Zip Codes with the Highest Percentage of Population Employed in Office & Administration in Kent, OH
RELATED REPORTS & OPTIONS
Office & Administration
Kent
Compare Zip Codes
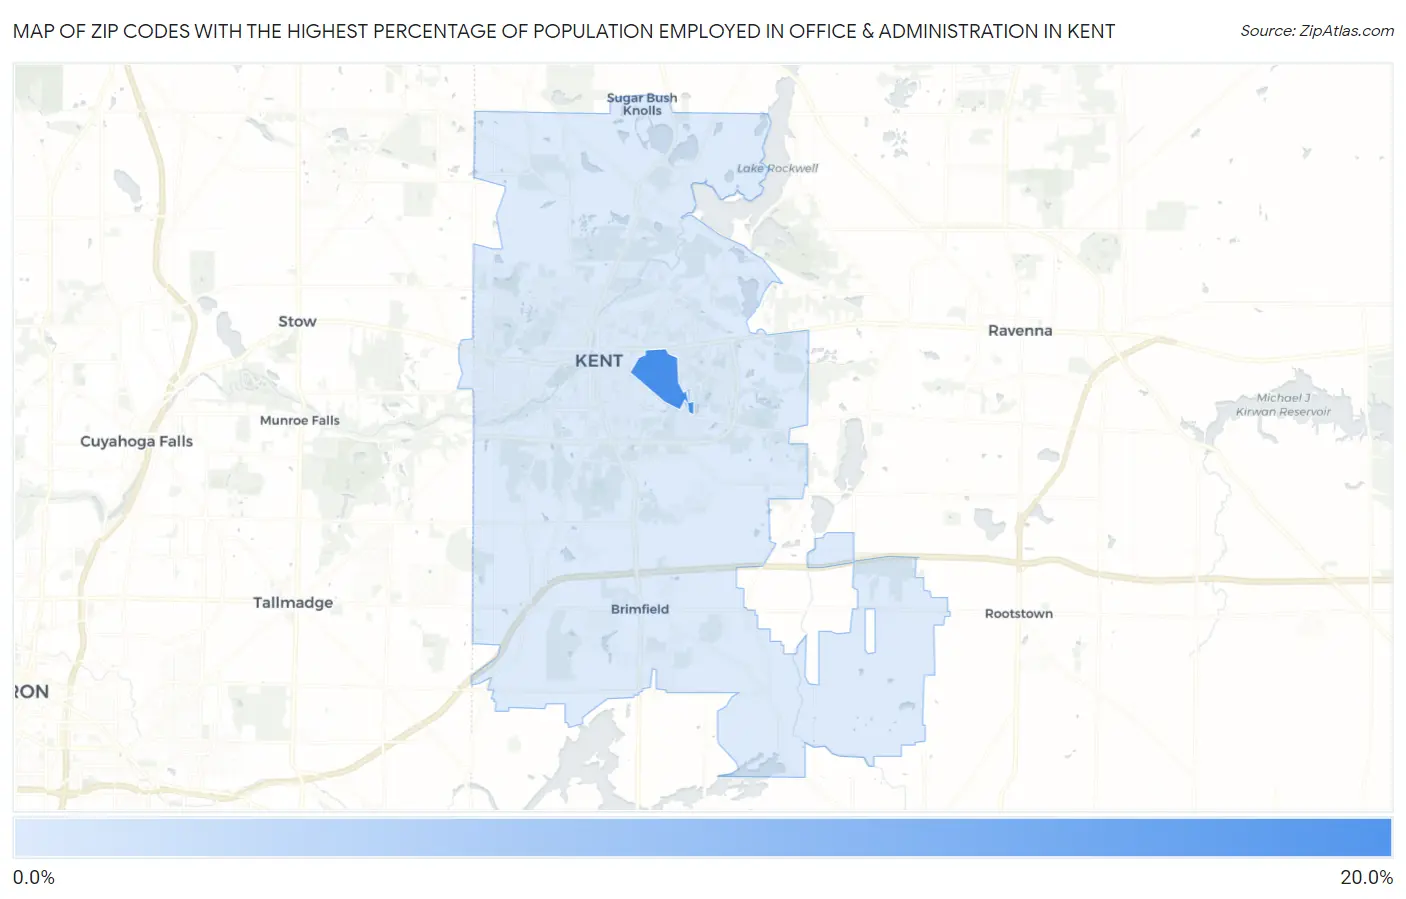
Map of Zip Codes with the Highest Percentage of Population Employed in Office & Administration in Kent
0.0%
20.0%
Zip Codes with the Highest Percentage of Population Employed in Office & Administration in Kent, OH
| Zip Code | % Employed | vs State | vs National | |
| 1. | 44243 | 16.2% | 11.3%(+4.92)#133 | 10.9%(+5.32)#3,413 |
| 2. | 44240 | 7.7% | 11.3%(-3.53)#904 | 10.9%(-3.13)#23,642 |
1
Common Questions
What are the Top Zip Codes with the Highest Percentage of Population Employed in Office & Administration in Kent, OH?
Top Zip Codes with the Highest Percentage of Population Employed in Office & Administration in Kent, OH are:
What zip code has the Highest Percentage of Population Employed in Office & Administration in Kent, OH?
44243 has the Highest Percentage of Population Employed in Office & Administration in Kent, OH with 16.2%.
What is the Percentage of Population Employed in Office & Administration in Kent, OH?
Percentage of Population Employed in Office & Administration in Kent is 10.0%.
What is the Percentage of Population Employed in Office & Administration in Ohio?
Percentage of Population Employed in Office & Administration in Ohio is 11.3%.
What is the Percentage of Population Employed in Office & Administration in the United States?
Percentage of Population Employed in Office & Administration in the United States is 10.9%.