Zip Codes with the Highest Percentage of Population Employed in Office & Administration in Massillon, OH
RELATED REPORTS & OPTIONS
Office & Administration
Massillon
Compare Zip Codes
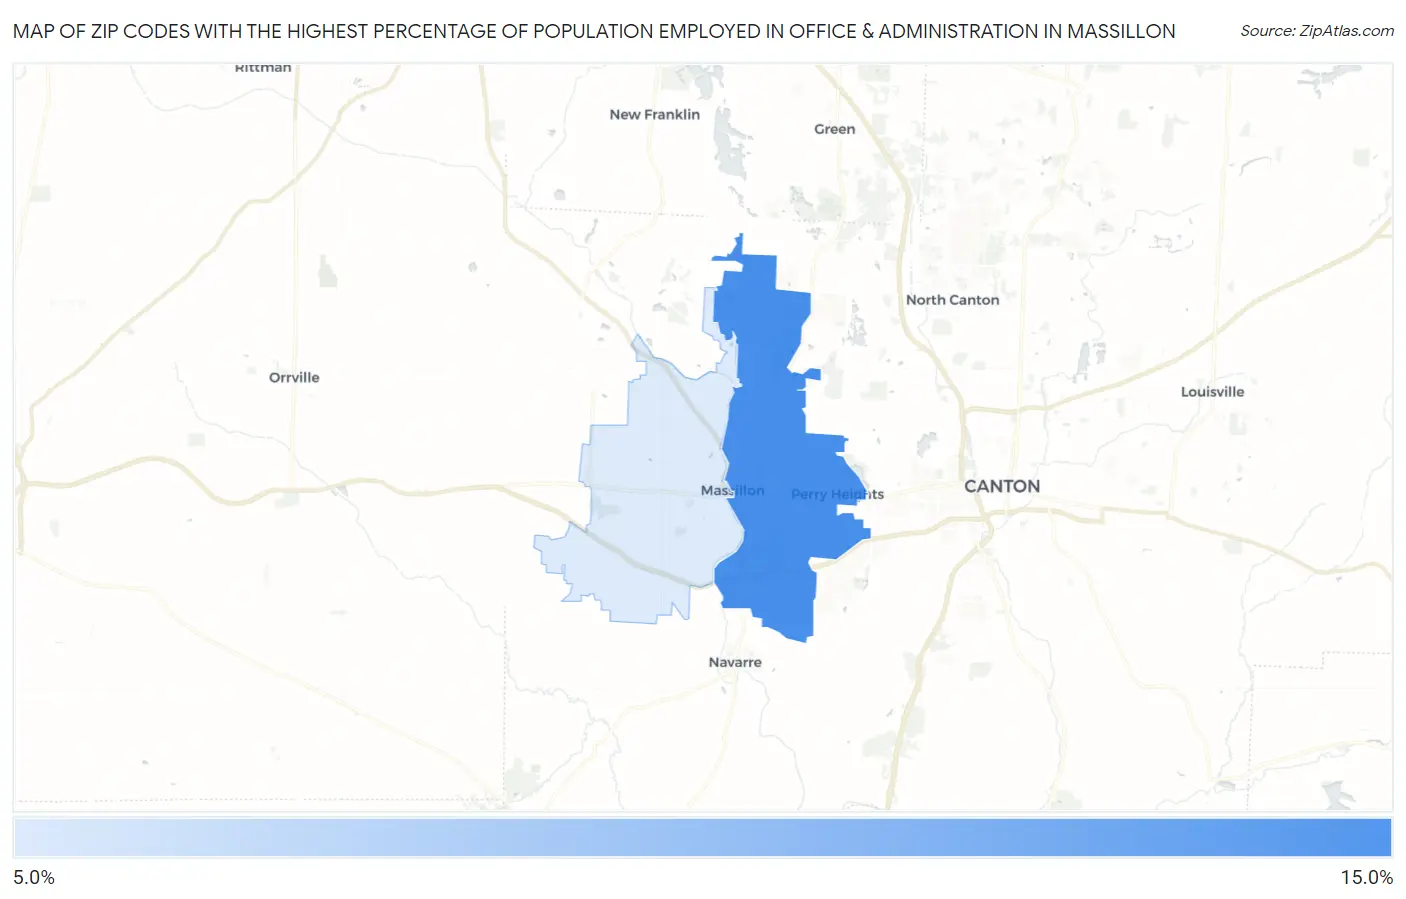
Map of Zip Codes with the Highest Percentage of Population Employed in Office & Administration in Massillon
0.0%
15.0%
Zip Codes with the Highest Percentage of Population Employed in Office & Administration in Massillon, OH
| Zip Code | % Employed | vs State | vs National | |
| 1. | 44646 | 11.8% | 11.3%(+0.526)#442 | 10.9%(+0.926)#11,390 |
| 2. | 44647 | 11.4% | 11.3%(+0.151)#490 | 10.9%(+0.551)#12,523 |
1
Common Questions
What are the Top Zip Codes with the Highest Percentage of Population Employed in Office & Administration in Massillon, OH?
Top Zip Codes with the Highest Percentage of Population Employed in Office & Administration in Massillon, OH are:
What zip code has the Highest Percentage of Population Employed in Office & Administration in Massillon, OH?
44646 has the Highest Percentage of Population Employed in Office & Administration in Massillon, OH with 11.8%.
What is the Percentage of Population Employed in Office & Administration in Massillon, OH?
Percentage of Population Employed in Office & Administration in Massillon is 12.7%.
What is the Percentage of Population Employed in Office & Administration in Ohio?
Percentage of Population Employed in Office & Administration in Ohio is 11.3%.
What is the Percentage of Population Employed in Office & Administration in the United States?
Percentage of Population Employed in Office & Administration in the United States is 10.9%.