Alliance, NE
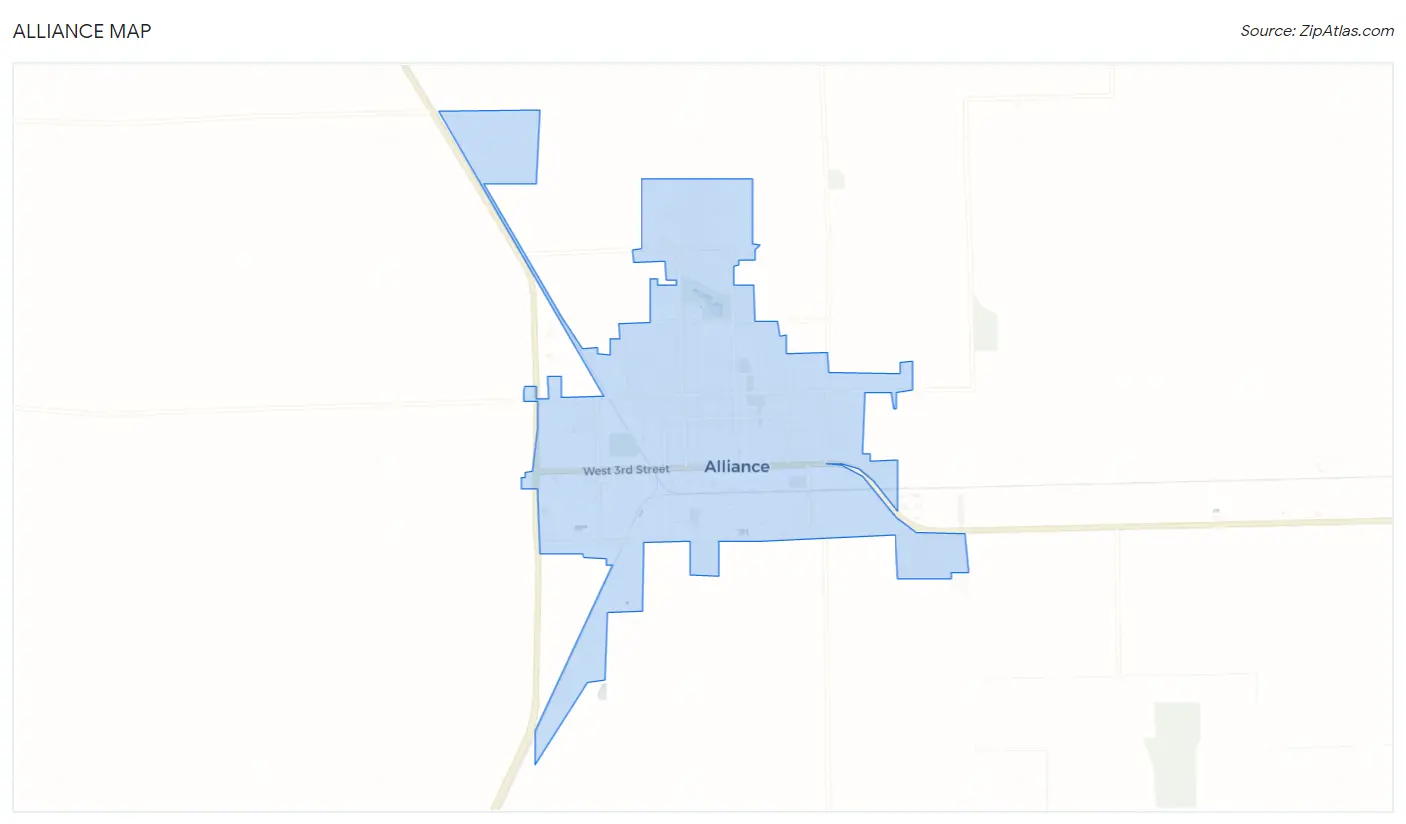
Alliance Map
Alliance Overview
8,118
TOTAL POPULATION
4,098
MALE POPULATION
4,020
FEMALE POPULATION
101.94
MALES / 100 FEMALES
98.10
FEMALES / 100 MALES
38.9
MEDIAN AGE
2.9
AVG FAMILY SIZE
2.3
AVG HOUSEHOLD SIZE
$30,015
PER CAPITA INCOME
$72,935
AVG FAMILY INCOME
$58,214
AVG HOUSEHOLD INCOME
25.2%
WAGE / INCOME GAP [ % ]
74.8¢/ $1
WAGE / INCOME GAP [ $ ]
0.40
INEQUALITY / GINI INDEX
4,014
LABOR FORCE [ PEOPLE ]
64.2%
PERCENT IN LABOR FORCE
5.4%
UNEMPLOYMENT RATE
Alliance Zip Codes
Alliance Area Codes
Race in Alliance
The most populous races in Alliance are White / Caucasian (6,909 | 85.1%), Hispanic or Latino (961 | 11.8%), and Black / African American (365 | 4.5%).
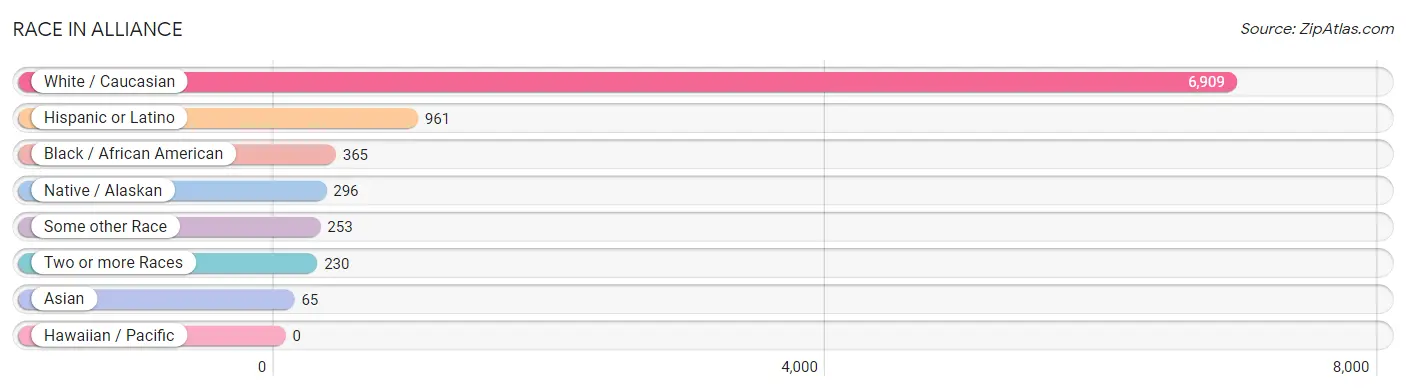
| Race | # Population | % Population |
| Asian | 65 | 0.8% |
| Black / African American | 365 | 4.5% |
| Hawaiian / Pacific | 0 | 0.0% |
| Hispanic or Latino | 961 | 11.8% |
| Native / Alaskan | 296 | 3.6% |
| White / Caucasian | 6,909 | 85.1% |
| Two or more Races | 230 | 2.8% |
| Some other Race | 253 | 3.1% |
| Total | 8,118 | 100.0% |
Ancestry in Alliance
The most populous ancestries reported in Alliance are German (2,342 | 28.8%), Irish (1,015 | 12.5%), Mexican (782 | 9.6%), English (631 | 7.8%), and Scottish (398 | 4.9%), together accounting for 63.7% of all Alliance residents.
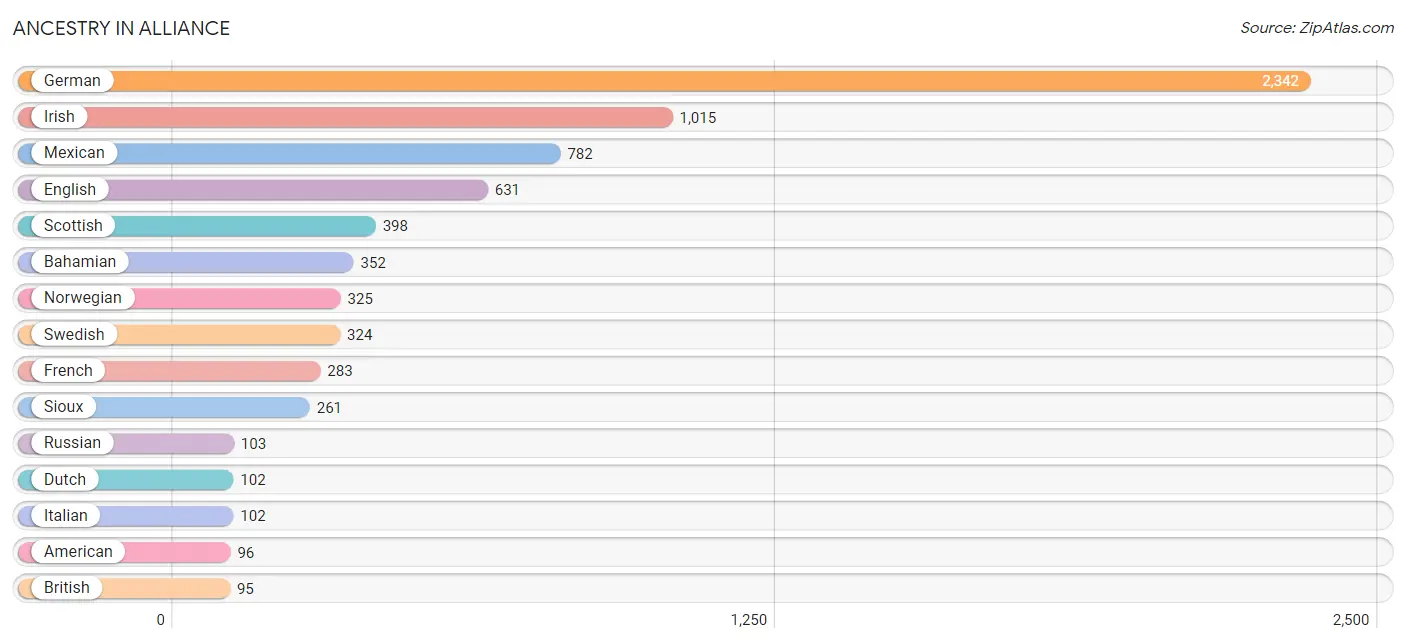
| Ancestry | # Population | % Population |
| Alsatian | 10 | 0.1% |
| American | 96 | 1.2% |
| Bahamian | 352 | 4.3% |
| British | 95 | 1.2% |
| Burmese | 13 | 0.2% |
| Central American | 2 | 0.0% |
| Cherokee | 7 | 0.1% |
| Colombian | 15 | 0.2% |
| Cuban | 26 | 0.3% |
| Czech | 56 | 0.7% |
| Danish | 43 | 0.5% |
| Dutch | 102 | 1.3% |
| Eastern European | 20 | 0.3% |
| English | 631 | 7.8% |
| European | 80 | 1.0% |
| French | 283 | 3.5% |
| German | 2,342 | 28.8% |
| Greek | 56 | 0.7% |
| Irish | 1,015 | 12.5% |
| Italian | 102 | 1.3% |
| Korean | 51 | 0.6% |
| Mexican | 782 | 9.6% |
| Mexican American Indian | 53 | 0.6% |
| Native Hawaiian | 10 | 0.1% |
| Norwegian | 325 | 4.0% |
| Polish | 88 | 1.1% |
| Russian | 103 | 1.3% |
| Salvadoran | 2 | 0.0% |
| Scotch-Irish | 42 | 0.5% |
| Scottish | 398 | 4.9% |
| Sioux | 261 | 3.2% |
| South American | 15 | 0.2% |
| Swedish | 324 | 4.0% |
| Swiss | 79 | 1.0% |
| Thai | 14 | 0.2% | View All 35 Rows |
Immigrants in Alliance
The most numerous immigrant groups reported in Alliance came from Latin America (387 | 4.8%), Bahamas (352 | 4.3%), Caribbean (352 | 4.3%), Asia (65 | 0.8%), and Philippines (51 | 0.6%), together accounting for 14.9% of all Alliance residents.
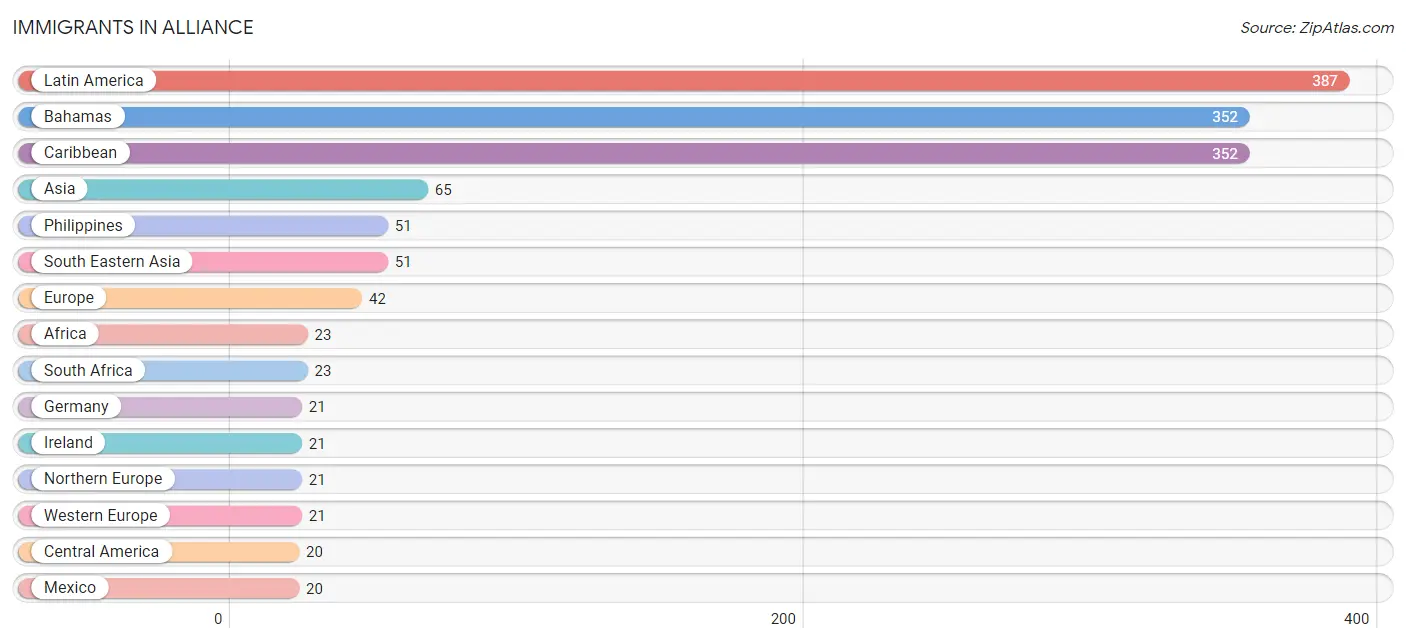
| Immigration Origin | # Population | % Population |
| Africa | 23 | 0.3% |
| Asia | 65 | 0.8% |
| Bahamas | 352 | 4.3% |
| Canada | 8 | 0.1% |
| Caribbean | 352 | 4.3% |
| Central America | 20 | 0.3% |
| Colombia | 15 | 0.2% |
| Europe | 42 | 0.5% |
| Germany | 21 | 0.3% |
| India | 14 | 0.2% |
| Ireland | 21 | 0.3% |
| Latin America | 387 | 4.8% |
| Mexico | 20 | 0.3% |
| Northern Europe | 21 | 0.3% |
| Philippines | 51 | 0.6% |
| South Africa | 23 | 0.3% |
| South America | 15 | 0.2% |
| South Central Asia | 14 | 0.2% |
| South Eastern Asia | 51 | 0.6% |
| Western Europe | 21 | 0.3% | View All 20 Rows |
Sex and Age in Alliance
Sex and Age in Alliance
The most populous age groups in Alliance are 5 to 9 Years (449 | 11.0%) for men and 60 to 64 Years (372 | 9.2%) for women.
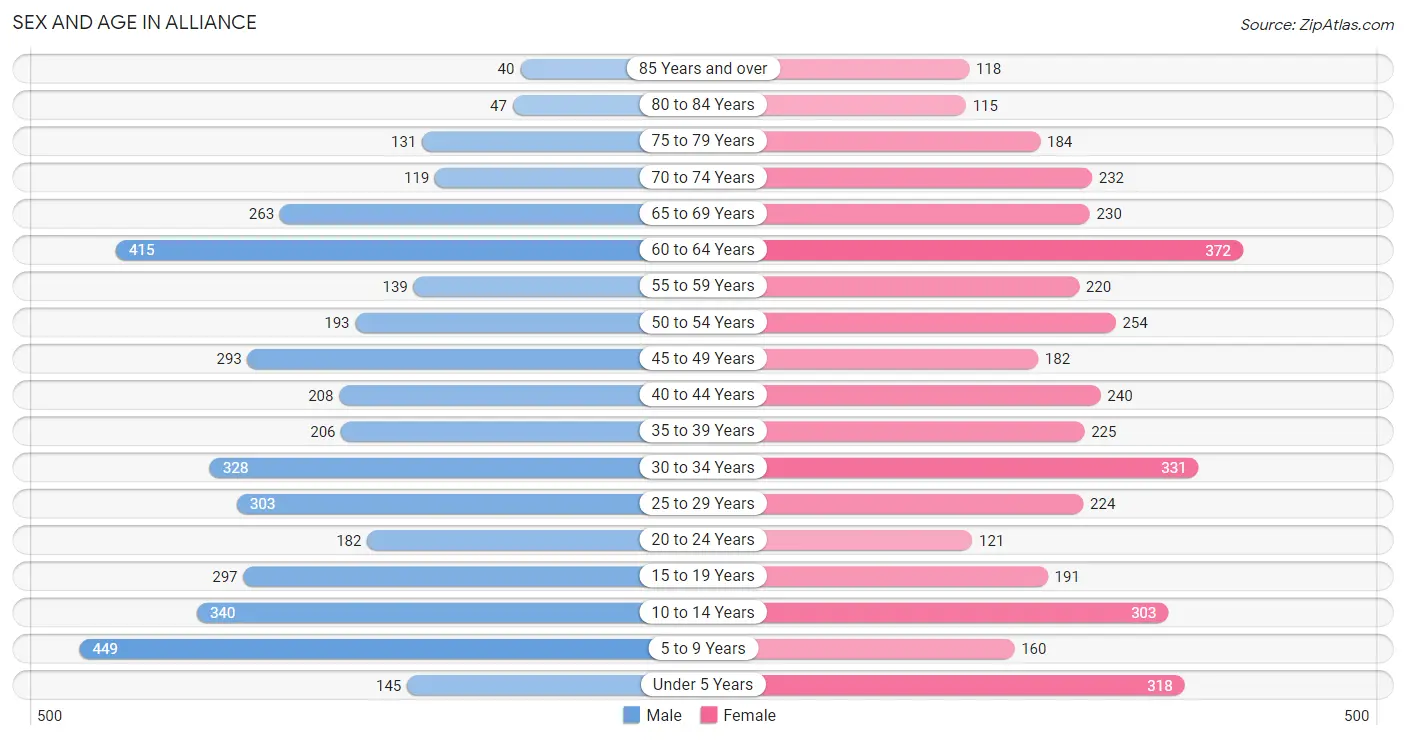
| Age Bracket | Male | Female |
| Under 5 Years | 145 (3.5%) | 318 (7.9%) |
| 5 to 9 Years | 449 (11.0%) | 160 (4.0%) |
| 10 to 14 Years | 340 (8.3%) | 303 (7.5%) |
| 15 to 19 Years | 297 (7.2%) | 191 (4.8%) |
| 20 to 24 Years | 182 (4.4%) | 121 (3.0%) |
| 25 to 29 Years | 303 (7.4%) | 224 (5.6%) |
| 30 to 34 Years | 328 (8.0%) | 331 (8.2%) |
| 35 to 39 Years | 206 (5.0%) | 225 (5.6%) |
| 40 to 44 Years | 208 (5.1%) | 240 (6.0%) |
| 45 to 49 Years | 293 (7.1%) | 182 (4.5%) |
| 50 to 54 Years | 193 (4.7%) | 254 (6.3%) |
| 55 to 59 Years | 139 (3.4%) | 220 (5.5%) |
| 60 to 64 Years | 415 (10.1%) | 372 (9.2%) |
| 65 to 69 Years | 263 (6.4%) | 230 (5.7%) |
| 70 to 74 Years | 119 (2.9%) | 232 (5.8%) |
| 75 to 79 Years | 131 (3.2%) | 184 (4.6%) |
| 80 to 84 Years | 47 (1.1%) | 115 (2.9%) |
| 85 Years and over | 40 (1.0%) | 118 (2.9%) |
| Total | 4,098 (100.0%) | 4,020 (100.0%) |
Families and Households in Alliance
Median Family Size in Alliance
The median family size in Alliance is 2.90 persons per family, with single female/mother families (416 | 19.7%) accounting for the largest median family size of 3.17 persons per family. On the other hand, married-couple families (1,470 | 69.5%) represent the smallest median family size with 2.80 persons per family.
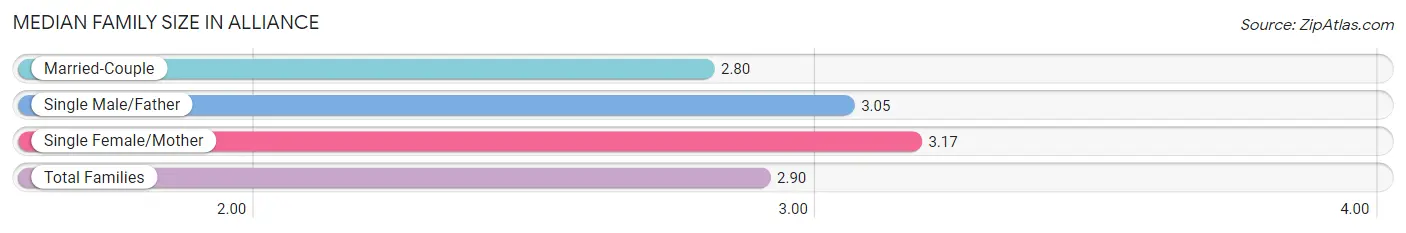
| Family Type | # Families | Family Size |
| Married-Couple | 1,470 (69.5%) | 2.80 |
| Single Male/Father | 230 (10.9%) | 3.05 |
| Single Female/Mother | 416 (19.7%) | 3.17 |
| Total Families | 2,116 (100.0%) | 2.90 |
Median Household Size in Alliance
The median household size in Alliance is 2.32 persons per household, with single male/father households (230 | 6.7%) accounting for the largest median household size of 4.2 persons per household. non-family households (1,310 | 38.2%) represent the smallest median household size with 1.08 persons per household.
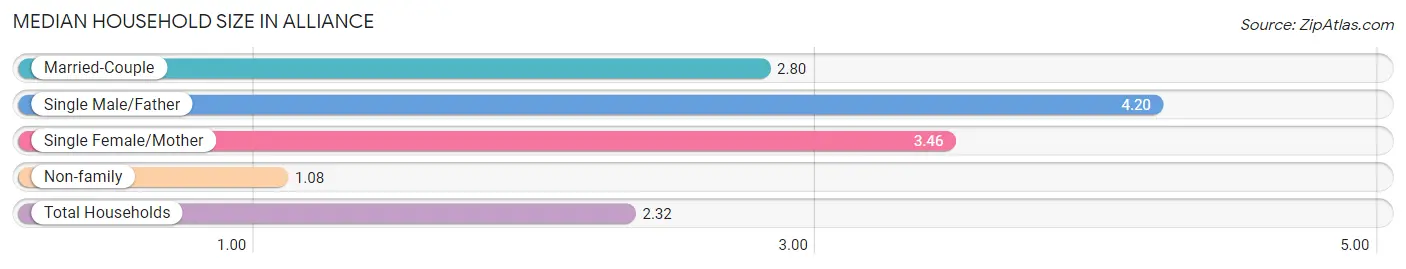
| Household Type | # Households | Household Size |
| Married-Couple | 1,470 (42.9%) | 2.80 |
| Single Male/Father | 230 (6.7%) | 4.20 |
| Single Female/Mother | 416 (12.1%) | 3.46 |
| Non-family | 1,310 (38.2%) | 1.08 |
| Total Households | 3,426 (100.0%) | 2.32 |
Household Size by Marriage Status in Alliance
Out of a total of 3,426 households in Alliance, 2,116 (61.8%) are family households, while 1,310 (38.2%) are nonfamily households. The most numerous type of family households are 2-person households, comprising 1,028, and the most common type of nonfamily households are 1-person households, comprising 1,209.
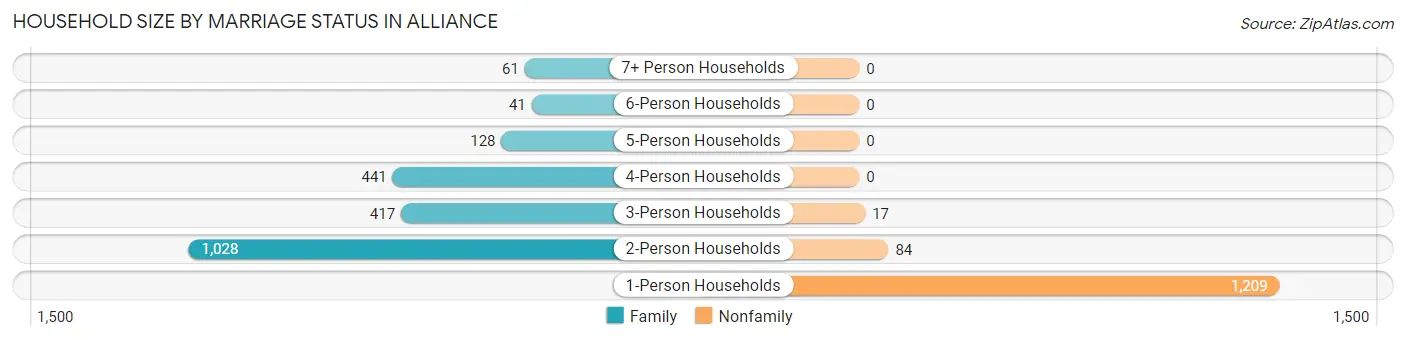
| Household Size | Family Households | Nonfamily Households |
| 1-Person Households | - | 1,209 (35.3%) |
| 2-Person Households | 1,028 (30.0%) | 84 (2.5%) |
| 3-Person Households | 417 (12.2%) | 17 (0.5%) |
| 4-Person Households | 441 (12.9%) | 0 (0.0%) |
| 5-Person Households | 128 (3.7%) | 0 (0.0%) |
| 6-Person Households | 41 (1.2%) | 0 (0.0%) |
| 7+ Person Households | 61 (1.8%) | 0 (0.0%) |
| Total | 2,116 (61.8%) | 1,310 (38.2%) |
Female Fertility in Alliance
Fertility by Age in Alliance
Average fertility rate in Alliance is 55.0 births per 1,000 women. Women in the age bracket of 20 to 34 years have the highest fertility rate with 123.0 births per 1,000 women. Women in the age bracket of 20 to 34 years acount for 100.0% of all women with births.
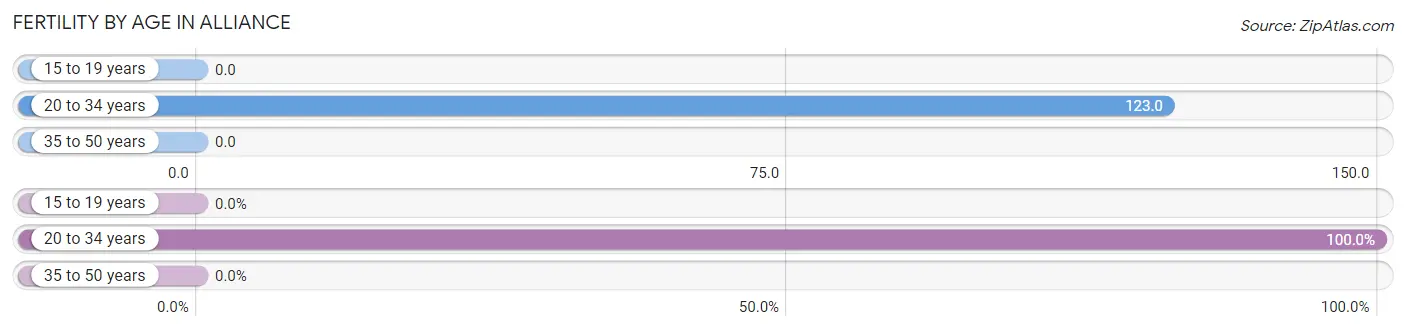
| Age Bracket | Women with Births | Births / 1,000 Women |
| 15 to 19 years | 0 (0.0%) | 0.0 |
| 20 to 34 years | 83 (100.0%) | 123.0 |
| 35 to 50 years | 0 (0.0%) | 0.0 |
| Total | 83 (100.0%) | 55.0 |
Fertility by Age by Marriage Status in Alliance
20.5% of women with births (83) in Alliance are married. The highest percentage of unmarried women with births falls into 20 to 34 years age bracket with 79.5% of them unmarried at the time of birth, while the lowest percentage of unmarried women with births belong to 20 to 34 years age bracket with 79.5% of them unmarried.
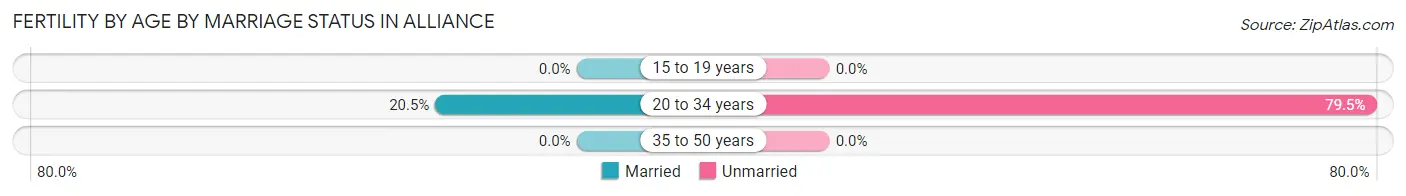
| Age Bracket | Married | Unmarried |
| 15 to 19 years | 0 (0.0%) | 0 (0.0%) |
| 20 to 34 years | 17 (20.5%) | 66 (79.5%) |
| 35 to 50 years | 0 (0.0%) | 0 (0.0%) |
| Total | 17 (20.5%) | 66 (79.5%) |
Fertility by Education in Alliance
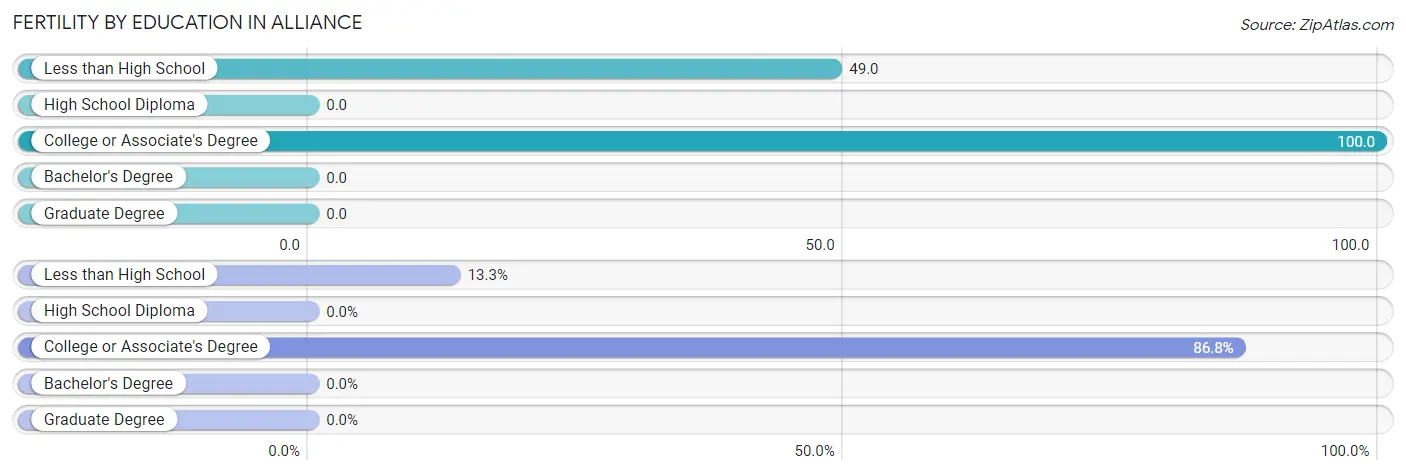
| Educational Attainment | Women with Births | Births / 1,000 Women |
| Less than High School | 11 (13.3%) | 49.0 |
| High School Diploma | 0 (0.0%) | 0.0 |
| College or Associate's Degree | 72 (86.8%) | 100.0 |
| Bachelor's Degree | 0 (0.0%) | 0.0 |
| Graduate Degree | 0 (0.0%) | 0.0 |
| Total | 83 (100.0%) | 55.0 |
Fertility by Education by Marriage Status in Alliance
79.5% of women with births in Alliance are unmarried. Women with the educational attainment of college or associate's degree are most likely to be married with 23.6% of them married at childbirth, while women with the educational attainment of less than high school are least likely to be married with 100.0% of them unmarried at childbirth.
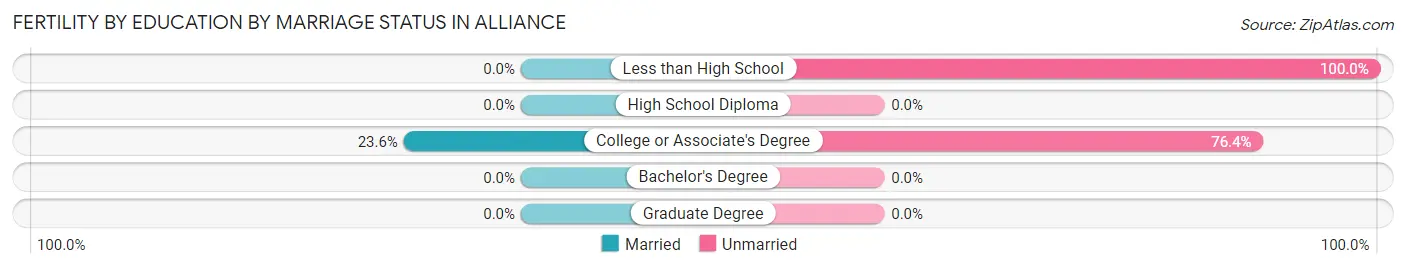
| Educational Attainment | Married | Unmarried |
| Less than High School | 0 (0.0%) | 11 (100.0%) |
| High School Diploma | 0 (0.0%) | 0 (0.0%) |
| College or Associate's Degree | 17 (23.6%) | 55 (76.4%) |
| Bachelor's Degree | 0 (0.0%) | 0 (0.0%) |
| Graduate Degree | 0 (0.0%) | 0 (0.0%) |
| Total | 17 (20.5%) | 66 (79.5%) |
Income in Alliance
Income Overview in Alliance
Per Capita Income in Alliance is $30,015, while median incomes of families and households are $72,935 and $58,214 respectively.
| Characteristic | Number | Measure |
| Per Capita Income | 8,118 | $30,015 |
| Median Family Income | 2,116 | $72,935 |
| Mean Family Income | 2,116 | $81,790 |
| Median Household Income | 3,426 | $58,214 |
| Mean Household Income | 3,426 | $68,538 |
| Income Deficit | 2,116 | $0 |
| Wage / Income Gap (%) | 8,118 | 25.22% |
| Wage / Income Gap ($) | 8,118 | 74.78¢ per $1 |
| Gini / Inequality Index | 8,118 | 0.40 |
Earnings by Sex in Alliance
Average Earnings in Alliance are $39,252, $46,608 for men and $34,853 for women, a difference of 25.2%.
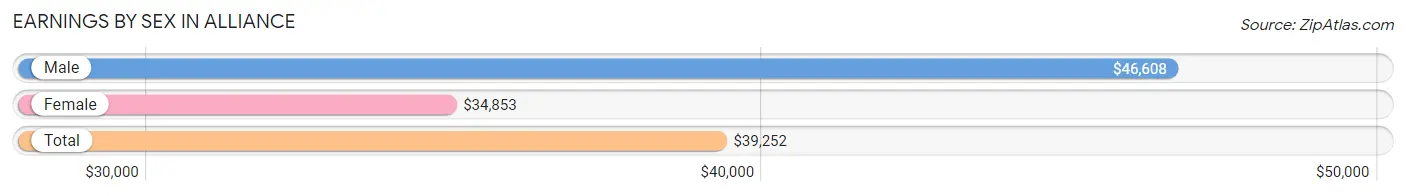
| Sex | Number | Average Earnings |
| Male | 2,100 (48.3%) | $46,608 |
| Female | 2,248 (51.7%) | $34,853 |
| Total | 4,348 (100.0%) | $39,252 |
Earnings by Sex by Income Bracket in Alliance
The most common earnings brackets in Alliance are $75,000 to $99,999 for men (478 | 22.8%) and $35,000 to $39,999 for women (305 | 13.6%).
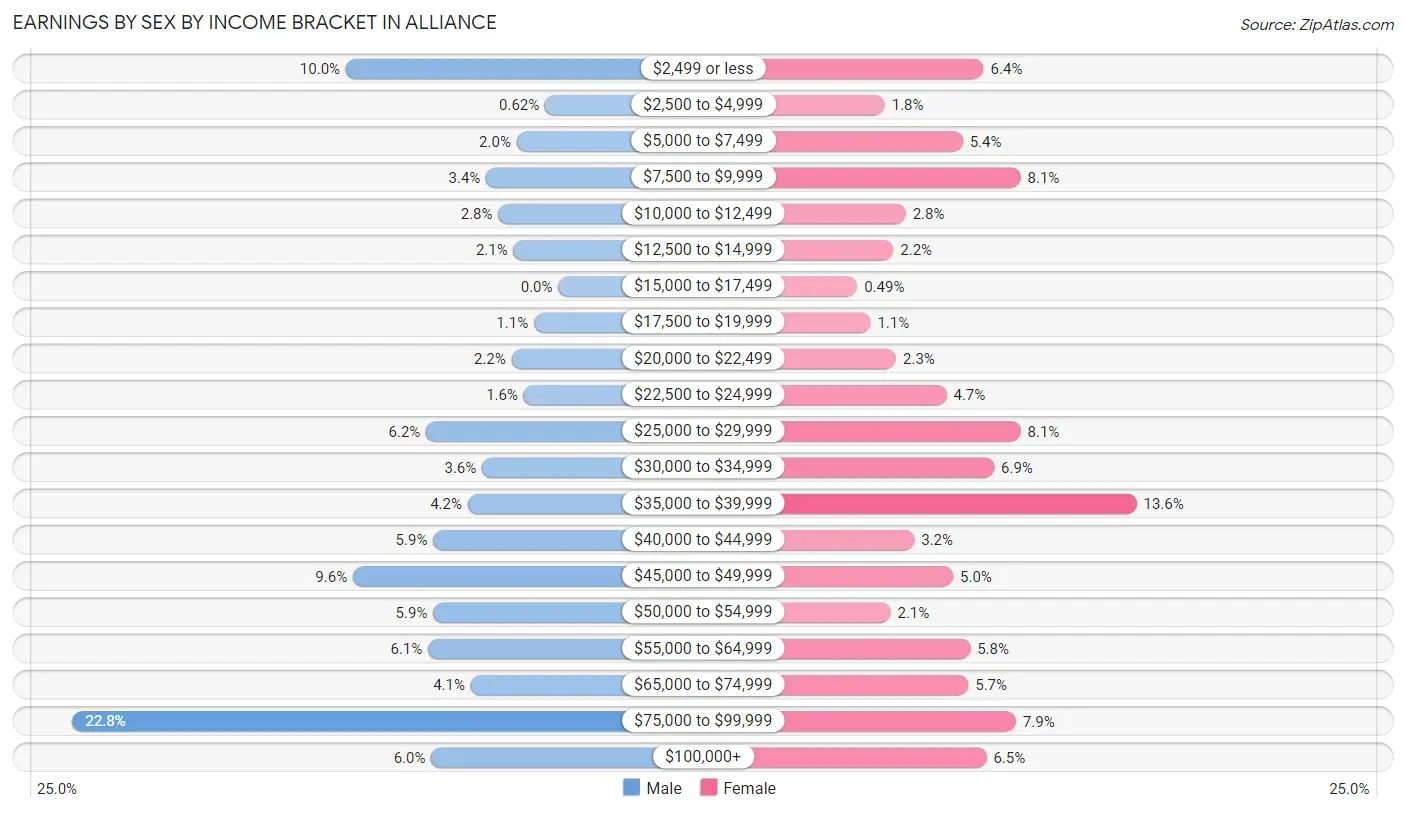
| Income | Male | Female |
| $2,499 or less | 209 (10.0%) | 144 (6.4%) |
| $2,500 to $4,999 | 13 (0.6%) | 40 (1.8%) |
| $5,000 to $7,499 | 41 (1.9%) | 122 (5.4%) |
| $7,500 to $9,999 | 71 (3.4%) | 183 (8.1%) |
| $10,000 to $12,499 | 59 (2.8%) | 62 (2.8%) |
| $12,500 to $14,999 | 44 (2.1%) | 49 (2.2%) |
| $15,000 to $17,499 | 0 (0.0%) | 11 (0.5%) |
| $17,500 to $19,999 | 24 (1.1%) | 25 (1.1%) |
| $20,000 to $22,499 | 46 (2.2%) | 52 (2.3%) |
| $22,500 to $24,999 | 34 (1.6%) | 105 (4.7%) |
| $25,000 to $29,999 | 130 (6.2%) | 183 (8.1%) |
| $30,000 to $34,999 | 75 (3.6%) | 155 (6.9%) |
| $35,000 to $39,999 | 89 (4.2%) | 305 (13.6%) |
| $40,000 to $44,999 | 123 (5.9%) | 71 (3.2%) |
| $45,000 to $49,999 | 202 (9.6%) | 112 (5.0%) |
| $50,000 to $54,999 | 123 (5.9%) | 46 (2.1%) |
| $55,000 to $64,999 | 128 (6.1%) | 130 (5.8%) |
| $65,000 to $74,999 | 86 (4.1%) | 128 (5.7%) |
| $75,000 to $99,999 | 478 (22.8%) | 178 (7.9%) |
| $100,000+ | 125 (5.9%) | 147 (6.5%) |
| Total | 2,100 (100.0%) | 2,248 (100.0%) |
Earnings by Sex by Educational Attainment in Alliance
Average earnings in Alliance are $50,172 for men and $38,048 for women, a difference of 24.2%. Men with an educational attainment of bachelor's degree enjoy the highest average annual earnings of $78,785, while those with high school diploma education earn the least with $49,306. Women with an educational attainment of graduate degree earn the most with the average annual earnings of $61,944, while those with high school diploma education have the smallest earnings of $18,047.
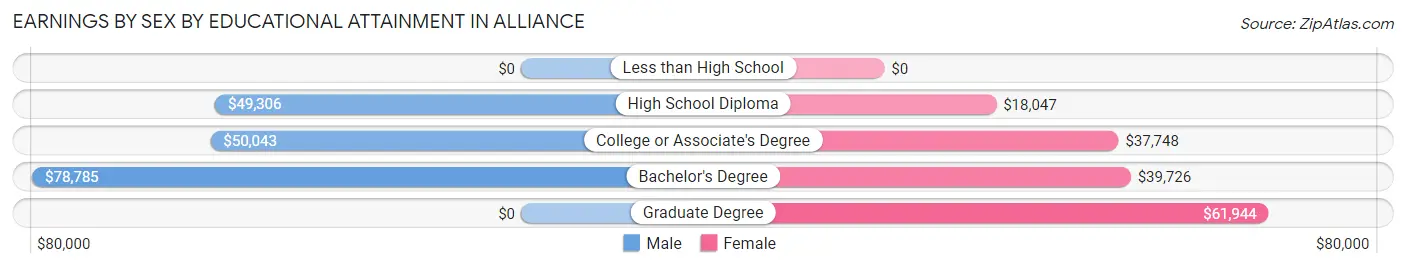
| Educational Attainment | Male Income | Female Income |
| Less than High School | - | - |
| High School Diploma | $49,306 | $18,047 |
| College or Associate's Degree | $50,043 | $37,748 |
| Bachelor's Degree | $78,785 | $39,726 |
| Graduate Degree | - | - |
| Total | $50,172 | $38,048 |
Family Income in Alliance
Family Income Brackets in Alliance
According to the Alliance family income data, there are 521 families falling into the $100,000 to $149,999 income range, which is the most common income bracket and makes up 24.6% of all families. Conversely, the $200,000+ income bracket is the least frequent group with only 23 families (1.1%) belonging to this category.
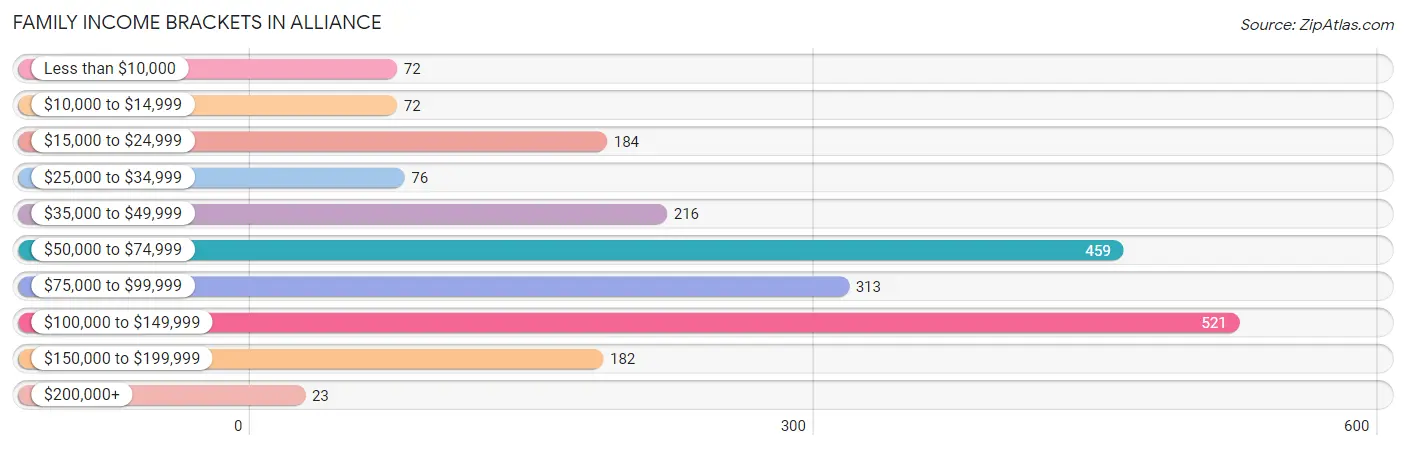
| Income Bracket | # Families | % Families |
| Less than $10,000 | 72 | 3.4% |
| $10,000 to $14,999 | 72 | 3.4% |
| $15,000 to $24,999 | 184 | 8.7% |
| $25,000 to $34,999 | 76 | 3.6% |
| $35,000 to $49,999 | 216 | 10.2% |
| $50,000 to $74,999 | 459 | 21.7% |
| $75,000 to $99,999 | 313 | 14.8% |
| $100,000 to $149,999 | 521 | 24.6% |
| $150,000 to $199,999 | 182 | 8.6% |
| $200,000+ | 23 | 1.1% |
Family Income by Famaliy Size in Alliance
4-person families (418 | 19.8%) account for the highest median family income in Alliance with $117,143 per family, while 2-person families (1,158 | 54.7%) have the highest median income of $31,708 per family member.
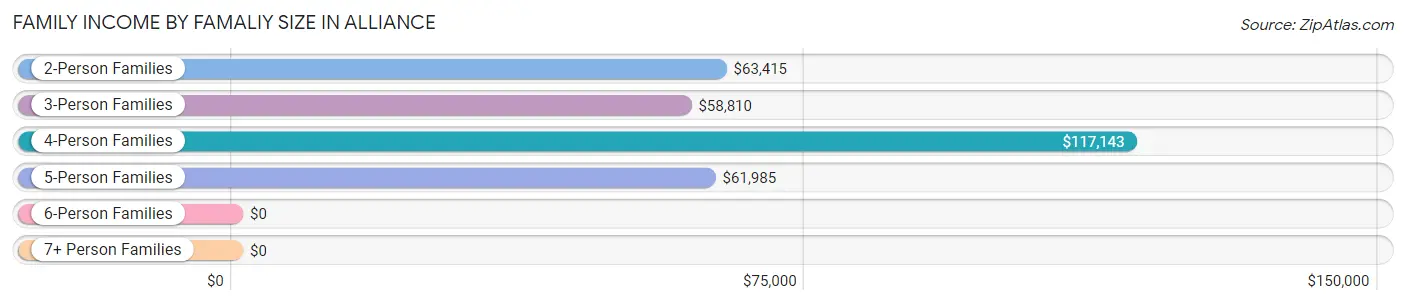
| Income Bracket | # Families | Median Income |
| 2-Person Families | 1,158 (54.7%) | $63,415 |
| 3-Person Families | 370 (17.5%) | $58,810 |
| 4-Person Families | 418 (19.8%) | $117,143 |
| 5-Person Families | 109 (5.1%) | $61,985 |
| 6-Person Families | 7 (0.3%) | $0 |
| 7+ Person Families | 54 (2.5%) | $0 |
| Total | 2,116 (100.0%) | $72,935 |
Family Income by Number of Earners in Alliance
The median family income in Alliance is $72,935, with families comprising 3+ earners (139) having the highest median family income of $117,321, while families with no earners (244) have the lowest median family income of $25,543, accounting for 6.6% and 11.5% of families, respectively.
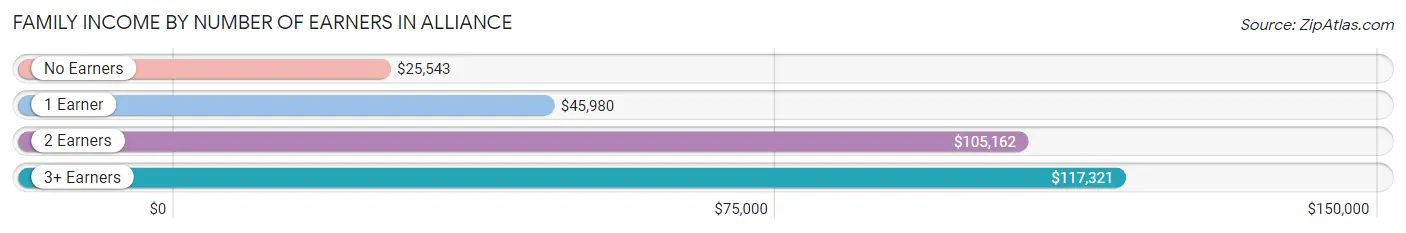
| Number of Earners | # Families | Median Income |
| No Earners | 244 (11.5%) | $25,543 |
| 1 Earner | 614 (29.0%) | $45,980 |
| 2 Earners | 1,119 (52.9%) | $105,162 |
| 3+ Earners | 139 (6.6%) | $117,321 |
| Total | 2,116 (100.0%) | $72,935 |
Household Income in Alliance
Household Income Brackets in Alliance
With 620 households falling in the category, the $50,000 to $74,999 income range is the most frequent in Alliance, accounting for 18.1% of all households. In contrast, only 27 households (0.8%) fall into the $200,000+ income bracket, making it the least populous group.
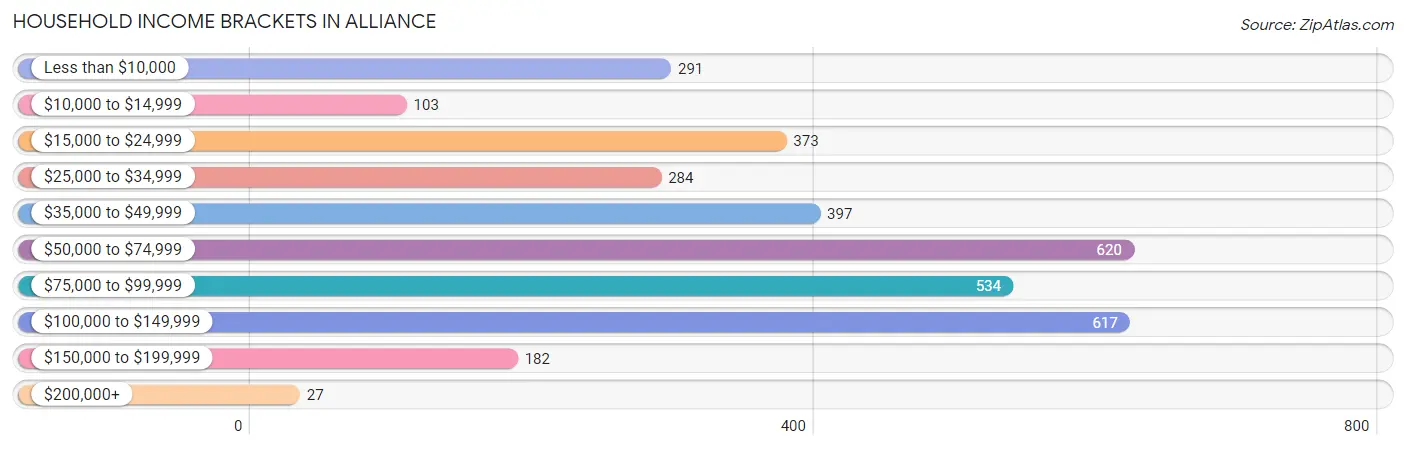
| Income Bracket | # Households | % Households |
| Less than $10,000 | 291 | 8.5% |
| $10,000 to $14,999 | 103 | 3.0% |
| $15,000 to $24,999 | 373 | 10.9% |
| $25,000 to $34,999 | 284 | 8.3% |
| $35,000 to $49,999 | 397 | 11.6% |
| $50,000 to $74,999 | 620 | 18.1% |
| $75,000 to $99,999 | 534 | 15.6% |
| $100,000 to $149,999 | 617 | 18.0% |
| $150,000 to $199,999 | 182 | 5.3% |
| $200,000+ | 27 | 0.8% |
Household Income by Householder Age in Alliance
The median household income in Alliance is $58,214, with the highest median household income of $85,533 found in the 45 to 64 years age bracket for the primary householder. A total of 1,242 households (36.2%) fall into this category. Meanwhile, the 65+ years age bracket for the primary householder has the lowest median household income of $29,537, with 952 households (27.8%) in this group.
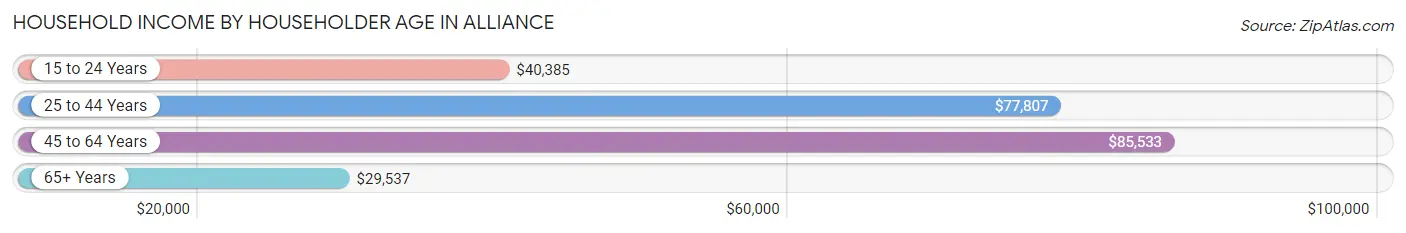
| Income Bracket | # Households | Median Income |
| 15 to 24 Years | 142 (4.1%) | $40,385 |
| 25 to 44 Years | 1,090 (31.8%) | $77,807 |
| 45 to 64 Years | 1,242 (36.2%) | $85,533 |
| 65+ Years | 952 (27.8%) | $29,537 |
| Total | 3,426 (100.0%) | $58,214 |
Poverty in Alliance
Income Below Poverty by Sex and Age in Alliance
With 8.6% poverty level for males and 19.1% for females among the residents of Alliance, 18 to 24 year old males and 65 to 74 year old females are the most vulnerable to poverty, with 99 males (40.2%) and 227 females (50.1%) in their respective age groups living below the poverty level.
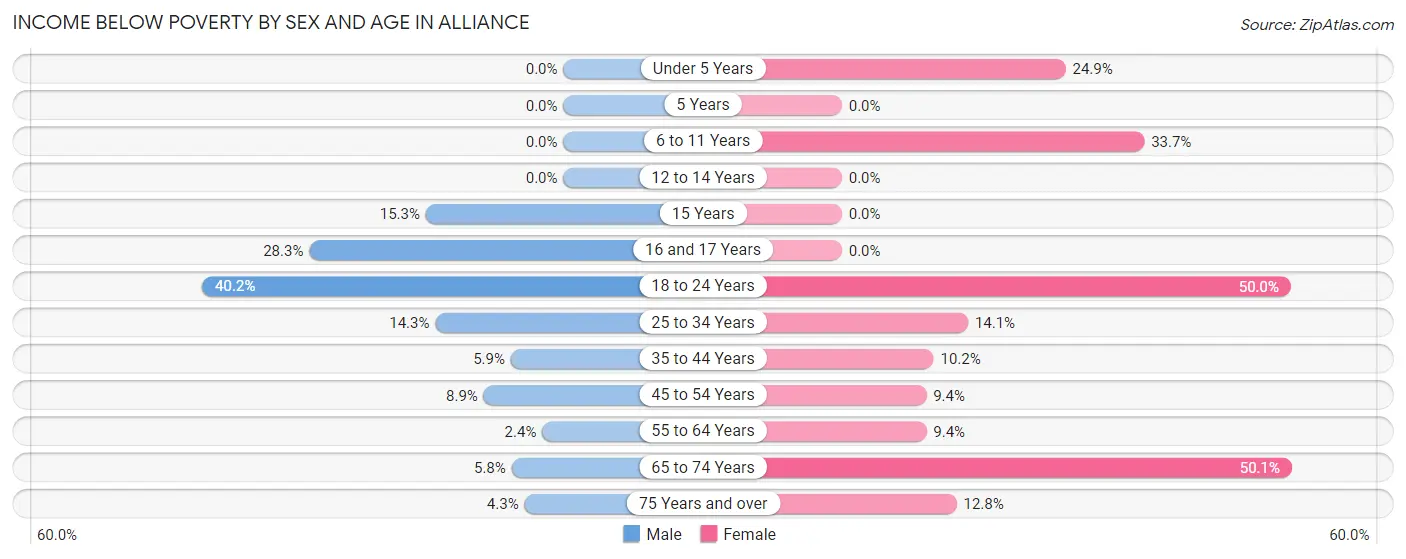
| Age Bracket | Male | Female |
| Under 5 Years | 0 (0.0%) | 78 (24.9%) |
| 5 Years | 0 (0.0%) | 0 (0.0%) |
| 6 to 11 Years | 0 (0.0%) | 65 (33.7%) |
| 12 to 14 Years | 0 (0.0%) | 0 (0.0%) |
| 15 Years | 19 (15.3%) | 0 (0.0%) |
| 16 and 17 Years | 30 (28.3%) | 0 (0.0%) |
| 18 to 24 Years | 99 (40.2%) | 115 (50.0%) |
| 25 to 34 Years | 88 (14.3%) | 78 (14.1%) |
| 35 to 44 Years | 24 (5.9%) | 47 (10.2%) |
| 45 to 54 Years | 41 (8.9%) | 41 (9.4%) |
| 55 to 64 Years | 13 (2.4%) | 55 (9.4%) |
| 65 to 74 Years | 22 (5.8%) | 227 (50.1%) |
| 75 Years and over | 9 (4.3%) | 46 (12.8%) |
| Total | 345 (8.6%) | 752 (19.1%) |
Income Above Poverty by Sex and Age in Alliance
According to the poverty statistics in Alliance, males aged under 5 years and females aged 5 years are the age groups that are most secure financially, with 100.0% of males and 100.0% of females in these age groups living above the poverty line.
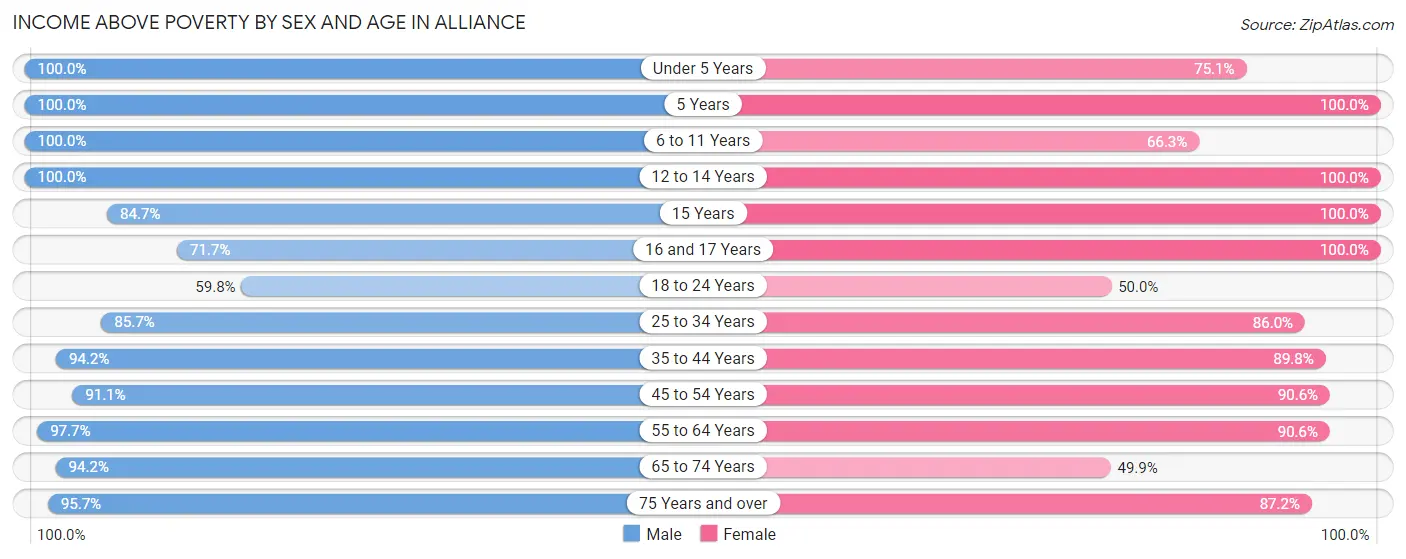
| Age Bracket | Male | Female |
| Under 5 Years | 145 (100.0%) | 235 (75.1%) |
| 5 Years | 32 (100.0%) | 70 (100.0%) |
| 6 to 11 Years | 547 (100.0%) | 128 (66.3%) |
| 12 to 14 Years | 196 (100.0%) | 200 (100.0%) |
| 15 Years | 105 (84.7%) | 27 (100.0%) |
| 16 and 17 Years | 76 (71.7%) | 54 (100.0%) |
| 18 to 24 Years | 147 (59.8%) | 115 (50.0%) |
| 25 to 34 Years | 529 (85.7%) | 477 (86.0%) |
| 35 to 44 Years | 386 (94.2%) | 413 (89.8%) |
| 45 to 54 Years | 421 (91.1%) | 395 (90.6%) |
| 55 to 64 Years | 540 (97.7%) | 529 (90.6%) |
| 65 to 74 Years | 360 (94.2%) | 226 (49.9%) |
| 75 Years and over | 199 (95.7%) | 314 (87.2%) |
| Total | 3,683 (91.4%) | 3,183 (80.9%) |
Income Below Poverty Among Married-Couple Families in Alliance
The poverty statistics for married-couple families in Alliance show that 6.3% or 93 of the total 1,470 families live below the poverty line. Families with no children have the highest poverty rate of 8.8%, comprising of 83 families. On the other hand, families with 3 or 4 children have the lowest poverty rate of 0.0%, which includes 0 families.
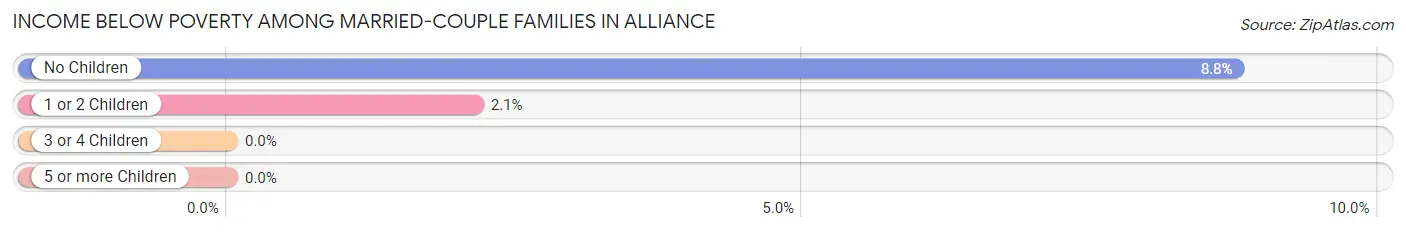
| Children | Above Poverty | Below Poverty |
| No Children | 865 (91.2%) | 83 (8.8%) |
| 1 or 2 Children | 457 (97.9%) | 10 (2.1%) |
| 3 or 4 Children | 55 (100.0%) | 0 (0.0%) |
| 5 or more Children | 0 (0.0%) | 0 (0.0%) |
| Total | 1,377 (93.7%) | 93 (6.3%) |
Income Below Poverty Among Single-Parent Households in Alliance
According to the poverty data in Alliance, 20.0% or 46 single-father households and 20.2% or 84 single-mother households are living below the poverty line. Among single-father households, those with no children have the highest poverty rate, with 11 households (35.5%) experiencing poverty. Likewise, among single-mother households, those with no children have the highest poverty rate, with 25 households (45.5%) falling below the poverty line.
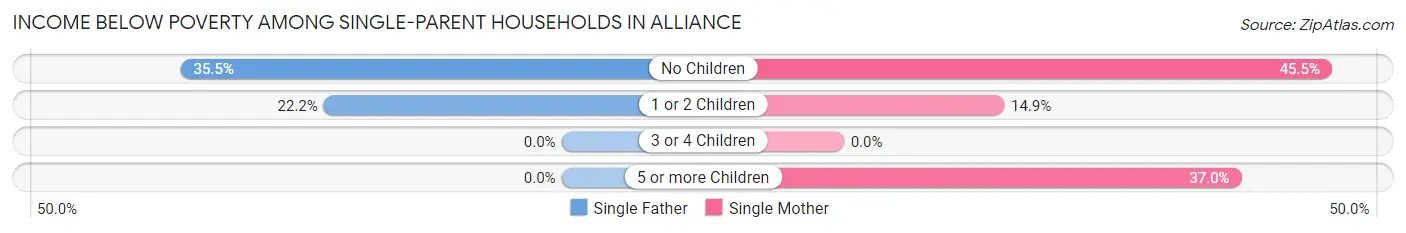
| Children | Single Father | Single Mother |
| No Children | 11 (35.5%) | 25 (45.5%) |
| 1 or 2 Children | 35 (22.2%) | 39 (14.9%) |
| 3 or 4 Children | 0 (0.0%) | 0 (0.0%) |
| 5 or more Children | 0 (0.0%) | 20 (37.0%) |
| Total | 46 (20.0%) | 84 (20.2%) |
Income Below Poverty Among Married-Couple vs Single-Parent Households in Alliance
The poverty data for Alliance shows that 93 of the married-couple family households (6.3%) and 130 of the single-parent households (20.1%) are living below the poverty level. Within the married-couple family households, those with no children have the highest poverty rate, with 83 households (8.8%) falling below the poverty line. Among the single-parent households, those with no children have the highest poverty rate, with 36 household (41.9%) living below poverty.
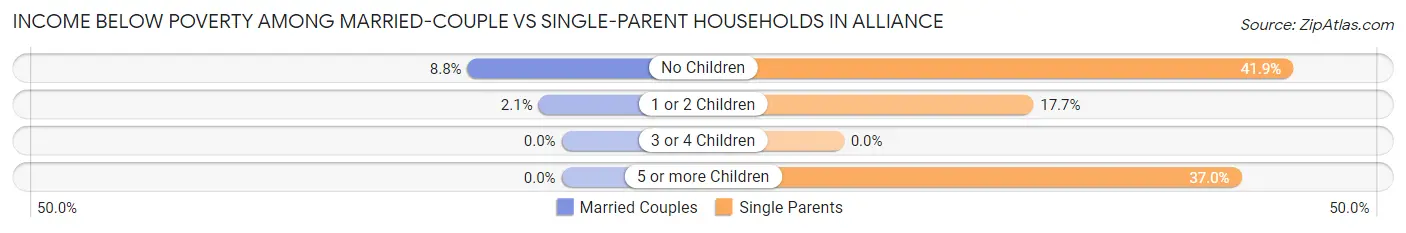
| Children | Married-Couple Families | Single-Parent Households |
| No Children | 83 (8.8%) | 36 (41.9%) |
| 1 or 2 Children | 10 (2.1%) | 74 (17.7%) |
| 3 or 4 Children | 0 (0.0%) | 0 (0.0%) |
| 5 or more Children | 0 (0.0%) | 20 (37.0%) |
| Total | 93 (6.3%) | 130 (20.1%) |
Employment Characteristics in Alliance
Employment by Class of Employer in Alliance
Among the 3,725 employed individuals in Alliance, private company employees (2,645 | 71.0%), local government employees (391 | 10.5%), and not-for-profit organizations (294 | 7.9%) make up the most common classes of employment.
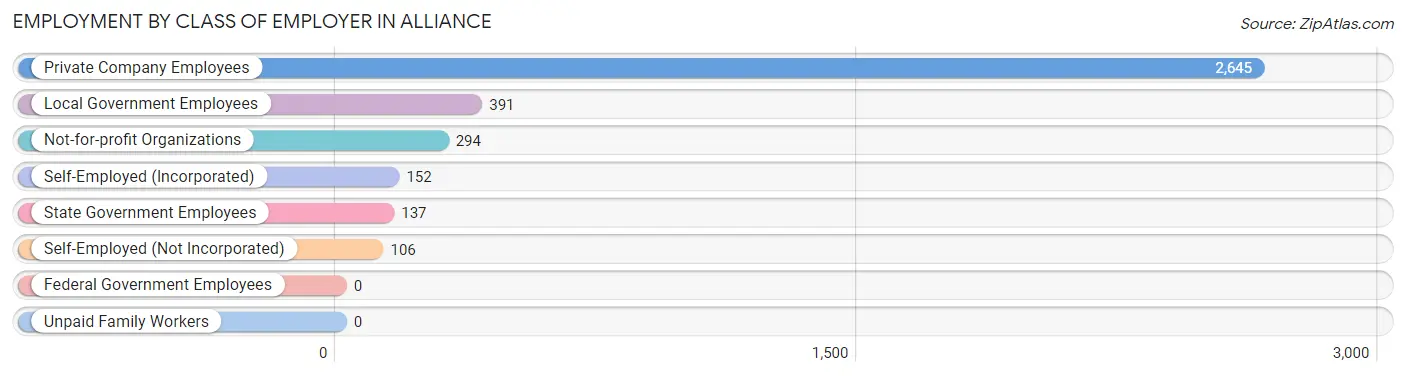
| Employer Class | # Employees | % Employees |
| Private Company Employees | 2,645 | 71.0% |
| Self-Employed (Incorporated) | 152 | 4.1% |
| Self-Employed (Not Incorporated) | 106 | 2.9% |
| Not-for-profit Organizations | 294 | 7.9% |
| Local Government Employees | 391 | 10.5% |
| State Government Employees | 137 | 3.7% |
| Federal Government Employees | 0 | 0.0% |
| Unpaid Family Workers | 0 | 0.0% |
| Total | 3,725 | 100.0% |
Employment Status by Age in Alliance
According to the labor force statistics for Alliance, out of the total population over 16 years of age (6,252), 64.2% or 4,014 individuals are in the labor force, with 5.4% or 217 of them unemployed. The age group with the highest labor force participation rate is 25 to 29 years, with 97.9% or 516 individuals in the labor force. Within the labor force, the 16 to 19 years age range has the highest percentage of unemployed individuals, with 35.8% or 59 of them being unemployed.
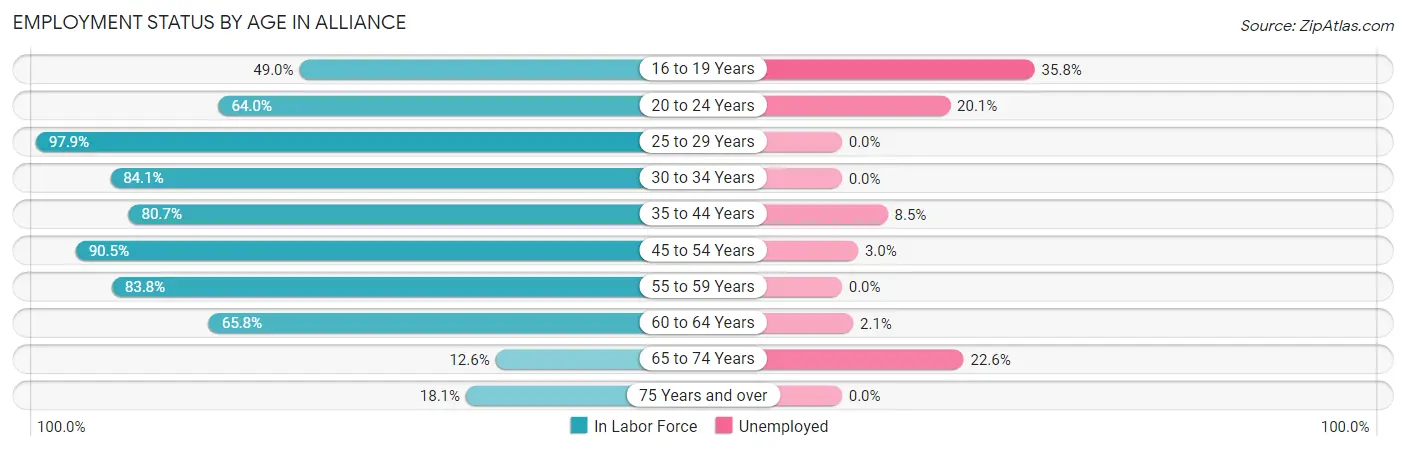
| Age Bracket | In Labor Force | Unemployed |
| 16 to 19 Years | 165 (49.0%) | 59 (35.8%) |
| 20 to 24 Years | 194 (64.0%) | 39 (20.1%) |
| 25 to 29 Years | 516 (97.9%) | 0 (0.0%) |
| 30 to 34 Years | 554 (84.1%) | 0 (0.0%) |
| 35 to 44 Years | 709 (80.7%) | 60 (8.5%) |
| 45 to 54 Years | 834 (90.5%) | 25 (3.0%) |
| 55 to 59 Years | 301 (83.8%) | 0 (0.0%) |
| 60 to 64 Years | 518 (65.8%) | 11 (2.1%) |
| 65 to 74 Years | 106 (12.6%) | 24 (22.6%) |
| 75 Years and over | 115 (18.1%) | 0 (0.0%) |
| Total | 4,014 (64.2%) | 217 (5.4%) |
Employment Status by Educational Attainment in Alliance
According to labor force statistics for Alliance, 83.0% of individuals (3,430) out of the total population between 25 and 64 years of age (4,133) are in the labor force, with 2.8% or 96 of them being unemployed. The group with the highest labor force participation rate are those with the educational attainment of bachelor's degree or higher, with 96.8% or 761 individuals in the labor force. Within the labor force, individuals with high school diploma education have the highest percentage of unemployment, with 8.8% or 72 of them being unemployed.
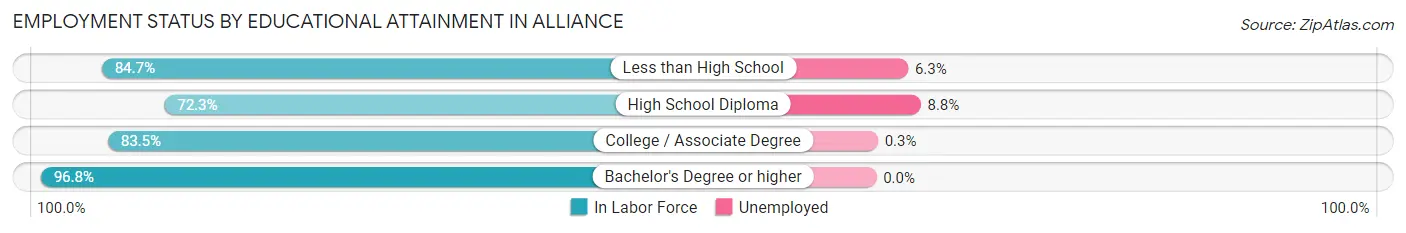
| Educational Attainment | In Labor Force | Unemployed |
| Less than High School | 316 (84.7%) | 23 (6.3%) |
| High School Diploma | 822 (72.3%) | 100 (8.8%) |
| College / Associate Degree | 1,534 (83.5%) | 6 (0.3%) |
| Bachelor's Degree or higher | 761 (96.8%) | 0 (0.0%) |
| Total | 3,430 (83.0%) | 116 (2.8%) |
Employment Occupations by Sex in Alliance
Management, Business, Science and Arts Occupations
The most common Management, Business, Science and Arts occupations in Alliance are Health Diagnosing & Treating (402 | 10.6%), Management (371 | 9.8%), Community & Social Service (317 | 8.4%), Health Technologists (189 | 5.0%), and Business & Financial (141 | 3.7%).
Management, Business, Science and Arts Occupations by Sex
Within the Management, Business, Science and Arts occupations in Alliance, the most male-oriented occupations are Architecture & Engineering (100.0%), Arts, Media & Entertainment (85.7%), and Computers, Engineering & Science (64.1%), while the most female-oriented occupations are Health Diagnosing & Treating (100.0%), Health Technologists (100.0%), and Legal Services & Support (90.3%).
| Occupation | Male | Female |
| Management | 128 (34.5%) | 243 (65.5%) |
| Business & Financial | 56 (39.7%) | 85 (60.3%) |
| Computers, Engineering & Science | 59 (64.1%) | 33 (35.9%) |
| Computers & Mathematics | 7 (17.5%) | 33 (82.5%) |
| Architecture & Engineering | 52 (100.0%) | 0 (0.0%) |
| Life, Physical & Social Science | 0 (0.0%) | 0 (0.0%) |
| Community & Social Service | 126 (39.8%) | 191 (60.3%) |
| Education, Arts & Media | 72 (51.8%) | 67 (48.2%) |
| Legal Services & Support | 3 (9.7%) | 28 (90.3%) |
| Education Instruction & Library | 15 (14.3%) | 90 (85.7%) |
| Arts, Media & Entertainment | 36 (85.7%) | 6 (14.3%) |
| Health Diagnosing & Treating | 0 (0.0%) | 402 (100.0%) |
| Health Technologists | 0 (0.0%) | 189 (100.0%) |
| Total (Category) | 369 (27.9%) | 954 (72.1%) |
| Total (Overall) | 1,847 (48.7%) | 1,947 (51.3%) |
Services Occupations
The most common Services occupations in Alliance are Cleaning & Maintenance (213 | 5.6%), Food Preparation & Serving (202 | 5.3%), Personal Care & Service (114 | 3.0%), Healthcare Support (63 | 1.7%), and Security & Protection (28 | 0.7%).
Services Occupations by Sex
Within the Services occupations in Alliance, the most male-oriented occupations are Security & Protection (100.0%), Firefighting & Prevention (100.0%), and Cleaning & Maintenance (38.5%), while the most female-oriented occupations are Healthcare Support (100.0%), Personal Care & Service (100.0%), and Food Preparation & Serving (85.2%).
| Occupation | Male | Female |
| Healthcare Support | 0 (0.0%) | 63 (100.0%) |
| Security & Protection | 28 (100.0%) | 0 (0.0%) |
| Firefighting & Prevention | 28 (100.0%) | 0 (0.0%) |
| Law Enforcement | 0 (0.0%) | 0 (0.0%) |
| Food Preparation & Serving | 30 (14.8%) | 172 (85.2%) |
| Cleaning & Maintenance | 82 (38.5%) | 131 (61.5%) |
| Personal Care & Service | 0 (0.0%) | 114 (100.0%) |
| Total (Category) | 140 (22.6%) | 480 (77.4%) |
| Total (Overall) | 1,847 (48.7%) | 1,947 (51.3%) |
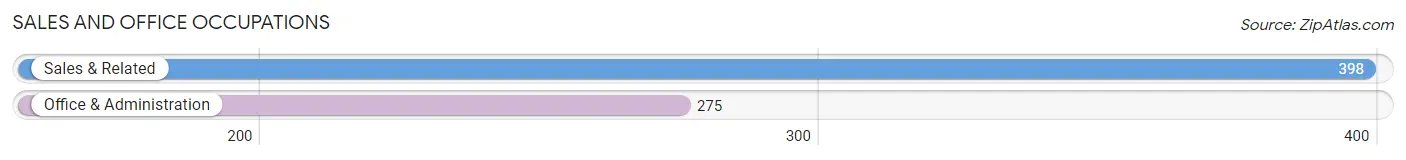
Sales and Office Occupations
The most common Sales and Office occupations in Alliance are Sales & Related (398 | 10.5%), and Office & Administration (275 | 7.2%).
Sales and Office Occupations by Sex
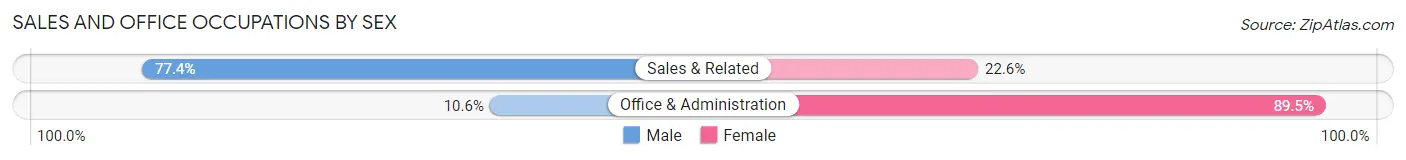
| Occupation | Male | Female |
| Sales & Related | 308 (77.4%) | 90 (22.6%) |
| Office & Administration | 29 (10.5%) | 246 (89.4%) |
| Total (Category) | 337 (50.1%) | 336 (49.9%) |
| Total (Overall) | 1,847 (48.7%) | 1,947 (51.3%) |
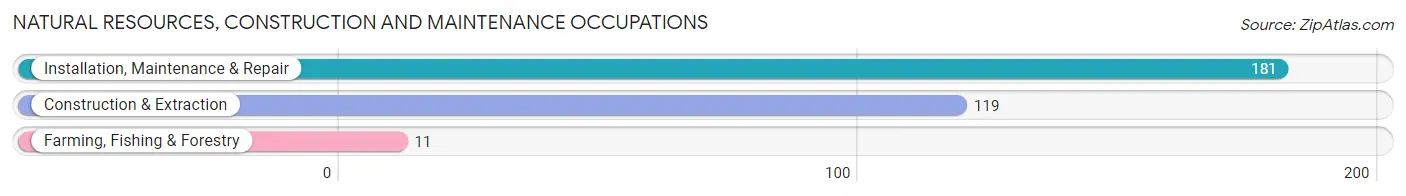
Natural Resources, Construction and Maintenance Occupations
The most common Natural Resources, Construction and Maintenance occupations in Alliance are Installation, Maintenance & Repair (181 | 4.8%), Construction & Extraction (119 | 3.1%), and Farming, Fishing & Forestry (11 | 0.3%).
Natural Resources, Construction and Maintenance Occupations by Sex
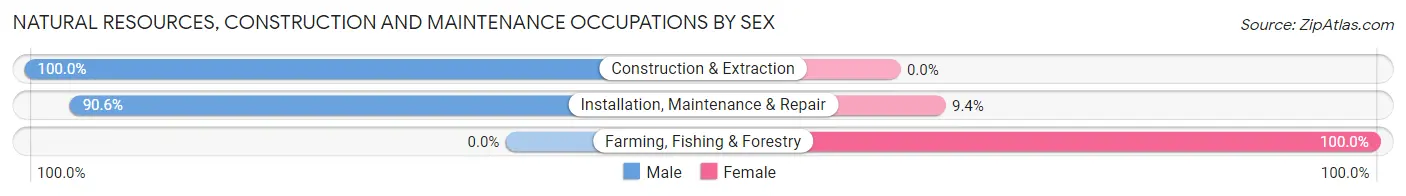
| Occupation | Male | Female |
| Farming, Fishing & Forestry | 0 (0.0%) | 11 (100.0%) |
| Construction & Extraction | 119 (100.0%) | 0 (0.0%) |
| Installation, Maintenance & Repair | 164 (90.6%) | 17 (9.4%) |
| Total (Category) | 283 (91.0%) | 28 (9.0%) |
| Total (Overall) | 1,847 (48.7%) | 1,947 (51.3%) |
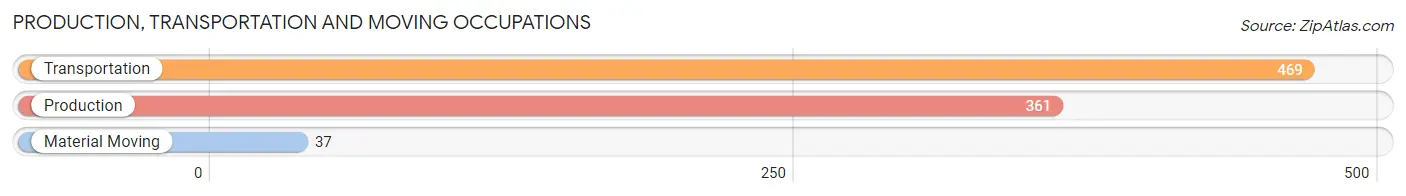
Production, Transportation and Moving Occupations
The most common Production, Transportation and Moving occupations in Alliance are Transportation (469 | 12.4%), Production (361 | 9.5%), and Material Moving (37 | 1.0%).
Production, Transportation and Moving Occupations by Sex
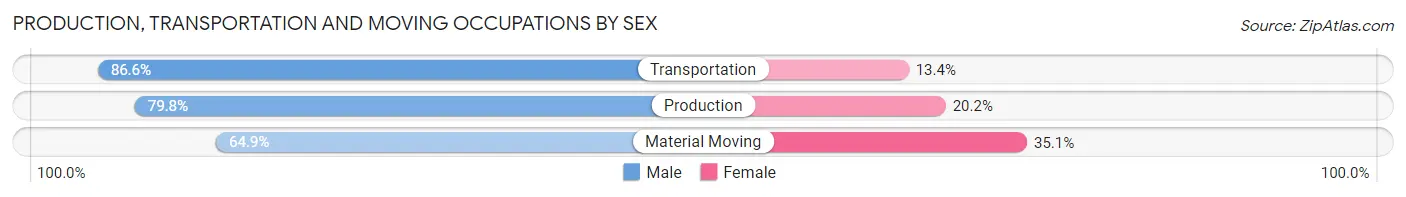
| Occupation | Male | Female |
| Production | 288 (79.8%) | 73 (20.2%) |
| Transportation | 406 (86.6%) | 63 (13.4%) |
| Material Moving | 24 (64.9%) | 13 (35.1%) |
| Total (Category) | 718 (82.8%) | 149 (17.2%) |
| Total (Overall) | 1,847 (48.7%) | 1,947 (51.3%) |
Employment Industries by Sex in Alliance
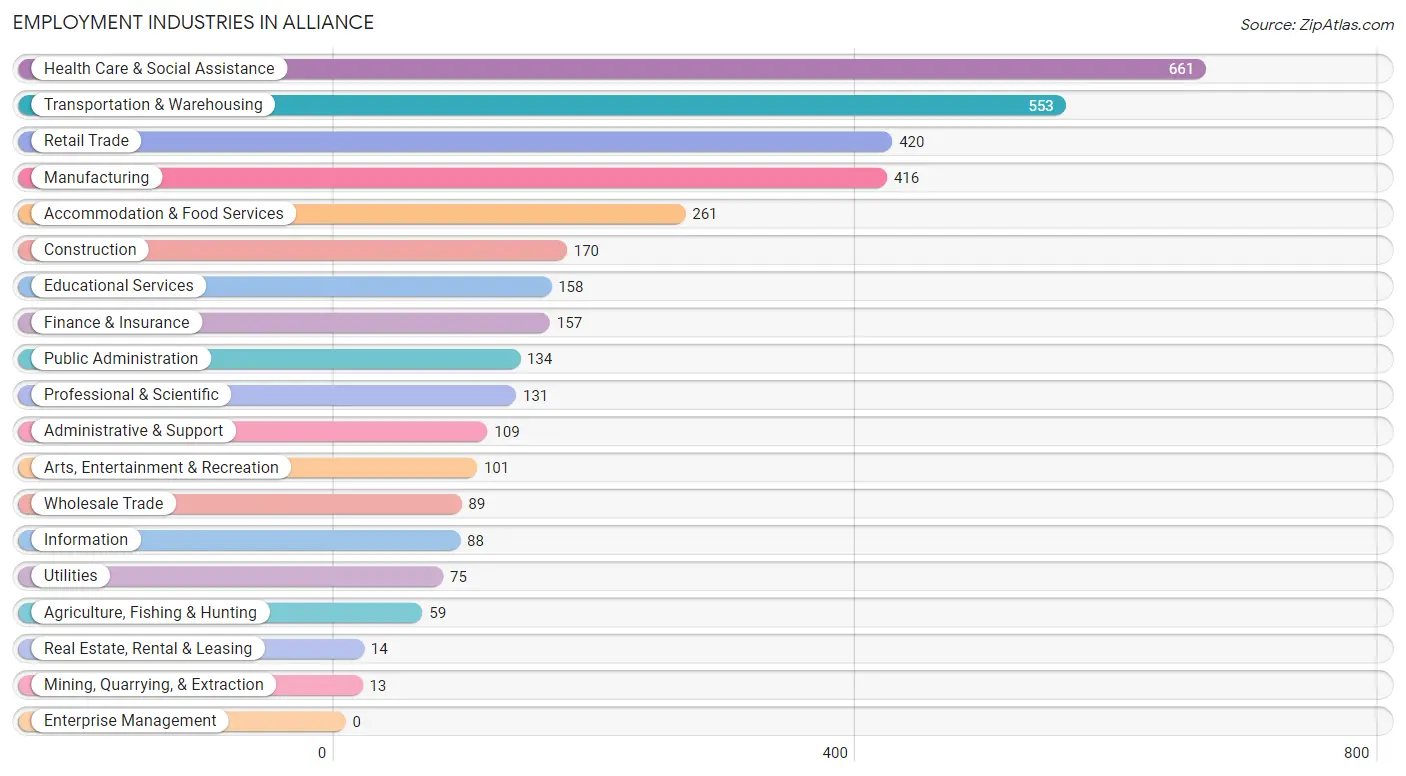
Employment Industries in Alliance
The major employment industries in Alliance include Health Care & Social Assistance (661 | 17.4%), Transportation & Warehousing (553 | 14.6%), Retail Trade (420 | 11.1%), Manufacturing (416 | 11.0%), and Accommodation & Food Services (261 | 6.9%).
Employment Industries by Sex in Alliance
The Alliance industries that see more men than women are Mining, Quarrying, & Extraction (100.0%), Wholesale Trade (100.0%), and Utilities (88.0%), whereas the industries that tend to have a higher number of women are Real Estate, Rental & Leasing (100.0%), Health Care & Social Assistance (99.9%), and Professional & Scientific (97.7%).
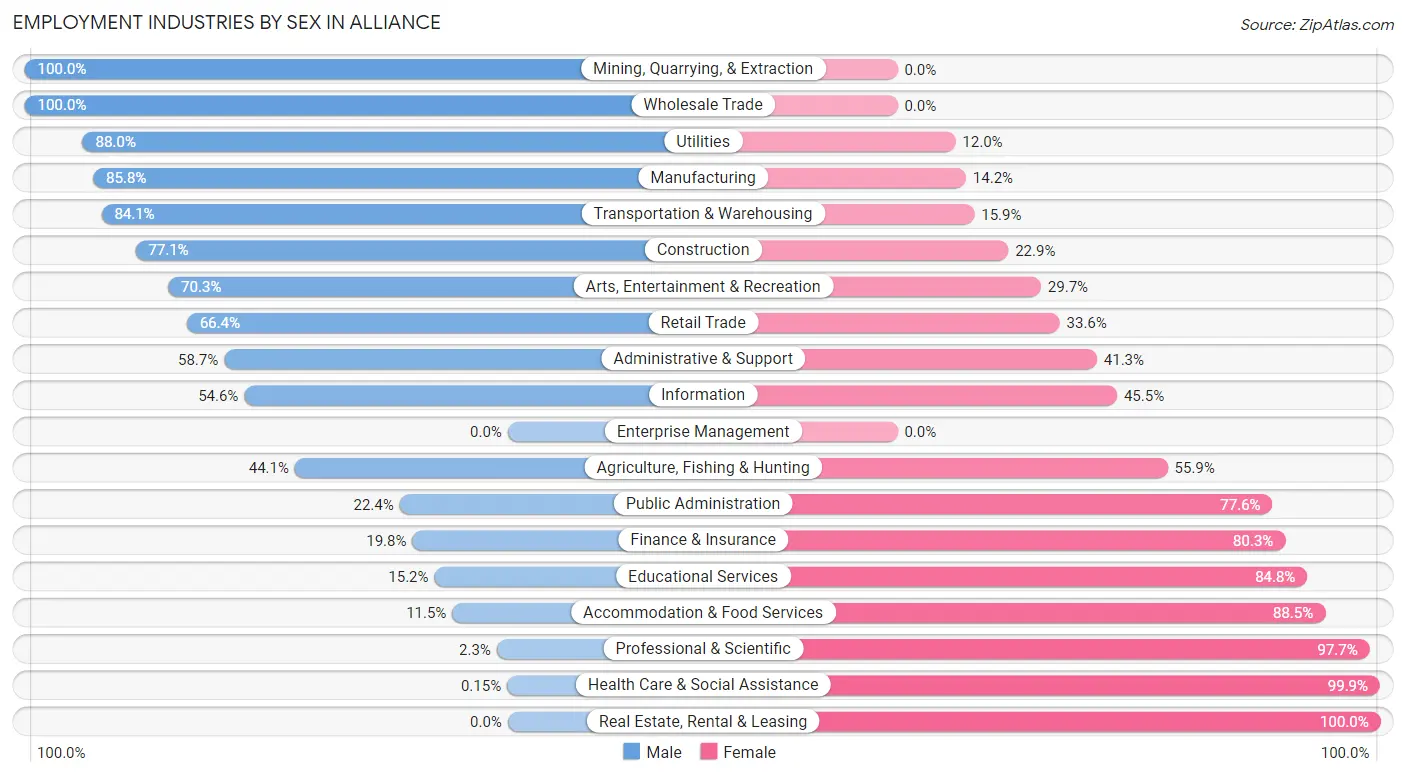
| Industry | Male | Female |
| Agriculture, Fishing & Hunting | 26 (44.1%) | 33 (55.9%) |
| Mining, Quarrying, & Extraction | 13 (100.0%) | 0 (0.0%) |
| Construction | 131 (77.1%) | 39 (22.9%) |
| Manufacturing | 357 (85.8%) | 59 (14.2%) |
| Wholesale Trade | 89 (100.0%) | 0 (0.0%) |
| Retail Trade | 279 (66.4%) | 141 (33.6%) |
| Transportation & Warehousing | 465 (84.1%) | 88 (15.9%) |
| Utilities | 66 (88.0%) | 9 (12.0%) |
| Information | 48 (54.5%) | 40 (45.5%) |
| Finance & Insurance | 31 (19.8%) | 126 (80.2%) |
| Real Estate, Rental & Leasing | 0 (0.0%) | 14 (100.0%) |
| Professional & Scientific | 3 (2.3%) | 128 (97.7%) |
| Enterprise Management | 0 (0.0%) | 0 (0.0%) |
| Administrative & Support | 64 (58.7%) | 45 (41.3%) |
| Educational Services | 24 (15.2%) | 134 (84.8%) |
| Health Care & Social Assistance | 1 (0.2%) | 660 (99.9%) |
| Arts, Entertainment & Recreation | 71 (70.3%) | 30 (29.7%) |
| Accommodation & Food Services | 30 (11.5%) | 231 (88.5%) |
| Public Administration | 30 (22.4%) | 104 (77.6%) |
| Total | 1,847 (48.7%) | 1,947 (51.3%) |
Education in Alliance
School Enrollment in Alliance
The most common levels of schooling among the 1,758 students in Alliance are middle school (586 | 33.3%), high school (450 | 25.6%), and elementary school (394 | 22.4%).
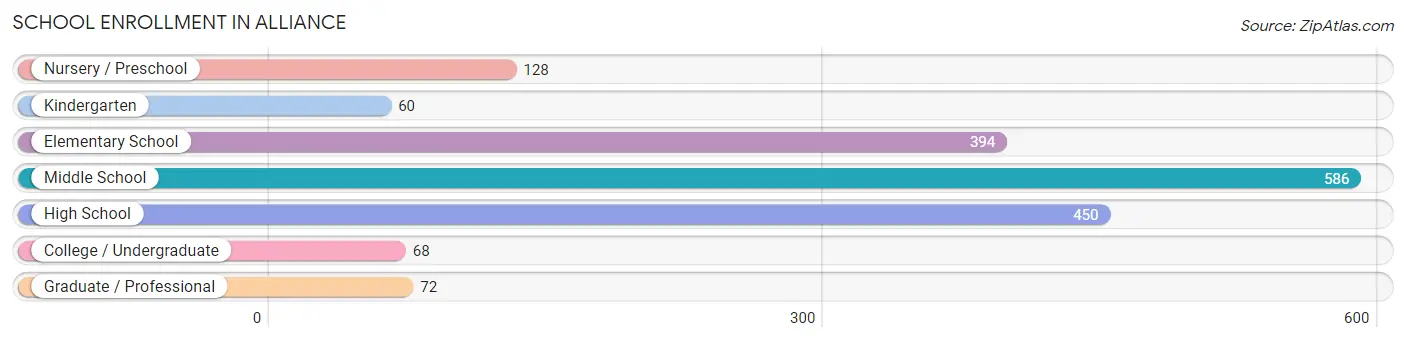
| School Level | # Students | % Students |
| Nursery / Preschool | 128 | 7.3% |
| Kindergarten | 60 | 3.4% |
| Elementary School | 394 | 22.4% |
| Middle School | 586 | 33.3% |
| High School | 450 | 25.6% |
| College / Undergraduate | 68 | 3.9% |
| Graduate / Professional | 72 | 4.1% |
| Total | 1,758 | 100.0% |
School Enrollment by Age by Funding Source in Alliance
Out of a total of 1,758 students who are enrolled in schools in Alliance, 302 (17.2%) attend a private institution, while the remaining 1,456 (82.8%) are enrolled in public schools. The age group of 35 years and over has the highest likelihood of being enrolled in private schools, with 30 (47.6% in the age bracket) enrolled. Conversely, the age group of 3 to 4 year olds has the lowest likelihood of being enrolled in a private school, with 96 (100.0% in the age bracket) attending a public institution.
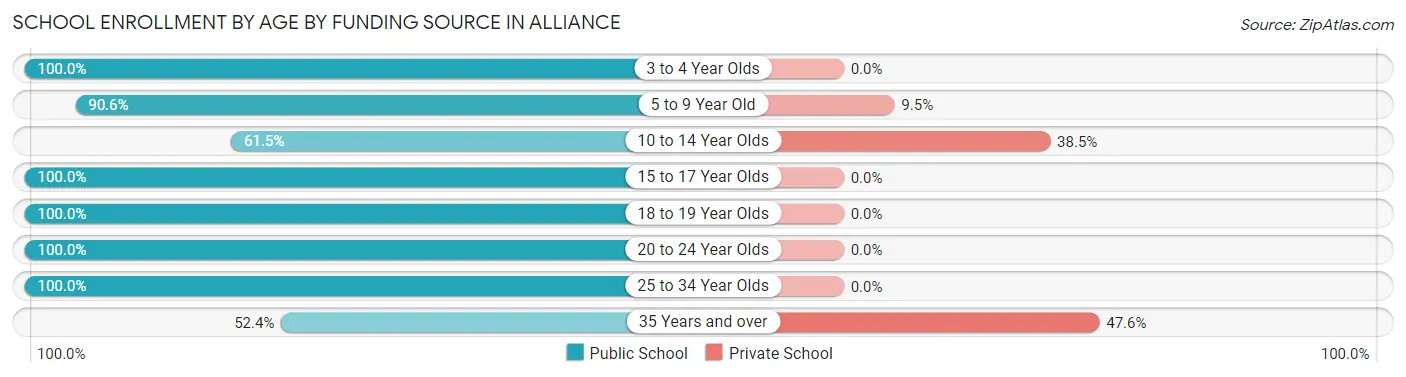
| Age Bracket | Public School | Private School |
| 3 to 4 Year Olds | 96 (100.0%) | 0 (0.0%) |
| 5 to 9 Year Old | 412 (90.5%) | 43 (9.5%) |
| 10 to 14 Year Olds | 368 (61.5%) | 230 (38.5%) |
| 15 to 17 Year Olds | 311 (100.0%) | 0 (0.0%) |
| 18 to 19 Year Olds | 124 (100.0%) | 0 (0.0%) |
| 20 to 24 Year Olds | 93 (100.0%) | 0 (0.0%) |
| 25 to 34 Year Olds | 18 (100.0%) | 0 (0.0%) |
| 35 Years and over | 33 (52.4%) | 30 (47.6%) |
| Total | 1,456 (82.8%) | 302 (17.2%) |
Educational Attainment by Field of Study in Alliance
Education (216 | 19.2%), science & technology (192 | 17.1%), business (180 | 16.0%), liberal arts & history (154 | 13.7%), and visual & performing arts (107 | 9.5%) are the most common fields of study among 1,126 individuals in Alliance who have obtained a bachelor's degree or higher.
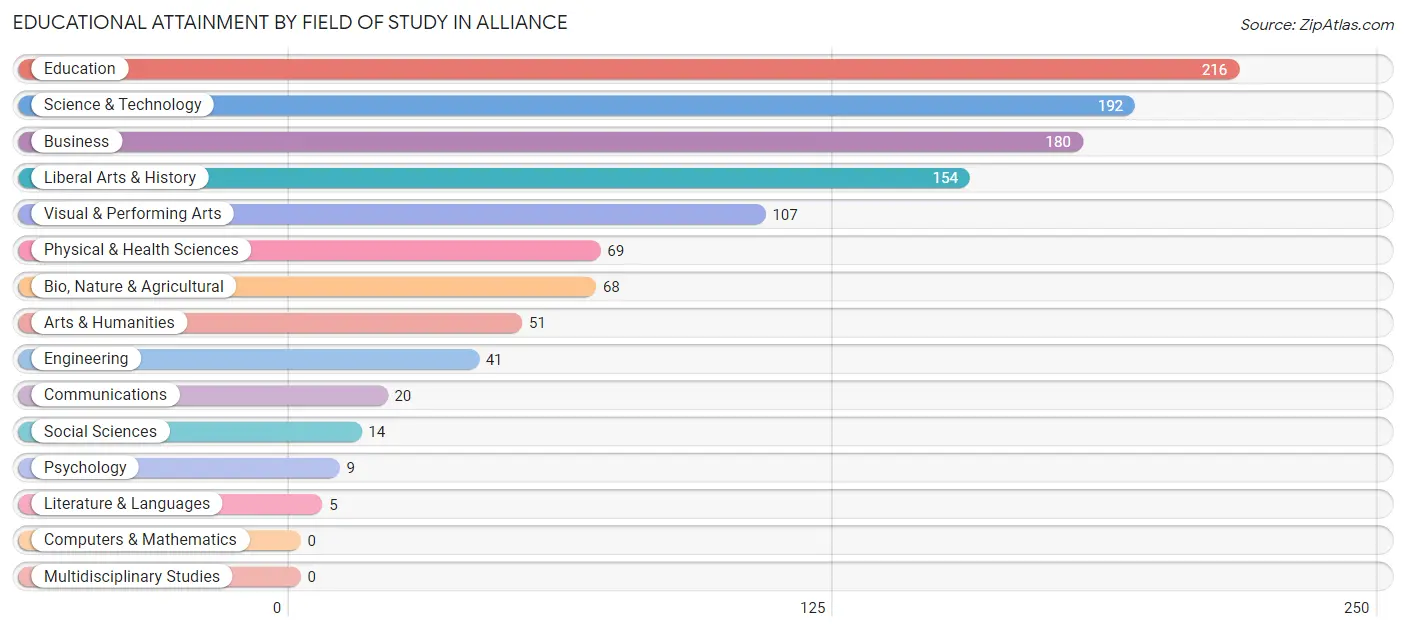
| Field of Study | # Graduates | % Graduates |
| Computers & Mathematics | 0 | 0.0% |
| Bio, Nature & Agricultural | 68 | 6.0% |
| Physical & Health Sciences | 69 | 6.1% |
| Psychology | 9 | 0.8% |
| Social Sciences | 14 | 1.2% |
| Engineering | 41 | 3.6% |
| Multidisciplinary Studies | 0 | 0.0% |
| Science & Technology | 192 | 17.1% |
| Business | 180 | 16.0% |
| Education | 216 | 19.2% |
| Literature & Languages | 5 | 0.4% |
| Liberal Arts & History | 154 | 13.7% |
| Visual & Performing Arts | 107 | 9.5% |
| Communications | 20 | 1.8% |
| Arts & Humanities | 51 | 4.5% |
| Total | 1,126 | 100.0% |
Transportation & Commute in Alliance
Vehicle Availability by Sex in Alliance
The most prevalent vehicle ownership categories in Alliance are males with 2 vehicles (788, accounting for 43.7%) and females with 2 vehicles (825, making up 41.1%).
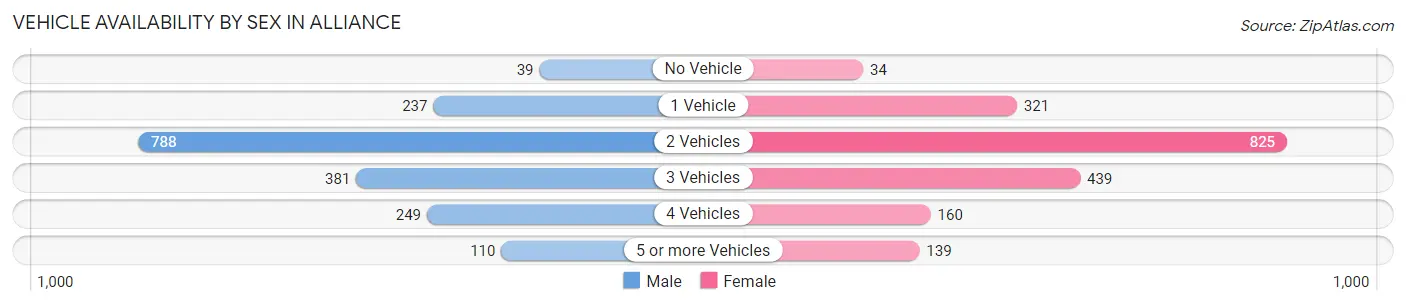
| Vehicles Available | Male | Female |
| No Vehicle | 39 (2.2%) | 34 (1.8%) |
| 1 Vehicle | 237 (13.1%) | 321 (16.7%) |
| 2 Vehicles | 788 (43.7%) | 825 (43.0%) |
| 3 Vehicles | 381 (21.1%) | 439 (22.9%) |
| 4 Vehicles | 249 (13.8%) | 160 (8.3%) |
| 5 or more Vehicles | 110 (6.1%) | 139 (7.2%) |
| Total | 1,804 (100.0%) | 1,918 (100.0%) |
Commute Time in Alliance
The most frequently occuring commute durations in Alliance are 5 to 9 minutes (1,965 commuters, 54.8%), less than 5 minutes (744 commuters, 20.7%), and 10 to 14 minutes (460 commuters, 12.8%).
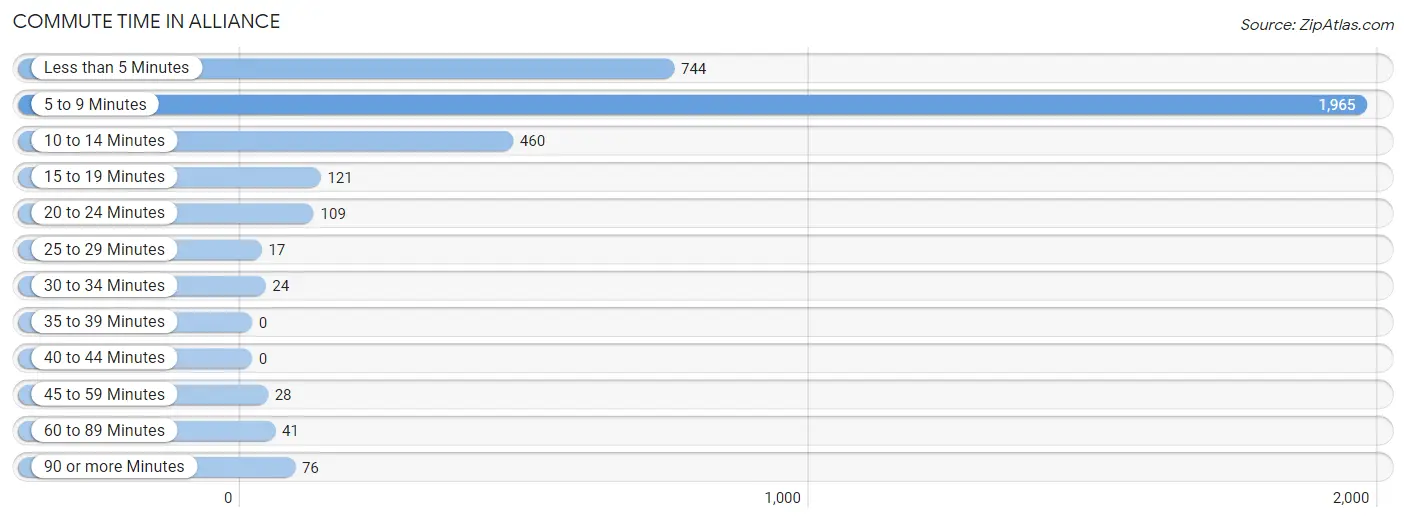
| Commute Time | # Commuters | % Commuters |
| Less than 5 Minutes | 744 | 20.7% |
| 5 to 9 Minutes | 1,965 | 54.8% |
| 10 to 14 Minutes | 460 | 12.8% |
| 15 to 19 Minutes | 121 | 3.4% |
| 20 to 24 Minutes | 109 | 3.0% |
| 25 to 29 Minutes | 17 | 0.5% |
| 30 to 34 Minutes | 24 | 0.7% |
| 35 to 39 Minutes | 0 | 0.0% |
| 40 to 44 Minutes | 0 | 0.0% |
| 45 to 59 Minutes | 28 | 0.8% |
| 60 to 89 Minutes | 41 | 1.1% |
| 90 or more Minutes | 76 | 2.1% |
Commute Time by Sex in Alliance
The most common commute times in Alliance are 5 to 9 minutes (997 commuters, 59.5%) for males and 5 to 9 minutes (968 commuters, 50.7%) for females.
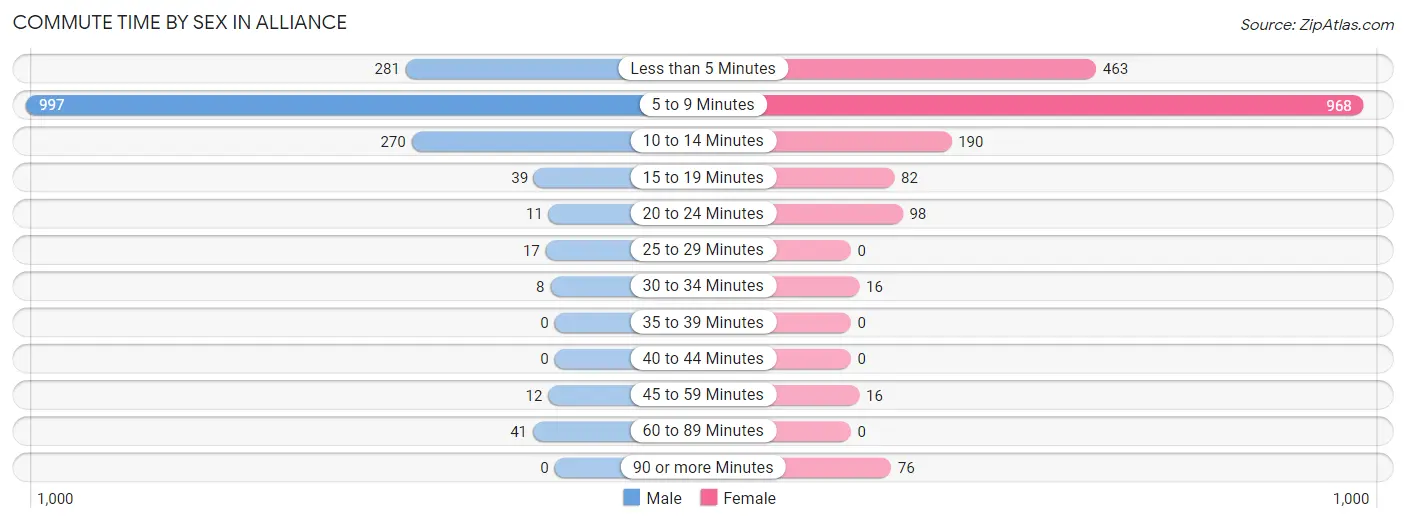
| Commute Time | Male | Female |
| Less than 5 Minutes | 281 (16.8%) | 463 (24.2%) |
| 5 to 9 Minutes | 997 (59.5%) | 968 (50.7%) |
| 10 to 14 Minutes | 270 (16.1%) | 190 (10.0%) |
| 15 to 19 Minutes | 39 (2.3%) | 82 (4.3%) |
| 20 to 24 Minutes | 11 (0.7%) | 98 (5.1%) |
| 25 to 29 Minutes | 17 (1.0%) | 0 (0.0%) |
| 30 to 34 Minutes | 8 (0.5%) | 16 (0.8%) |
| 35 to 39 Minutes | 0 (0.0%) | 0 (0.0%) |
| 40 to 44 Minutes | 0 (0.0%) | 0 (0.0%) |
| 45 to 59 Minutes | 12 (0.7%) | 16 (0.8%) |
| 60 to 89 Minutes | 41 (2.5%) | 0 (0.0%) |
| 90 or more Minutes | 0 (0.0%) | 76 (4.0%) |
Time of Departure to Work by Sex in Alliance
The most frequent times of departure to work in Alliance are 6:30 AM to 6:59 AM (326, 19.5%) for males and 7:30 AM to 7:59 AM (413, 21.6%) for females.
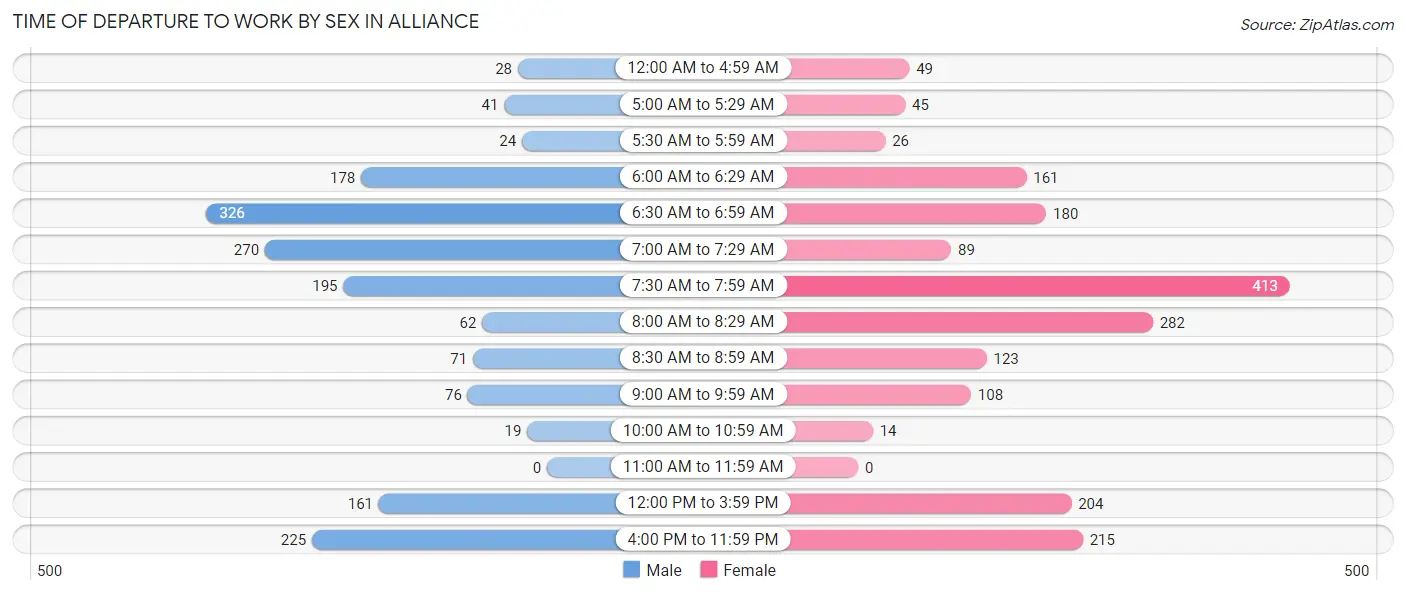
| Time of Departure | Male | Female |
| 12:00 AM to 4:59 AM | 28 (1.7%) | 49 (2.6%) |
| 5:00 AM to 5:29 AM | 41 (2.5%) | 45 (2.4%) |
| 5:30 AM to 5:59 AM | 24 (1.4%) | 26 (1.4%) |
| 6:00 AM to 6:29 AM | 178 (10.6%) | 161 (8.4%) |
| 6:30 AM to 6:59 AM | 326 (19.5%) | 180 (9.4%) |
| 7:00 AM to 7:29 AM | 270 (16.1%) | 89 (4.7%) |
| 7:30 AM to 7:59 AM | 195 (11.6%) | 413 (21.6%) |
| 8:00 AM to 8:29 AM | 62 (3.7%) | 282 (14.8%) |
| 8:30 AM to 8:59 AM | 71 (4.2%) | 123 (6.4%) |
| 9:00 AM to 9:59 AM | 76 (4.5%) | 108 (5.7%) |
| 10:00 AM to 10:59 AM | 19 (1.1%) | 14 (0.7%) |
| 11:00 AM to 11:59 AM | 0 (0.0%) | 0 (0.0%) |
| 12:00 PM to 3:59 PM | 161 (9.6%) | 204 (10.7%) |
| 4:00 PM to 11:59 PM | 225 (13.4%) | 215 (11.3%) |
| Total | 1,676 (100.0%) | 1,909 (100.0%) |
Housing Occupancy in Alliance
Occupancy by Ownership in Alliance
Of the total 3,426 dwellings in Alliance, owner-occupied units account for 2,345 (68.4%), while renter-occupied units make up 1,081 (31.6%).
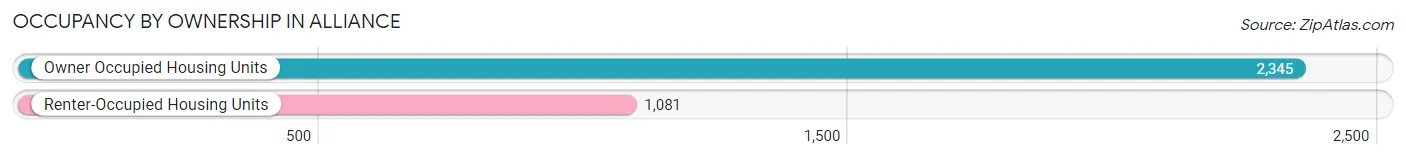
| Occupancy | # Housing Units | % Housing Units |
| Owner Occupied Housing Units | 2,345 | 68.4% |
| Renter-Occupied Housing Units | 1,081 | 31.6% |
| Total Occupied Housing Units | 3,426 | 100.0% |
Occupancy by Household Size in Alliance
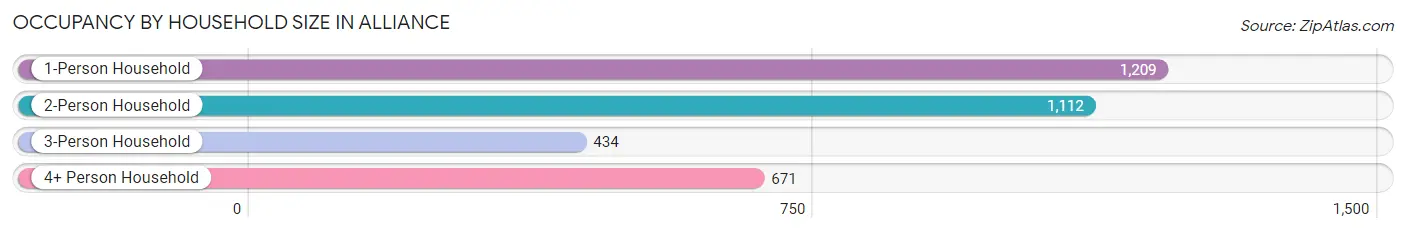
| Household Size | # Housing Units | % Housing Units |
| 1-Person Household | 1,209 | 35.3% |
| 2-Person Household | 1,112 | 32.5% |
| 3-Person Household | 434 | 12.7% |
| 4+ Person Household | 671 | 19.6% |
| Total Housing Units | 3,426 | 100.0% |
Occupancy by Ownership by Household Size in Alliance
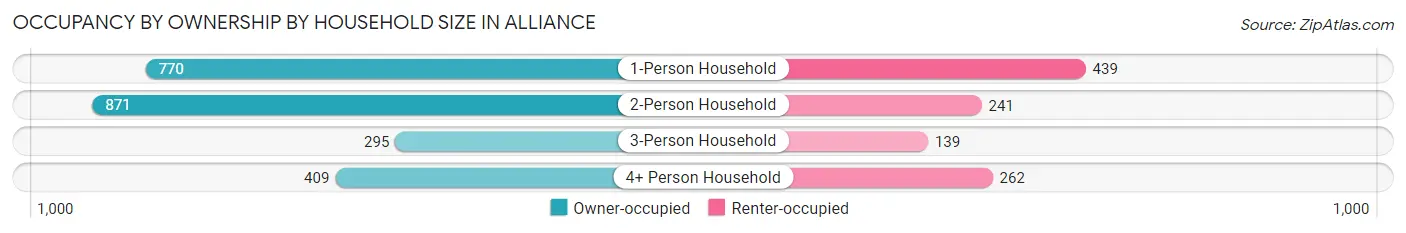
| Household Size | Owner-occupied | Renter-occupied |
| 1-Person Household | 770 (63.7%) | 439 (36.3%) |
| 2-Person Household | 871 (78.3%) | 241 (21.7%) |
| 3-Person Household | 295 (68.0%) | 139 (32.0%) |
| 4+ Person Household | 409 (61.0%) | 262 (39.1%) |
| Total Housing Units | 2,345 (68.4%) | 1,081 (31.6%) |
Occupancy by Educational Attainment in Alliance
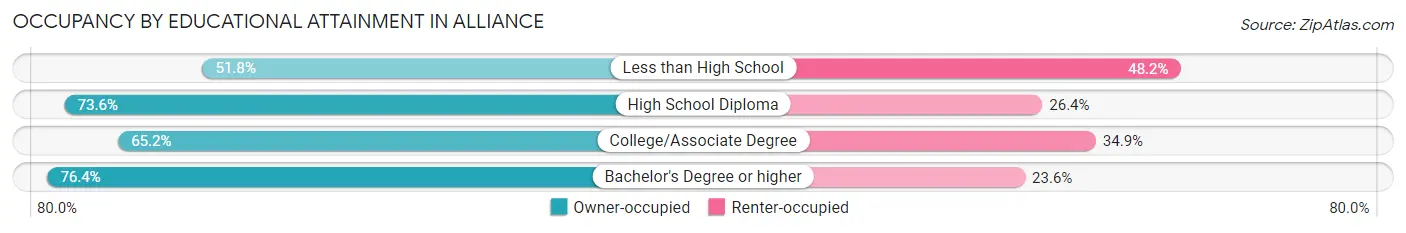
| Household Size | Owner-occupied | Renter-occupied |
| Less than High School | 146 (51.8%) | 136 (48.2%) |
| High School Diploma | 651 (73.6%) | 233 (26.4%) |
| College/Associate Degree | 1,034 (65.1%) | 553 (34.8%) |
| Bachelor's Degree or higher | 514 (76.4%) | 159 (23.6%) |
Occupancy by Age of Householder in Alliance
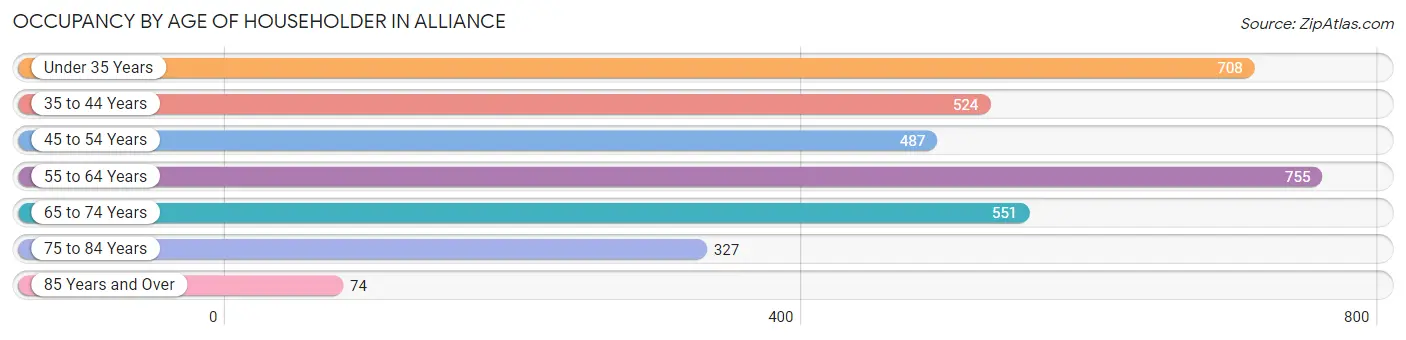
| Age Bracket | # Households | % Households |
| Under 35 Years | 708 | 20.7% |
| 35 to 44 Years | 524 | 15.3% |
| 45 to 54 Years | 487 | 14.2% |
| 55 to 64 Years | 755 | 22.0% |
| 65 to 74 Years | 551 | 16.1% |
| 75 to 84 Years | 327 | 9.5% |
| 85 Years and Over | 74 | 2.2% |
| Total | 3,426 | 100.0% |
Housing Finances in Alliance
Median Income by Occupancy in Alliance
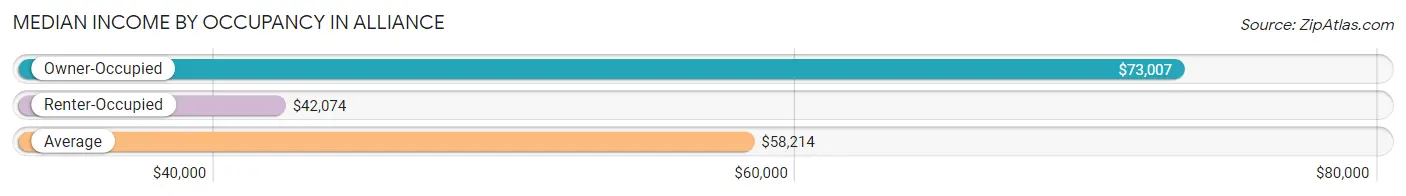
| Occupancy Type | # Households | Median Income |
| Owner-Occupied | 2,345 (68.4%) | $73,007 |
| Renter-Occupied | 1,081 (31.6%) | $42,074 |
| Average | 3,426 (100.0%) | $58,214 |
Occupancy by Householder Income Bracket in Alliance
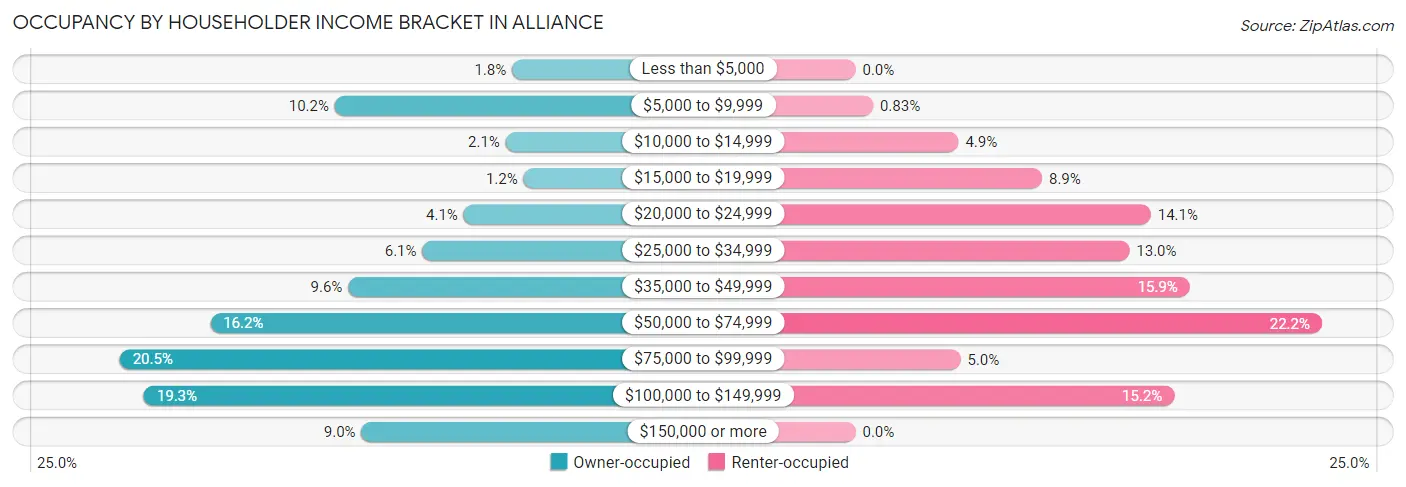
| Income Bracket | Owner-occupied | Renter-occupied |
| Less than $5,000 | 42 (1.8%) | 0 (0.0%) |
| $5,000 to $9,999 | 240 (10.2%) | 9 (0.8%) |
| $10,000 to $14,999 | 49 (2.1%) | 53 (4.9%) |
| $15,000 to $19,999 | 29 (1.2%) | 96 (8.9%) |
| $20,000 to $24,999 | 96 (4.1%) | 152 (14.1%) |
| $25,000 to $34,999 | 142 (6.1%) | 141 (13.0%) |
| $35,000 to $49,999 | 225 (9.6%) | 172 (15.9%) |
| $50,000 to $74,999 | 379 (16.2%) | 240 (22.2%) |
| $75,000 to $99,999 | 480 (20.5%) | 54 (5.0%) |
| $100,000 to $149,999 | 453 (19.3%) | 164 (15.2%) |
| $150,000 or more | 210 (9.0%) | 0 (0.0%) |
| Total | 2,345 (100.0%) | 1,081 (100.0%) |
Monthly Housing Cost Tiers in Alliance
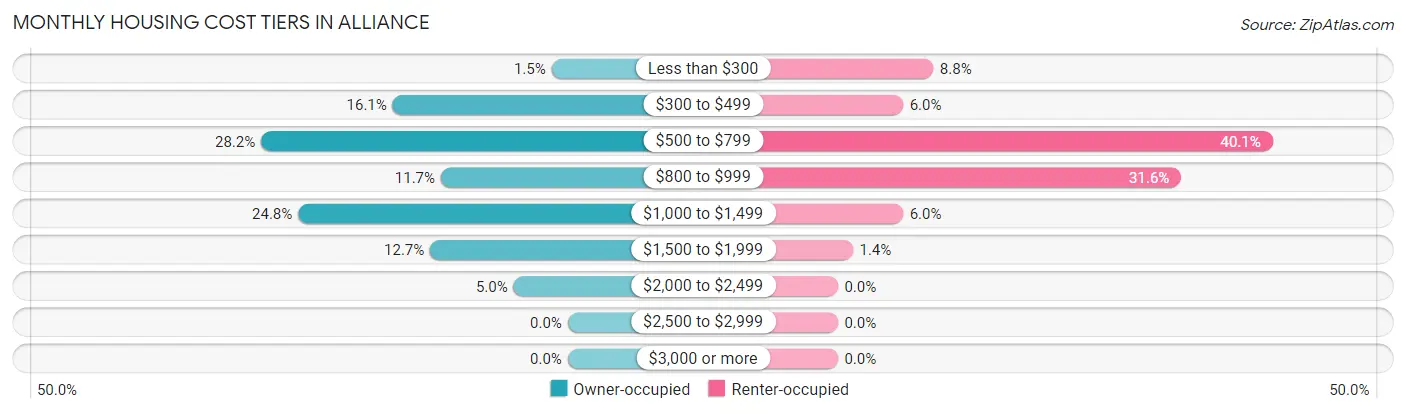
| Monthly Cost | Owner-occupied | Renter-occupied |
| Less than $300 | 35 (1.5%) | 95 (8.8%) |
| $300 to $499 | 378 (16.1%) | 65 (6.0%) |
| $500 to $799 | 662 (28.2%) | 433 (40.1%) |
| $800 to $999 | 274 (11.7%) | 342 (31.6%) |
| $1,000 to $1,499 | 582 (24.8%) | 65 (6.0%) |
| $1,500 to $1,999 | 297 (12.7%) | 15 (1.4%) |
| $2,000 to $2,499 | 117 (5.0%) | 0 (0.0%) |
| $2,500 to $2,999 | 0 (0.0%) | 0 (0.0%) |
| $3,000 or more | 0 (0.0%) | 0 (0.0%) |
| Total | 2,345 (100.0%) | 1,081 (100.0%) |
Physical Housing Characteristics in Alliance
Housing Structures in Alliance
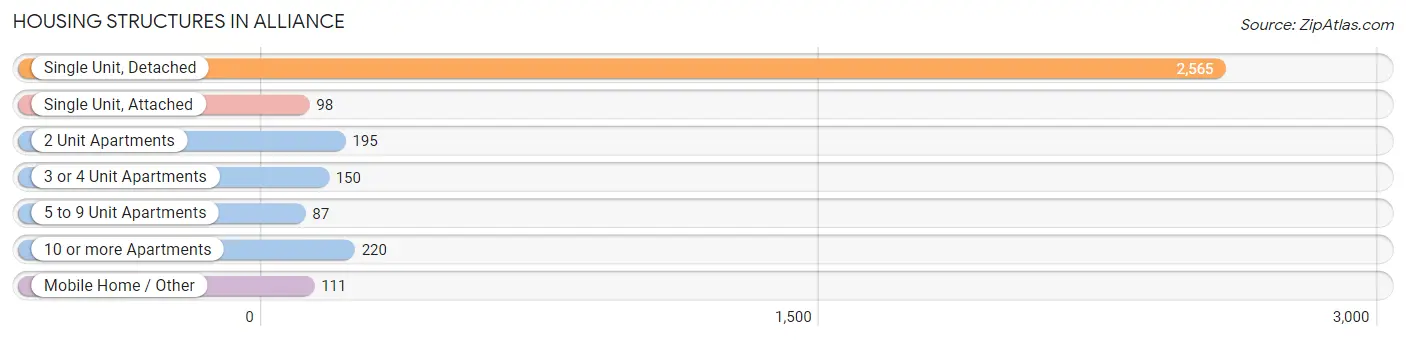
| Structure Type | # Housing Units | % Housing Units |
| Single Unit, Detached | 2,565 | 74.9% |
| Single Unit, Attached | 98 | 2.9% |
| 2 Unit Apartments | 195 | 5.7% |
| 3 or 4 Unit Apartments | 150 | 4.4% |
| 5 to 9 Unit Apartments | 87 | 2.5% |
| 10 or more Apartments | 220 | 6.4% |
| Mobile Home / Other | 111 | 3.2% |
| Total | 3,426 | 100.0% |
Housing Structures by Occupancy in Alliance
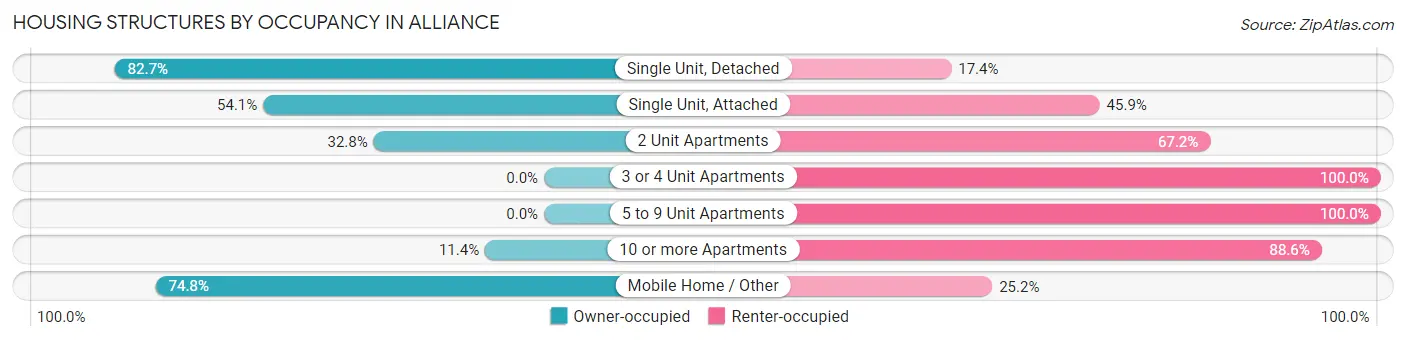
| Structure Type | Owner-occupied | Renter-occupied |
| Single Unit, Detached | 2,120 (82.7%) | 445 (17.3%) |
| Single Unit, Attached | 53 (54.1%) | 45 (45.9%) |
| 2 Unit Apartments | 64 (32.8%) | 131 (67.2%) |
| 3 or 4 Unit Apartments | 0 (0.0%) | 150 (100.0%) |
| 5 to 9 Unit Apartments | 0 (0.0%) | 87 (100.0%) |
| 10 or more Apartments | 25 (11.4%) | 195 (88.6%) |
| Mobile Home / Other | 83 (74.8%) | 28 (25.2%) |
| Total | 2,345 (68.4%) | 1,081 (31.6%) |
Housing Structures by Number of Rooms in Alliance
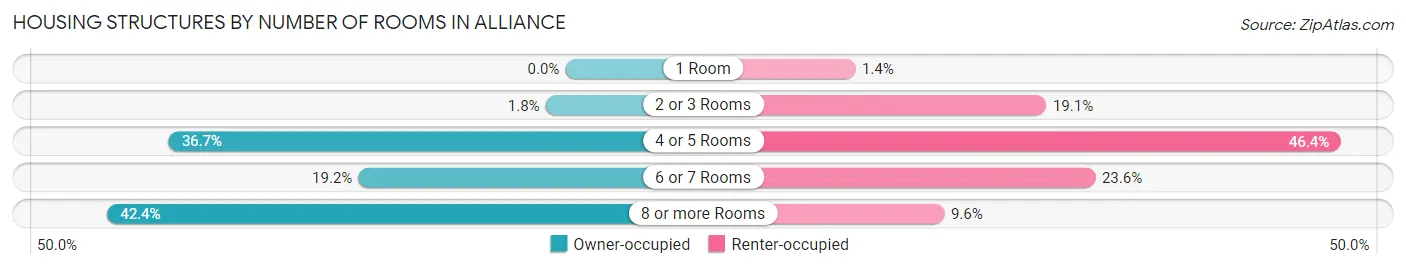
| Number of Rooms | Owner-occupied | Renter-occupied |
| 1 Room | 0 (0.0%) | 15 (1.4%) |
| 2 or 3 Rooms | 43 (1.8%) | 206 (19.1%) |
| 4 or 5 Rooms | 860 (36.7%) | 501 (46.4%) |
| 6 or 7 Rooms | 449 (19.2%) | 255 (23.6%) |
| 8 or more Rooms | 993 (42.3%) | 104 (9.6%) |
| Total | 2,345 (100.0%) | 1,081 (100.0%) |
Housing Structure by Heating Type in Alliance
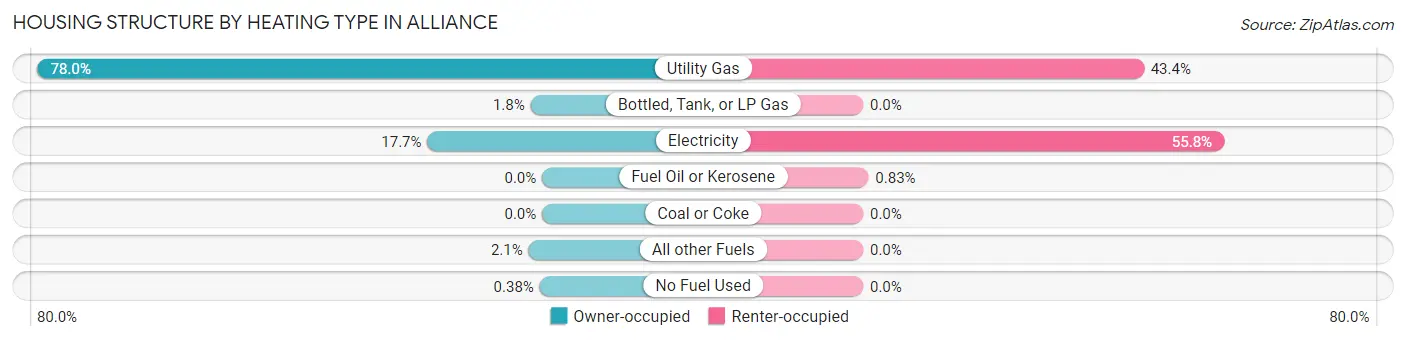
| Heating Type | Owner-occupied | Renter-occupied |
| Utility Gas | 1,829 (78.0%) | 469 (43.4%) |
| Bottled, Tank, or LP Gas | 42 (1.8%) | 0 (0.0%) |
| Electricity | 416 (17.7%) | 603 (55.8%) |
| Fuel Oil or Kerosene | 0 (0.0%) | 9 (0.8%) |
| Coal or Coke | 0 (0.0%) | 0 (0.0%) |
| All other Fuels | 49 (2.1%) | 0 (0.0%) |
| No Fuel Used | 9 (0.4%) | 0 (0.0%) |
| Total | 2,345 (100.0%) | 1,081 (100.0%) |
Household Vehicle Usage in Alliance
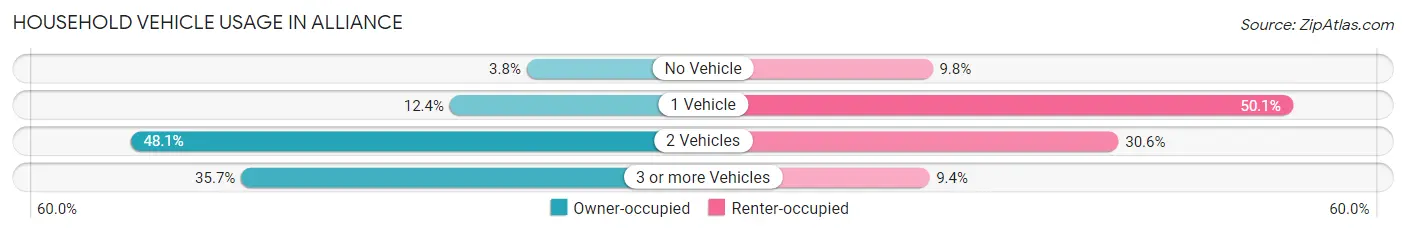
| Vehicles per Household | Owner-occupied | Renter-occupied |
| No Vehicle | 88 (3.7%) | 106 (9.8%) |
| 1 Vehicle | 290 (12.4%) | 542 (50.1%) |
| 2 Vehicles | 1,129 (48.1%) | 331 (30.6%) |
| 3 or more Vehicles | 838 (35.7%) | 102 (9.4%) |
| Total | 2,345 (100.0%) | 1,081 (100.0%) |
Real Estate & Mortgages in Alliance
Real Estate and Mortgage Overview in Alliance
| Characteristic | Without Mortgage | With Mortgage |
| Housing Units | 1,136 | 1,209 |
| Median Property Value | $123,200 | $174,800 |
| Median Household Income | $56,346 | $139 |
| Monthly Housing Costs | $583 | $0 |
| Real Estate Taxes | $2,115 | $83 |
Property Value by Mortgage Status in Alliance
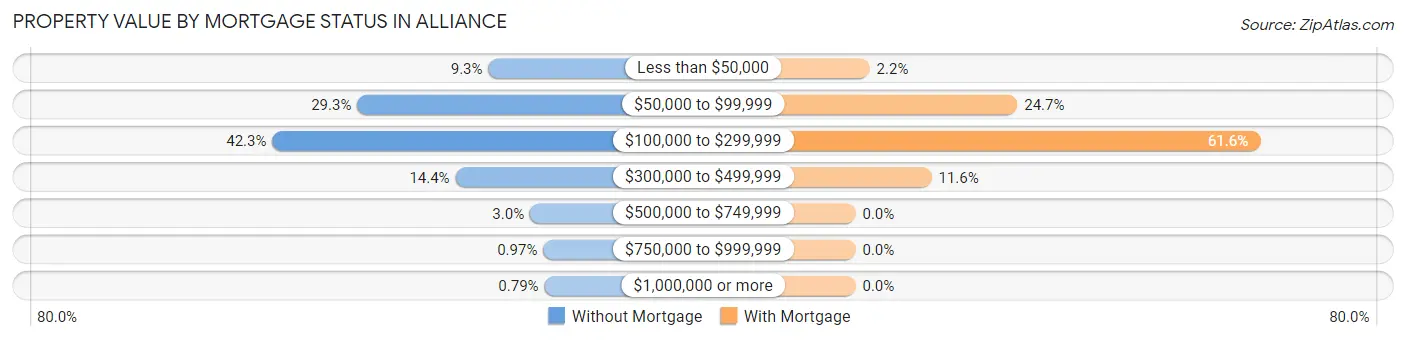
| Property Value | Without Mortgage | With Mortgage |
| Less than $50,000 | 106 (9.3%) | 26 (2.1%) |
| $50,000 to $99,999 | 333 (29.3%) | 298 (24.6%) |
| $100,000 to $299,999 | 480 (42.2%) | 745 (61.6%) |
| $300,000 to $499,999 | 163 (14.3%) | 140 (11.6%) |
| $500,000 to $749,999 | 34 (3.0%) | 0 (0.0%) |
| $750,000 to $999,999 | 11 (1.0%) | 0 (0.0%) |
| $1,000,000 or more | 9 (0.8%) | 0 (0.0%) |
| Total | 1,136 (100.0%) | 1,209 (100.0%) |
Household Income by Mortgage Status in Alliance
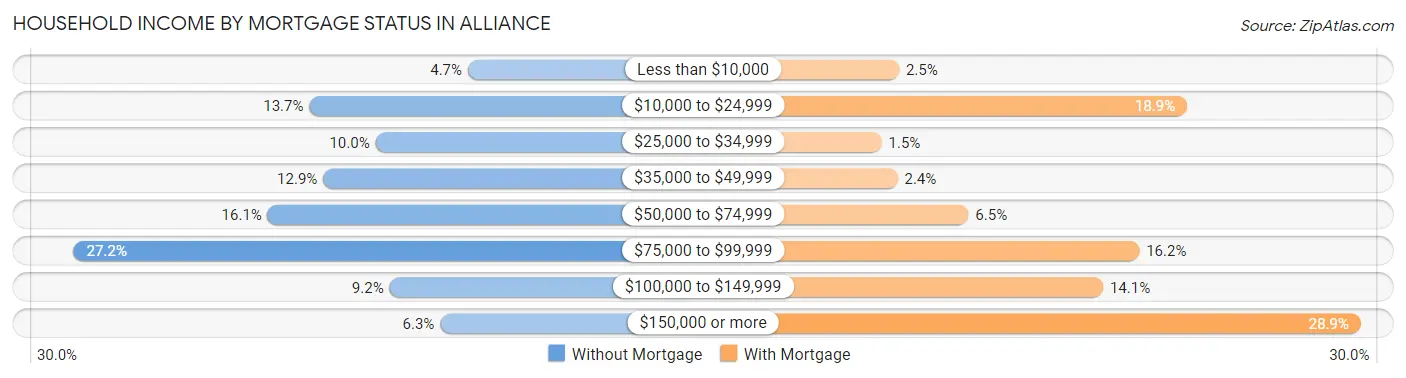
| Household Income | Without Mortgage | With Mortgage |
| Less than $10,000 | 53 (4.7%) | 30 (2.5%) |
| $10,000 to $24,999 | 156 (13.7%) | 229 (18.9%) |
| $25,000 to $34,999 | 113 (10.0%) | 18 (1.5%) |
| $35,000 to $49,999 | 147 (12.9%) | 29 (2.4%) |
| $50,000 to $74,999 | 183 (16.1%) | 78 (6.5%) |
| $75,000 to $99,999 | 309 (27.2%) | 196 (16.2%) |
| $100,000 to $149,999 | 104 (9.1%) | 171 (14.1%) |
| $150,000 or more | 71 (6.2%) | 349 (28.9%) |
| Total | 1,136 (100.0%) | 1,209 (100.0%) |
Property Value to Household Income Ratio in Alliance
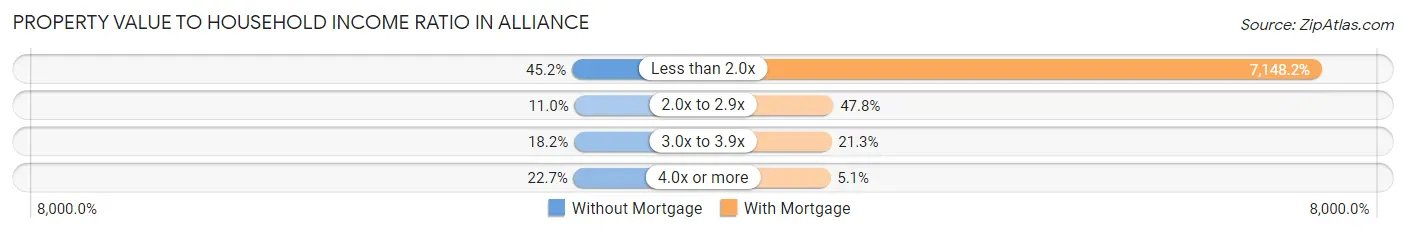
| Value-to-Income Ratio | Without Mortgage | With Mortgage |
| Less than 2.0x | 513 (45.2%) | 86,422 (7,148.2%) |
| 2.0x to 2.9x | 125 (11.0%) | 578 (47.8%) |
| 3.0x to 3.9x | 207 (18.2%) | 257 (21.3%) |
| 4.0x or more | 258 (22.7%) | 61 (5.1%) |
| Total | 1,136 (100.0%) | 1,209 (100.0%) |
Real Estate Taxes by Mortgage Status in Alliance
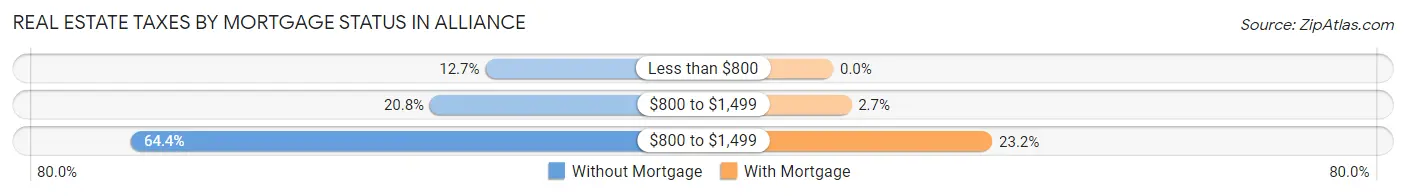
| Property Taxes | Without Mortgage | With Mortgage |
| Less than $800 | 144 (12.7%) | 0 (0.0%) |
| $800 to $1,499 | 236 (20.8%) | 32 (2.6%) |
| $800 to $1,499 | 732 (64.4%) | 281 (23.2%) |
| Total | 1,136 (100.0%) | 1,209 (100.0%) |
Health & Disability in Alliance
Health Insurance Coverage by Age in Alliance
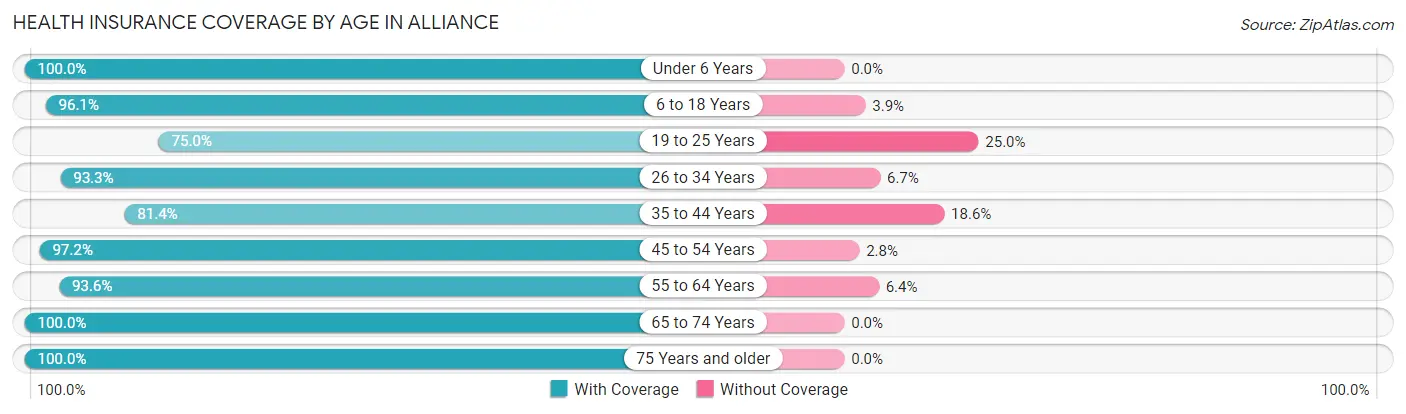
| Age Bracket | With Coverage | Without Coverage |
| Under 6 Years | 565 (100.0%) | 0 (0.0%) |
| 6 to 18 Years | 1,543 (96.1%) | 63 (3.9%) |
| 19 to 25 Years | 384 (75.0%) | 128 (25.0%) |
| 26 to 34 Years | 925 (93.3%) | 66 (6.7%) |
| 35 to 44 Years | 708 (81.4%) | 162 (18.6%) |
| 45 to 54 Years | 873 (97.2%) | 25 (2.8%) |
| 55 to 64 Years | 1,064 (93.6%) | 73 (6.4%) |
| 65 to 74 Years | 835 (100.0%) | 0 (0.0%) |
| 75 Years and older | 568 (100.0%) | 0 (0.0%) |
| Total | 7,465 (93.5%) | 517 (6.5%) |
Health Insurance Coverage by Citizenship Status in Alliance
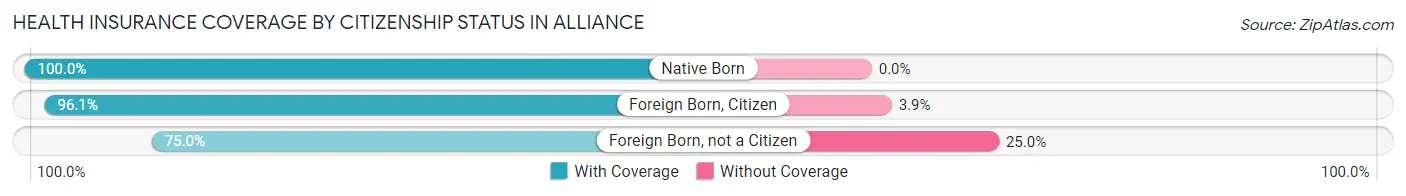
| Citizenship Status | With Coverage | Without Coverage |
| Native Born | 565 (100.0%) | 0 (0.0%) |
| Foreign Born, Citizen | 1,543 (96.1%) | 63 (3.9%) |
| Foreign Born, not a Citizen | 384 (75.0%) | 128 (25.0%) |
Health Insurance Coverage by Household Income in Alliance
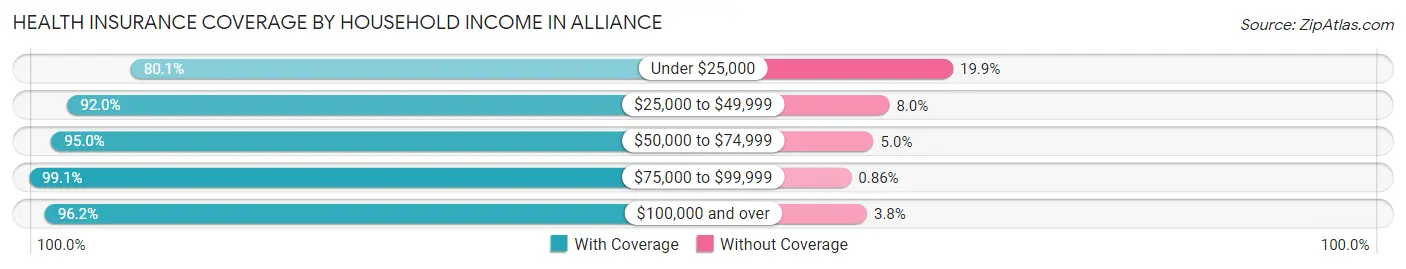
| Household Income | With Coverage | Without Coverage |
| Under $25,000 | 966 (80.1%) | 240 (19.9%) |
| $25,000 to $49,999 | 931 (92.0%) | 81 (8.0%) |
| $50,000 to $74,999 | 1,285 (95.0%) | 68 (5.0%) |
| $75,000 to $99,999 | 1,725 (99.1%) | 15 (0.9%) |
| $100,000 and over | 2,536 (96.2%) | 100 (3.8%) |
Public vs Private Health Insurance Coverage by Age in Alliance
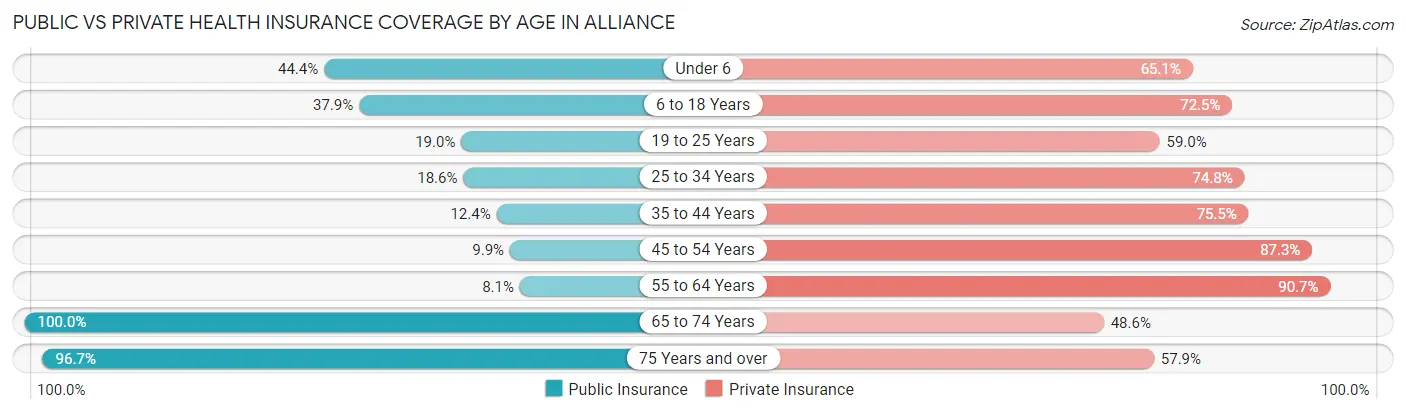
| Age Bracket | Public Insurance | Private Insurance |
| Under 6 | 251 (44.4%) | 368 (65.1%) |
| 6 to 18 Years | 609 (37.9%) | 1,164 (72.5%) |
| 19 to 25 Years | 97 (19.0%) | 302 (59.0%) |
| 25 to 34 Years | 184 (18.6%) | 741 (74.8%) |
| 35 to 44 Years | 108 (12.4%) | 657 (75.5%) |
| 45 to 54 Years | 89 (9.9%) | 784 (87.3%) |
| 55 to 64 Years | 92 (8.1%) | 1,031 (90.7%) |
| 65 to 74 Years | 835 (100.0%) | 406 (48.6%) |
| 75 Years and over | 549 (96.7%) | 329 (57.9%) |
| Total | 2,814 (35.2%) | 5,782 (72.4%) |
Disability Status by Sex by Age in Alliance
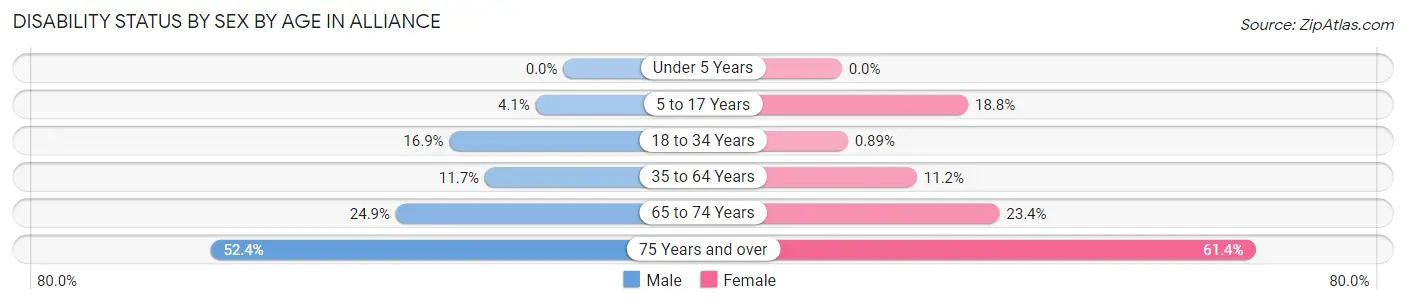
| Age Bracket | Male | Female |
| Under 5 Years | 0 (0.0%) | 0 (0.0%) |
| 5 to 17 Years | 42 (4.1%) | 102 (18.8%) |
| 18 to 34 Years | 146 (16.9%) | 7 (0.9%) |
| 35 to 64 Years | 166 (11.7%) | 165 (11.2%) |
| 65 to 74 Years | 95 (24.9%) | 106 (23.4%) |
| 75 Years and over | 109 (52.4%) | 221 (61.4%) |
Disability Class by Sex by Age in Alliance
Disability Class: Hearing Difficulty
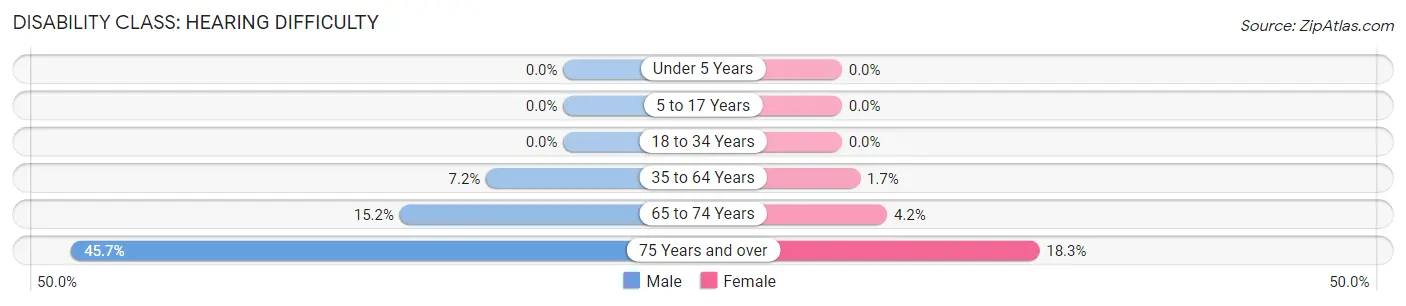
| Age Bracket | Male | Female |
| Under 5 Years | 0 (0.0%) | 0 (0.0%) |
| 5 to 17 Years | 0 (0.0%) | 0 (0.0%) |
| 18 to 34 Years | 0 (0.0%) | 0 (0.0%) |
| 35 to 64 Years | 102 (7.2%) | 25 (1.7%) |
| 65 to 74 Years | 58 (15.2%) | 19 (4.2%) |
| 75 Years and over | 95 (45.7%) | 66 (18.3%) |
Disability Class: Vision Difficulty
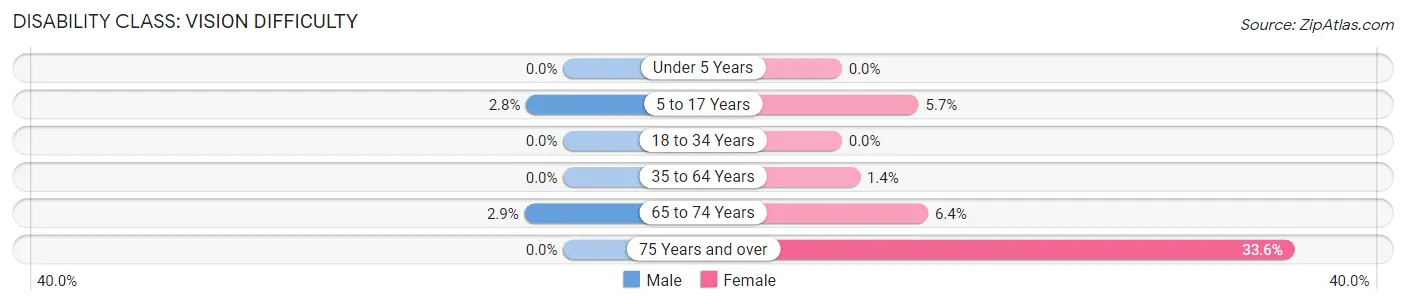
| Age Bracket | Male | Female |
| Under 5 Years | 0 (0.0%) | 0 (0.0%) |
| 5 to 17 Years | 28 (2.8%) | 31 (5.7%) |
| 18 to 34 Years | 0 (0.0%) | 0 (0.0%) |
| 35 to 64 Years | 0 (0.0%) | 20 (1.3%) |
| 65 to 74 Years | 11 (2.9%) | 29 (6.4%) |
| 75 Years and over | 0 (0.0%) | 121 (33.6%) |
Disability Class: Cognitive Difficulty
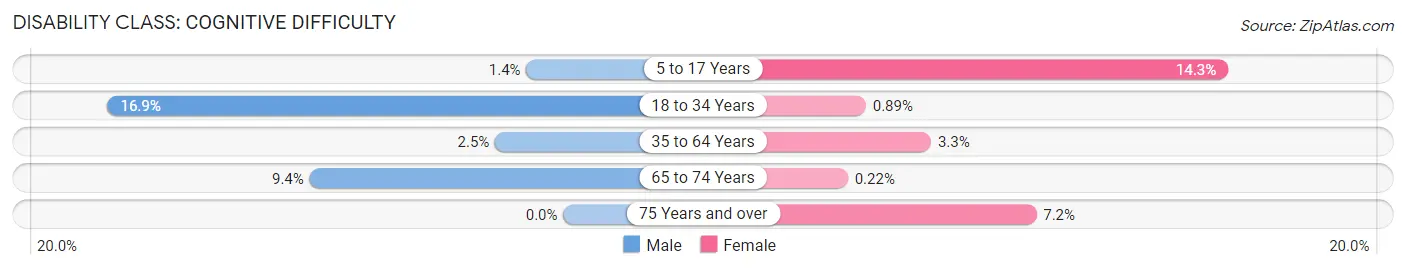
| Age Bracket | Male | Female |
| 5 to 17 Years | 14 (1.4%) | 78 (14.3%) |
| 18 to 34 Years | 146 (16.9%) | 7 (0.9%) |
| 35 to 64 Years | 36 (2.5%) | 49 (3.3%) |
| 65 to 74 Years | 36 (9.4%) | 1 (0.2%) |
| 75 Years and over | 0 (0.0%) | 26 (7.2%) |
Disability Class: Ambulatory Difficulty
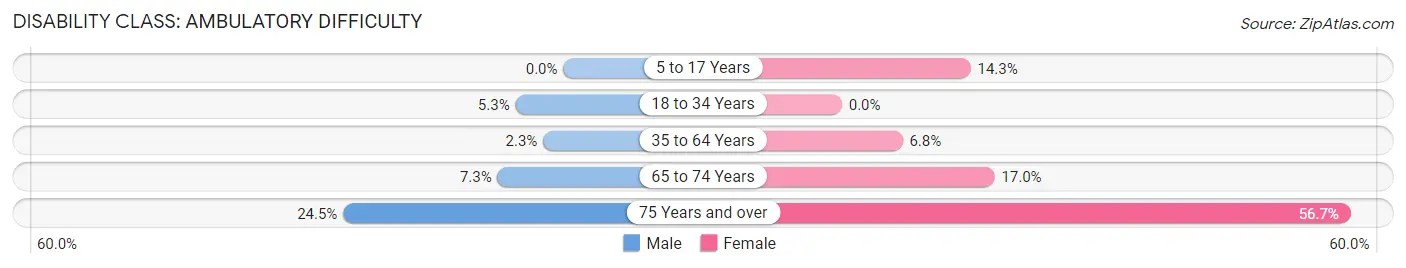
| Age Bracket | Male | Female |
| 5 to 17 Years | 0 (0.0%) | 78 (14.3%) |
| 18 to 34 Years | 46 (5.3%) | 0 (0.0%) |
| 35 to 64 Years | 32 (2.2%) | 100 (6.8%) |
| 65 to 74 Years | 28 (7.3%) | 77 (17.0%) |
| 75 Years and over | 51 (24.5%) | 204 (56.7%) |
Disability Class: Self-Care Difficulty
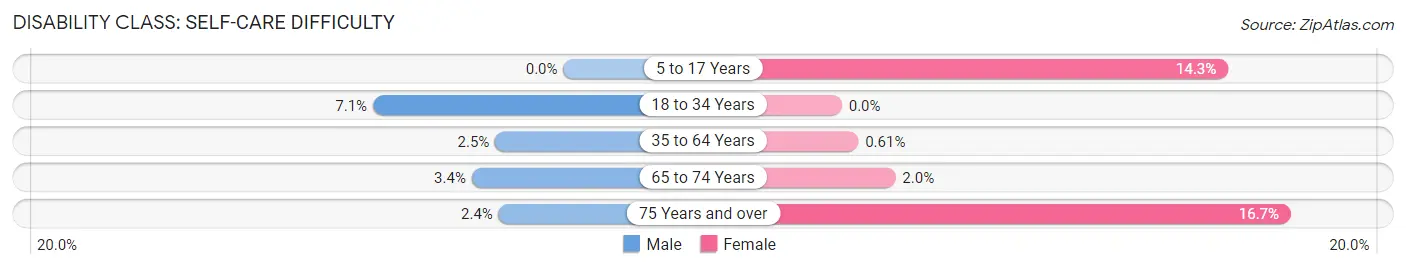
| Age Bracket | Male | Female |
| 5 to 17 Years | 0 (0.0%) | 78 (14.3%) |
| 18 to 34 Years | 61 (7.1%) | 0 (0.0%) |
| 35 to 64 Years | 36 (2.5%) | 9 (0.6%) |
| 65 to 74 Years | 13 (3.4%) | 9 (2.0%) |
| 75 Years and over | 5 (2.4%) | 60 (16.7%) |
Technology Access in Alliance
Computing Device Access in Alliance
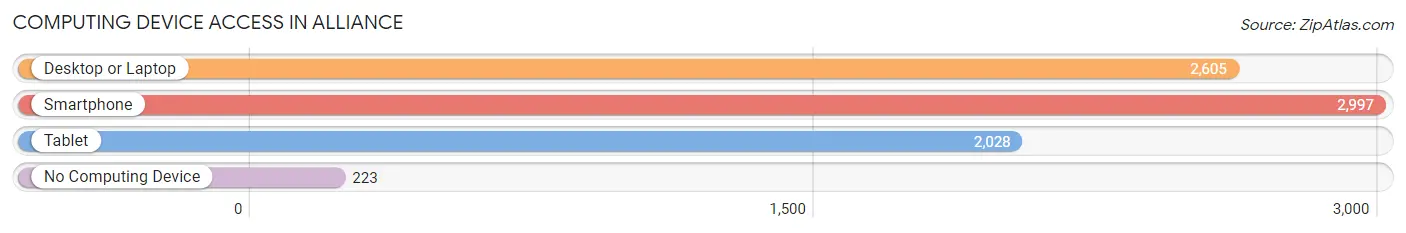
| Device Type | # Households | % Households |
| Desktop or Laptop | 2,605 | 76.0% |
| Smartphone | 2,997 | 87.5% |
| Tablet | 2,028 | 59.2% |
| No Computing Device | 223 | 6.5% |
| Total | 3,426 | 100.0% |
Internet Access in Alliance
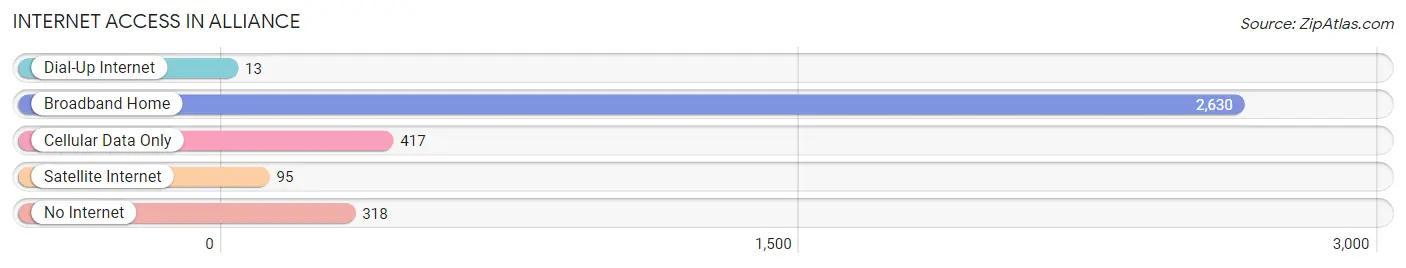
| Internet Type | # Households | % Households |
| Dial-Up Internet | 13 | 0.4% |
| Broadband Home | 2,630 | 76.8% |
| Cellular Data Only | 417 | 12.2% |
| Satellite Internet | 95 | 2.8% |
| No Internet | 318 | 9.3% |
| Total | 3,426 | 100.0% |
Alliance Summary
Alliance, Nebraska is a city located in the western part of the state, in Box Butte County. It is the county seat and the largest city in the county. The city is located on the edge of the Sandhills region of Nebraska, and is known for its agricultural and ranching heritage.
Geography
Alliance is located in the western part of Nebraska, in Box Butte County. It is situated at the intersection of U.S. Highway 385 and Nebraska Highway 2. The city is located on the edge of the Sandhills region of Nebraska, and is known for its agricultural and ranching heritage. The city is located at an elevation of 4,068 feet (1,240 m) above sea level. The city has a total area of 4.2 square miles (10.8 km2), all of which is land.
Climate
Alliance has a semi-arid climate, with hot summers and cold winters. The average annual temperature is 52.3°F (11.3°C). The average high temperature in July is 87.2°F (30.7°C), and the average low temperature in January is 11.2°F (-11.6°C). The average annual precipitation is 17.2 inches (437 mm).
Demographics
As of the 2010 census, Alliance had a population of 8,491. The racial makeup of the city was 91.2% White, 0.7% African American, 0.7% Native American, 0.7% Asian, 0.1% Pacific Islander, 4.7% from other races, and 1.9% from two or more races. Hispanic or Latino of any race were 10.2% of the population.
Economy
Alliance is a major agricultural and ranching center in western Nebraska. The city is home to several large grain elevators, as well as a number of feedlots and livestock operations. The city is also home to a number of manufacturing and service businesses, including a large meat packing plant, a plastics manufacturer, and a number of retail stores.
The city is also home to a number of educational institutions, including the University of Nebraska at Alliance, a two-year college, and a number of public and private schools.
History
Alliance was founded in 1887, when the Union Pacific Railroad built a line through the area. The city was named after the Alliance Land and Cattle Company, which had purchased a large tract of land in the area. The city quickly grew, and by 1890, it had a population of 1,000.
In the early 20th century, Alliance became a major agricultural center, with a number of grain elevators and livestock operations. The city also became a major shipping point for cattle, sheep, and hogs.
In the 1950s, the city began to diversify its economy, with the establishment of a number of manufacturing and service businesses. The city also became a major educational center, with the establishment of the University of Nebraska at Alliance in 1965.
Today, Alliance is a thriving city, with a diverse economy and a strong sense of community. The city is home to a number of businesses, educational institutions, and cultural attractions, and is a popular destination for visitors from across the region.
Common Questions
What is the Total Population of Alliance?
Total Population of Alliance is 8,118.
What is the Total Male Population of Alliance?
Total Male Population of Alliance is 4,098.
What is the Total Female Population of Alliance?
Total Female Population of Alliance is 4,020.
What is the Ratio of Males per 100 Females in Alliance?
There are 101.94 Males per 100 Females in Alliance.
What is the Ratio of Females per 100 Males in Alliance?
There are 98.10 Females per 100 Males in Alliance.
What is the Median Population Age in Alliance?
Median Population Age in Alliance is 38.9 Years.
What is the Average Family Size in Alliance
Average Family Size in Alliance is 2.9 People.
What is the Average Household Size in Alliance
Average Household Size in Alliance is 2.3 People.
What is Per Capita Income in Alliance?
Per Capita income in Alliance is $30,015.
What is the Median Family Income in Alliance?
Median Family Income in Alliance is $72,935.
What is the Median Household income in Alliance?
Median Household Income in Alliance is $58,214.
What is Income or Wage Gap in Alliance?
Income or Wage Gap in Alliance is 25.2%.
Women in Alliance earn 74.8 cents for every dollar earned by a man.
What is Inequality or Gini Index in Alliance?
Inequality or Gini Index in Alliance is 0.40.
How Large is the Labor Force in Alliance?
There are 4,014 People in the Labor Forcein in Alliance.
What is the Percentage of People in the Labor Force in Alliance?
64.2% of People are in the Labor Force in Alliance.
What is the Unemployment Rate in Alliance?
Unemployment Rate in Alliance is 5.4%.