Cities with the Highest Percentage of Households With One or more Vehicles in Nebraska
RELATED REPORTS & OPTIONS
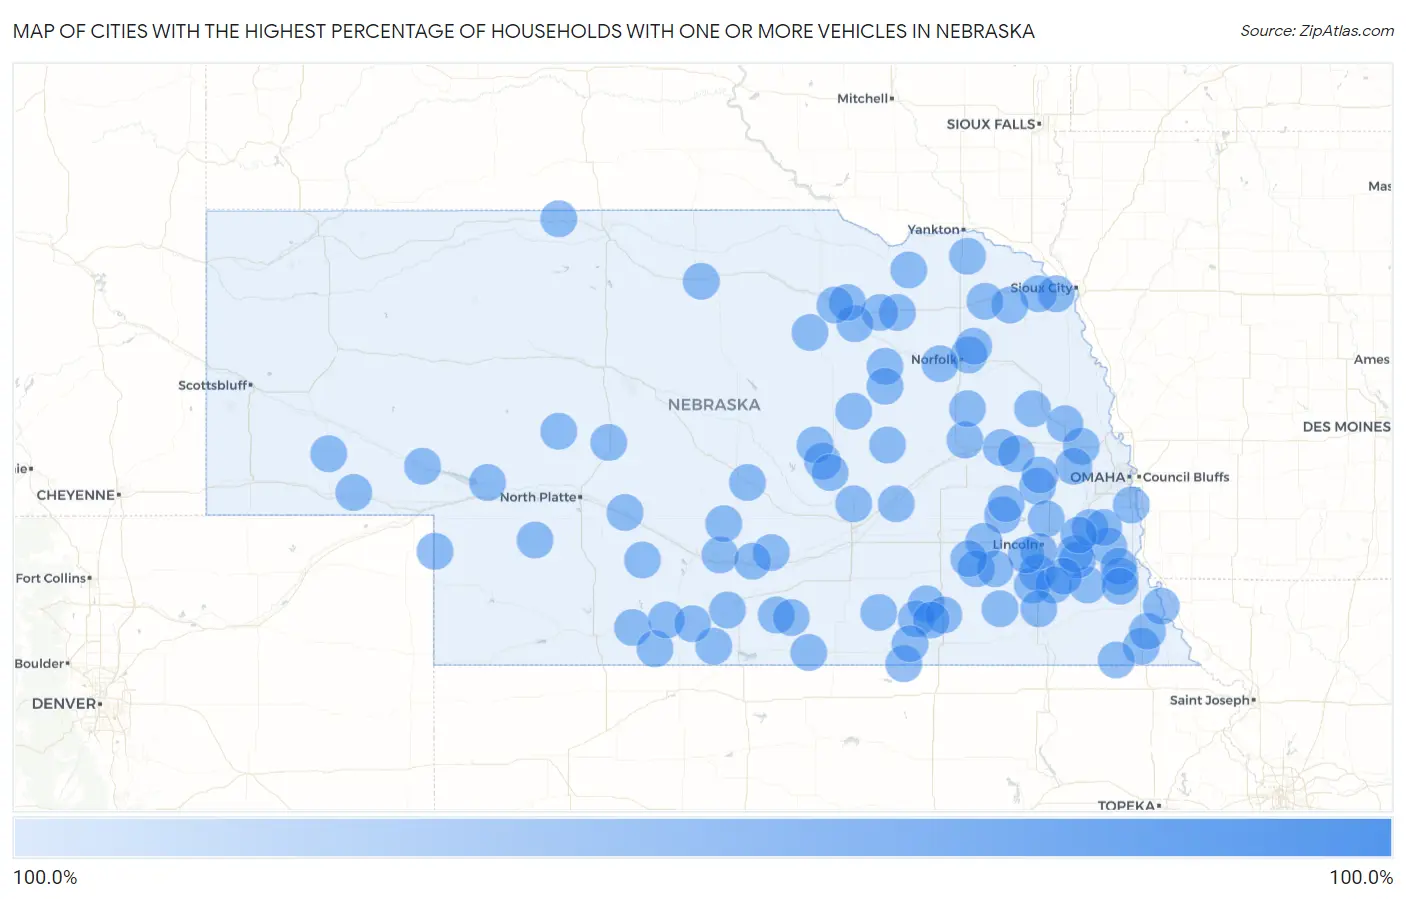
Households with 1 or more Cars
Nebraska
Compare Cities
Map of Cities with the Highest Percentage of Households With One or more Vehicles in Nebraska
0.0%
100.0%
Cities with the Highest Percentage of Households With One or more Vehicles in Nebraska
| City | Housholds With 1+ Cars | vs State | vs National | |
| 1. | Arlington | 100.0% | 95.0%(+5.00)#1 | 91.7%(+8.30)#89 |
| 2. | Bartley | 100.0% | 95.0%(+5.00)#2 | 91.7%(+8.30)#291 |
| 3. | Stapleton | 100.0% | 95.0%(+5.00)#3 | 91.7%(+8.30)#295 |
| 4. | St Libory | 100.0% | 95.0%(+5.00)#4 | 91.7%(+8.30)#355 |
| 5. | Jackson | 100.0% | 95.0%(+5.00)#5 | 91.7%(+8.30)#389 |
| 6. | Weston | 100.0% | 95.0%(+5.00)#6 | 91.7%(+8.30)#395 |
| 7. | Bee | 100.0% | 95.0%(+5.00)#7 | 91.7%(+8.30)#406 |
| 8. | Goehner | 100.0% | 95.0%(+5.00)#8 | 91.7%(+8.30)#408 |
| 9. | Belgrade | 100.0% | 95.0%(+5.00)#9 | 91.7%(+8.30)#470 |
| 10. | Avoca | 100.0% | 95.0%(+5.00)#10 | 91.7%(+8.30)#476 |
| 11. | Brunswick | 100.0% | 95.0%(+5.00)#11 | 91.7%(+8.30)#501 |
| 12. | Hardy | 100.0% | 95.0%(+5.00)#12 | 91.7%(+8.30)#514 |
| 13. | Venango | 100.0% | 95.0%(+5.00)#13 | 91.7%(+8.30)#524 |
| 14. | Davey | 100.0% | 95.0%(+5.00)#14 | 91.7%(+8.30)#530 |
| 15. | Swanton | 100.0% | 95.0%(+5.00)#15 | 91.7%(+8.30)#536 |
| 16. | Sprague | 100.0% | 95.0%(+5.00)#16 | 91.7%(+8.30)#616 |
| 17. | Wilsonville | 100.0% | 95.0%(+5.00)#17 | 91.7%(+8.30)#652 |
| 18. | Waterbury | 100.0% | 95.0%(+5.00)#18 | 91.7%(+8.30)#654 |
| 19. | Lorton | 100.0% | 95.0%(+5.00)#19 | 91.7%(+8.30)#658 |
| 20. | Royal | 100.0% | 95.0%(+5.00)#20 | 91.7%(+8.30)#666 |
| 21. | Deweese | 100.0% | 95.0%(+5.00)#21 | 91.7%(+8.30)#717 |
| 22. | Burr | 100.0% | 95.0%(+5.00)#22 | 91.7%(+8.30)#718 |
| 23. | Cotesfield | 100.0% | 95.0%(+5.00)#23 | 91.7%(+8.30)#726 |
| 24. | Keystone | 100.0% | 95.0%(+5.00)#24 | 91.7%(+8.30)#738 |
| 25. | Schuyler | 100.0% | 95.0%(+5.00)#25 | 91.7%(+8.30)#774 |
| 26. | Woodland Park | 100.0% | 95.0%(+5.00)#26 | 91.7%(+8.30)#1,174 |
| 27. | Battle Creek | 100.0% | 95.0%(+5.00)#27 | 91.7%(+8.30)#1,299 |
| 28. | Friend | 100.0% | 95.0%(+5.00)#28 | 91.7%(+8.30)#1,474 |
| 29. | Palmyra | 100.0% | 95.0%(+5.00)#29 | 91.7%(+8.30)#1,854 |
| 30. | Overton | 100.0% | 95.0%(+5.00)#30 | 91.7%(+8.30)#1,895 |
| 31. | Glenwood | 100.0% | 95.0%(+5.00)#31 | 91.7%(+8.30)#2,017 |
| 32. | Elgin | 100.0% | 95.0%(+5.00)#32 | 91.7%(+8.30)#2,070 |
| 33. | Dorchester | 100.0% | 95.0%(+5.00)#33 | 91.7%(+8.30)#2,217 |
| 34. | Firth | 100.0% | 95.0%(+5.00)#34 | 91.7%(+8.30)#2,412 |
| 35. | Brady | 100.0% | 95.0%(+5.00)#35 | 91.7%(+8.30)#2,513 |
| 36. | Petersburg | 100.0% | 95.0%(+5.00)#36 | 91.7%(+8.30)#2,541 |
| 37. | Hildreth | 100.0% | 95.0%(+5.00)#37 | 91.7%(+8.30)#2,561 |
| 38. | Chambers | 100.0% | 95.0%(+5.00)#38 | 91.7%(+8.30)#2,593 |
| 39. | Sumner | 100.0% | 95.0%(+5.00)#39 | 91.7%(+8.30)#2,641 |
| 40. | Ewing | 100.0% | 95.0%(+5.00)#40 | 91.7%(+8.30)#2,720 |
| 41. | Spalding | 100.0% | 95.0%(+5.00)#41 | 91.7%(+8.30)#2,744 |
| 42. | Scotia | 100.0% | 95.0%(+5.00)#42 | 91.7%(+8.30)#2,754 |
| 43. | Shickley | 100.0% | 95.0%(+5.00)#43 | 91.7%(+8.30)#2,771 |
| 44. | Dalton | 100.0% | 95.0%(+5.00)#44 | 91.7%(+8.30)#2,853 |
| 45. | Davenport | 100.0% | 95.0%(+5.00)#45 | 91.7%(+8.30)#2,895 |
| 46. | Hoskins | 100.0% | 95.0%(+5.00)#46 | 91.7%(+8.30)#2,937 |
| 47. | Snyder | 100.0% | 95.0%(+5.00)#47 | 91.7%(+8.30)#2,963 |
| 48. | Woodland Hills | 100.0% | 95.0%(+5.00)#48 | 91.7%(+8.30)#3,129 |
| 49. | Holbrook | 100.0% | 95.0%(+5.00)#49 | 91.7%(+8.30)#3,165 |
| 50. | Long Pine | 100.0% | 95.0%(+5.00)#50 | 91.7%(+8.30)#3,170 |
| 51. | Wallace | 100.0% | 95.0%(+5.00)#51 | 91.7%(+8.30)#3,203 |
| 52. | Bruning | 100.0% | 95.0%(+5.00)#52 | 91.7%(+8.30)#3,253 |
| 53. | Hallam | 100.0% | 95.0%(+5.00)#53 | 91.7%(+8.30)#3,275 |
| 54. | Lakeview | 100.0% | 95.0%(+5.00)#54 | 91.7%(+8.30)#3,348 |
| 55. | Dwight | 100.0% | 95.0%(+5.00)#55 | 91.7%(+8.30)#3,419 |
| 56. | Panama | 100.0% | 95.0%(+5.00)#56 | 91.7%(+8.30)#3,423 |
| 57. | Murdock | 100.0% | 95.0%(+5.00)#57 | 91.7%(+8.30)#3,519 |
| 58. | Fordyce | 100.0% | 95.0%(+5.00)#58 | 91.7%(+8.30)#3,537 |
| 59. | Yankee Hill | 100.0% | 95.0%(+5.00)#59 | 91.7%(+8.30)#3,669 |
| 60. | Pickrell | 100.0% | 95.0%(+5.00)#60 | 91.7%(+8.30)#3,670 |
| 61. | Elba | 100.0% | 95.0%(+5.00)#61 | 91.7%(+8.30)#3,693 |
| 62. | Lewellen | 100.0% | 95.0%(+5.00)#63 | 91.7%(+8.30)#3,755 |
| 63. | Manley | 100.0% | 95.0%(+5.00)#64 | 91.7%(+8.30)#3,756 |
| 64. | Dunbar | 100.0% | 95.0%(+5.00)#65 | 91.7%(+8.30)#3,835 |
| 65. | Center | 100.0% | 95.0%(+5.00)#66 | 91.7%(+8.30)#3,851 |
| 66. | Talmage | 100.0% | 95.0%(+5.00)#67 | 91.7%(+8.30)#3,867 |
| 67. | Stamford | 100.0% | 95.0%(+5.00)#68 | 91.7%(+8.30)#3,887 |
| 68. | Overland | 100.0% | 95.0%(+5.00)#69 | 91.7%(+8.30)#3,901 |
| 69. | Dawson | 100.0% | 95.0%(+5.00)#70 | 91.7%(+8.30)#4,022 |
| 70. | Carleton | 100.0% | 95.0%(+5.00)#71 | 91.7%(+8.30)#4,061 |
| 71. | Farnam | 100.0% | 95.0%(+5.00)#72 | 91.7%(+8.30)#4,115 |
| 72. | Ruskin | 100.0% | 95.0%(+5.00)#73 | 91.7%(+8.30)#4,123 |
| 73. | Concord | 100.0% | 95.0%(+5.00)#74 | 91.7%(+8.30)#4,137 |
| 74. | Creston | 100.0% | 95.0%(+5.00)#75 | 91.7%(+8.30)#4,177 |
| 75. | Cheney | 100.0% | 95.0%(+5.00)#76 | 91.7%(+8.30)#4,213 |
| 76. | Edison | 100.0% | 95.0%(+5.00)#77 | 91.7%(+8.30)#4,289 |
| 77. | Denton | 100.0% | 95.0%(+5.00)#78 | 91.7%(+8.30)#4,356 |
| 78. | Mason City | 100.0% | 95.0%(+5.00)#79 | 91.7%(+8.30)#4,357 |
| 79. | La Platte | 100.0% | 95.0%(+5.00)#80 | 91.7%(+8.30)#4,369 |
| 80. | Leshara | 100.0% | 95.0%(+5.00)#81 | 91.7%(+8.30)#4,409 |
| 81. | Sunol | 100.0% | 95.0%(+5.00)#82 | 91.7%(+8.30)#4,428 |
| 82. | Du Bois | 100.0% | 95.0%(+5.00)#83 | 91.7%(+8.30)#4,496 |
| 83. | Stella | 100.0% | 95.0%(+5.00)#84 | 91.7%(+8.30)#4,530 |
| 84. | Brownville | 100.0% | 95.0%(+5.00)#85 | 91.7%(+8.30)#4,546 |
| 85. | Page | 100.0% | 95.0%(+5.00)#86 | 91.7%(+8.30)#4,652 |
| 86. | Tryon | 100.0% | 95.0%(+5.00)#87 | 91.7%(+8.30)#4,666 |
| 87. | Odessa | 100.0% | 95.0%(+5.00)#88 | 91.7%(+8.30)#4,667 |
| 88. | Inman | 100.0% | 95.0%(+5.00)#89 | 91.7%(+8.30)#4,668 |
| 89. | Princeton | 100.0% | 95.0%(+5.00)#90 | 91.7%(+8.30)#4,689 |
| 90. | Upland | 100.0% | 95.0%(+5.00)#91 | 91.7%(+8.30)#4,710 |
| 91. | Atlanta | 100.0% | 95.0%(+5.00)#92 | 91.7%(+8.30)#4,739 |
| 92. | Malmo | 100.0% | 95.0%(+5.00)#93 | 91.7%(+8.30)#4,740 |
| 93. | Martell | 100.0% | 95.0%(+5.00)#94 | 91.7%(+8.30)#4,829 |
| 94. | Belden | 100.0% | 95.0%(+5.00)#95 | 91.7%(+8.30)#4,849 |
| 95. | Linwood | 100.0% | 95.0%(+5.00)#96 | 91.7%(+8.30)#4,869 |
| 96. | Kilgore | 100.0% | 95.0%(+5.00)#97 | 91.7%(+8.30)#4,878 |
| 97. | Cordova | 100.0% | 95.0%(+5.00)#98 | 91.7%(+8.30)#4,970 |
| 98. | Winslow | 100.0% | 95.0%(+5.00)#99 | 91.7%(+8.30)#4,986 |
| 99. | Alvo | 100.0% | 95.0%(+5.00)#100 | 91.7%(+8.30)#5,048 |
| 100. | Riverton | 100.0% | 95.0%(+5.00)#101 | 91.7%(+8.30)#5,105 |
Common Questions
What are the Top 10 Cities with the Highest Percentage of Households With One or more Vehicles in Nebraska?
Top 10 Cities with the Highest Percentage of Households With One or more Vehicles in Nebraska are:
What city has the Highest Percentage of Households With One or more Vehicles in Nebraska?
Arlington has the Highest Percentage of Households With One or more Vehicles in Nebraska with 100.0%.
What is the Percentage of Households With One or more Vehicles in the State of Nebraska?
Percentage of Households With One or more Vehicles in Nebraska is 95.0%.
What is the Percentage of Households With One or more Vehicles in the United States?
Percentage of Households With One or more Vehicles in the United States is 91.7%.