Scottsbluff, NE
Scottsbluff Map
Scottsbluff Overview
14,454
TOTAL POPULATION
6,818
MALE POPULATION
7,636
FEMALE POPULATION
89.29
MALES / 100 FEMALES
112.00
FEMALES / 100 MALES
35.6
MEDIAN AGE
3.1
AVG FAMILY SIZE
2.3
AVG HOUSEHOLD SIZE
$31,472
PER CAPITA INCOME
$73,000
AVG FAMILY INCOME
$55,744
AVG HOUSEHOLD INCOME
23.6%
WAGE / INCOME GAP [ % ]
76.4¢/ $1
WAGE / INCOME GAP [ $ ]
$10,804
FAMILY INCOME DEFICIT
0.43
INEQUALITY / GINI INDEX
7,213
LABOR FORCE [ PEOPLE ]
65.0%
PERCENT IN LABOR FORCE
2.3%
UNEMPLOYMENT RATE
Scottsbluff Zip Codes
Scottsbluff Area Codes
Race in Scottsbluff
The most populous races in Scottsbluff are White / Caucasian (11,073 | 76.6%), Hispanic or Latino (4,316 | 29.9%), and Two or more Races (1,647 | 11.4%).
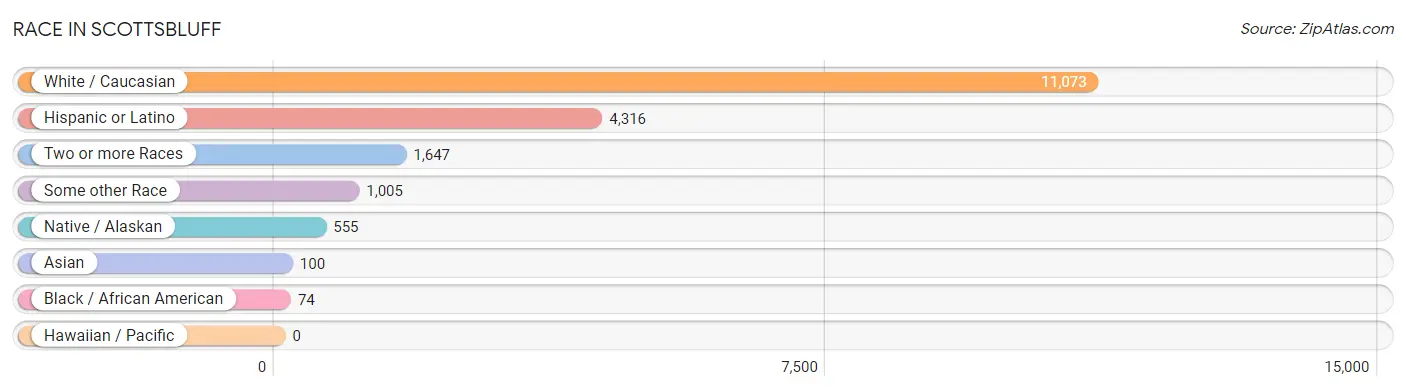
| Race | # Population | % Population |
| Asian | 100 | 0.7% |
| Black / African American | 74 | 0.5% |
| Hawaiian / Pacific | 0 | 0.0% |
| Hispanic or Latino | 4,316 | 29.9% |
| Native / Alaskan | 555 | 3.8% |
| White / Caucasian | 11,073 | 76.6% |
| Two or more Races | 1,647 | 11.4% |
| Some other Race | 1,005 | 7.0% |
| Total | 14,454 | 100.0% |
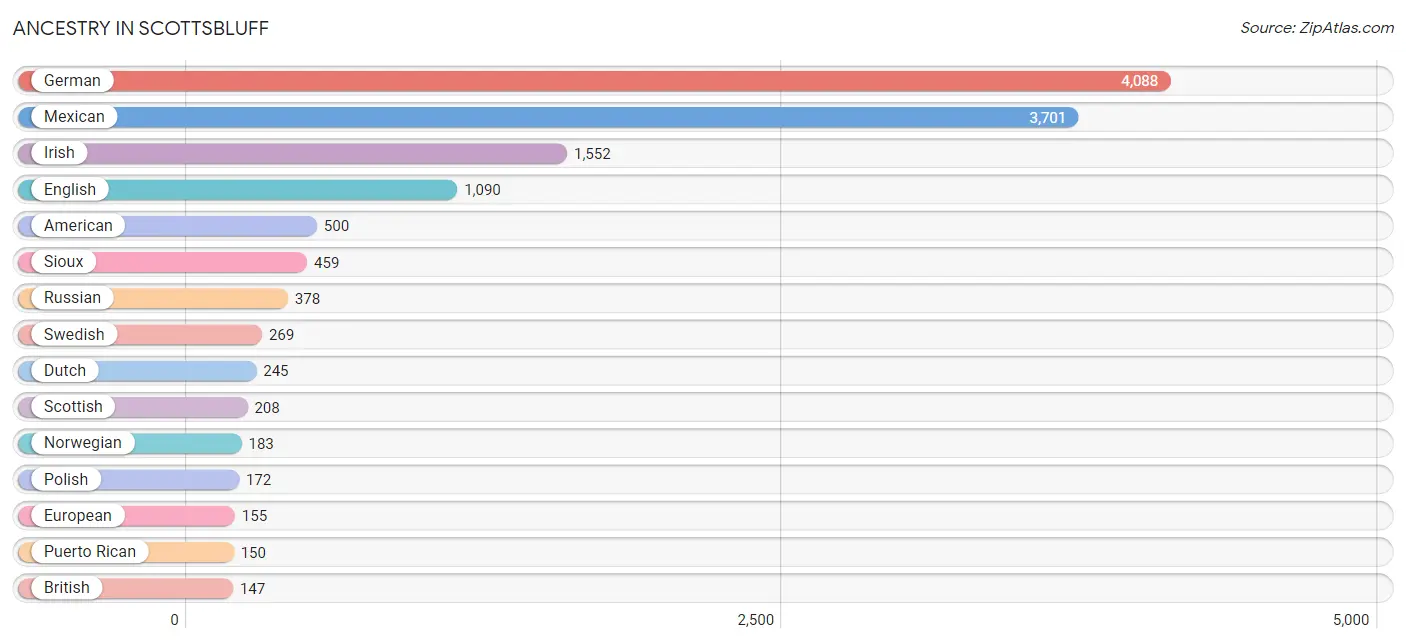
Ancestry in Scottsbluff
The most populous ancestries reported in Scottsbluff are German (4,088 | 28.3%), Mexican (3,701 | 25.6%), Irish (1,552 | 10.7%), English (1,090 | 7.5%), and American (500 | 3.5%), together accounting for 75.6% of all Scottsbluff residents.
| Ancestry | # Population | % Population |
| American | 500 | 3.5% |
| Australian | 6 | 0.0% |
| Austrian | 14 | 0.1% |
| Belgian | 13 | 0.1% |
| Bhutanese | 103 | 0.7% |
| British | 147 | 1.0% |
| Cajun | 24 | 0.2% |
| Canadian | 19 | 0.1% |
| Central American | 58 | 0.4% |
| Central American Indian | 25 | 0.2% |
| Cherokee | 100 | 0.7% |
| Choctaw | 57 | 0.4% |
| Colombian | 42 | 0.3% |
| Croatian | 92 | 0.6% |
| Crow | 63 | 0.4% |
| Cuban | 12 | 0.1% |
| Czech | 129 | 0.9% |
| Czechoslovakian | 16 | 0.1% |
| Danish | 57 | 0.4% |
| Dutch | 245 | 1.7% |
| English | 1,090 | 7.5% |
| European | 155 | 1.1% |
| Filipino | 11 | 0.1% |
| French | 144 | 1.0% |
| French Canadian | 36 | 0.3% |
| German | 4,088 | 28.3% |
| German Russian | 52 | 0.4% |
| Greek | 6 | 0.0% |
| Guatemalan | 25 | 0.2% |
| Hungarian | 48 | 0.3% |
| Indian (Asian) | 43 | 0.3% |
| Indonesian | 6 | 0.0% |
| Irish | 1,552 | 10.7% |
| Italian | 147 | 1.0% |
| Korean | 22 | 0.2% |
| Malaysian | 63 | 0.4% |
| Mexican | 3,701 | 25.6% |
| Mexican American Indian | 15 | 0.1% |
| Native Hawaiian | 35 | 0.2% |
| Navajo | 38 | 0.3% |
| Nigerian | 4 | 0.0% |
| Northern European | 47 | 0.3% |
| Norwegian | 183 | 1.3% |
| Panamanian | 33 | 0.2% |
| Peruvian | 78 | 0.5% |
| Polish | 172 | 1.2% |
| Puerto Rican | 150 | 1.0% |
| Russian | 378 | 2.6% |
| Scandinavian | 40 | 0.3% |
| Scotch-Irish | 143 | 1.0% |
| Scottish | 208 | 1.4% |
| Sioux | 459 | 3.2% |
| South American | 120 | 0.8% |
| Spaniard | 112 | 0.8% |
| Spanish | 17 | 0.1% |
| Subsaharan African | 9 | 0.1% |
| Sudanese | 5 | 0.0% |
| Swedish | 269 | 1.9% |
| Swiss | 56 | 0.4% |
| Thai | 7 | 0.1% |
| Welsh | 43 | 0.3% | View All 61 Rows |
Immigrants in Scottsbluff
The most numerous immigrant groups reported in Scottsbluff came from Latin America (547 | 3.8%), Central America (535 | 3.7%), Mexico (468 | 3.2%), Asia (64 | 0.4%), and Eastern Asia (52 | 0.4%), together accounting for 11.5% of all Scottsbluff residents.
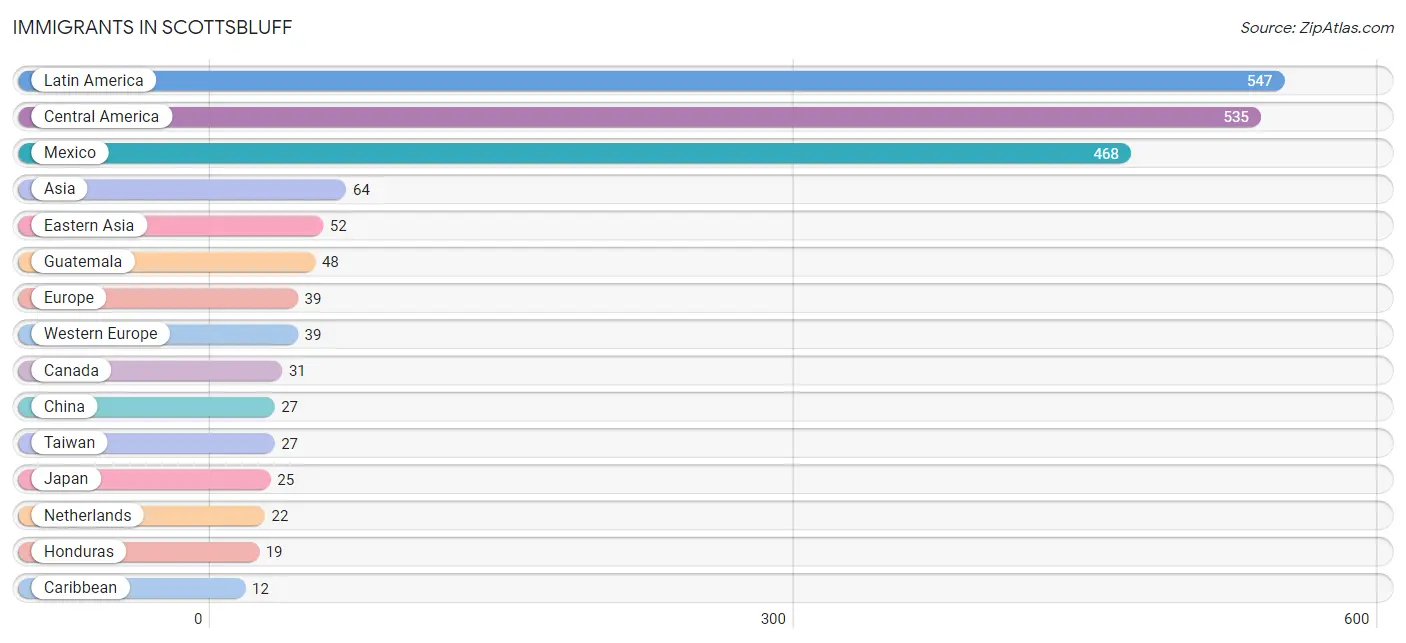
| Immigration Origin | # Population | % Population |
| Asia | 64 | 0.4% |
| Canada | 31 | 0.2% |
| Caribbean | 12 | 0.1% |
| Central America | 535 | 3.7% |
| China | 27 | 0.2% |
| Cuba | 12 | 0.1% |
| Eastern Asia | 52 | 0.4% |
| Europe | 39 | 0.3% |
| France | 5 | 0.0% |
| Germany | 12 | 0.1% |
| Guatemala | 48 | 0.3% |
| Honduras | 19 | 0.1% |
| Japan | 25 | 0.2% |
| Latin America | 547 | 3.8% |
| Mexico | 468 | 3.2% |
| Netherlands | 22 | 0.2% |
| Philippines | 6 | 0.0% |
| South Eastern Asia | 12 | 0.1% |
| Taiwan | 27 | 0.2% |
| Western Europe | 39 | 0.3% | View All 20 Rows |
Sex and Age in Scottsbluff
Sex and Age in Scottsbluff
The most populous age groups in Scottsbluff are 5 to 9 Years (730 | 10.7%) for men and 5 to 9 Years (589 | 7.7%) for women.
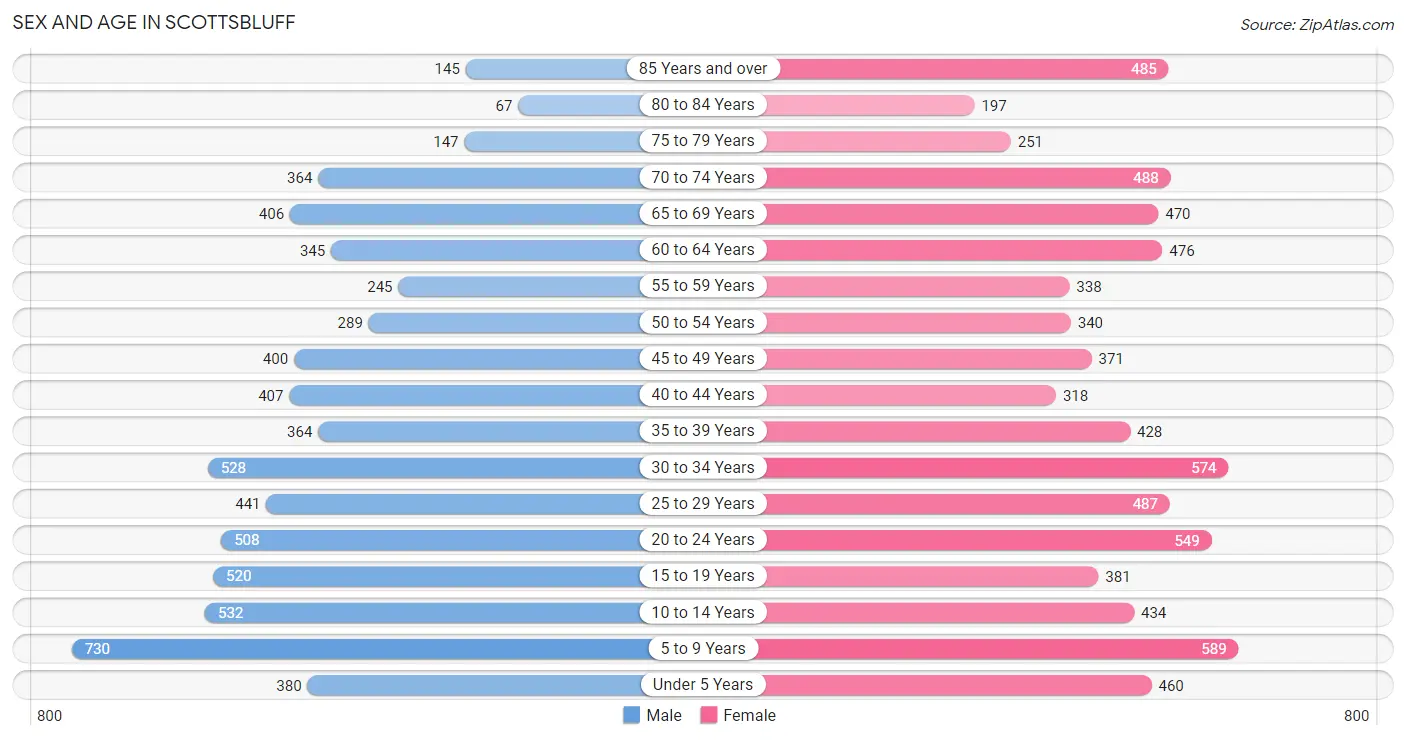
| Age Bracket | Male | Female |
| Under 5 Years | 380 (5.6%) | 460 (6.0%) |
| 5 to 9 Years | 730 (10.7%) | 589 (7.7%) |
| 10 to 14 Years | 532 (7.8%) | 434 (5.7%) |
| 15 to 19 Years | 520 (7.6%) | 381 (5.0%) |
| 20 to 24 Years | 508 (7.4%) | 549 (7.2%) |
| 25 to 29 Years | 441 (6.5%) | 487 (6.4%) |
| 30 to 34 Years | 528 (7.7%) | 574 (7.5%) |
| 35 to 39 Years | 364 (5.3%) | 428 (5.6%) |
| 40 to 44 Years | 407 (6.0%) | 318 (4.2%) |
| 45 to 49 Years | 400 (5.9%) | 371 (4.9%) |
| 50 to 54 Years | 289 (4.2%) | 340 (4.4%) |
| 55 to 59 Years | 245 (3.6%) | 338 (4.4%) |
| 60 to 64 Years | 345 (5.1%) | 476 (6.2%) |
| 65 to 69 Years | 406 (5.9%) | 470 (6.2%) |
| 70 to 74 Years | 364 (5.3%) | 488 (6.4%) |
| 75 to 79 Years | 147 (2.2%) | 251 (3.3%) |
| 80 to 84 Years | 67 (1.0%) | 197 (2.6%) |
| 85 Years and over | 145 (2.1%) | 485 (6.4%) |
| Total | 6,818 (100.0%) | 7,636 (100.0%) |
Families and Households in Scottsbluff
Median Family Size in Scottsbluff
The median family size in Scottsbluff is 3.09 persons per family, with single female/mother families (705 | 21.0%) accounting for the largest median family size of 3.14 persons per family. On the other hand, single male/father families (313 | 9.3%) represent the smallest median family size with 2.90 persons per family.
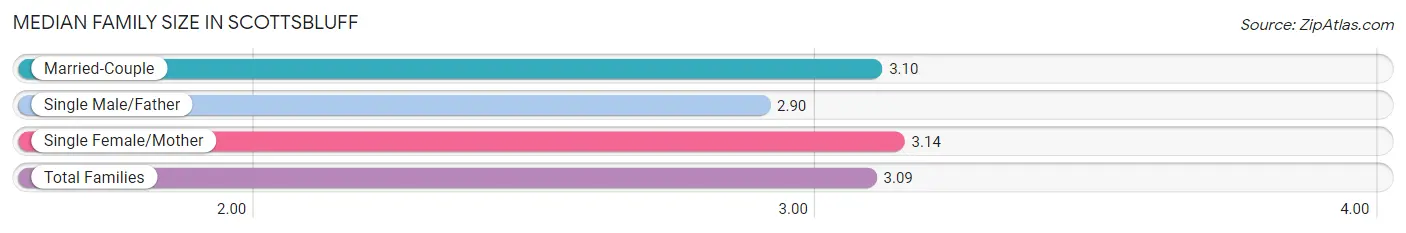
| Family Type | # Families | Family Size |
| Married-Couple | 2,346 (69.7%) | 3.10 |
| Single Male/Father | 313 (9.3%) | 2.90 |
| Single Female/Mother | 705 (21.0%) | 3.14 |
| Total Families | 3,364 (100.0%) | 3.09 |
Median Household Size in Scottsbluff
The median household size in Scottsbluff is 2.29 persons per household, with single female/mother households (705 | 11.5%) accounting for the largest median household size of 3.47 persons per household. non-family households (2,795 | 45.4%) represent the smallest median household size with 1.17 persons per household.
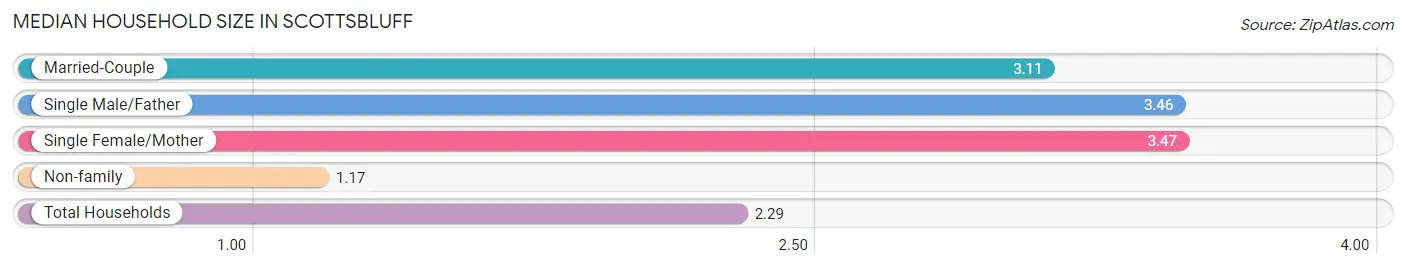
| Household Type | # Households | Household Size |
| Married-Couple | 2,346 (38.1%) | 3.11 |
| Single Male/Father | 313 (5.1%) | 3.46 |
| Single Female/Mother | 705 (11.5%) | 3.47 |
| Non-family | 2,795 (45.4%) | 1.17 |
| Total Households | 6,159 (100.0%) | 2.29 |
Household Size by Marriage Status in Scottsbluff
Out of a total of 6,159 households in Scottsbluff, 3,364 (54.6%) are family households, while 2,795 (45.4%) are nonfamily households. The most numerous type of family households are 2-person households, comprising 1,462, and the most common type of nonfamily households are 1-person households, comprising 2,372.
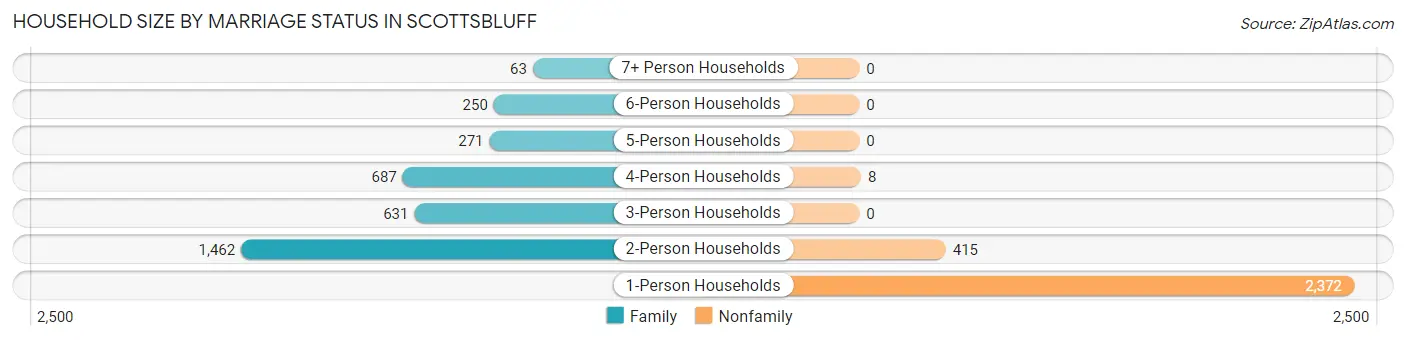
| Household Size | Family Households | Nonfamily Households |
| 1-Person Households | - | 2,372 (38.5%) |
| 2-Person Households | 1,462 (23.7%) | 415 (6.7%) |
| 3-Person Households | 631 (10.2%) | 0 (0.0%) |
| 4-Person Households | 687 (11.2%) | 8 (0.1%) |
| 5-Person Households | 271 (4.4%) | 0 (0.0%) |
| 6-Person Households | 250 (4.1%) | 0 (0.0%) |
| 7+ Person Households | 63 (1.0%) | 0 (0.0%) |
| Total | 3,364 (54.6%) | 2,795 (45.4%) |
Female Fertility in Scottsbluff
Fertility by Age in Scottsbluff
Average fertility rate in Scottsbluff is 43.0 births per 1,000 women. Women in the age bracket of 20 to 34 years have the highest fertility rate with 77.0 births per 1,000 women. Women in the age bracket of 20 to 34 years acount for 92.5% of all women with births.
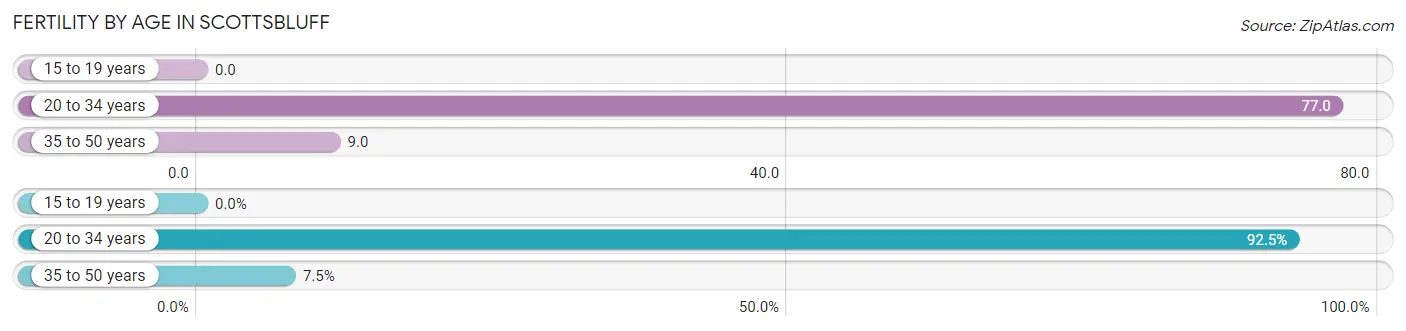
| Age Bracket | Women with Births | Births / 1,000 Women |
| 15 to 19 years | 0 (0.0%) | 0.0 |
| 20 to 34 years | 124 (92.5%) | 77.0 |
| 35 to 50 years | 10 (7.5%) | 9.0 |
| Total | 134 (100.0%) | 43.0 |
Fertility by Age by Marriage Status in Scottsbluff
95.5% of women with births (134) in Scottsbluff are married. The highest percentage of unmarried women with births falls into 20 to 34 years age bracket with 4.8% of them unmarried at the time of birth, while the lowest percentage of unmarried women with births belong to 35 to 50 years age bracket with 0.0% of them unmarried.
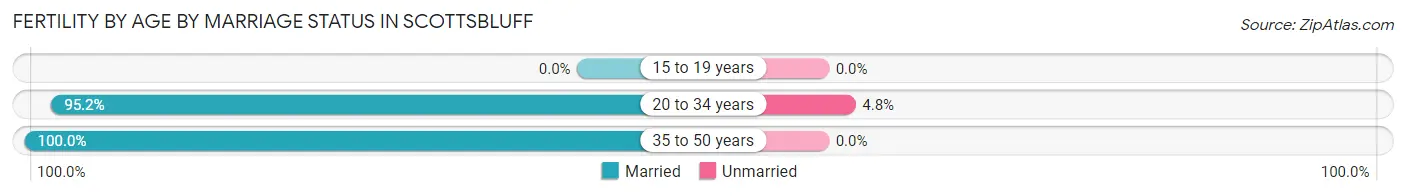
| Age Bracket | Married | Unmarried |
| 15 to 19 years | 0 (0.0%) | 0 (0.0%) |
| 20 to 34 years | 118 (95.2%) | 6 (4.8%) |
| 35 to 50 years | 10 (100.0%) | 0 (0.0%) |
| Total | 128 (95.5%) | 6 (4.5%) |
Fertility by Education in Scottsbluff
Average fertility rate in Scottsbluff is 43.0 births per 1,000 women. Women with the education attainment of high school diploma have the highest fertility rate of 56.0 births per 1,000 women, while women with the education attainment of graduate degree have the lowest fertility at 28.0 births per 1,000 women. Women with the education attainment of high school diploma represent 35.1% of all women with births.
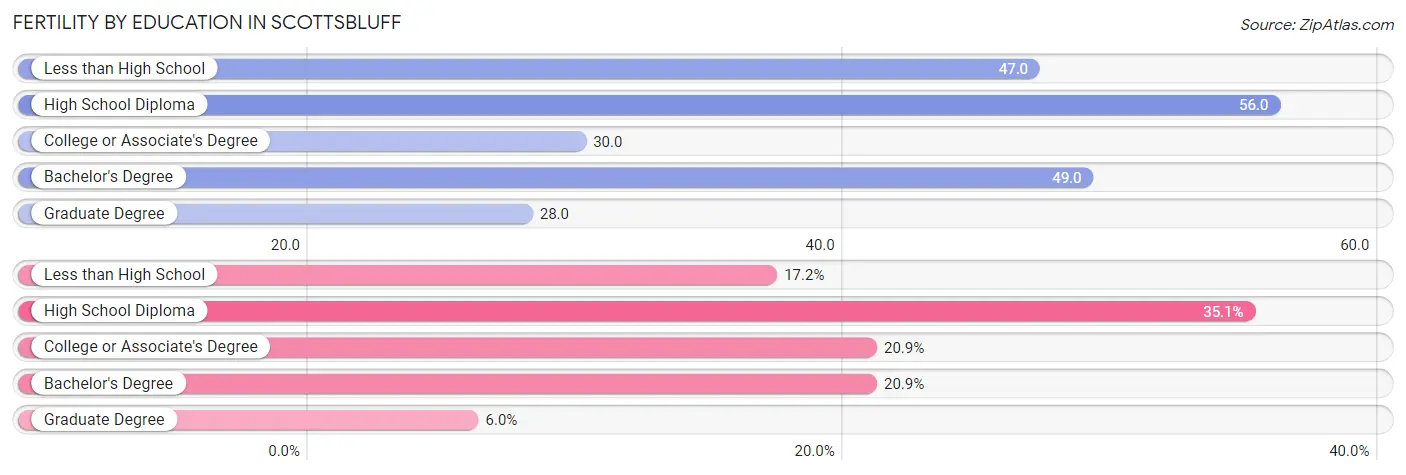
| Educational Attainment | Women with Births | Births / 1,000 Women |
| Less than High School | 23 (17.2%) | 47.0 |
| High School Diploma | 47 (35.1%) | 56.0 |
| College or Associate's Degree | 28 (20.9%) | 30.0 |
| Bachelor's Degree | 28 (20.9%) | 49.0 |
| Graduate Degree | 8 (6.0%) | 28.0 |
| Total | 134 (100.0%) | 43.0 |
Fertility by Education by Marriage Status in Scottsbluff
4.5% of women with births in Scottsbluff are unmarried. Women with the educational attainment of less than high school are most likely to be married with 100.0% of them married at childbirth, while women with the educational attainment of high school diploma are least likely to be married with 12.8% of them unmarried at childbirth.
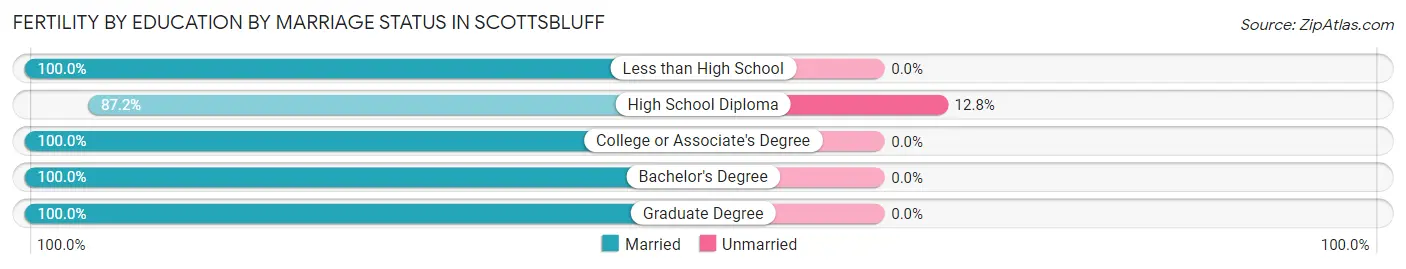
| Educational Attainment | Married | Unmarried |
| Less than High School | 23 (100.0%) | 0 (0.0%) |
| High School Diploma | 41 (87.2%) | 6 (12.8%) |
| College or Associate's Degree | 28 (100.0%) | 0 (0.0%) |
| Bachelor's Degree | 28 (100.0%) | 0 (0.0%) |
| Graduate Degree | 8 (100.0%) | 0 (0.0%) |
| Total | 128 (95.5%) | 6 (4.5%) |
Income in Scottsbluff
Income Overview in Scottsbluff
Per Capita Income in Scottsbluff is $31,472, while median incomes of families and households are $73,000 and $55,744 respectively.
| Characteristic | Number | Measure |
| Per Capita Income | 14,454 | $31,472 |
| Median Family Income | 3,364 | $73,000 |
| Mean Family Income | 3,364 | $89,389 |
| Median Household Income | 6,159 | $55,744 |
| Mean Household Income | 6,159 | $70,392 |
| Income Deficit | 3,364 | $10,804 |
| Wage / Income Gap (%) | 14,454 | 23.63% |
| Wage / Income Gap ($) | 14,454 | 76.37¢ per $1 |
| Gini / Inequality Index | 14,454 | 0.43 |
Earnings by Sex in Scottsbluff
Average Earnings in Scottsbluff are $35,460, $41,745 for men and $31,880 for women, a difference of 23.6%.
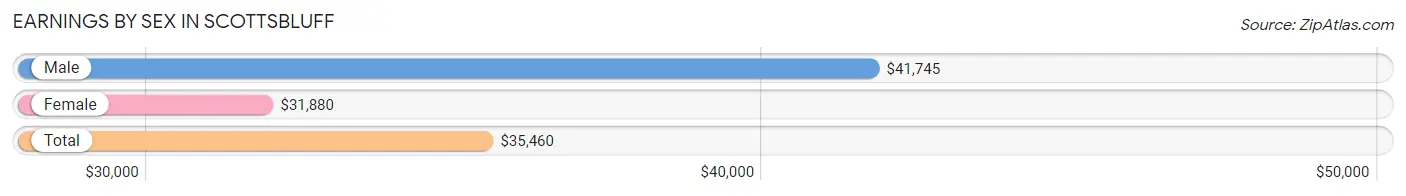
| Sex | Number | Average Earnings |
| Male | 3,751 (49.5%) | $41,745 |
| Female | 3,830 (50.5%) | $31,880 |
| Total | 7,581 (100.0%) | $35,460 |
Earnings by Sex by Income Bracket in Scottsbluff
The most common earnings brackets in Scottsbluff are $55,000 to $64,999 for men (465 | 12.4%) and $30,000 to $34,999 for women (412 | 10.8%).
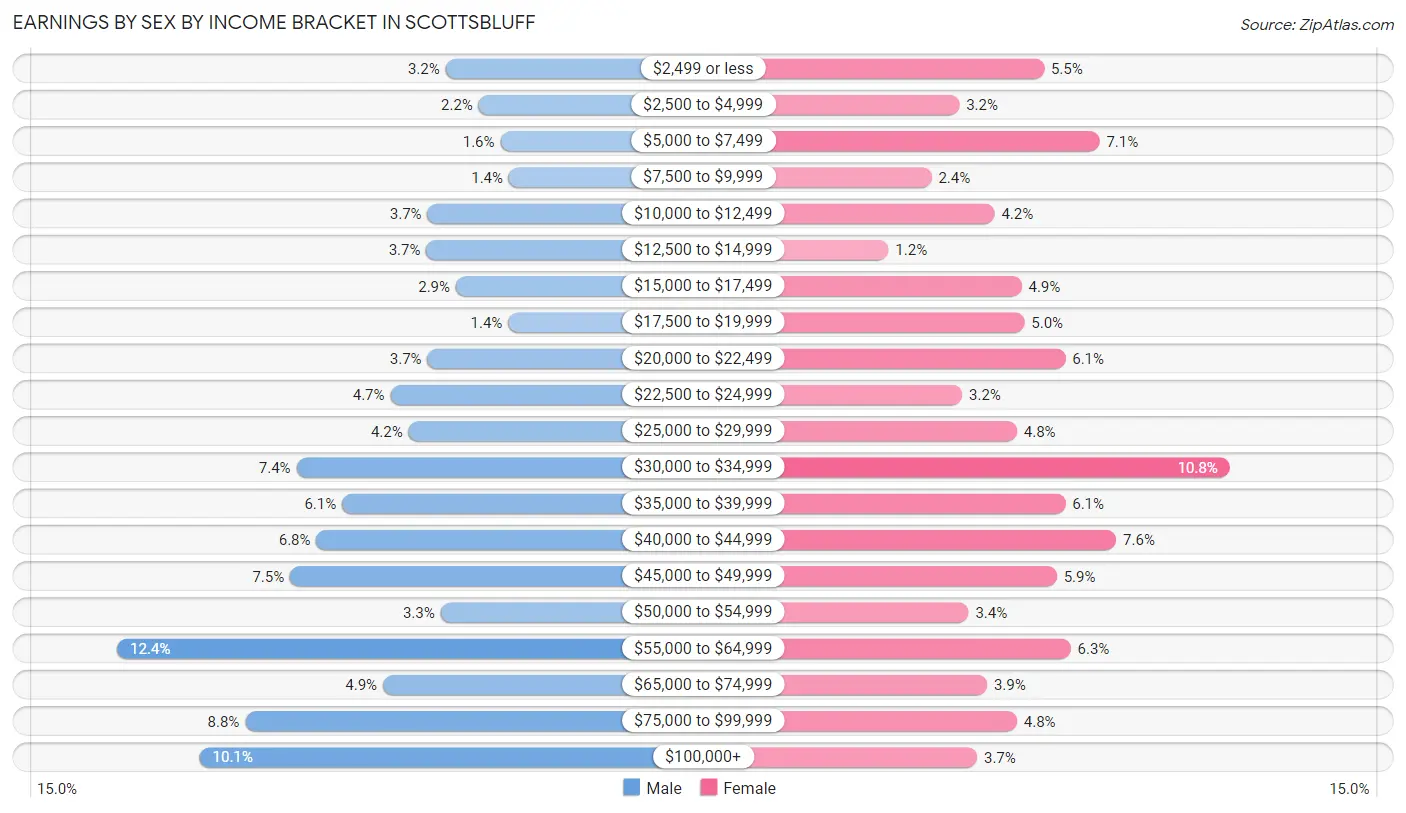
| Income | Male | Female |
| $2,499 or less | 119 (3.2%) | 212 (5.5%) |
| $2,500 to $4,999 | 84 (2.2%) | 121 (3.2%) |
| $5,000 to $7,499 | 61 (1.6%) | 272 (7.1%) |
| $7,500 to $9,999 | 52 (1.4%) | 91 (2.4%) |
| $10,000 to $12,499 | 138 (3.7%) | 159 (4.2%) |
| $12,500 to $14,999 | 139 (3.7%) | 45 (1.2%) |
| $15,000 to $17,499 | 108 (2.9%) | 188 (4.9%) |
| $17,500 to $19,999 | 53 (1.4%) | 191 (5.0%) |
| $20,000 to $22,499 | 138 (3.7%) | 235 (6.1%) |
| $22,500 to $24,999 | 177 (4.7%) | 124 (3.2%) |
| $25,000 to $29,999 | 158 (4.2%) | 183 (4.8%) |
| $30,000 to $34,999 | 276 (7.4%) | 412 (10.8%) |
| $35,000 to $39,999 | 228 (6.1%) | 235 (6.1%) |
| $40,000 to $44,999 | 255 (6.8%) | 290 (7.6%) |
| $45,000 to $49,999 | 283 (7.5%) | 226 (5.9%) |
| $50,000 to $54,999 | 124 (3.3%) | 131 (3.4%) |
| $55,000 to $64,999 | 465 (12.4%) | 241 (6.3%) |
| $65,000 to $74,999 | 185 (4.9%) | 151 (3.9%) |
| $75,000 to $99,999 | 330 (8.8%) | 183 (4.8%) |
| $100,000+ | 378 (10.1%) | 140 (3.7%) |
| Total | 3,751 (100.0%) | 3,830 (100.0%) |
Earnings by Sex by Educational Attainment in Scottsbluff
Average earnings in Scottsbluff are $48,312 for men and $34,353 for women, a difference of 28.9%. Men with an educational attainment of graduate degree enjoy the highest average annual earnings of $79,000, while those with less than high school education earn the least with $35,625. Women with an educational attainment of graduate degree earn the most with the average annual earnings of $54,814, while those with less than high school education have the smallest earnings of $18,962.
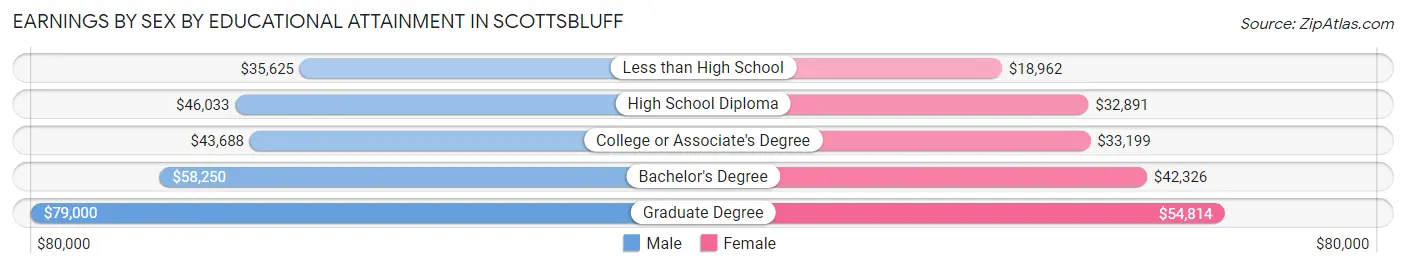
| Educational Attainment | Male Income | Female Income |
| Less than High School | $35,625 | $18,962 |
| High School Diploma | $46,033 | $32,891 |
| College or Associate's Degree | $43,688 | $33,199 |
| Bachelor's Degree | $58,250 | $42,326 |
| Graduate Degree | $79,000 | $54,814 |
| Total | $48,312 | $34,353 |
Family Income in Scottsbluff
Family Income Brackets in Scottsbluff
According to the Scottsbluff family income data, there are 743 families falling into the $100,000 to $149,999 income range, which is the most common income bracket and makes up 22.1% of all families. Conversely, the less than $10,000 income bracket is the least frequent group with only 77 families (2.3%) belonging to this category.
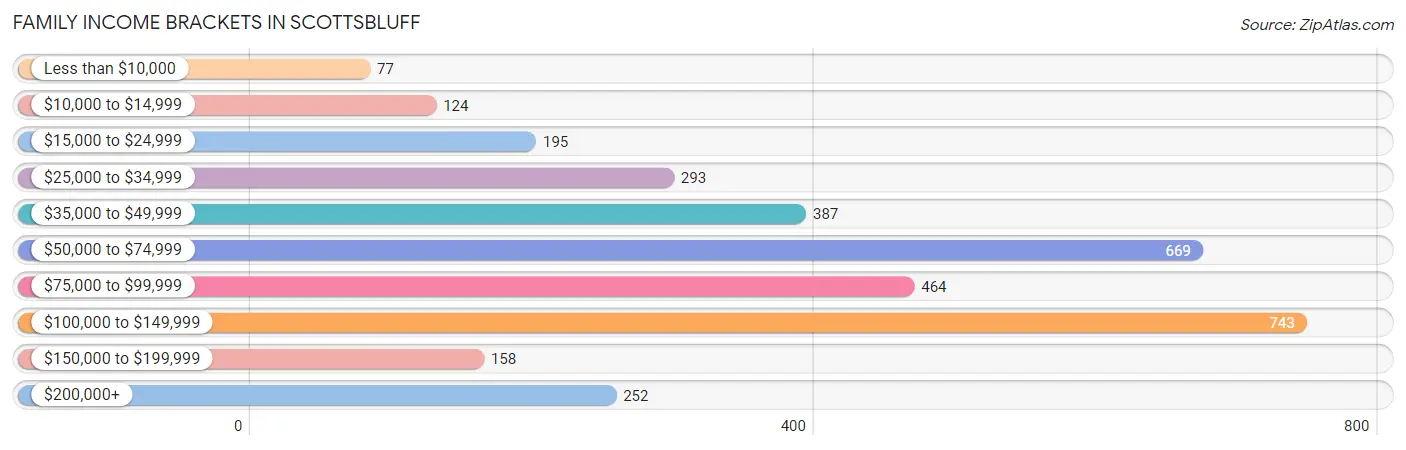
| Income Bracket | # Families | % Families |
| Less than $10,000 | 77 | 2.3% |
| $10,000 to $14,999 | 124 | 3.7% |
| $15,000 to $24,999 | 195 | 5.8% |
| $25,000 to $34,999 | 293 | 8.7% |
| $35,000 to $49,999 | 387 | 11.5% |
| $50,000 to $74,999 | 669 | 19.9% |
| $75,000 to $99,999 | 464 | 13.8% |
| $100,000 to $149,999 | 743 | 22.1% |
| $150,000 to $199,999 | 158 | 4.7% |
| $200,000+ | 252 | 7.5% |
Family Income by Famaliy Size in Scottsbluff
7+ person families (63 | 1.9%) account for the highest median family income in Scottsbluff with $119,330 per family, while 2-person families (1,650 | 49.0%) have the highest median income of $34,302 per family member.
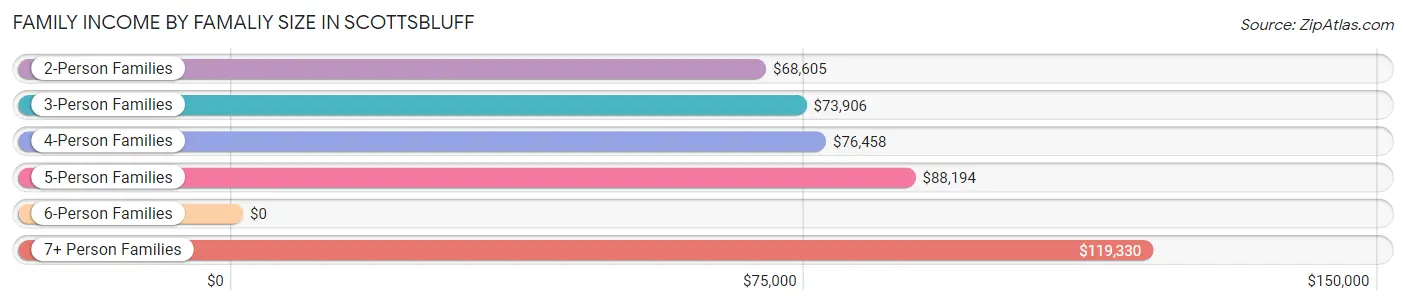
| Income Bracket | # Families | Median Income |
| 2-Person Families | 1,650 (49.0%) | $68,605 |
| 3-Person Families | 599 (17.8%) | $73,906 |
| 4-Person Families | 602 (17.9%) | $76,458 |
| 5-Person Families | 228 (6.8%) | $88,194 |
| 6-Person Families | 222 (6.6%) | $0 |
| 7+ Person Families | 63 (1.9%) | $119,330 |
| Total | 3,364 (100.0%) | $73,000 |
Family Income by Number of Earners in Scottsbluff
The median family income in Scottsbluff is $73,000, with families comprising 3+ earners (278) having the highest median family income of $118,571, while families with no earners (553) have the lowest median family income of $44,144, accounting for 8.3% and 16.4% of families, respectively.
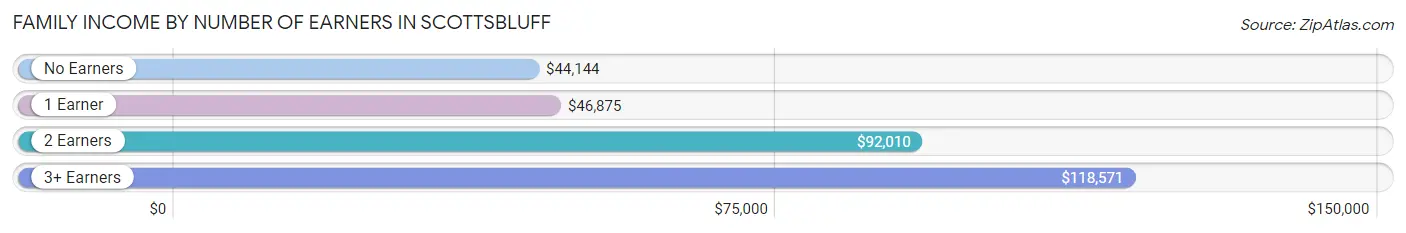
| Number of Earners | # Families | Median Income |
| No Earners | 553 (16.4%) | $44,144 |
| 1 Earner | 1,028 (30.6%) | $46,875 |
| 2 Earners | 1,505 (44.7%) | $92,010 |
| 3+ Earners | 278 (8.3%) | $118,571 |
| Total | 3,364 (100.0%) | $73,000 |
Household Income in Scottsbluff
Household Income Brackets in Scottsbluff
With 1,164 households falling in the category, the $50,000 to $74,999 income range is the most frequent in Scottsbluff, accounting for 18.9% of all households. In contrast, only 148 households (2.4%) fall into the $150,000 to $199,999 income bracket, making it the least populous group.
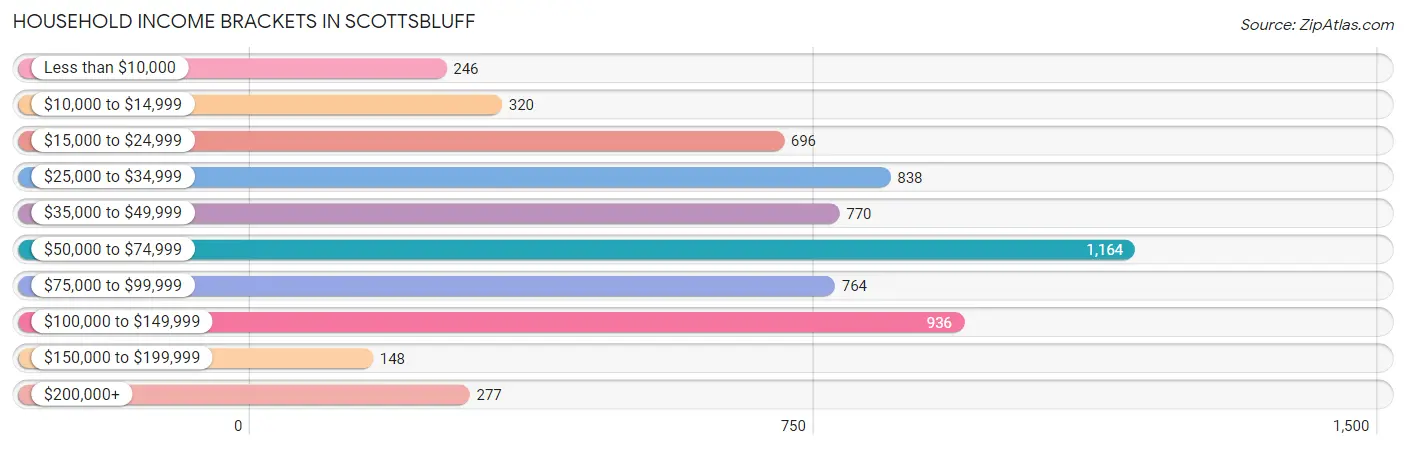
| Income Bracket | # Households | % Households |
| Less than $10,000 | 246 | 4.0% |
| $10,000 to $14,999 | 320 | 5.2% |
| $15,000 to $24,999 | 696 | 11.3% |
| $25,000 to $34,999 | 838 | 13.6% |
| $35,000 to $49,999 | 770 | 12.5% |
| $50,000 to $74,999 | 1,164 | 18.9% |
| $75,000 to $99,999 | 764 | 12.4% |
| $100,000 to $149,999 | 936 | 15.2% |
| $150,000 to $199,999 | 148 | 2.4% |
| $200,000+ | 277 | 4.5% |
Household Income by Householder Age in Scottsbluff
The median household income in Scottsbluff is $55,744, with the highest median household income of $70,596 found in the 25 to 44 years age bracket for the primary householder. A total of 1,966 households (31.9%) fall into this category. Meanwhile, the 15 to 24 years age bracket for the primary householder has the lowest median household income of $34,315, with 492 households (8.0%) in this group.
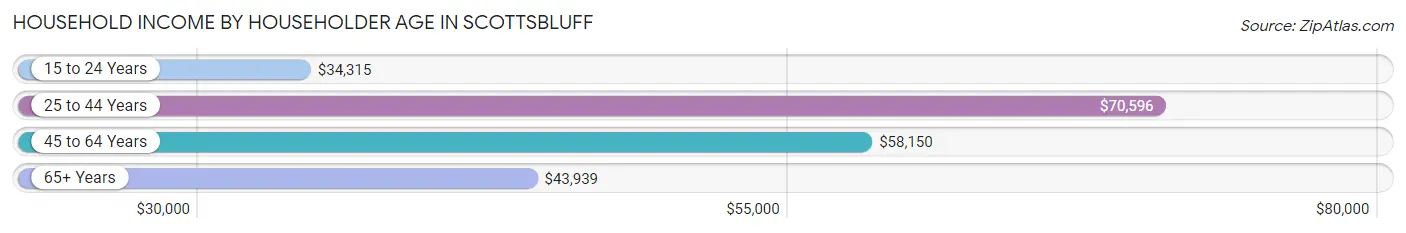
| Income Bracket | # Households | Median Income |
| 15 to 24 Years | 492 (8.0%) | $34,315 |
| 25 to 44 Years | 1,966 (31.9%) | $70,596 |
| 45 to 64 Years | 1,681 (27.3%) | $58,150 |
| 65+ Years | 2,020 (32.8%) | $43,939 |
| Total | 6,159 (100.0%) | $55,744 |
Poverty in Scottsbluff
Income Below Poverty by Sex and Age in Scottsbluff
With 13.3% poverty level for males and 17.3% for females among the residents of Scottsbluff, 6 to 11 year old males and 15 year old females are the most vulnerable to poverty, with 262 males (36.4%) and 43 females (32.8%) in their respective age groups living below the poverty level.
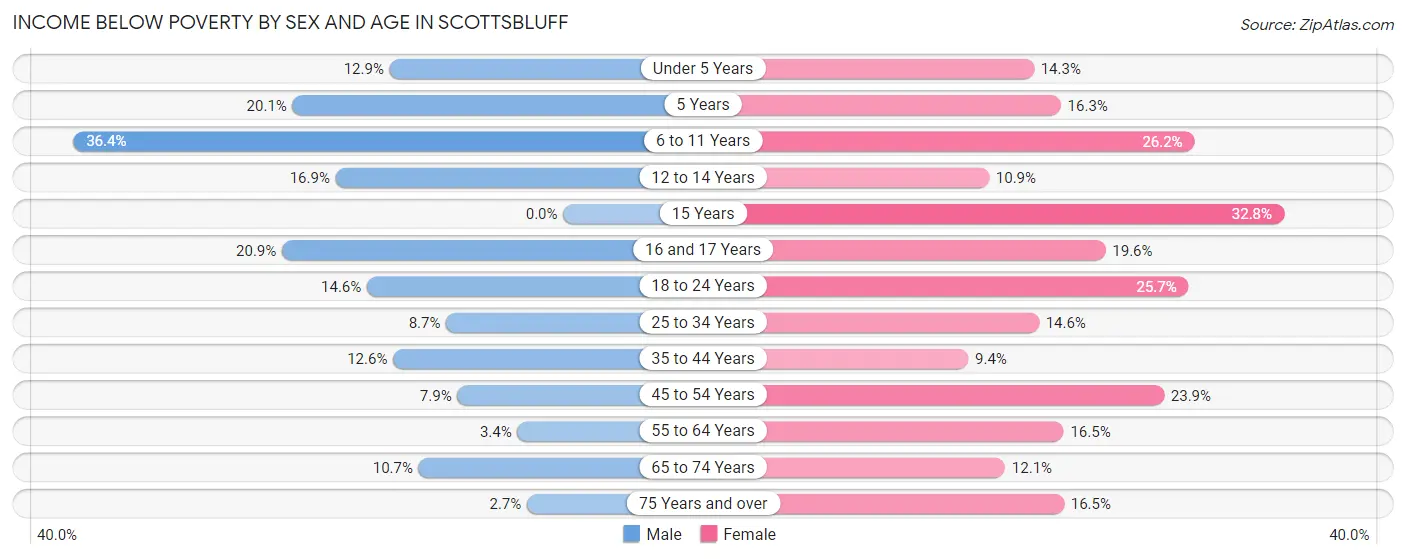
| Age Bracket | Male | Female |
| Under 5 Years | 49 (12.9%) | 62 (14.2%) |
| 5 Years | 41 (20.1%) | 13 (16.3%) |
| 6 to 11 Years | 262 (36.4%) | 167 (26.2%) |
| 12 to 14 Years | 48 (16.9%) | 32 (10.9%) |
| 15 Years | 0 (0.0%) | 43 (32.8%) |
| 16 and 17 Years | 38 (20.9%) | 18 (19.6%) |
| 18 to 24 Years | 96 (14.6%) | 166 (25.7%) |
| 25 to 34 Years | 84 (8.7%) | 155 (14.6%) |
| 35 to 44 Years | 97 (12.6%) | 70 (9.4%) |
| 45 to 54 Years | 53 (7.9%) | 170 (23.9%) |
| 55 to 64 Years | 20 (3.4%) | 133 (16.5%) |
| 65 to 74 Years | 81 (10.7%) | 116 (12.1%) |
| 75 Years and over | 9 (2.7%) | 134 (16.5%) |
| Total | 878 (13.3%) | 1,279 (17.3%) |
Income Above Poverty by Sex and Age in Scottsbluff
According to the poverty statistics in Scottsbluff, males aged 15 years and females aged 35 to 44 years are the age groups that are most secure financially, with 100.0% of males and 90.6% of females in these age groups living above the poverty line.
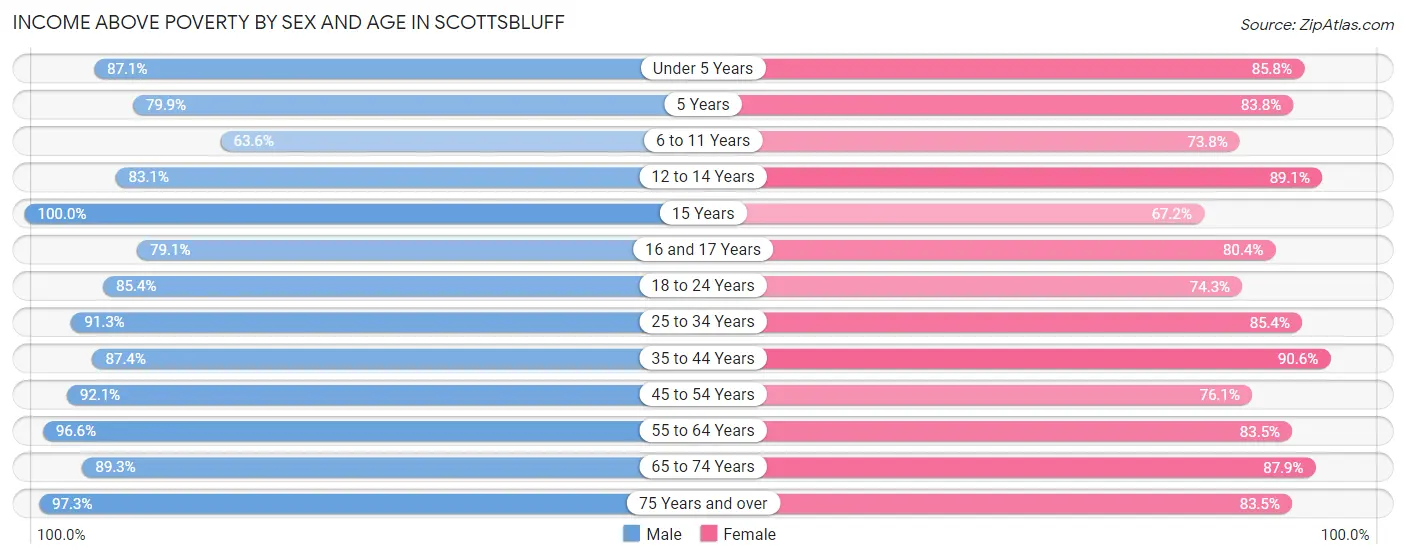
| Age Bracket | Male | Female |
| Under 5 Years | 331 (87.1%) | 373 (85.8%) |
| 5 Years | 163 (79.9%) | 67 (83.8%) |
| 6 to 11 Years | 458 (63.6%) | 471 (73.8%) |
| 12 to 14 Years | 236 (83.1%) | 261 (89.1%) |
| 15 Years | 101 (100.0%) | 88 (67.2%) |
| 16 and 17 Years | 144 (79.1%) | 74 (80.4%) |
| 18 to 24 Years | 563 (85.4%) | 479 (74.3%) |
| 25 to 34 Years | 883 (91.3%) | 905 (85.4%) |
| 35 to 44 Years | 671 (87.4%) | 676 (90.6%) |
| 45 to 54 Years | 621 (92.1%) | 541 (76.1%) |
| 55 to 64 Years | 569 (96.6%) | 675 (83.5%) |
| 65 to 74 Years | 674 (89.3%) | 842 (87.9%) |
| 75 Years and over | 326 (97.3%) | 679 (83.5%) |
| Total | 5,740 (86.7%) | 6,131 (82.7%) |
Income Below Poverty Among Married-Couple Families in Scottsbluff
The poverty statistics for married-couple families in Scottsbluff show that 4.9% or 114 of the total 2,346 families live below the poverty line. Families with 5 or more children have the highest poverty rate of 20.0%, comprising of 7 families. On the other hand, families with no children have the lowest poverty rate of 3.7%, which includes 48 families.
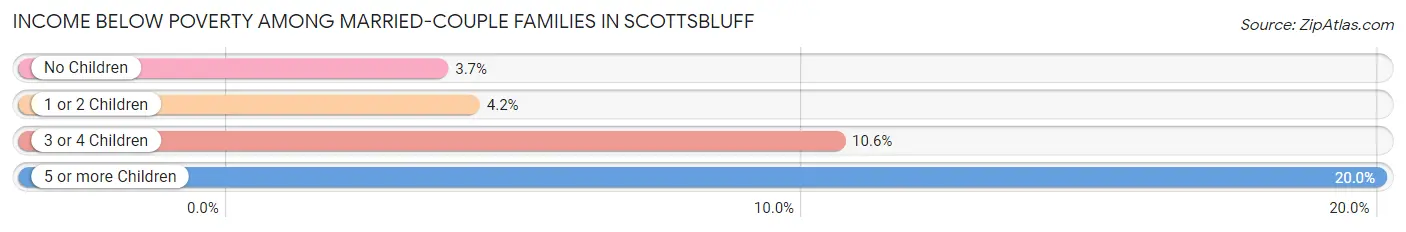
| Children | Above Poverty | Below Poverty |
| No Children | 1,262 (96.3%) | 48 (3.7%) |
| 1 or 2 Children | 705 (95.8%) | 31 (4.2%) |
| 3 or 4 Children | 237 (89.4%) | 28 (10.6%) |
| 5 or more Children | 28 (80.0%) | 7 (20.0%) |
| Total | 2,232 (95.1%) | 114 (4.9%) |
Income Below Poverty Among Single-Parent Households in Scottsbluff
According to the poverty data in Scottsbluff, 26.8% or 84 single-father households and 31.4% or 221 single-mother households are living below the poverty line. Among single-father households, those with no children have the highest poverty rate, with 30 households (46.2%) experiencing poverty. Likewise, among single-mother households, those with 5 or more children have the highest poverty rate, with 84 households (100.0%) falling below the poverty line.
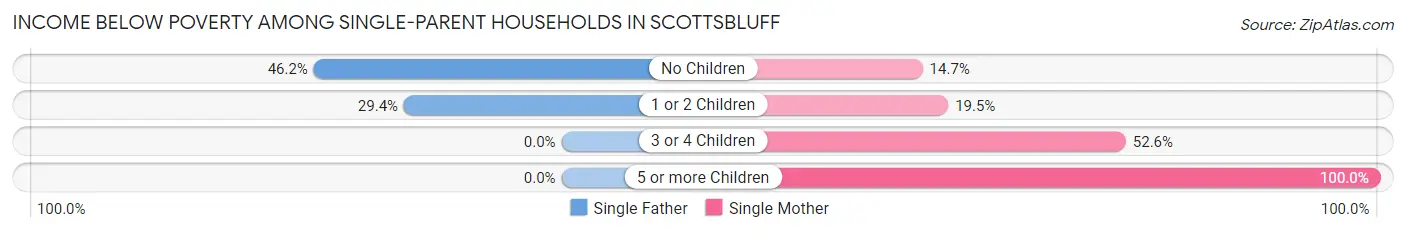
| Children | Single Father | Single Mother |
| No Children | 30 (46.2%) | 30 (14.7%) |
| 1 or 2 Children | 54 (29.3%) | 66 (19.5%) |
| 3 or 4 Children | 0 (0.0%) | 41 (52.6%) |
| 5 or more Children | 0 (0.0%) | 84 (100.0%) |
| Total | 84 (26.8%) | 221 (31.4%) |
Income Below Poverty Among Married-Couple vs Single-Parent Households in Scottsbluff
The poverty data for Scottsbluff shows that 114 of the married-couple family households (4.9%) and 305 of the single-parent households (30.0%) are living below the poverty level. Within the married-couple family households, those with 5 or more children have the highest poverty rate, with 7 households (20.0%) falling below the poverty line. Among the single-parent households, those with 5 or more children have the highest poverty rate, with 84 household (100.0%) living below poverty.
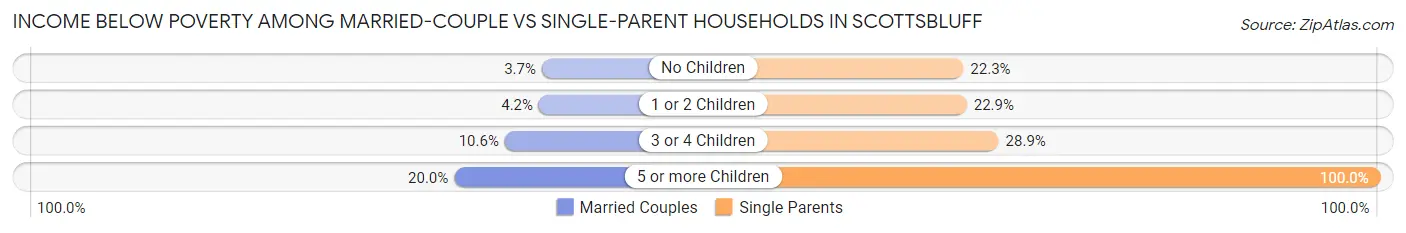
| Children | Married-Couple Families | Single-Parent Households |
| No Children | 48 (3.7%) | 60 (22.3%) |
| 1 or 2 Children | 31 (4.2%) | 120 (22.9%) |
| 3 or 4 Children | 28 (10.6%) | 41 (28.9%) |
| 5 or more Children | 7 (20.0%) | 84 (100.0%) |
| Total | 114 (4.9%) | 305 (30.0%) |
Employment Characteristics in Scottsbluff
Employment by Class of Employer in Scottsbluff
Among the 6,885 employed individuals in Scottsbluff, private company employees (4,731 | 68.7%), not-for-profit organizations (578 | 8.4%), and local government employees (520 | 7.5%) make up the most common classes of employment.
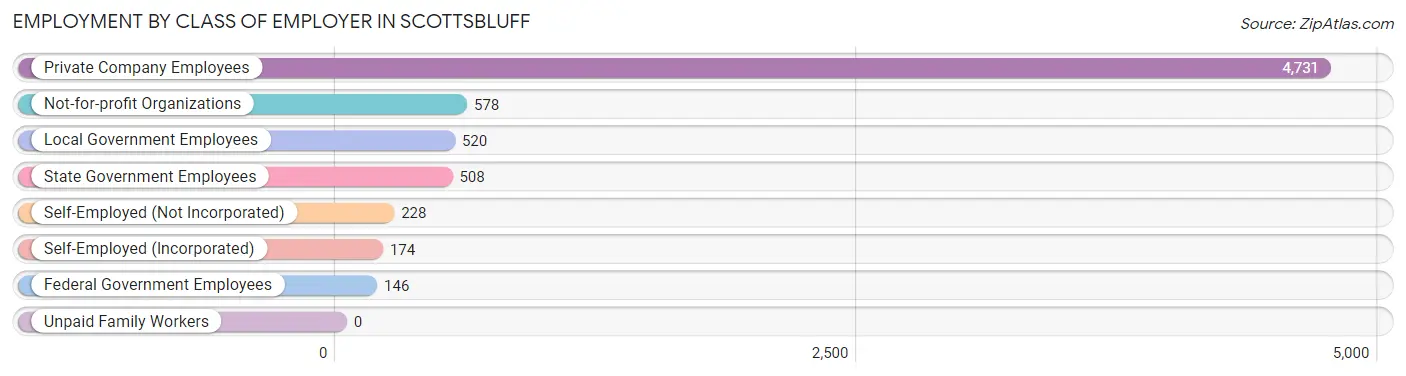
| Employer Class | # Employees | % Employees |
| Private Company Employees | 4,731 | 68.7% |
| Self-Employed (Incorporated) | 174 | 2.5% |
| Self-Employed (Not Incorporated) | 228 | 3.3% |
| Not-for-profit Organizations | 578 | 8.4% |
| Local Government Employees | 520 | 7.5% |
| State Government Employees | 508 | 7.4% |
| Federal Government Employees | 146 | 2.1% |
| Unpaid Family Workers | 0 | 0.0% |
| Total | 6,885 | 100.0% |
Employment Status by Age in Scottsbluff
According to the labor force statistics for Scottsbluff, out of the total population over 16 years of age (11,097), 65.0% or 7,213 individuals are in the labor force, with 2.3% or 166 of them unemployed. The age group with the highest labor force participation rate is 30 to 34 years, with 93.1% or 1,026 individuals in the labor force. Within the labor force, the 16 to 19 years age range has the highest percentage of unemployed individuals, with 7.6% or 29 of them being unemployed.
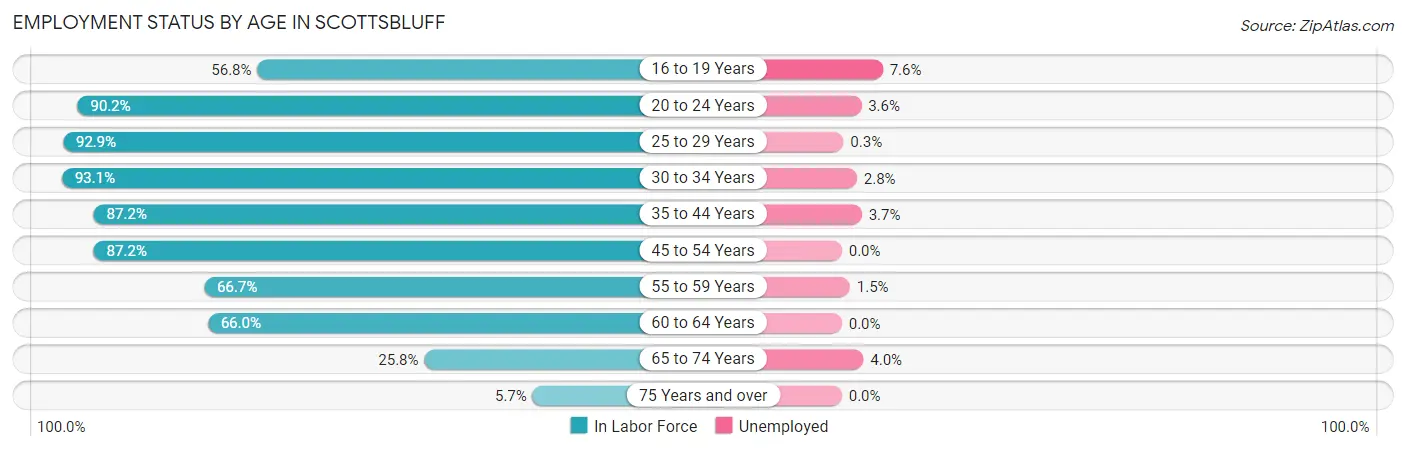
| Age Bracket | In Labor Force | Unemployed |
| 16 to 19 Years | 380 (56.8%) | 29 (7.6%) |
| 20 to 24 Years | 953 (90.2%) | 34 (3.6%) |
| 25 to 29 Years | 862 (92.9%) | 3 (0.3%) |
| 30 to 34 Years | 1,026 (93.1%) | 29 (2.8%) |
| 35 to 44 Years | 1,323 (87.2%) | 49 (3.7%) |
| 45 to 54 Years | 1,221 (87.2%) | 0 (0.0%) |
| 55 to 59 Years | 389 (66.7%) | 6 (1.5%) |
| 60 to 64 Years | 542 (66.0%) | 0 (0.0%) |
| 65 to 74 Years | 446 (25.8%) | 18 (4.0%) |
| 75 Years and over | 74 (5.7%) | 0 (0.0%) |
| Total | 7,213 (65.0%) | 166 (2.3%) |
Employment Status by Educational Attainment in Scottsbluff
According to labor force statistics for Scottsbluff, 84.4% of individuals (5,360) out of the total population between 25 and 64 years of age (6,351) are in the labor force, with 1.6% or 86 of them being unemployed. The group with the highest labor force participation rate are those with the educational attainment of bachelor's degree or higher, with 90.9% or 1,653 individuals in the labor force. Within the labor force, individuals with less than high school education have the highest percentage of unemployment, with 5.5% or 26 of them being unemployed.
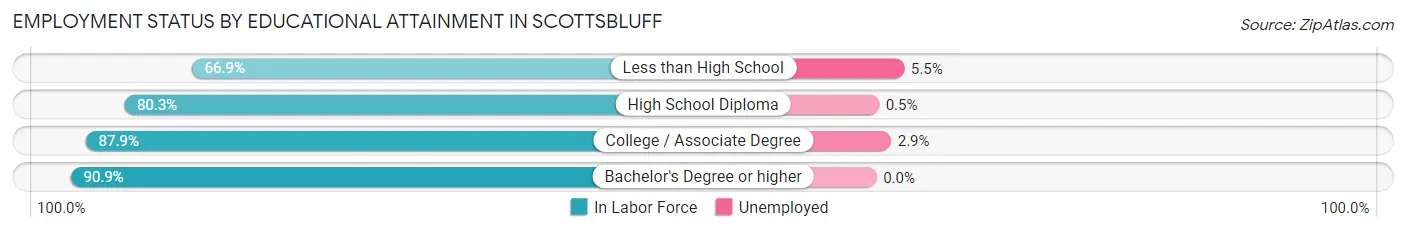
| Educational Attainment | In Labor Force | Unemployed |
| Less than High School | 476 (66.9%) | 39 (5.5%) |
| High School Diploma | 1,310 (80.3%) | 8 (0.5%) |
| College / Associate Degree | 1,925 (87.9%) | 64 (2.9%) |
| Bachelor's Degree or higher | 1,653 (90.9%) | 0 (0.0%) |
| Total | 5,360 (84.4%) | 102 (1.6%) |
Employment Occupations by Sex in Scottsbluff
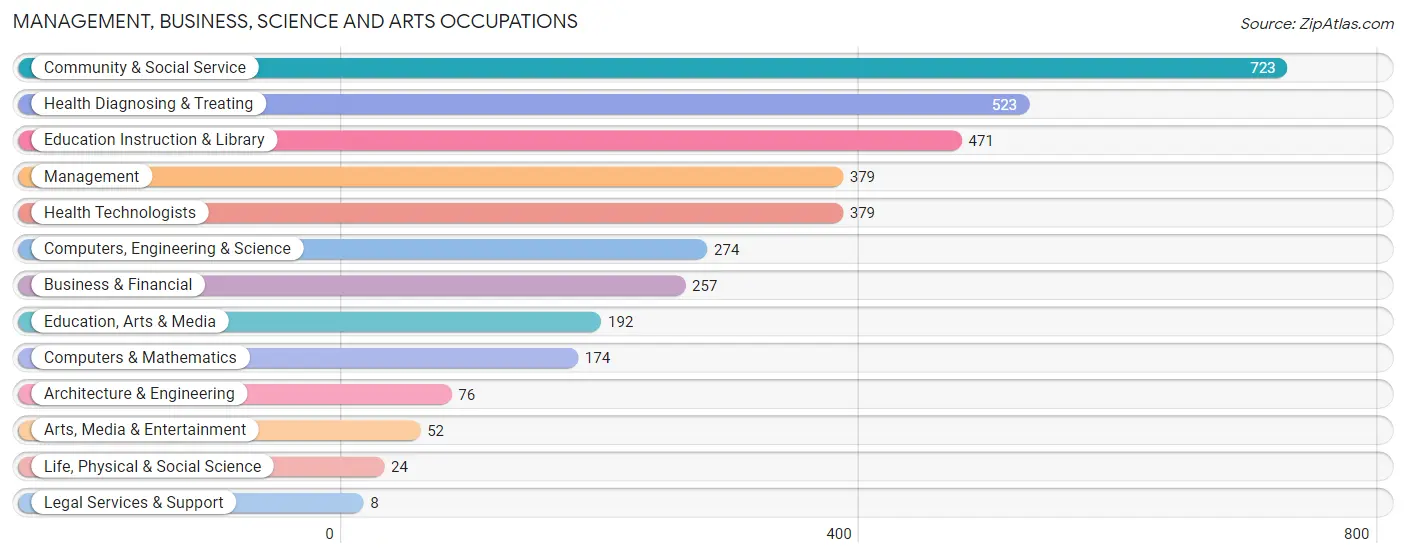
Management, Business, Science and Arts Occupations
The most common Management, Business, Science and Arts occupations in Scottsbluff are Community & Social Service (723 | 10.3%), Health Diagnosing & Treating (523 | 7.4%), Education Instruction & Library (471 | 6.7%), Management (379 | 5.4%), and Health Technologists (379 | 5.4%).
Management, Business, Science and Arts Occupations by Sex
Within the Management, Business, Science and Arts occupations in Scottsbluff, the most male-oriented occupations are Architecture & Engineering (100.0%), Life, Physical & Social Science (100.0%), and Legal Services & Support (100.0%), while the most female-oriented occupations are Health Technologists (77.3%), Health Diagnosing & Treating (76.9%), and Education, Arts & Media (74.0%).
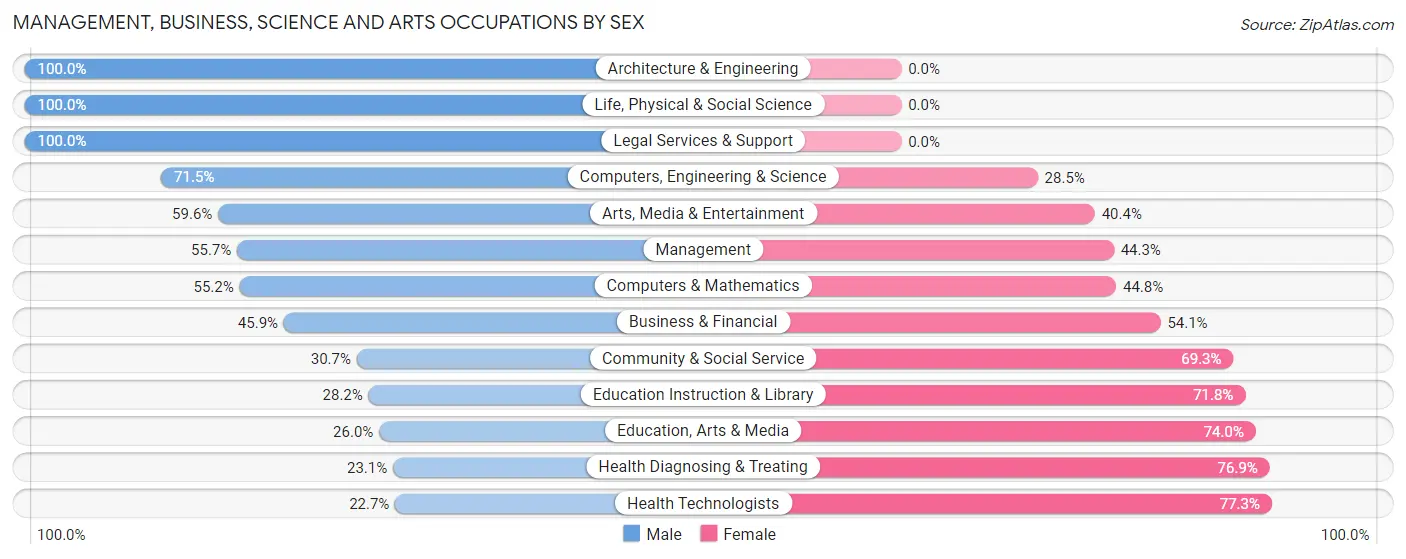
| Occupation | Male | Female |
| Management | 211 (55.7%) | 168 (44.3%) |
| Business & Financial | 118 (45.9%) | 139 (54.1%) |
| Computers, Engineering & Science | 196 (71.5%) | 78 (28.5%) |
| Computers & Mathematics | 96 (55.2%) | 78 (44.8%) |
| Architecture & Engineering | 76 (100.0%) | 0 (0.0%) |
| Life, Physical & Social Science | 24 (100.0%) | 0 (0.0%) |
| Community & Social Service | 222 (30.7%) | 501 (69.3%) |
| Education, Arts & Media | 50 (26.0%) | 142 (74.0%) |
| Legal Services & Support | 8 (100.0%) | 0 (0.0%) |
| Education Instruction & Library | 133 (28.2%) | 338 (71.8%) |
| Arts, Media & Entertainment | 31 (59.6%) | 21 (40.4%) |
| Health Diagnosing & Treating | 121 (23.1%) | 402 (76.9%) |
| Health Technologists | 86 (22.7%) | 293 (77.3%) |
| Total (Category) | 868 (40.3%) | 1,288 (59.7%) |
| Total (Overall) | 3,522 (50.0%) | 3,518 (50.0%) |
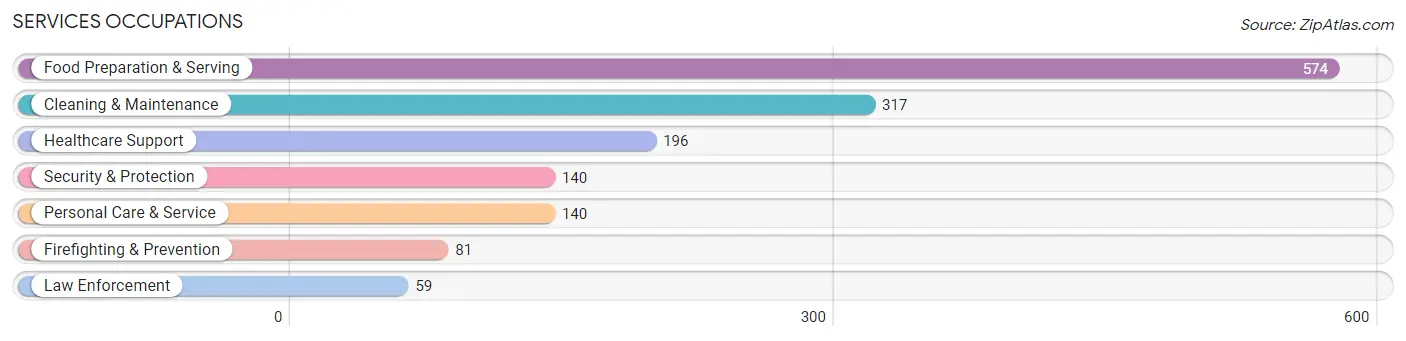
Services Occupations
The most common Services occupations in Scottsbluff are Food Preparation & Serving (574 | 8.2%), Cleaning & Maintenance (317 | 4.5%), Healthcare Support (196 | 2.8%), Security & Protection (140 | 2.0%), and Personal Care & Service (140 | 2.0%).
Services Occupations by Sex
Within the Services occupations in Scottsbluff, the most male-oriented occupations are Law Enforcement (100.0%), Cleaning & Maintenance (82.3%), and Security & Protection (58.6%), while the most female-oriented occupations are Healthcare Support (100.0%), Personal Care & Service (81.4%), and Firefighting & Prevention (71.6%).
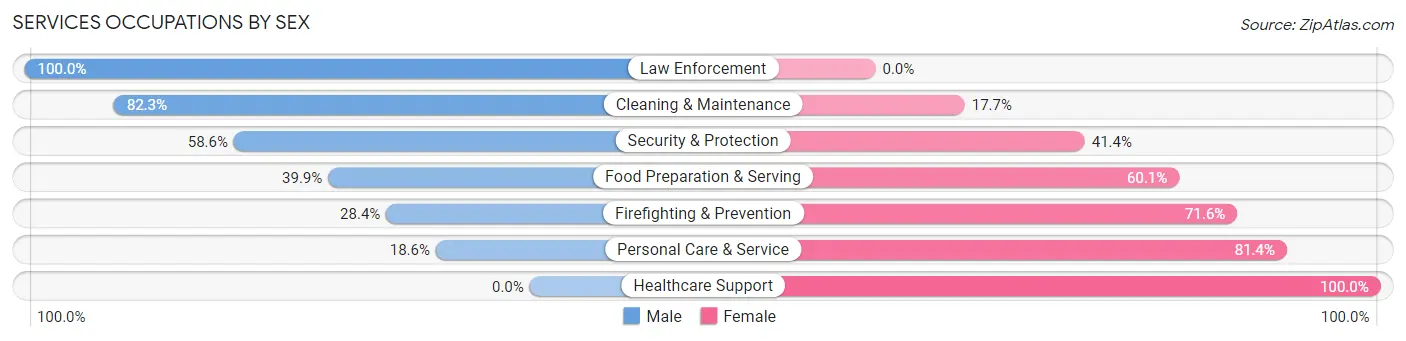
| Occupation | Male | Female |
| Healthcare Support | 0 (0.0%) | 196 (100.0%) |
| Security & Protection | 82 (58.6%) | 58 (41.4%) |
| Firefighting & Prevention | 23 (28.4%) | 58 (71.6%) |
| Law Enforcement | 59 (100.0%) | 0 (0.0%) |
| Food Preparation & Serving | 229 (39.9%) | 345 (60.1%) |
| Cleaning & Maintenance | 261 (82.3%) | 56 (17.7%) |
| Personal Care & Service | 26 (18.6%) | 114 (81.4%) |
| Total (Category) | 598 (43.8%) | 769 (56.2%) |
| Total (Overall) | 3,522 (50.0%) | 3,518 (50.0%) |
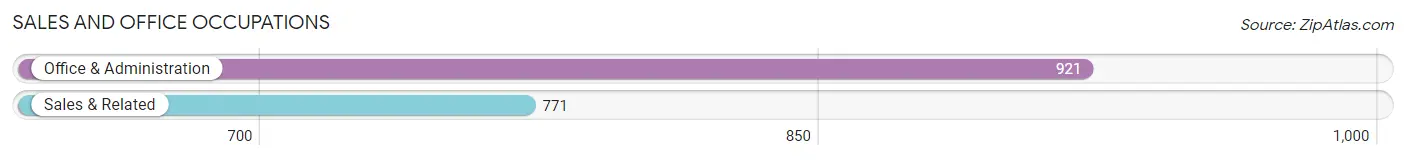
Sales and Office Occupations
The most common Sales and Office occupations in Scottsbluff are Office & Administration (921 | 13.1%), and Sales & Related (771 | 11.0%).
Sales and Office Occupations by Sex
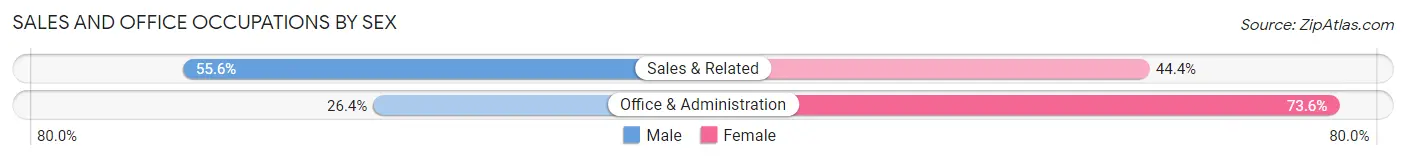
| Occupation | Male | Female |
| Sales & Related | 429 (55.6%) | 342 (44.4%) |
| Office & Administration | 243 (26.4%) | 678 (73.6%) |
| Total (Category) | 672 (39.7%) | 1,020 (60.3%) |
| Total (Overall) | 3,522 (50.0%) | 3,518 (50.0%) |
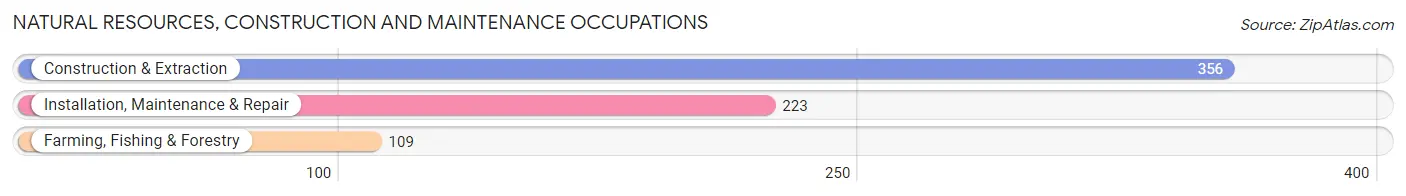
Natural Resources, Construction and Maintenance Occupations
The most common Natural Resources, Construction and Maintenance occupations in Scottsbluff are Construction & Extraction (356 | 5.1%), Installation, Maintenance & Repair (223 | 3.2%), and Farming, Fishing & Forestry (109 | 1.5%).
Natural Resources, Construction and Maintenance Occupations by Sex
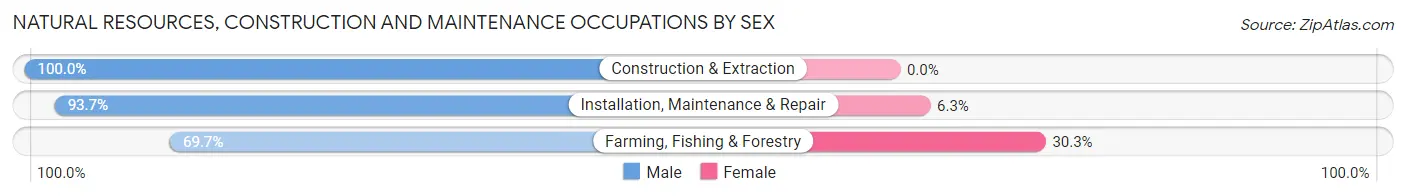
| Occupation | Male | Female |
| Farming, Fishing & Forestry | 76 (69.7%) | 33 (30.3%) |
| Construction & Extraction | 356 (100.0%) | 0 (0.0%) |
| Installation, Maintenance & Repair | 209 (93.7%) | 14 (6.3%) |
| Total (Category) | 641 (93.2%) | 47 (6.8%) |
| Total (Overall) | 3,522 (50.0%) | 3,518 (50.0%) |
Production, Transportation and Moving Occupations
The most common Production, Transportation and Moving occupations in Scottsbluff are Production (533 | 7.6%), Material Moving (335 | 4.8%), and Transportation (269 | 3.8%).
Production, Transportation and Moving Occupations by Sex
| Occupation | Male | Female |
| Production | 305 (57.2%) | 228 (42.8%) |
| Transportation | 269 (100.0%) | 0 (0.0%) |
| Material Moving | 169 (50.4%) | 166 (49.5%) |
| Total (Category) | 743 (65.3%) | 394 (34.6%) |
| Total (Overall) | 3,522 (50.0%) | 3,518 (50.0%) |
Employment Industries by Sex in Scottsbluff
Employment Industries in Scottsbluff
The major employment industries in Scottsbluff include Health Care & Social Assistance (1,216 | 17.3%), Retail Trade (1,175 | 16.7%), Accommodation & Food Services (702 | 10.0%), Educational Services (627 | 8.9%), and Manufacturing (592 | 8.4%).
Employment Industries by Sex in Scottsbluff
The Scottsbluff industries that see more men than women are Wholesale Trade (93.1%), Construction (92.7%), and Utilities (90.4%), whereas the industries that tend to have a higher number of women are Health Care & Social Assistance (82.7%), Real Estate, Rental & Leasing (76.4%), and Administrative & Support (64.9%).
| Industry | Male | Female |
| Agriculture, Fishing & Hunting | 138 (69.4%) | 61 (30.6%) |
| Mining, Quarrying, & Extraction | 0 (0.0%) | 0 (0.0%) |
| Construction | 421 (92.7%) | 33 (7.3%) |
| Manufacturing | 305 (51.5%) | 287 (48.5%) |
| Wholesale Trade | 162 (93.1%) | 12 (6.9%) |
| Retail Trade | 630 (53.6%) | 545 (46.4%) |
| Transportation & Warehousing | 229 (87.1%) | 34 (12.9%) |
| Utilities | 47 (90.4%) | 5 (9.6%) |
| Information | 100 (62.9%) | 59 (37.1%) |
| Finance & Insurance | 145 (37.5%) | 242 (62.5%) |
| Real Estate, Rental & Leasing | 21 (23.6%) | 68 (76.4%) |
| Professional & Scientific | 76 (46.1%) | 89 (53.9%) |
| Enterprise Management | 0 (0.0%) | 0 (0.0%) |
| Administrative & Support | 60 (35.1%) | 111 (64.9%) |
| Educational Services | 268 (42.7%) | 359 (57.3%) |
| Health Care & Social Assistance | 211 (17.3%) | 1,005 (82.7%) |
| Arts, Entertainment & Recreation | 65 (48.1%) | 70 (51.8%) |
| Accommodation & Food Services | 382 (54.4%) | 320 (45.6%) |
| Public Administration | 153 (52.0%) | 141 (48.0%) |
| Total | 3,522 (50.0%) | 3,518 (50.0%) |
Education in Scottsbluff
School Enrollment in Scottsbluff
The most common levels of schooling among the 3,864 students in Scottsbluff are elementary school (1,030 | 26.7%), middle school (861 | 22.3%), and college / undergraduate (638 | 16.5%).
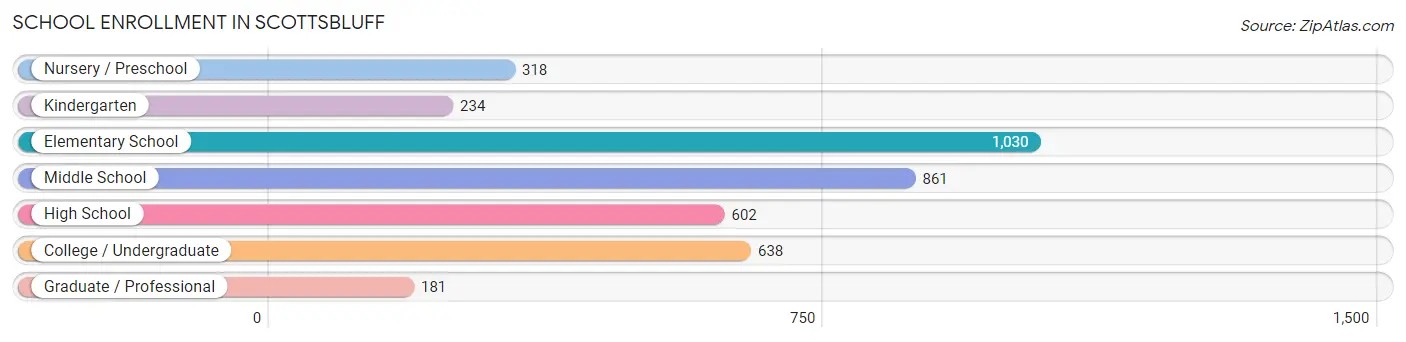
| School Level | # Students | % Students |
| Nursery / Preschool | 318 | 8.2% |
| Kindergarten | 234 | 6.1% |
| Elementary School | 1,030 | 26.7% |
| Middle School | 861 | 22.3% |
| High School | 602 | 15.6% |
| College / Undergraduate | 638 | 16.5% |
| Graduate / Professional | 181 | 4.7% |
| Total | 3,864 | 100.0% |
School Enrollment by Age by Funding Source in Scottsbluff
Out of a total of 3,864 students who are enrolled in schools in Scottsbluff, 460 (11.9%) attend a private institution, while the remaining 3,404 (88.1%) are enrolled in public schools. The age group of 3 to 4 year olds has the highest likelihood of being enrolled in private schools, with 99 (44.2% in the age bracket) enrolled. Conversely, the age group of 10 to 14 year olds has the lowest likelihood of being enrolled in a private school, with 928 (96.1% in the age bracket) attending a public institution.
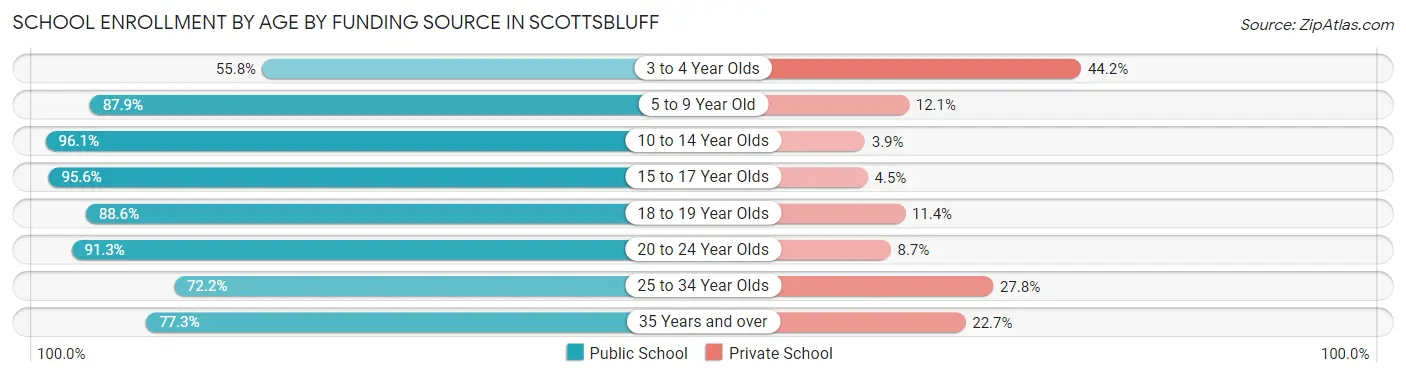
| Age Bracket | Public School | Private School |
| 3 to 4 Year Olds | 125 (55.8%) | 99 (44.2%) |
| 5 to 9 Year Old | 1,108 (87.9%) | 153 (12.1%) |
| 10 to 14 Year Olds | 928 (96.1%) | 38 (3.9%) |
| 15 to 17 Year Olds | 494 (95.6%) | 23 (4.4%) |
| 18 to 19 Year Olds | 233 (88.6%) | 30 (11.4%) |
| 20 to 24 Year Olds | 251 (91.3%) | 24 (8.7%) |
| 25 to 34 Year Olds | 166 (72.2%) | 64 (27.8%) |
| 35 Years and over | 99 (77.3%) | 29 (22.7%) |
| Total | 3,404 (88.1%) | 460 (11.9%) |
Educational Attainment by Field of Study in Scottsbluff
Education (681 | 24.4%), business (586 | 21.0%), science & technology (348 | 12.5%), arts & humanities (248 | 8.9%), and bio, nature & agricultural (174 | 6.2%) are the most common fields of study among 2,791 individuals in Scottsbluff who have obtained a bachelor's degree or higher.
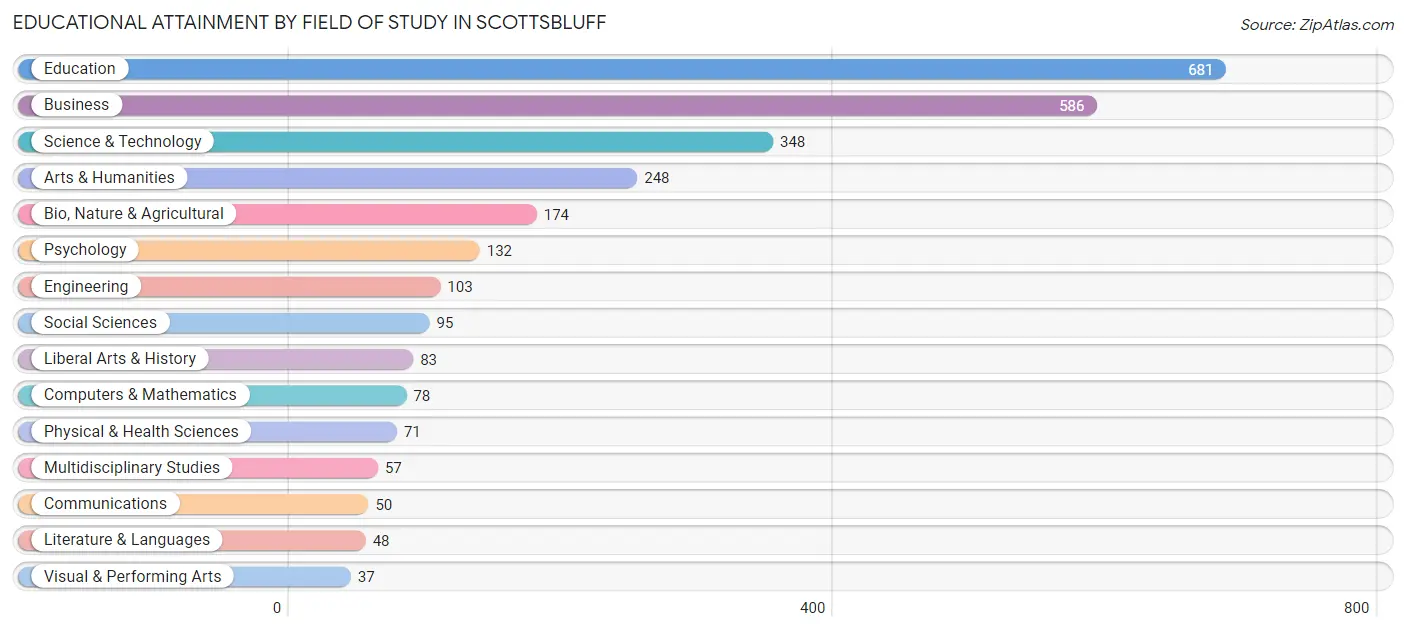
| Field of Study | # Graduates | % Graduates |
| Computers & Mathematics | 78 | 2.8% |
| Bio, Nature & Agricultural | 174 | 6.2% |
| Physical & Health Sciences | 71 | 2.5% |
| Psychology | 132 | 4.7% |
| Social Sciences | 95 | 3.4% |
| Engineering | 103 | 3.7% |
| Multidisciplinary Studies | 57 | 2.0% |
| Science & Technology | 348 | 12.5% |
| Business | 586 | 21.0% |
| Education | 681 | 24.4% |
| Literature & Languages | 48 | 1.7% |
| Liberal Arts & History | 83 | 3.0% |
| Visual & Performing Arts | 37 | 1.3% |
| Communications | 50 | 1.8% |
| Arts & Humanities | 248 | 8.9% |
| Total | 2,791 | 100.0% |
Transportation & Commute in Scottsbluff
Vehicle Availability by Sex in Scottsbluff
The most prevalent vehicle ownership categories in Scottsbluff are males with 2 vehicles (1,648, accounting for 47.6%) and females with 2 vehicles (1,422, making up 49.1%).
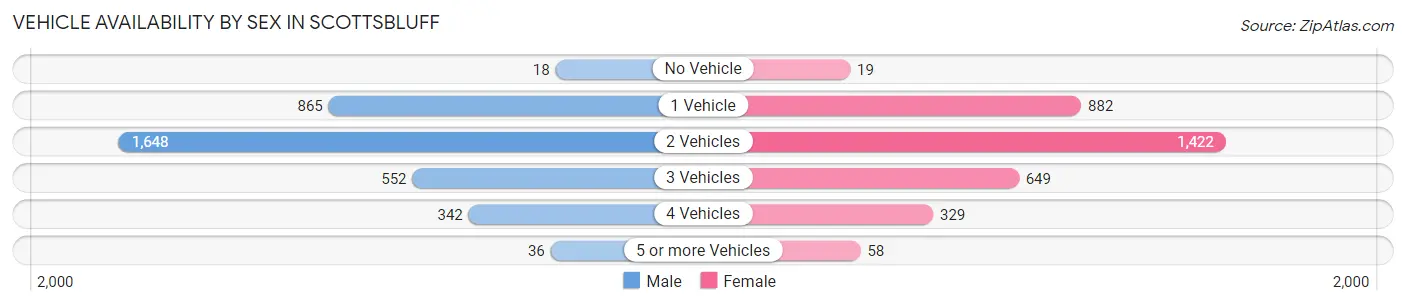
| Vehicles Available | Male | Female |
| No Vehicle | 18 (0.5%) | 19 (0.6%) |
| 1 Vehicle | 865 (25.0%) | 882 (26.3%) |
| 2 Vehicles | 1,648 (47.6%) | 1,422 (42.3%) |
| 3 Vehicles | 552 (16.0%) | 649 (19.3%) |
| 4 Vehicles | 342 (9.9%) | 329 (9.8%) |
| 5 or more Vehicles | 36 (1.0%) | 58 (1.7%) |
| Total | 3,461 (100.0%) | 3,359 (100.0%) |
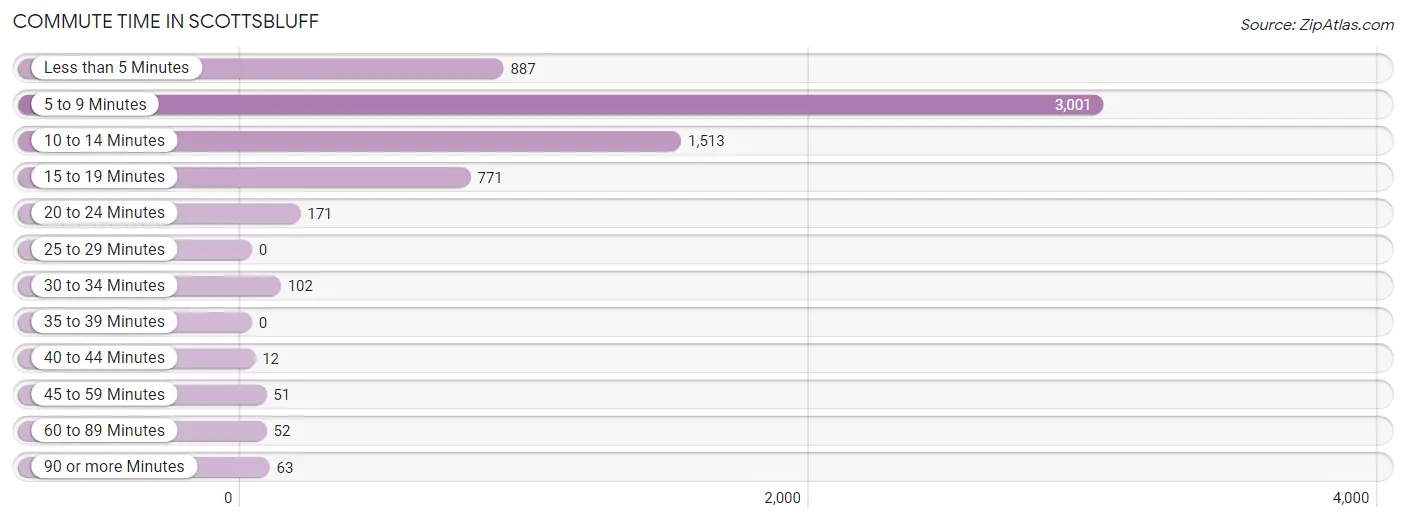
Commute Time in Scottsbluff
The most frequently occuring commute durations in Scottsbluff are 5 to 9 minutes (3,001 commuters, 45.3%), 10 to 14 minutes (1,513 commuters, 22.8%), and less than 5 minutes (887 commuters, 13.4%).
| Commute Time | # Commuters | % Commuters |
| Less than 5 Minutes | 887 | 13.4% |
| 5 to 9 Minutes | 3,001 | 45.3% |
| 10 to 14 Minutes | 1,513 | 22.8% |
| 15 to 19 Minutes | 771 | 11.6% |
| 20 to 24 Minutes | 171 | 2.6% |
| 25 to 29 Minutes | 0 | 0.0% |
| 30 to 34 Minutes | 102 | 1.5% |
| 35 to 39 Minutes | 0 | 0.0% |
| 40 to 44 Minutes | 12 | 0.2% |
| 45 to 59 Minutes | 51 | 0.8% |
| 60 to 89 Minutes | 52 | 0.8% |
| 90 or more Minutes | 63 | 0.9% |
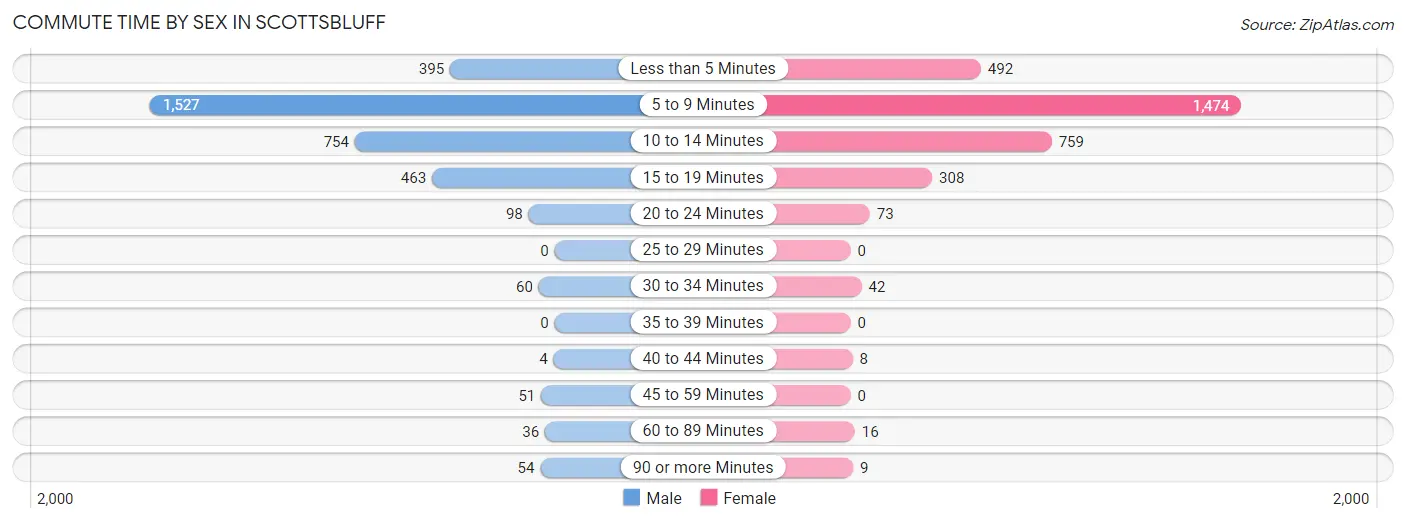
Commute Time by Sex in Scottsbluff
The most common commute times in Scottsbluff are 5 to 9 minutes (1,527 commuters, 44.4%) for males and 5 to 9 minutes (1,474 commuters, 46.3%) for females.
| Commute Time | Male | Female |
| Less than 5 Minutes | 395 (11.5%) | 492 (15.5%) |
| 5 to 9 Minutes | 1,527 (44.4%) | 1,474 (46.3%) |
| 10 to 14 Minutes | 754 (21.9%) | 759 (23.9%) |
| 15 to 19 Minutes | 463 (13.5%) | 308 (9.7%) |
| 20 to 24 Minutes | 98 (2.9%) | 73 (2.3%) |
| 25 to 29 Minutes | 0 (0.0%) | 0 (0.0%) |
| 30 to 34 Minutes | 60 (1.7%) | 42 (1.3%) |
| 35 to 39 Minutes | 0 (0.0%) | 0 (0.0%) |
| 40 to 44 Minutes | 4 (0.1%) | 8 (0.3%) |
| 45 to 59 Minutes | 51 (1.5%) | 0 (0.0%) |
| 60 to 89 Minutes | 36 (1.1%) | 16 (0.5%) |
| 90 or more Minutes | 54 (1.6%) | 9 (0.3%) |
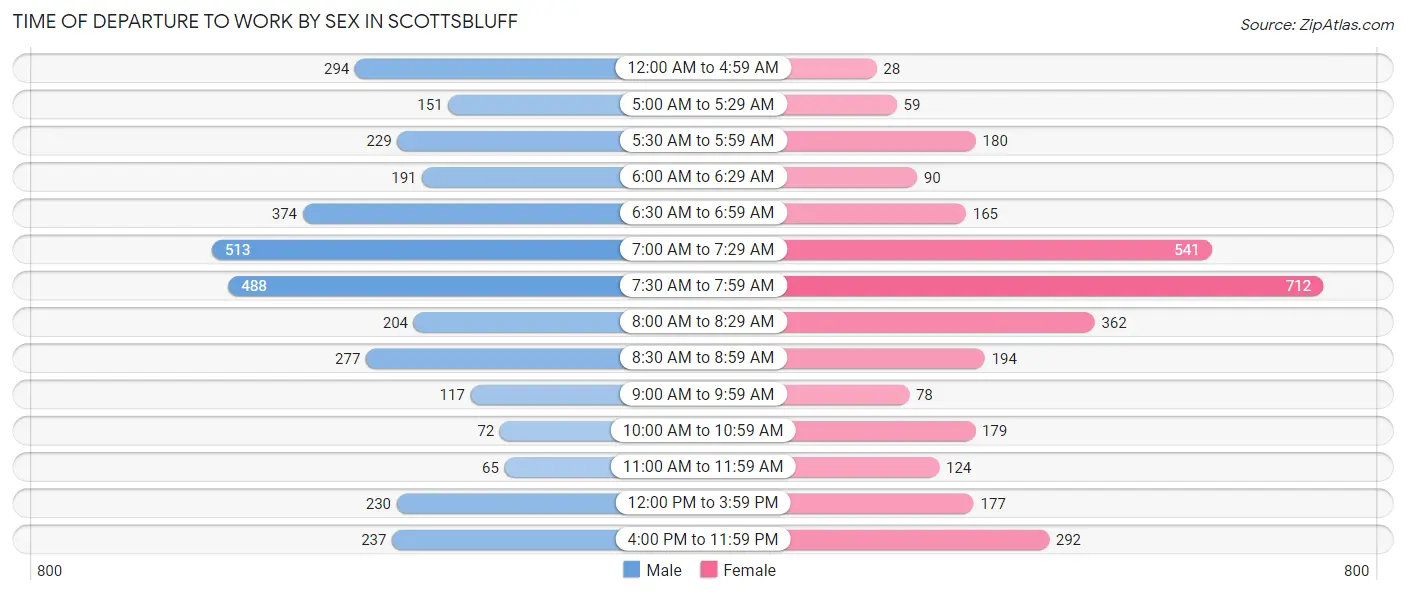
Time of Departure to Work by Sex in Scottsbluff
The most frequent times of departure to work in Scottsbluff are 7:00 AM to 7:29 AM (513, 14.9%) for males and 7:30 AM to 7:59 AM (712, 22.4%) for females.
| Time of Departure | Male | Female |
| 12:00 AM to 4:59 AM | 294 (8.5%) | 28 (0.9%) |
| 5:00 AM to 5:29 AM | 151 (4.4%) | 59 (1.8%) |
| 5:30 AM to 5:59 AM | 229 (6.7%) | 180 (5.7%) |
| 6:00 AM to 6:29 AM | 191 (5.6%) | 90 (2.8%) |
| 6:30 AM to 6:59 AM | 374 (10.9%) | 165 (5.2%) |
| 7:00 AM to 7:29 AM | 513 (14.9%) | 541 (17.0%) |
| 7:30 AM to 7:59 AM | 488 (14.2%) | 712 (22.4%) |
| 8:00 AM to 8:29 AM | 204 (5.9%) | 362 (11.4%) |
| 8:30 AM to 8:59 AM | 277 (8.1%) | 194 (6.1%) |
| 9:00 AM to 9:59 AM | 117 (3.4%) | 78 (2.5%) |
| 10:00 AM to 10:59 AM | 72 (2.1%) | 179 (5.6%) |
| 11:00 AM to 11:59 AM | 65 (1.9%) | 124 (3.9%) |
| 12:00 PM to 3:59 PM | 230 (6.7%) | 177 (5.6%) |
| 4:00 PM to 11:59 PM | 237 (6.9%) | 292 (9.2%) |
| Total | 3,442 (100.0%) | 3,181 (100.0%) |
Housing Occupancy in Scottsbluff
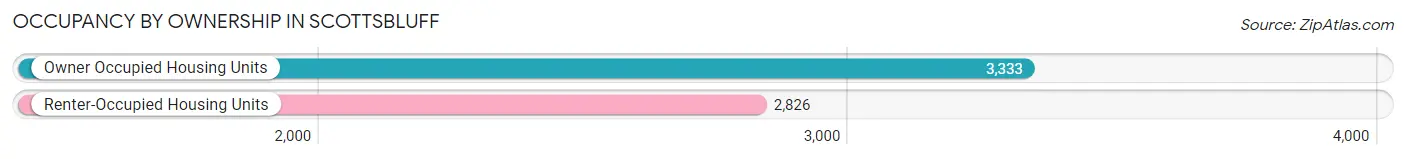
Occupancy by Ownership in Scottsbluff
Of the total 6,159 dwellings in Scottsbluff, owner-occupied units account for 3,333 (54.1%), while renter-occupied units make up 2,826 (45.9%).
| Occupancy | # Housing Units | % Housing Units |
| Owner Occupied Housing Units | 3,333 | 54.1% |
| Renter-Occupied Housing Units | 2,826 | 45.9% |
| Total Occupied Housing Units | 6,159 | 100.0% |
Occupancy by Household Size in Scottsbluff
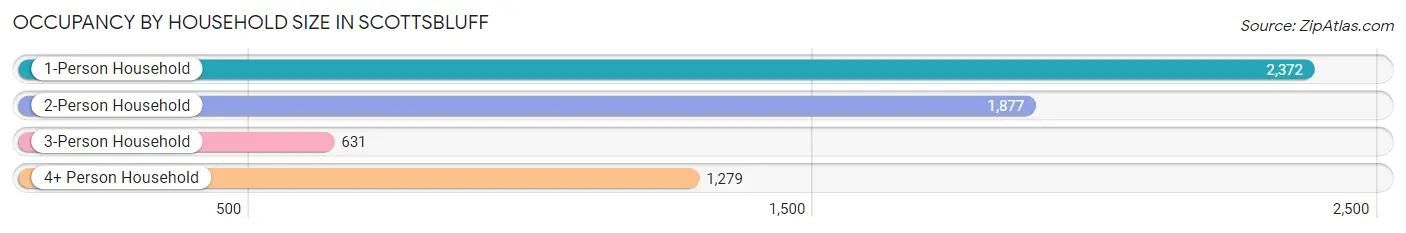
| Household Size | # Housing Units | % Housing Units |
| 1-Person Household | 2,372 | 38.5% |
| 2-Person Household | 1,877 | 30.5% |
| 3-Person Household | 631 | 10.2% |
| 4+ Person Household | 1,279 | 20.8% |
| Total Housing Units | 6,159 | 100.0% |
Occupancy by Ownership by Household Size in Scottsbluff
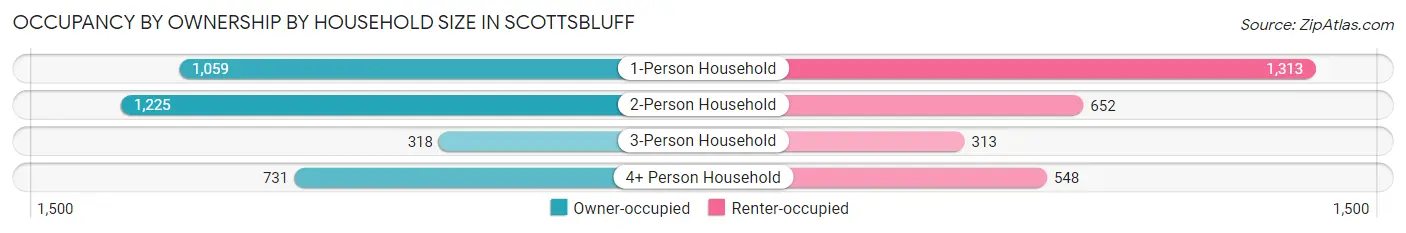
| Household Size | Owner-occupied | Renter-occupied |
| 1-Person Household | 1,059 (44.7%) | 1,313 (55.3%) |
| 2-Person Household | 1,225 (65.3%) | 652 (34.7%) |
| 3-Person Household | 318 (50.4%) | 313 (49.6%) |
| 4+ Person Household | 731 (57.2%) | 548 (42.8%) |
| Total Housing Units | 3,333 (54.1%) | 2,826 (45.9%) |
Occupancy by Educational Attainment in Scottsbluff
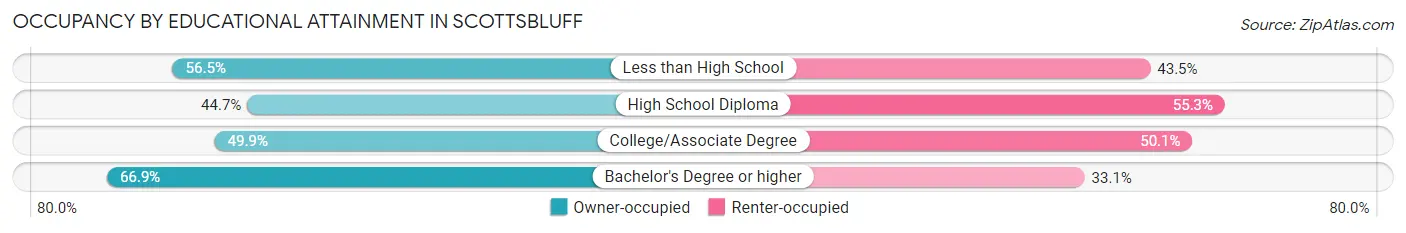
| Household Size | Owner-occupied | Renter-occupied |
| Less than High School | 317 (56.5%) | 244 (43.5%) |
| High School Diploma | 628 (44.7%) | 777 (55.3%) |
| College/Associate Degree | 1,222 (49.9%) | 1,229 (50.1%) |
| Bachelor's Degree or higher | 1,166 (66.9%) | 576 (33.1%) |
Occupancy by Age of Householder in Scottsbluff
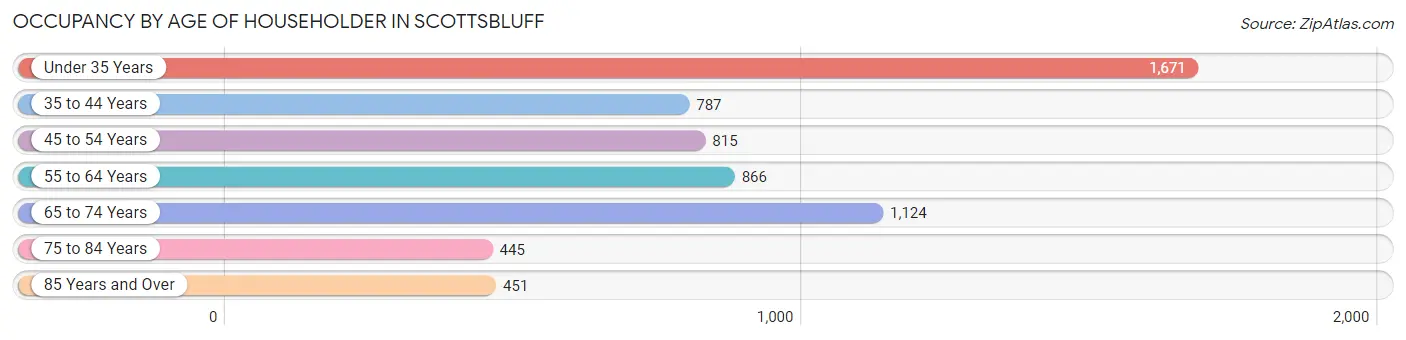
| Age Bracket | # Households | % Households |
| Under 35 Years | 1,671 | 27.1% |
| 35 to 44 Years | 787 | 12.8% |
| 45 to 54 Years | 815 | 13.2% |
| 55 to 64 Years | 866 | 14.1% |
| 65 to 74 Years | 1,124 | 18.2% |
| 75 to 84 Years | 445 | 7.2% |
| 85 Years and Over | 451 | 7.3% |
| Total | 6,159 | 100.0% |
Housing Finances in Scottsbluff
Median Income by Occupancy in Scottsbluff
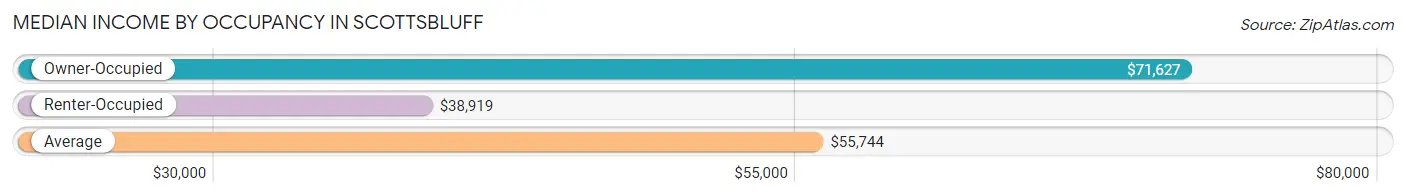
| Occupancy Type | # Households | Median Income |
| Owner-Occupied | 3,333 (54.1%) | $71,627 |
| Renter-Occupied | 2,826 (45.9%) | $38,919 |
| Average | 6,159 (100.0%) | $55,744 |
Occupancy by Householder Income Bracket in Scottsbluff
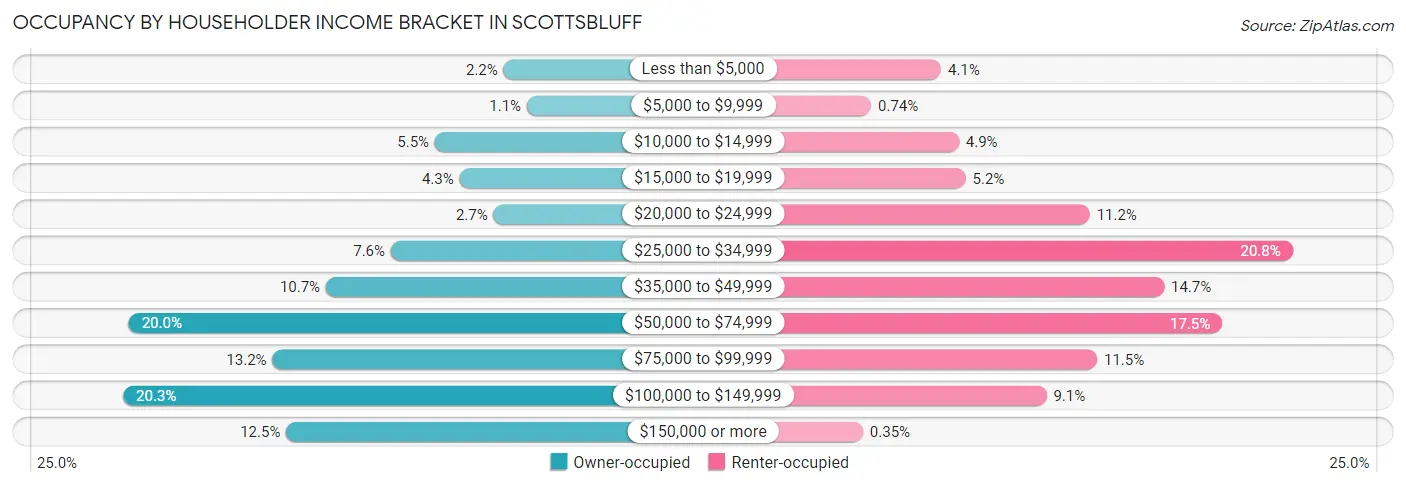
| Income Bracket | Owner-occupied | Renter-occupied |
| Less than $5,000 | 73 (2.2%) | 115 (4.1%) |
| $5,000 to $9,999 | 36 (1.1%) | 21 (0.7%) |
| $10,000 to $14,999 | 182 (5.5%) | 139 (4.9%) |
| $15,000 to $19,999 | 143 (4.3%) | 148 (5.2%) |
| $20,000 to $24,999 | 89 (2.7%) | 315 (11.2%) |
| $25,000 to $34,999 | 252 (7.6%) | 588 (20.8%) |
| $35,000 to $49,999 | 355 (10.6%) | 415 (14.7%) |
| $50,000 to $74,999 | 668 (20.0%) | 493 (17.4%) |
| $75,000 to $99,999 | 440 (13.2%) | 325 (11.5%) |
| $100,000 to $149,999 | 677 (20.3%) | 257 (9.1%) |
| $150,000 or more | 418 (12.5%) | 10 (0.4%) |
| Total | 3,333 (100.0%) | 2,826 (100.0%) |
Monthly Housing Cost Tiers in Scottsbluff
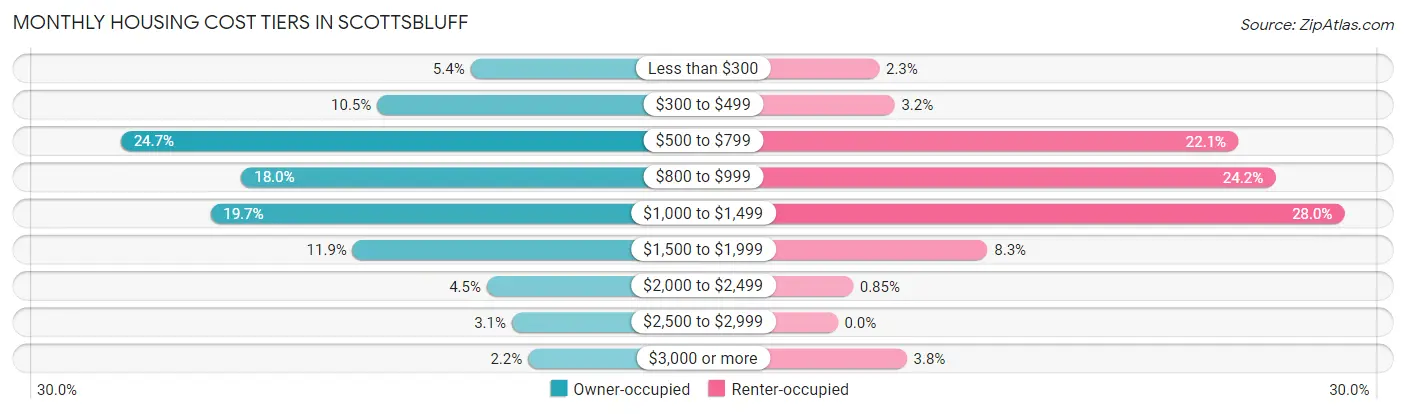
| Monthly Cost | Owner-occupied | Renter-occupied |
| Less than $300 | 179 (5.4%) | 65 (2.3%) |
| $300 to $499 | 351 (10.5%) | 89 (3.2%) |
| $500 to $799 | 823 (24.7%) | 625 (22.1%) |
| $800 to $999 | 601 (18.0%) | 683 (24.2%) |
| $1,000 to $1,499 | 658 (19.7%) | 791 (28.0%) |
| $1,500 to $1,999 | 396 (11.9%) | 234 (8.3%) |
| $2,000 to $2,499 | 149 (4.5%) | 24 (0.9%) |
| $2,500 to $2,999 | 103 (3.1%) | 0 (0.0%) |
| $3,000 or more | 73 (2.2%) | 108 (3.8%) |
| Total | 3,333 (100.0%) | 2,826 (100.0%) |
Physical Housing Characteristics in Scottsbluff
Housing Structures in Scottsbluff
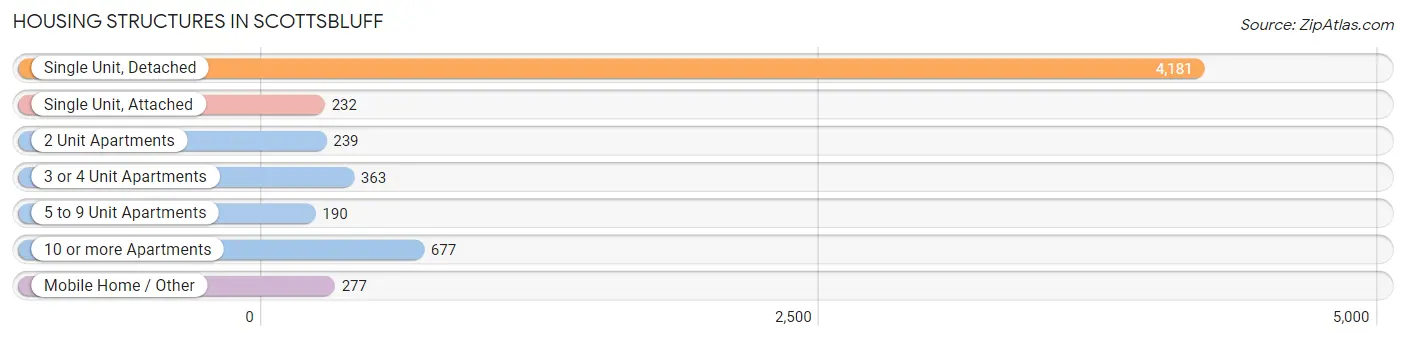
| Structure Type | # Housing Units | % Housing Units |
| Single Unit, Detached | 4,181 | 67.9% |
| Single Unit, Attached | 232 | 3.8% |
| 2 Unit Apartments | 239 | 3.9% |
| 3 or 4 Unit Apartments | 363 | 5.9% |
| 5 to 9 Unit Apartments | 190 | 3.1% |
| 10 or more Apartments | 677 | 11.0% |
| Mobile Home / Other | 277 | 4.5% |
| Total | 6,159 | 100.0% |
Housing Structures by Occupancy in Scottsbluff
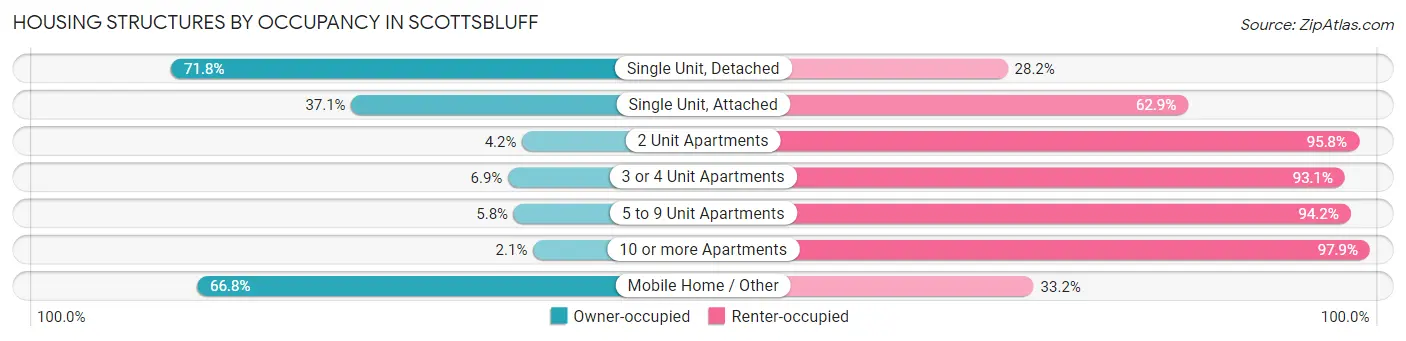
| Structure Type | Owner-occupied | Renter-occupied |
| Single Unit, Detached | 3,002 (71.8%) | 1,179 (28.2%) |
| Single Unit, Attached | 86 (37.1%) | 146 (62.9%) |
| 2 Unit Apartments | 10 (4.2%) | 229 (95.8%) |
| 3 or 4 Unit Apartments | 25 (6.9%) | 338 (93.1%) |
| 5 to 9 Unit Apartments | 11 (5.8%) | 179 (94.2%) |
| 10 or more Apartments | 14 (2.1%) | 663 (97.9%) |
| Mobile Home / Other | 185 (66.8%) | 92 (33.2%) |
| Total | 3,333 (54.1%) | 2,826 (45.9%) |
Housing Structures by Number of Rooms in Scottsbluff
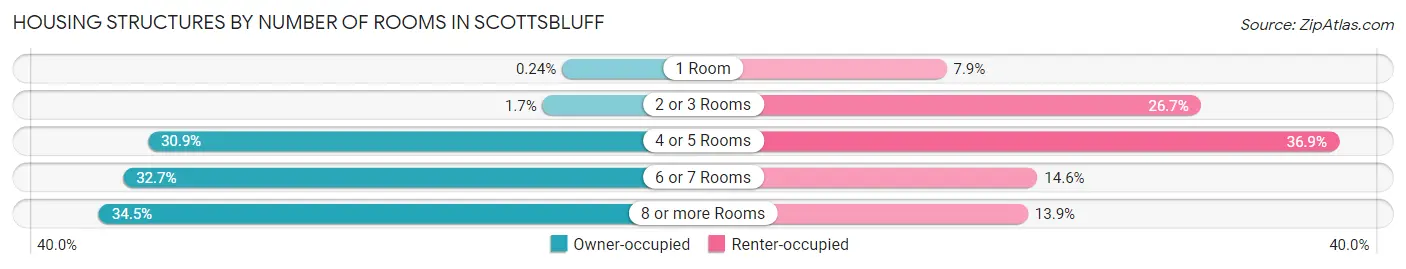
| Number of Rooms | Owner-occupied | Renter-occupied |
| 1 Room | 8 (0.2%) | 223 (7.9%) |
| 2 or 3 Rooms | 56 (1.7%) | 754 (26.7%) |
| 4 or 5 Rooms | 1,029 (30.9%) | 1,043 (36.9%) |
| 6 or 7 Rooms | 1,090 (32.7%) | 413 (14.6%) |
| 8 or more Rooms | 1,150 (34.5%) | 393 (13.9%) |
| Total | 3,333 (100.0%) | 2,826 (100.0%) |
Housing Structure by Heating Type in Scottsbluff
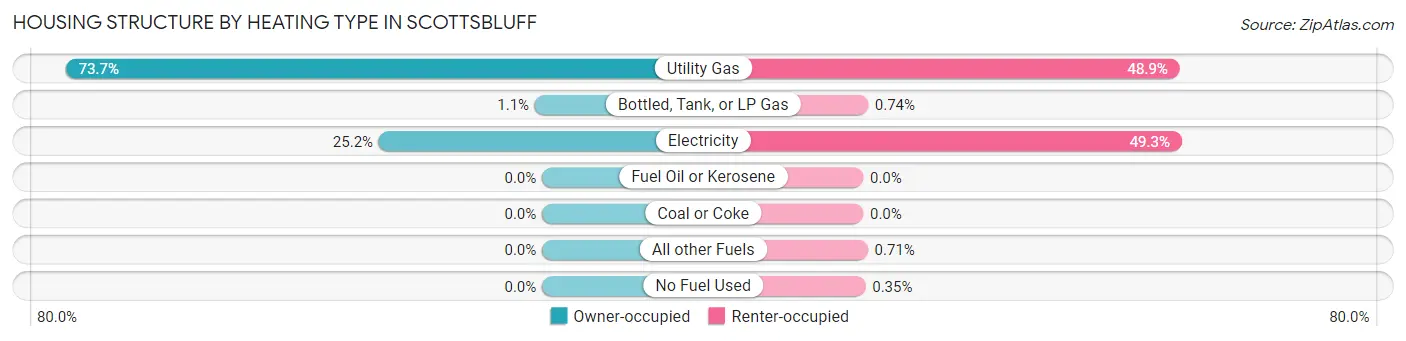
| Heating Type | Owner-occupied | Renter-occupied |
| Utility Gas | 2,455 (73.7%) | 1,383 (48.9%) |
| Bottled, Tank, or LP Gas | 37 (1.1%) | 21 (0.7%) |
| Electricity | 841 (25.2%) | 1,392 (49.3%) |
| Fuel Oil or Kerosene | 0 (0.0%) | 0 (0.0%) |
| Coal or Coke | 0 (0.0%) | 0 (0.0%) |
| All other Fuels | 0 (0.0%) | 20 (0.7%) |
| No Fuel Used | 0 (0.0%) | 10 (0.4%) |
| Total | 3,333 (100.0%) | 2,826 (100.0%) |
Household Vehicle Usage in Scottsbluff
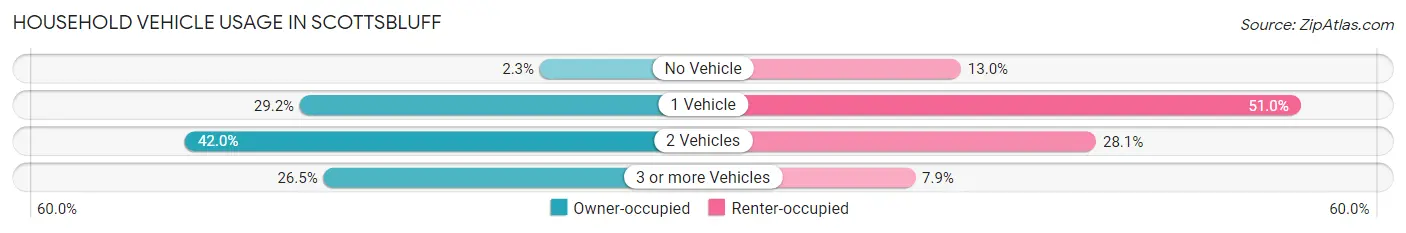
| Vehicles per Household | Owner-occupied | Renter-occupied |
| No Vehicle | 76 (2.3%) | 367 (13.0%) |
| 1 Vehicle | 972 (29.2%) | 1,442 (51.0%) |
| 2 Vehicles | 1,401 (42.0%) | 795 (28.1%) |
| 3 or more Vehicles | 884 (26.5%) | 222 (7.9%) |
| Total | 3,333 (100.0%) | 2,826 (100.0%) |
Real Estate & Mortgages in Scottsbluff
Real Estate and Mortgage Overview in Scottsbluff
| Characteristic | Without Mortgage | With Mortgage |
| Housing Units | 1,577 | 1,756 |
| Median Property Value | $129,400 | $133,400 |
| Median Household Income | $50,592 | $308 |
| Monthly Housing Costs | $590 | $73 |
| Real Estate Taxes | $2,254 | $44 |
Property Value by Mortgage Status in Scottsbluff
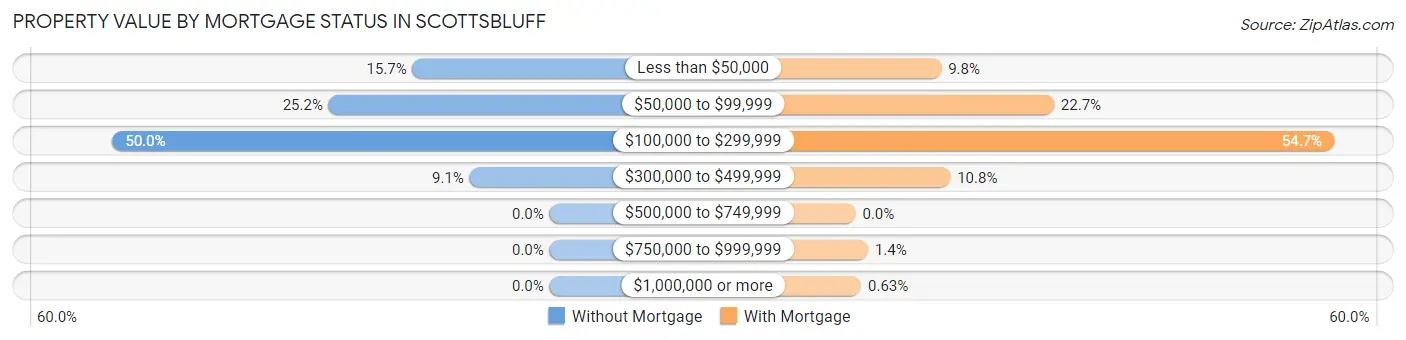
| Property Value | Without Mortgage | With Mortgage |
| Less than $50,000 | 247 (15.7%) | 172 (9.8%) |
| $50,000 to $99,999 | 398 (25.2%) | 398 (22.7%) |
| $100,000 to $299,999 | 788 (50.0%) | 960 (54.7%) |
| $300,000 to $499,999 | 144 (9.1%) | 190 (10.8%) |
| $500,000 to $749,999 | 0 (0.0%) | 0 (0.0%) |
| $750,000 to $999,999 | 0 (0.0%) | 25 (1.4%) |
| $1,000,000 or more | 0 (0.0%) | 11 (0.6%) |
| Total | 1,577 (100.0%) | 1,756 (100.0%) |
Household Income by Mortgage Status in Scottsbluff
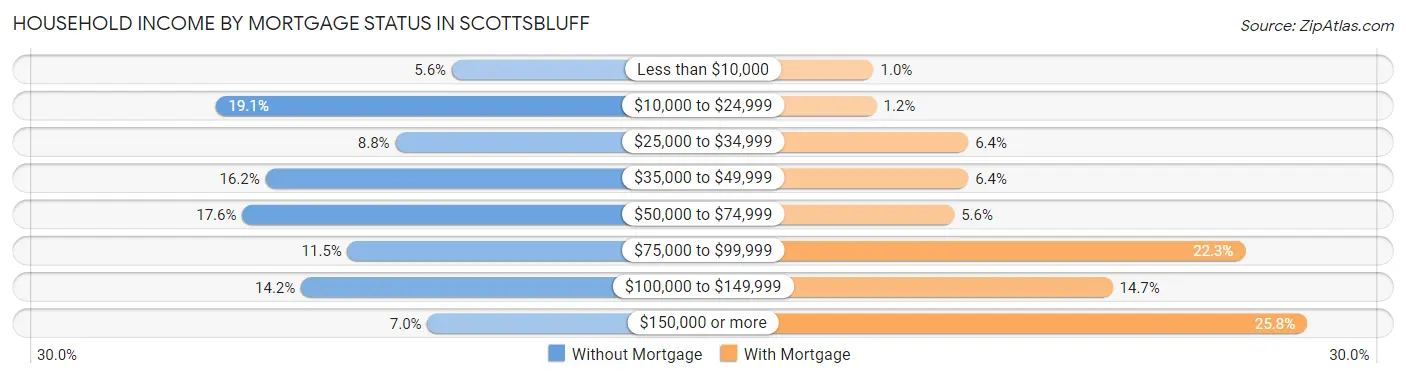
| Household Income | Without Mortgage | With Mortgage |
| Less than $10,000 | 88 (5.6%) | 18 (1.0%) |
| $10,000 to $24,999 | 301 (19.1%) | 21 (1.2%) |
| $25,000 to $34,999 | 139 (8.8%) | 113 (6.4%) |
| $35,000 to $49,999 | 256 (16.2%) | 113 (6.4%) |
| $50,000 to $74,999 | 277 (17.6%) | 99 (5.6%) |
| $75,000 to $99,999 | 182 (11.5%) | 391 (22.3%) |
| $100,000 to $149,999 | 224 (14.2%) | 258 (14.7%) |
| $150,000 or more | 110 (7.0%) | 453 (25.8%) |
| Total | 1,577 (100.0%) | 1,756 (100.0%) |
Property Value to Household Income Ratio in Scottsbluff
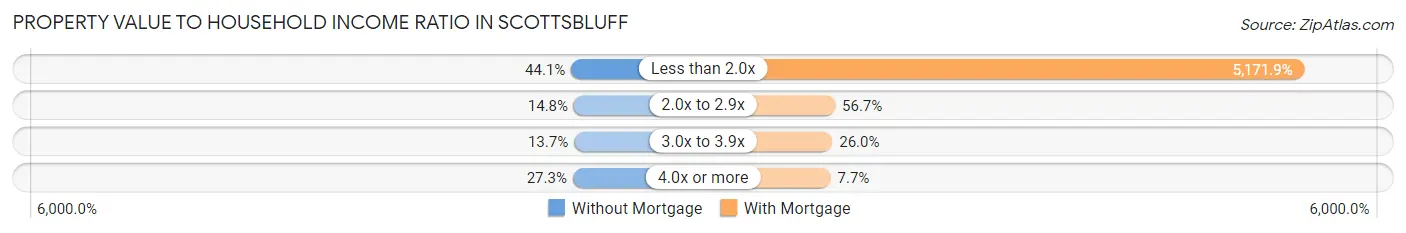
| Value-to-Income Ratio | Without Mortgage | With Mortgage |
| Less than 2.0x | 696 (44.1%) | 90,818 (5,171.9%) |
| 2.0x to 2.9x | 234 (14.8%) | 996 (56.7%) |
| 3.0x to 3.9x | 216 (13.7%) | 457 (26.0%) |
| 4.0x or more | 431 (27.3%) | 136 (7.7%) |
| Total | 1,577 (100.0%) | 1,756 (100.0%) |
Real Estate Taxes by Mortgage Status in Scottsbluff
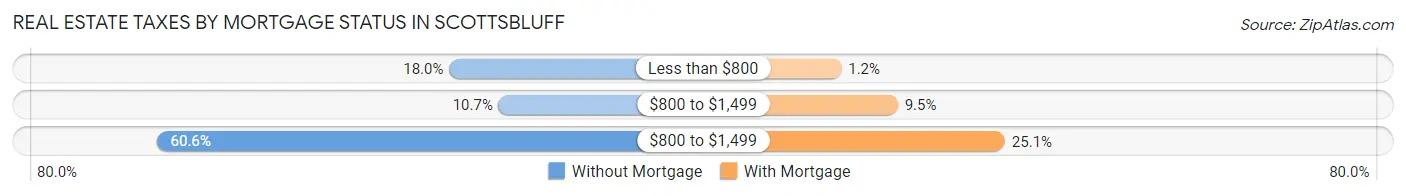
| Property Taxes | Without Mortgage | With Mortgage |
| Less than $800 | 283 (17.9%) | 21 (1.2%) |
| $800 to $1,499 | 169 (10.7%) | 166 (9.5%) |
| $800 to $1,499 | 955 (60.6%) | 441 (25.1%) |
| Total | 1,577 (100.0%) | 1,756 (100.0%) |
Health & Disability in Scottsbluff
Health Insurance Coverage by Age in Scottsbluff
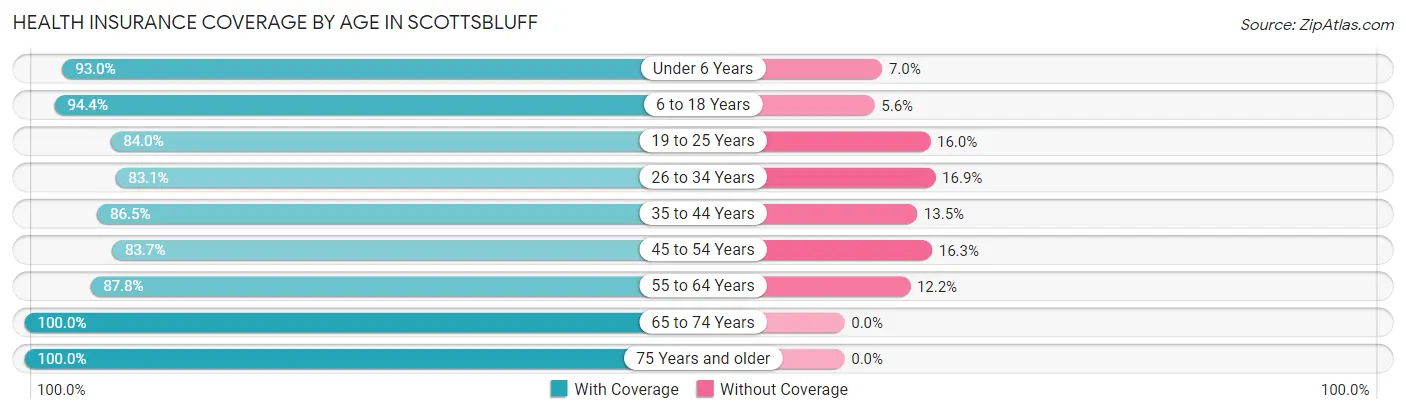
| Age Bracket | With Coverage | Without Coverage |
| Under 6 Years | 1,045 (93.0%) | 79 (7.0%) |
| 6 to 18 Years | 2,628 (94.4%) | 156 (5.6%) |
| 19 to 25 Years | 1,072 (84.0%) | 204 (16.0%) |
| 26 to 34 Years | 1,593 (83.1%) | 325 (16.9%) |
| 35 to 44 Years | 1,309 (86.5%) | 205 (13.5%) |
| 45 to 54 Years | 1,159 (83.7%) | 226 (16.3%) |
| 55 to 64 Years | 1,226 (87.8%) | 171 (12.2%) |
| 65 to 74 Years | 1,713 (100.0%) | 0 (0.0%) |
| 75 Years and older | 1,148 (100.0%) | 0 (0.0%) |
| Total | 12,893 (90.4%) | 1,366 (9.6%) |
Health Insurance Coverage by Citizenship Status in Scottsbluff
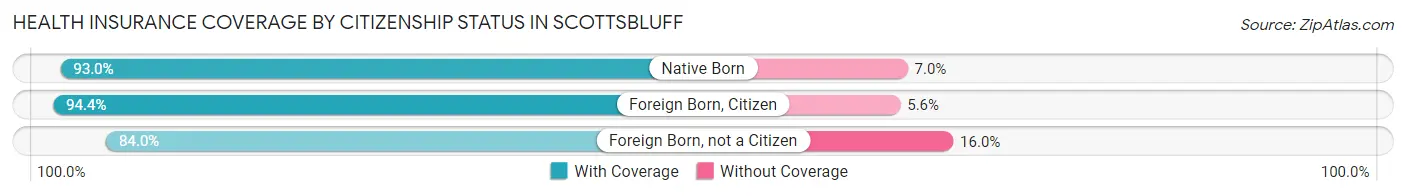
| Citizenship Status | With Coverage | Without Coverage |
| Native Born | 1,045 (93.0%) | 79 (7.0%) |
| Foreign Born, Citizen | 2,628 (94.4%) | 156 (5.6%) |
| Foreign Born, not a Citizen | 1,072 (84.0%) | 204 (16.0%) |
Health Insurance Coverage by Household Income in Scottsbluff
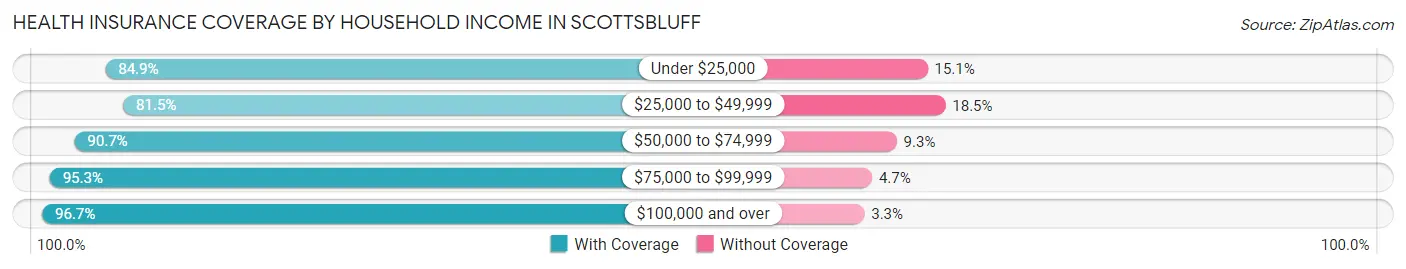
| Household Income | With Coverage | Without Coverage |
| Under $25,000 | 1,644 (84.9%) | 293 (15.1%) |
| $25,000 to $49,999 | 2,454 (81.5%) | 556 (18.5%) |
| $50,000 to $74,999 | 2,377 (90.7%) | 245 (9.3%) |
| $75,000 to $99,999 | 1,883 (95.3%) | 93 (4.7%) |
| $100,000 and over | 4,392 (96.7%) | 149 (3.3%) |
Public vs Private Health Insurance Coverage by Age in Scottsbluff
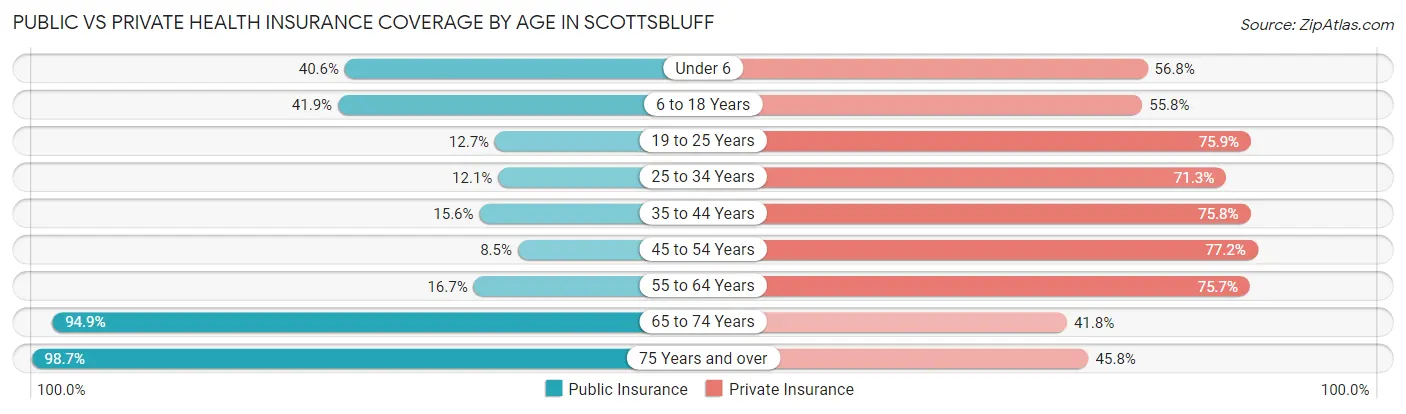
| Age Bracket | Public Insurance | Private Insurance |
| Under 6 | 456 (40.6%) | 638 (56.8%) |
| 6 to 18 Years | 1,165 (41.8%) | 1,553 (55.8%) |
| 19 to 25 Years | 162 (12.7%) | 969 (75.9%) |
| 25 to 34 Years | 232 (12.1%) | 1,368 (71.3%) |
| 35 to 44 Years | 236 (15.6%) | 1,148 (75.8%) |
| 45 to 54 Years | 117 (8.5%) | 1,069 (77.2%) |
| 55 to 64 Years | 233 (16.7%) | 1,058 (75.7%) |
| 65 to 74 Years | 1,625 (94.9%) | 716 (41.8%) |
| 75 Years and over | 1,133 (98.7%) | 526 (45.8%) |
| Total | 5,359 (37.6%) | 9,045 (63.4%) |
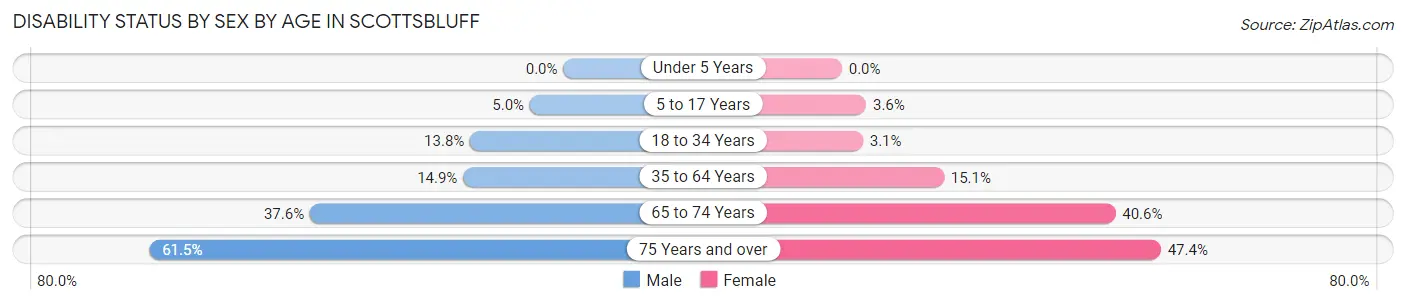
Disability Status by Sex by Age in Scottsbluff
| Age Bracket | Male | Female |
| Under 5 Years | 0 (0.0%) | 0 (0.0%) |
| 5 to 17 Years | 77 (5.0%) | 45 (3.6%) |
| 18 to 34 Years | 235 (13.8%) | 55 (3.1%) |
| 35 to 64 Years | 302 (14.9%) | 343 (15.1%) |
| 65 to 74 Years | 284 (37.6%) | 389 (40.6%) |
| 75 Years and over | 206 (61.5%) | 385 (47.4%) |
Disability Class by Sex by Age in Scottsbluff
Disability Class: Hearing Difficulty
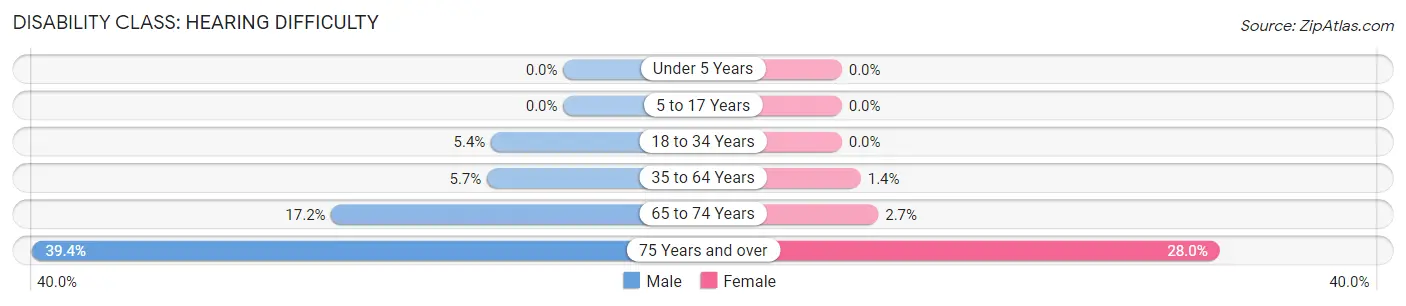
| Age Bracket | Male | Female |
| Under 5 Years | 0 (0.0%) | 0 (0.0%) |
| 5 to 17 Years | 0 (0.0%) | 0 (0.0%) |
| 18 to 34 Years | 91 (5.4%) | 0 (0.0%) |
| 35 to 64 Years | 115 (5.7%) | 32 (1.4%) |
| 65 to 74 Years | 130 (17.2%) | 26 (2.7%) |
| 75 Years and over | 132 (39.4%) | 228 (28.0%) |
Disability Class: Vision Difficulty
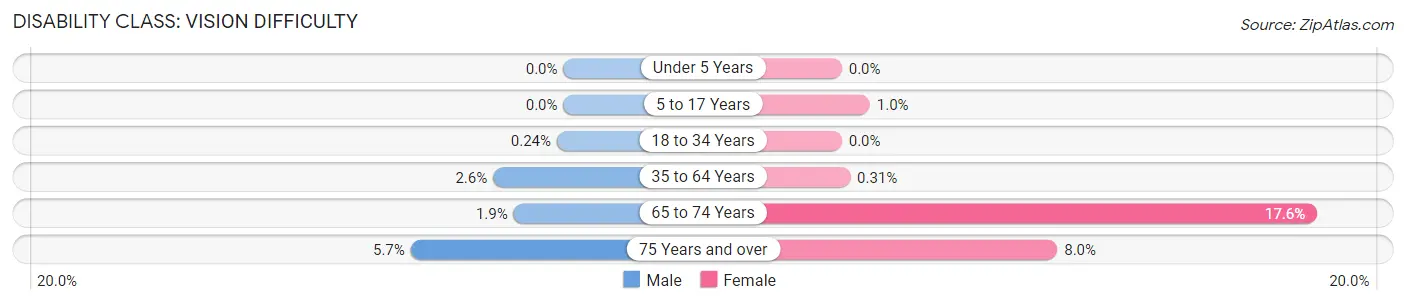
| Age Bracket | Male | Female |
| Under 5 Years | 0 (0.0%) | 0 (0.0%) |
| 5 to 17 Years | 0 (0.0%) | 13 (1.0%) |
| 18 to 34 Years | 4 (0.2%) | 0 (0.0%) |
| 35 to 64 Years | 53 (2.6%) | 7 (0.3%) |
| 65 to 74 Years | 14 (1.8%) | 169 (17.6%) |
| 75 Years and over | 19 (5.7%) | 65 (8.0%) |
Disability Class: Cognitive Difficulty
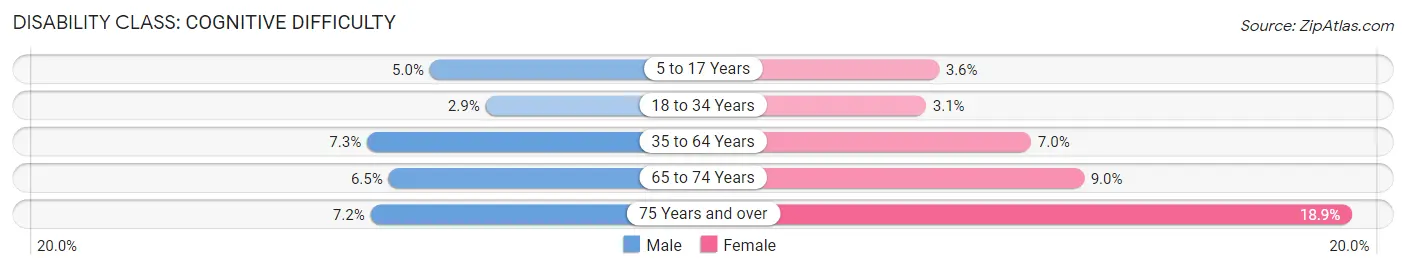
| Age Bracket | Male | Female |
| 5 to 17 Years | 77 (5.0%) | 45 (3.6%) |
| 18 to 34 Years | 49 (2.9%) | 55 (3.1%) |
| 35 to 64 Years | 148 (7.3%) | 159 (7.0%) |
| 65 to 74 Years | 49 (6.5%) | 86 (9.0%) |
| 75 Years and over | 24 (7.2%) | 154 (18.9%) |
Disability Class: Ambulatory Difficulty
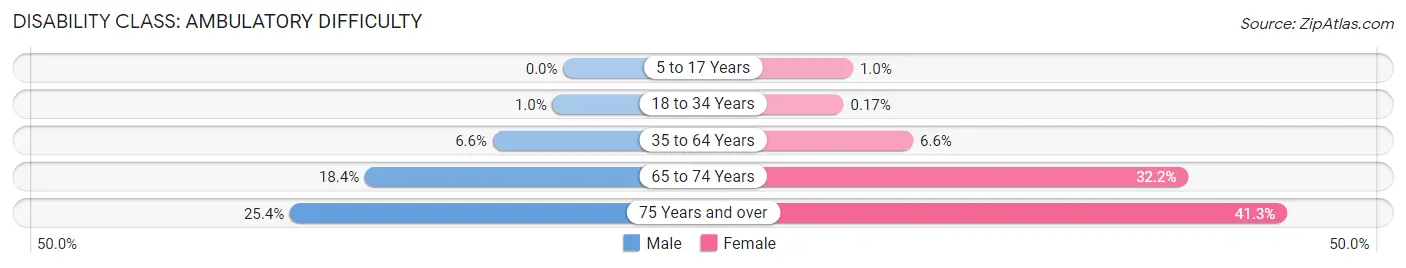
| Age Bracket | Male | Female |
| 5 to 17 Years | 0 (0.0%) | 13 (1.0%) |
| 18 to 34 Years | 17 (1.0%) | 3 (0.2%) |
| 35 to 64 Years | 133 (6.6%) | 150 (6.6%) |
| 65 to 74 Years | 139 (18.4%) | 308 (32.2%) |
| 75 Years and over | 85 (25.4%) | 336 (41.3%) |
Disability Class: Self-Care Difficulty
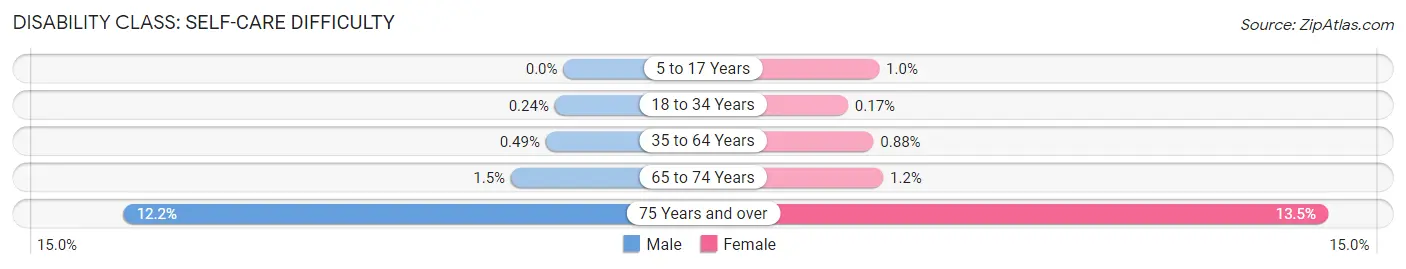
| Age Bracket | Male | Female |
| 5 to 17 Years | 0 (0.0%) | 13 (1.0%) |
| 18 to 34 Years | 4 (0.2%) | 3 (0.2%) |
| 35 to 64 Years | 10 (0.5%) | 20 (0.9%) |
| 65 to 74 Years | 11 (1.5%) | 11 (1.1%) |
| 75 Years and over | 41 (12.2%) | 110 (13.5%) |
Technology Access in Scottsbluff
Computing Device Access in Scottsbluff
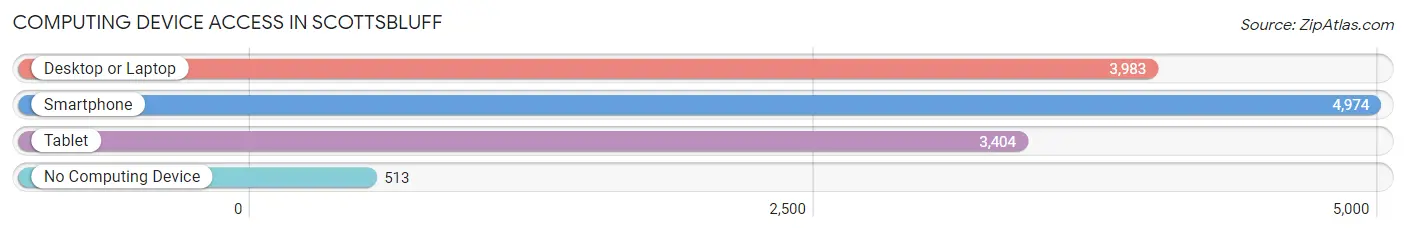
| Device Type | # Households | % Households |
| Desktop or Laptop | 3,983 | 64.7% |
| Smartphone | 4,974 | 80.8% |
| Tablet | 3,404 | 55.3% |
| No Computing Device | 513 | 8.3% |
| Total | 6,159 | 100.0% |
Internet Access in Scottsbluff
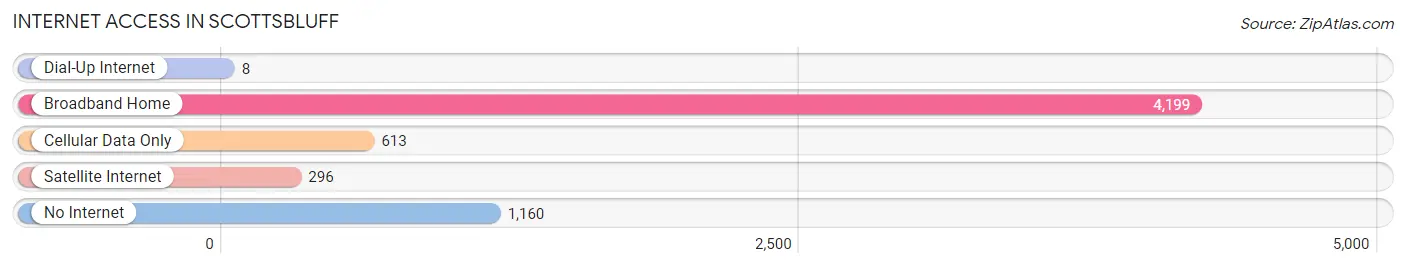
| Internet Type | # Households | % Households |
| Dial-Up Internet | 8 | 0.1% |
| Broadband Home | 4,199 | 68.2% |
| Cellular Data Only | 613 | 10.0% |
| Satellite Internet | 296 | 4.8% |
| No Internet | 1,160 | 18.8% |
| Total | 6,159 | 100.0% |
Scottsbluff Summary
Scottbluff, Nebraska is a city located in the western part of the state, in the panhandle region. It is the county seat of Scotts Bluff County and is the largest city in the county. The city is located on the North Platte River and is part of the Nebraska Panhandle. The city is home to a population of 15,039 people, according to the 2010 census.
History
The area that is now Scottsbluff was first inhabited by Native American tribes, including the Sioux, Cheyenne, and Arapaho. The first Europeans to explore the area were French fur traders in the late 1700s. The area was later explored by the Lewis and Clark Expedition in 1804.
In 1812, the first permanent settlement was established in the area by fur traders. The settlement was named after Hiram Scott, a fur trader who was killed by Native Americans in 1828. The settlement was later renamed Scottsbluff in 1887.
In the late 1800s, the area began to experience a population boom due to the construction of the Union Pacific Railroad. The railroad brought many new settlers to the area, and the population of Scottsbluff grew rapidly.
In the early 1900s, the city experienced a period of economic growth due to the development of the sugar beet industry. The city also became a major center for the cattle industry.
In the 1950s, the city experienced a period of growth due to the construction of the Gering-Fort Laramie Canal. The canal brought water to the area, which allowed for the development of agriculture and industry.
Geography
Scottsbluff is located in the western part of Nebraska, in the panhandle region. The city is located on the North Platte River and is part of the Nebraska Panhandle. The city is located at an elevation of 4,719 feet above sea level.
The city has a total area of 8.3 square miles, of which 8.2 square miles is land and 0.1 square miles is water. The city is located in a semi-arid climate, with hot summers and cold winters.
Economy
The economy of Scottsbluff is largely based on agriculture and industry. The city is home to several large agricultural companies, including Cargill, JBS, and Tyson Foods. The city is also home to several manufacturing companies, including ConAgra Foods, Cabela’s, and the Scottsbluff-Gering Industrial Park.
The city is also home to several retail stores, including Walmart, Target, and Kohl’s. The city is also home to several restaurants, including Applebee’s, Olive Garden, and Red Lobster.
Demographics
According to the 2010 census, the population of Scottsbluff was 15,039. The population is made up of a diverse mix of ethnicities, including White (83.2%), Hispanic or Latino (9.3%), African American (2.2%), and Native American (1.2%).
The median household income in Scottsbluff is $45,945, and the median family income is $54,945. The city has a poverty rate of 13.3%, which is higher than the national average. The city also has a high unemployment rate of 6.2%.
Conclusion
Scottsbluff, Nebraska is a city located in the western part of the state, in the panhandle region. The city is home to a population of 15,039 people, according to the 2010 census. The city has a diverse economy, with agriculture and industry being the main sources of employment. The city also has a diverse population, with a mix of ethnicities. The city has a median household income of $45,945 and a poverty rate of 13.3%.
Common Questions
What is the Total Population of Scottsbluff?
Total Population of Scottsbluff is 14,454.
What is the Total Male Population of Scottsbluff?
Total Male Population of Scottsbluff is 6,818.
What is the Total Female Population of Scottsbluff?
Total Female Population of Scottsbluff is 7,636.
What is the Ratio of Males per 100 Females in Scottsbluff?
There are 89.29 Males per 100 Females in Scottsbluff.
What is the Ratio of Females per 100 Males in Scottsbluff?
There are 112.00 Females per 100 Males in Scottsbluff.
What is the Median Population Age in Scottsbluff?
Median Population Age in Scottsbluff is 35.6 Years.
What is the Average Family Size in Scottsbluff
Average Family Size in Scottsbluff is 3.1 People.
What is the Average Household Size in Scottsbluff
Average Household Size in Scottsbluff is 2.3 People.
What is Per Capita Income in Scottsbluff?
Per Capita income in Scottsbluff is $31,472.
What is the Median Family Income in Scottsbluff?
Median Family Income in Scottsbluff is $73,000.
What is the Median Household income in Scottsbluff?
Median Household Income in Scottsbluff is $55,744.
What is Income or Wage Gap in Scottsbluff?
Income or Wage Gap in Scottsbluff is 23.6%.
Women in Scottsbluff earn 76.4 cents for every dollar earned by a man.
What is Family Income Deficit in Scottsbluff?
Family Income Deficit in Scottsbluff is $10,804.
Families that are below poverty line in Scottsbluff earn $10,804 less on average than the poverty threshold level.
What is Inequality or Gini Index in Scottsbluff?
Inequality or Gini Index in Scottsbluff is 0.43.
How Large is the Labor Force in Scottsbluff?
There are 7,213 People in the Labor Forcein in Scottsbluff.
What is the Percentage of People in the Labor Force in Scottsbluff?
65.0% of People are in the Labor Force in Scottsbluff.
What is the Unemployment Rate in Scottsbluff?
Unemployment Rate in Scottsbluff is 2.3%.