Villa Ridge, MO
Villa Ridge Map

Villa Ridge Overview
2,971
TOTAL POPULATION
1,604
MALE POPULATION
1,367
FEMALE POPULATION
117.34
MALES / 100 FEMALES
85.22
FEMALES / 100 MALES
35.0
MEDIAN AGE
3.2
AVG FAMILY SIZE
2.9
AVG HOUSEHOLD SIZE
$27,971
PER CAPITA INCOME
$86,225
AVG FAMILY INCOME
$71,750
AVG HOUSEHOLD INCOME
42.9%
WAGE / INCOME GAP [ % ]
57.1¢/ $1
WAGE / INCOME GAP [ $ ]
0.28
INEQUALITY / GINI INDEX
1,451
LABOR FORCE [ PEOPLE ]
63.4%
PERCENT IN LABOR FORCE
5.8%
UNEMPLOYMENT RATE
Villa Ridge Zip Codes
Villa Ridge Area Codes
Race in Villa Ridge
The most populous races in Villa Ridge are White / Caucasian (2,761 | 92.9%), Hispanic or Latino (110 | 3.7%), and Two or more Races (98 | 3.3%).

| Race | # Population | % Population |
| Asian | 10 | 0.3% |
| Black / African American | 27 | 0.9% |
| Hawaiian / Pacific | 0 | 0.0% |
| Hispanic or Latino | 110 | 3.7% |
| Native / Alaskan | 0 | 0.0% |
| White / Caucasian | 2,761 | 92.9% |
| Two or more Races | 98 | 3.3% |
| Some other Race | 75 | 2.5% |
| Total | 2,971 | 100.0% |
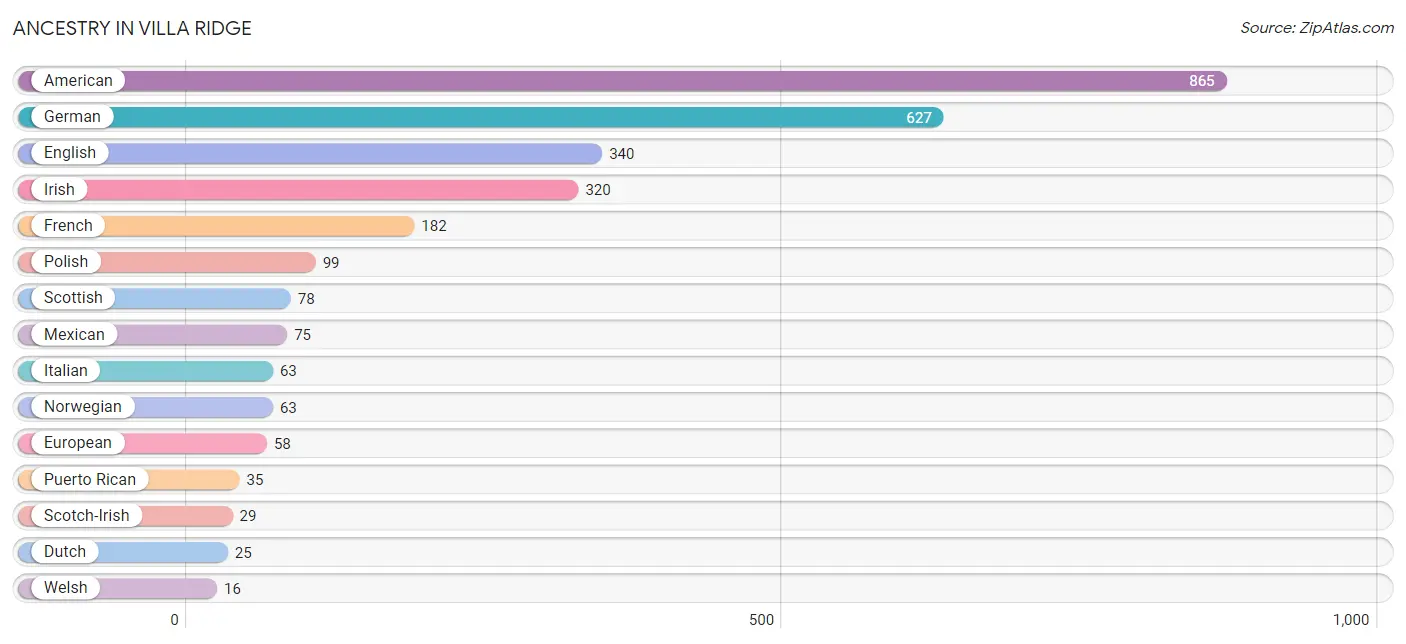
Ancestry in Villa Ridge
The most populous ancestries reported in Villa Ridge are American (865 | 29.1%), German (627 | 21.1%), English (340 | 11.4%), Irish (320 | 10.8%), and French (182 | 6.1%), together accounting for 78.6% of all Villa Ridge residents.
| Ancestry | # Population | % Population |
| American | 865 | 29.1% |
| Blackfeet | 9 | 0.3% |
| Chickasaw | 3 | 0.1% |
| Czech | 15 | 0.5% |
| Dutch | 25 | 0.8% |
| English | 340 | 11.4% |
| European | 58 | 1.9% |
| French | 182 | 6.1% |
| German | 627 | 21.1% |
| Irish | 320 | 10.8% |
| Italian | 63 | 2.1% |
| Korean | 10 | 0.3% |
| Mexican | 75 | 2.5% |
| Norwegian | 63 | 2.1% |
| Polish | 99 | 3.3% |
| Portuguese | 4 | 0.1% |
| Puerto Rican | 35 | 1.2% |
| Scotch-Irish | 29 | 1.0% |
| Scottish | 78 | 2.6% |
| Welsh | 16 | 0.5% | View All 20 Rows |
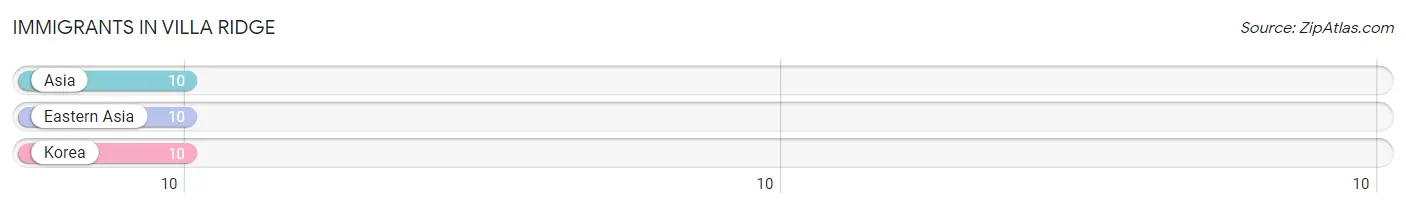
Immigrants in Villa Ridge
The most numerous immigrant groups reported in Villa Ridge came from Asia (10 | 0.3%), Eastern Asia (10 | 0.3%), and Korea (10 | 0.3%), together accounting for 1.0% of all Villa Ridge residents.
| Immigration Origin | # Population | % Population |
| Asia | 10 | 0.3% |
| Eastern Asia | 10 | 0.3% |
| Korea | 10 | 0.3% | View All 3 Rows |
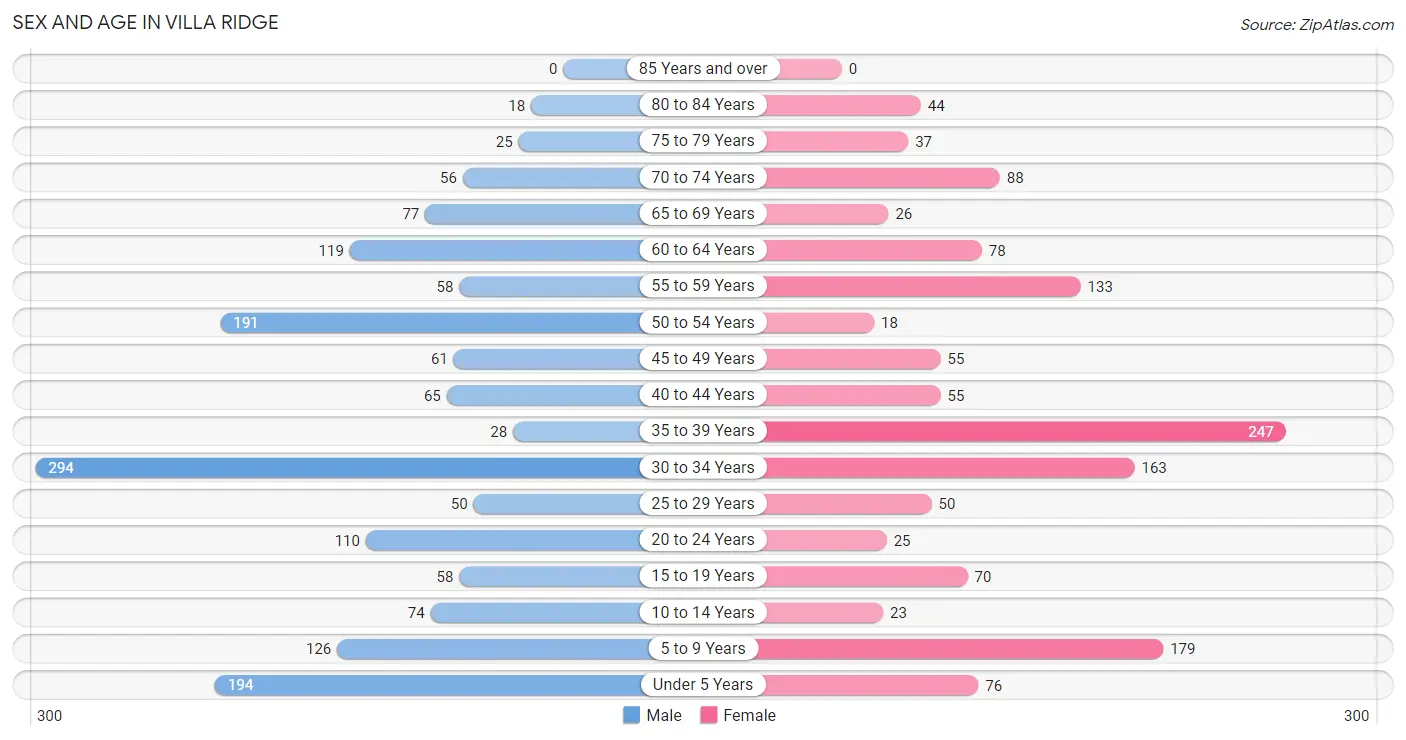
Sex and Age in Villa Ridge
Sex and Age in Villa Ridge
The most populous age groups in Villa Ridge are 30 to 34 Years (294 | 18.3%) for men and 35 to 39 Years (247 | 18.1%) for women.
| Age Bracket | Male | Female |
| Under 5 Years | 194 (12.1%) | 76 (5.6%) |
| 5 to 9 Years | 126 (7.9%) | 179 (13.1%) |
| 10 to 14 Years | 74 (4.6%) | 23 (1.7%) |
| 15 to 19 Years | 58 (3.6%) | 70 (5.1%) |
| 20 to 24 Years | 110 (6.9%) | 25 (1.8%) |
| 25 to 29 Years | 50 (3.1%) | 50 (3.7%) |
| 30 to 34 Years | 294 (18.3%) | 163 (11.9%) |
| 35 to 39 Years | 28 (1.8%) | 247 (18.1%) |
| 40 to 44 Years | 65 (4.1%) | 55 (4.0%) |
| 45 to 49 Years | 61 (3.8%) | 55 (4.0%) |
| 50 to 54 Years | 191 (11.9%) | 18 (1.3%) |
| 55 to 59 Years | 58 (3.6%) | 133 (9.7%) |
| 60 to 64 Years | 119 (7.4%) | 78 (5.7%) |
| 65 to 69 Years | 77 (4.8%) | 26 (1.9%) |
| 70 to 74 Years | 56 (3.5%) | 88 (6.4%) |
| 75 to 79 Years | 25 (1.6%) | 37 (2.7%) |
| 80 to 84 Years | 18 (1.1%) | 44 (3.2%) |
| 85 Years and over | 0 (0.0%) | 0 (0.0%) |
| Total | 1,604 (100.0%) | 1,367 (100.0%) |
Families and Households in Villa Ridge
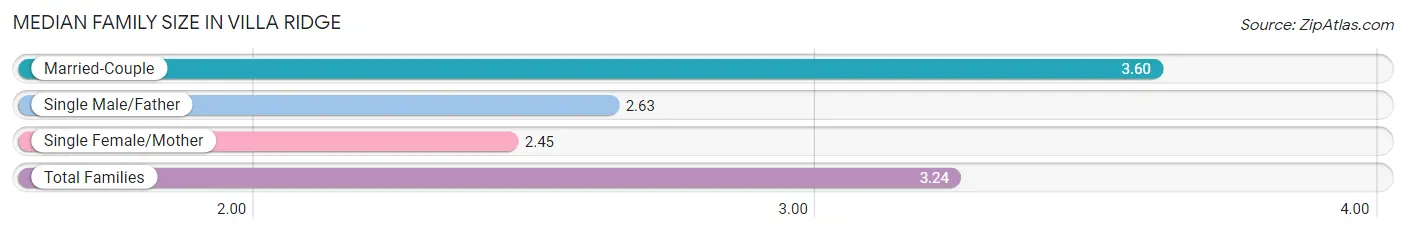
Median Family Size in Villa Ridge
The median family size in Villa Ridge is 3.24 persons per family, with married-couple families (469 | 64.0%) accounting for the largest median family size of 3.6 persons per family. On the other hand, single female/mother families (51 | 7.0%) represent the smallest median family size with 2.45 persons per family.
| Family Type | # Families | Family Size |
| Married-Couple | 469 (64.0%) | 3.60 |
| Single Male/Father | 213 (29.1%) | 2.63 |
| Single Female/Mother | 51 (7.0%) | 2.45 |
| Total Families | 733 (100.0%) | 3.24 |
Median Household Size in Villa Ridge
The median household size in Villa Ridge is 2.94 persons per household, with single male/father households (213 | 21.0%) accounting for the largest median household size of 3.67 persons per household. non-family households (279 | 27.6%) represent the smallest median household size with 1.30 persons per household.

| Household Type | # Households | Household Size |
| Married-Couple | 469 (46.3%) | 3.63 |
| Single Male/Father | 213 (21.0%) | 3.67 |
| Single Female/Mother | 51 (5.0%) | 2.45 |
| Non-family | 279 (27.6%) | 1.30 |
| Total Households | 1,012 (100.0%) | 2.94 |
Household Size by Marriage Status in Villa Ridge
Out of a total of 1,012 households in Villa Ridge, 733 (72.4%) are family households, while 279 (27.6%) are nonfamily households. The most numerous type of family households are 2-person households, comprising 284, and the most common type of nonfamily households are 1-person households, comprising 240.

| Household Size | Family Households | Nonfamily Households |
| 1-Person Households | - | 240 (23.7%) |
| 2-Person Households | 284 (28.1%) | 23 (2.3%) |
| 3-Person Households | 82 (8.1%) | 0 (0.0%) |
| 4-Person Households | 280 (27.7%) | 16 (1.6%) |
| 5-Person Households | 43 (4.3%) | 0 (0.0%) |
| 6-Person Households | 36 (3.6%) | 0 (0.0%) |
| 7+ Person Households | 8 (0.8%) | 0 (0.0%) |
| Total | 733 (72.4%) | 279 (27.6%) |
Female Fertility in Villa Ridge
Fertility by Age in Villa Ridge
Average fertility rate in Villa Ridge is 6.0 births per 1,000 women. Women in the age bracket of 20 to 34 years have the highest fertility rate with 17.0 births per 1,000 women. Women in the age bracket of 20 to 34 years acount for 100.0% of all women with births.

| Age Bracket | Women with Births | Births / 1,000 Women |
| 15 to 19 years | 0 (0.0%) | 0.0 |
| 20 to 34 years | 4 (100.0%) | 17.0 |
| 35 to 50 years | 0 (0.0%) | 0.0 |
| Total | 4 (100.0%) | 6.0 |
Fertility by Age by Marriage Status in Villa Ridge
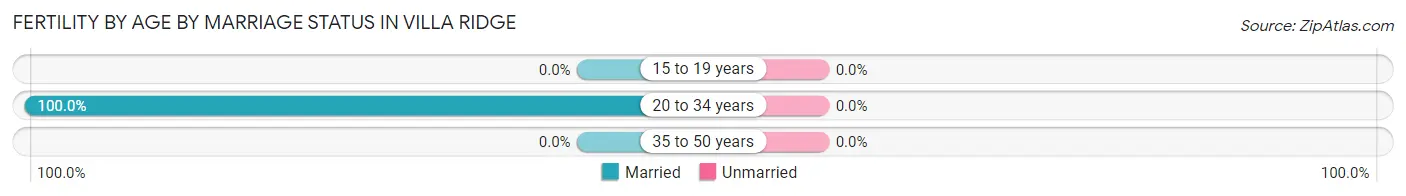
| Age Bracket | Married | Unmarried |
| 15 to 19 years | 0 (0.0%) | 0 (0.0%) |
| 20 to 34 years | 4 (100.0%) | 0 (0.0%) |
| 35 to 50 years | 0 (0.0%) | 0 (0.0%) |
| Total | 4 (100.0%) | 0 (0.0%) |
Fertility by Education in Villa Ridge

| Educational Attainment | Women with Births | Births / 1,000 Women |
| Less than High School | 0 (0.0%) | 0.0 |
| High School Diploma | 0 (0.0%) | 0.0 |
| College or Associate's Degree | 4 (100.0%) | 10.0 |
| Bachelor's Degree | 0 (0.0%) | 0.0 |
| Graduate Degree | 0 (0.0%) | 0.0 |
| Total | 4 (100.0%) | 6.0 |
Fertility by Education by Marriage Status in Villa Ridge
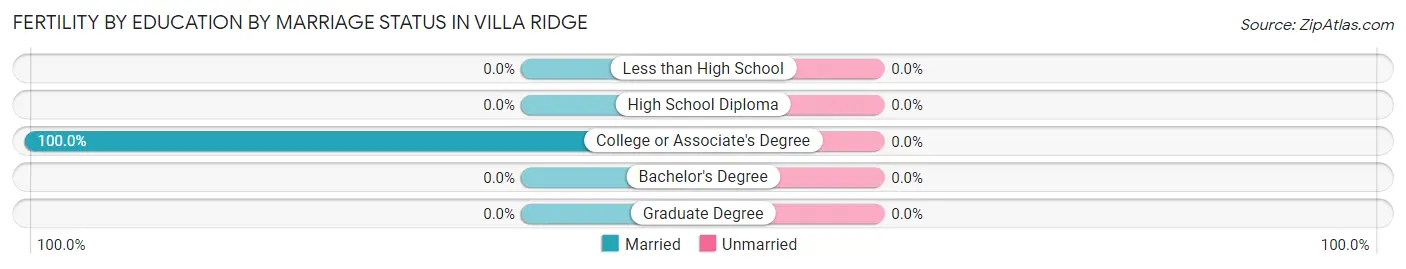
| Educational Attainment | Married | Unmarried |
| Less than High School | 0 (0.0%) | 0 (0.0%) |
| High School Diploma | 0 (0.0%) | 0 (0.0%) |
| College or Associate's Degree | 4 (100.0%) | 0 (0.0%) |
| Bachelor's Degree | 0 (0.0%) | 0 (0.0%) |
| Graduate Degree | 0 (0.0%) | 0 (0.0%) |
| Total | 4 (100.0%) | 0 (0.0%) |
Income in Villa Ridge
Income Overview in Villa Ridge
Per Capita Income in Villa Ridge is $27,971, while median incomes of families and households are $86,225 and $71,750 respectively.
| Characteristic | Number | Measure |
| Per Capita Income | 2,971 | $27,971 |
| Median Family Income | 733 | $86,225 |
| Mean Family Income | 733 | $88,190 |
| Median Household Income | 1,012 | $71,750 |
| Mean Household Income | 1,012 | $78,495 |
| Income Deficit | 733 | $0 |
| Wage / Income Gap (%) | 2,971 | 42.86% |
| Wage / Income Gap ($) | 2,971 | 57.14¢ per $1 |
| Gini / Inequality Index | 2,971 | 0.28 |
Earnings by Sex in Villa Ridge
Average Earnings in Villa Ridge are $45,515, $46,987 for men and $26,848 for women, a difference of 42.9%.
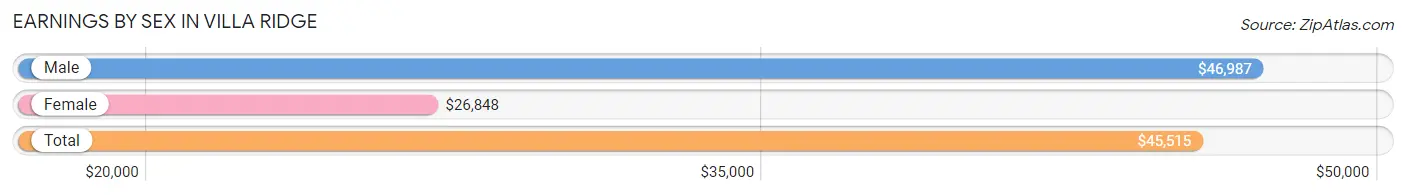
| Sex | Number | Average Earnings |
| Male | 962 (64.4%) | $46,987 |
| Female | 532 (35.6%) | $26,848 |
| Total | 1,494 (100.0%) | $45,515 |
Earnings by Sex by Income Bracket in Villa Ridge
The most common earnings brackets in Villa Ridge are $75,000 to $99,999 for men (251 | 26.1%) and $100,000+ for women (57 | 10.7%).
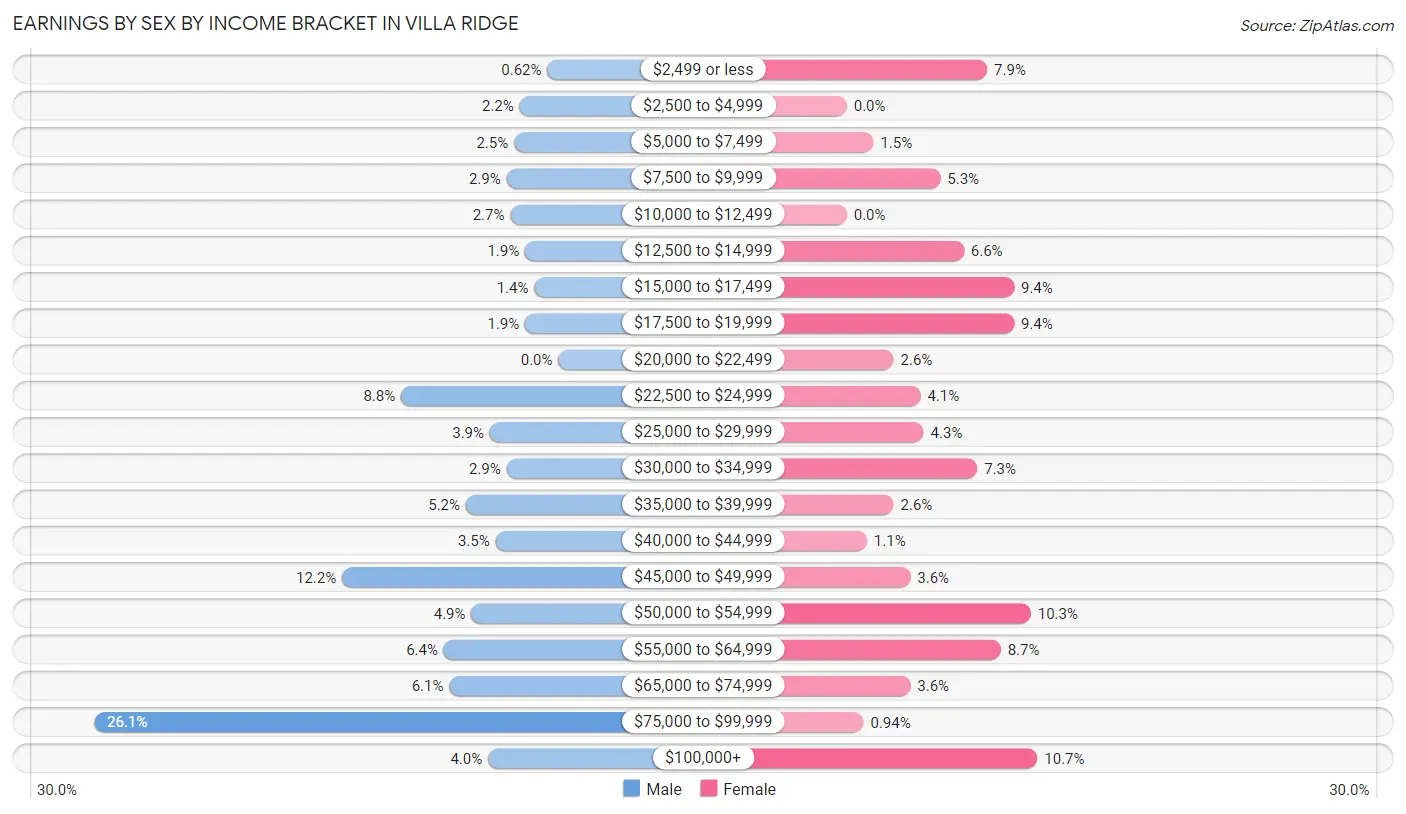
| Income | Male | Female |
| $2,499 or less | 6 (0.6%) | 42 (7.9%) |
| $2,500 to $4,999 | 21 (2.2%) | 0 (0.0%) |
| $5,000 to $7,499 | 24 (2.5%) | 8 (1.5%) |
| $7,500 to $9,999 | 28 (2.9%) | 28 (5.3%) |
| $10,000 to $12,499 | 26 (2.7%) | 0 (0.0%) |
| $12,500 to $14,999 | 18 (1.9%) | 35 (6.6%) |
| $15,000 to $17,499 | 13 (1.3%) | 50 (9.4%) |
| $17,500 to $19,999 | 18 (1.9%) | 50 (9.4%) |
| $20,000 to $22,499 | 0 (0.0%) | 14 (2.6%) |
| $22,500 to $24,999 | 85 (8.8%) | 22 (4.1%) |
| $25,000 to $29,999 | 37 (3.8%) | 23 (4.3%) |
| $30,000 to $34,999 | 28 (2.9%) | 39 (7.3%) |
| $35,000 to $39,999 | 50 (5.2%) | 14 (2.6%) |
| $40,000 to $44,999 | 34 (3.5%) | 6 (1.1%) |
| $45,000 to $49,999 | 117 (12.2%) | 19 (3.6%) |
| $50,000 to $54,999 | 47 (4.9%) | 55 (10.3%) |
| $55,000 to $64,999 | 62 (6.4%) | 46 (8.6%) |
| $65,000 to $74,999 | 59 (6.1%) | 19 (3.6%) |
| $75,000 to $99,999 | 251 (26.1%) | 5 (0.9%) |
| $100,000+ | 38 (4.0%) | 57 (10.7%) |
| Total | 962 (100.0%) | 532 (100.0%) |
Earnings by Sex by Educational Attainment in Villa Ridge
Average earnings in Villa Ridge are $54,605 for men and $31,875 for women, a difference of 41.6%. Men with an educational attainment of college or associate's degree enjoy the highest average annual earnings of $85,129, while those with less than high school education earn the least with $24,665. Women with an educational attainment of graduate degree earn the most with the average annual earnings of $100,208, while those with high school diploma education have the smallest earnings of $17,440.
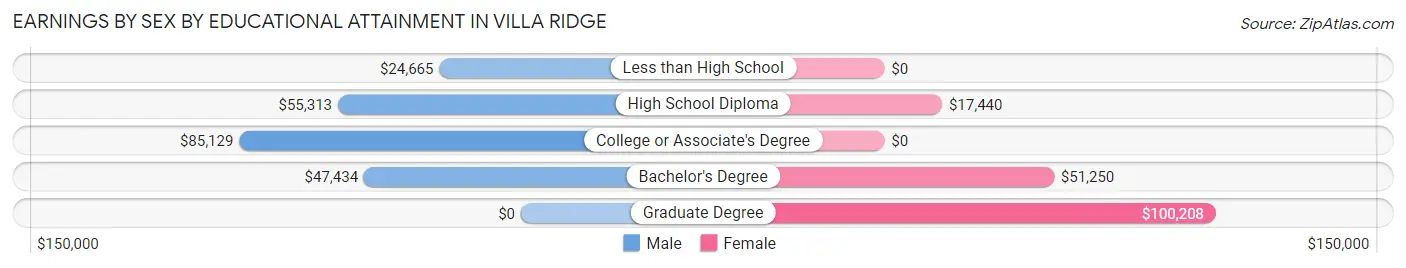
| Educational Attainment | Male Income | Female Income |
| Less than High School | $24,665 | $0 |
| High School Diploma | $55,313 | $17,440 |
| College or Associate's Degree | $85,129 | $0 |
| Bachelor's Degree | $47,434 | $51,250 |
| Graduate Degree | - | - |
| Total | $54,605 | $31,875 |
Family Income in Villa Ridge
Family Income Brackets in Villa Ridge
According to the Villa Ridge family income data, there are 237 families falling into the $75,000 to $99,999 income range, which is the most common income bracket and makes up 32.3% of all families.
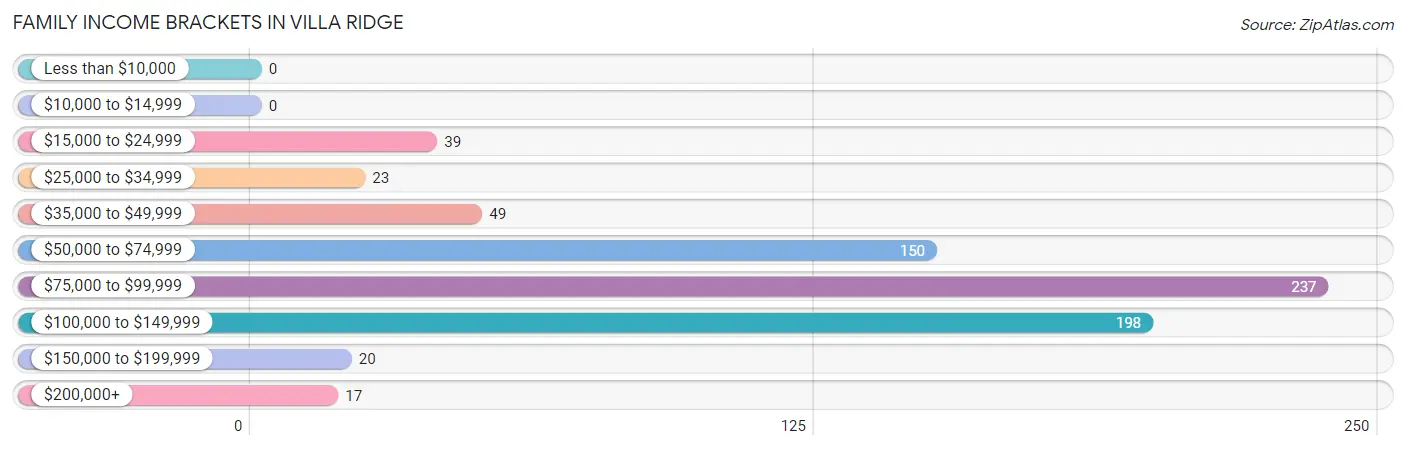
| Income Bracket | # Families | % Families |
| Less than $10,000 | 0 | 0.0% |
| $10,000 to $14,999 | 0 | 0.0% |
| $15,000 to $24,999 | 39 | 5.3% |
| $25,000 to $34,999 | 23 | 3.1% |
| $35,000 to $49,999 | 49 | 6.7% |
| $50,000 to $74,999 | 150 | 20.5% |
| $75,000 to $99,999 | 237 | 32.3% |
| $100,000 to $149,999 | 198 | 27.0% |
| $150,000 to $199,999 | 20 | 2.7% |
| $200,000+ | 17 | 2.3% |
Family Income by Famaliy Size in Villa Ridge
4-person families (90 | 12.3%) account for the highest median family income in Villa Ridge with $94,792 per family, while 2-person families (284 | 38.7%) have the highest median income of $36,875 per family member.
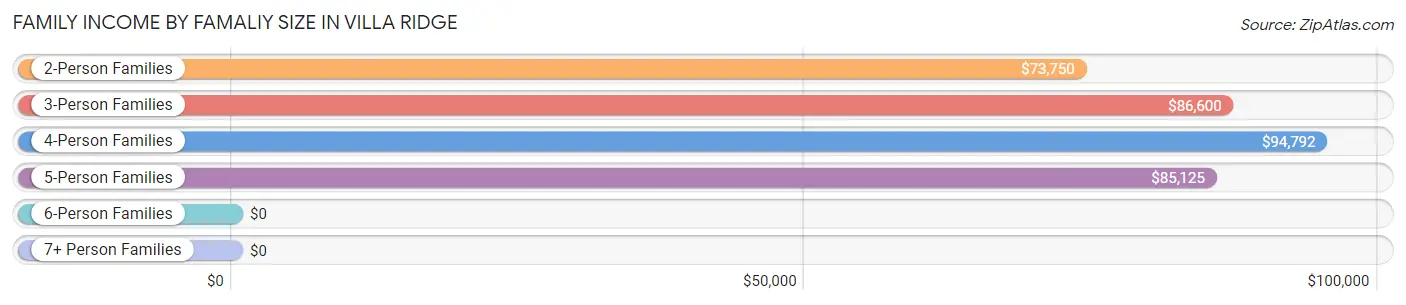
| Income Bracket | # Families | Median Income |
| 2-Person Families | 284 (38.7%) | $73,750 |
| 3-Person Families | 272 (37.1%) | $86,600 |
| 4-Person Families | 90 (12.3%) | $94,792 |
| 5-Person Families | 43 (5.9%) | $85,125 |
| 6-Person Families | 36 (4.9%) | $0 |
| 7+ Person Families | 8 (1.1%) | $0 |
| Total | 733 (100.0%) | $86,225 |
Family Income by Number of Earners in Villa Ridge
The median family income in Villa Ridge is $86,225, with families comprising 3+ earners (68) having the highest median family income of $125,000, while families with no earners (114) have the lowest median family income of $48,036, accounting for 9.3% and 15.5% of families, respectively.
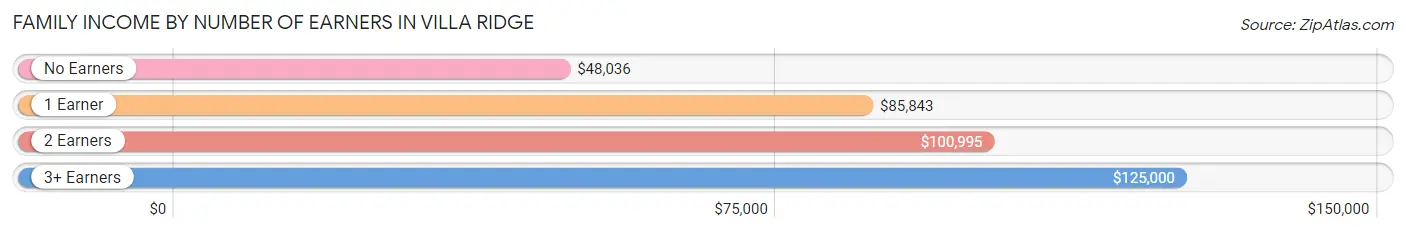
| Number of Earners | # Families | Median Income |
| No Earners | 114 (15.5%) | $48,036 |
| 1 Earner | 242 (33.0%) | $85,843 |
| 2 Earners | 309 (42.2%) | $100,995 |
| 3+ Earners | 68 (9.3%) | $125,000 |
| Total | 733 (100.0%) | $86,225 |
Household Income in Villa Ridge
Household Income Brackets in Villa Ridge
With 255 households falling in the category, the $50,000 to $74,999 income range is the most frequent in Villa Ridge, accounting for 25.2% of all households.
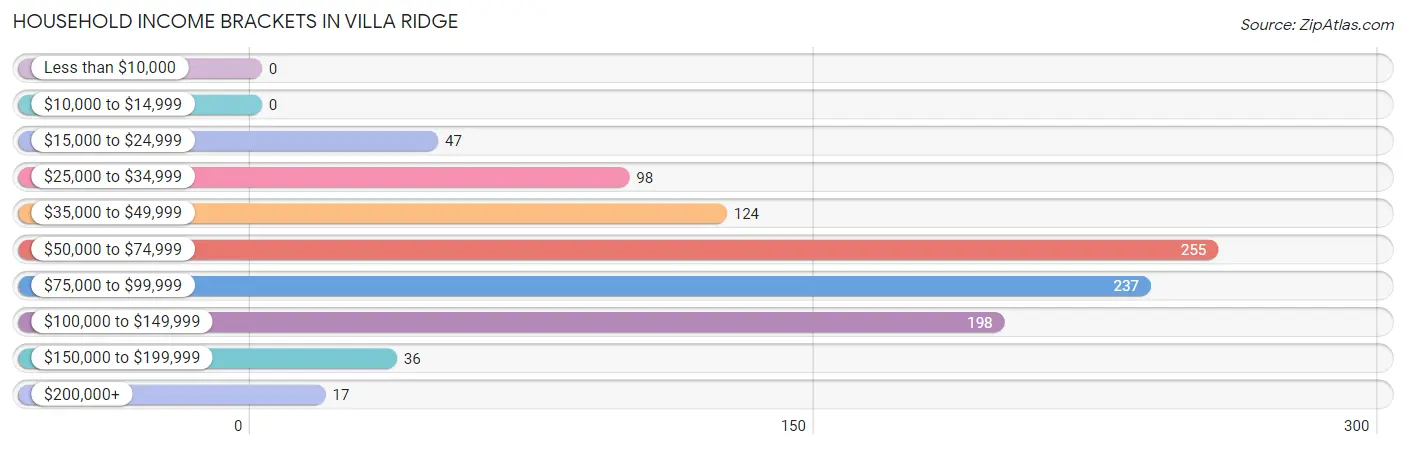
| Income Bracket | # Households | % Households |
| Less than $10,000 | 0 | 0.0% |
| $10,000 to $14,999 | 0 | 0.0% |
| $15,000 to $24,999 | 47 | 4.6% |
| $25,000 to $34,999 | 98 | 9.7% |
| $35,000 to $49,999 | 124 | 12.3% |
| $50,000 to $74,999 | 255 | 25.2% |
| $75,000 to $99,999 | 237 | 23.4% |
| $100,000 to $149,999 | 198 | 19.6% |
| $150,000 to $199,999 | 36 | 3.6% |
| $200,000+ | 17 | 1.7% |
Household Income by Householder Age in Villa Ridge
The median household income in Villa Ridge is $71,750, with the highest median household income of $86,331 found in the 25 to 44 years age bracket for the primary householder. A total of 370 households (36.6%) fall into this category.
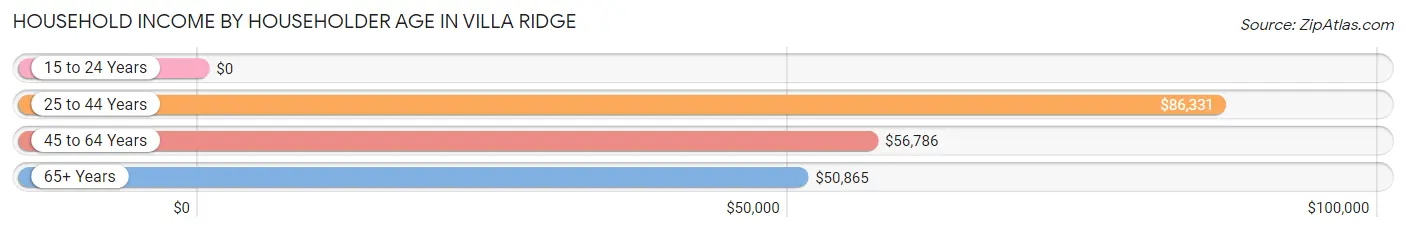
| Income Bracket | # Households | Median Income |
| 15 to 24 Years | 0 (0.0%) | $0 |
| 25 to 44 Years | 370 (36.6%) | $86,331 |
| 45 to 64 Years | 450 (44.5%) | $56,786 |
| 65+ Years | 192 (19.0%) | $50,865 |
| Total | 1,012 (100.0%) | $71,750 |
Poverty in Villa Ridge
Income Below Poverty by Sex and Age in Villa Ridge
With 6.2% poverty level for males and 21.7% for females among the residents of Villa Ridge, 16 and 17 year old males and 35 to 44 year old females are the most vulnerable to poverty, with 22 males (57.9%) and 245 females (81.1%) in their respective age groups living below the poverty level.
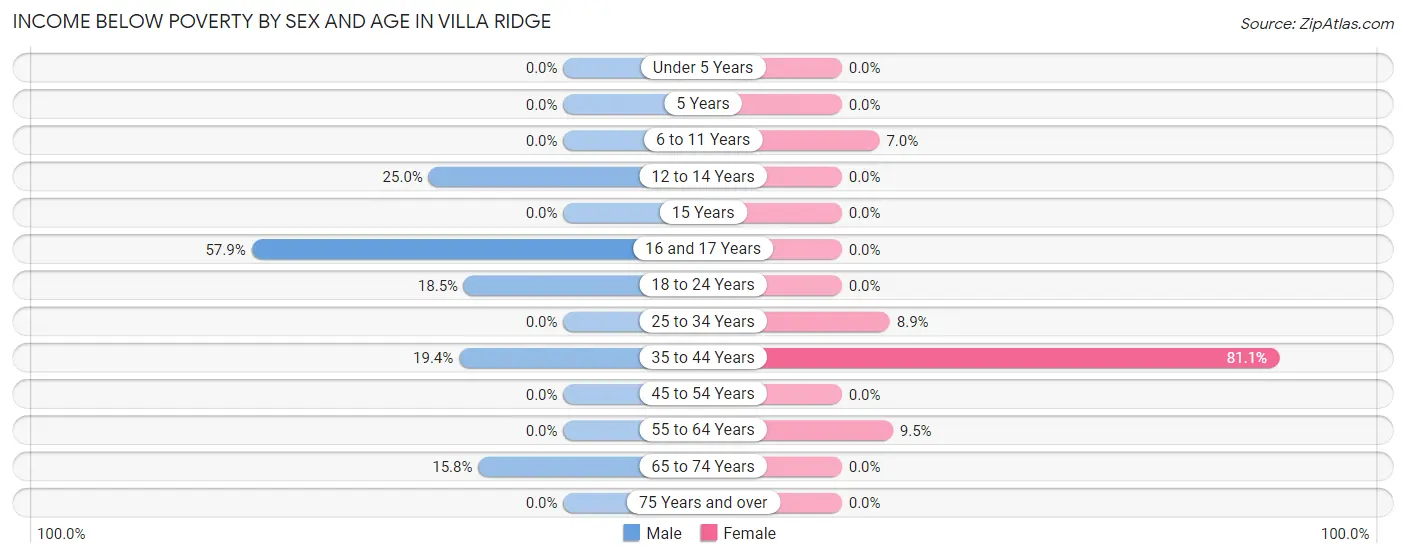
| Age Bracket | Male | Female |
| Under 5 Years | 0 (0.0%) | 0 (0.0%) |
| 5 Years | 0 (0.0%) | 0 (0.0%) |
| 6 to 11 Years | 0 (0.0%) | 13 (7.0%) |
| 12 to 14 Years | 14 (25.0%) | 0 (0.0%) |
| 15 Years | 0 (0.0%) | 0 (0.0%) |
| 16 and 17 Years | 22 (57.9%) | 0 (0.0%) |
| 18 to 24 Years | 24 (18.5%) | 0 (0.0%) |
| 25 to 34 Years | 0 (0.0%) | 19 (8.9%) |
| 35 to 44 Years | 18 (19.4%) | 245 (81.1%) |
| 45 to 54 Years | 0 (0.0%) | 0 (0.0%) |
| 55 to 64 Years | 0 (0.0%) | 20 (9.5%) |
| 65 to 74 Years | 21 (15.8%) | 0 (0.0%) |
| 75 Years and over | 0 (0.0%) | 0 (0.0%) |
| Total | 99 (6.2%) | 297 (21.7%) |
Income Above Poverty by Sex and Age in Villa Ridge
According to the poverty statistics in Villa Ridge, males aged under 5 years and females aged under 5 years are the age groups that are most secure financially, with 100.0% of males and 100.0% of females in these age groups living above the poverty line.
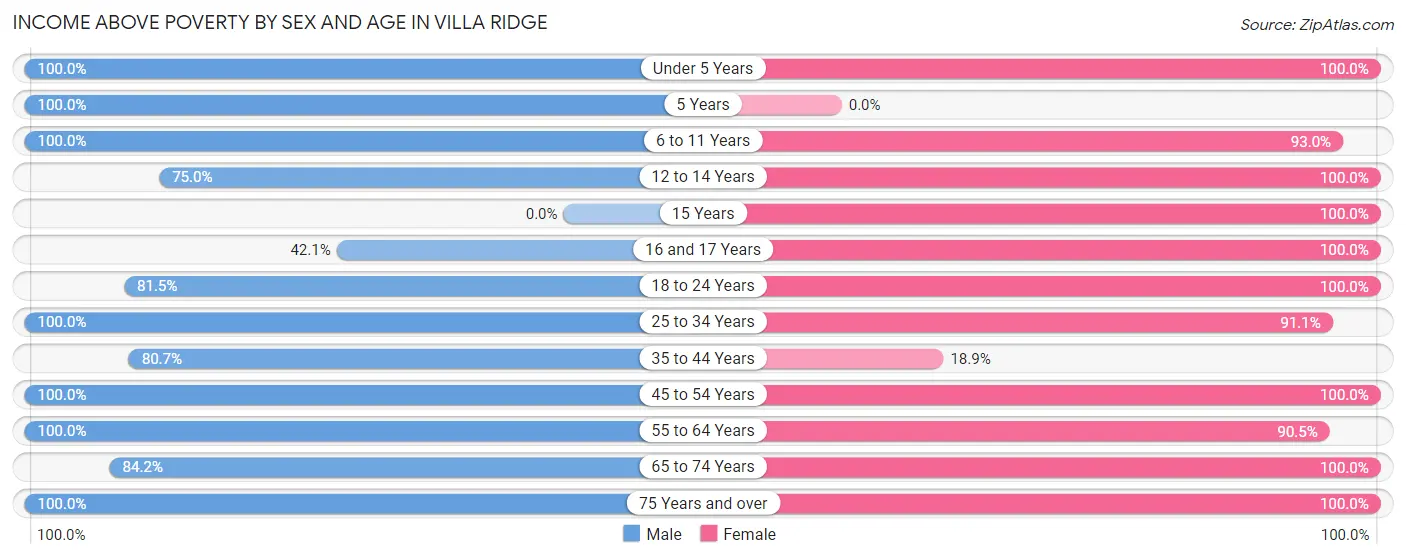
| Age Bracket | Male | Female |
| Under 5 Years | 194 (100.0%) | 76 (100.0%) |
| 5 Years | 78 (100.0%) | 0 (0.0%) |
| 6 to 11 Years | 66 (100.0%) | 173 (93.0%) |
| 12 to 14 Years | 42 (75.0%) | 16 (100.0%) |
| 15 Years | 0 (0.0%) | 11 (100.0%) |
| 16 and 17 Years | 16 (42.1%) | 42 (100.0%) |
| 18 to 24 Years | 106 (81.5%) | 42 (100.0%) |
| 25 to 34 Years | 344 (100.0%) | 194 (91.1%) |
| 35 to 44 Years | 75 (80.6%) | 57 (18.9%) |
| 45 to 54 Years | 252 (100.0%) | 73 (100.0%) |
| 55 to 64 Years | 177 (100.0%) | 191 (90.5%) |
| 65 to 74 Years | 112 (84.2%) | 114 (100.0%) |
| 75 Years and over | 43 (100.0%) | 81 (100.0%) |
| Total | 1,505 (93.8%) | 1,070 (78.3%) |
Income Below Poverty Among Married-Couple Families in Villa Ridge
The poverty statistics for married-couple families in Villa Ridge show that 6.0% or 28 of the total 469 families live below the poverty line. Families with 5 or more children have the highest poverty rate of 100.0%, comprising of 8 families. On the other hand, families with 1 or 2 children have the lowest poverty rate of 0.0%, which includes 0 families.
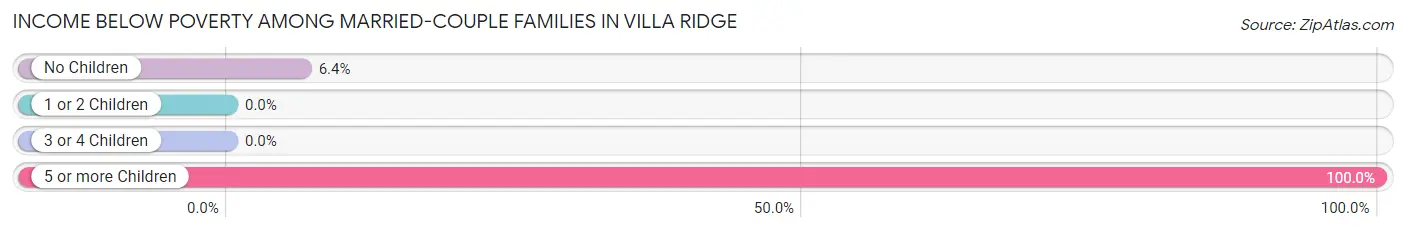
| Children | Above Poverty | Below Poverty |
| No Children | 292 (93.6%) | 20 (6.4%) |
| 1 or 2 Children | 87 (100.0%) | 0 (0.0%) |
| 3 or 4 Children | 62 (100.0%) | 0 (0.0%) |
| 5 or more Children | 0 (0.0%) | 8 (100.0%) |
| Total | 441 (94.0%) | 28 (6.0%) |
Income Below Poverty Among Single-Parent Households in Villa Ridge
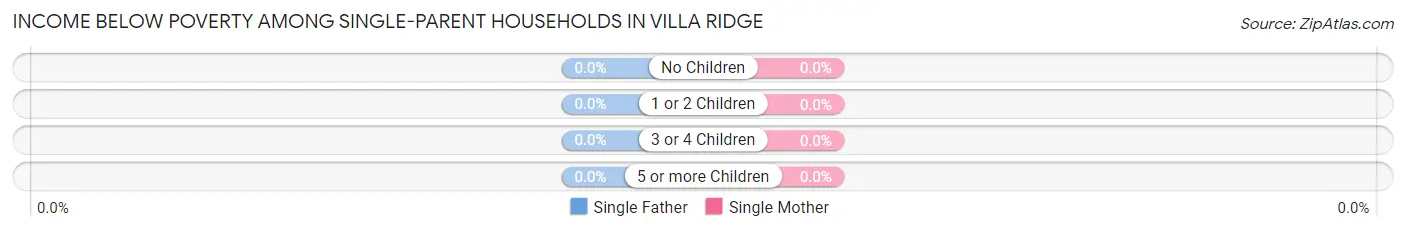
| Children | Single Father | Single Mother |
| No Children | 0 (0.0%) | 0 (0.0%) |
| 1 or 2 Children | 0 (0.0%) | 0 (0.0%) |
| 3 or 4 Children | 0 (0.0%) | 0 (0.0%) |
| 5 or more Children | 0 (0.0%) | 0 (0.0%) |
| Total | 0 (0.0%) | 0 (0.0%) |
Income Below Poverty Among Married-Couple vs Single-Parent Households in Villa Ridge
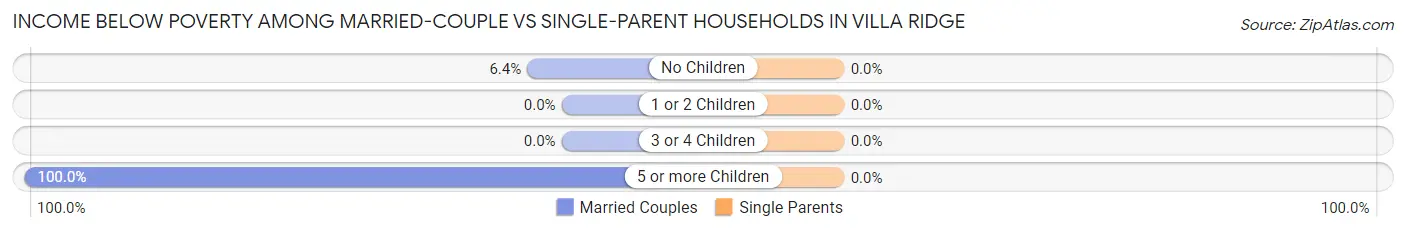
| Children | Married-Couple Families | Single-Parent Households |
| No Children | 20 (6.4%) | 0 (0.0%) |
| 1 or 2 Children | 0 (0.0%) | 0 (0.0%) |
| 3 or 4 Children | 0 (0.0%) | 0 (0.0%) |
| 5 or more Children | 8 (100.0%) | 0 (0.0%) |
| Total | 28 (6.0%) | 0 (0.0%) |
Employment Characteristics in Villa Ridge
Employment by Class of Employer in Villa Ridge
Among the 1,347 employed individuals in Villa Ridge, private company employees (1,010 | 75.0%), state government employees (147 | 10.9%), and local government employees (76 | 5.6%) make up the most common classes of employment.
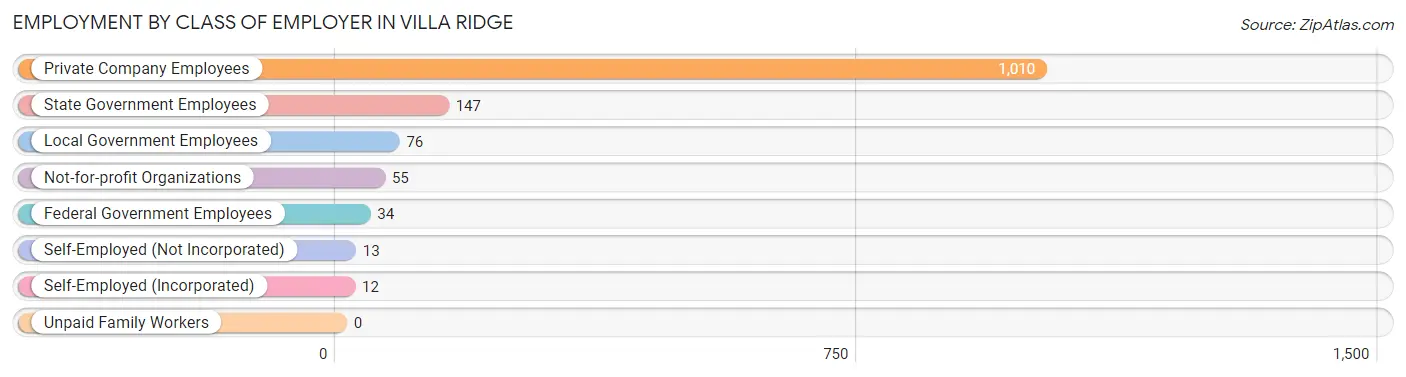
| Employer Class | # Employees | % Employees |
| Private Company Employees | 1,010 | 75.0% |
| Self-Employed (Incorporated) | 12 | 0.9% |
| Self-Employed (Not Incorporated) | 13 | 1.0% |
| Not-for-profit Organizations | 55 | 4.1% |
| Local Government Employees | 76 | 5.6% |
| State Government Employees | 147 | 10.9% |
| Federal Government Employees | 34 | 2.5% |
| Unpaid Family Workers | 0 | 0.0% |
| Total | 1,347 | 100.0% |
Employment Status by Age in Villa Ridge
According to the labor force statistics for Villa Ridge, out of the total population over 16 years of age (2,288), 63.4% or 1,451 individuals are in the labor force, with 5.8% or 84 of them unemployed. The age group with the highest labor force participation rate is 45 to 54 years, with 96.3% or 313 individuals in the labor force. Within the labor force, the 45 to 54 years age range has the highest percentage of unemployed individuals, with 16.9% or 53 of them being unemployed.
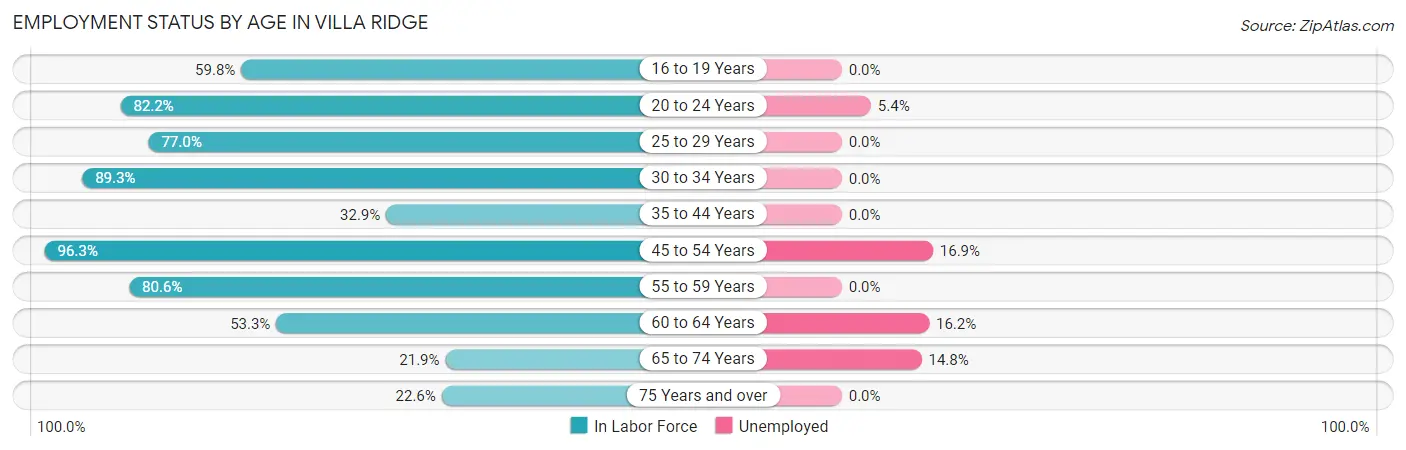
| Age Bracket | In Labor Force | Unemployed |
| 16 to 19 Years | 70 (59.8%) | 0 (0.0%) |
| 20 to 24 Years | 111 (82.2%) | 6 (5.4%) |
| 25 to 29 Years | 77 (77.0%) | 0 (0.0%) |
| 30 to 34 Years | 408 (89.3%) | 0 (0.0%) |
| 35 to 44 Years | 130 (32.9%) | 0 (0.0%) |
| 45 to 54 Years | 313 (96.3%) | 53 (16.9%) |
| 55 to 59 Years | 154 (80.6%) | 0 (0.0%) |
| 60 to 64 Years | 105 (53.3%) | 17 (16.2%) |
| 65 to 74 Years | 54 (21.9%) | 8 (14.8%) |
| 75 Years and over | 28 (22.6%) | 0 (0.0%) |
| Total | 1,451 (63.4%) | 84 (5.8%) |
Employment Status by Educational Attainment in Villa Ridge
According to labor force statistics for Villa Ridge, 71.3% of individuals (1,187) out of the total population between 25 and 64 years of age (1,665) are in the labor force, with 5.9% or 70 of them being unemployed. The group with the highest labor force participation rate are those with the educational attainment of bachelor's degree or higher, with 100.0% or 291 individuals in the labor force. Within the labor force, individuals with less than high school education have the highest percentage of unemployment, with 56.2% or 41 of them being unemployed.
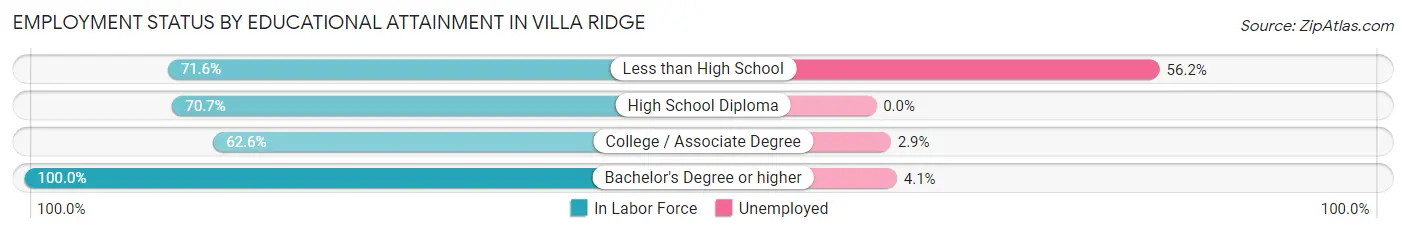
| Educational Attainment | In Labor Force | Unemployed |
| Less than High School | 73 (71.6%) | 57 (56.2%) |
| High School Diploma | 232 (70.7%) | 0 (0.0%) |
| College / Associate Degree | 591 (62.6%) | 27 (2.9%) |
| Bachelor's Degree or higher | 291 (100.0%) | 12 (4.1%) |
| Total | 1,187 (71.3%) | 98 (5.9%) |
Employment Occupations by Sex in Villa Ridge
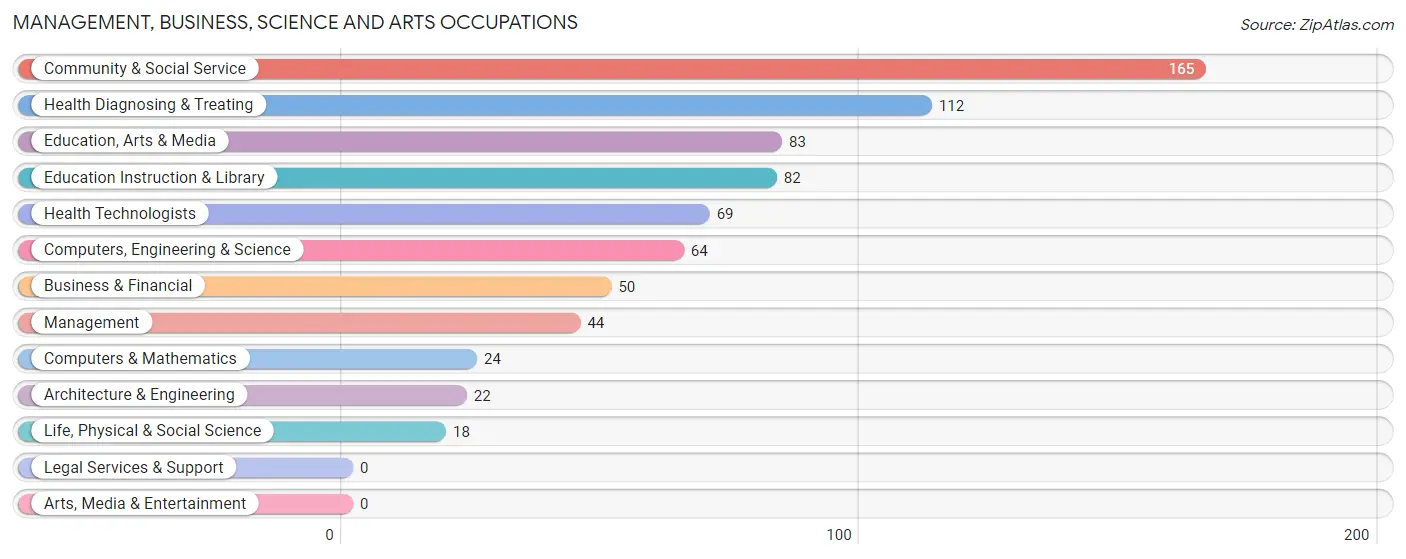
Management, Business, Science and Arts Occupations
The most common Management, Business, Science and Arts occupations in Villa Ridge are Community & Social Service (165 | 12.1%), Health Diagnosing & Treating (112 | 8.2%), Education, Arts & Media (83 | 6.1%), Education Instruction & Library (82 | 6.0%), and Health Technologists (69 | 5.1%).
Management, Business, Science and Arts Occupations by Sex
Within the Management, Business, Science and Arts occupations in Villa Ridge, the most male-oriented occupations are Computers, Engineering & Science (100.0%), Computers & Mathematics (100.0%), and Architecture & Engineering (100.0%), while the most female-oriented occupations are Education Instruction & Library (100.0%), Health Diagnosing & Treating (100.0%), and Health Technologists (100.0%).
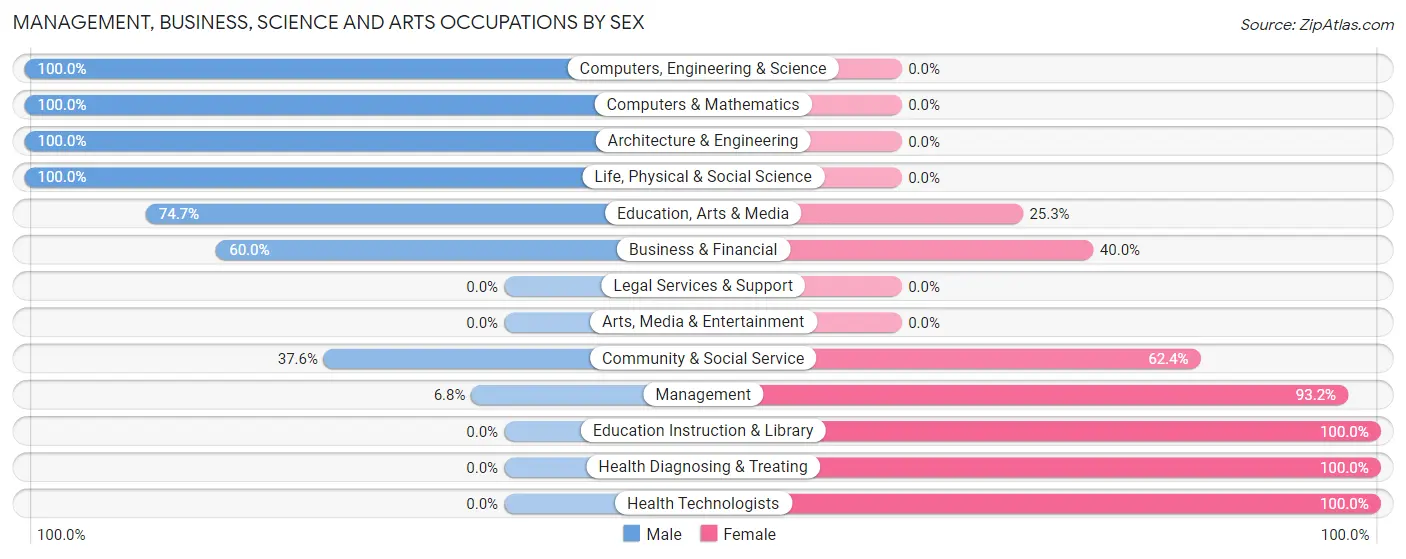
| Occupation | Male | Female |
| Management | 3 (6.8%) | 41 (93.2%) |
| Business & Financial | 30 (60.0%) | 20 (40.0%) |
| Computers, Engineering & Science | 64 (100.0%) | 0 (0.0%) |
| Computers & Mathematics | 24 (100.0%) | 0 (0.0%) |
| Architecture & Engineering | 22 (100.0%) | 0 (0.0%) |
| Life, Physical & Social Science | 18 (100.0%) | 0 (0.0%) |
| Community & Social Service | 62 (37.6%) | 103 (62.4%) |
| Education, Arts & Media | 62 (74.7%) | 21 (25.3%) |
| Legal Services & Support | 0 (0.0%) | 0 (0.0%) |
| Education Instruction & Library | 0 (0.0%) | 82 (100.0%) |
| Arts, Media & Entertainment | 0 (0.0%) | 0 (0.0%) |
| Health Diagnosing & Treating | 0 (0.0%) | 112 (100.0%) |
| Health Technologists | 0 (0.0%) | 69 (100.0%) |
| Total (Category) | 159 (36.5%) | 276 (63.4%) |
| Total (Overall) | 907 (66.4%) | 459 (33.6%) |
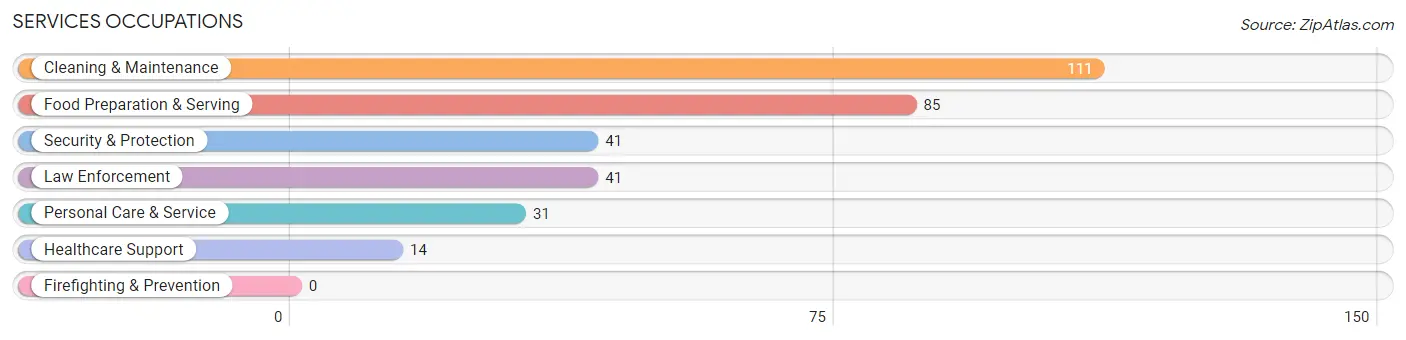
Services Occupations
The most common Services occupations in Villa Ridge are Cleaning & Maintenance (111 | 8.1%), Food Preparation & Serving (85 | 6.2%), Security & Protection (41 | 3.0%), Law Enforcement (41 | 3.0%), and Personal Care & Service (31 | 2.3%).
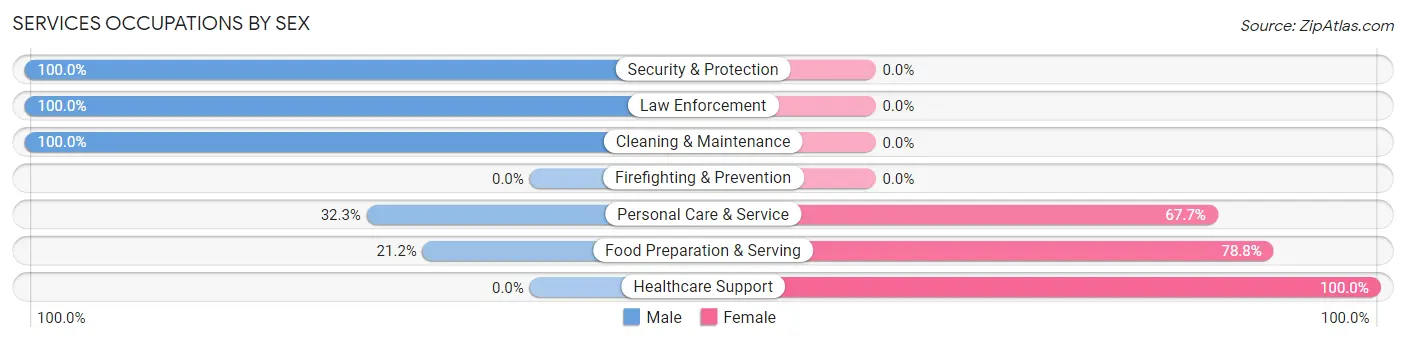
Services Occupations by Sex
Within the Services occupations in Villa Ridge, the most male-oriented occupations are Security & Protection (100.0%), Law Enforcement (100.0%), and Cleaning & Maintenance (100.0%), while the most female-oriented occupations are Healthcare Support (100.0%), Food Preparation & Serving (78.8%), and Personal Care & Service (67.7%).
| Occupation | Male | Female |
| Healthcare Support | 0 (0.0%) | 14 (100.0%) |
| Security & Protection | 41 (100.0%) | 0 (0.0%) |
| Firefighting & Prevention | 0 (0.0%) | 0 (0.0%) |
| Law Enforcement | 41 (100.0%) | 0 (0.0%) |
| Food Preparation & Serving | 18 (21.2%) | 67 (78.8%) |
| Cleaning & Maintenance | 111 (100.0%) | 0 (0.0%) |
| Personal Care & Service | 10 (32.3%) | 21 (67.7%) |
| Total (Category) | 180 (63.8%) | 102 (36.2%) |
| Total (Overall) | 907 (66.4%) | 459 (33.6%) |
Sales and Office Occupations
The most common Sales and Office occupations in Villa Ridge are Office & Administration (99 | 7.2%), and Sales & Related (81 | 5.9%).

Sales and Office Occupations by Sex

| Occupation | Male | Female |
| Sales & Related | 69 (85.2%) | 12 (14.8%) |
| Office & Administration | 32 (32.3%) | 67 (67.7%) |
| Total (Category) | 101 (56.1%) | 79 (43.9%) |
| Total (Overall) | 907 (66.4%) | 459 (33.6%) |
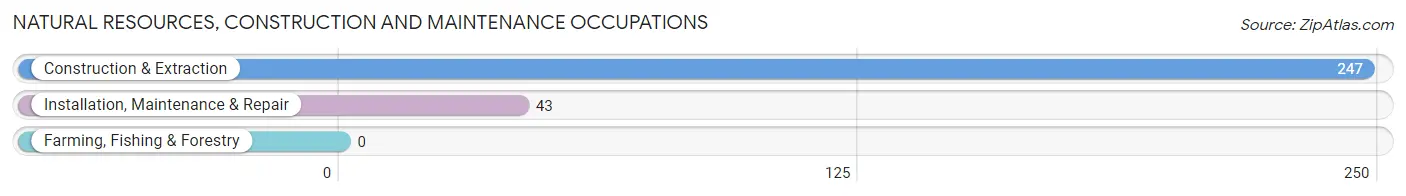
Natural Resources, Construction and Maintenance Occupations
The most common Natural Resources, Construction and Maintenance occupations in Villa Ridge are Construction & Extraction (247 | 18.1%), and Installation, Maintenance & Repair (43 | 3.2%).
Natural Resources, Construction and Maintenance Occupations by Sex

| Occupation | Male | Female |
| Farming, Fishing & Forestry | 0 (0.0%) | 0 (0.0%) |
| Construction & Extraction | 247 (100.0%) | 0 (0.0%) |
| Installation, Maintenance & Repair | 43 (100.0%) | 0 (0.0%) |
| Total (Category) | 290 (100.0%) | 0 (0.0%) |
| Total (Overall) | 907 (66.4%) | 459 (33.6%) |
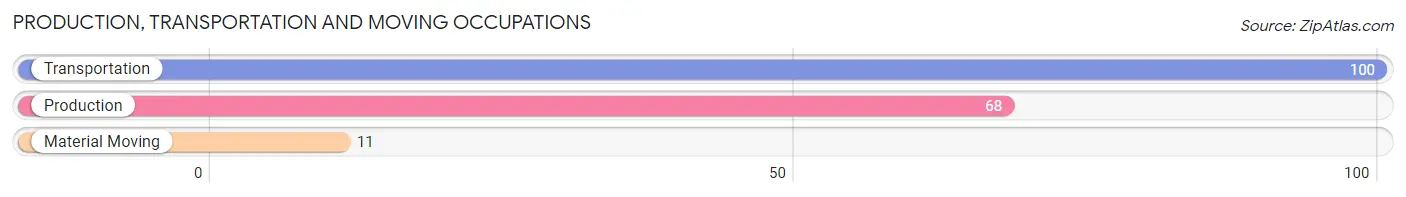
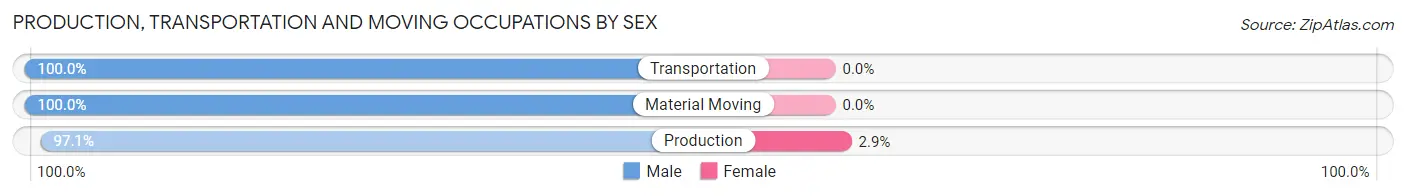
Production, Transportation and Moving Occupations
The most common Production, Transportation and Moving occupations in Villa Ridge are Transportation (100 | 7.3%), Production (68 | 5.0%), and Material Moving (11 | 0.8%).
Production, Transportation and Moving Occupations by Sex
| Occupation | Male | Female |
| Production | 66 (97.1%) | 2 (2.9%) |
| Transportation | 100 (100.0%) | 0 (0.0%) |
| Material Moving | 11 (100.0%) | 0 (0.0%) |
| Total (Category) | 177 (98.9%) | 2 (1.1%) |
| Total (Overall) | 907 (66.4%) | 459 (33.6%) |
Employment Industries by Sex in Villa Ridge
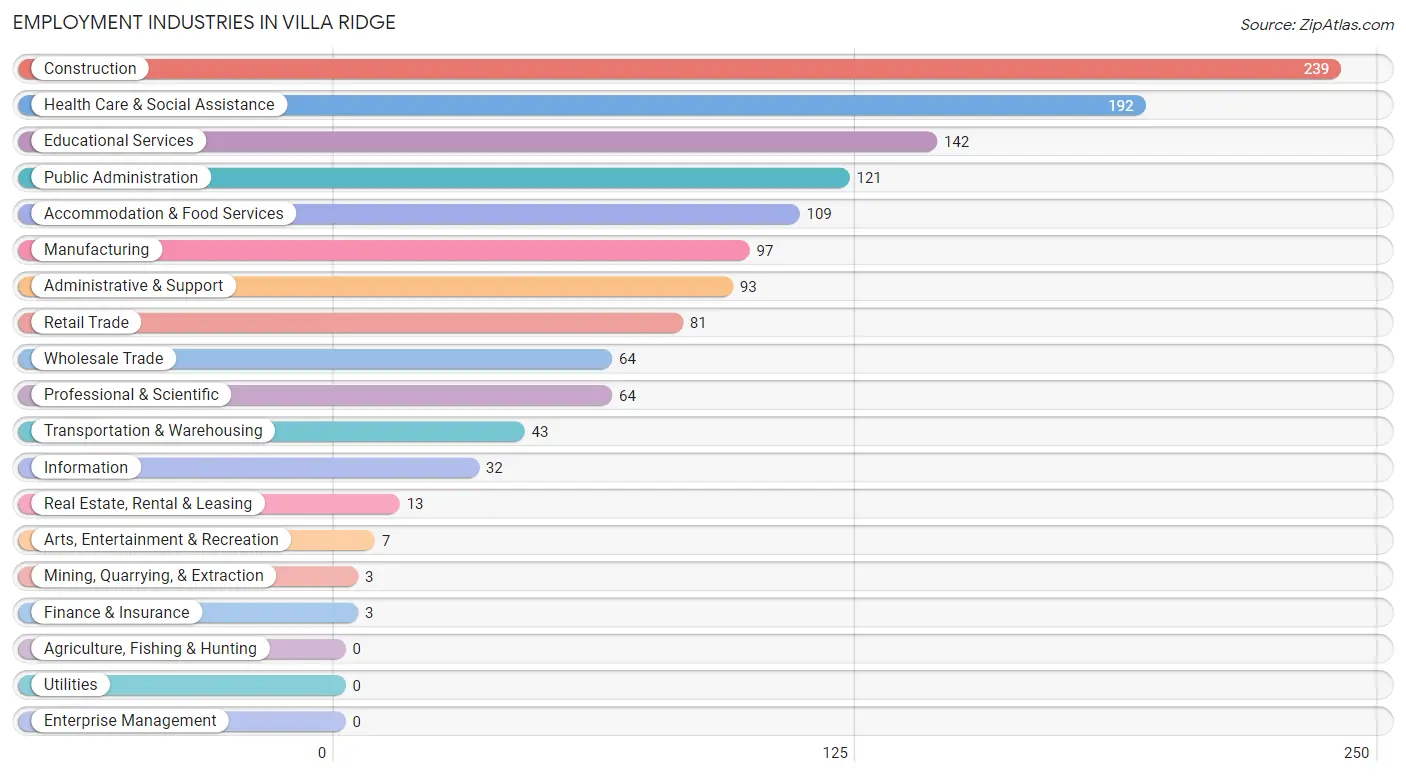
Employment Industries in Villa Ridge
The major employment industries in Villa Ridge include Construction (239 | 17.5%), Health Care & Social Assistance (192 | 14.1%), Educational Services (142 | 10.4%), Public Administration (121 | 8.9%), and Accommodation & Food Services (109 | 8.0%).
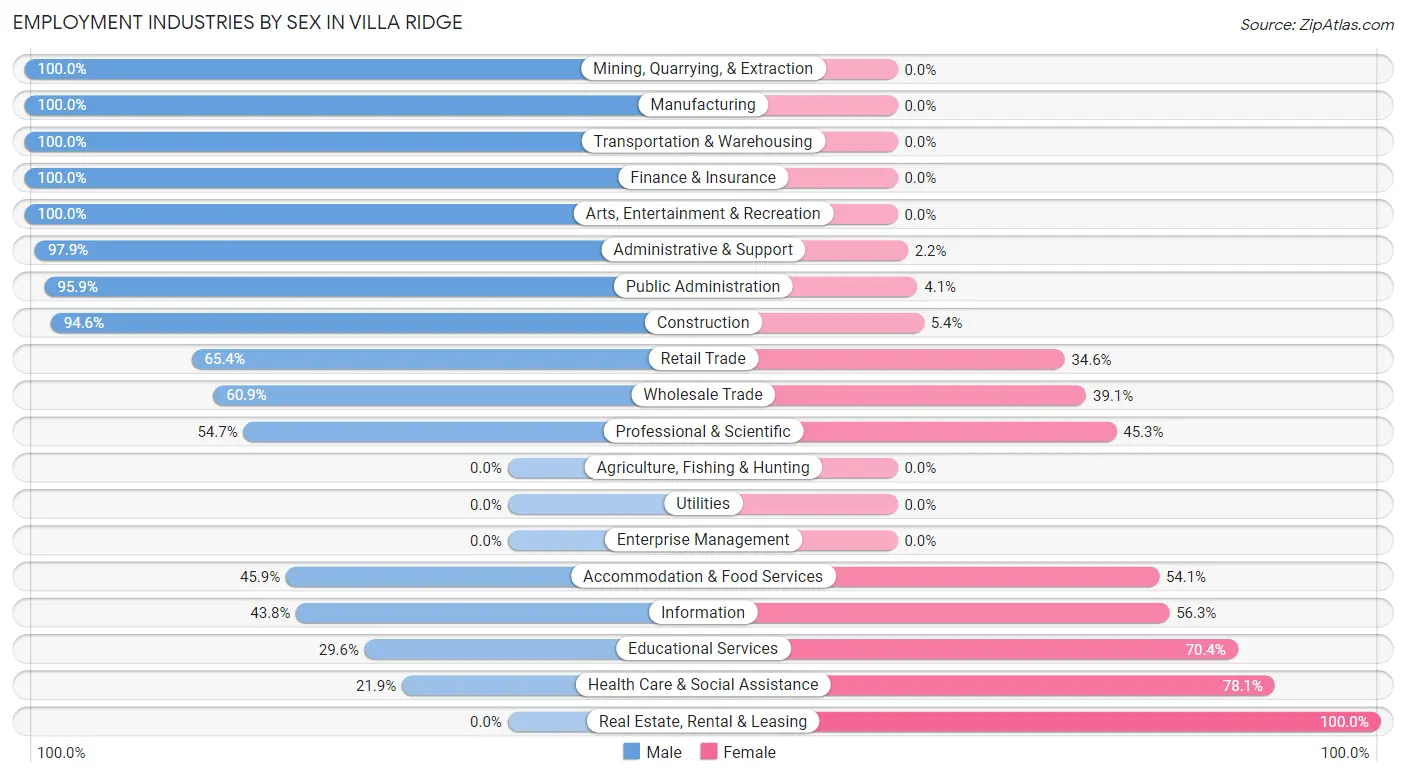
Employment Industries by Sex in Villa Ridge
The Villa Ridge industries that see more men than women are Mining, Quarrying, & Extraction (100.0%), Manufacturing (100.0%), and Transportation & Warehousing (100.0%), whereas the industries that tend to have a higher number of women are Real Estate, Rental & Leasing (100.0%), Health Care & Social Assistance (78.1%), and Educational Services (70.4%).
| Industry | Male | Female |
| Agriculture, Fishing & Hunting | 0 (0.0%) | 0 (0.0%) |
| Mining, Quarrying, & Extraction | 3 (100.0%) | 0 (0.0%) |
| Construction | 226 (94.6%) | 13 (5.4%) |
| Manufacturing | 97 (100.0%) | 0 (0.0%) |
| Wholesale Trade | 39 (60.9%) | 25 (39.1%) |
| Retail Trade | 53 (65.4%) | 28 (34.6%) |
| Transportation & Warehousing | 43 (100.0%) | 0 (0.0%) |
| Utilities | 0 (0.0%) | 0 (0.0%) |
| Information | 14 (43.8%) | 18 (56.2%) |
| Finance & Insurance | 3 (100.0%) | 0 (0.0%) |
| Real Estate, Rental & Leasing | 0 (0.0%) | 13 (100.0%) |
| Professional & Scientific | 35 (54.7%) | 29 (45.3%) |
| Enterprise Management | 0 (0.0%) | 0 (0.0%) |
| Administrative & Support | 91 (97.9%) | 2 (2.1%) |
| Educational Services | 42 (29.6%) | 100 (70.4%) |
| Health Care & Social Assistance | 42 (21.9%) | 150 (78.1%) |
| Arts, Entertainment & Recreation | 7 (100.0%) | 0 (0.0%) |
| Accommodation & Food Services | 50 (45.9%) | 59 (54.1%) |
| Public Administration | 116 (95.9%) | 5 (4.1%) |
| Total | 907 (66.4%) | 459 (33.6%) |
Education in Villa Ridge
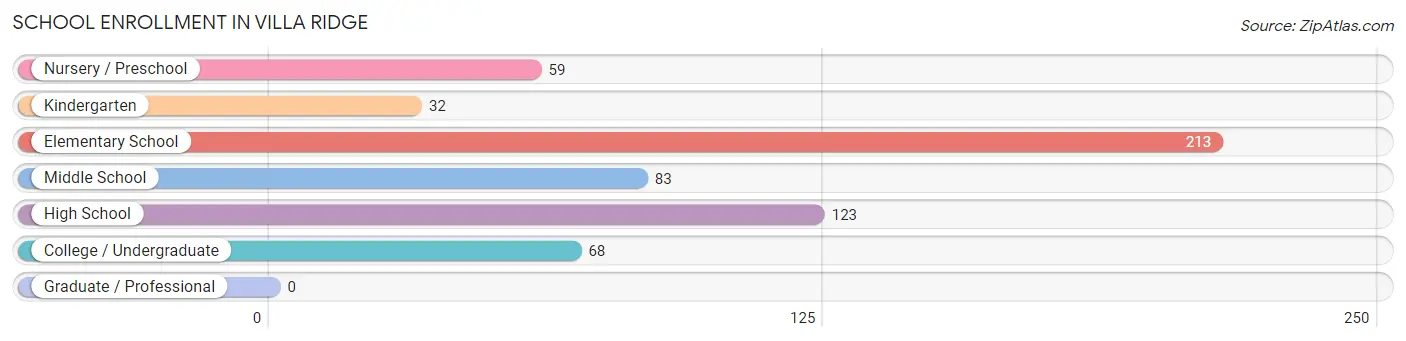
School Enrollment in Villa Ridge
The most common levels of schooling among the 578 students in Villa Ridge are elementary school (213 | 36.8%), high school (123 | 21.3%), and middle school (83 | 14.4%).
| School Level | # Students | % Students |
| Nursery / Preschool | 59 | 10.2% |
| Kindergarten | 32 | 5.5% |
| Elementary School | 213 | 36.8% |
| Middle School | 83 | 14.4% |
| High School | 123 | 21.3% |
| College / Undergraduate | 68 | 11.8% |
| Graduate / Professional | 0 | 0.0% |
| Total | 578 | 100.0% |
School Enrollment by Age by Funding Source in Villa Ridge
Out of a total of 578 students who are enrolled in schools in Villa Ridge, 83 (14.4%) attend a private institution, while the remaining 495 (85.6%) are enrolled in public schools. The age group of 25 to 34 year olds has the highest likelihood of being enrolled in private schools, with 30 (100.0% in the age bracket) enrolled. Conversely, the age group of 3 to 4 year olds has the lowest likelihood of being enrolled in a private school, with 19 (100.0% in the age bracket) attending a public institution.
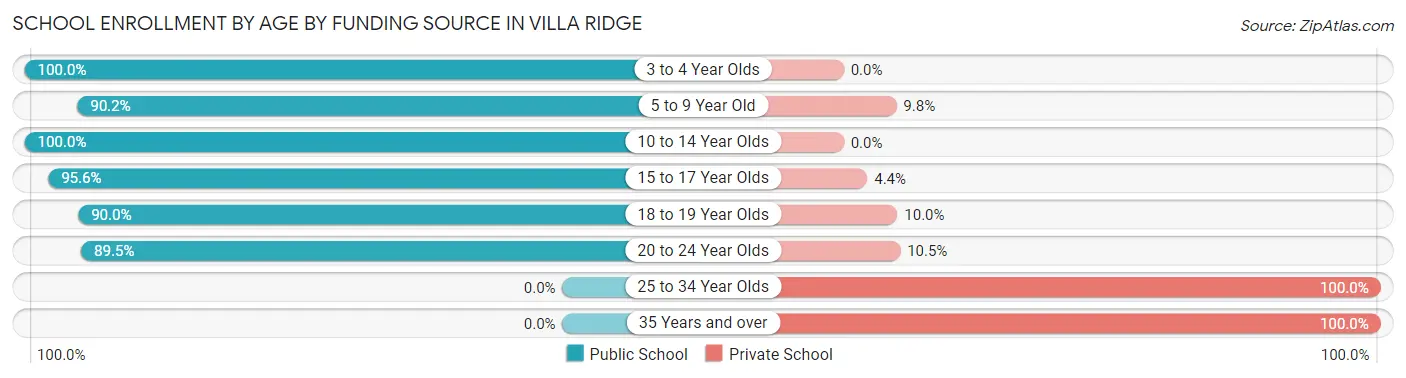
| Age Bracket | Public School | Private School |
| 3 to 4 Year Olds | 19 (100.0%) | 0 (0.0%) |
| 5 to 9 Year Old | 257 (90.2%) | 28 (9.8%) |
| 10 to 14 Year Olds | 97 (100.0%) | 0 (0.0%) |
| 15 to 17 Year Olds | 87 (95.6%) | 4 (4.4%) |
| 18 to 19 Year Olds | 18 (90.0%) | 2 (10.0%) |
| 20 to 24 Year Olds | 17 (89.5%) | 2 (10.5%) |
| 25 to 34 Year Olds | 0 (0.0%) | 30 (100.0%) |
| 35 Years and over | 0 (0.0%) | 17 (100.0%) |
| Total | 495 (85.6%) | 83 (14.4%) |
Educational Attainment by Field of Study in Villa Ridge
Education (102 | 25.5%), business (63 | 15.8%), social sciences (62 | 15.5%), arts & humanities (57 | 14.2%), and visual & performing arts (39 | 9.8%) are the most common fields of study among 400 individuals in Villa Ridge who have obtained a bachelor's degree or higher.
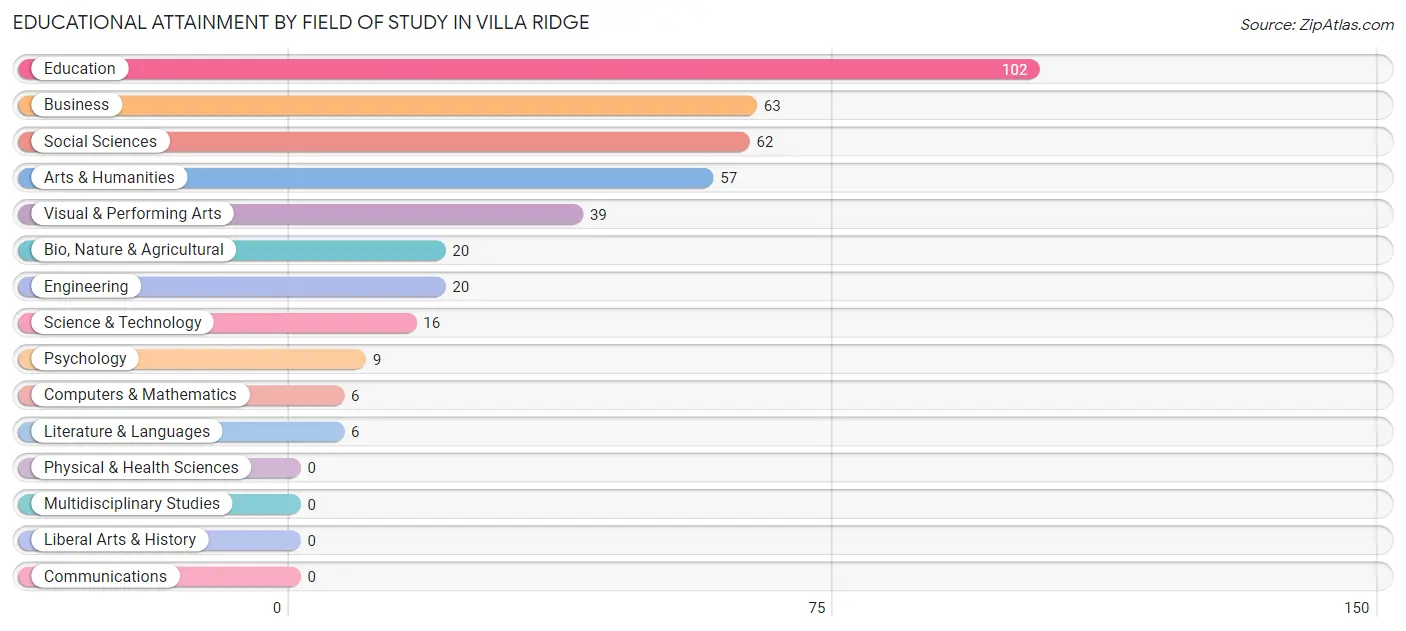
| Field of Study | # Graduates | % Graduates |
| Computers & Mathematics | 6 | 1.5% |
| Bio, Nature & Agricultural | 20 | 5.0% |
| Physical & Health Sciences | 0 | 0.0% |
| Psychology | 9 | 2.2% |
| Social Sciences | 62 | 15.5% |
| Engineering | 20 | 5.0% |
| Multidisciplinary Studies | 0 | 0.0% |
| Science & Technology | 16 | 4.0% |
| Business | 63 | 15.8% |
| Education | 102 | 25.5% |
| Literature & Languages | 6 | 1.5% |
| Liberal Arts & History | 0 | 0.0% |
| Visual & Performing Arts | 39 | 9.8% |
| Communications | 0 | 0.0% |
| Arts & Humanities | 57 | 14.2% |
| Total | 400 | 100.0% |
Transportation & Commute in Villa Ridge
Vehicle Availability by Sex in Villa Ridge
The most prevalent vehicle ownership categories in Villa Ridge are males with 2 vehicles (410, accounting for 46.2%) and females with 2 vehicles (167, making up 89.3%).
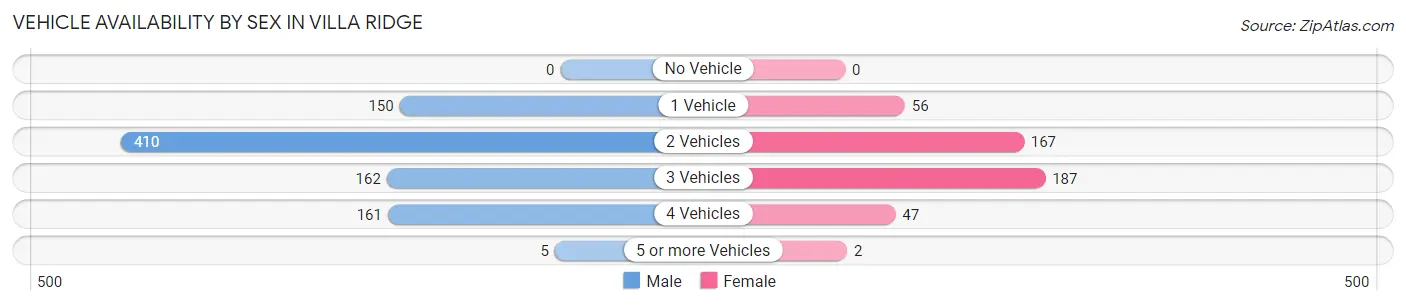
| Vehicles Available | Male | Female |
| No Vehicle | 0 (0.0%) | 0 (0.0%) |
| 1 Vehicle | 150 (16.9%) | 56 (12.2%) |
| 2 Vehicles | 410 (46.2%) | 167 (36.4%) |
| 3 Vehicles | 162 (18.2%) | 187 (40.7%) |
| 4 Vehicles | 161 (18.1%) | 47 (10.2%) |
| 5 or more Vehicles | 5 (0.6%) | 2 (0.4%) |
| Total | 888 (100.0%) | 459 (100.0%) |
Commute Time in Villa Ridge
The most frequently occuring commute durations in Villa Ridge are 20 to 24 minutes (232 commuters, 20.1%), 15 to 19 minutes (218 commuters, 18.8%), and 30 to 34 minutes (196 commuters, 16.9%).
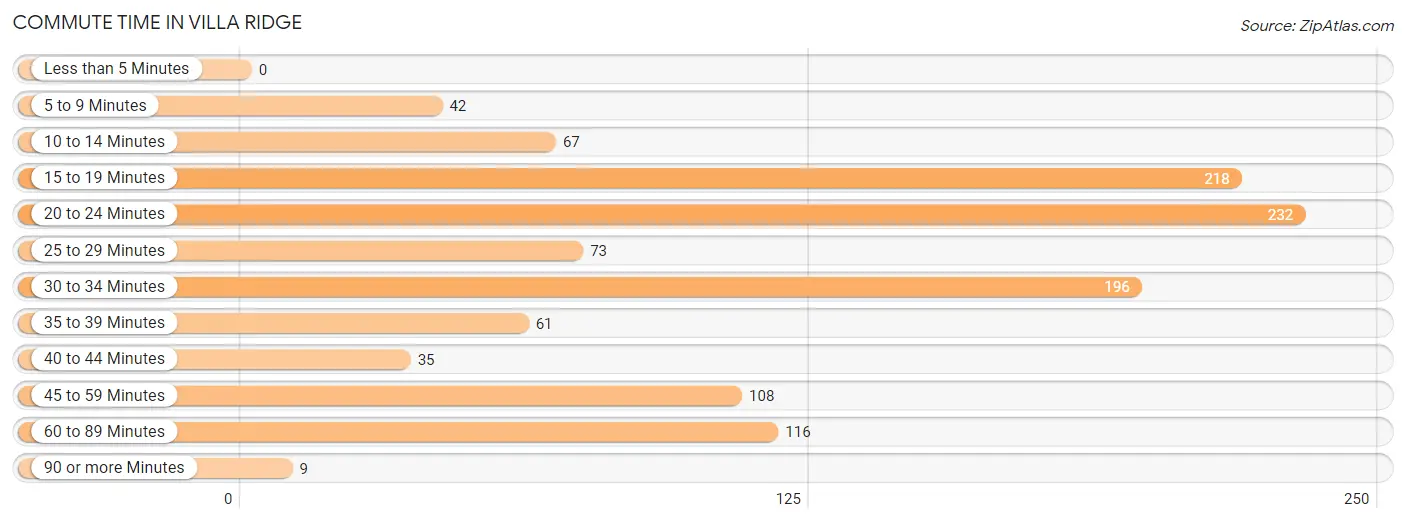
| Commute Time | # Commuters | % Commuters |
| Less than 5 Minutes | 0 | 0.0% |
| 5 to 9 Minutes | 42 | 3.6% |
| 10 to 14 Minutes | 67 | 5.8% |
| 15 to 19 Minutes | 218 | 18.8% |
| 20 to 24 Minutes | 232 | 20.1% |
| 25 to 29 Minutes | 73 | 6.3% |
| 30 to 34 Minutes | 196 | 16.9% |
| 35 to 39 Minutes | 61 | 5.3% |
| 40 to 44 Minutes | 35 | 3.0% |
| 45 to 59 Minutes | 108 | 9.3% |
| 60 to 89 Minutes | 116 | 10.0% |
| 90 or more Minutes | 9 | 0.8% |
Commute Time by Sex in Villa Ridge
The most common commute times in Villa Ridge are 30 to 34 minutes (166 commuters, 23.5%) for males and 15 to 19 minutes (108 commuters, 24.0%) for females.
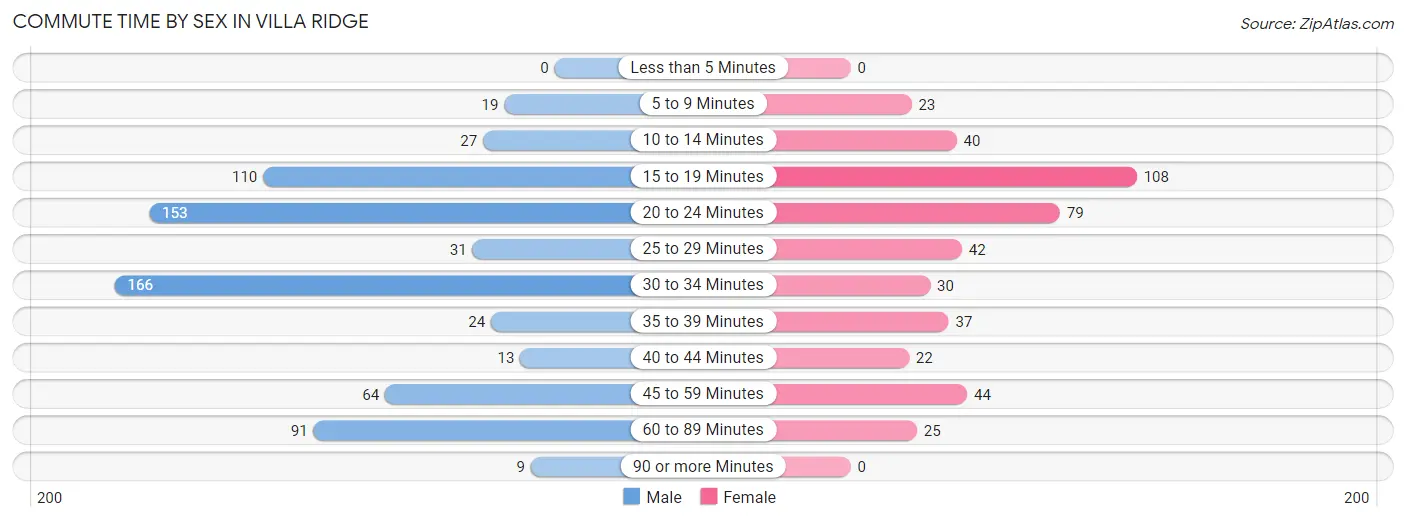
| Commute Time | Male | Female |
| Less than 5 Minutes | 0 (0.0%) | 0 (0.0%) |
| 5 to 9 Minutes | 19 (2.7%) | 23 (5.1%) |
| 10 to 14 Minutes | 27 (3.8%) | 40 (8.9%) |
| 15 to 19 Minutes | 110 (15.6%) | 108 (24.0%) |
| 20 to 24 Minutes | 153 (21.6%) | 79 (17.6%) |
| 25 to 29 Minutes | 31 (4.4%) | 42 (9.3%) |
| 30 to 34 Minutes | 166 (23.5%) | 30 (6.7%) |
| 35 to 39 Minutes | 24 (3.4%) | 37 (8.2%) |
| 40 to 44 Minutes | 13 (1.8%) | 22 (4.9%) |
| 45 to 59 Minutes | 64 (9.0%) | 44 (9.8%) |
| 60 to 89 Minutes | 91 (12.9%) | 25 (5.6%) |
| 90 or more Minutes | 9 (1.3%) | 0 (0.0%) |
Time of Departure to Work by Sex in Villa Ridge
The most frequent times of departure to work in Villa Ridge are 7:00 AM to 7:29 AM (137, 19.4%) for males and 7:30 AM to 7:59 AM (96, 21.3%) for females.
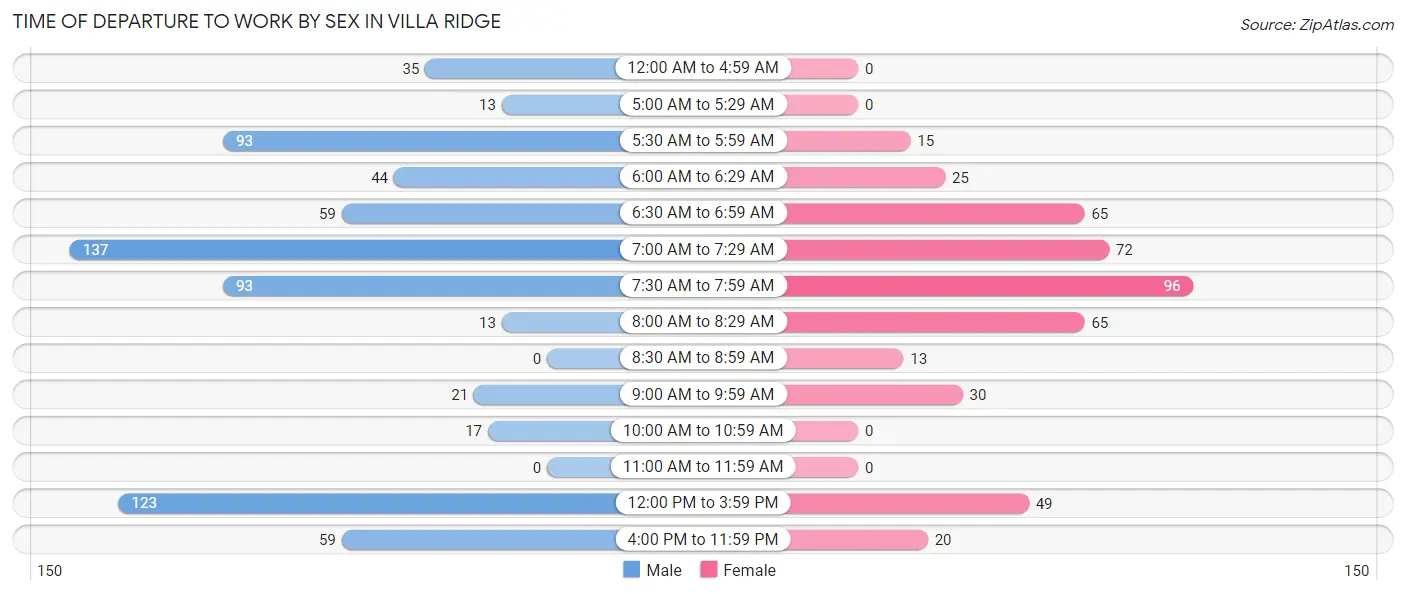
| Time of Departure | Male | Female |
| 12:00 AM to 4:59 AM | 35 (5.0%) | 0 (0.0%) |
| 5:00 AM to 5:29 AM | 13 (1.8%) | 0 (0.0%) |
| 5:30 AM to 5:59 AM | 93 (13.2%) | 15 (3.3%) |
| 6:00 AM to 6:29 AM | 44 (6.2%) | 25 (5.6%) |
| 6:30 AM to 6:59 AM | 59 (8.4%) | 65 (14.4%) |
| 7:00 AM to 7:29 AM | 137 (19.4%) | 72 (16.0%) |
| 7:30 AM to 7:59 AM | 93 (13.2%) | 96 (21.3%) |
| 8:00 AM to 8:29 AM | 13 (1.8%) | 65 (14.4%) |
| 8:30 AM to 8:59 AM | 0 (0.0%) | 13 (2.9%) |
| 9:00 AM to 9:59 AM | 21 (3.0%) | 30 (6.7%) |
| 10:00 AM to 10:59 AM | 17 (2.4%) | 0 (0.0%) |
| 11:00 AM to 11:59 AM | 0 (0.0%) | 0 (0.0%) |
| 12:00 PM to 3:59 PM | 123 (17.4%) | 49 (10.9%) |
| 4:00 PM to 11:59 PM | 59 (8.4%) | 20 (4.4%) |
| Total | 707 (100.0%) | 450 (100.0%) |
Housing Occupancy in Villa Ridge
Occupancy by Ownership in Villa Ridge
Of the total 1,012 dwellings in Villa Ridge, owner-occupied units account for 833 (82.3%), while renter-occupied units make up 179 (17.7%).
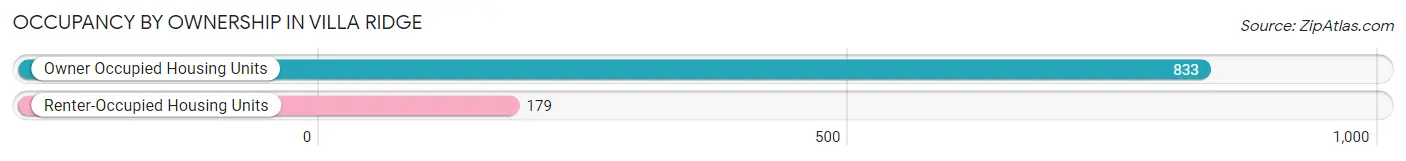
| Occupancy | # Housing Units | % Housing Units |
| Owner Occupied Housing Units | 833 | 82.3% |
| Renter-Occupied Housing Units | 179 | 17.7% |
| Total Occupied Housing Units | 1,012 | 100.0% |
Occupancy by Household Size in Villa Ridge
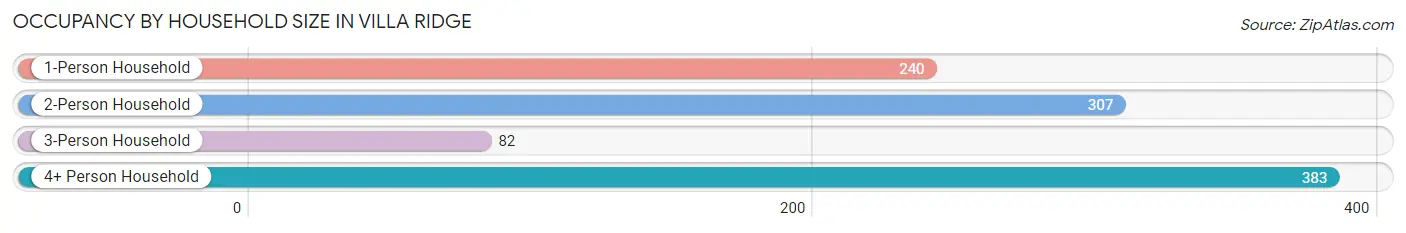
| Household Size | # Housing Units | % Housing Units |
| 1-Person Household | 240 | 23.7% |
| 2-Person Household | 307 | 30.3% |
| 3-Person Household | 82 | 8.1% |
| 4+ Person Household | 383 | 37.9% |
| Total Housing Units | 1,012 | 100.0% |
Occupancy by Ownership by Household Size in Villa Ridge
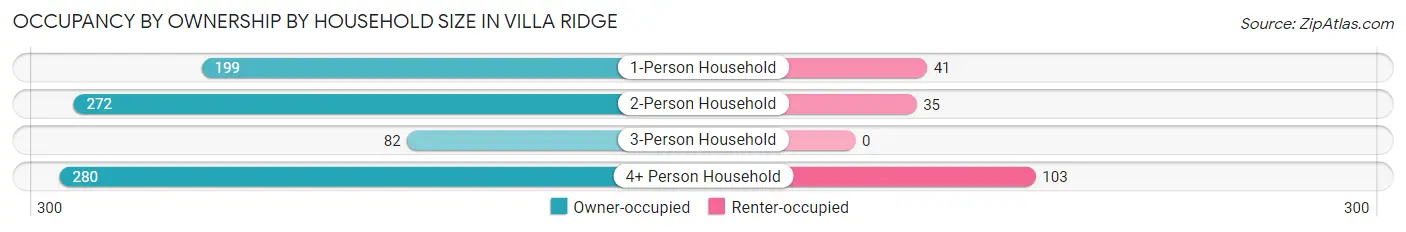
| Household Size | Owner-occupied | Renter-occupied |
| 1-Person Household | 199 (82.9%) | 41 (17.1%) |
| 2-Person Household | 272 (88.6%) | 35 (11.4%) |
| 3-Person Household | 82 (100.0%) | 0 (0.0%) |
| 4+ Person Household | 280 (73.1%) | 103 (26.9%) |
| Total Housing Units | 833 (82.3%) | 179 (17.7%) |
Occupancy by Educational Attainment in Villa Ridge
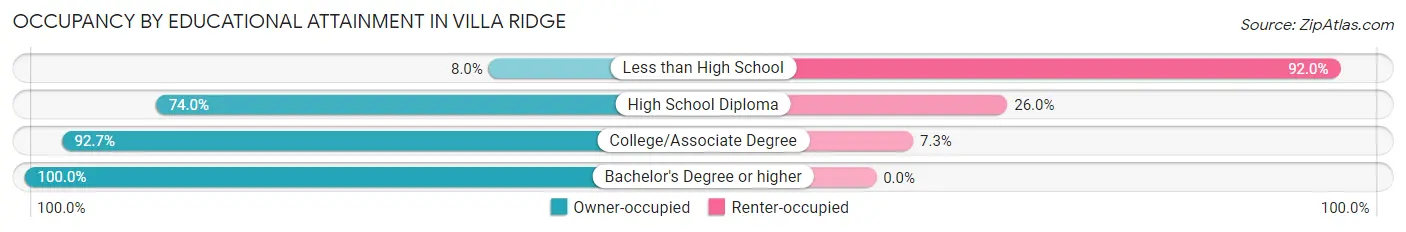
| Household Size | Owner-occupied | Renter-occupied |
| Less than High School | 6 (8.0%) | 69 (92.0%) |
| High School Diploma | 222 (74.0%) | 78 (26.0%) |
| College/Associate Degree | 405 (92.7%) | 32 (7.3%) |
| Bachelor's Degree or higher | 200 (100.0%) | 0 (0.0%) |
Occupancy by Age of Householder in Villa Ridge
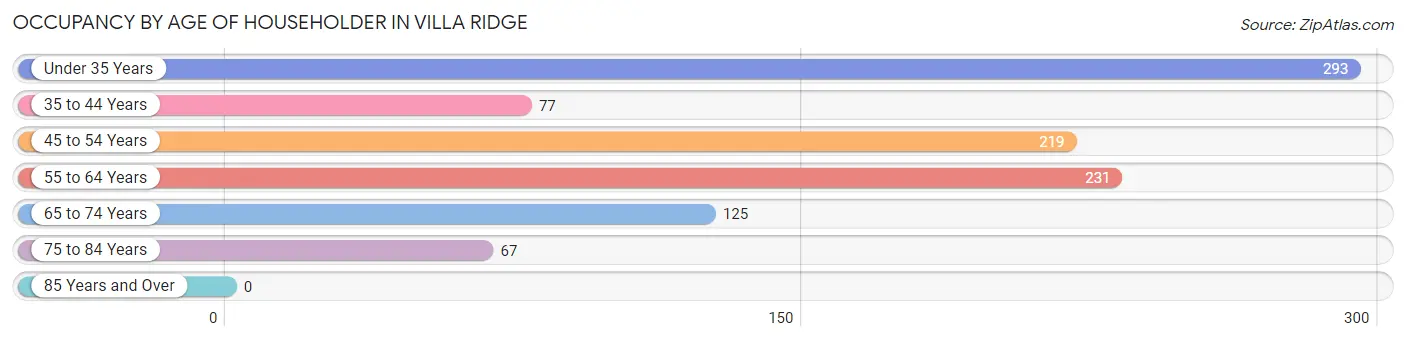
| Age Bracket | # Households | % Households |
| Under 35 Years | 293 | 28.9% |
| 35 to 44 Years | 77 | 7.6% |
| 45 to 54 Years | 219 | 21.6% |
| 55 to 64 Years | 231 | 22.8% |
| 65 to 74 Years | 125 | 12.3% |
| 75 to 84 Years | 67 | 6.6% |
| 85 Years and Over | 0 | 0.0% |
| Total | 1,012 | 100.0% |
Housing Finances in Villa Ridge
Median Income by Occupancy in Villa Ridge
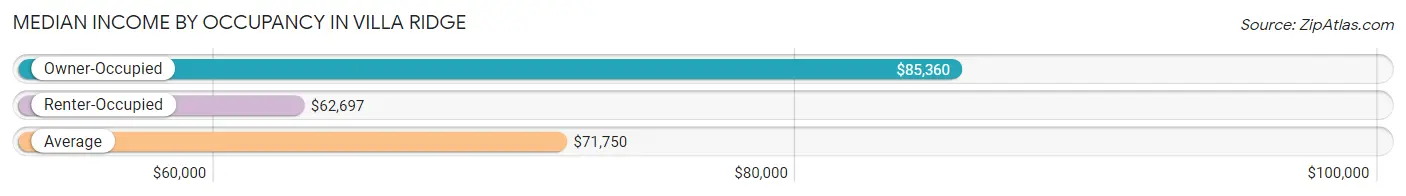
| Occupancy Type | # Households | Median Income |
| Owner-Occupied | 833 (82.3%) | $85,360 |
| Renter-Occupied | 179 (17.7%) | $62,697 |
| Average | 1,012 (100.0%) | $71,750 |
Occupancy by Householder Income Bracket in Villa Ridge

| Income Bracket | Owner-occupied | Renter-occupied |
| Less than $5,000 | 0 (0.0%) | 0 (0.0%) |
| $5,000 to $9,999 | 0 (0.0%) | 0 (0.0%) |
| $10,000 to $14,999 | 0 (0.0%) | 0 (0.0%) |
| $15,000 to $19,999 | 28 (3.4%) | 0 (0.0%) |
| $20,000 to $24,999 | 19 (2.3%) | 0 (0.0%) |
| $25,000 to $34,999 | 49 (5.9%) | 49 (27.4%) |
| $35,000 to $49,999 | 95 (11.4%) | 29 (16.2%) |
| $50,000 to $74,999 | 198 (23.8%) | 57 (31.8%) |
| $75,000 to $99,999 | 220 (26.4%) | 17 (9.5%) |
| $100,000 to $149,999 | 171 (20.5%) | 27 (15.1%) |
| $150,000 or more | 53 (6.4%) | 0 (0.0%) |
| Total | 833 (100.0%) | 179 (100.0%) |
Monthly Housing Cost Tiers in Villa Ridge
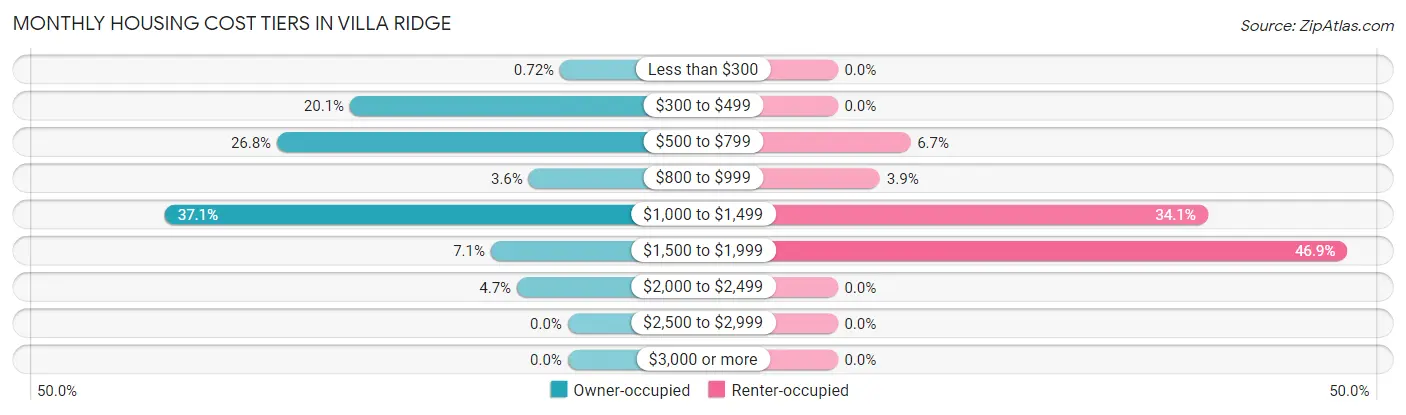
| Monthly Cost | Owner-occupied | Renter-occupied |
| Less than $300 | 6 (0.7%) | 0 (0.0%) |
| $300 to $499 | 167 (20.1%) | 0 (0.0%) |
| $500 to $799 | 223 (26.8%) | 12 (6.7%) |
| $800 to $999 | 30 (3.6%) | 7 (3.9%) |
| $1,000 to $1,499 | 309 (37.1%) | 61 (34.1%) |
| $1,500 to $1,999 | 59 (7.1%) | 84 (46.9%) |
| $2,000 to $2,499 | 39 (4.7%) | 0 (0.0%) |
| $2,500 to $2,999 | 0 (0.0%) | 0 (0.0%) |
| $3,000 or more | 0 (0.0%) | 0 (0.0%) |
| Total | 833 (100.0%) | 179 (100.0%) |
Physical Housing Characteristics in Villa Ridge
Housing Structures in Villa Ridge
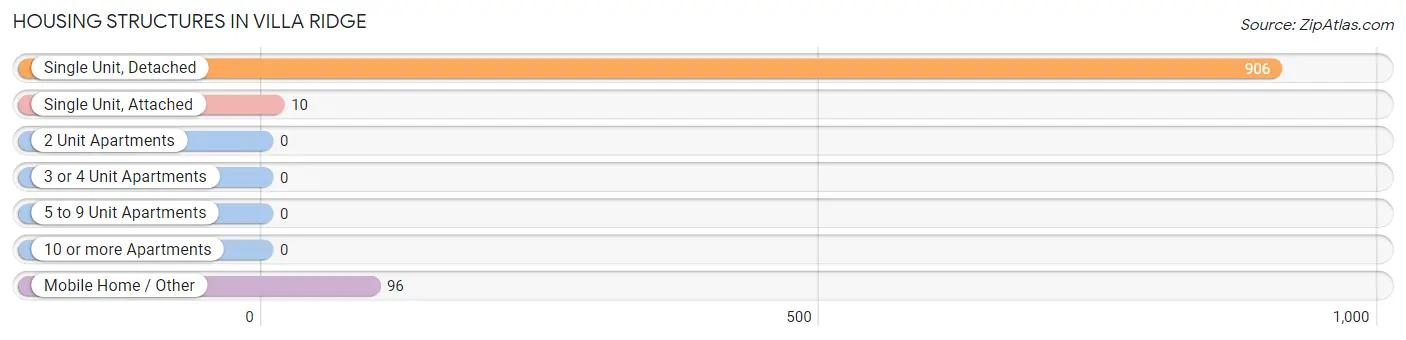
| Structure Type | # Housing Units | % Housing Units |
| Single Unit, Detached | 906 | 89.5% |
| Single Unit, Attached | 10 | 1.0% |
| 2 Unit Apartments | 0 | 0.0% |
| 3 or 4 Unit Apartments | 0 | 0.0% |
| 5 to 9 Unit Apartments | 0 | 0.0% |
| 10 or more Apartments | 0 | 0.0% |
| Mobile Home / Other | 96 | 9.5% |
| Total | 1,012 | 100.0% |
Housing Structures by Occupancy in Villa Ridge
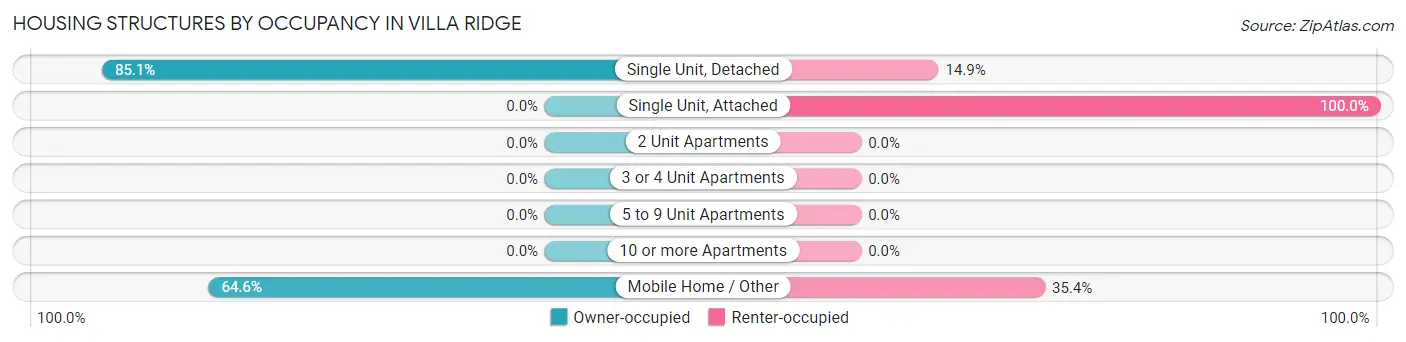
| Structure Type | Owner-occupied | Renter-occupied |
| Single Unit, Detached | 771 (85.1%) | 135 (14.9%) |
| Single Unit, Attached | 0 (0.0%) | 10 (100.0%) |
| 2 Unit Apartments | 0 (0.0%) | 0 (0.0%) |
| 3 or 4 Unit Apartments | 0 (0.0%) | 0 (0.0%) |
| 5 to 9 Unit Apartments | 0 (0.0%) | 0 (0.0%) |
| 10 or more Apartments | 0 (0.0%) | 0 (0.0%) |
| Mobile Home / Other | 62 (64.6%) | 34 (35.4%) |
| Total | 833 (82.3%) | 179 (17.7%) |
Housing Structures by Number of Rooms in Villa Ridge
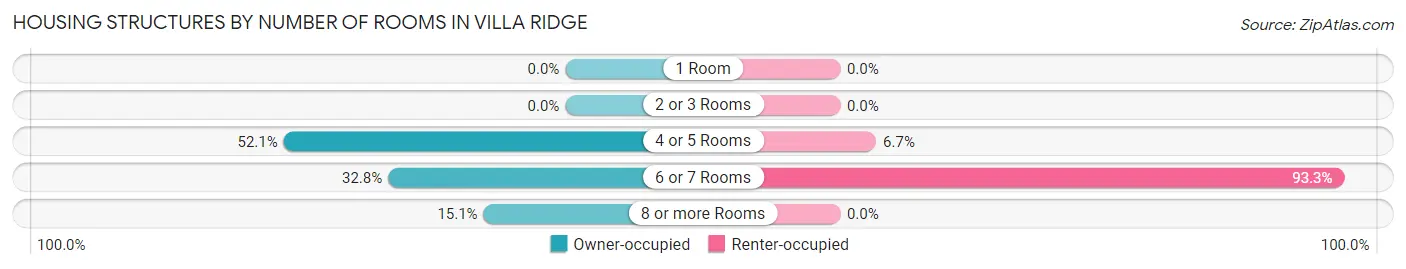
| Number of Rooms | Owner-occupied | Renter-occupied |
| 1 Room | 0 (0.0%) | 0 (0.0%) |
| 2 or 3 Rooms | 0 (0.0%) | 0 (0.0%) |
| 4 or 5 Rooms | 434 (52.1%) | 12 (6.7%) |
| 6 or 7 Rooms | 273 (32.8%) | 167 (93.3%) |
| 8 or more Rooms | 126 (15.1%) | 0 (0.0%) |
| Total | 833 (100.0%) | 179 (100.0%) |
Housing Structure by Heating Type in Villa Ridge
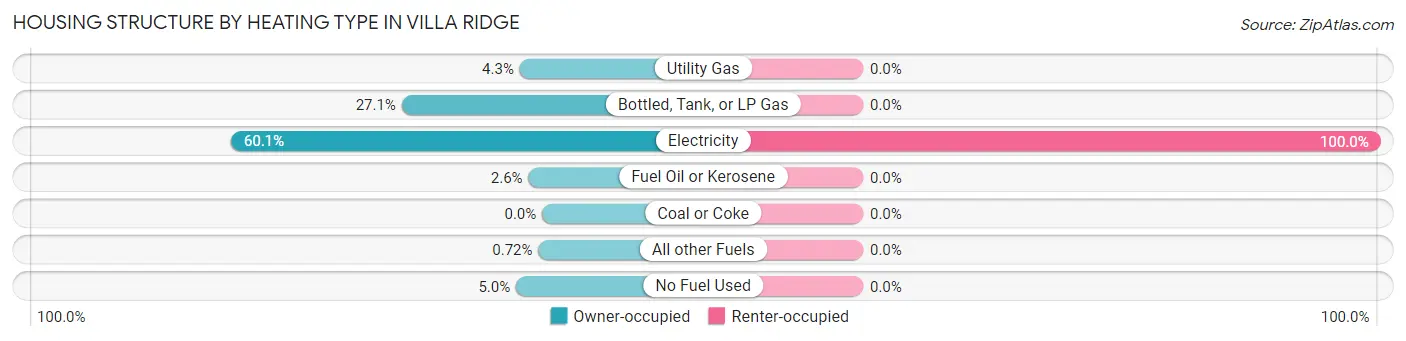
| Heating Type | Owner-occupied | Renter-occupied |
| Utility Gas | 36 (4.3%) | 0 (0.0%) |
| Bottled, Tank, or LP Gas | 226 (27.1%) | 0 (0.0%) |
| Electricity | 501 (60.1%) | 179 (100.0%) |
| Fuel Oil or Kerosene | 22 (2.6%) | 0 (0.0%) |
| Coal or Coke | 0 (0.0%) | 0 (0.0%) |
| All other Fuels | 6 (0.7%) | 0 (0.0%) |
| No Fuel Used | 42 (5.0%) | 0 (0.0%) |
| Total | 833 (100.0%) | 179 (100.0%) |
Household Vehicle Usage in Villa Ridge
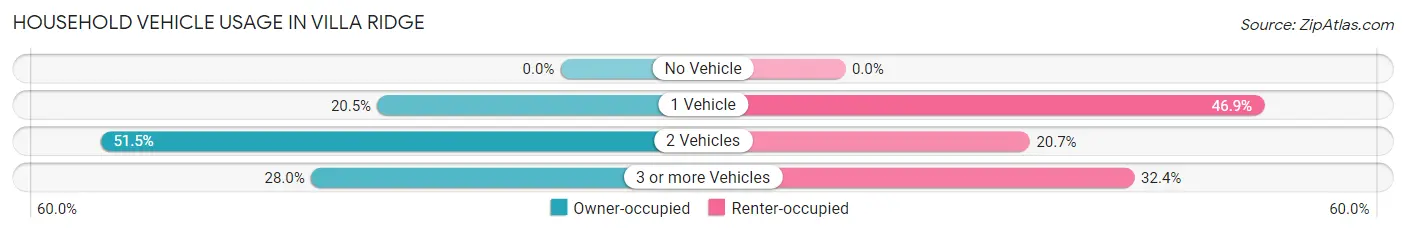
| Vehicles per Household | Owner-occupied | Renter-occupied |
| No Vehicle | 0 (0.0%) | 0 (0.0%) |
| 1 Vehicle | 171 (20.5%) | 84 (46.9%) |
| 2 Vehicles | 429 (51.5%) | 37 (20.7%) |
| 3 or more Vehicles | 233 (28.0%) | 58 (32.4%) |
| Total | 833 (100.0%) | 179 (100.0%) |
Real Estate & Mortgages in Villa Ridge
Real Estate and Mortgage Overview in Villa Ridge
| Characteristic | Without Mortgage | With Mortgage |
| Housing Units | 308 | 525 |
| Median Property Value | $122,900 | $160,800 |
| Median Household Income | $47,200 | $53 |
| Monthly Housing Costs | $484 | $0 |
| Real Estate Taxes | $1,333 | $16 |
Property Value by Mortgage Status in Villa Ridge
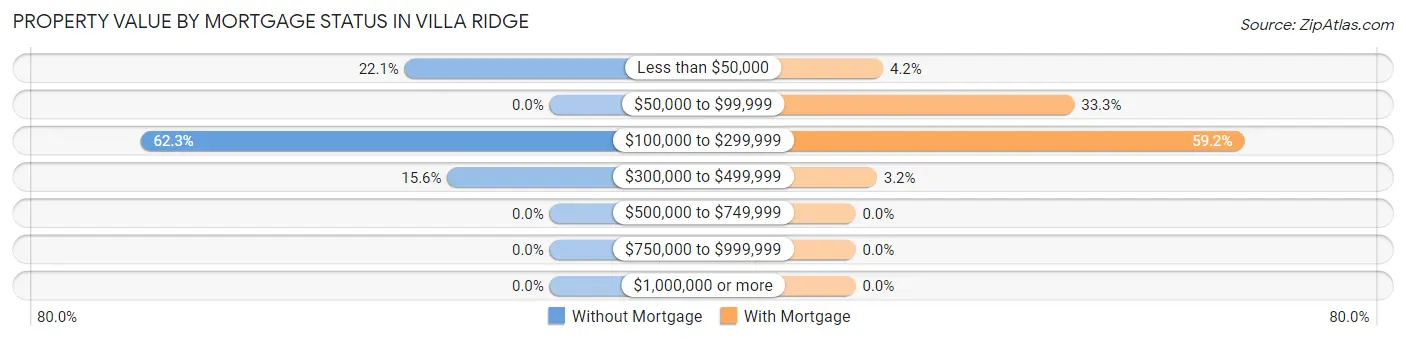
| Property Value | Without Mortgage | With Mortgage |
| Less than $50,000 | 68 (22.1%) | 22 (4.2%) |
| $50,000 to $99,999 | 0 (0.0%) | 175 (33.3%) |
| $100,000 to $299,999 | 192 (62.3%) | 311 (59.2%) |
| $300,000 to $499,999 | 48 (15.6%) | 17 (3.2%) |
| $500,000 to $749,999 | 0 (0.0%) | 0 (0.0%) |
| $750,000 to $999,999 | 0 (0.0%) | 0 (0.0%) |
| $1,000,000 or more | 0 (0.0%) | 0 (0.0%) |
| Total | 308 (100.0%) | 525 (100.0%) |
Household Income by Mortgage Status in Villa Ridge
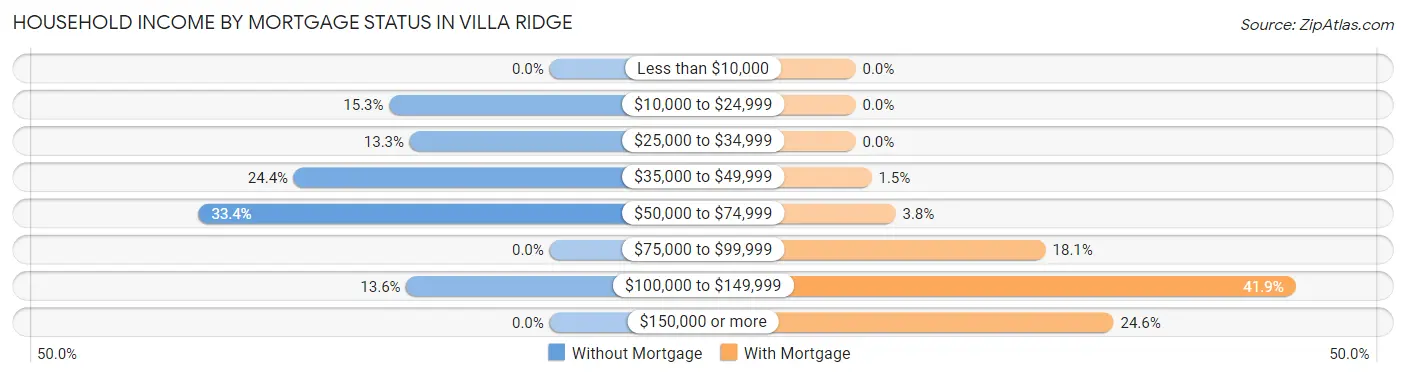
| Household Income | Without Mortgage | With Mortgage |
| Less than $10,000 | 0 (0.0%) | 0 (0.0%) |
| $10,000 to $24,999 | 47 (15.3%) | 0 (0.0%) |
| $25,000 to $34,999 | 41 (13.3%) | 0 (0.0%) |
| $35,000 to $49,999 | 75 (24.3%) | 8 (1.5%) |
| $50,000 to $74,999 | 103 (33.4%) | 20 (3.8%) |
| $75,000 to $99,999 | 0 (0.0%) | 95 (18.1%) |
| $100,000 to $149,999 | 42 (13.6%) | 220 (41.9%) |
| $150,000 or more | 0 (0.0%) | 129 (24.6%) |
| Total | 308 (100.0%) | 525 (100.0%) |
Property Value to Household Income Ratio in Villa Ridge
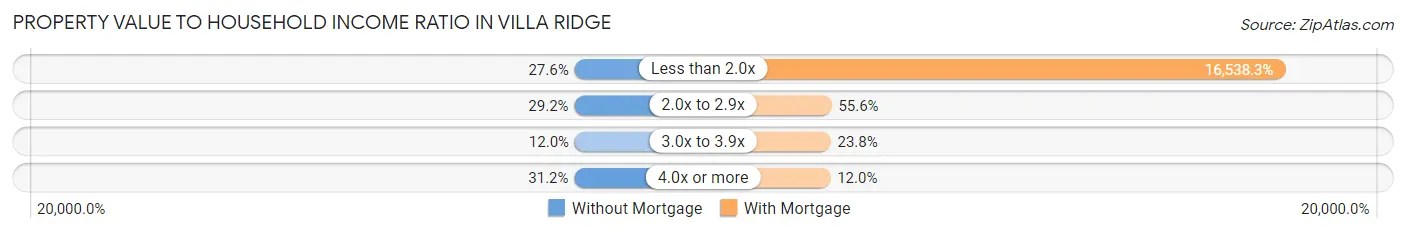
| Value-to-Income Ratio | Without Mortgage | With Mortgage |
| Less than 2.0x | 85 (27.6%) | 86,826 (16,538.3%) |
| 2.0x to 2.9x | 90 (29.2%) | 292 (55.6%) |
| 3.0x to 3.9x | 37 (12.0%) | 125 (23.8%) |
| 4.0x or more | 96 (31.2%) | 63 (12.0%) |
| Total | 308 (100.0%) | 525 (100.0%) |
Real Estate Taxes by Mortgage Status in Villa Ridge

| Property Taxes | Without Mortgage | With Mortgage |
| Less than $800 | 60 (19.5%) | 0 (0.0%) |
| $800 to $1,499 | 126 (40.9%) | 28 (5.3%) |
| $800 to $1,499 | 102 (33.1%) | 243 (46.3%) |
| Total | 308 (100.0%) | 525 (100.0%) |
Health & Disability in Villa Ridge
Health Insurance Coverage by Age in Villa Ridge
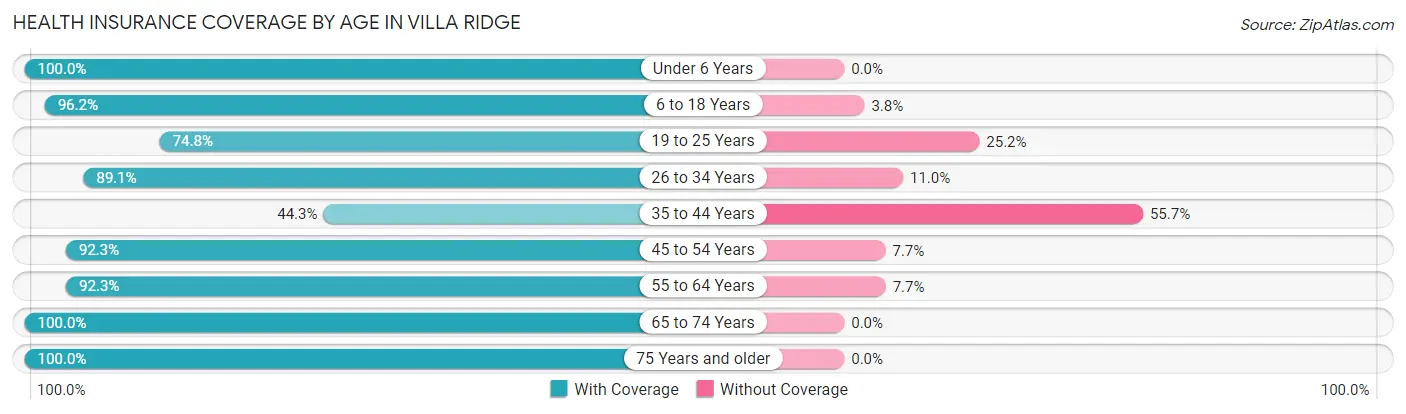
| Age Bracket | With Coverage | Without Coverage |
| Under 6 Years | 348 (100.0%) | 0 (0.0%) |
| 6 to 18 Years | 435 (96.2%) | 17 (3.8%) |
| 19 to 25 Years | 101 (74.8%) | 34 (25.2%) |
| 26 to 34 Years | 496 (89.0%) | 61 (11.0%) |
| 35 to 44 Years | 175 (44.3%) | 220 (55.7%) |
| 45 to 54 Years | 300 (92.3%) | 25 (7.7%) |
| 55 to 64 Years | 358 (92.3%) | 30 (7.7%) |
| 65 to 74 Years | 247 (100.0%) | 0 (0.0%) |
| 75 Years and older | 124 (100.0%) | 0 (0.0%) |
| Total | 2,584 (87.0%) | 387 (13.0%) |
Health Insurance Coverage by Citizenship Status in Villa Ridge

| Citizenship Status | With Coverage | Without Coverage |
| Native Born | 348 (100.0%) | 0 (0.0%) |
| Foreign Born, Citizen | 435 (96.2%) | 17 (3.8%) |
| Foreign Born, not a Citizen | 101 (74.8%) | 34 (25.2%) |
Health Insurance Coverage by Household Income in Villa Ridge

| Household Income | With Coverage | Without Coverage |
| Under $25,000 | 86 (81.9%) | 19 (18.1%) |
| $25,000 to $49,999 | 461 (97.5%) | 12 (2.5%) |
| $50,000 to $74,999 | 603 (97.3%) | 17 (2.7%) |
| $75,000 to $99,999 | 618 (68.9%) | 279 (31.1%) |
| $100,000 and over | 816 (93.1%) | 60 (6.9%) |
Public vs Private Health Insurance Coverage by Age in Villa Ridge
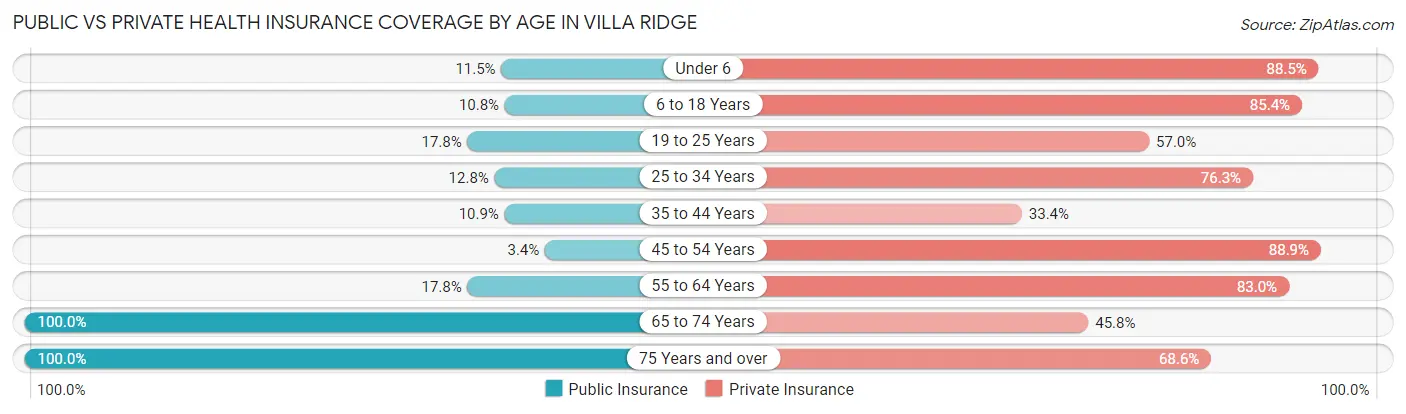
| Age Bracket | Public Insurance | Private Insurance |
| Under 6 | 40 (11.5%) | 308 (88.5%) |
| 6 to 18 Years | 49 (10.8%) | 386 (85.4%) |
| 19 to 25 Years | 24 (17.8%) | 77 (57.0%) |
| 25 to 34 Years | 71 (12.8%) | 425 (76.3%) |
| 35 to 44 Years | 43 (10.9%) | 132 (33.4%) |
| 45 to 54 Years | 11 (3.4%) | 289 (88.9%) |
| 55 to 64 Years | 69 (17.8%) | 322 (83.0%) |
| 65 to 74 Years | 247 (100.0%) | 113 (45.8%) |
| 75 Years and over | 124 (100.0%) | 85 (68.5%) |
| Total | 678 (22.8%) | 2,137 (71.9%) |
Disability Status by Sex by Age in Villa Ridge
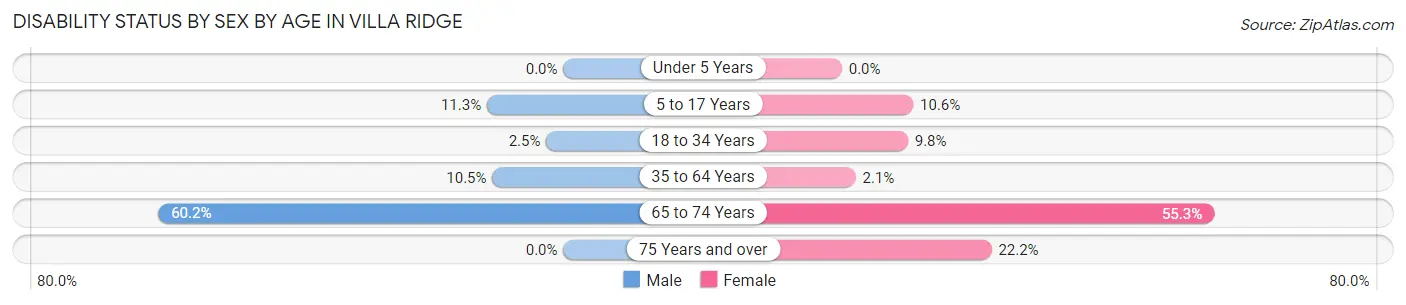
| Age Bracket | Male | Female |
| Under 5 Years | 0 (0.0%) | 0 (0.0%) |
| 5 to 17 Years | 27 (11.3%) | 27 (10.6%) |
| 18 to 34 Years | 12 (2.5%) | 25 (9.8%) |
| 35 to 64 Years | 55 (10.5%) | 12 (2.1%) |
| 65 to 74 Years | 80 (60.2%) | 63 (55.3%) |
| 75 Years and over | 0 (0.0%) | 18 (22.2%) |
Disability Class by Sex by Age in Villa Ridge
Disability Class: Hearing Difficulty
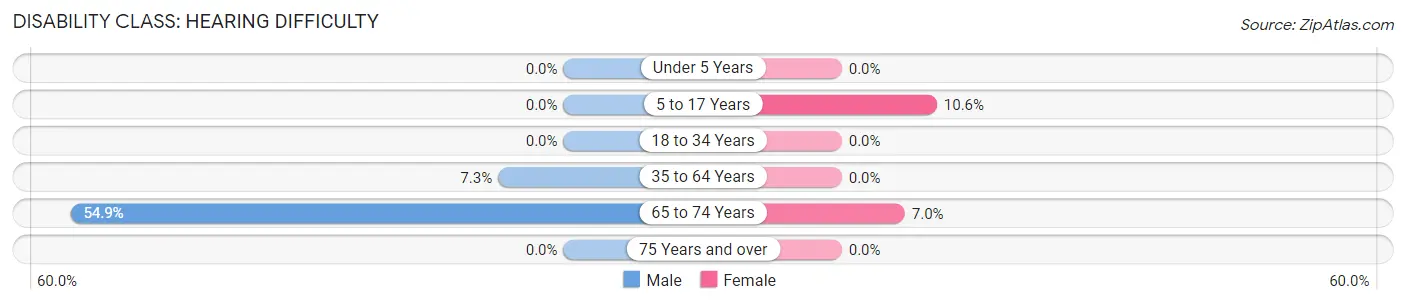
| Age Bracket | Male | Female |
| Under 5 Years | 0 (0.0%) | 0 (0.0%) |
| 5 to 17 Years | 0 (0.0%) | 27 (10.6%) |
| 18 to 34 Years | 0 (0.0%) | 0 (0.0%) |
| 35 to 64 Years | 38 (7.3%) | 0 (0.0%) |
| 65 to 74 Years | 73 (54.9%) | 8 (7.0%) |
| 75 Years and over | 0 (0.0%) | 0 (0.0%) |
Disability Class: Vision Difficulty
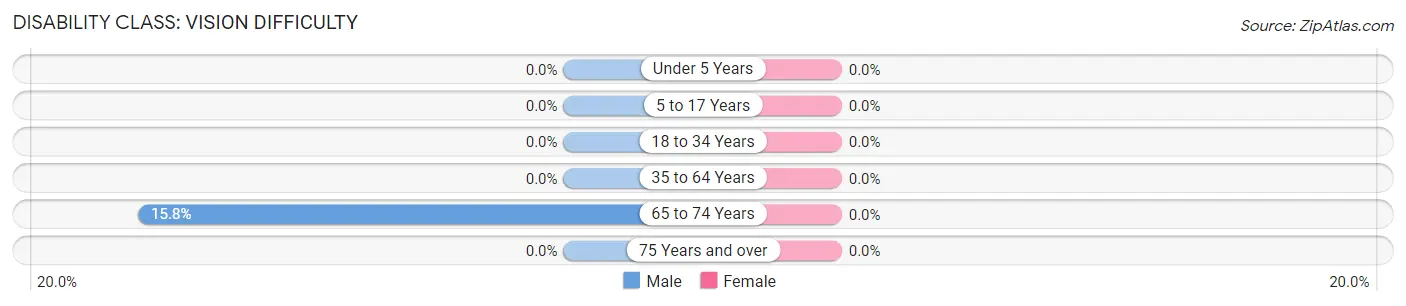
| Age Bracket | Male | Female |
| Under 5 Years | 0 (0.0%) | 0 (0.0%) |
| 5 to 17 Years | 0 (0.0%) | 0 (0.0%) |
| 18 to 34 Years | 0 (0.0%) | 0 (0.0%) |
| 35 to 64 Years | 0 (0.0%) | 0 (0.0%) |
| 65 to 74 Years | 21 (15.8%) | 0 (0.0%) |
| 75 Years and over | 0 (0.0%) | 0 (0.0%) |
Disability Class: Cognitive Difficulty
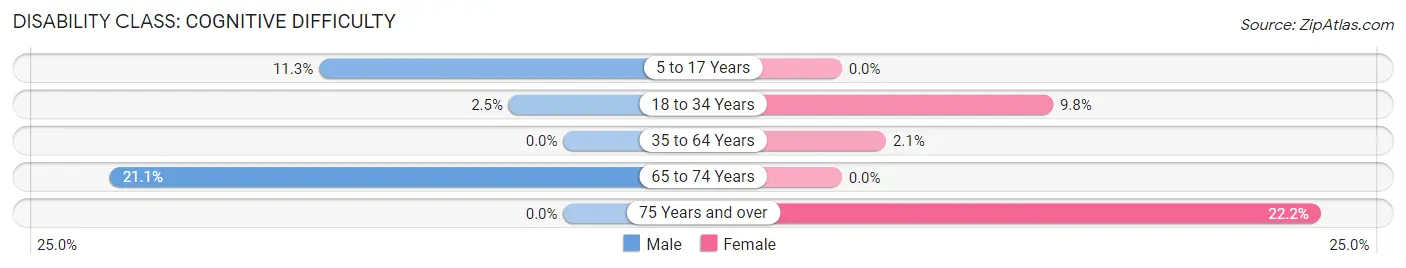
| Age Bracket | Male | Female |
| 5 to 17 Years | 27 (11.3%) | 0 (0.0%) |
| 18 to 34 Years | 12 (2.5%) | 25 (9.8%) |
| 35 to 64 Years | 0 (0.0%) | 12 (2.1%) |
| 65 to 74 Years | 28 (21.0%) | 0 (0.0%) |
| 75 Years and over | 0 (0.0%) | 18 (22.2%) |
Disability Class: Ambulatory Difficulty
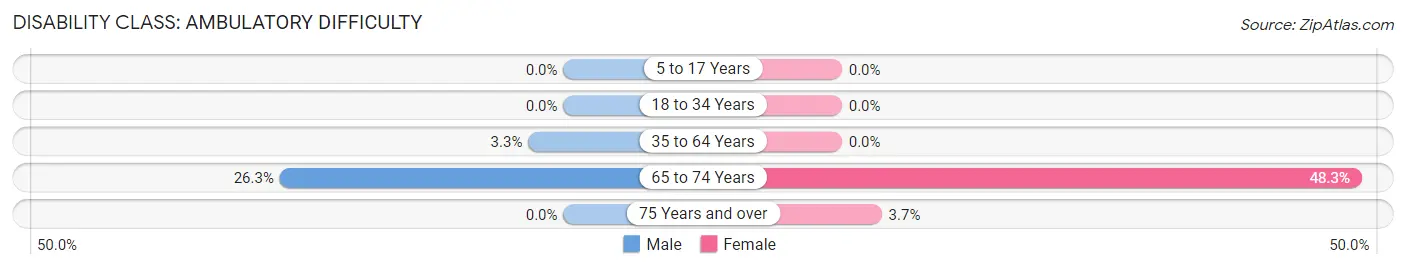
| Age Bracket | Male | Female |
| 5 to 17 Years | 0 (0.0%) | 0 (0.0%) |
| 18 to 34 Years | 0 (0.0%) | 0 (0.0%) |
| 35 to 64 Years | 17 (3.3%) | 0 (0.0%) |
| 65 to 74 Years | 35 (26.3%) | 55 (48.2%) |
| 75 Years and over | 0 (0.0%) | 3 (3.7%) |
Disability Class: Self-Care Difficulty
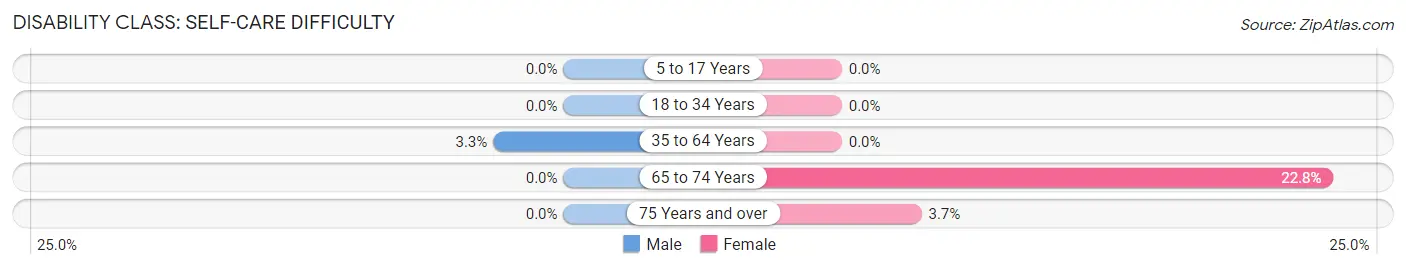
| Age Bracket | Male | Female |
| 5 to 17 Years | 0 (0.0%) | 0 (0.0%) |
| 18 to 34 Years | 0 (0.0%) | 0 (0.0%) |
| 35 to 64 Years | 17 (3.3%) | 0 (0.0%) |
| 65 to 74 Years | 0 (0.0%) | 26 (22.8%) |
| 75 Years and over | 0 (0.0%) | 3 (3.7%) |
Technology Access in Villa Ridge
Computing Device Access in Villa Ridge
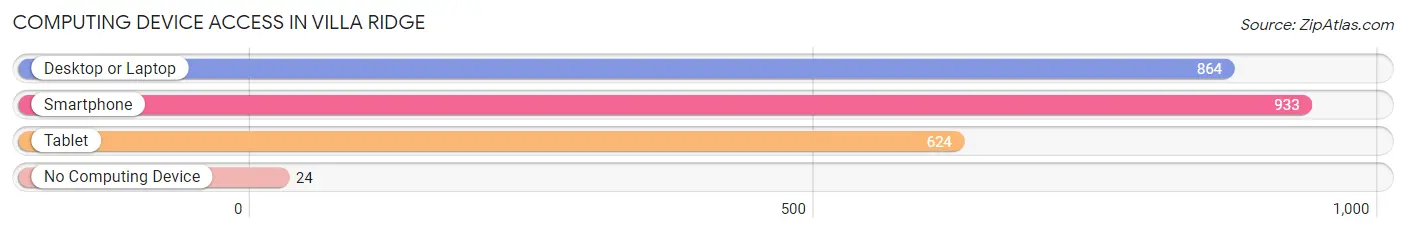
| Device Type | # Households | % Households |
| Desktop or Laptop | 864 | 85.4% |
| Smartphone | 933 | 92.2% |
| Tablet | 624 | 61.7% |
| No Computing Device | 24 | 2.4% |
| Total | 1,012 | 100.0% |
Internet Access in Villa Ridge
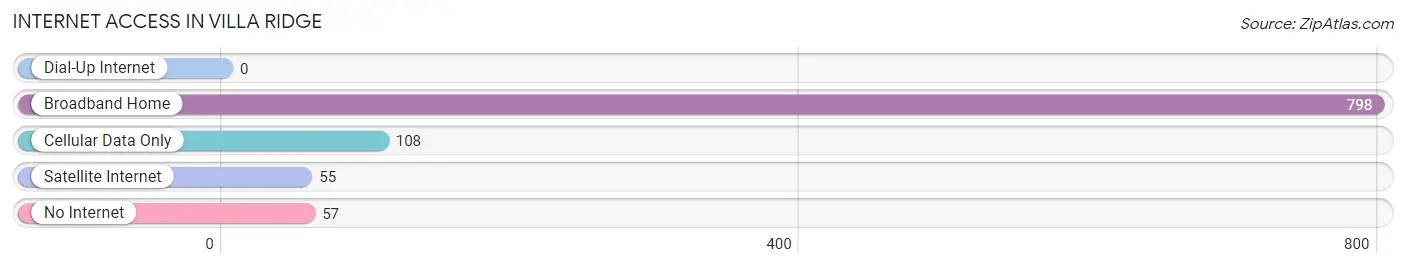
| Internet Type | # Households | % Households |
| Dial-Up Internet | 0 | 0.0% |
| Broadband Home | 798 | 78.8% |
| Cellular Data Only | 108 | 10.7% |
| Satellite Internet | 55 | 5.4% |
| No Internet | 57 | 5.6% |
| Total | 1,012 | 100.0% |
Villa Ridge Summary
Villa Ridge is a small unincorporated community located in Franklin County, Missouri, United States. It is situated along the Meramec River, approximately 25 miles southwest of St. Louis. The population of Villa Ridge was estimated to be 1,093 in the 2010 census.
History
Villa Ridge was founded in 1819 by a group of German immigrants who had settled in the area. The town was originally known as “Villa”, but the name was changed to “Villa Ridge” in 1837. The name was chosen to reflect the rolling hills of the area.
The town was a popular stop for travelers on the St. Louis-San Francisco Railway, which ran through the area in the late 19th century. The railroad brought many new settlers to the area, and the town grew rapidly.
In the early 20th century, Villa Ridge was a thriving agricultural community. The town was home to several large farms, as well as a number of small businesses.
Geography
Villa Ridge is located in Franklin County, Missouri, approximately 25 miles southwest of St. Louis. The town is situated along the Meramec River, and is surrounded by rolling hills and farmland.
The climate in Villa Ridge is humid subtropical, with hot, humid summers and cold, wet winters. The average annual temperature is around 54°F (12°C).
Economy
Villa Ridge is primarily a rural community, and the economy is largely based on agriculture. The town is home to several large farms, as well as a number of small businesses.
The town is also home to a number of manufacturing companies, including a plastics factory and a metal fabrication plant.
Demographics
As of the 2010 census, the population of Villa Ridge was estimated to be 1,093. The racial makeup of the town was 97.3% White, 0.7% African American, 0.3% Native American, 0.2% Asian, and 1.5% from other races.
The median household income in Villa Ridge was $41,250, and the median family income was $50,000. The per capita income was $20,845.
Conclusion
Villa Ridge is a small unincorporated community located in Franklin County, Missouri. It was founded in 1819 by a group of German immigrants, and was originally known as “Villa”. The town was renamed “Villa Ridge” in 1837, and has since grown into a thriving agricultural community. The town is situated along the Meramec River, and is surrounded by rolling hills and farmland. The economy of Villa Ridge is largely based on agriculture, and the town is also home to a number of manufacturing companies. As of the 2010 census, the population of Villa Ridge was estimated to be 1,093.
Common Questions
What is the Total Population of Villa Ridge?
Total Population of Villa Ridge is 2,971.
What is the Total Male Population of Villa Ridge?
Total Male Population of Villa Ridge is 1,604.
What is the Total Female Population of Villa Ridge?
Total Female Population of Villa Ridge is 1,367.
What is the Ratio of Males per 100 Females in Villa Ridge?
There are 117.34 Males per 100 Females in Villa Ridge.
What is the Ratio of Females per 100 Males in Villa Ridge?
There are 85.22 Females per 100 Males in Villa Ridge.
What is the Median Population Age in Villa Ridge?
Median Population Age in Villa Ridge is 35.0 Years.
What is the Average Family Size in Villa Ridge
Average Family Size in Villa Ridge is 3.2 People.
What is the Average Household Size in Villa Ridge
Average Household Size in Villa Ridge is 2.9 People.
What is Per Capita Income in Villa Ridge?
Per Capita income in Villa Ridge is $27,971.
What is the Median Family Income in Villa Ridge?
Median Family Income in Villa Ridge is $86,225.
What is the Median Household income in Villa Ridge?
Median Household Income in Villa Ridge is $71,750.
What is Income or Wage Gap in Villa Ridge?
Income or Wage Gap in Villa Ridge is 42.9%.
Women in Villa Ridge earn 57.1 cents for every dollar earned by a man.
What is Inequality or Gini Index in Villa Ridge?
Inequality or Gini Index in Villa Ridge is 0.28.
How Large is the Labor Force in Villa Ridge?
There are 1,451 People in the Labor Forcein in Villa Ridge.
What is the Percentage of People in the Labor Force in Villa Ridge?
63.4% of People are in the Labor Force in Villa Ridge.
What is the Unemployment Rate in Villa Ridge?
Unemployment Rate in Villa Ridge is 5.8%.