St Thomas, MO
St Thomas Map
St Thomas Overview
249
TOTAL POPULATION
116
MALE POPULATION
133
FEMALE POPULATION
87.22
MALES / 100 FEMALES
114.66
FEMALES / 100 MALES
36.2
MEDIAN AGE
3.1
AVG FAMILY SIZE
2.6
AVG HOUSEHOLD SIZE
$44,589
PER CAPITA INCOME
$94,000
AVG FAMILY INCOME
$82,083
AVG HOUSEHOLD INCOME
21.6%
WAGE / INCOME GAP [ % ]
78.4¢/ $1
WAGE / INCOME GAP [ $ ]
0.42
INEQUALITY / GINI INDEX
150
LABOR FORCE [ PEOPLE ]
76.9%
PERCENT IN LABOR FORCE
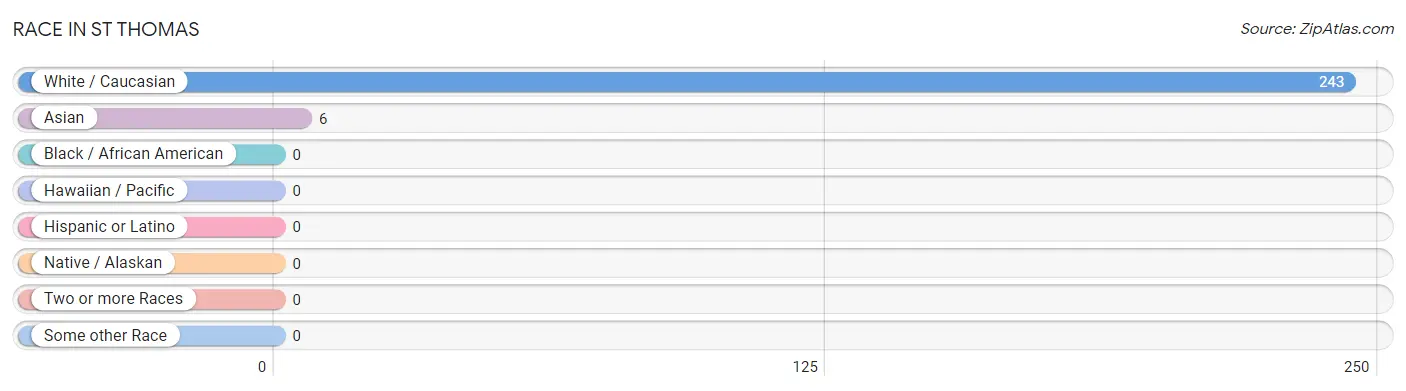
Race in St Thomas
The most populous races in St Thomas are White / Caucasian (243 | 97.6%), and Asian (6 | 2.4%).
| Race | # Population | % Population |
| Asian | 6 | 2.4% |
| Black / African American | 0 | 0.0% |
| Hawaiian / Pacific | 0 | 0.0% |
| Hispanic or Latino | 0 | 0.0% |
| Native / Alaskan | 0 | 0.0% |
| White / Caucasian | 243 | 97.6% |
| Two or more Races | 0 | 0.0% |
| Some other Race | 0 | 0.0% |
| Total | 249 | 100.0% |
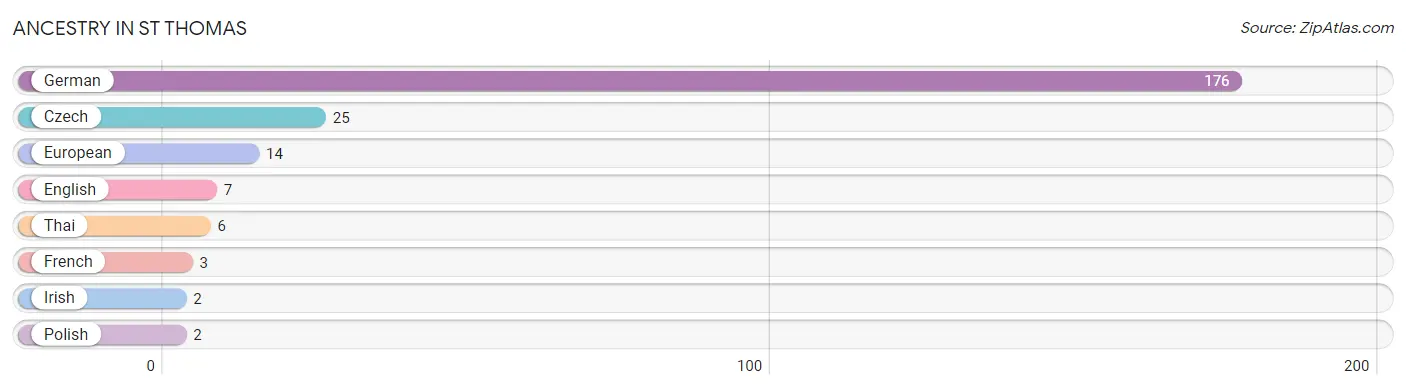
Ancestry in St Thomas
The most populous ancestries reported in St Thomas are German (176 | 70.7%), Czech (25 | 10.0%), European (14 | 5.6%), English (7 | 2.8%), and Thai (6 | 2.4%), together accounting for 91.6% of all St Thomas residents.
| Ancestry | # Population | % Population |
| Czech | 25 | 10.0% |
| English | 7 | 2.8% |
| European | 14 | 5.6% |
| French | 3 | 1.2% |
| German | 176 | 70.7% |
| Irish | 2 | 0.8% |
| Polish | 2 | 0.8% |
| Thai | 6 | 2.4% | View All 8 Rows |
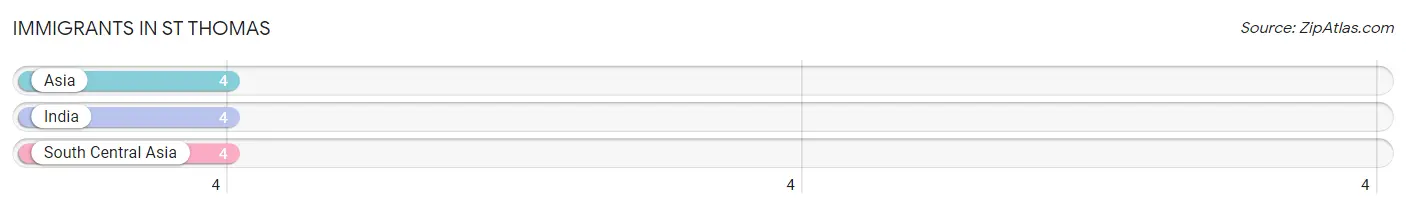
Immigrants in St Thomas
The most numerous immigrant groups reported in St Thomas came from Asia (4 | 1.6%), India (4 | 1.6%), and South Central Asia (4 | 1.6%), together accounting for 4.8% of all St Thomas residents.
| Immigration Origin | # Population | % Population |
| Asia | 4 | 1.6% |
| India | 4 | 1.6% |
| South Central Asia | 4 | 1.6% | View All 3 Rows |
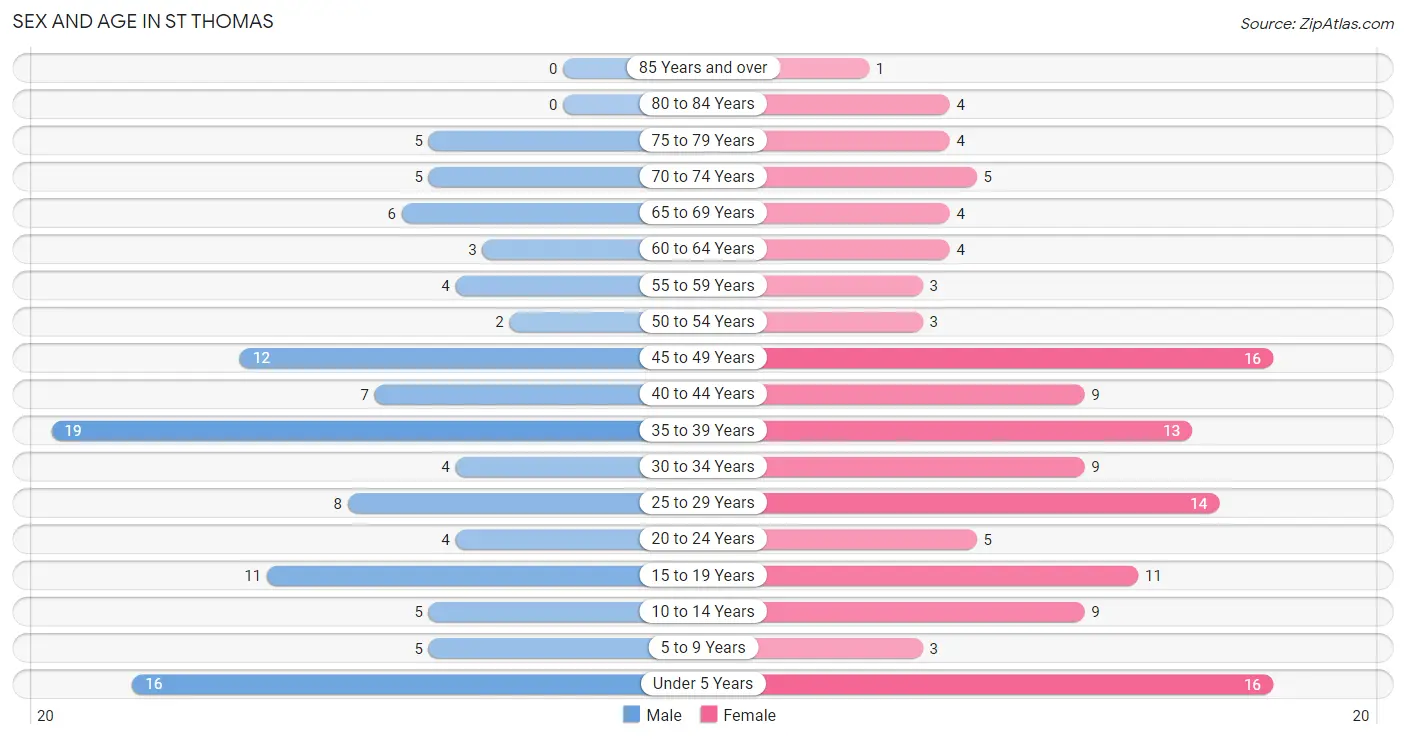
Sex and Age in St Thomas
Sex and Age in St Thomas
The most populous age groups in St Thomas are 35 to 39 Years (19 | 16.4%) for men and Under 5 Years (16 | 12.0%) for women.
| Age Bracket | Male | Female |
| Under 5 Years | 16 (13.8%) | 16 (12.0%) |
| 5 to 9 Years | 5 (4.3%) | 3 (2.3%) |
| 10 to 14 Years | 5 (4.3%) | 9 (6.8%) |
| 15 to 19 Years | 11 (9.5%) | 11 (8.3%) |
| 20 to 24 Years | 4 (3.5%) | 5 (3.8%) |
| 25 to 29 Years | 8 (6.9%) | 14 (10.5%) |
| 30 to 34 Years | 4 (3.5%) | 9 (6.8%) |
| 35 to 39 Years | 19 (16.4%) | 13 (9.8%) |
| 40 to 44 Years | 7 (6.0%) | 9 (6.8%) |
| 45 to 49 Years | 12 (10.3%) | 16 (12.0%) |
| 50 to 54 Years | 2 (1.7%) | 3 (2.3%) |
| 55 to 59 Years | 4 (3.5%) | 3 (2.3%) |
| 60 to 64 Years | 3 (2.6%) | 4 (3.0%) |
| 65 to 69 Years | 6 (5.2%) | 4 (3.0%) |
| 70 to 74 Years | 5 (4.3%) | 5 (3.8%) |
| 75 to 79 Years | 5 (4.3%) | 4 (3.0%) |
| 80 to 84 Years | 0 (0.0%) | 4 (3.0%) |
| 85 Years and over | 0 (0.0%) | 1 (0.7%) |
| Total | 116 (100.0%) | 133 (100.0%) |
Families and Households in St Thomas
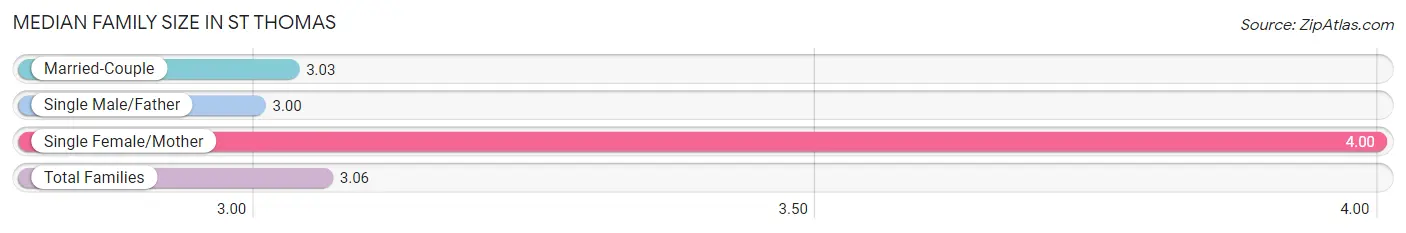
Median Family Size in St Thomas
The median family size in St Thomas is 3.06 persons per family, with single female/mother families (2 | 2.9%) accounting for the largest median family size of 4 persons per family. On the other hand, single male/father families (1 | 1.4%) represent the smallest median family size with 3.00 persons per family.
| Family Type | # Families | Family Size |
| Married-Couple | 67 (95.7%) | 3.03 |
| Single Male/Father | 1 (1.4%) | 3.00 |
| Single Female/Mother | 2 (2.9%) | 4.00 |
| Total Families | 70 (100.0%) | 3.06 |
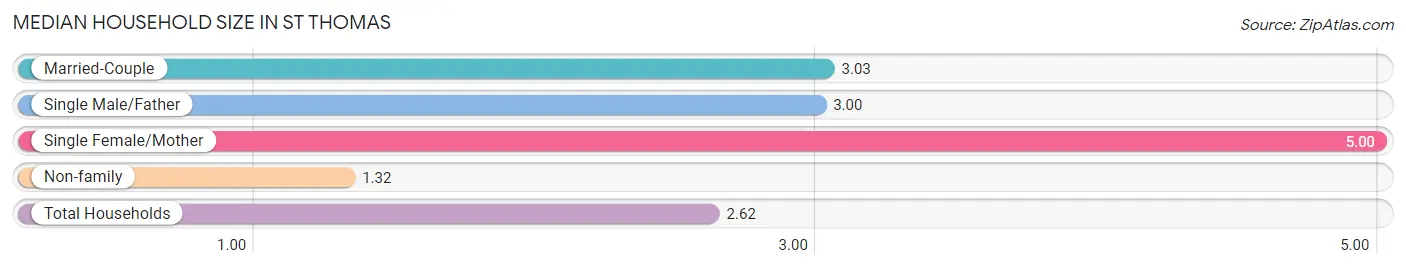
Median Household Size in St Thomas
The median household size in St Thomas is 2.62 persons per household, with single female/mother households (2 | 2.1%) accounting for the largest median household size of 5 persons per household. non-family households (25 | 26.3%) represent the smallest median household size with 1.32 persons per household.
| Household Type | # Households | Household Size |
| Married-Couple | 67 (70.5%) | 3.03 |
| Single Male/Father | 1 (1.1%) | 3.00 |
| Single Female/Mother | 2 (2.1%) | 5.00 |
| Non-family | 25 (26.3%) | 1.32 |
| Total Households | 95 (100.0%) | 2.62 |
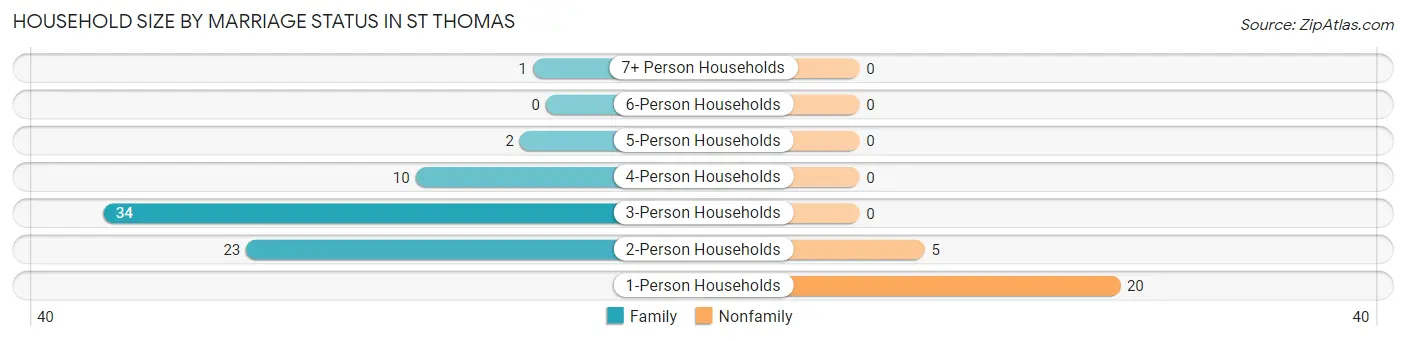
Household Size by Marriage Status in St Thomas
Out of a total of 95 households in St Thomas, 70 (73.7%) are family households, while 25 (26.3%) are nonfamily households. The most numerous type of family households are 3-person households, comprising 34, and the most common type of nonfamily households are 1-person households, comprising 20.
| Household Size | Family Households | Nonfamily Households |
| 1-Person Households | - | 20 (21.0%) |
| 2-Person Households | 23 (24.2%) | 5 (5.3%) |
| 3-Person Households | 34 (35.8%) | 0 (0.0%) |
| 4-Person Households | 10 (10.5%) | 0 (0.0%) |
| 5-Person Households | 2 (2.1%) | 0 (0.0%) |
| 6-Person Households | 0 (0.0%) | 0 (0.0%) |
| 7+ Person Households | 1 (1.1%) | 0 (0.0%) |
| Total | 70 (73.7%) | 25 (26.3%) |
Female Fertility in St Thomas
Fertility by Age in St Thomas
Average fertility rate in St Thomas is 78.0 births per 1,000 women. Women in the age bracket of 20 to 34 years have the highest fertility rate with 214.0 births per 1,000 women. Women in the age bracket of 20 to 34 years acount for 100.0% of all women with births.
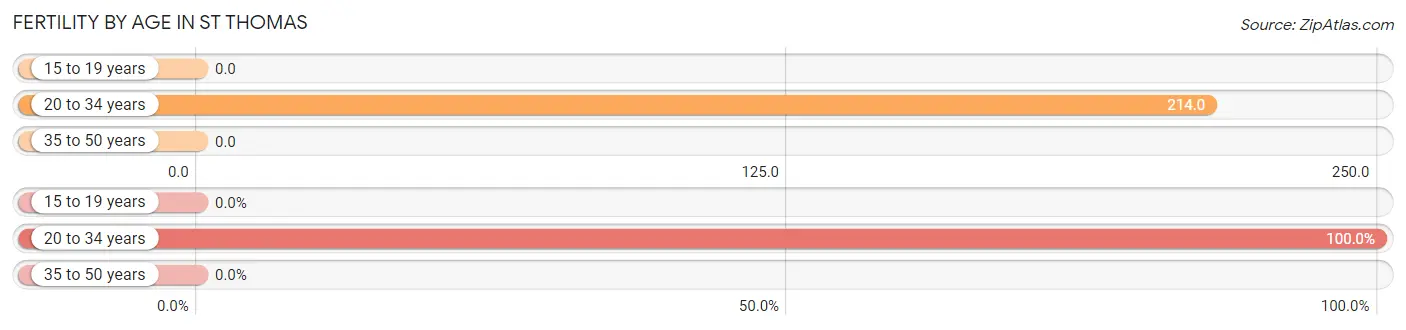
| Age Bracket | Women with Births | Births / 1,000 Women |
| 15 to 19 years | 0 (0.0%) | 0.0 |
| 20 to 34 years | 6 (100.0%) | 214.0 |
| 35 to 50 years | 0 (0.0%) | 0.0 |
| Total | 6 (100.0%) | 78.0 |
Fertility by Age by Marriage Status in St Thomas
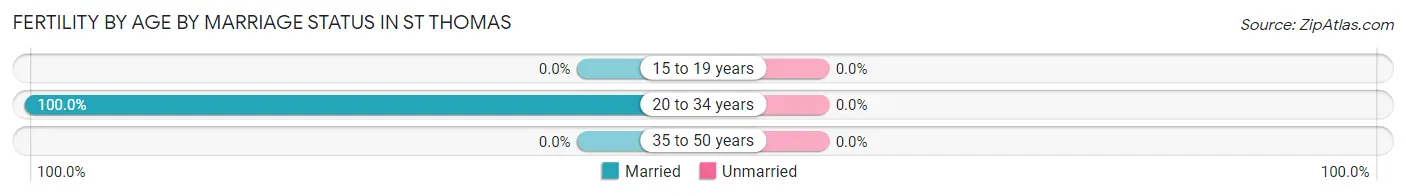
| Age Bracket | Married | Unmarried |
| 15 to 19 years | 0 (0.0%) | 0 (0.0%) |
| 20 to 34 years | 6 (100.0%) | 0 (0.0%) |
| 35 to 50 years | 0 (0.0%) | 0 (0.0%) |
| Total | 6 (100.0%) | 0 (0.0%) |
Fertility by Education in St Thomas
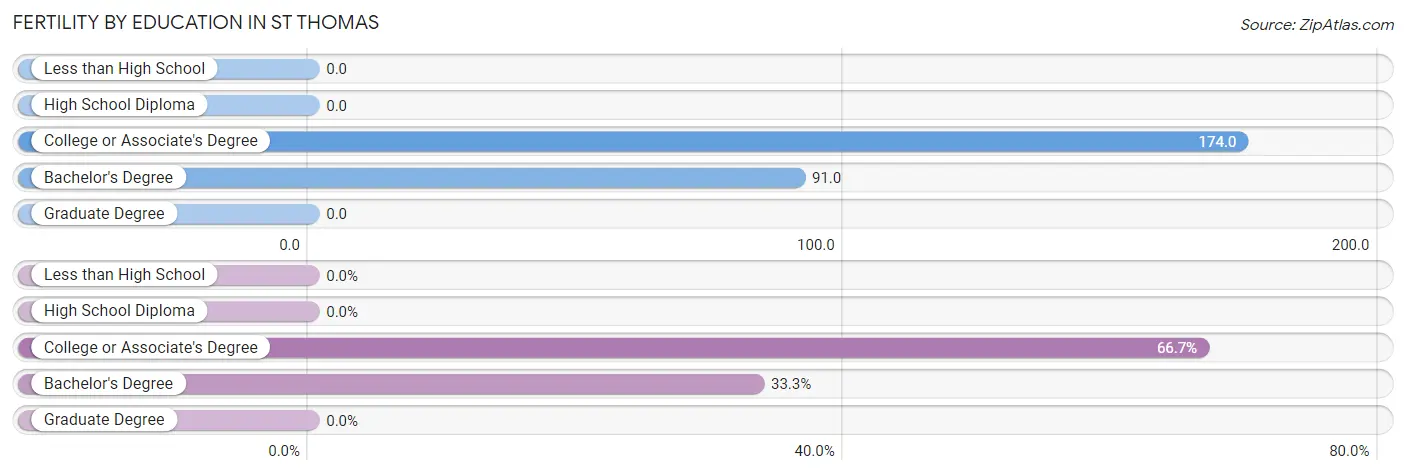
| Educational Attainment | Women with Births | Births / 1,000 Women |
| Less than High School | 0 (0.0%) | 0.0 |
| High School Diploma | 0 (0.0%) | 0.0 |
| College or Associate's Degree | 4 (66.7%) | 174.0 |
| Bachelor's Degree | 2 (33.3%) | 91.0 |
| Graduate Degree | 0 (0.0%) | 0.0 |
| Total | 6 (100.0%) | 78.0 |
Fertility by Education by Marriage Status in St Thomas
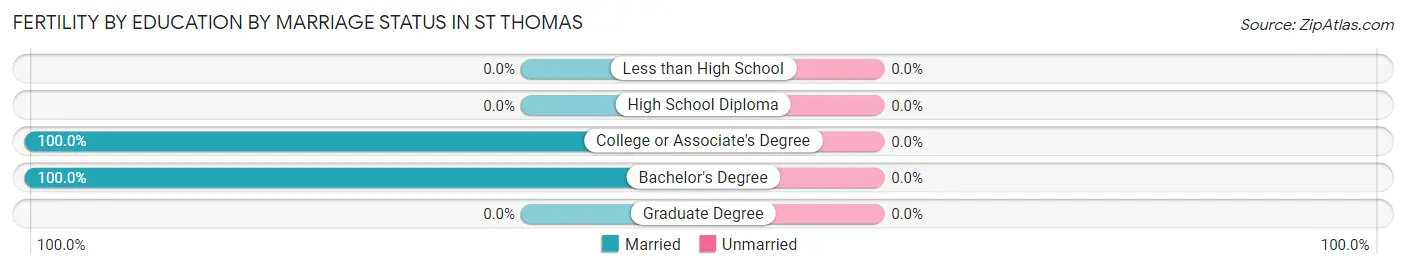
| Educational Attainment | Married | Unmarried |
| Less than High School | 0 (0.0%) | 0 (0.0%) |
| High School Diploma | 0 (0.0%) | 0 (0.0%) |
| College or Associate's Degree | 4 (100.0%) | 0 (0.0%) |
| Bachelor's Degree | 2 (100.0%) | 0 (0.0%) |
| Graduate Degree | 0 (0.0%) | 0 (0.0%) |
| Total | 6 (100.0%) | 0 (0.0%) |
Income in St Thomas
Income Overview in St Thomas
Per Capita Income in St Thomas is $44,589, while median incomes of families and households are $94,000 and $82,083 respectively.
| Characteristic | Number | Measure |
| Per Capita Income | 249 | $44,589 |
| Median Family Income | 70 | $94,000 |
| Mean Family Income | 70 | $103,693 |
| Median Household Income | 95 | $82,083 |
| Mean Household Income | 95 | $113,921 |
| Income Deficit | 70 | $0 |
| Wage / Income Gap (%) | 249 | 21.60% |
| Wage / Income Gap ($) | 249 | 78.40¢ per $1 |
| Gini / Inequality Index | 249 | 0.42 |
Earnings by Sex in St Thomas
Average Earnings in St Thomas are $43,000, $37,917 for men and $48,365 for women, a difference of 21.6%.
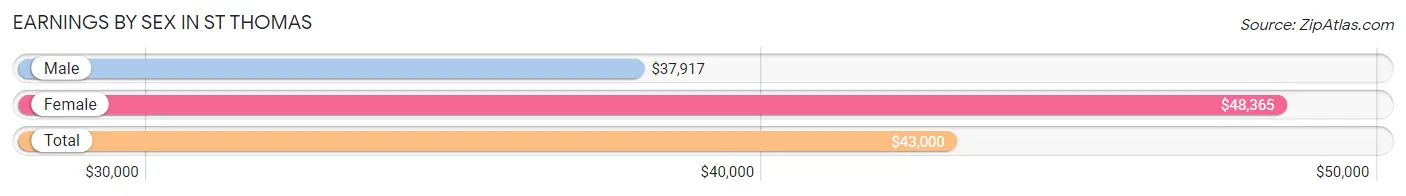
| Sex | Number | Average Earnings |
| Male | 73 (46.2%) | $37,917 |
| Female | 85 (53.8%) | $48,365 |
| Total | 158 (100.0%) | $43,000 |
Earnings by Sex by Income Bracket in St Thomas
The most common earnings brackets in St Thomas are $10,000 to $12,499 for men (20 | 27.4%) and $45,000 to $49,999 for women (15 | 17.6%).
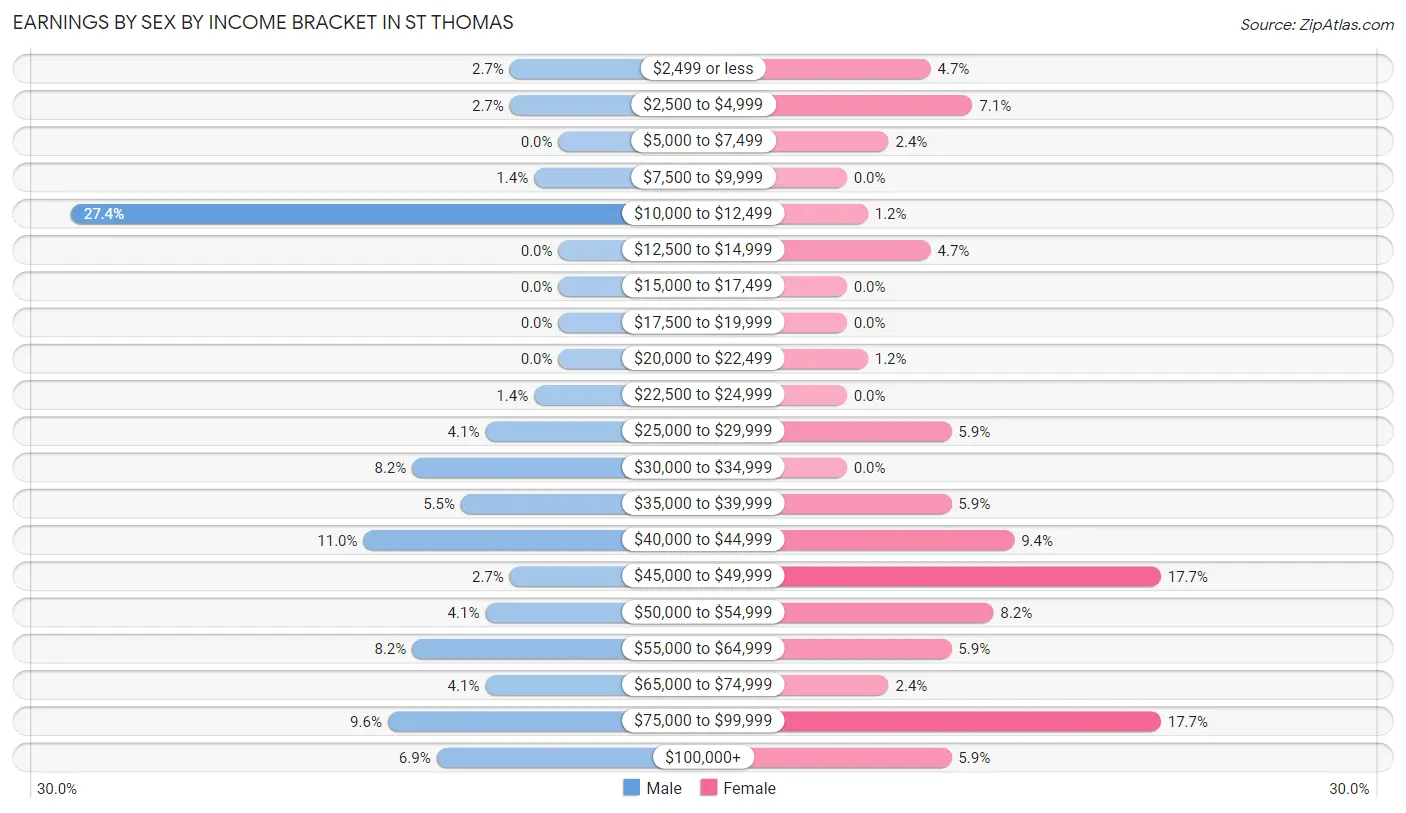
| Income | Male | Female |
| $2,499 or less | 2 (2.7%) | 4 (4.7%) |
| $2,500 to $4,999 | 2 (2.7%) | 6 (7.1%) |
| $5,000 to $7,499 | 0 (0.0%) | 2 (2.4%) |
| $7,500 to $9,999 | 1 (1.4%) | 0 (0.0%) |
| $10,000 to $12,499 | 20 (27.4%) | 1 (1.2%) |
| $12,500 to $14,999 | 0 (0.0%) | 4 (4.7%) |
| $15,000 to $17,499 | 0 (0.0%) | 0 (0.0%) |
| $17,500 to $19,999 | 0 (0.0%) | 0 (0.0%) |
| $20,000 to $22,499 | 0 (0.0%) | 1 (1.2%) |
| $22,500 to $24,999 | 1 (1.4%) | 0 (0.0%) |
| $25,000 to $29,999 | 3 (4.1%) | 5 (5.9%) |
| $30,000 to $34,999 | 6 (8.2%) | 0 (0.0%) |
| $35,000 to $39,999 | 4 (5.5%) | 5 (5.9%) |
| $40,000 to $44,999 | 8 (11.0%) | 8 (9.4%) |
| $45,000 to $49,999 | 2 (2.7%) | 15 (17.6%) |
| $50,000 to $54,999 | 3 (4.1%) | 7 (8.2%) |
| $55,000 to $64,999 | 6 (8.2%) | 5 (5.9%) |
| $65,000 to $74,999 | 3 (4.1%) | 2 (2.4%) |
| $75,000 to $99,999 | 7 (9.6%) | 15 (17.6%) |
| $100,000+ | 5 (6.9%) | 5 (5.9%) |
| Total | 73 (100.0%) | 85 (100.0%) |
Earnings by Sex by Educational Attainment in St Thomas
Average earnings in St Thomas are $38,750 for men and $49,808 for women, a difference of 22.2%. Men with an educational attainment of college or associate's degree enjoy the highest average annual earnings of $83,750, while those with high school diploma education earn the least with $41,250. Women with an educational attainment of high school diploma earn the most with the average annual earnings of $75,417, while those with college or associate's degree education have the smallest earnings of $46,250.
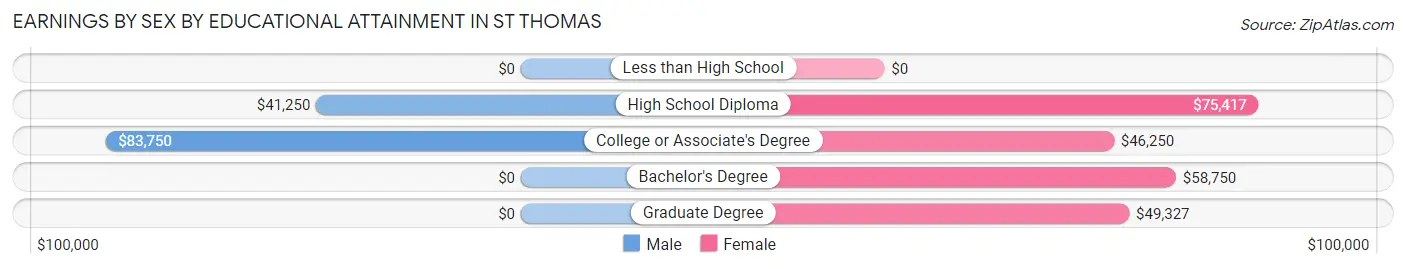
| Educational Attainment | Male Income | Female Income |
| Less than High School | - | - |
| High School Diploma | $41,250 | $75,417 |
| College or Associate's Degree | $83,750 | $46,250 |
| Bachelor's Degree | - | - |
| Graduate Degree | - | - |
| Total | $38,750 | $49,808 |
Family Income in St Thomas
Family Income Brackets in St Thomas
According to the St Thomas family income data, there are 18 families falling into the $50,000 to $74,999 income range, which is the most common income bracket and makes up 25.7% of all families.
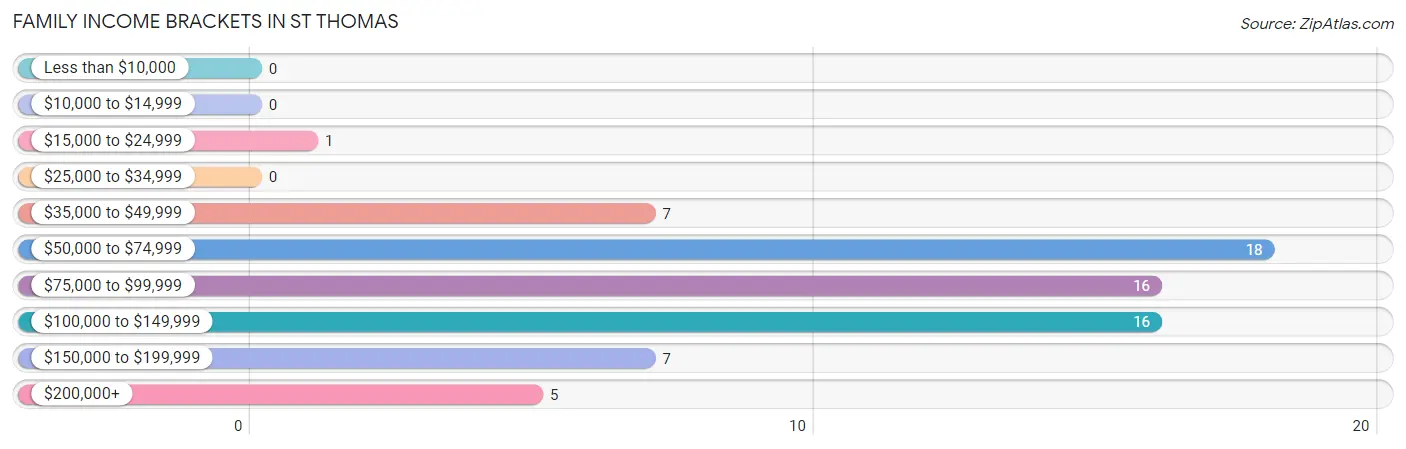
| Income Bracket | # Families | % Families |
| Less than $10,000 | 0 | 0.0% |
| $10,000 to $14,999 | 0 | 0.0% |
| $15,000 to $24,999 | 1 | 1.4% |
| $25,000 to $34,999 | 0 | 0.0% |
| $35,000 to $49,999 | 7 | 10.0% |
| $50,000 to $74,999 | 18 | 25.7% |
| $75,000 to $99,999 | 16 | 22.9% |
| $100,000 to $149,999 | 16 | 22.9% |
| $150,000 to $199,999 | 7 | 10.0% |
| $200,000+ | 5 | 7.1% |
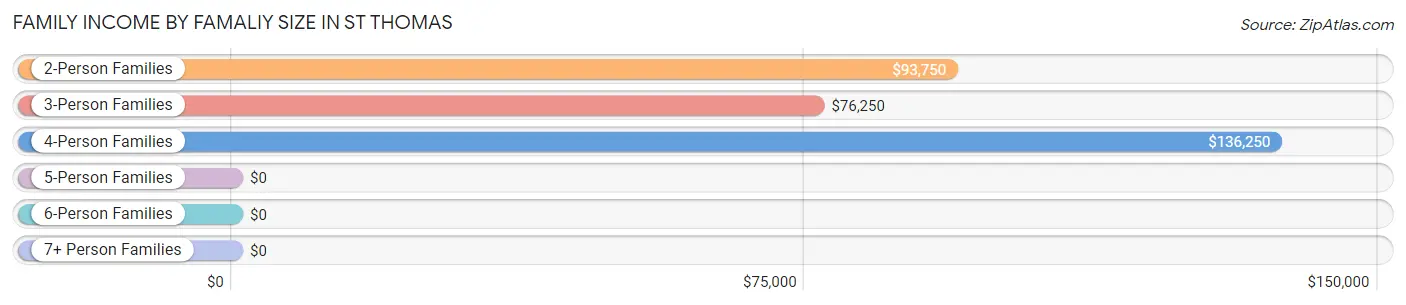
Family Income by Famaliy Size in St Thomas
4-person families (9 | 12.9%) account for the highest median family income in St Thomas with $136,250 per family, while 2-person families (23 | 32.9%) have the highest median income of $46,875 per family member.
| Income Bracket | # Families | Median Income |
| 2-Person Families | 23 (32.9%) | $93,750 |
| 3-Person Families | 35 (50.0%) | $76,250 |
| 4-Person Families | 9 (12.9%) | $136,250 |
| 5-Person Families | 2 (2.9%) | $0 |
| 6-Person Families | 0 (0.0%) | $0 |
| 7+ Person Families | 1 (1.4%) | $0 |
| Total | 70 (100.0%) | $94,000 |
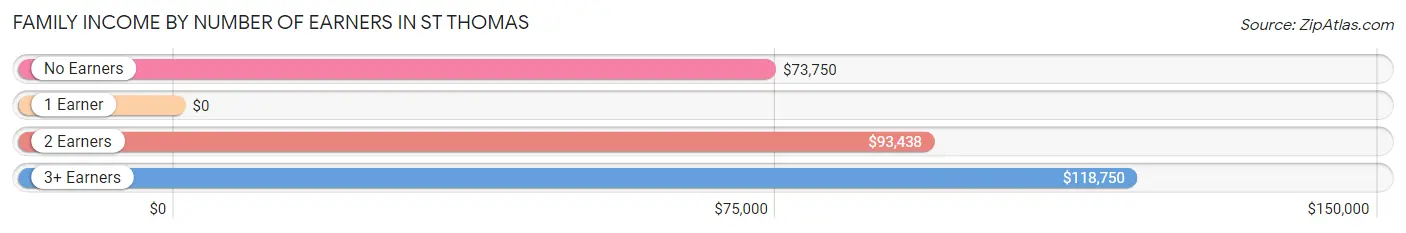
Family Income by Number of Earners in St Thomas
| Number of Earners | # Families | Median Income |
| No Earners | 5 (7.1%) | $73,750 |
| 1 Earner | 12 (17.1%) | $0 |
| 2 Earners | 45 (64.3%) | $93,438 |
| 3+ Earners | 8 (11.4%) | $118,750 |
| Total | 70 (100.0%) | $94,000 |
Household Income in St Thomas
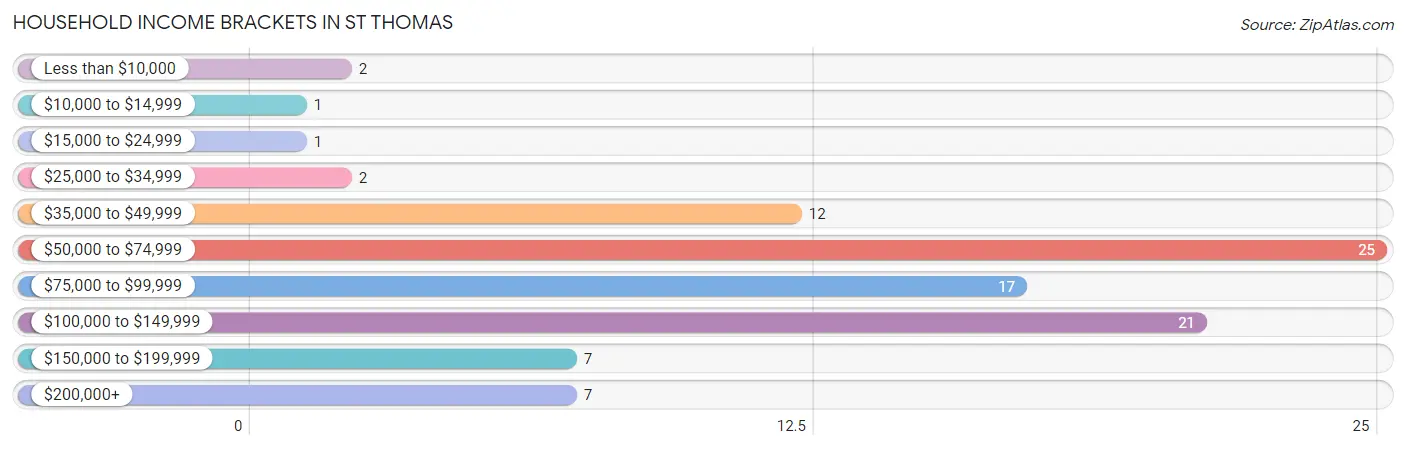
Household Income Brackets in St Thomas
With 25 households falling in the category, the $50,000 to $74,999 income range is the most frequent in St Thomas, accounting for 26.3% of all households. In contrast, only 1 households (1.1%) fall into the $10,000 to $14,999 income bracket, making it the least populous group.
| Income Bracket | # Households | % Households |
| Less than $10,000 | 2 | 2.1% |
| $10,000 to $14,999 | 1 | 1.1% |
| $15,000 to $24,999 | 1 | 1.1% |
| $25,000 to $34,999 | 2 | 2.1% |
| $35,000 to $49,999 | 12 | 12.6% |
| $50,000 to $74,999 | 25 | 26.3% |
| $75,000 to $99,999 | 17 | 17.9% |
| $100,000 to $149,999 | 21 | 22.1% |
| $150,000 to $199,999 | 7 | 7.4% |
| $200,000+ | 7 | 7.4% |
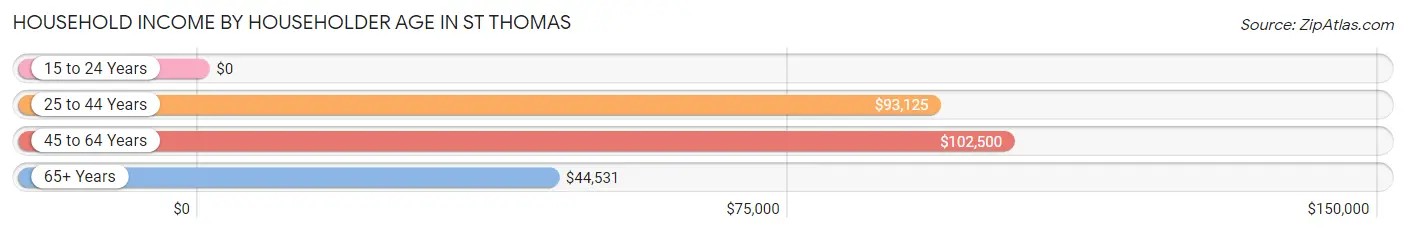
Household Income by Householder Age in St Thomas
The median household income in St Thomas is $82,083, with the highest median household income of $102,500 found in the 45 to 64 years age bracket for the primary householder. A total of 26 households (27.4%) fall into this category. Meanwhile, the 15 to 24 years age bracket for the primary householder has the lowest median household income of $0, with 4 households (4.2%) in this group.
| Income Bracket | # Households | Median Income |
| 15 to 24 Years | 4 (4.2%) | $0 |
| 25 to 44 Years | 44 (46.3%) | $93,125 |
| 45 to 64 Years | 26 (27.4%) | $102,500 |
| 65+ Years | 21 (22.1%) | $44,531 |
| Total | 95 (100.0%) | $82,083 |
Poverty in St Thomas
Income Below Poverty by Sex and Age in St Thomas
With 3.5% poverty level for males and 3.0% for females among the residents of St Thomas, 6 to 11 year old males and 75 year old and over females are the most vulnerable to poverty, with 2 males (33.3%) and 3 females (33.3%) in their respective age groups living below the poverty level.
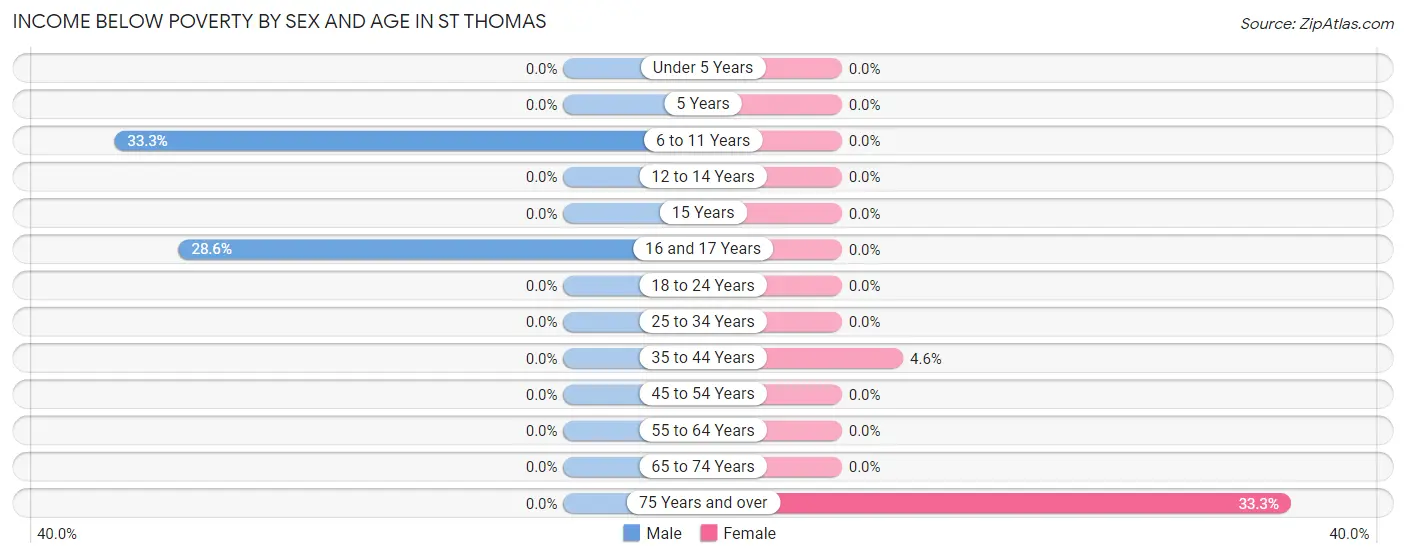
| Age Bracket | Male | Female |
| Under 5 Years | 0 (0.0%) | 0 (0.0%) |
| 5 Years | 0 (0.0%) | 0 (0.0%) |
| 6 to 11 Years | 2 (33.3%) | 0 (0.0%) |
| 12 to 14 Years | 0 (0.0%) | 0 (0.0%) |
| 15 Years | 0 (0.0%) | 0 (0.0%) |
| 16 and 17 Years | 2 (28.6%) | 0 (0.0%) |
| 18 to 24 Years | 0 (0.0%) | 0 (0.0%) |
| 25 to 34 Years | 0 (0.0%) | 0 (0.0%) |
| 35 to 44 Years | 0 (0.0%) | 1 (4.5%) |
| 45 to 54 Years | 0 (0.0%) | 0 (0.0%) |
| 55 to 64 Years | 0 (0.0%) | 0 (0.0%) |
| 65 to 74 Years | 0 (0.0%) | 0 (0.0%) |
| 75 Years and over | 0 (0.0%) | 3 (33.3%) |
| Total | 4 (3.5%) | 4 (3.0%) |
Income Above Poverty by Sex and Age in St Thomas
According to the poverty statistics in St Thomas, males aged under 5 years and females aged under 5 years are the age groups that are most secure financially, with 100.0% of males and 100.0% of females in these age groups living above the poverty line.
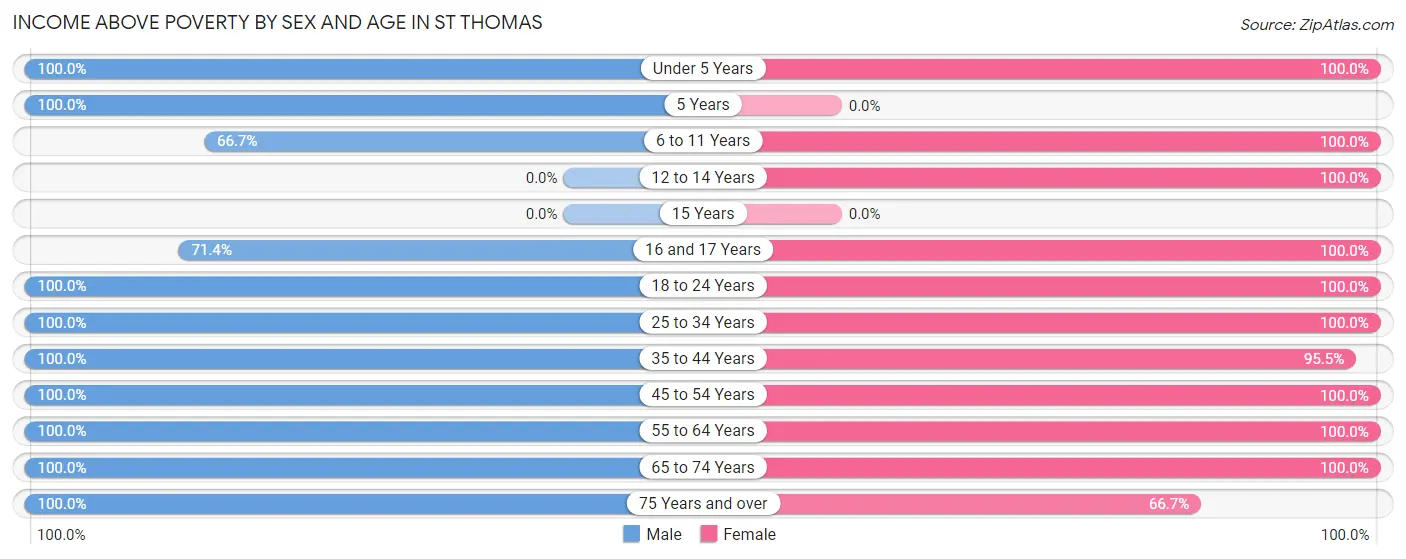
| Age Bracket | Male | Female |
| Under 5 Years | 16 (100.0%) | 16 (100.0%) |
| 5 Years | 4 (100.0%) | 0 (0.0%) |
| 6 to 11 Years | 4 (66.7%) | 3 (100.0%) |
| 12 to 14 Years | 0 (0.0%) | 9 (100.0%) |
| 15 Years | 0 (0.0%) | 0 (0.0%) |
| 16 and 17 Years | 5 (71.4%) | 3 (100.0%) |
| 18 to 24 Years | 8 (100.0%) | 13 (100.0%) |
| 25 to 34 Years | 12 (100.0%) | 23 (100.0%) |
| 35 to 44 Years | 26 (100.0%) | 21 (95.5%) |
| 45 to 54 Years | 14 (100.0%) | 19 (100.0%) |
| 55 to 64 Years | 7 (100.0%) | 7 (100.0%) |
| 65 to 74 Years | 11 (100.0%) | 9 (100.0%) |
| 75 Years and over | 5 (100.0%) | 6 (66.7%) |
| Total | 112 (96.6%) | 129 (97.0%) |
Income Below Poverty Among Married-Couple Families in St Thomas
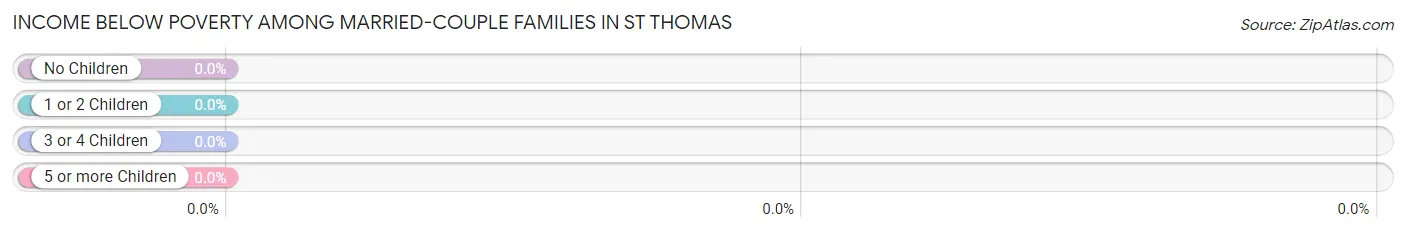
| Children | Above Poverty | Below Poverty |
| No Children | 26 (100.0%) | 0 (0.0%) |
| 1 or 2 Children | 39 (100.0%) | 0 (0.0%) |
| 3 or 4 Children | 1 (100.0%) | 0 (0.0%) |
| 5 or more Children | 1 (100.0%) | 0 (0.0%) |
| Total | 67 (100.0%) | 0 (0.0%) |
Income Below Poverty Among Single-Parent Households in St Thomas
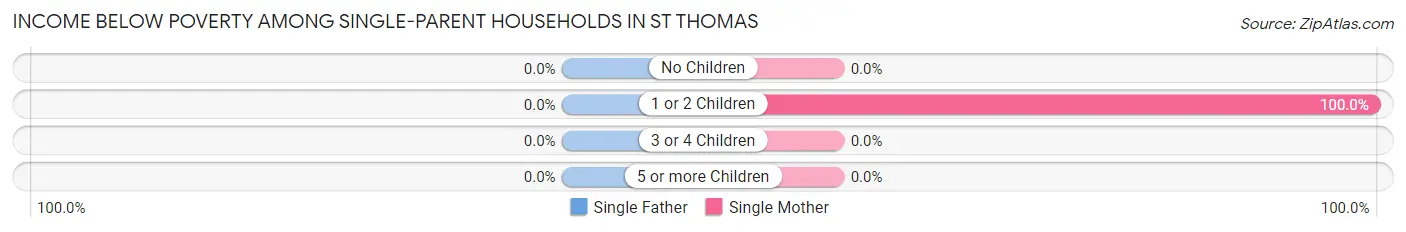
| Children | Single Father | Single Mother |
| No Children | 0 (0.0%) | 0 (0.0%) |
| 1 or 2 Children | 0 (0.0%) | 1 (100.0%) |
| 3 or 4 Children | 0 (0.0%) | 0 (0.0%) |
| 5 or more Children | 0 (0.0%) | 0 (0.0%) |
| Total | 0 (0.0%) | 1 (50.0%) |
Income Below Poverty Among Married-Couple vs Single-Parent Households in St Thomas
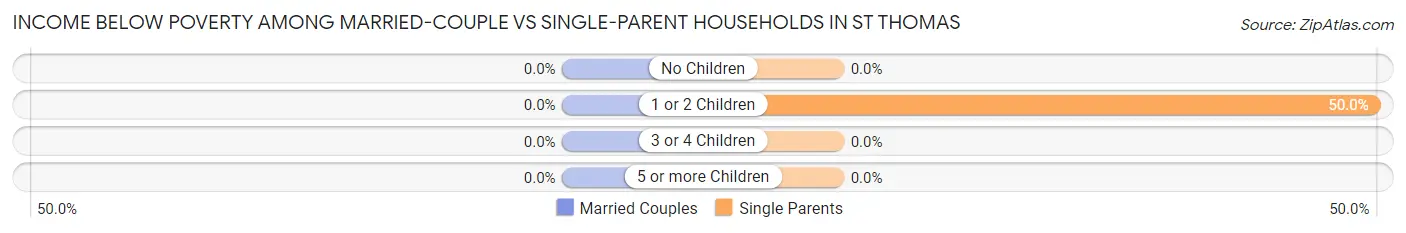
| Children | Married-Couple Families | Single-Parent Households |
| No Children | 0 (0.0%) | 0 (0.0%) |
| 1 or 2 Children | 0 (0.0%) | 1 (50.0%) |
| 3 or 4 Children | 0 (0.0%) | 0 (0.0%) |
| 5 or more Children | 0 (0.0%) | 0 (0.0%) |
| Total | 0 (0.0%) | 1 (33.3%) |
Employment Characteristics in St Thomas
Employment by Class of Employer in St Thomas
Among the 150 employed individuals in St Thomas, private company employees (79 | 52.7%), state government employees (41 | 27.3%), and self-employed (not incorporated) (14 | 9.3%) make up the most common classes of employment.
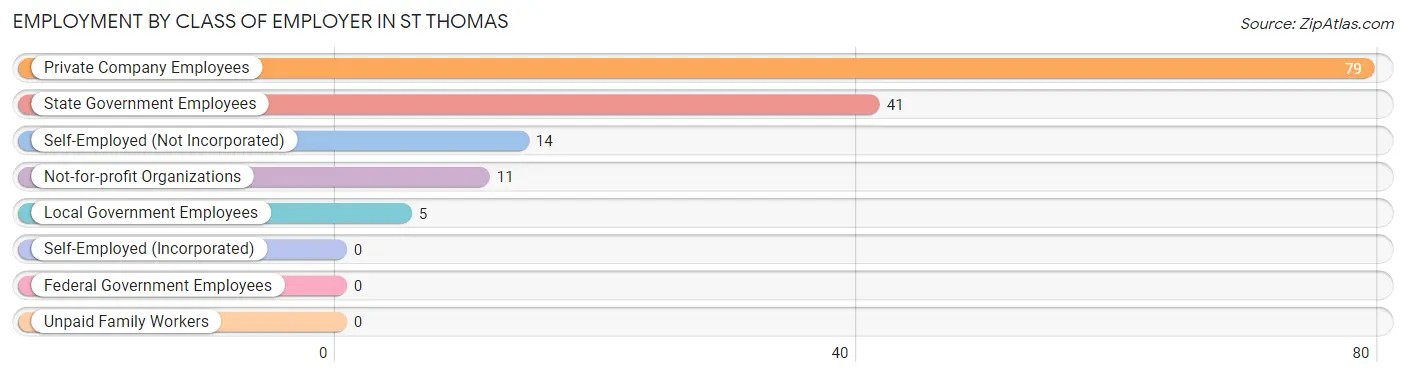
| Employer Class | # Employees | % Employees |
| Private Company Employees | 79 | 52.7% |
| Self-Employed (Incorporated) | 0 | 0.0% |
| Self-Employed (Not Incorporated) | 14 | 9.3% |
| Not-for-profit Organizations | 11 | 7.3% |
| Local Government Employees | 5 | 3.3% |
| State Government Employees | 41 | 27.3% |
| Federal Government Employees | 0 | 0.0% |
| Unpaid Family Workers | 0 | 0.0% |
| Total | 150 | 100.0% |
Employment Status by Age in St Thomas
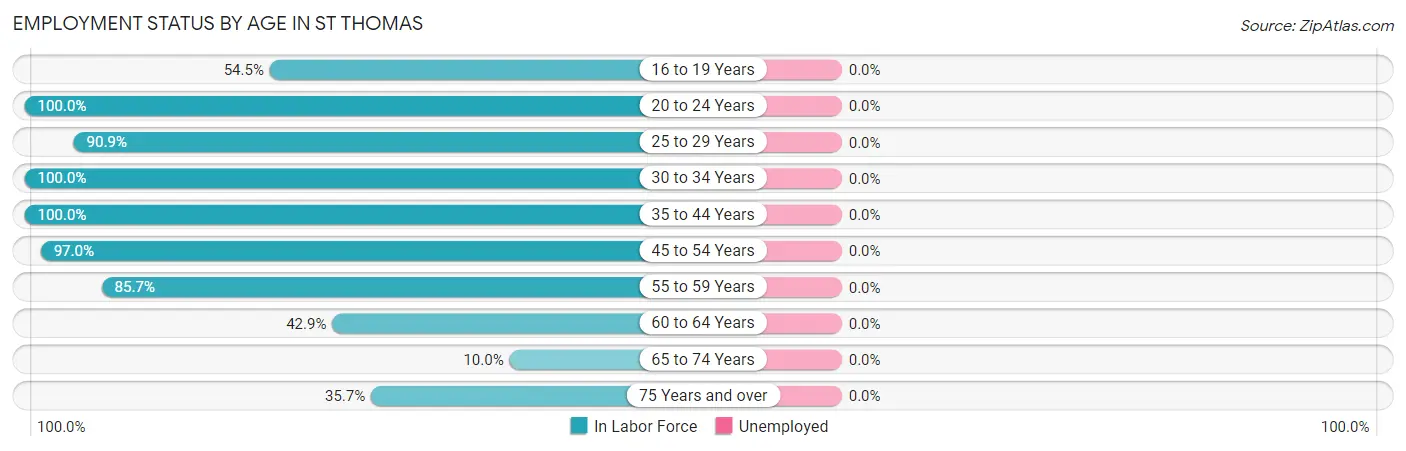
| Age Bracket | In Labor Force | Unemployed |
| 16 to 19 Years | 12 (54.5%) | 0 (0.0%) |
| 20 to 24 Years | 9 (100.0%) | 0 (0.0%) |
| 25 to 29 Years | 20 (90.9%) | 0 (0.0%) |
| 30 to 34 Years | 13 (100.0%) | 0 (0.0%) |
| 35 to 44 Years | 48 (100.0%) | 0 (0.0%) |
| 45 to 54 Years | 32 (97.0%) | 0 (0.0%) |
| 55 to 59 Years | 6 (85.7%) | 0 (0.0%) |
| 60 to 64 Years | 3 (42.9%) | 0 (0.0%) |
| 65 to 74 Years | 2 (10.0%) | 0 (0.0%) |
| 75 Years and over | 5 (35.7%) | 0 (0.0%) |
| Total | 150 (76.9%) | 0 (0.0%) |
Employment Status by Educational Attainment in St Thomas
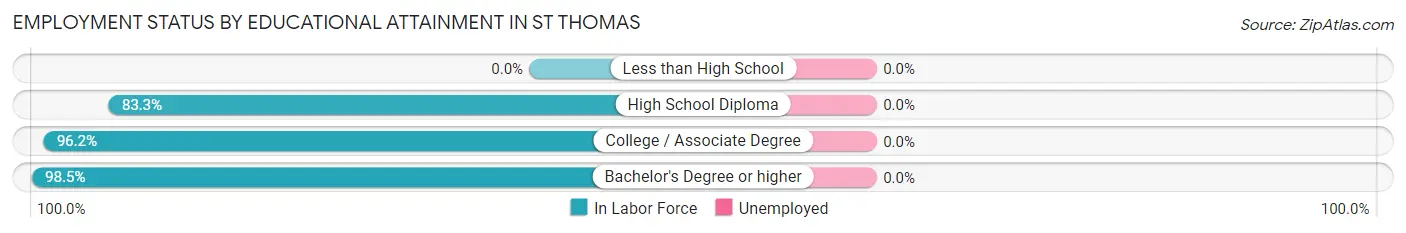
| Educational Attainment | In Labor Force | Unemployed |
| Less than High School | 0 (0.0%) | 0 (0.0%) |
| High School Diploma | 30 (83.3%) | 0 (0.0%) |
| College / Associate Degree | 25 (96.2%) | 0 (0.0%) |
| Bachelor's Degree or higher | 67 (98.5%) | 0 (0.0%) |
| Total | 122 (93.8%) | 0 (0.0%) |
Employment Occupations by Sex in St Thomas
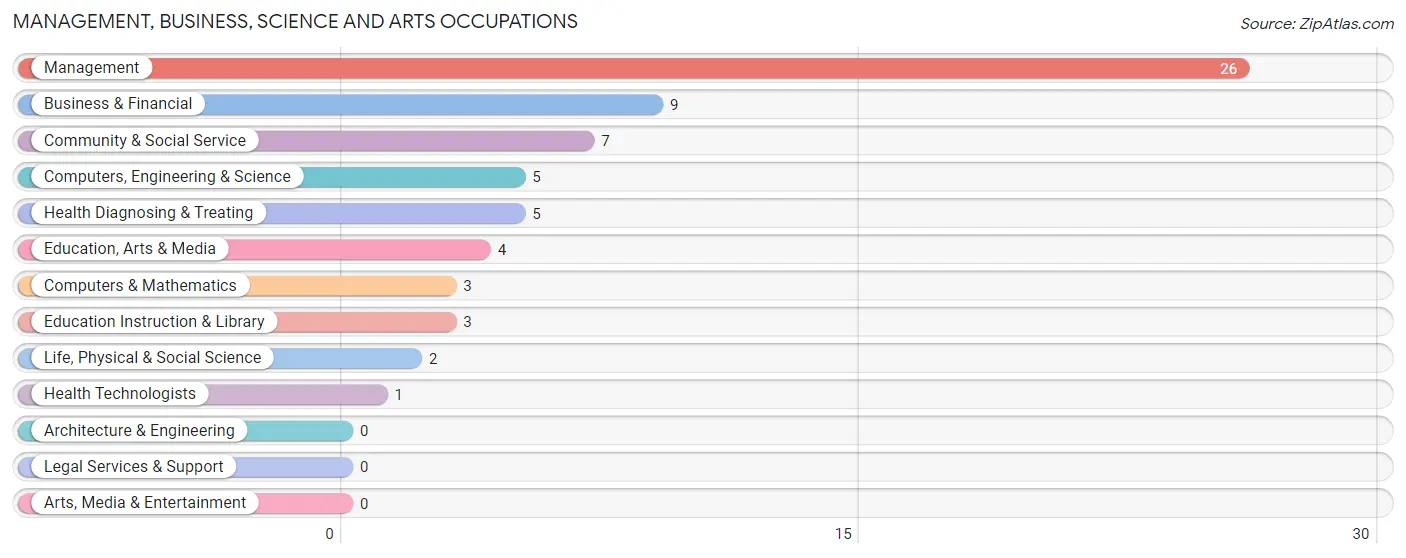
Management, Business, Science and Arts Occupations
The most common Management, Business, Science and Arts occupations in St Thomas are Management (26 | 17.3%), Business & Financial (9 | 6.0%), Community & Social Service (7 | 4.7%), Computers, Engineering & Science (5 | 3.3%), and Health Diagnosing & Treating (5 | 3.3%).
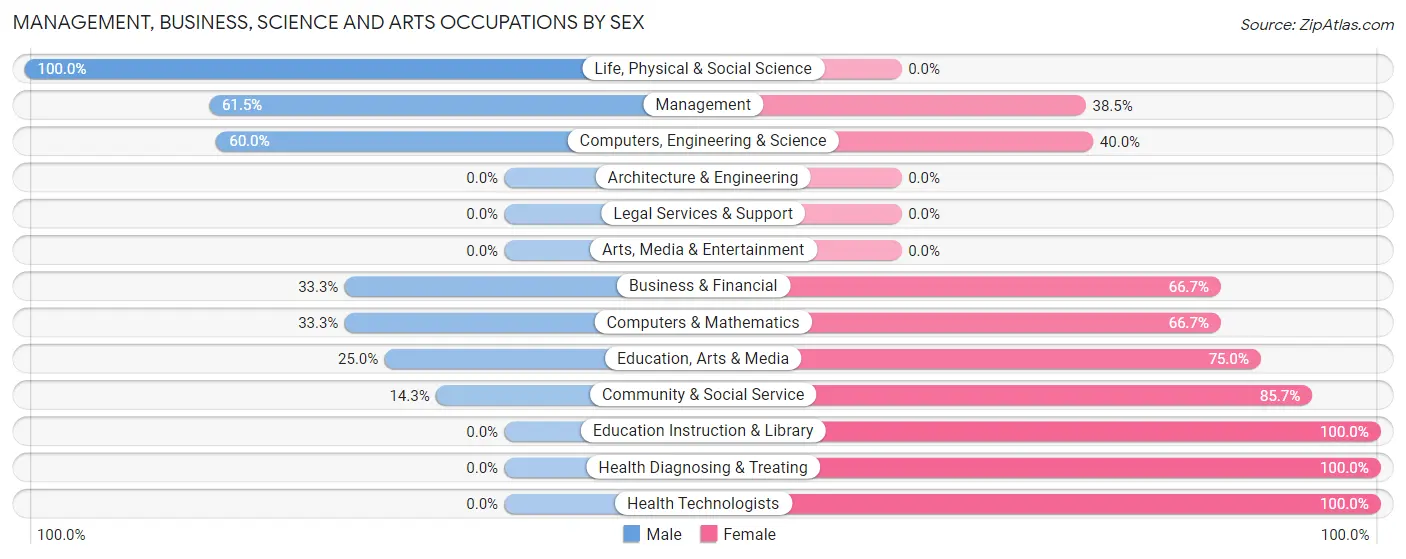
Management, Business, Science and Arts Occupations by Sex
Within the Management, Business, Science and Arts occupations in St Thomas, the most male-oriented occupations are Life, Physical & Social Science (100.0%), Management (61.5%), and Computers, Engineering & Science (60.0%), while the most female-oriented occupations are Education Instruction & Library (100.0%), Health Diagnosing & Treating (100.0%), and Health Technologists (100.0%).
| Occupation | Male | Female |
| Management | 16 (61.5%) | 10 (38.5%) |
| Business & Financial | 3 (33.3%) | 6 (66.7%) |
| Computers, Engineering & Science | 3 (60.0%) | 2 (40.0%) |
| Computers & Mathematics | 1 (33.3%) | 2 (66.7%) |
| Architecture & Engineering | 0 (0.0%) | 0 (0.0%) |
| Life, Physical & Social Science | 2 (100.0%) | 0 (0.0%) |
| Community & Social Service | 1 (14.3%) | 6 (85.7%) |
| Education, Arts & Media | 1 (25.0%) | 3 (75.0%) |
| Legal Services & Support | 0 (0.0%) | 0 (0.0%) |
| Education Instruction & Library | 0 (0.0%) | 3 (100.0%) |
| Arts, Media & Entertainment | 0 (0.0%) | 0 (0.0%) |
| Health Diagnosing & Treating | 0 (0.0%) | 5 (100.0%) |
| Health Technologists | 0 (0.0%) | 1 (100.0%) |
| Total (Category) | 23 (44.2%) | 29 (55.8%) |
| Total (Overall) | 71 (47.3%) | 79 (52.7%) |
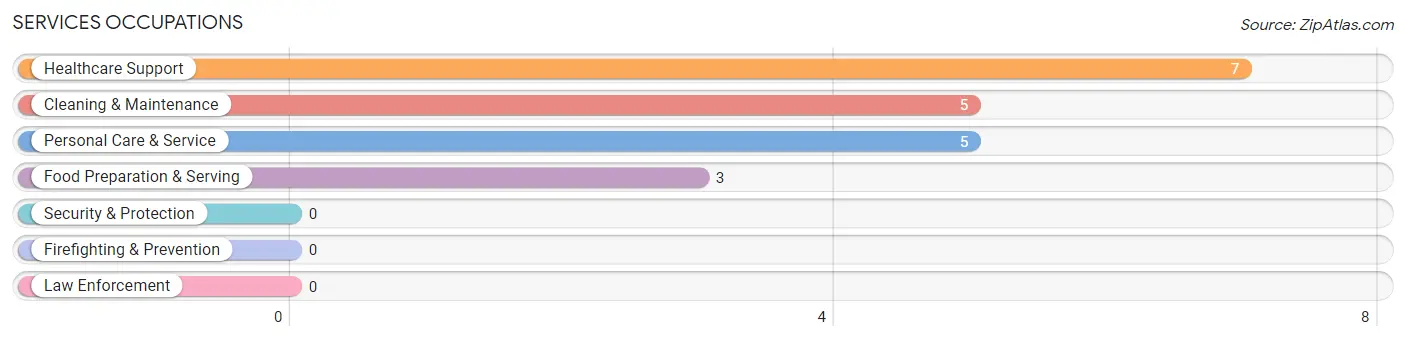
Services Occupations
The most common Services occupations in St Thomas are Healthcare Support (7 | 4.7%), Cleaning & Maintenance (5 | 3.3%), Personal Care & Service (5 | 3.3%), and Food Preparation & Serving (3 | 2.0%).
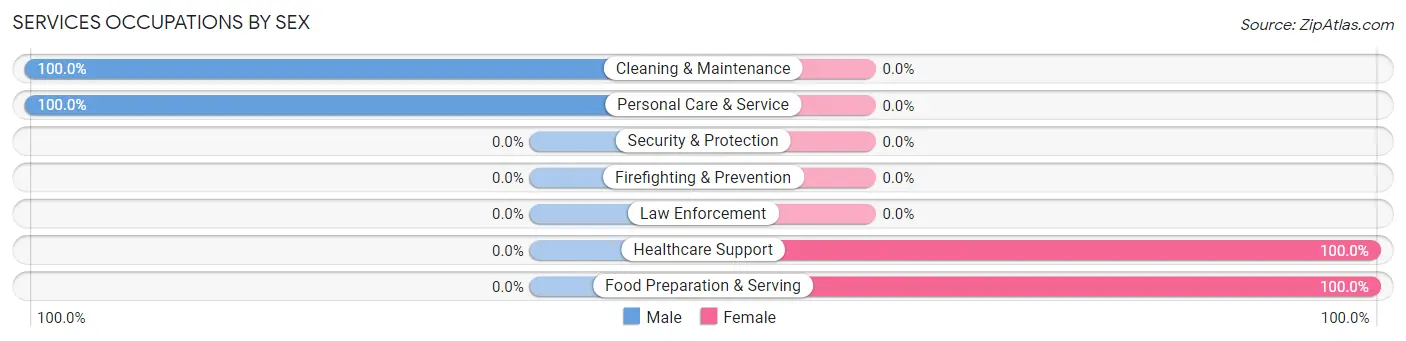
Services Occupations by Sex
Within the Services occupations in St Thomas, the most male-oriented occupations are Cleaning & Maintenance (100.0%), and Personal Care & Service (100.0%), while the most female-oriented occupations are Healthcare Support (100.0%), and Food Preparation & Serving (100.0%).
| Occupation | Male | Female |
| Healthcare Support | 0 (0.0%) | 7 (100.0%) |
| Security & Protection | 0 (0.0%) | 0 (0.0%) |
| Firefighting & Prevention | 0 (0.0%) | 0 (0.0%) |
| Law Enforcement | 0 (0.0%) | 0 (0.0%) |
| Food Preparation & Serving | 0 (0.0%) | 3 (100.0%) |
| Cleaning & Maintenance | 5 (100.0%) | 0 (0.0%) |
| Personal Care & Service | 5 (100.0%) | 0 (0.0%) |
| Total (Category) | 10 (50.0%) | 10 (50.0%) |
| Total (Overall) | 71 (47.3%) | 79 (52.7%) |
Sales and Office Occupations
The most common Sales and Office occupations in St Thomas are Office & Administration (34 | 22.7%), and Sales & Related (14 | 9.3%).
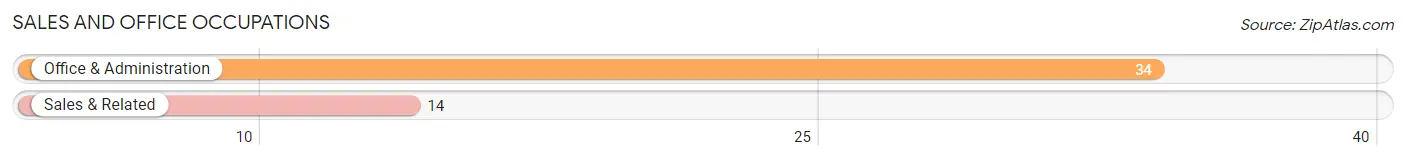
Sales and Office Occupations by Sex
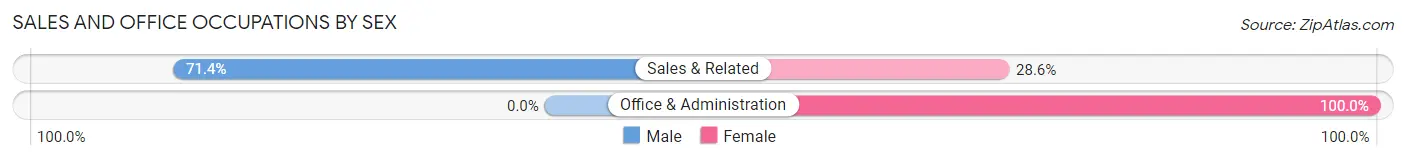
| Occupation | Male | Female |
| Sales & Related | 10 (71.4%) | 4 (28.6%) |
| Office & Administration | 0 (0.0%) | 34 (100.0%) |
| Total (Category) | 10 (20.8%) | 38 (79.2%) |
| Total (Overall) | 71 (47.3%) | 79 (52.7%) |
Natural Resources, Construction and Maintenance Occupations
The most common Natural Resources, Construction and Maintenance occupations in St Thomas are Installation, Maintenance & Repair (8 | 5.3%), Construction & Extraction (4 | 2.7%), and Farming, Fishing & Forestry (2 | 1.3%).
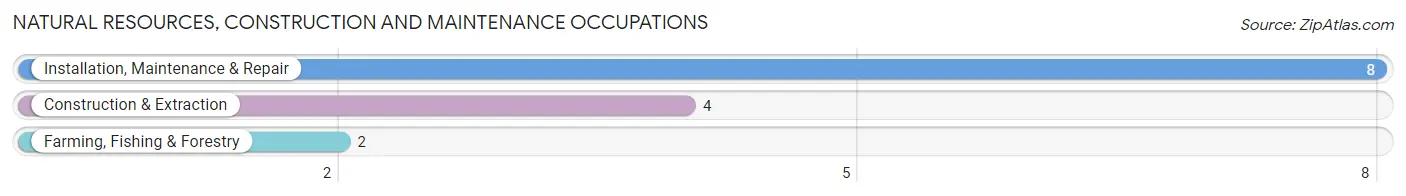
Natural Resources, Construction and Maintenance Occupations by Sex
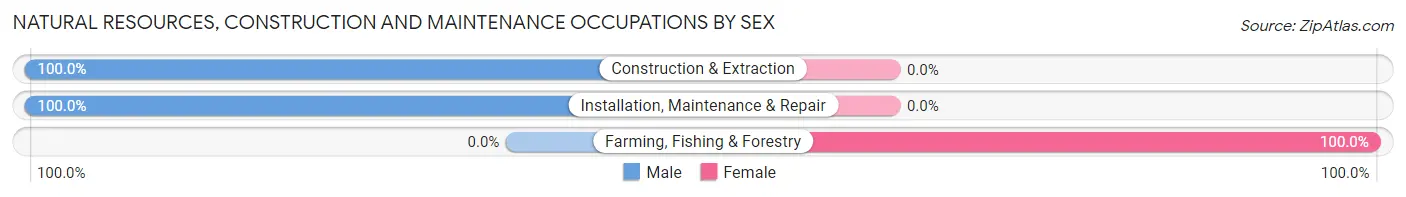
| Occupation | Male | Female |
| Farming, Fishing & Forestry | 0 (0.0%) | 2 (100.0%) |
| Construction & Extraction | 4 (100.0%) | 0 (0.0%) |
| Installation, Maintenance & Repair | 8 (100.0%) | 0 (0.0%) |
| Total (Category) | 12 (85.7%) | 2 (14.3%) |
| Total (Overall) | 71 (47.3%) | 79 (52.7%) |
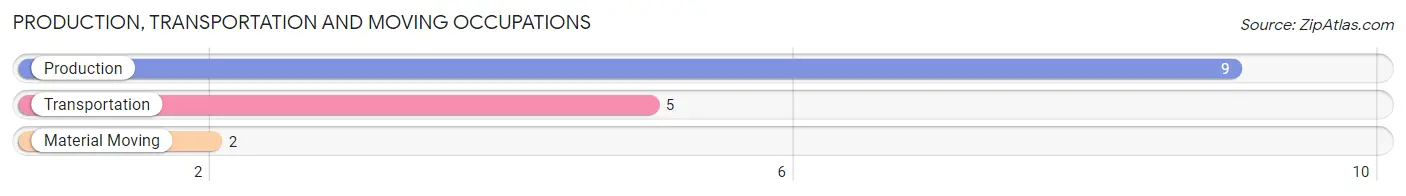
Production, Transportation and Moving Occupations
The most common Production, Transportation and Moving occupations in St Thomas are Production (9 | 6.0%), Transportation (5 | 3.3%), and Material Moving (2 | 1.3%).
Production, Transportation and Moving Occupations by Sex
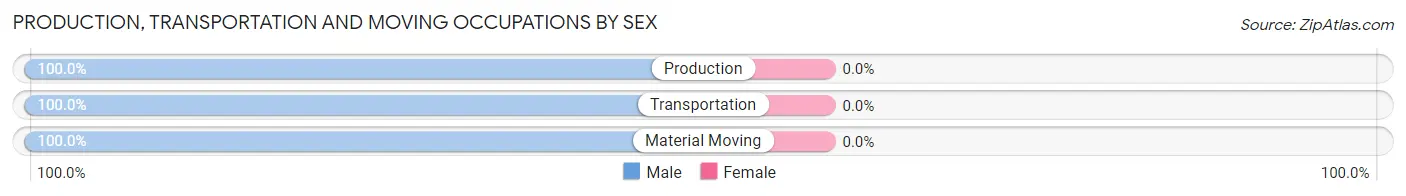
| Occupation | Male | Female |
| Production | 9 (100.0%) | 0 (0.0%) |
| Transportation | 5 (100.0%) | 0 (0.0%) |
| Material Moving | 2 (100.0%) | 0 (0.0%) |
| Total (Category) | 16 (100.0%) | 0 (0.0%) |
| Total (Overall) | 71 (47.3%) | 79 (52.7%) |
Employment Industries by Sex in St Thomas
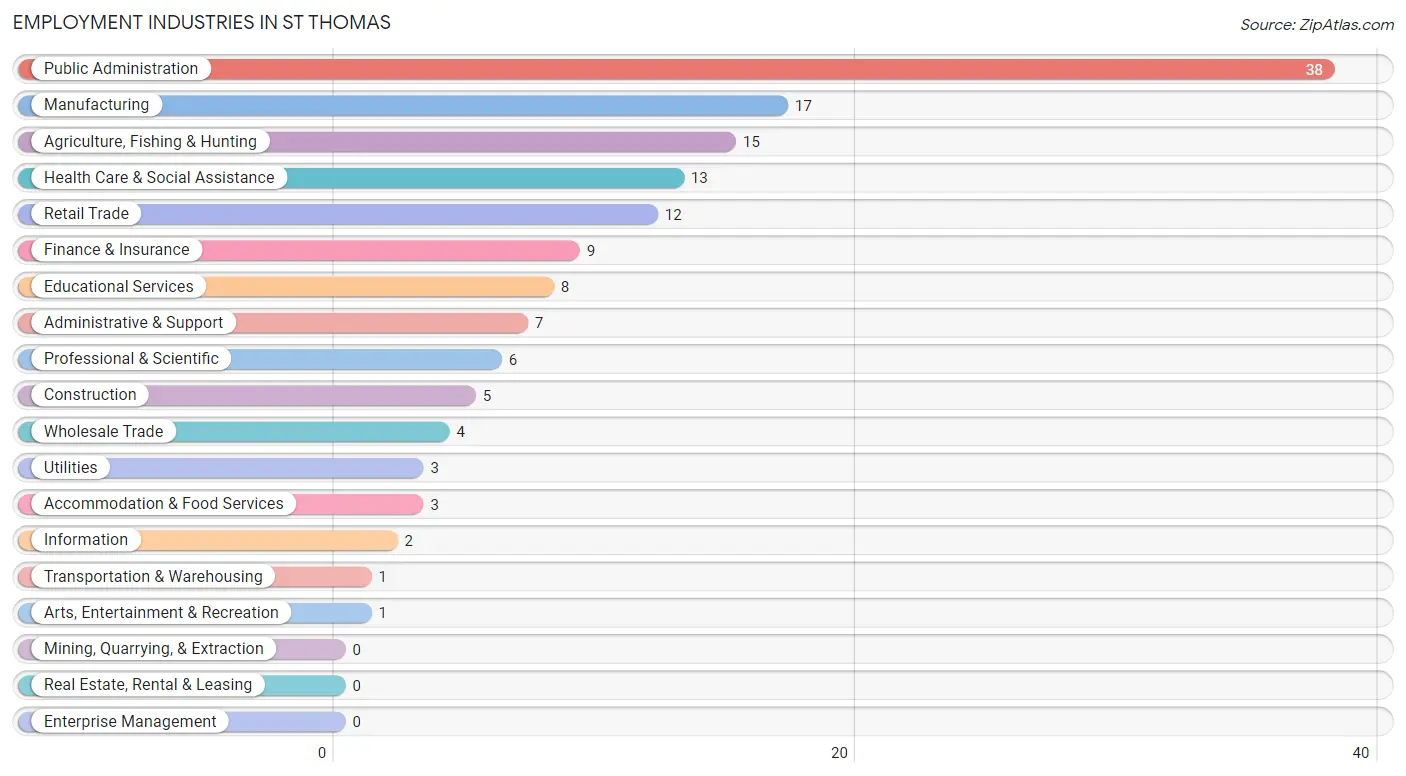
Employment Industries in St Thomas
The major employment industries in St Thomas include Public Administration (38 | 25.3%), Manufacturing (17 | 11.3%), Agriculture, Fishing & Hunting (15 | 10.0%), Health Care & Social Assistance (13 | 8.7%), and Retail Trade (12 | 8.0%).
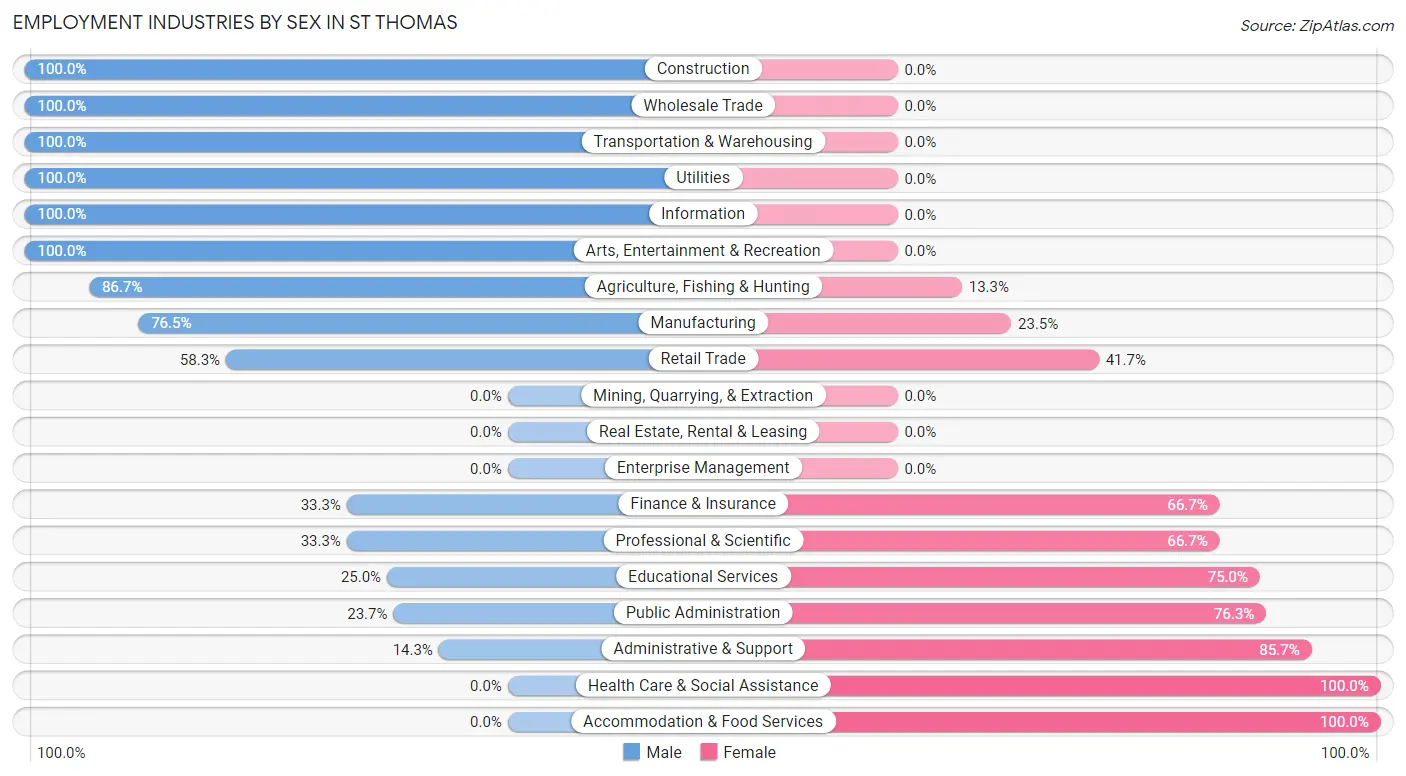
Employment Industries by Sex in St Thomas
The St Thomas industries that see more men than women are Construction (100.0%), Wholesale Trade (100.0%), and Transportation & Warehousing (100.0%), whereas the industries that tend to have a higher number of women are Health Care & Social Assistance (100.0%), Accommodation & Food Services (100.0%), and Administrative & Support (85.7%).
| Industry | Male | Female |
| Agriculture, Fishing & Hunting | 13 (86.7%) | 2 (13.3%) |
| Mining, Quarrying, & Extraction | 0 (0.0%) | 0 (0.0%) |
| Construction | 5 (100.0%) | 0 (0.0%) |
| Manufacturing | 13 (76.5%) | 4 (23.5%) |
| Wholesale Trade | 4 (100.0%) | 0 (0.0%) |
| Retail Trade | 7 (58.3%) | 5 (41.7%) |
| Transportation & Warehousing | 1 (100.0%) | 0 (0.0%) |
| Utilities | 3 (100.0%) | 0 (0.0%) |
| Information | 2 (100.0%) | 0 (0.0%) |
| Finance & Insurance | 3 (33.3%) | 6 (66.7%) |
| Real Estate, Rental & Leasing | 0 (0.0%) | 0 (0.0%) |
| Professional & Scientific | 2 (33.3%) | 4 (66.7%) |
| Enterprise Management | 0 (0.0%) | 0 (0.0%) |
| Administrative & Support | 1 (14.3%) | 6 (85.7%) |
| Educational Services | 2 (25.0%) | 6 (75.0%) |
| Health Care & Social Assistance | 0 (0.0%) | 13 (100.0%) |
| Arts, Entertainment & Recreation | 1 (100.0%) | 0 (0.0%) |
| Accommodation & Food Services | 0 (0.0%) | 3 (100.0%) |
| Public Administration | 9 (23.7%) | 29 (76.3%) |
| Total | 71 (47.3%) | 79 (52.7%) |
Education in St Thomas
School Enrollment in St Thomas
The most common levels of schooling among the 52 students in St Thomas are college / undergraduate (13 | 25.0%), high school (12 | 23.1%), and middle school (10 | 19.2%).
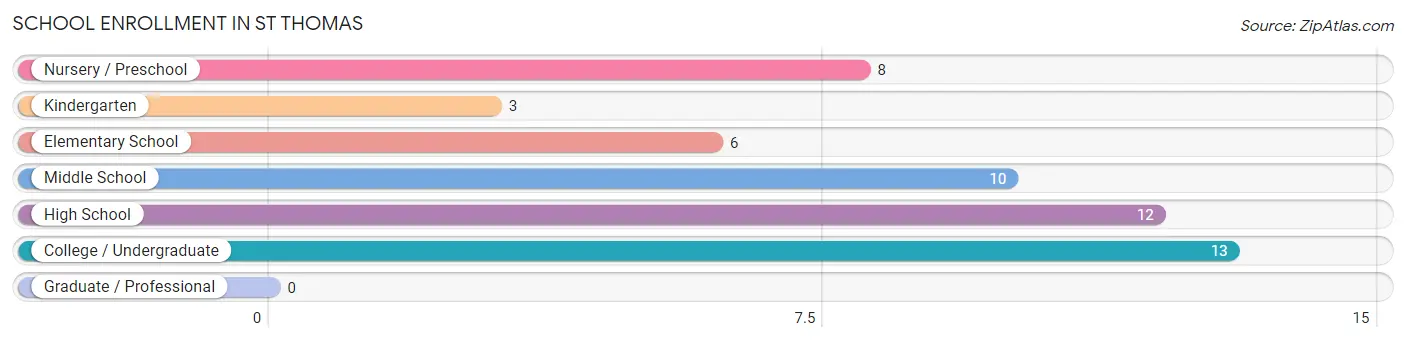
| School Level | # Students | % Students |
| Nursery / Preschool | 8 | 15.4% |
| Kindergarten | 3 | 5.8% |
| Elementary School | 6 | 11.5% |
| Middle School | 10 | 19.2% |
| High School | 12 | 23.1% |
| College / Undergraduate | 13 | 25.0% |
| Graduate / Professional | 0 | 0.0% |
| Total | 52 | 100.0% |
School Enrollment by Age by Funding Source in St Thomas
Out of a total of 52 students who are enrolled in schools in St Thomas, 28 (53.8%) attend a private institution, while the remaining 24 (46.2%) are enrolled in public schools. The age group of 3 to 4 year olds has the highest likelihood of being enrolled in private schools, with 5 (100.0% in the age bracket) enrolled. Conversely, the age group of 15 to 17 year olds has the lowest likelihood of being enrolled in a private school, with 10 (100.0% in the age bracket) attending a public institution.
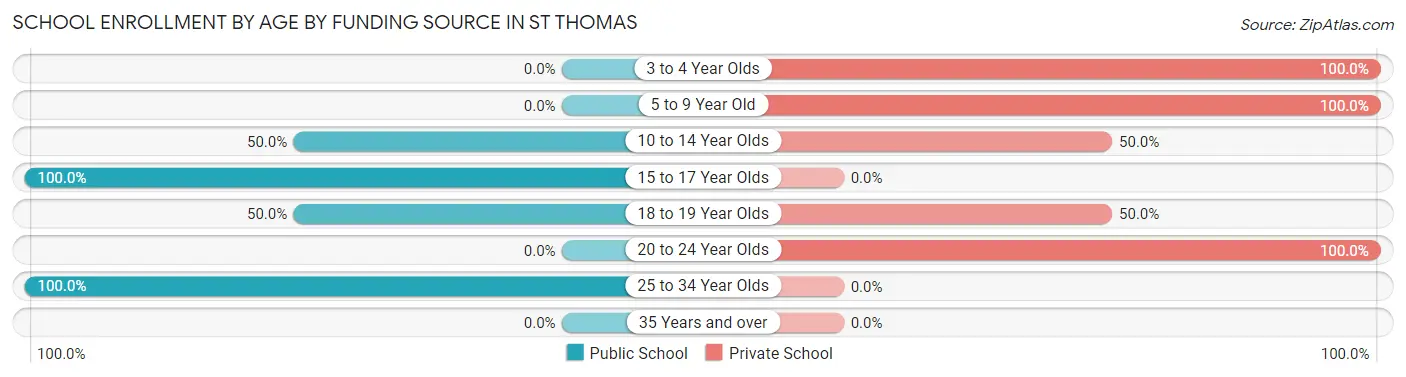
| Age Bracket | Public School | Private School |
| 3 to 4 Year Olds | 0 (0.0%) | 5 (100.0%) |
| 5 to 9 Year Old | 0 (0.0%) | 8 (100.0%) |
| 10 to 14 Year Olds | 7 (50.0%) | 7 (50.0%) |
| 15 to 17 Year Olds | 10 (100.0%) | 0 (0.0%) |
| 18 to 19 Year Olds | 6 (50.0%) | 6 (50.0%) |
| 20 to 24 Year Olds | 0 (0.0%) | 2 (100.0%) |
| 25 to 34 Year Olds | 1 (100.0%) | 0 (0.0%) |
| 35 Years and over | 0 (0.0%) | 0 (0.0%) |
| Total | 24 (46.2%) | 28 (53.8%) |
Educational Attainment by Field of Study in St Thomas
Bio, nature & agricultural (17 | 19.1%), visual & performing arts (15 | 16.9%), communications (13 | 14.6%), science & technology (12 | 13.5%), and business (12 | 13.5%) are the most common fields of study among 89 individuals in St Thomas who have obtained a bachelor's degree or higher.
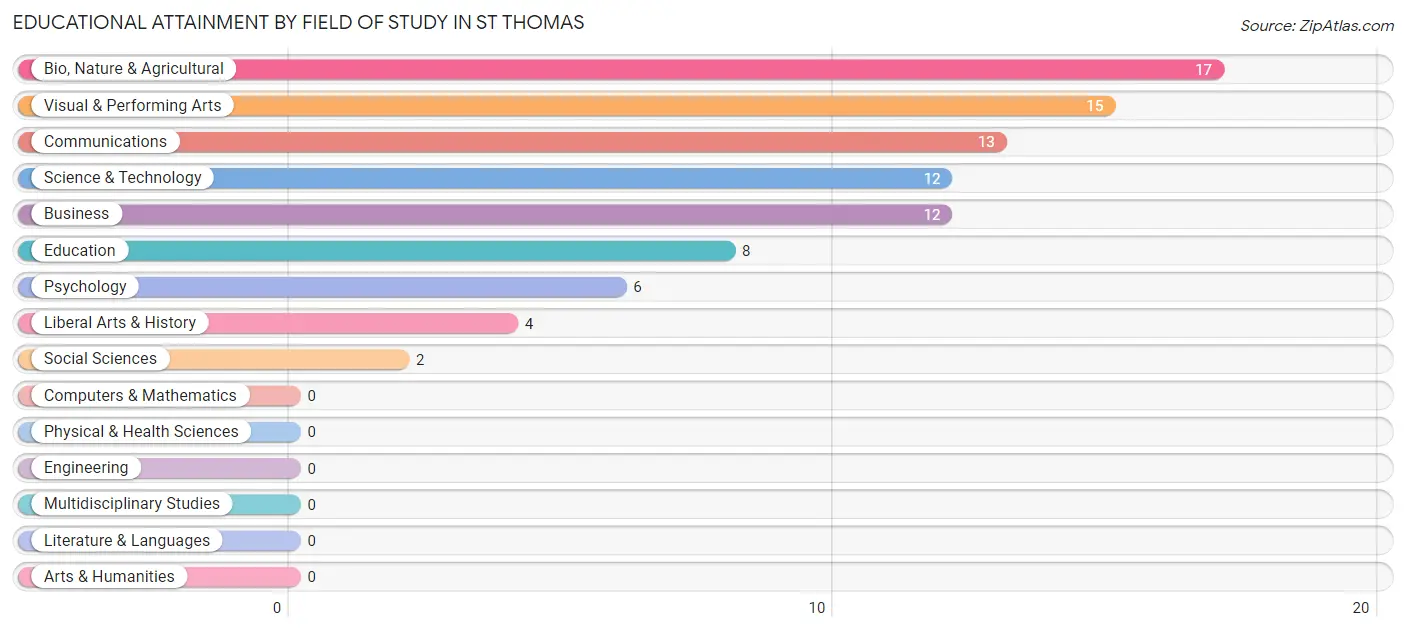
| Field of Study | # Graduates | % Graduates |
| Computers & Mathematics | 0 | 0.0% |
| Bio, Nature & Agricultural | 17 | 19.1% |
| Physical & Health Sciences | 0 | 0.0% |
| Psychology | 6 | 6.7% |
| Social Sciences | 2 | 2.2% |
| Engineering | 0 | 0.0% |
| Multidisciplinary Studies | 0 | 0.0% |
| Science & Technology | 12 | 13.5% |
| Business | 12 | 13.5% |
| Education | 8 | 9.0% |
| Literature & Languages | 0 | 0.0% |
| Liberal Arts & History | 4 | 4.5% |
| Visual & Performing Arts | 15 | 16.9% |
| Communications | 13 | 14.6% |
| Arts & Humanities | 0 | 0.0% |
| Total | 89 | 100.0% |
Transportation & Commute in St Thomas
Vehicle Availability by Sex in St Thomas
The most prevalent vehicle ownership categories in St Thomas are males with 2 vehicles (26, accounting for 36.6%) and females with 2 vehicles (26, making up 32.9%).
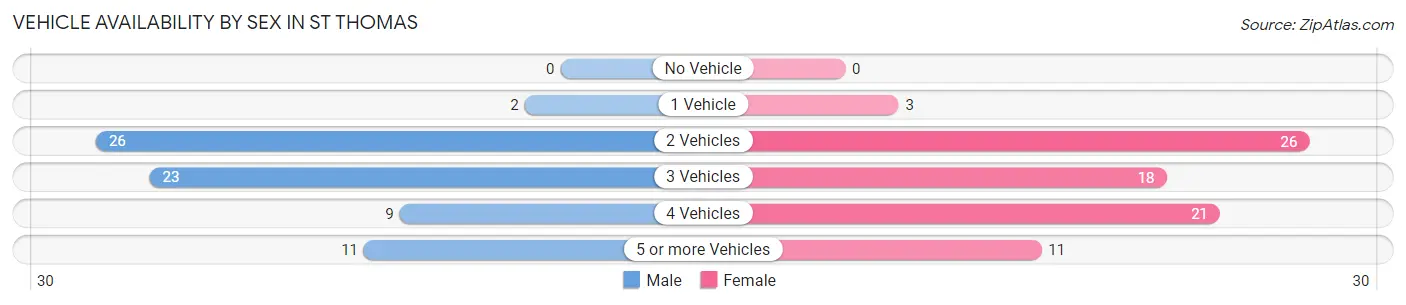
| Vehicles Available | Male | Female |
| No Vehicle | 0 (0.0%) | 0 (0.0%) |
| 1 Vehicle | 2 (2.8%) | 3 (3.8%) |
| 2 Vehicles | 26 (36.6%) | 26 (32.9%) |
| 3 Vehicles | 23 (32.4%) | 18 (22.8%) |
| 4 Vehicles | 9 (12.7%) | 21 (26.6%) |
| 5 or more Vehicles | 11 (15.5%) | 11 (13.9%) |
| Total | 71 (100.0%) | 79 (100.0%) |
Commute Time in St Thomas
The most frequently occuring commute durations in St Thomas are 30 to 34 minutes (39 commuters, 30.2%), 5 to 9 minutes (24 commuters, 18.6%), and 20 to 24 minutes (21 commuters, 16.3%).
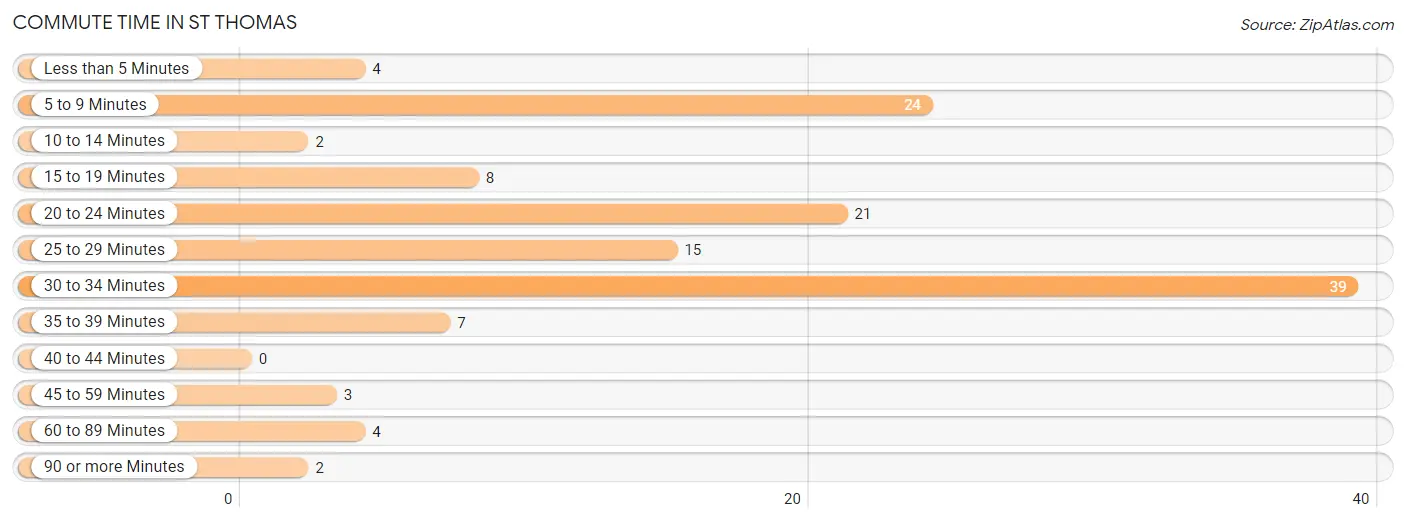
| Commute Time | # Commuters | % Commuters |
| Less than 5 Minutes | 4 | 3.1% |
| 5 to 9 Minutes | 24 | 18.6% |
| 10 to 14 Minutes | 2 | 1.5% |
| 15 to 19 Minutes | 8 | 6.2% |
| 20 to 24 Minutes | 21 | 16.3% |
| 25 to 29 Minutes | 15 | 11.6% |
| 30 to 34 Minutes | 39 | 30.2% |
| 35 to 39 Minutes | 7 | 5.4% |
| 40 to 44 Minutes | 0 | 0.0% |
| 45 to 59 Minutes | 3 | 2.3% |
| 60 to 89 Minutes | 4 | 3.1% |
| 90 or more Minutes | 2 | 1.5% |
Commute Time by Sex in St Thomas
The most common commute times in St Thomas are 5 to 9 minutes (24 commuters, 34.3%) for males and 30 to 34 minutes (19 commuters, 32.2%) for females.
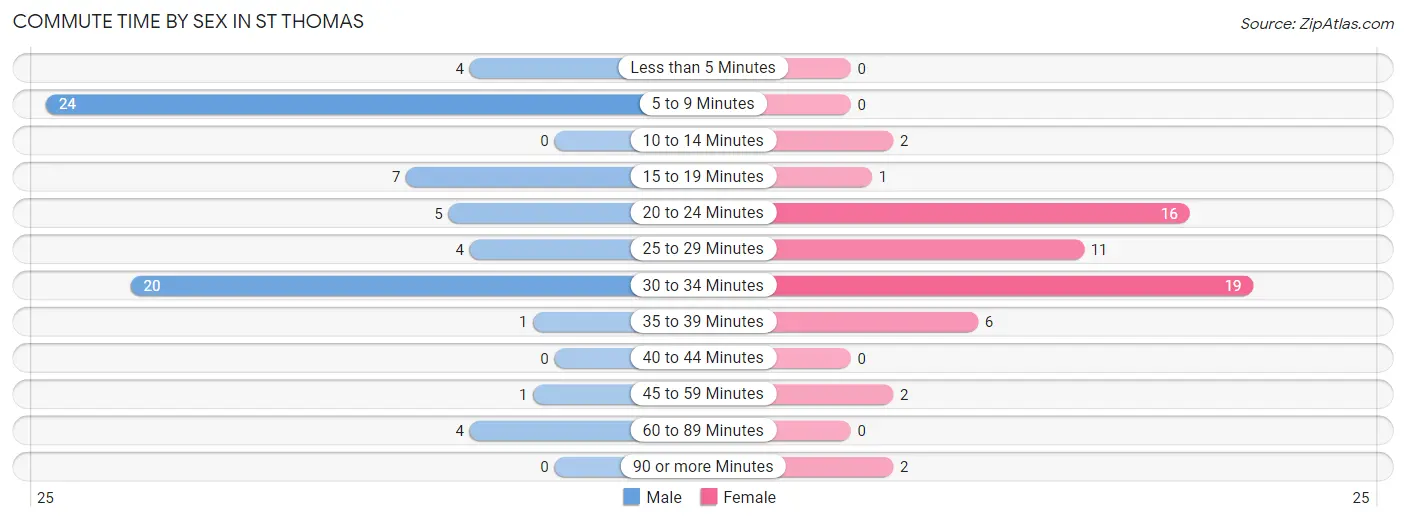
| Commute Time | Male | Female |
| Less than 5 Minutes | 4 (5.7%) | 0 (0.0%) |
| 5 to 9 Minutes | 24 (34.3%) | 0 (0.0%) |
| 10 to 14 Minutes | 0 (0.0%) | 2 (3.4%) |
| 15 to 19 Minutes | 7 (10.0%) | 1 (1.7%) |
| 20 to 24 Minutes | 5 (7.1%) | 16 (27.1%) |
| 25 to 29 Minutes | 4 (5.7%) | 11 (18.6%) |
| 30 to 34 Minutes | 20 (28.6%) | 19 (32.2%) |
| 35 to 39 Minutes | 1 (1.4%) | 6 (10.2%) |
| 40 to 44 Minutes | 0 (0.0%) | 0 (0.0%) |
| 45 to 59 Minutes | 1 (1.4%) | 2 (3.4%) |
| 60 to 89 Minutes | 4 (5.7%) | 0 (0.0%) |
| 90 or more Minutes | 0 (0.0%) | 2 (3.4%) |
Time of Departure to Work by Sex in St Thomas
The most frequent times of departure to work in St Thomas are 6:30 AM to 6:59 AM (20, 28.6%) for males and 7:00 AM to 7:29 AM (20, 33.9%) for females.
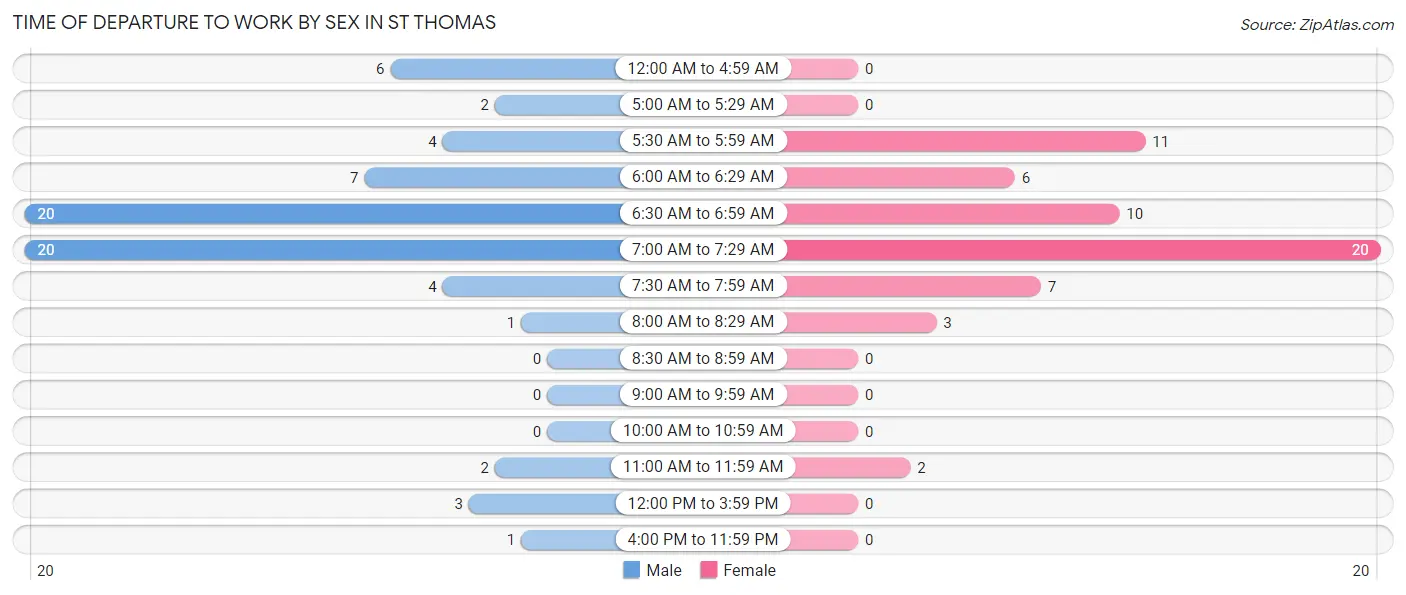
| Time of Departure | Male | Female |
| 12:00 AM to 4:59 AM | 6 (8.6%) | 0 (0.0%) |
| 5:00 AM to 5:29 AM | 2 (2.9%) | 0 (0.0%) |
| 5:30 AM to 5:59 AM | 4 (5.7%) | 11 (18.6%) |
| 6:00 AM to 6:29 AM | 7 (10.0%) | 6 (10.2%) |
| 6:30 AM to 6:59 AM | 20 (28.6%) | 10 (17.0%) |
| 7:00 AM to 7:29 AM | 20 (28.6%) | 20 (33.9%) |
| 7:30 AM to 7:59 AM | 4 (5.7%) | 7 (11.9%) |
| 8:00 AM to 8:29 AM | 1 (1.4%) | 3 (5.1%) |
| 8:30 AM to 8:59 AM | 0 (0.0%) | 0 (0.0%) |
| 9:00 AM to 9:59 AM | 0 (0.0%) | 0 (0.0%) |
| 10:00 AM to 10:59 AM | 0 (0.0%) | 0 (0.0%) |
| 11:00 AM to 11:59 AM | 2 (2.9%) | 2 (3.4%) |
| 12:00 PM to 3:59 PM | 3 (4.3%) | 0 (0.0%) |
| 4:00 PM to 11:59 PM | 1 (1.4%) | 0 (0.0%) |
| Total | 70 (100.0%) | 59 (100.0%) |
Housing Occupancy in St Thomas
Occupancy by Ownership in St Thomas
Of the total 95 dwellings in St Thomas, owner-occupied units account for 86 (90.5%), while renter-occupied units make up 9 (9.5%).
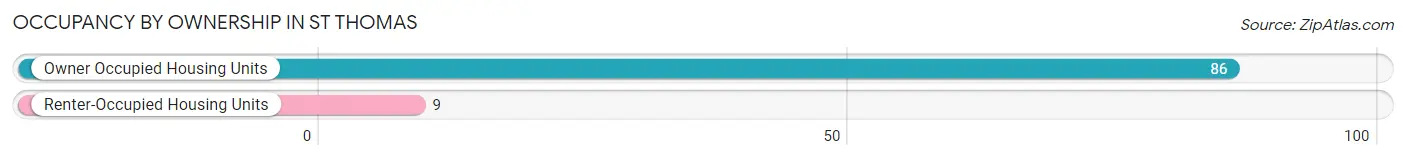
| Occupancy | # Housing Units | % Housing Units |
| Owner Occupied Housing Units | 86 | 90.5% |
| Renter-Occupied Housing Units | 9 | 9.5% |
| Total Occupied Housing Units | 95 | 100.0% |
Occupancy by Household Size in St Thomas
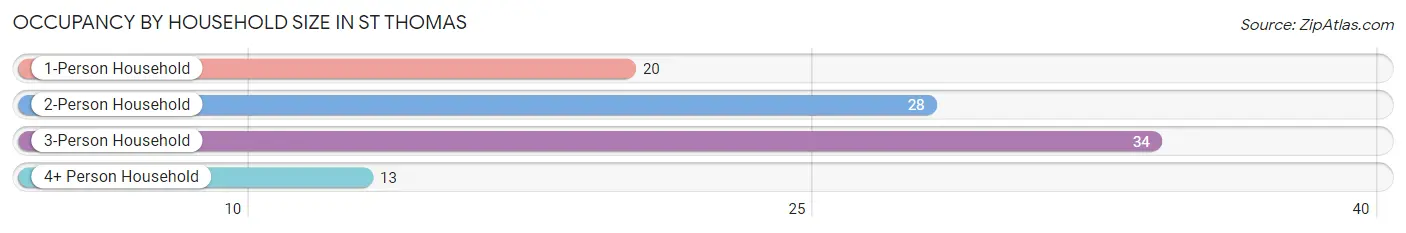
| Household Size | # Housing Units | % Housing Units |
| 1-Person Household | 20 | 21.0% |
| 2-Person Household | 28 | 29.5% |
| 3-Person Household | 34 | 35.8% |
| 4+ Person Household | 13 | 13.7% |
| Total Housing Units | 95 | 100.0% |
Occupancy by Ownership by Household Size in St Thomas
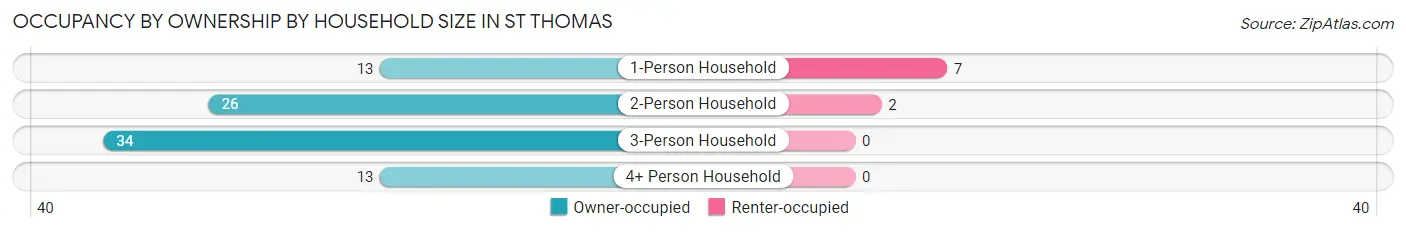
| Household Size | Owner-occupied | Renter-occupied |
| 1-Person Household | 13 (65.0%) | 7 (35.0%) |
| 2-Person Household | 26 (92.9%) | 2 (7.1%) |
| 3-Person Household | 34 (100.0%) | 0 (0.0%) |
| 4+ Person Household | 13 (100.0%) | 0 (0.0%) |
| Total Housing Units | 86 (90.5%) | 9 (9.5%) |
Occupancy by Educational Attainment in St Thomas
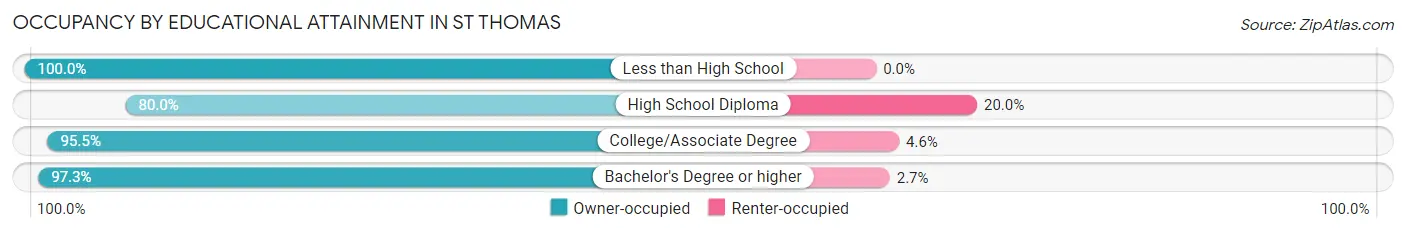
| Household Size | Owner-occupied | Renter-occupied |
| Less than High School | 1 (100.0%) | 0 (0.0%) |
| High School Diploma | 28 (80.0%) | 7 (20.0%) |
| College/Associate Degree | 21 (95.5%) | 1 (4.5%) |
| Bachelor's Degree or higher | 36 (97.3%) | 1 (2.7%) |
Occupancy by Age of Householder in St Thomas
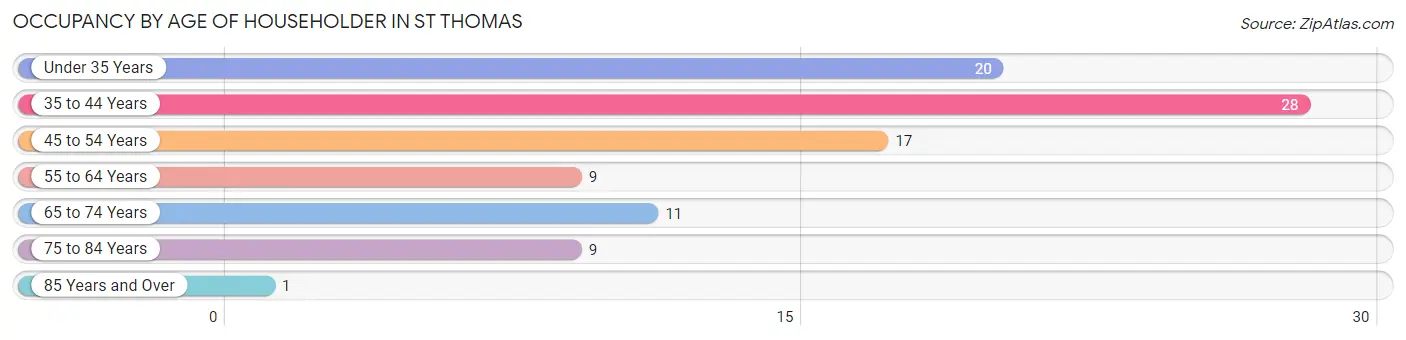
| Age Bracket | # Households | % Households |
| Under 35 Years | 20 | 21.0% |
| 35 to 44 Years | 28 | 29.5% |
| 45 to 54 Years | 17 | 17.9% |
| 55 to 64 Years | 9 | 9.5% |
| 65 to 74 Years | 11 | 11.6% |
| 75 to 84 Years | 9 | 9.5% |
| 85 Years and Over | 1 | 1.1% |
| Total | 95 | 100.0% |
Housing Finances in St Thomas
Median Income by Occupancy in St Thomas
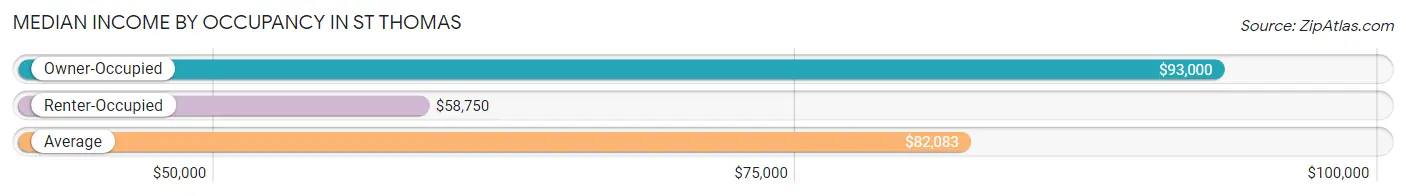
| Occupancy Type | # Households | Median Income |
| Owner-Occupied | 86 (90.5%) | $93,000 |
| Renter-Occupied | 9 (9.5%) | $58,750 |
| Average | 95 (100.0%) | $82,083 |
Occupancy by Householder Income Bracket in St Thomas
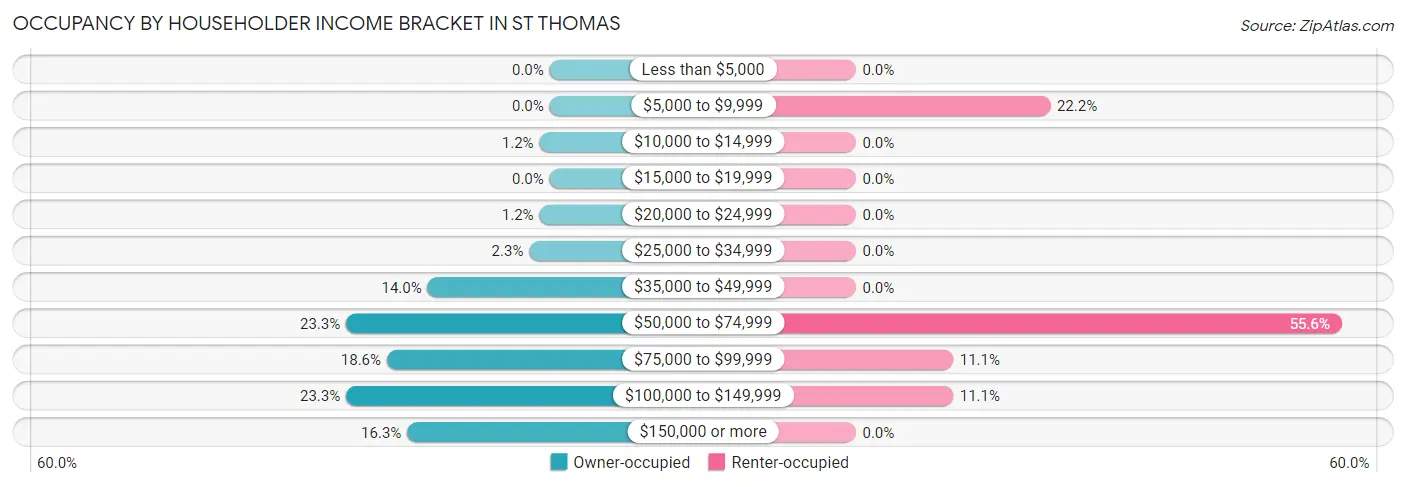
| Income Bracket | Owner-occupied | Renter-occupied |
| Less than $5,000 | 0 (0.0%) | 0 (0.0%) |
| $5,000 to $9,999 | 0 (0.0%) | 2 (22.2%) |
| $10,000 to $14,999 | 1 (1.2%) | 0 (0.0%) |
| $15,000 to $19,999 | 0 (0.0%) | 0 (0.0%) |
| $20,000 to $24,999 | 1 (1.2%) | 0 (0.0%) |
| $25,000 to $34,999 | 2 (2.3%) | 0 (0.0%) |
| $35,000 to $49,999 | 12 (14.0%) | 0 (0.0%) |
| $50,000 to $74,999 | 20 (23.3%) | 5 (55.6%) |
| $75,000 to $99,999 | 16 (18.6%) | 1 (11.1%) |
| $100,000 to $149,999 | 20 (23.3%) | 1 (11.1%) |
| $150,000 or more | 14 (16.3%) | 0 (0.0%) |
| Total | 86 (100.0%) | 9 (100.0%) |
Monthly Housing Cost Tiers in St Thomas
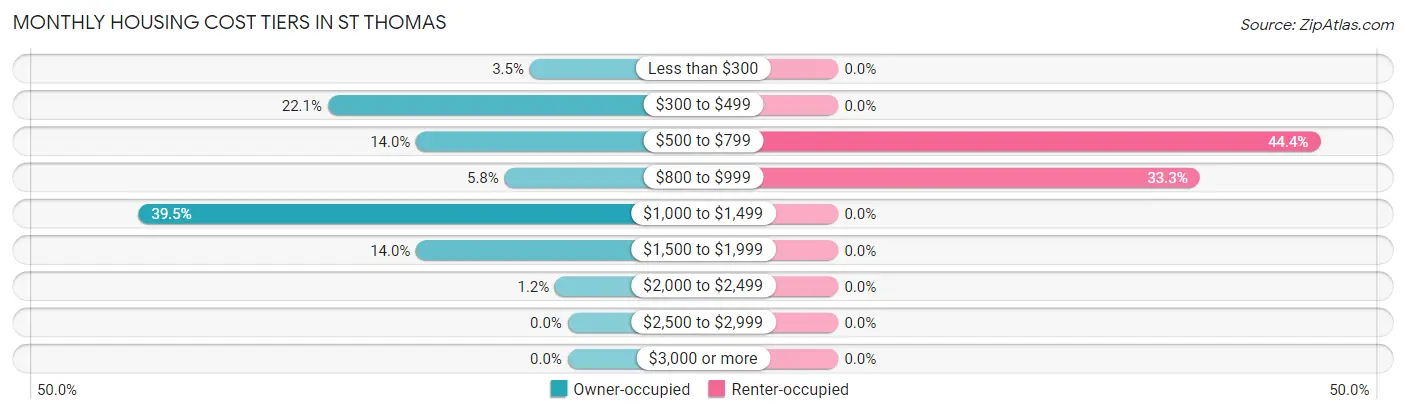
| Monthly Cost | Owner-occupied | Renter-occupied |
| Less than $300 | 3 (3.5%) | 0 (0.0%) |
| $300 to $499 | 19 (22.1%) | 0 (0.0%) |
| $500 to $799 | 12 (14.0%) | 4 (44.4%) |
| $800 to $999 | 5 (5.8%) | 3 (33.3%) |
| $1,000 to $1,499 | 34 (39.5%) | 0 (0.0%) |
| $1,500 to $1,999 | 12 (14.0%) | 0 (0.0%) |
| $2,000 to $2,499 | 1 (1.2%) | 0 (0.0%) |
| $2,500 to $2,999 | 0 (0.0%) | 0 (0.0%) |
| $3,000 or more | 0 (0.0%) | 0 (0.0%) |
| Total | 86 (100.0%) | 9 (100.0%) |
Physical Housing Characteristics in St Thomas
Housing Structures in St Thomas
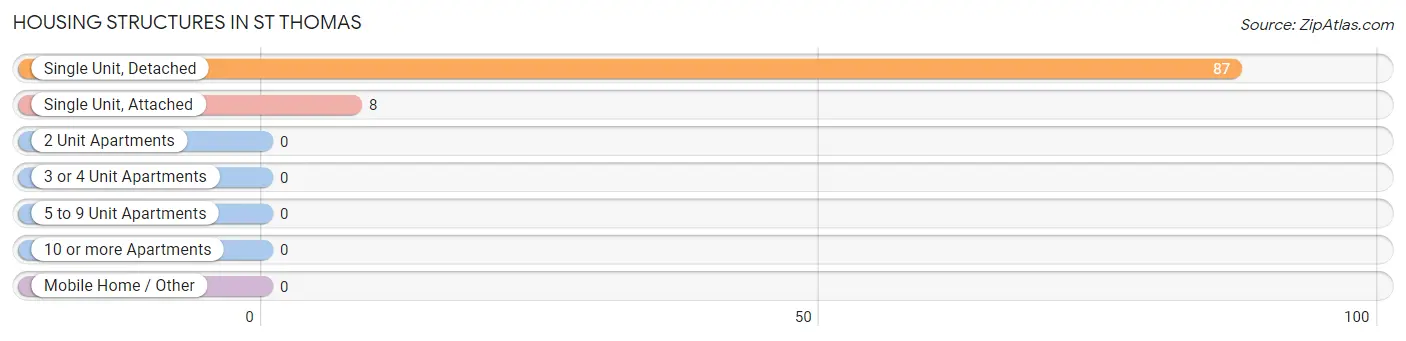
| Structure Type | # Housing Units | % Housing Units |
| Single Unit, Detached | 87 | 91.6% |
| Single Unit, Attached | 8 | 8.4% |
| 2 Unit Apartments | 0 | 0.0% |
| 3 or 4 Unit Apartments | 0 | 0.0% |
| 5 to 9 Unit Apartments | 0 | 0.0% |
| 10 or more Apartments | 0 | 0.0% |
| Mobile Home / Other | 0 | 0.0% |
| Total | 95 | 100.0% |
Housing Structures by Occupancy in St Thomas
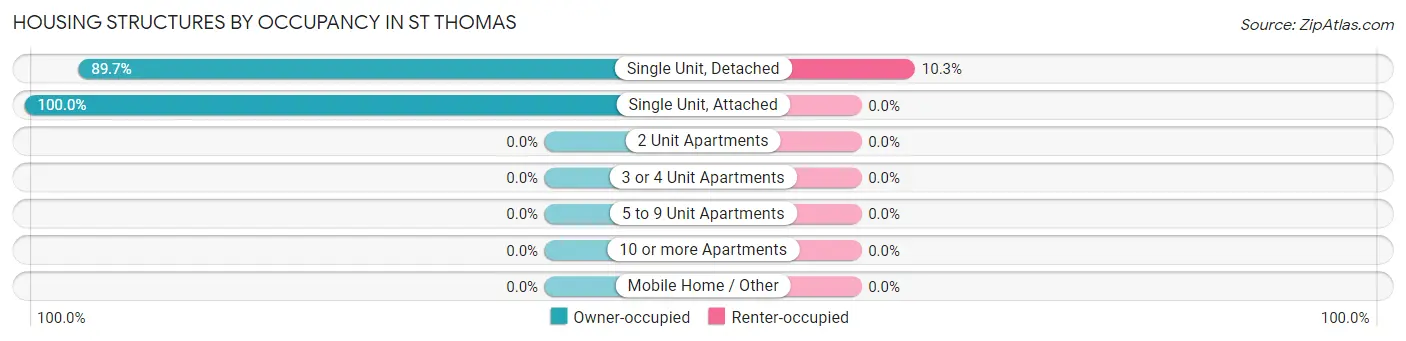
| Structure Type | Owner-occupied | Renter-occupied |
| Single Unit, Detached | 78 (89.7%) | 9 (10.3%) |
| Single Unit, Attached | 8 (100.0%) | 0 (0.0%) |
| 2 Unit Apartments | 0 (0.0%) | 0 (0.0%) |
| 3 or 4 Unit Apartments | 0 (0.0%) | 0 (0.0%) |
| 5 to 9 Unit Apartments | 0 (0.0%) | 0 (0.0%) |
| 10 or more Apartments | 0 (0.0%) | 0 (0.0%) |
| Mobile Home / Other | 0 (0.0%) | 0 (0.0%) |
| Total | 86 (90.5%) | 9 (9.5%) |
Housing Structures by Number of Rooms in St Thomas
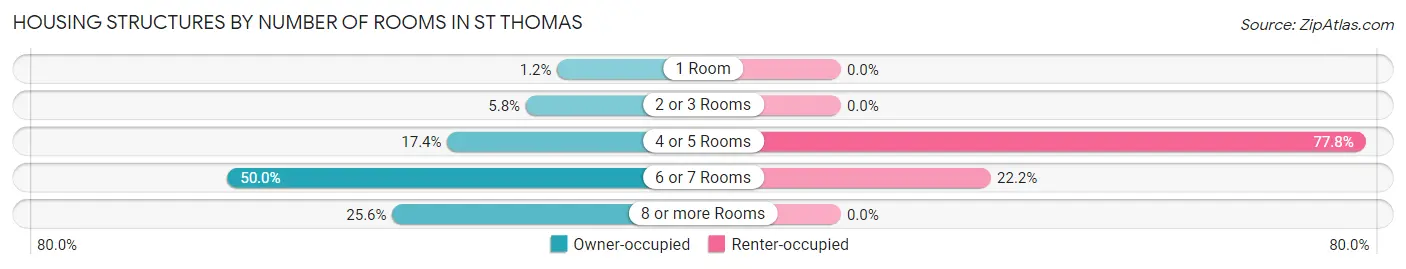
| Number of Rooms | Owner-occupied | Renter-occupied |
| 1 Room | 1 (1.2%) | 0 (0.0%) |
| 2 or 3 Rooms | 5 (5.8%) | 0 (0.0%) |
| 4 or 5 Rooms | 15 (17.4%) | 7 (77.8%) |
| 6 or 7 Rooms | 43 (50.0%) | 2 (22.2%) |
| 8 or more Rooms | 22 (25.6%) | 0 (0.0%) |
| Total | 86 (100.0%) | 9 (100.0%) |
Housing Structure by Heating Type in St Thomas
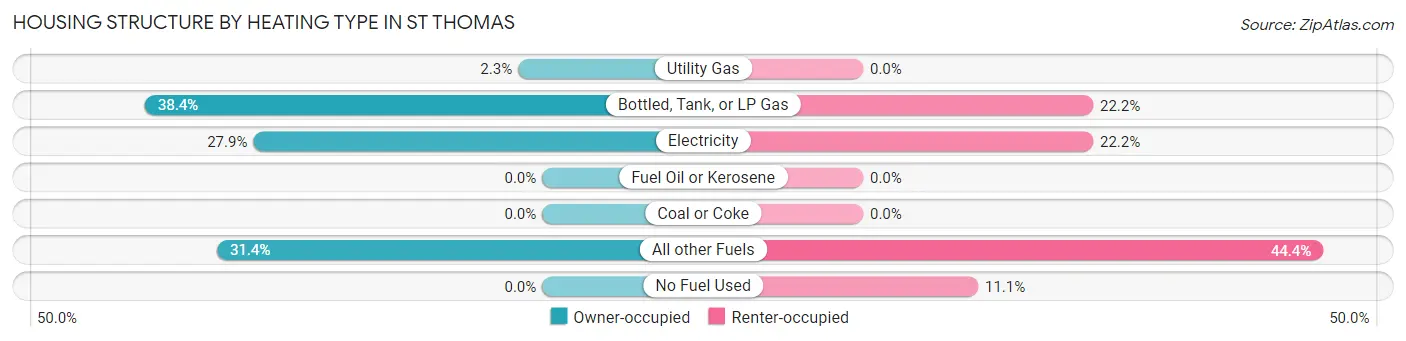
| Heating Type | Owner-occupied | Renter-occupied |
| Utility Gas | 2 (2.3%) | 0 (0.0%) |
| Bottled, Tank, or LP Gas | 33 (38.4%) | 2 (22.2%) |
| Electricity | 24 (27.9%) | 2 (22.2%) |
| Fuel Oil or Kerosene | 0 (0.0%) | 0 (0.0%) |
| Coal or Coke | 0 (0.0%) | 0 (0.0%) |
| All other Fuels | 27 (31.4%) | 4 (44.4%) |
| No Fuel Used | 0 (0.0%) | 1 (11.1%) |
| Total | 86 (100.0%) | 9 (100.0%) |
Household Vehicle Usage in St Thomas
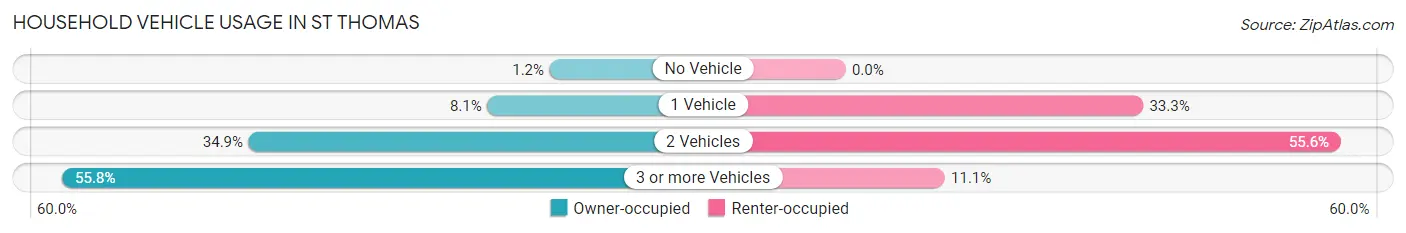
| Vehicles per Household | Owner-occupied | Renter-occupied |
| No Vehicle | 1 (1.2%) | 0 (0.0%) |
| 1 Vehicle | 7 (8.1%) | 3 (33.3%) |
| 2 Vehicles | 30 (34.9%) | 5 (55.6%) |
| 3 or more Vehicles | 48 (55.8%) | 1 (11.1%) |
| Total | 86 (100.0%) | 9 (100.0%) |
Real Estate & Mortgages in St Thomas
Real Estate and Mortgage Overview in St Thomas
| Characteristic | Without Mortgage | With Mortgage |
| Housing Units | 29 | 57 |
| Median Property Value | $217,500 | $195,800 |
| Median Household Income | $93,750 | $11 |
| Monthly Housing Costs | $425 | $0 |
| Real Estate Taxes | $1,321 | $3 |
Property Value by Mortgage Status in St Thomas
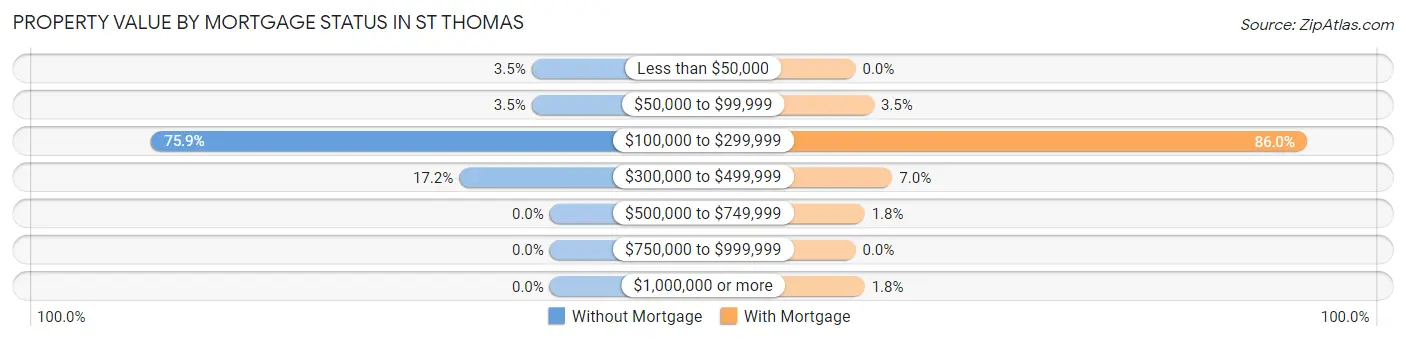
| Property Value | Without Mortgage | With Mortgage |
| Less than $50,000 | 1 (3.5%) | 0 (0.0%) |
| $50,000 to $99,999 | 1 (3.5%) | 2 (3.5%) |
| $100,000 to $299,999 | 22 (75.9%) | 49 (86.0%) |
| $300,000 to $499,999 | 5 (17.2%) | 4 (7.0%) |
| $500,000 to $749,999 | 0 (0.0%) | 1 (1.8%) |
| $750,000 to $999,999 | 0 (0.0%) | 0 (0.0%) |
| $1,000,000 or more | 0 (0.0%) | 1 (1.8%) |
| Total | 29 (100.0%) | 57 (100.0%) |
Household Income by Mortgage Status in St Thomas
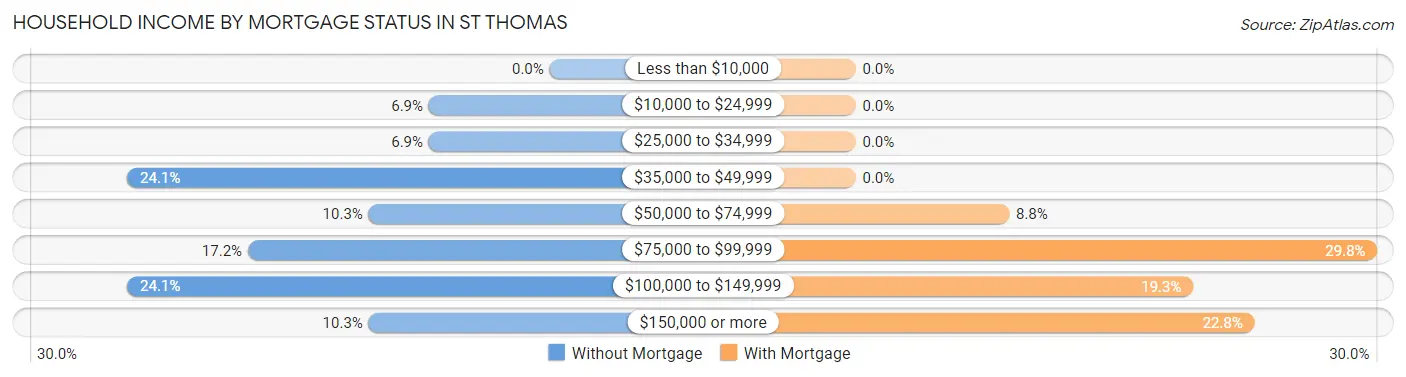
| Household Income | Without Mortgage | With Mortgage |
| Less than $10,000 | 0 (0.0%) | 0 (0.0%) |
| $10,000 to $24,999 | 2 (6.9%) | 0 (0.0%) |
| $25,000 to $34,999 | 2 (6.9%) | 0 (0.0%) |
| $35,000 to $49,999 | 7 (24.1%) | 0 (0.0%) |
| $50,000 to $74,999 | 3 (10.3%) | 5 (8.8%) |
| $75,000 to $99,999 | 5 (17.2%) | 17 (29.8%) |
| $100,000 to $149,999 | 7 (24.1%) | 11 (19.3%) |
| $150,000 or more | 3 (10.3%) | 13 (22.8%) |
| Total | 29 (100.0%) | 57 (100.0%) |
Property Value to Household Income Ratio in St Thomas
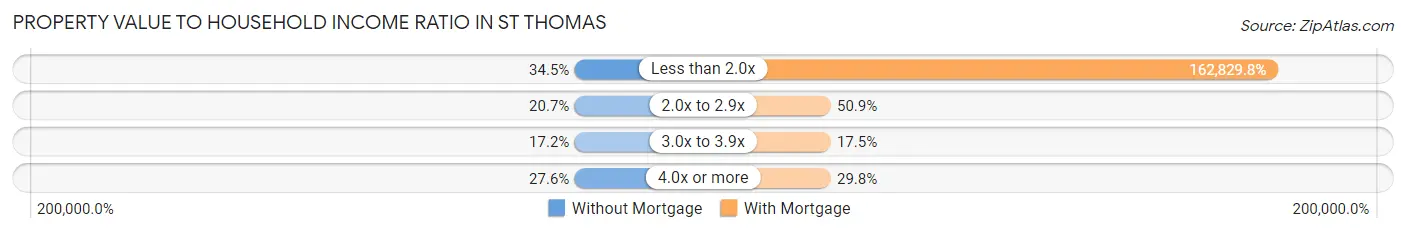
| Value-to-Income Ratio | Without Mortgage | With Mortgage |
| Less than 2.0x | 10 (34.5%) | 92,813 (162,829.8%) |
| 2.0x to 2.9x | 6 (20.7%) | 29 (50.9%) |
| 3.0x to 3.9x | 5 (17.2%) | 10 (17.5%) |
| 4.0x or more | 8 (27.6%) | 17 (29.8%) |
| Total | 29 (100.0%) | 57 (100.0%) |
Real Estate Taxes by Mortgage Status in St Thomas
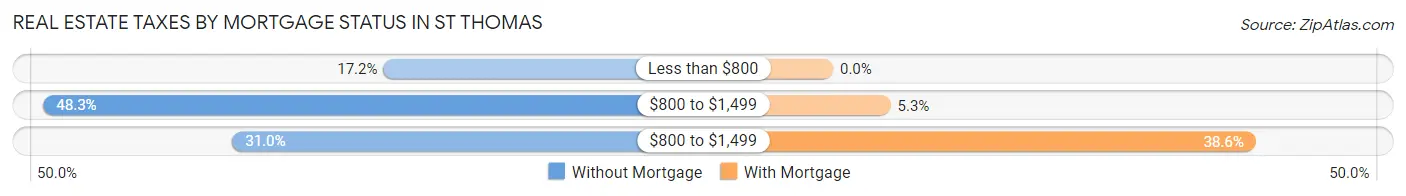
| Property Taxes | Without Mortgage | With Mortgage |
| Less than $800 | 5 (17.2%) | 0 (0.0%) |
| $800 to $1,499 | 14 (48.3%) | 3 (5.3%) |
| $800 to $1,499 | 9 (31.0%) | 22 (38.6%) |
| Total | 29 (100.0%) | 57 (100.0%) |
Health & Disability in St Thomas
Health Insurance Coverage by Age in St Thomas
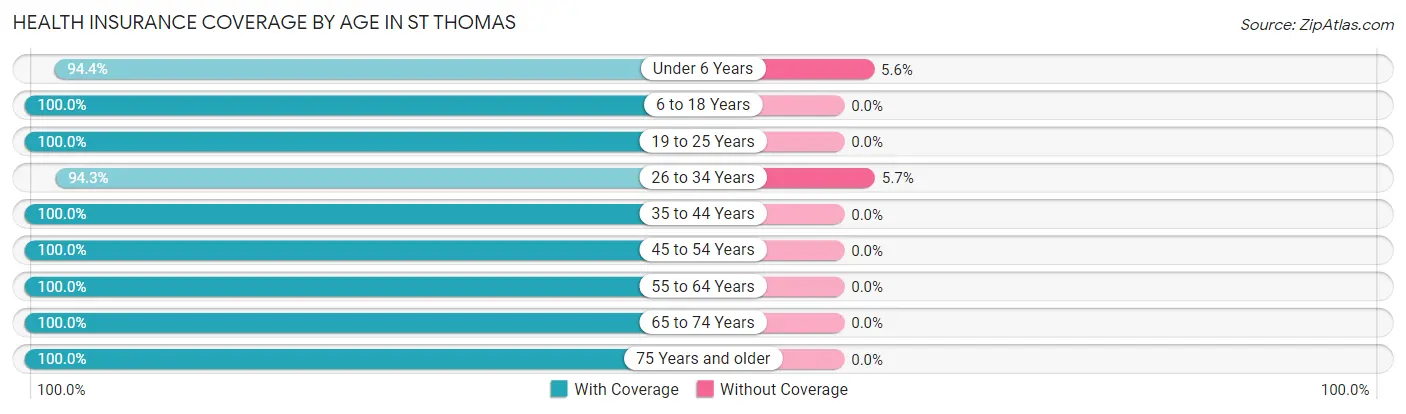
| Age Bracket | With Coverage | Without Coverage |
| Under 6 Years | 34 (94.4%) | 2 (5.6%) |
| 6 to 18 Years | 30 (100.0%) | 0 (0.0%) |
| 19 to 25 Years | 19 (100.0%) | 0 (0.0%) |
| 26 to 34 Years | 33 (94.3%) | 2 (5.7%) |
| 35 to 44 Years | 48 (100.0%) | 0 (0.0%) |
| 45 to 54 Years | 33 (100.0%) | 0 (0.0%) |
| 55 to 64 Years | 14 (100.0%) | 0 (0.0%) |
| 65 to 74 Years | 20 (100.0%) | 0 (0.0%) |
| 75 Years and older | 14 (100.0%) | 0 (0.0%) |
| Total | 245 (98.4%) | 4 (1.6%) |
Health Insurance Coverage by Citizenship Status in St Thomas
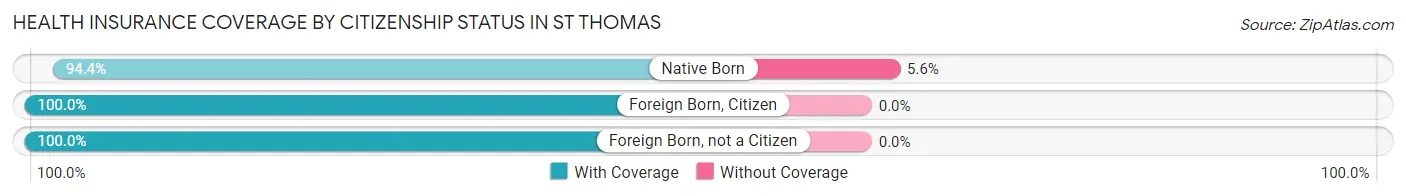
| Citizenship Status | With Coverage | Without Coverage |
| Native Born | 34 (94.4%) | 2 (5.6%) |
| Foreign Born, Citizen | 30 (100.0%) | 0 (0.0%) |
| Foreign Born, not a Citizen | 19 (100.0%) | 0 (0.0%) |
Health Insurance Coverage by Household Income in St Thomas
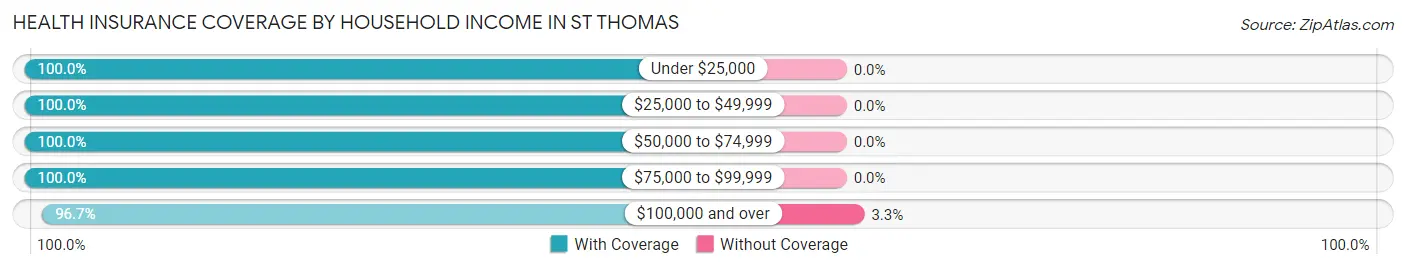
| Household Income | With Coverage | Without Coverage |
| Under $25,000 | 4 (100.0%) | 0 (0.0%) |
| $25,000 to $49,999 | 19 (100.0%) | 0 (0.0%) |
| $50,000 to $74,999 | 65 (100.0%) | 0 (0.0%) |
| $75,000 to $99,999 | 40 (100.0%) | 0 (0.0%) |
| $100,000 and over | 117 (96.7%) | 4 (3.3%) |
Public vs Private Health Insurance Coverage by Age in St Thomas
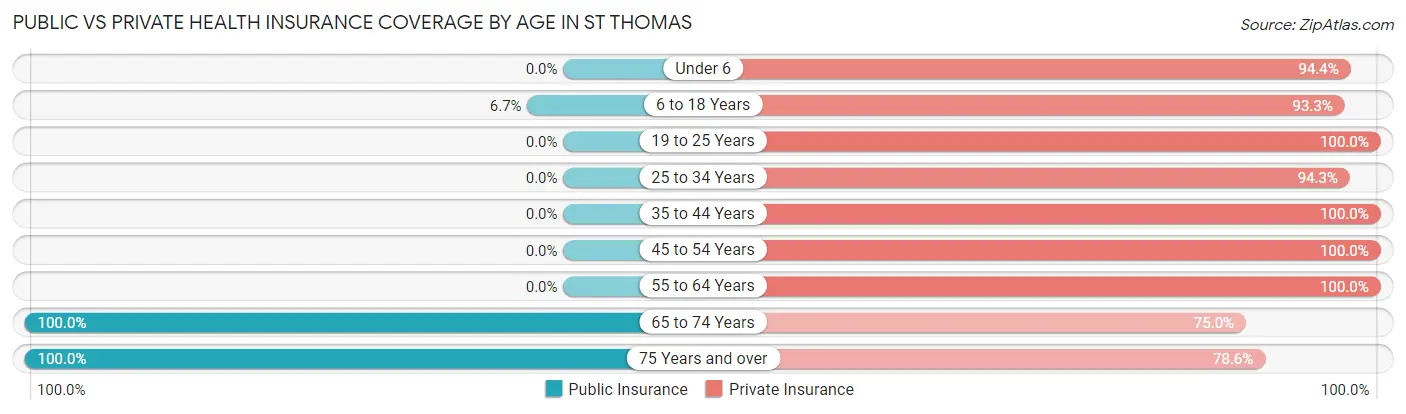
| Age Bracket | Public Insurance | Private Insurance |
| Under 6 | 0 (0.0%) | 34 (94.4%) |
| 6 to 18 Years | 2 (6.7%) | 28 (93.3%) |
| 19 to 25 Years | 0 (0.0%) | 19 (100.0%) |
| 25 to 34 Years | 0 (0.0%) | 33 (94.3%) |
| 35 to 44 Years | 0 (0.0%) | 48 (100.0%) |
| 45 to 54 Years | 0 (0.0%) | 33 (100.0%) |
| 55 to 64 Years | 0 (0.0%) | 14 (100.0%) |
| 65 to 74 Years | 20 (100.0%) | 15 (75.0%) |
| 75 Years and over | 14 (100.0%) | 11 (78.6%) |
| Total | 36 (14.5%) | 235 (94.4%) |
Disability Status by Sex by Age in St Thomas
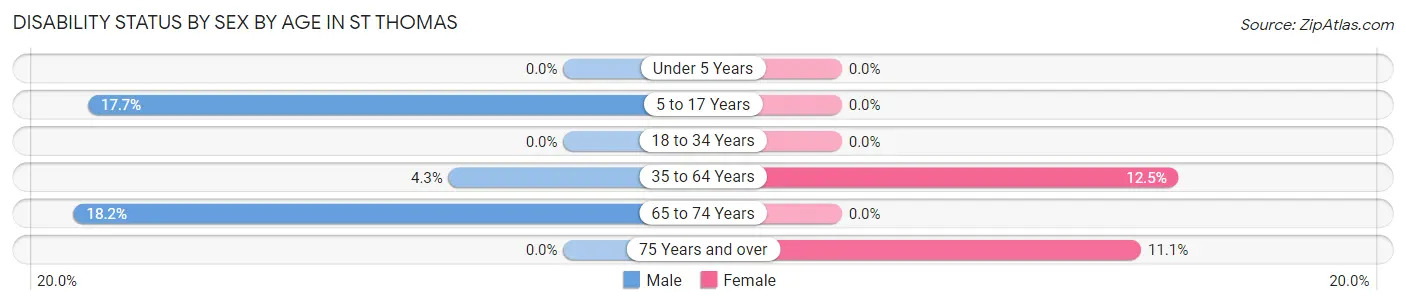
| Age Bracket | Male | Female |
| Under 5 Years | 0 (0.0%) | 0 (0.0%) |
| 5 to 17 Years | 3 (17.6%) | 0 (0.0%) |
| 18 to 34 Years | 0 (0.0%) | 0 (0.0%) |
| 35 to 64 Years | 2 (4.3%) | 6 (12.5%) |
| 65 to 74 Years | 2 (18.2%) | 0 (0.0%) |
| 75 Years and over | 0 (0.0%) | 1 (11.1%) |
Disability Class by Sex by Age in St Thomas
Disability Class: Hearing Difficulty

| Age Bracket | Male | Female |
| Under 5 Years | 0 (0.0%) | 0 (0.0%) |
| 5 to 17 Years | 0 (0.0%) | 0 (0.0%) |
| 18 to 34 Years | 0 (0.0%) | 0 (0.0%) |
| 35 to 64 Years | 0 (0.0%) | 0 (0.0%) |
| 65 to 74 Years | 0 (0.0%) | 0 (0.0%) |
| 75 Years and over | 0 (0.0%) | 1 (11.1%) |
Disability Class: Vision Difficulty
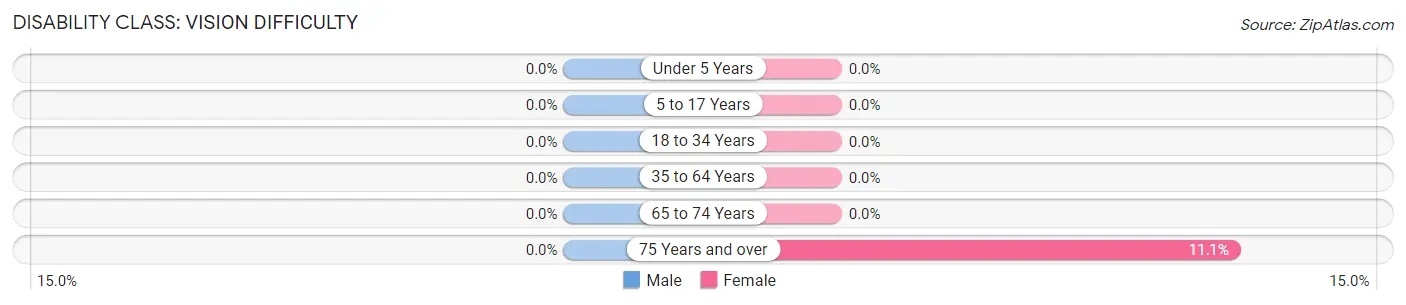
| Age Bracket | Male | Female |
| Under 5 Years | 0 (0.0%) | 0 (0.0%) |
| 5 to 17 Years | 0 (0.0%) | 0 (0.0%) |
| 18 to 34 Years | 0 (0.0%) | 0 (0.0%) |
| 35 to 64 Years | 0 (0.0%) | 0 (0.0%) |
| 65 to 74 Years | 0 (0.0%) | 0 (0.0%) |
| 75 Years and over | 0 (0.0%) | 1 (11.1%) |
Disability Class: Cognitive Difficulty
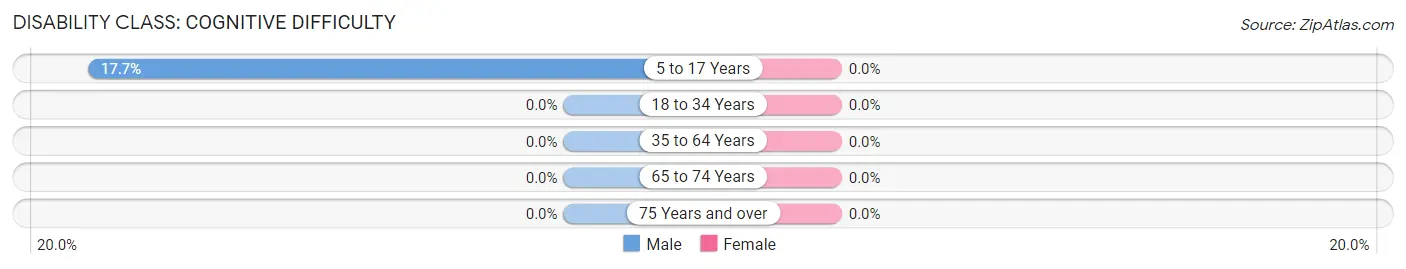
| Age Bracket | Male | Female |
| 5 to 17 Years | 3 (17.6%) | 0 (0.0%) |
| 18 to 34 Years | 0 (0.0%) | 0 (0.0%) |
| 35 to 64 Years | 0 (0.0%) | 0 (0.0%) |
| 65 to 74 Years | 0 (0.0%) | 0 (0.0%) |
| 75 Years and over | 0 (0.0%) | 0 (0.0%) |
Disability Class: Ambulatory Difficulty
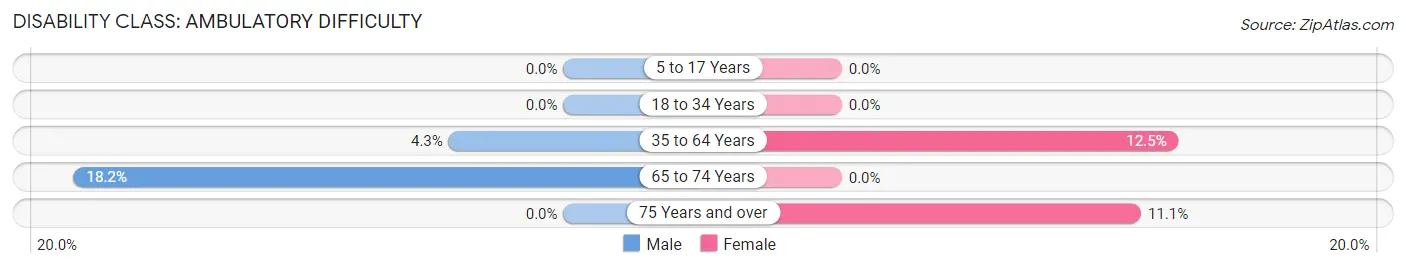
| Age Bracket | Male | Female |
| 5 to 17 Years | 0 (0.0%) | 0 (0.0%) |
| 18 to 34 Years | 0 (0.0%) | 0 (0.0%) |
| 35 to 64 Years | 2 (4.3%) | 6 (12.5%) |
| 65 to 74 Years | 2 (18.2%) | 0 (0.0%) |
| 75 Years and over | 0 (0.0%) | 1 (11.1%) |
Disability Class: Self-Care Difficulty
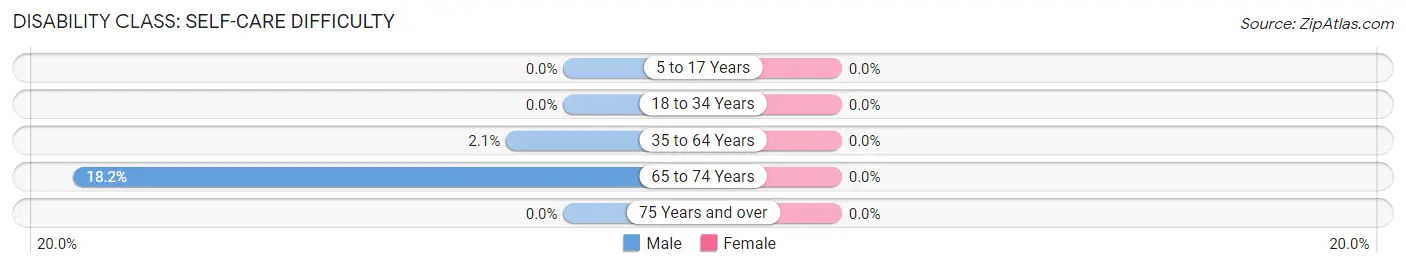
| Age Bracket | Male | Female |
| 5 to 17 Years | 0 (0.0%) | 0 (0.0%) |
| 18 to 34 Years | 0 (0.0%) | 0 (0.0%) |
| 35 to 64 Years | 1 (2.1%) | 0 (0.0%) |
| 65 to 74 Years | 2 (18.2%) | 0 (0.0%) |
| 75 Years and over | 0 (0.0%) | 0 (0.0%) |
Technology Access in St Thomas
Computing Device Access in St Thomas
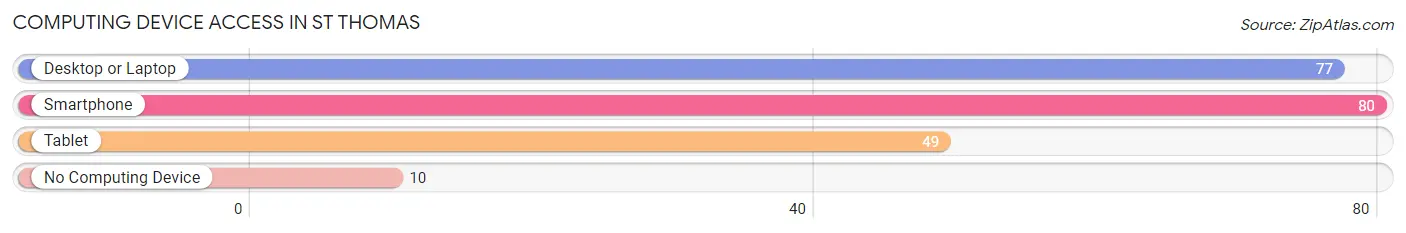
| Device Type | # Households | % Households |
| Desktop or Laptop | 77 | 81.0% |
| Smartphone | 80 | 84.2% |
| Tablet | 49 | 51.6% |
| No Computing Device | 10 | 10.5% |
| Total | 95 | 100.0% |
Internet Access in St Thomas
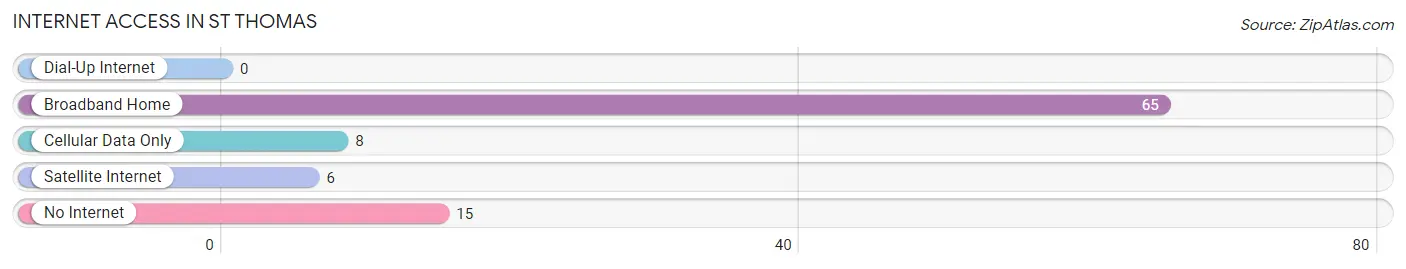
| Internet Type | # Households | % Households |
| Dial-Up Internet | 0 | 0.0% |
| Broadband Home | 65 | 68.4% |
| Cellular Data Only | 8 | 8.4% |
| Satellite Internet | 6 | 6.3% |
| No Internet | 15 | 15.8% |
| Total | 95 | 100.0% |
St Thomas Summary
Thomas, Missouri is a small town located in the southeastern corner of the state, in the Ozark Mountains. It is situated in the foothills of the Ozarks, and is surrounded by rolling hills and lush forests. The town is located on the banks of the Black River, and is home to a population of just over 1,000 people.
History
The area that is now St. Thomas was first settled in the early 1800s by a group of settlers from Kentucky. The settlers were attracted to the area by its abundant natural resources, including timber, minerals, and fertile soil. The town was originally known as “Black River”, and was later renamed “St. Thomas” in honor of the patron saint of the settlers.
The town was officially incorporated in 1872, and the first post office was established in 1873. The town quickly grew and prospered, and by the early 1900s, it had become a thriving community with a population of over 1,000 people.
Geography
St. Thomas is located in the southeastern corner of Missouri, in the Ozark Mountains. The town is situated on the banks of the Black River, and is surrounded by rolling hills and lush forests. The town is located at an elevation of 890 feet above sea level, and has a total area of 1.2 square miles.
The climate in St. Thomas is humid subtropical, with hot, humid summers and mild winters. The average annual temperature is around 60 degrees Fahrenheit, and the average annual precipitation is around 40 inches.
Economy
The economy of St. Thomas is largely based on agriculture and tourism. The town is home to several small farms, which produce a variety of crops, including corn, soybeans, wheat, and hay. The town is also home to several small businesses, including restaurants, shops, and a few small manufacturing companies.
Tourism is also an important part of the local economy. The town is home to several attractions, including the Black River State Park, which offers camping, fishing, and hiking opportunities. The town is also home to several historic sites, including the St. Thomas Church, which was built in 1872.
Demographics
As of the 2010 census, the population of St. Thomas was 1,072. The racial makeup of the town was 97.2% White, 0.7% African American, 0.2% Native American, 0.2% Asian, 0.1% Pacific Islander, 0.7% from other races, and 0.9% from two or more races. Hispanic or Latino of any race were 1.3% of the population.
The median income for a household in St. Thomas was $35,625, and the median income for a family was $41,250. The per capita income for the town was $17,845. About 11.2% of families and 14.2% of the population were below the poverty line, including 18.2% of those under age 18 and 8.3% of those age 65 or over.
St. Thomas is a small town with a rich history and a vibrant economy. The town is home to a diverse population, and offers a variety of attractions and activities for visitors and residents alike. With its beautiful scenery and friendly people, St. Thomas is a great place to live, work, and play.
Common Questions
What is the Total Population of St Thomas?
Total Population of St Thomas is 249.
What is the Total Male Population of St Thomas?
Total Male Population of St Thomas is 116.
What is the Total Female Population of St Thomas?
Total Female Population of St Thomas is 133.
What is the Ratio of Males per 100 Females in St Thomas?
There are 87.22 Males per 100 Females in St Thomas.
What is the Ratio of Females per 100 Males in St Thomas?
There are 114.66 Females per 100 Males in St Thomas.
What is the Median Population Age in St Thomas?
Median Population Age in St Thomas is 36.2 Years.
What is the Average Family Size in St Thomas
Average Family Size in St Thomas is 3.1 People.
What is the Average Household Size in St Thomas
Average Household Size in St Thomas is 2.6 People.
What is Per Capita Income in St Thomas?
Per Capita income in St Thomas is $44,589.
What is the Median Family Income in St Thomas?
Median Family Income in St Thomas is $94,000.
What is the Median Household income in St Thomas?
Median Household Income in St Thomas is $82,083.
What is Income or Wage Gap in St Thomas?
Income or Wage Gap in St Thomas is 21.6%.
Women in St Thomas earn 78.4 cents for every dollar earned by a man.
What is Inequality or Gini Index in St Thomas?
Inequality or Gini Index in St Thomas is 0.42.
How Large is the Labor Force in St Thomas?
There are 150 People in the Labor Forcein in St Thomas.
What is the Percentage of People in the Labor Force in St Thomas?
76.9% of People are in the Labor Force in St Thomas.