Schell City, MO
Schell City Map
Schell City Overview
164
TOTAL POPULATION
73
MALE POPULATION
91
FEMALE POPULATION
80.22
MALES / 100 FEMALES
124.66
FEMALES / 100 MALES
53.5
MEDIAN AGE
2.9
AVG FAMILY SIZE
2.2
AVG HOUSEHOLD SIZE
$17,398
PER CAPITA INCOME
$44,167
AVG FAMILY INCOME
$26,875
AVG HOUSEHOLD INCOME
$13,457
FAMILY INCOME DEFICIT
0.40
INEQUALITY / GINI INDEX
38
LABOR FORCE [ PEOPLE ]
29.5%
PERCENT IN LABOR FORCE
5.3%
UNEMPLOYMENT RATE
Schell City Zip Codes
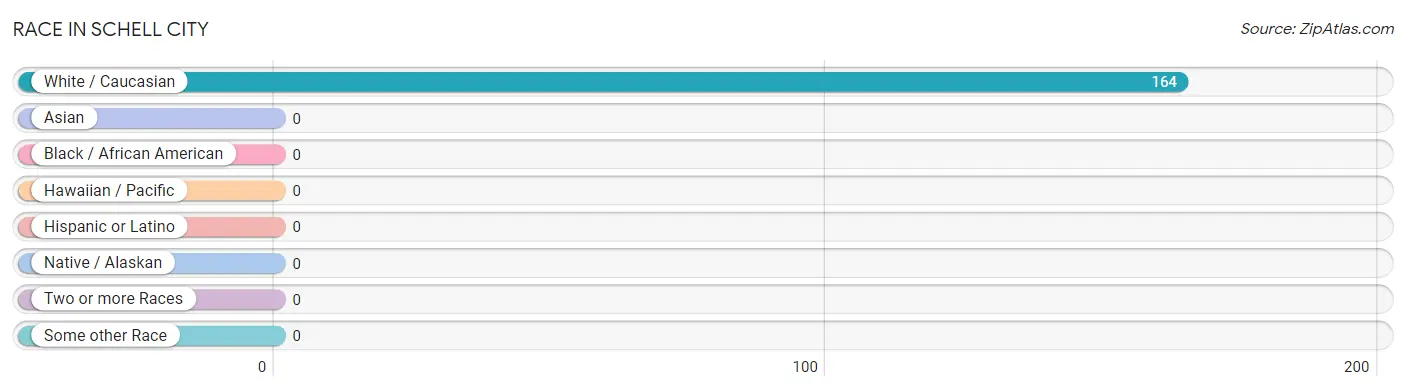
Race in Schell City
The most populous races in Schell City are , and White / Caucasian (164 | 100.0%).
| Race | # Population | % Population |
| Asian | 0 | 0.0% |
| Black / African American | 0 | 0.0% |
| Hawaiian / Pacific | 0 | 0.0% |
| Hispanic or Latino | 0 | 0.0% |
| Native / Alaskan | 0 | 0.0% |
| White / Caucasian | 164 | 100.0% |
| Two or more Races | 0 | 0.0% |
| Some other Race | 0 | 0.0% |
| Total | 164 | 100.0% |
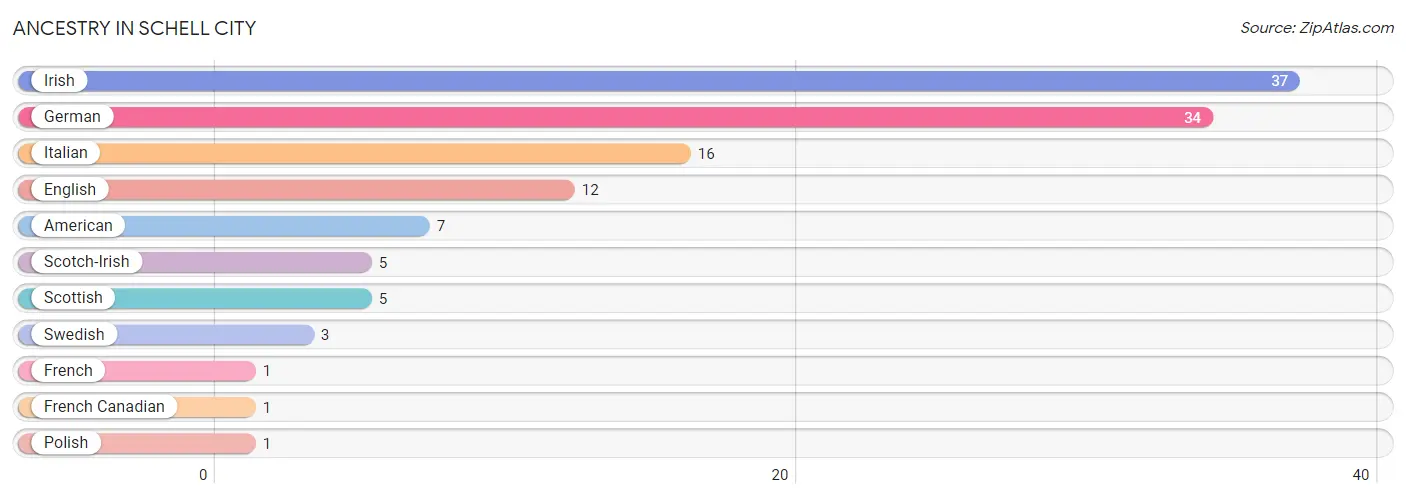
Ancestry in Schell City
The most populous ancestries reported in Schell City are Irish (37 | 22.6%), German (34 | 20.7%), Italian (16 | 9.8%), English (12 | 7.3%), and American (7 | 4.3%), together accounting for 64.6% of all Schell City residents.
| Ancestry | # Population | % Population |
| American | 7 | 4.3% |
| English | 12 | 7.3% |
| French | 1 | 0.6% |
| French Canadian | 1 | 0.6% |
| German | 34 | 20.7% |
| Irish | 37 | 22.6% |
| Italian | 16 | 9.8% |
| Polish | 1 | 0.6% |
| Scotch-Irish | 5 | 3.0% |
| Scottish | 5 | 3.0% |
| Swedish | 3 | 1.8% | View All 11 Rows |
Immigrants in Schell City
The most numerous immigrant groups reported in Schell City came from , and Canada (2 | 1.2%), together accounting for 1.2% of all Schell City residents.

| Immigration Origin | # Population | % Population |
| Canada | 2 | 1.2% | View All 1 Rows |
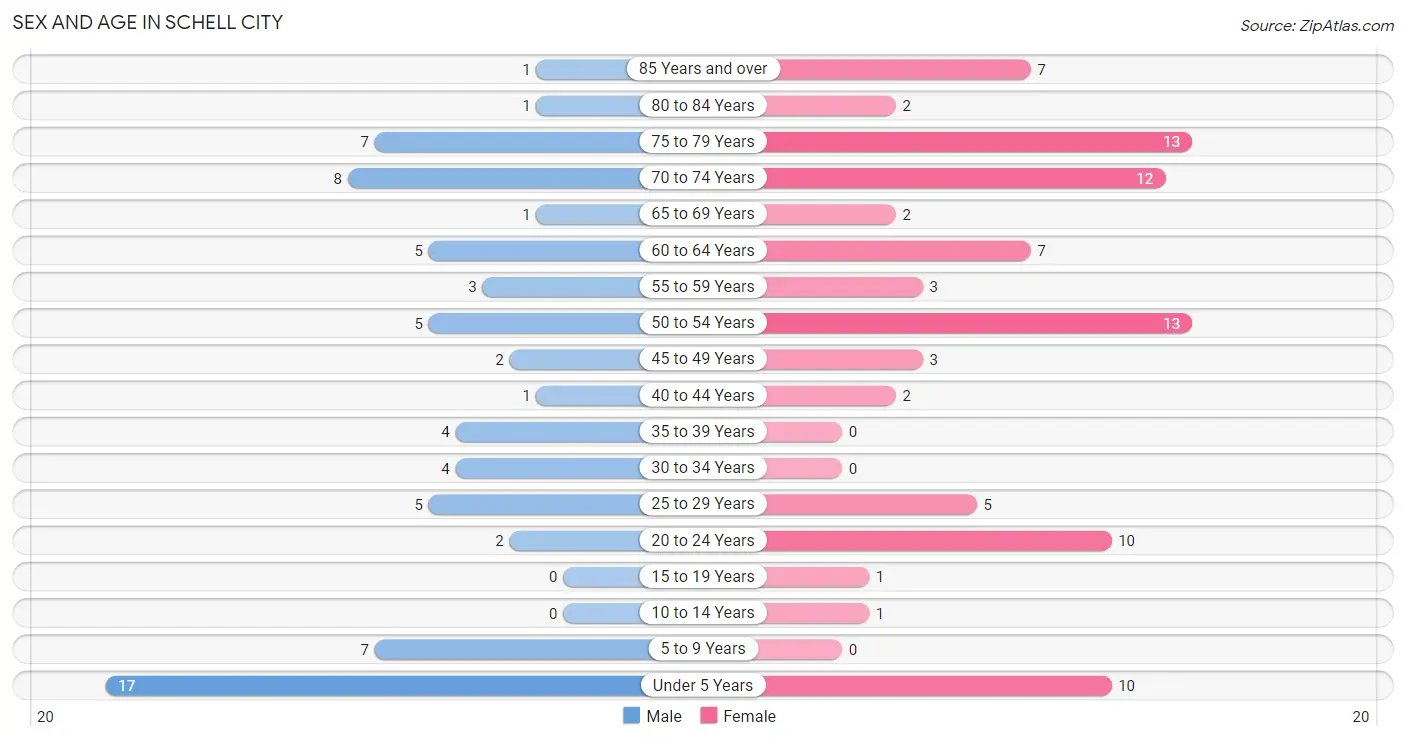
Sex and Age in Schell City
Sex and Age in Schell City
The most populous age groups in Schell City are Under 5 Years (17 | 23.3%) for men and 50 to 54 Years (13 | 14.3%) for women.
| Age Bracket | Male | Female |
| Under 5 Years | 17 (23.3%) | 10 (11.0%) |
| 5 to 9 Years | 7 (9.6%) | 0 (0.0%) |
| 10 to 14 Years | 0 (0.0%) | 1 (1.1%) |
| 15 to 19 Years | 0 (0.0%) | 1 (1.1%) |
| 20 to 24 Years | 2 (2.7%) | 10 (11.0%) |
| 25 to 29 Years | 5 (6.9%) | 5 (5.5%) |
| 30 to 34 Years | 4 (5.5%) | 0 (0.0%) |
| 35 to 39 Years | 4 (5.5%) | 0 (0.0%) |
| 40 to 44 Years | 1 (1.4%) | 2 (2.2%) |
| 45 to 49 Years | 2 (2.7%) | 3 (3.3%) |
| 50 to 54 Years | 5 (6.9%) | 13 (14.3%) |
| 55 to 59 Years | 3 (4.1%) | 3 (3.3%) |
| 60 to 64 Years | 5 (6.9%) | 7 (7.7%) |
| 65 to 69 Years | 1 (1.4%) | 2 (2.2%) |
| 70 to 74 Years | 8 (11.0%) | 12 (13.2%) |
| 75 to 79 Years | 7 (9.6%) | 13 (14.3%) |
| 80 to 84 Years | 1 (1.4%) | 2 (2.2%) |
| 85 Years and over | 1 (1.4%) | 7 (7.7%) |
| Total | 73 (100.0%) | 91 (100.0%) |
Families and Households in Schell City
Median Family Size in Schell City
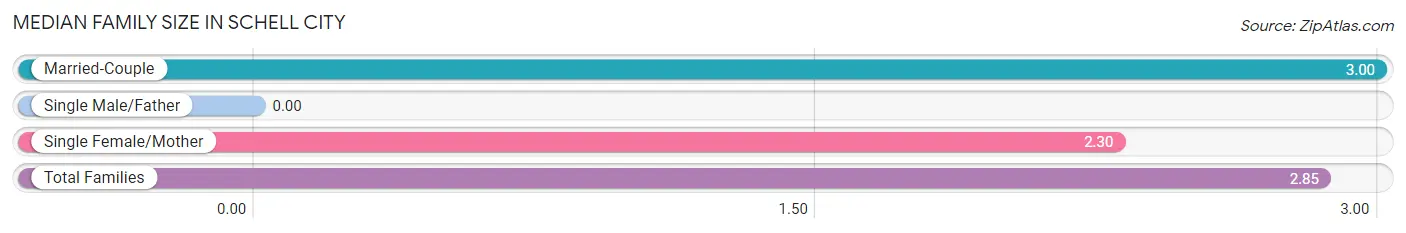
| Family Type | # Families | Family Size |
| Married-Couple | 36 (78.3%) | 3.00 |
| Single Male/Father | 0 (0.0%) | - |
| Single Female/Mother | 10 (21.7%) | 2.30 |
| Total Families | 46 (100.0%) | 2.85 |
Median Household Size in Schell City
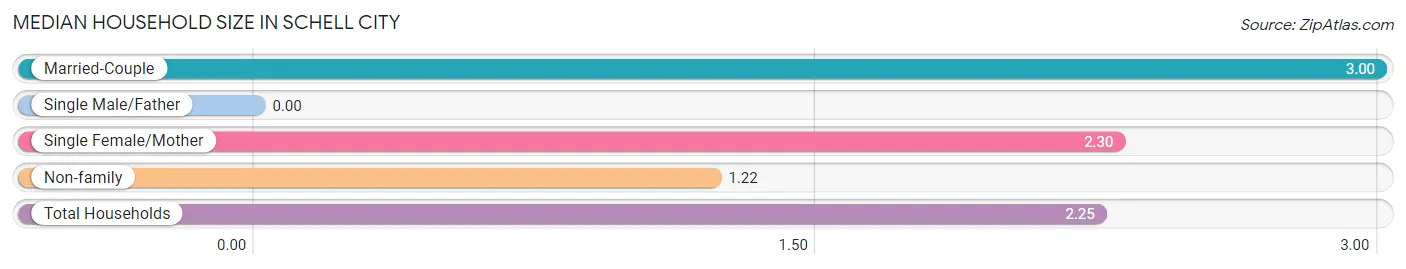
| Household Type | # Households | Household Size |
| Married-Couple | 36 (49.3%) | 3.00 |
| Single Male/Father | 0 (0.0%) | - |
| Single Female/Mother | 10 (13.7%) | 2.30 |
| Non-family | 27 (37.0%) | 1.22 |
| Total Households | 73 (100.0%) | 2.25 |
Household Size by Marriage Status in Schell City
Out of a total of 73 households in Schell City, 46 (63.0%) are family households, while 27 (37.0%) are nonfamily households. The most numerous type of family households are 2-person households, comprising 29, and the most common type of nonfamily households are 1-person households, comprising 23.
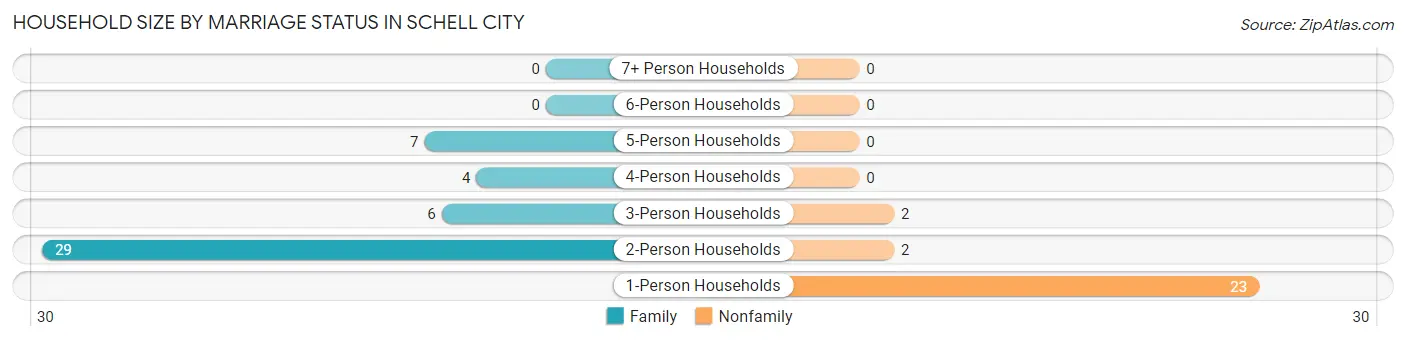
| Household Size | Family Households | Nonfamily Households |
| 1-Person Households | - | 23 (31.5%) |
| 2-Person Households | 29 (39.7%) | 2 (2.7%) |
| 3-Person Households | 6 (8.2%) | 2 (2.7%) |
| 4-Person Households | 4 (5.5%) | 0 (0.0%) |
| 5-Person Households | 7 (9.6%) | 0 (0.0%) |
| 6-Person Households | 0 (0.0%) | 0 (0.0%) |
| 7+ Person Households | 0 (0.0%) | 0 (0.0%) |
| Total | 46 (63.0%) | 27 (37.0%) |
Female Fertility in Schell City
Fertility by Age in Schell City
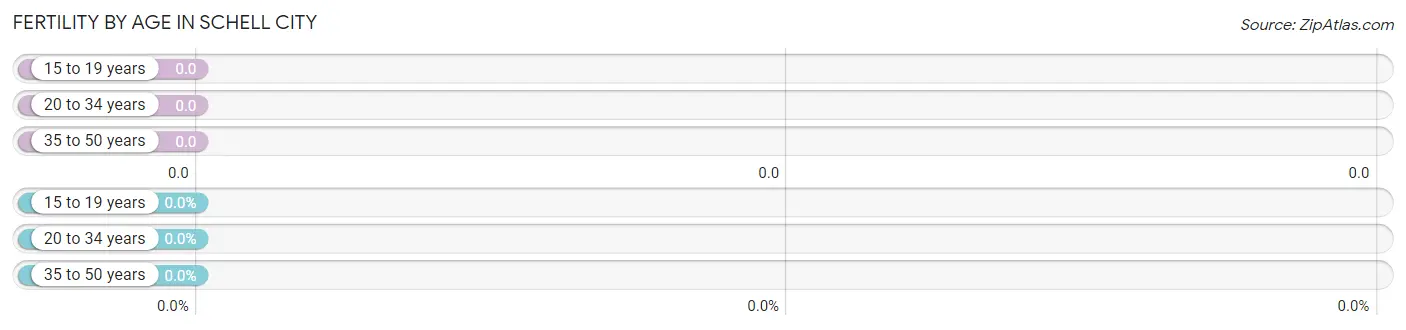
| Age Bracket | Women with Births | Births / 1,000 Women |
| 15 to 19 years | 0 (0.0%) | 0.0 |
| 20 to 34 years | 0 (0.0%) | 0.0 |
| 35 to 50 years | 0 (0.0%) | 0.0 |
| Total | 0 (0.0%) | 0.0 |
Fertility by Age by Marriage Status in Schell City
| Age Bracket | Married | Unmarried |
| 15 to 19 years | 0 (0.0%) | 0 (0.0%) |
| 20 to 34 years | 0 (0.0%) | 0 (0.0%) |
| 35 to 50 years | 0 (0.0%) | 0 (0.0%) |
| Total | 0 (0.0%) | 0 (0.0%) |
Fertility by Education in Schell City
| Educational Attainment | Women with Births | Births / 1,000 Women |
| Less than High School | 0 (0.0%) | 0.0 |
| High School Diploma | 0 (0.0%) | 0.0 |
| College or Associate's Degree | 0 (0.0%) | 0.0 |
| Bachelor's Degree | 0 (0.0%) | 0.0 |
| Graduate Degree | 0 (0.0%) | 0.0 |
| Total | 0 (0.0%) | 0.0 |
Fertility by Education by Marriage Status in Schell City
| Educational Attainment | Married | Unmarried |
| Less than High School | 0 (0.0%) | 0 (0.0%) |
| High School Diploma | 0 (0.0%) | 0 (0.0%) |
| College or Associate's Degree | 0 (0.0%) | 0 (0.0%) |
| Bachelor's Degree | 0 (0.0%) | 0 (0.0%) |
| Graduate Degree | 0 (0.0%) | 0 (0.0%) |
| Total | 0 (0.0%) | 0 (0.0%) |
Income in Schell City
Income Overview in Schell City
Per Capita Income in Schell City is $17,398, while median incomes of families and households are $44,167 and $26,875 respectively.
| Characteristic | Number | Measure |
| Per Capita Income | 164 | $17,398 |
| Median Family Income | 46 | $44,167 |
| Mean Family Income | 46 | $52,013 |
| Median Household Income | 73 | $26,875 |
| Mean Household Income | 73 | $42,738 |
| Income Deficit | 46 | $13,457 |
| Wage / Income Gap (%) | 164 | 0.00% |
| Wage / Income Gap ($) | 164 | 100.00¢ per $1 |
| Gini / Inequality Index | 164 | 0.40 |
Earnings by Sex in Schell City
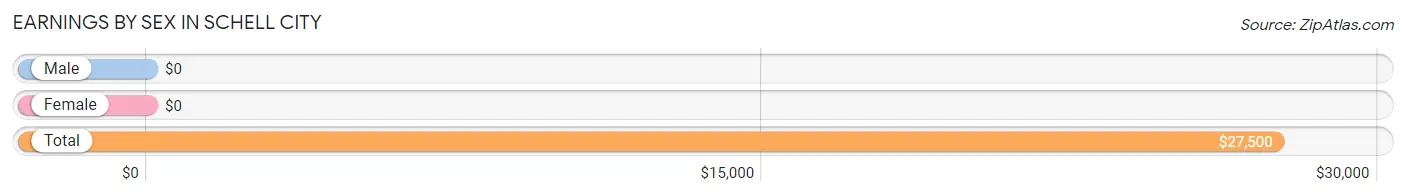
| Sex | Number | Average Earnings |
| Male | 16 (33.3%) | $0 |
| Female | 32 (66.7%) | $0 |
| Total | 48 (100.0%) | $27,500 |
Earnings by Sex by Income Bracket in Schell City
The most common earnings brackets in Schell City are $5,000 to $7,499 for men (2 | 12.5%) and $2,499 or less for women (6 | 18.8%).
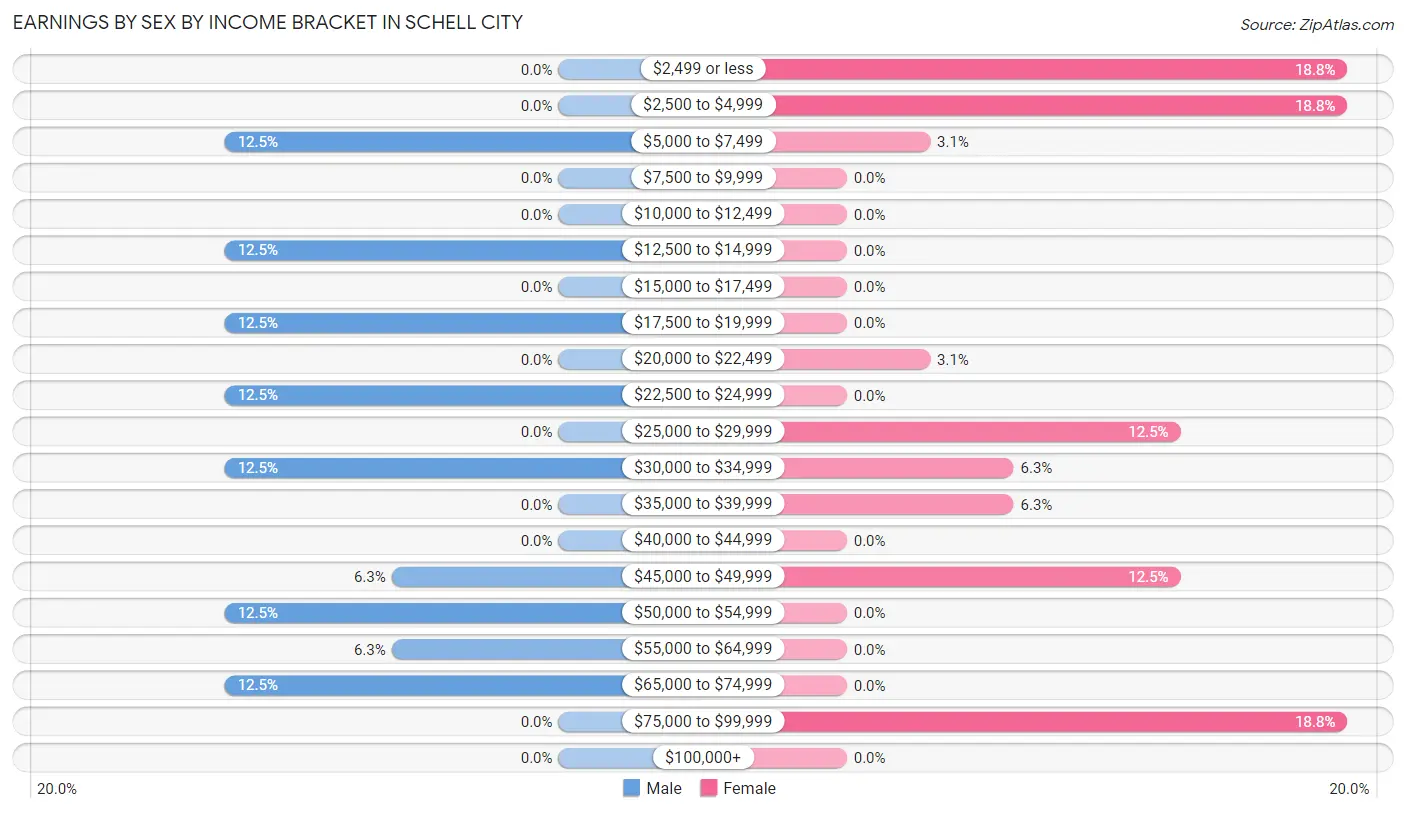
| Income | Male | Female |
| $2,499 or less | 0 (0.0%) | 6 (18.8%) |
| $2,500 to $4,999 | 0 (0.0%) | 6 (18.8%) |
| $5,000 to $7,499 | 2 (12.5%) | 1 (3.1%) |
| $7,500 to $9,999 | 0 (0.0%) | 0 (0.0%) |
| $10,000 to $12,499 | 0 (0.0%) | 0 (0.0%) |
| $12,500 to $14,999 | 2 (12.5%) | 0 (0.0%) |
| $15,000 to $17,499 | 0 (0.0%) | 0 (0.0%) |
| $17,500 to $19,999 | 2 (12.5%) | 0 (0.0%) |
| $20,000 to $22,499 | 0 (0.0%) | 1 (3.1%) |
| $22,500 to $24,999 | 2 (12.5%) | 0 (0.0%) |
| $25,000 to $29,999 | 0 (0.0%) | 4 (12.5%) |
| $30,000 to $34,999 | 2 (12.5%) | 2 (6.2%) |
| $35,000 to $39,999 | 0 (0.0%) | 2 (6.2%) |
| $40,000 to $44,999 | 0 (0.0%) | 0 (0.0%) |
| $45,000 to $49,999 | 1 (6.2%) | 4 (12.5%) |
| $50,000 to $54,999 | 2 (12.5%) | 0 (0.0%) |
| $55,000 to $64,999 | 1 (6.2%) | 0 (0.0%) |
| $65,000 to $74,999 | 2 (12.5%) | 0 (0.0%) |
| $75,000 to $99,999 | 0 (0.0%) | 6 (18.8%) |
| $100,000+ | 0 (0.0%) | 0 (0.0%) |
| Total | 16 (100.0%) | 32 (100.0%) |
Earnings by Sex by Educational Attainment in Schell City
| Educational Attainment | Male Income | Female Income |
| Less than High School | - | - |
| High School Diploma | - | - |
| College or Associate's Degree | - | - |
| Bachelor's Degree | - | - |
| Graduate Degree | - | - |
| Total | - | - |
Family Income in Schell City
Family Income Brackets in Schell City
According to the Schell City family income data, there are 11 families falling into the $50,000 to $74,999 income range, which is the most common income bracket and makes up 23.9% of all families.
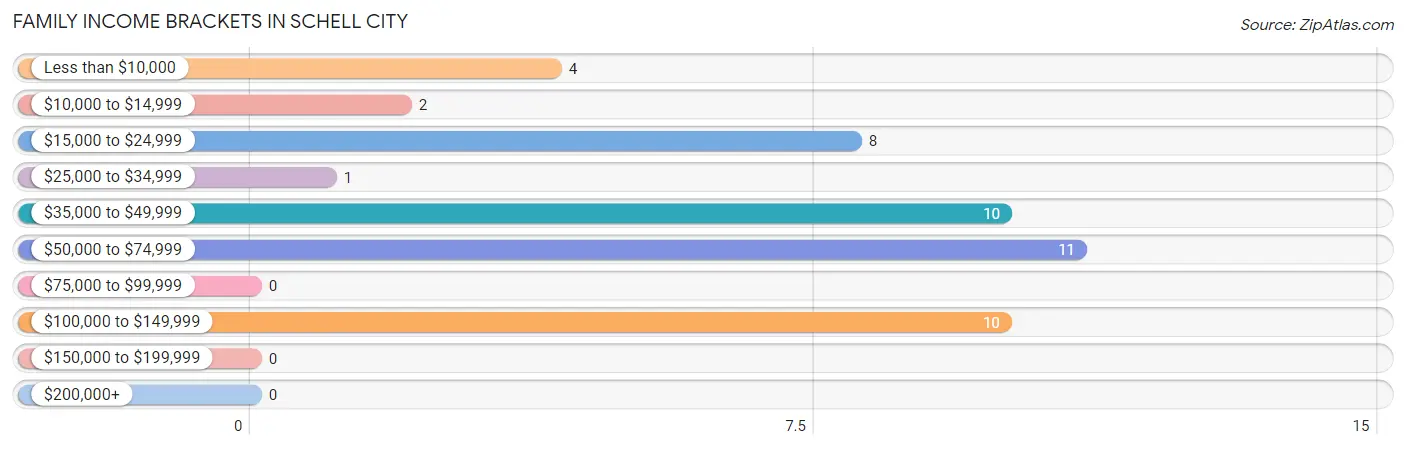
| Income Bracket | # Families | % Families |
| Less than $10,000 | 4 | 8.7% |
| $10,000 to $14,999 | 2 | 4.3% |
| $15,000 to $24,999 | 8 | 17.4% |
| $25,000 to $34,999 | 1 | 2.2% |
| $35,000 to $49,999 | 10 | 21.7% |
| $50,000 to $74,999 | 11 | 23.9% |
| $75,000 to $99,999 | 0 | 0.0% |
| $100,000 to $149,999 | 10 | 21.7% |
| $150,000 to $199,999 | 0 | 0.0% |
| $200,000+ | 0 | 0.0% |
Family Income by Famaliy Size in Schell City
2-person families (29 | 63.0%) account for the highest median family income in Schell City with $44,583 per family, while 2-person families (29 | 63.0%) have the highest median income of $22,292 per family member.
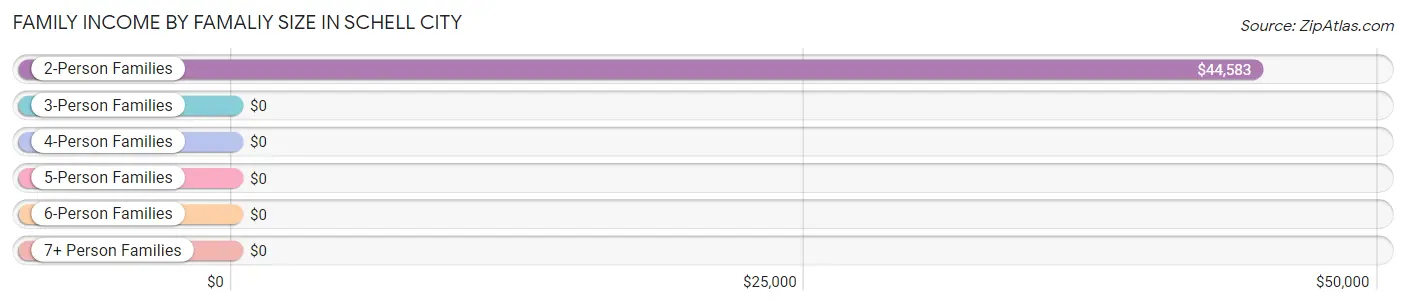
| Income Bracket | # Families | Median Income |
| 2-Person Families | 29 (63.0%) | $44,583 |
| 3-Person Families | 6 (13.0%) | $0 |
| 4-Person Families | 4 (8.7%) | $0 |
| 5-Person Families | 7 (15.2%) | $0 |
| 6-Person Families | 0 (0.0%) | $0 |
| 7+ Person Families | 0 (0.0%) | $0 |
| Total | 46 (100.0%) | $44,167 |
Family Income by Number of Earners in Schell City
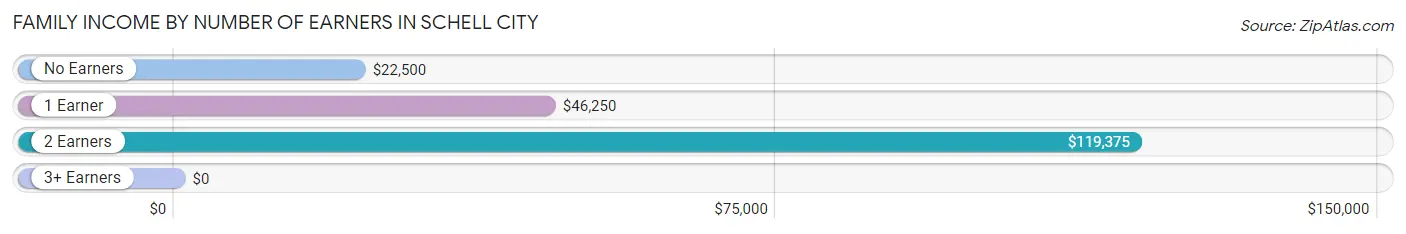
| Number of Earners | # Families | Median Income |
| No Earners | 10 (21.7%) | $22,500 |
| 1 Earner | 29 (63.0%) | $46,250 |
| 2 Earners | 7 (15.2%) | $119,375 |
| 3+ Earners | 0 (0.0%) | $0 |
| Total | 46 (100.0%) | $44,167 |
Household Income in Schell City
Household Income Brackets in Schell City
With 19 households falling in the category, the $15,000 to $24,999 income range is the most frequent in Schell City, accounting for 26.0% of all households.
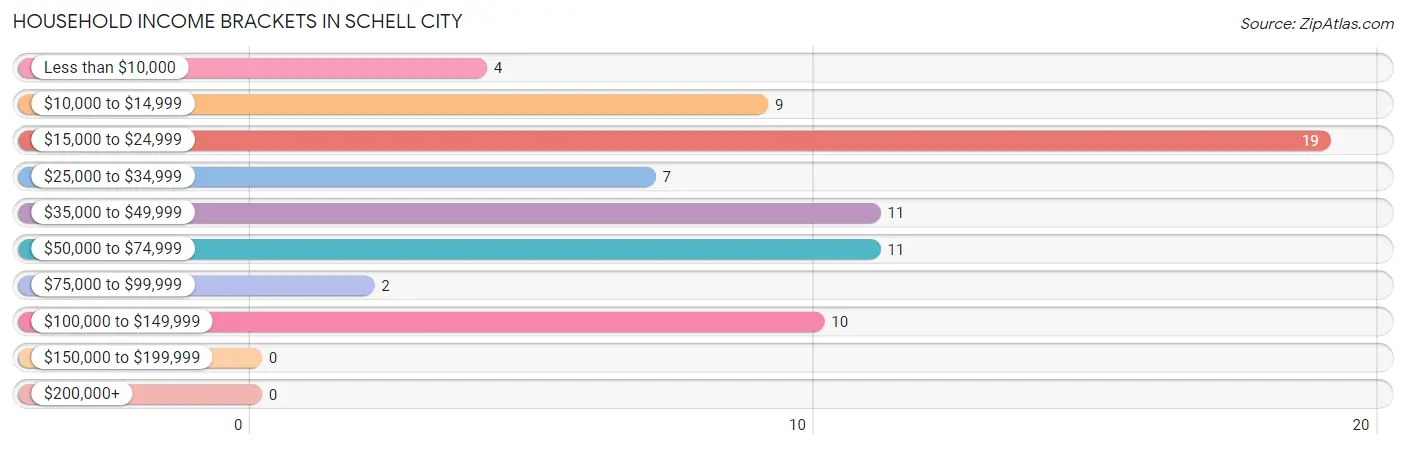
| Income Bracket | # Households | % Households |
| Less than $10,000 | 4 | 5.5% |
| $10,000 to $14,999 | 9 | 12.3% |
| $15,000 to $24,999 | 19 | 26.0% |
| $25,000 to $34,999 | 7 | 9.6% |
| $35,000 to $49,999 | 11 | 15.1% |
| $50,000 to $74,999 | 11 | 15.1% |
| $75,000 to $99,999 | 2 | 2.7% |
| $100,000 to $149,999 | 10 | 13.7% |
| $150,000 to $199,999 | 0 | 0.0% |
| $200,000+ | 0 | 0.0% |
Household Income by Householder Age in Schell City
The median household income in Schell City is $26,875, with the highest median household income of $26,042 found in the 65+ years age bracket for the primary householder. A total of 37 households (50.7%) fall into this category. Meanwhile, the 15 to 24 years age bracket for the primary householder has the lowest median household income of $0, with 7 households (9.6%) in this group.

| Income Bracket | # Households | Median Income |
| 15 to 24 Years | 7 (9.6%) | $0 |
| 25 to 44 Years | 9 (12.3%) | $0 |
| 45 to 64 Years | 20 (27.4%) | $0 |
| 65+ Years | 37 (50.7%) | $26,042 |
| Total | 73 (100.0%) | $26,875 |
Poverty in Schell City
Income Below Poverty by Sex and Age in Schell City
With 30.1% poverty level for males and 22.0% for females among the residents of Schell City, 35 to 44 year old males and 25 to 34 year old females are the most vulnerable to poverty, with 4 males (80.0%) and 5 females (100.0%) in their respective age groups living below the poverty level.
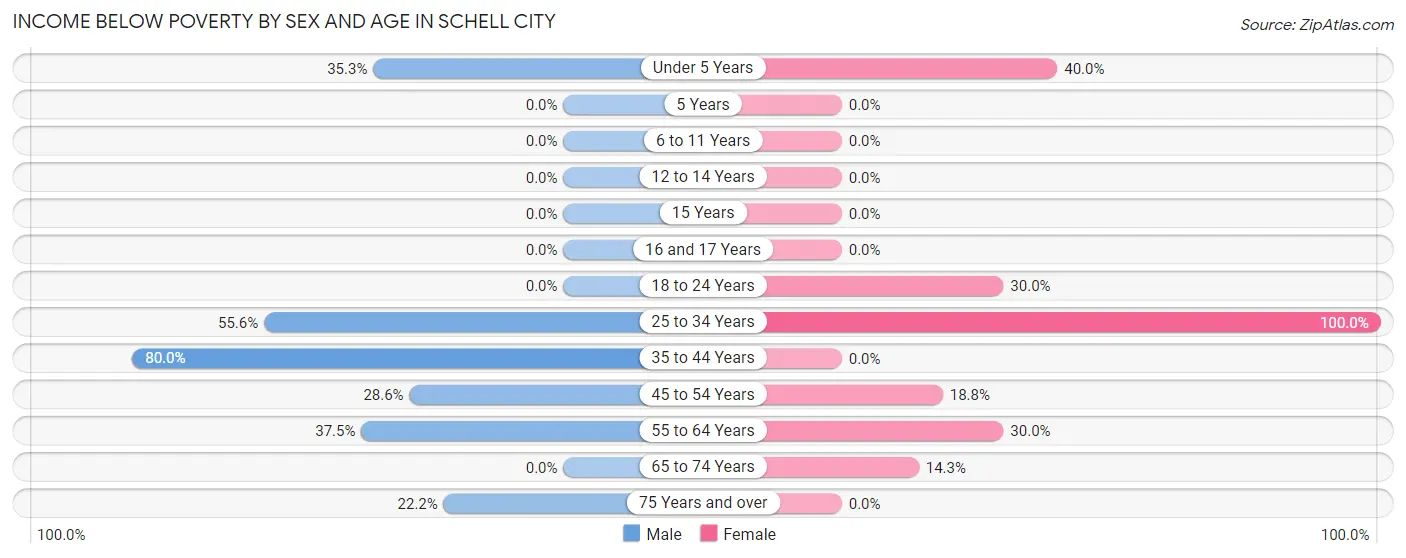
| Age Bracket | Male | Female |
| Under 5 Years | 6 (35.3%) | 4 (40.0%) |
| 5 Years | 0 (0.0%) | 0 (0.0%) |
| 6 to 11 Years | 0 (0.0%) | 0 (0.0%) |
| 12 to 14 Years | 0 (0.0%) | 0 (0.0%) |
| 15 Years | 0 (0.0%) | 0 (0.0%) |
| 16 and 17 Years | 0 (0.0%) | 0 (0.0%) |
| 18 to 24 Years | 0 (0.0%) | 3 (30.0%) |
| 25 to 34 Years | 5 (55.6%) | 5 (100.0%) |
| 35 to 44 Years | 4 (80.0%) | 0 (0.0%) |
| 45 to 54 Years | 2 (28.6%) | 3 (18.8%) |
| 55 to 64 Years | 3 (37.5%) | 3 (30.0%) |
| 65 to 74 Years | 0 (0.0%) | 2 (14.3%) |
| 75 Years and over | 2 (22.2%) | 0 (0.0%) |
| Total | 22 (30.1%) | 20 (22.0%) |
Income Above Poverty by Sex and Age in Schell City
According to the poverty statistics in Schell City, males aged 5 years and females aged 12 to 14 years are the age groups that are most secure financially, with 100.0% of males and 100.0% of females in these age groups living above the poverty line.
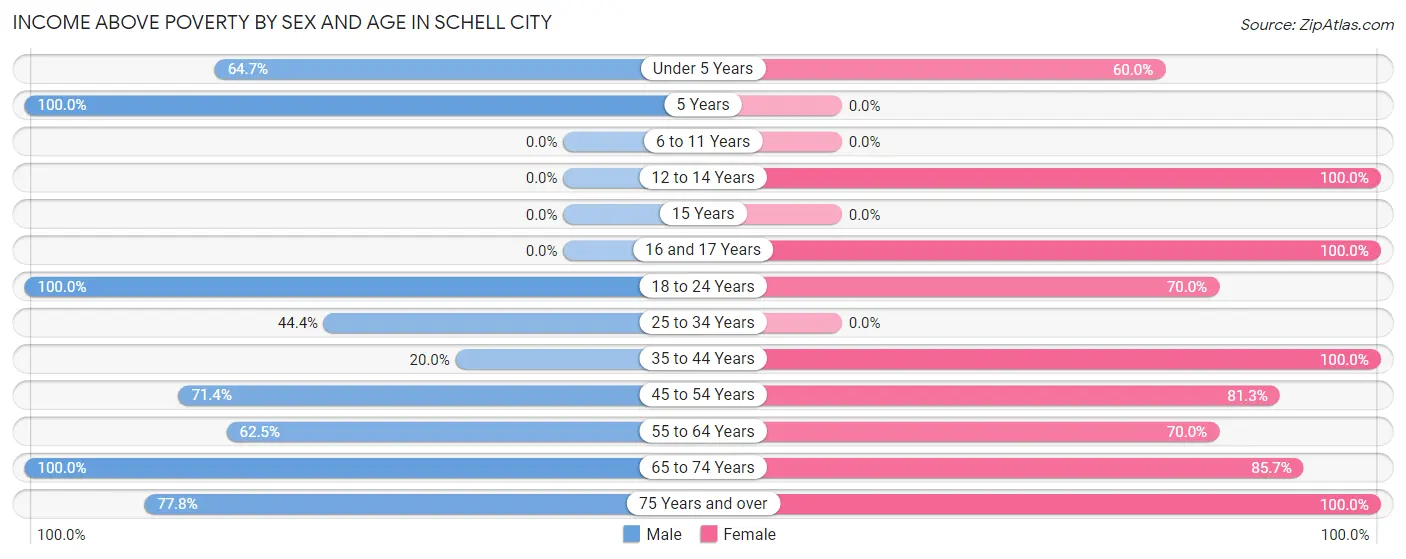
| Age Bracket | Male | Female |
| Under 5 Years | 11 (64.7%) | 6 (60.0%) |
| 5 Years | 7 (100.0%) | 0 (0.0%) |
| 6 to 11 Years | 0 (0.0%) | 0 (0.0%) |
| 12 to 14 Years | 0 (0.0%) | 1 (100.0%) |
| 15 Years | 0 (0.0%) | 0 (0.0%) |
| 16 and 17 Years | 0 (0.0%) | 1 (100.0%) |
| 18 to 24 Years | 2 (100.0%) | 7 (70.0%) |
| 25 to 34 Years | 4 (44.4%) | 0 (0.0%) |
| 35 to 44 Years | 1 (20.0%) | 2 (100.0%) |
| 45 to 54 Years | 5 (71.4%) | 13 (81.2%) |
| 55 to 64 Years | 5 (62.5%) | 7 (70.0%) |
| 65 to 74 Years | 9 (100.0%) | 12 (85.7%) |
| 75 Years and over | 7 (77.8%) | 22 (100.0%) |
| Total | 51 (69.9%) | 71 (78.0%) |
Income Below Poverty Among Married-Couple Families in Schell City
The poverty statistics for married-couple families in Schell City show that 19.4% or 7 of the total 36 families live below the poverty line. Families with 1 or 2 children have the highest poverty rate of 100.0%, comprising of 4 families. On the other hand, families with 3 or 4 children have the lowest poverty rate of 0.0%, which includes 0 families.
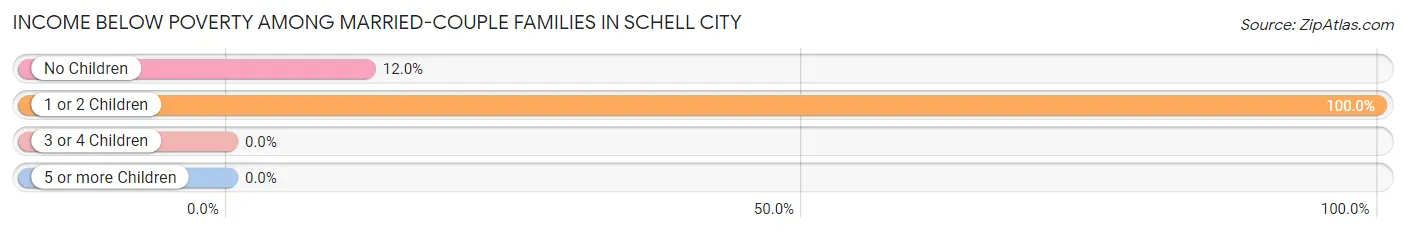
| Children | Above Poverty | Below Poverty |
| No Children | 22 (88.0%) | 3 (12.0%) |
| 1 or 2 Children | 0 (0.0%) | 4 (100.0%) |
| 3 or 4 Children | 7 (100.0%) | 0 (0.0%) |
| 5 or more Children | 0 (0.0%) | 0 (0.0%) |
| Total | 29 (80.6%) | 7 (19.4%) |
Income Below Poverty Among Single-Parent Households in Schell City
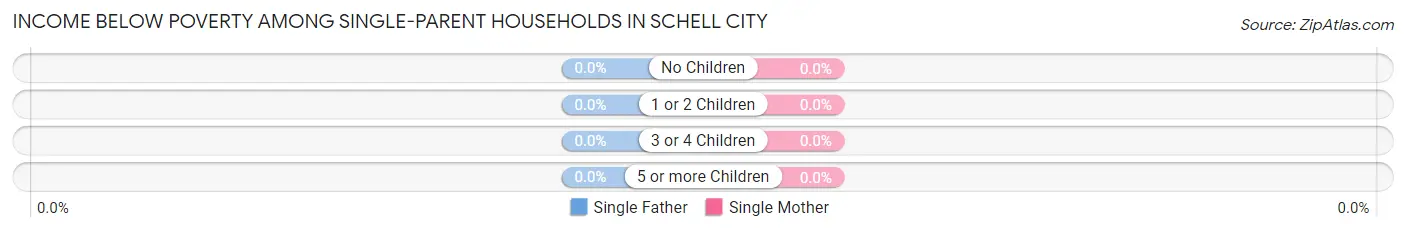
| Children | Single Father | Single Mother |
| No Children | 0 (0.0%) | 0 (0.0%) |
| 1 or 2 Children | 0 (0.0%) | 0 (0.0%) |
| 3 or 4 Children | 0 (0.0%) | 0 (0.0%) |
| 5 or more Children | 0 (0.0%) | 0 (0.0%) |
| Total | 0 (0.0%) | 0 (0.0%) |
Income Below Poverty Among Married-Couple vs Single-Parent Households in Schell City
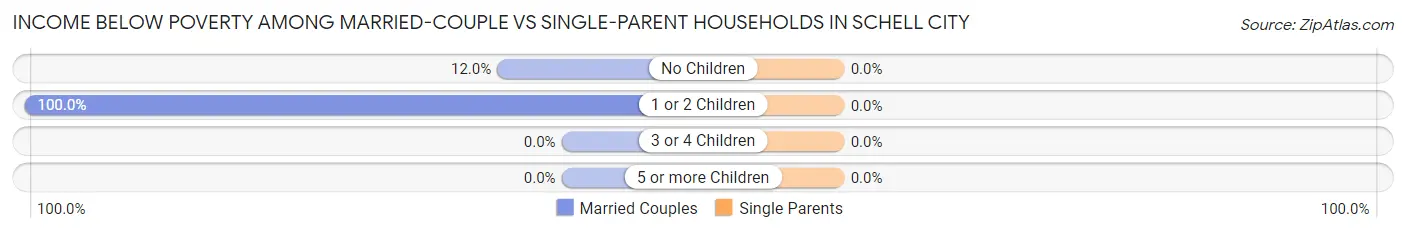
| Children | Married-Couple Families | Single-Parent Households |
| No Children | 3 (12.0%) | 0 (0.0%) |
| 1 or 2 Children | 4 (100.0%) | 0 (0.0%) |
| 3 or 4 Children | 0 (0.0%) | 0 (0.0%) |
| 5 or more Children | 0 (0.0%) | 0 (0.0%) |
| Total | 7 (19.4%) | 0 (0.0%) |
Employment Characteristics in Schell City
Employment by Class of Employer in Schell City
Among the 34 employed individuals in Schell City, private company employees (18 | 52.9%), not-for-profit organizations (5 | 14.7%), and self-employed (incorporated) (4 | 11.8%) make up the most common classes of employment.
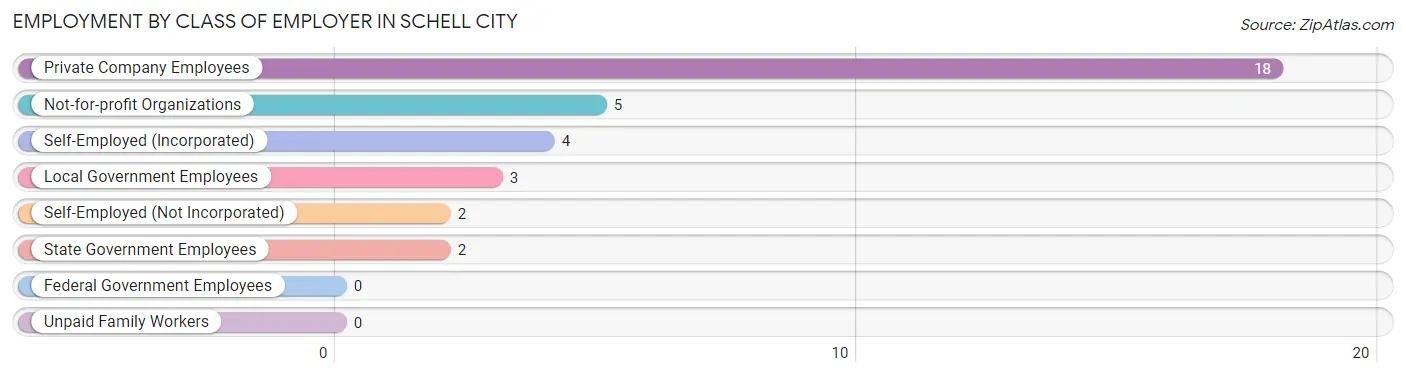
| Employer Class | # Employees | % Employees |
| Private Company Employees | 18 | 52.9% |
| Self-Employed (Incorporated) | 4 | 11.8% |
| Self-Employed (Not Incorporated) | 2 | 5.9% |
| Not-for-profit Organizations | 5 | 14.7% |
| Local Government Employees | 3 | 8.8% |
| State Government Employees | 2 | 5.9% |
| Federal Government Employees | 0 | 0.0% |
| Unpaid Family Workers | 0 | 0.0% |
| Total | 34 | 100.0% |
Employment Status by Age in Schell City
According to the labor force statistics for Schell City, out of the total population over 16 years of age (129), 29.5% or 38 individuals are in the labor force, with 5.3% or 2 of them unemployed. The age group with the highest labor force participation rate is 30 to 34 years, with 100.0% or 4 individuals in the labor force. Within the labor force, the 55 to 59 years age range has the highest percentage of unemployed individuals, with 50.0% or 2 of them being unemployed.
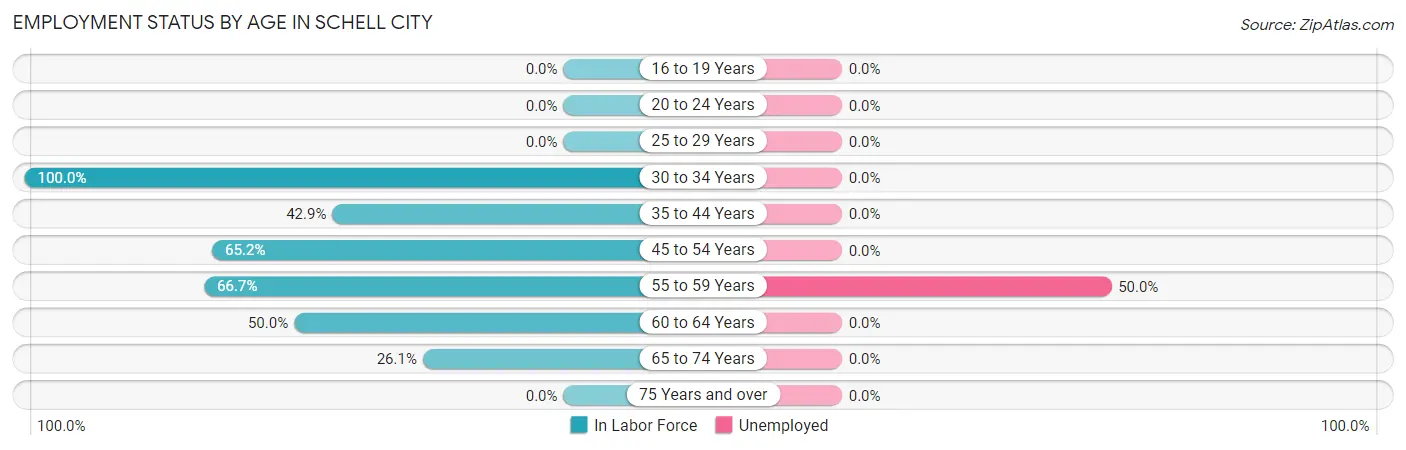
| Age Bracket | In Labor Force | Unemployed |
| 16 to 19 Years | 0 (0.0%) | 0 (0.0%) |
| 20 to 24 Years | 0 (0.0%) | 0 (0.0%) |
| 25 to 29 Years | 0 (0.0%) | 0 (0.0%) |
| 30 to 34 Years | 4 (100.0%) | 0 (0.0%) |
| 35 to 44 Years | 3 (42.9%) | 0 (0.0%) |
| 45 to 54 Years | 15 (65.2%) | 0 (0.0%) |
| 55 to 59 Years | 4 (66.7%) | 2 (50.0%) |
| 60 to 64 Years | 6 (50.0%) | 0 (0.0%) |
| 65 to 74 Years | 6 (26.1%) | 0 (0.0%) |
| 75 Years and over | 0 (0.0%) | 0 (0.0%) |
| Total | 38 (29.5%) | 2 (5.3%) |
Employment Status by Educational Attainment in Schell City
According to labor force statistics for Schell City, 51.6% of individuals (32) out of the total population between 25 and 64 years of age (62) are in the labor force, with 6.3% or 2 of them being unemployed. The group with the highest labor force participation rate are those with the educational attainment of bachelor's degree or higher, with 100.0% or 6 individuals in the labor force. Within the labor force, individuals with high school diploma education have the highest percentage of unemployment, with 11.8% or 2 of them being unemployed.
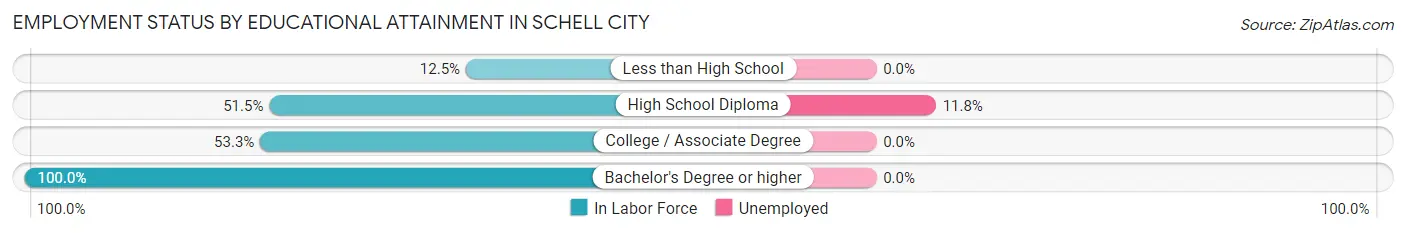
| Educational Attainment | In Labor Force | Unemployed |
| Less than High School | 1 (12.5%) | 0 (0.0%) |
| High School Diploma | 17 (51.5%) | 4 (11.8%) |
| College / Associate Degree | 8 (53.3%) | 0 (0.0%) |
| Bachelor's Degree or higher | 6 (100.0%) | 0 (0.0%) |
| Total | 32 (51.6%) | 4 (6.3%) |
Employment Occupations by Sex in Schell City
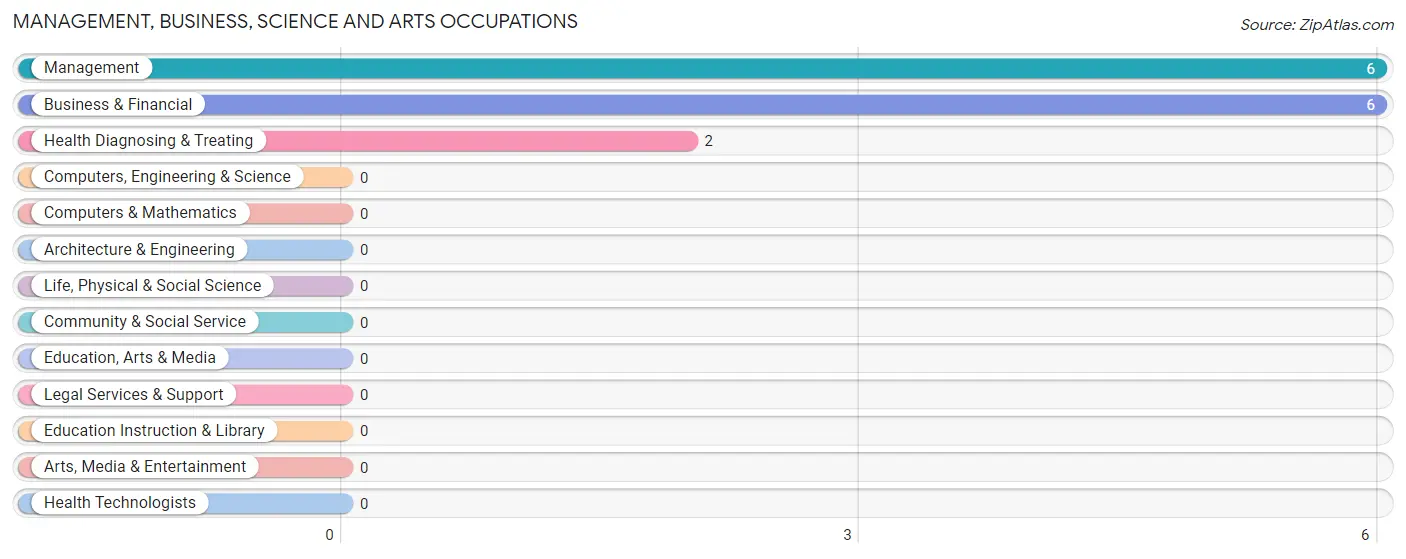
Management, Business, Science and Arts Occupations
The most common Management, Business, Science and Arts occupations in Schell City are Management (6 | 16.7%), Business & Financial (6 | 16.7%), and Health Diagnosing & Treating (2 | 5.6%).
Management, Business, Science and Arts Occupations by Sex
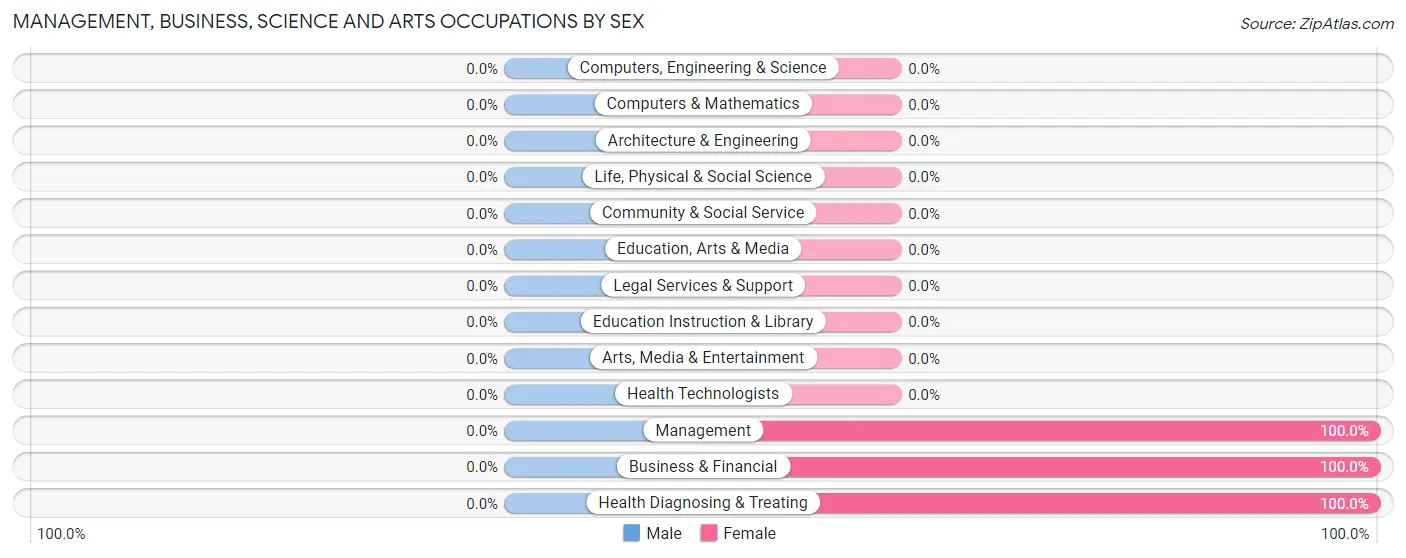
| Occupation | Male | Female |
| Management | 0 (0.0%) | 6 (100.0%) |
| Business & Financial | 0 (0.0%) | 6 (100.0%) |
| Computers, Engineering & Science | 0 (0.0%) | 0 (0.0%) |
| Computers & Mathematics | 0 (0.0%) | 0 (0.0%) |
| Architecture & Engineering | 0 (0.0%) | 0 (0.0%) |
| Life, Physical & Social Science | 0 (0.0%) | 0 (0.0%) |
| Community & Social Service | 0 (0.0%) | 0 (0.0%) |
| Education, Arts & Media | 0 (0.0%) | 0 (0.0%) |
| Legal Services & Support | 0 (0.0%) | 0 (0.0%) |
| Education Instruction & Library | 0 (0.0%) | 0 (0.0%) |
| Arts, Media & Entertainment | 0 (0.0%) | 0 (0.0%) |
| Health Diagnosing & Treating | 0 (0.0%) | 2 (100.0%) |
| Health Technologists | 0 (0.0%) | 0 (0.0%) |
| Total (Category) | 0 (0.0%) | 14 (100.0%) |
| Total (Overall) | 12 (33.3%) | 24 (66.7%) |
Services Occupations
The most common Services occupations in Schell City are Healthcare Support (5 | 13.9%), and Cleaning & Maintenance (3 | 8.3%).
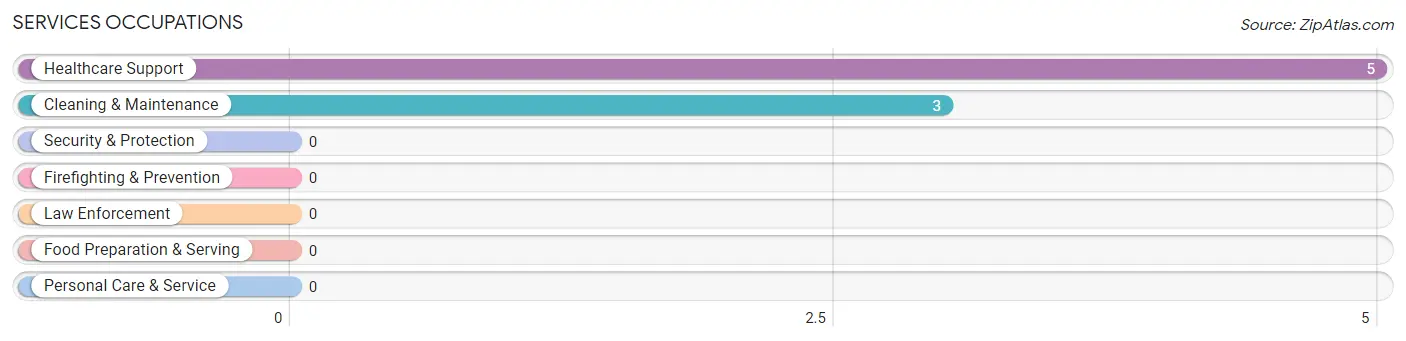
Services Occupations by Sex
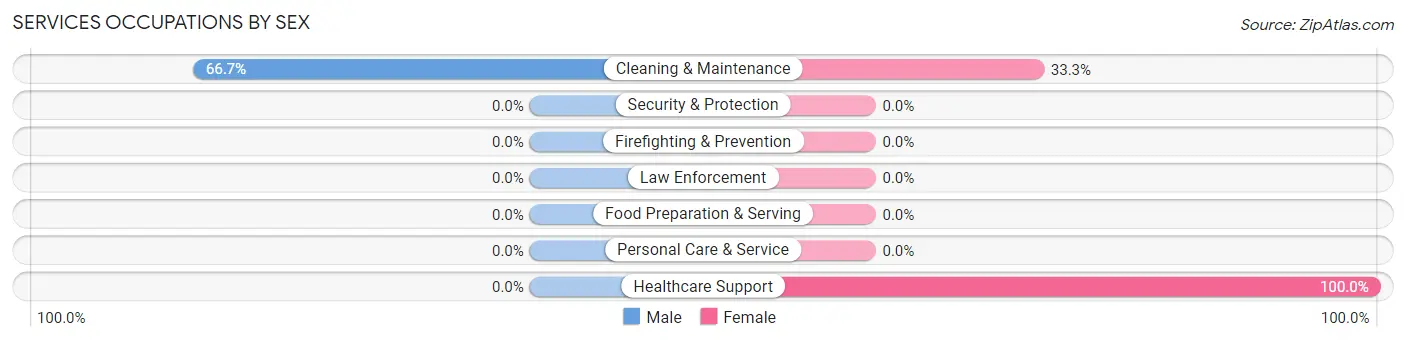
| Occupation | Male | Female |
| Healthcare Support | 0 (0.0%) | 5 (100.0%) |
| Security & Protection | 0 (0.0%) | 0 (0.0%) |
| Firefighting & Prevention | 0 (0.0%) | 0 (0.0%) |
| Law Enforcement | 0 (0.0%) | 0 (0.0%) |
| Food Preparation & Serving | 0 (0.0%) | 0 (0.0%) |
| Cleaning & Maintenance | 2 (66.7%) | 1 (33.3%) |
| Personal Care & Service | 0 (0.0%) | 0 (0.0%) |
| Total (Category) | 2 (25.0%) | 6 (75.0%) |
| Total (Overall) | 12 (33.3%) | 24 (66.7%) |
Sales and Office Occupations
The most common Sales and Office occupations in Schell City are Sales & Related (3 | 8.3%), and Office & Administration (2 | 5.6%).
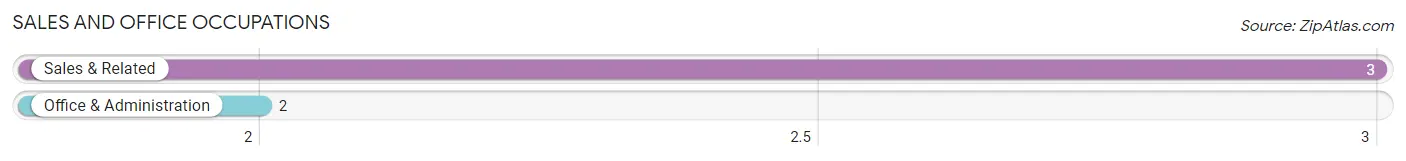
Sales and Office Occupations by Sex

| Occupation | Male | Female |
| Sales & Related | 2 (66.7%) | 1 (33.3%) |
| Office & Administration | 0 (0.0%) | 2 (100.0%) |
| Total (Category) | 2 (40.0%) | 3 (60.0%) |
| Total (Overall) | 12 (33.3%) | 24 (66.7%) |
Natural Resources, Construction and Maintenance Occupations
The most common Natural Resources, Construction and Maintenance occupations in Schell City are Installation, Maintenance & Repair (2 | 5.6%), and Farming, Fishing & Forestry (1 | 2.8%).
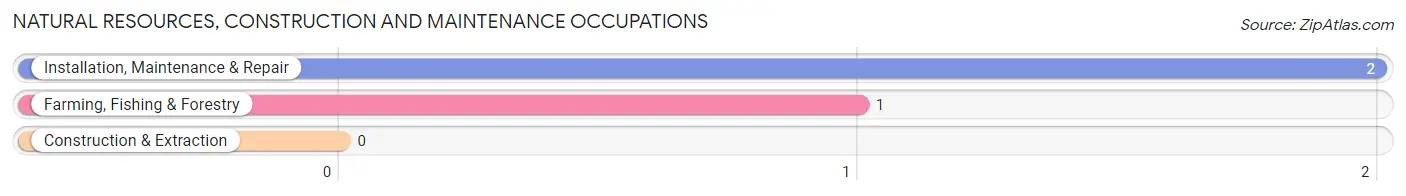
Natural Resources, Construction and Maintenance Occupations by Sex
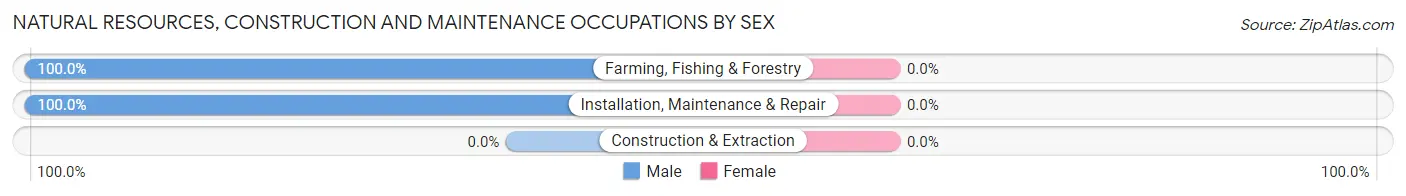
| Occupation | Male | Female |
| Farming, Fishing & Forestry | 1 (100.0%) | 0 (0.0%) |
| Construction & Extraction | 0 (0.0%) | 0 (0.0%) |
| Installation, Maintenance & Repair | 2 (100.0%) | 0 (0.0%) |
| Total (Category) | 3 (100.0%) | 0 (0.0%) |
| Total (Overall) | 12 (33.3%) | 24 (66.7%) |
Production, Transportation and Moving Occupations
The most common Production, Transportation and Moving occupations in Schell City are Production (3 | 8.3%), and Transportation (3 | 8.3%).
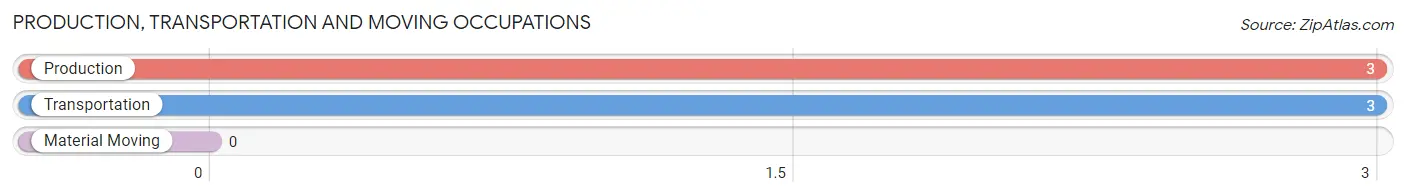
Production, Transportation and Moving Occupations by Sex
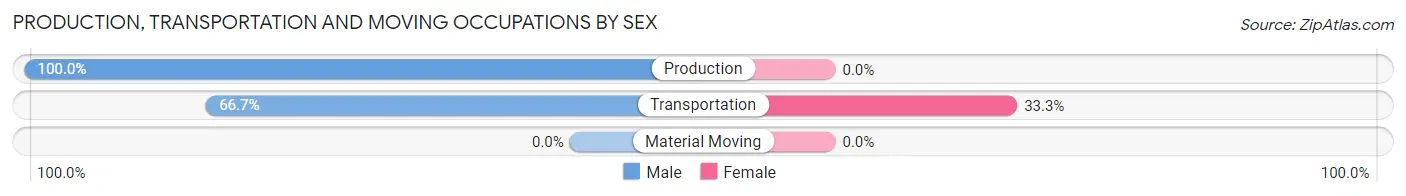
| Occupation | Male | Female |
| Production | 3 (100.0%) | 0 (0.0%) |
| Transportation | 2 (66.7%) | 1 (33.3%) |
| Material Moving | 0 (0.0%) | 0 (0.0%) |
| Total (Category) | 5 (83.3%) | 1 (16.7%) |
| Total (Overall) | 12 (33.3%) | 24 (66.7%) |
Employment Industries by Sex in Schell City
Employment Industries in Schell City
The major employment industries in Schell City include Health Care & Social Assistance (13 | 36.1%), Finance & Insurance (7 | 19.4%), Manufacturing (3 | 8.3%), Retail Trade (2 | 5.6%), and Transportation & Warehousing (2 | 5.6%).
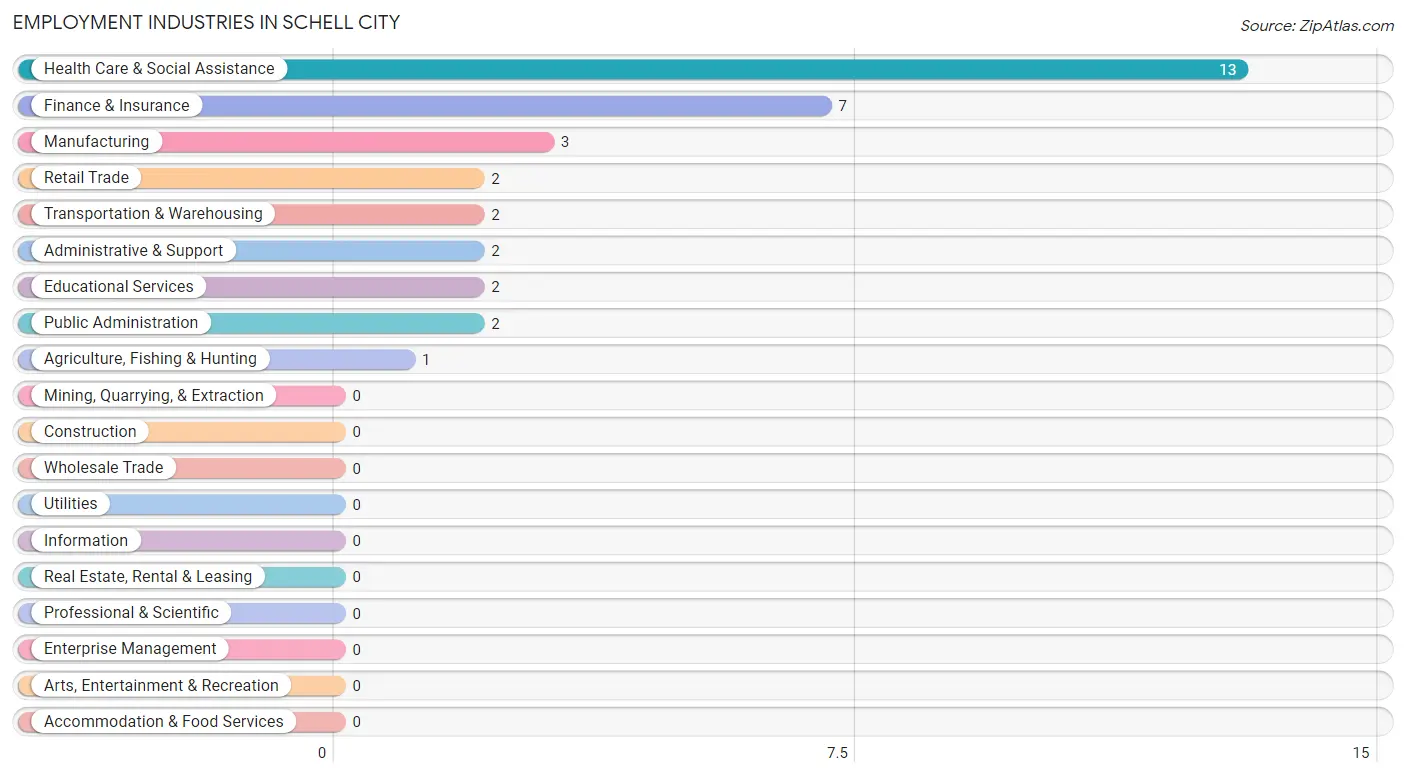
Employment Industries by Sex in Schell City
The Schell City industries that see more men than women are Agriculture, Fishing & Hunting (100.0%), Manufacturing (100.0%), and Retail Trade (100.0%), whereas the industries that tend to have a higher number of women are Finance & Insurance (100.0%), Educational Services (100.0%), and Health Care & Social Assistance (100.0%).
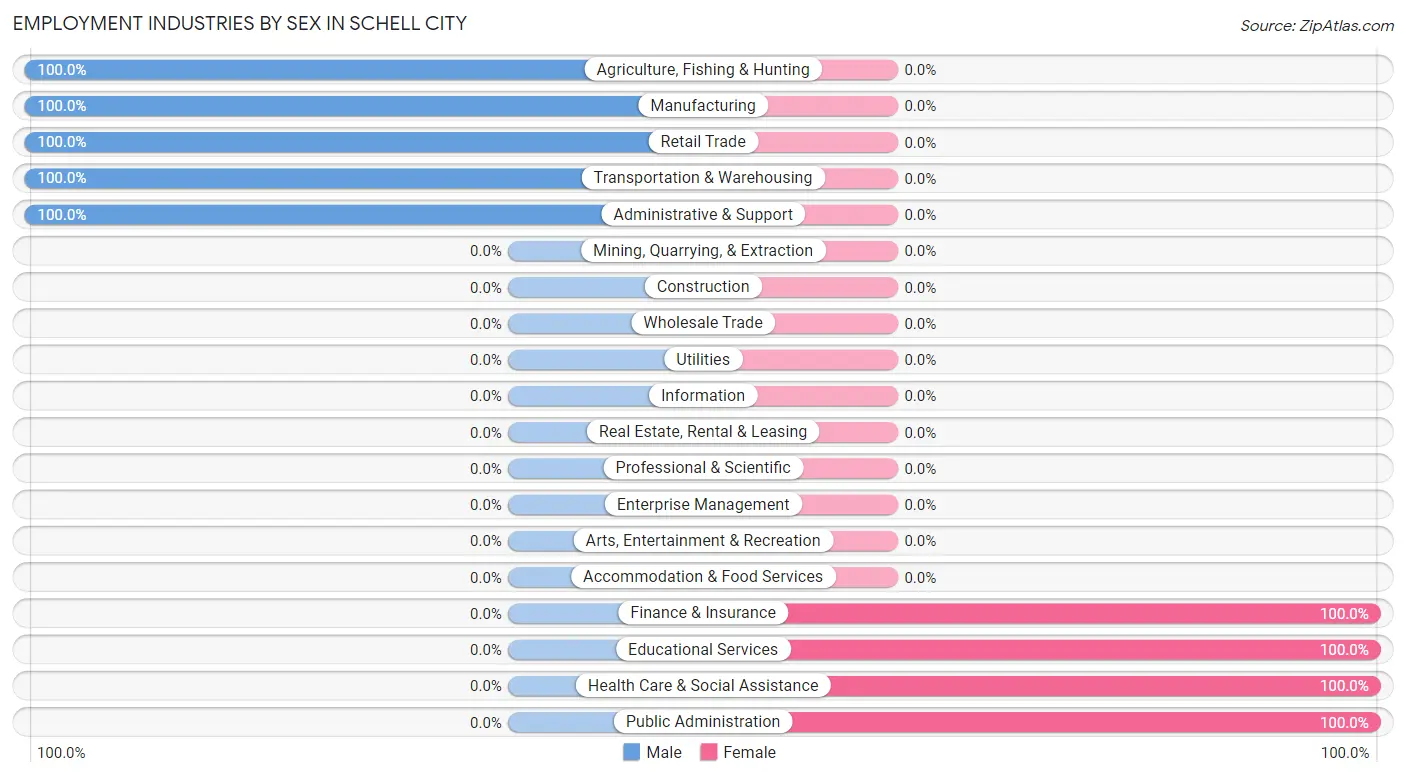
| Industry | Male | Female |
| Agriculture, Fishing & Hunting | 1 (100.0%) | 0 (0.0%) |
| Mining, Quarrying, & Extraction | 0 (0.0%) | 0 (0.0%) |
| Construction | 0 (0.0%) | 0 (0.0%) |
| Manufacturing | 3 (100.0%) | 0 (0.0%) |
| Wholesale Trade | 0 (0.0%) | 0 (0.0%) |
| Retail Trade | 2 (100.0%) | 0 (0.0%) |
| Transportation & Warehousing | 2 (100.0%) | 0 (0.0%) |
| Utilities | 0 (0.0%) | 0 (0.0%) |
| Information | 0 (0.0%) | 0 (0.0%) |
| Finance & Insurance | 0 (0.0%) | 7 (100.0%) |
| Real Estate, Rental & Leasing | 0 (0.0%) | 0 (0.0%) |
| Professional & Scientific | 0 (0.0%) | 0 (0.0%) |
| Enterprise Management | 0 (0.0%) | 0 (0.0%) |
| Administrative & Support | 2 (100.0%) | 0 (0.0%) |
| Educational Services | 0 (0.0%) | 2 (100.0%) |
| Health Care & Social Assistance | 0 (0.0%) | 13 (100.0%) |
| Arts, Entertainment & Recreation | 0 (0.0%) | 0 (0.0%) |
| Accommodation & Food Services | 0 (0.0%) | 0 (0.0%) |
| Public Administration | 0 (0.0%) | 2 (100.0%) |
| Total | 12 (33.3%) | 24 (66.7%) |
Education in Schell City
School Enrollment in Schell City
The most common levels of schooling among the 13 students in Schell City are nursery / preschool (11 | 84.6%), middle school (1 | 7.7%), and high school (1 | 7.7%).
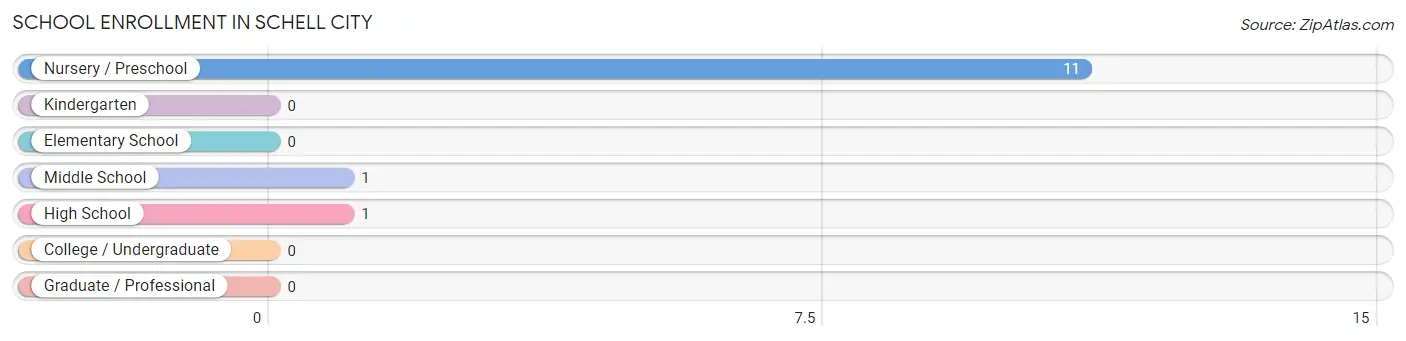
| School Level | # Students | % Students |
| Nursery / Preschool | 11 | 84.6% |
| Kindergarten | 0 | 0.0% |
| Elementary School | 0 | 0.0% |
| Middle School | 1 | 7.7% |
| High School | 1 | 7.7% |
| College / Undergraduate | 0 | 0.0% |
| Graduate / Professional | 0 | 0.0% |
| Total | 13 | 100.0% |
School Enrollment by Age by Funding Source in Schell City
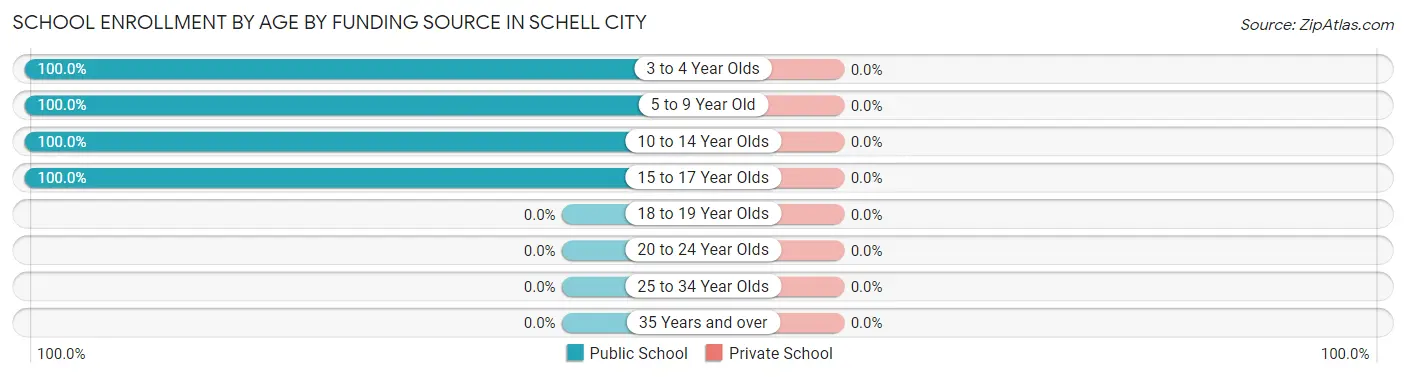
| Age Bracket | Public School | Private School |
| 3 to 4 Year Olds | 4 (100.0%) | 0 (0.0%) |
| 5 to 9 Year Old | 7 (100.0%) | 0 (0.0%) |
| 10 to 14 Year Olds | 1 (100.0%) | 0 (0.0%) |
| 15 to 17 Year Olds | 1 (100.0%) | 0 (0.0%) |
| 18 to 19 Year Olds | 0 (0.0%) | 0 (0.0%) |
| 20 to 24 Year Olds | 0 (0.0%) | 0 (0.0%) |
| 25 to 34 Year Olds | 0 (0.0%) | 0 (0.0%) |
| 35 Years and over | 0 (0.0%) | 0 (0.0%) |
| Total | 13 (100.0%) | 0 (0.0%) |
Educational Attainment by Field of Study in Schell City
Physical & health sciences (6 | 66.7%), social sciences (1 | 11.1%), education (1 | 11.1%), and liberal arts & history (1 | 11.1%) are the most common fields of study among 9 individuals in Schell City who have obtained a bachelor's degree or higher.
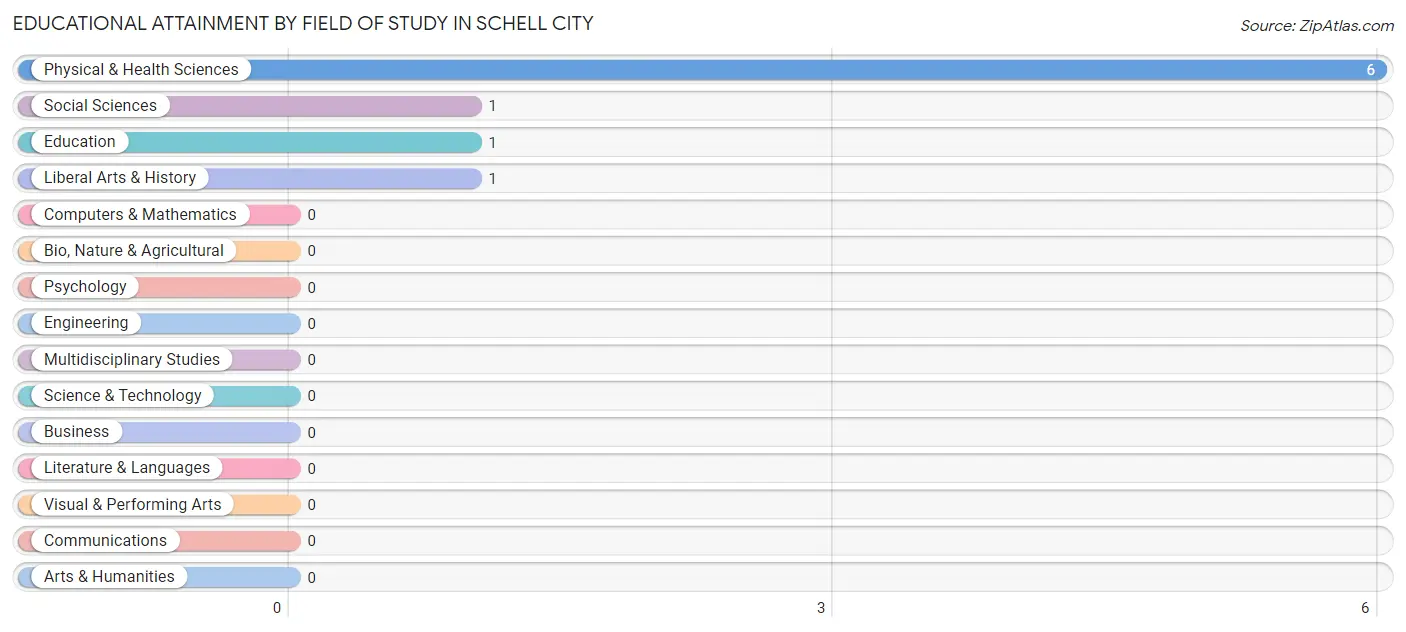
| Field of Study | # Graduates | % Graduates |
| Computers & Mathematics | 0 | 0.0% |
| Bio, Nature & Agricultural | 0 | 0.0% |
| Physical & Health Sciences | 6 | 66.7% |
| Psychology | 0 | 0.0% |
| Social Sciences | 1 | 11.1% |
| Engineering | 0 | 0.0% |
| Multidisciplinary Studies | 0 | 0.0% |
| Science & Technology | 0 | 0.0% |
| Business | 0 | 0.0% |
| Education | 1 | 11.1% |
| Literature & Languages | 0 | 0.0% |
| Liberal Arts & History | 1 | 11.1% |
| Visual & Performing Arts | 0 | 0.0% |
| Communications | 0 | 0.0% |
| Arts & Humanities | 0 | 0.0% |
| Total | 9 | 100.0% |
Transportation & Commute in Schell City
Vehicle Availability by Sex in Schell City
The most prevalent vehicle ownership categories in Schell City are males with 1 vehicle (5, accounting for 50.0%) and females with 1 vehicle (11, making up 20.8%).
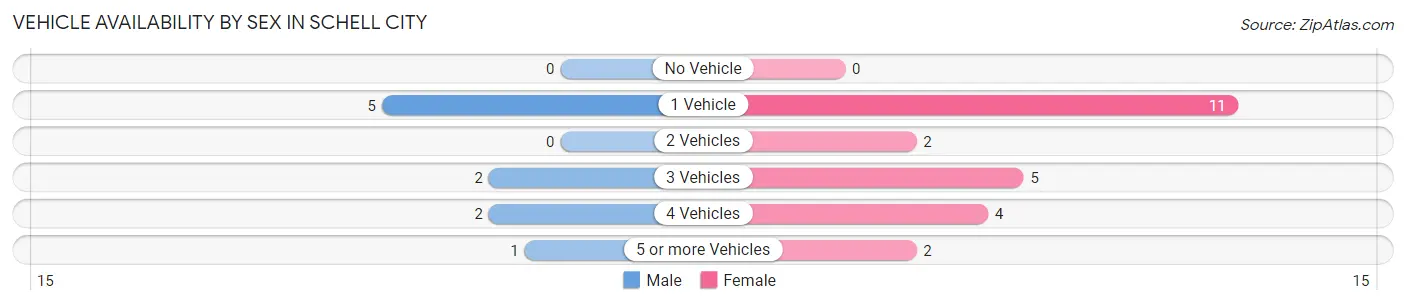
| Vehicles Available | Male | Female |
| No Vehicle | 0 (0.0%) | 0 (0.0%) |
| 1 Vehicle | 5 (50.0%) | 11 (45.8%) |
| 2 Vehicles | 0 (0.0%) | 2 (8.3%) |
| 3 Vehicles | 2 (20.0%) | 5 (20.8%) |
| 4 Vehicles | 2 (20.0%) | 4 (16.7%) |
| 5 or more Vehicles | 1 (10.0%) | 2 (8.3%) |
| Total | 10 (100.0%) | 24 (100.0%) |
Commute Time in Schell City
The most frequently occuring commute durations in Schell City are 30 to 34 minutes (11 commuters, 40.7%), less than 5 minutes (4 commuters, 14.8%), and 10 to 14 minutes (3 commuters, 11.1%).
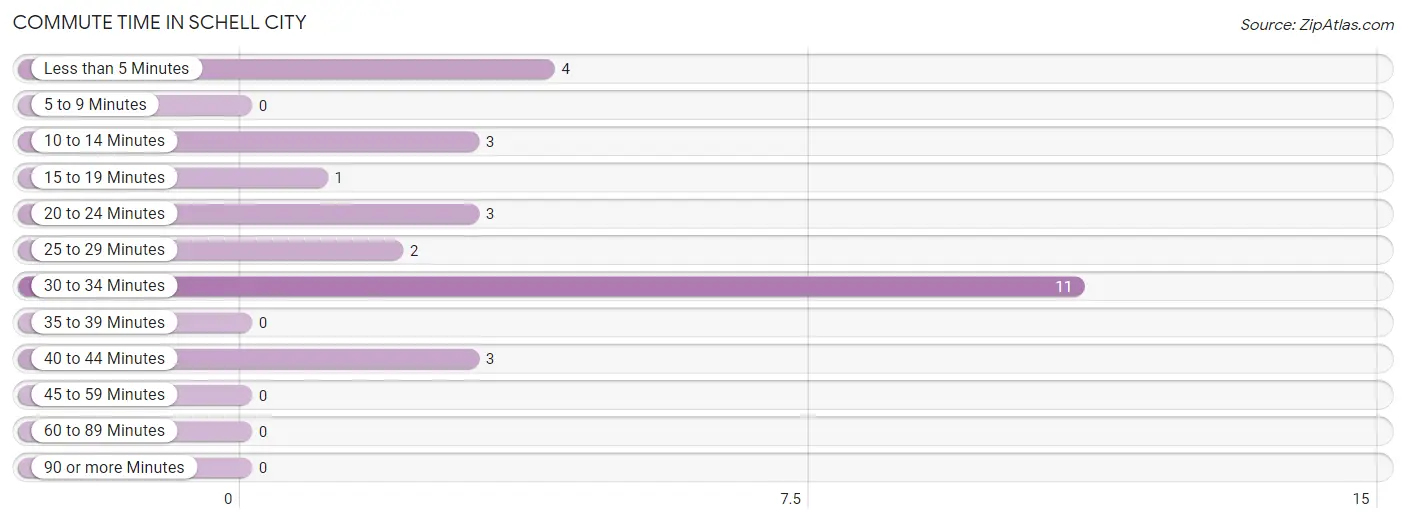
| Commute Time | # Commuters | % Commuters |
| Less than 5 Minutes | 4 | 14.8% |
| 5 to 9 Minutes | 0 | 0.0% |
| 10 to 14 Minutes | 3 | 11.1% |
| 15 to 19 Minutes | 1 | 3.7% |
| 20 to 24 Minutes | 3 | 11.1% |
| 25 to 29 Minutes | 2 | 7.4% |
| 30 to 34 Minutes | 11 | 40.7% |
| 35 to 39 Minutes | 0 | 0.0% |
| 40 to 44 Minutes | 3 | 11.1% |
| 45 to 59 Minutes | 0 | 0.0% |
| 60 to 89 Minutes | 0 | 0.0% |
| 90 or more Minutes | 0 | 0.0% |
Commute Time by Sex in Schell City
The most common commute times in Schell City are 30 to 34 minutes (5 commuters, 50.0%) for males and 30 to 34 minutes (6 commuters, 35.3%) for females.
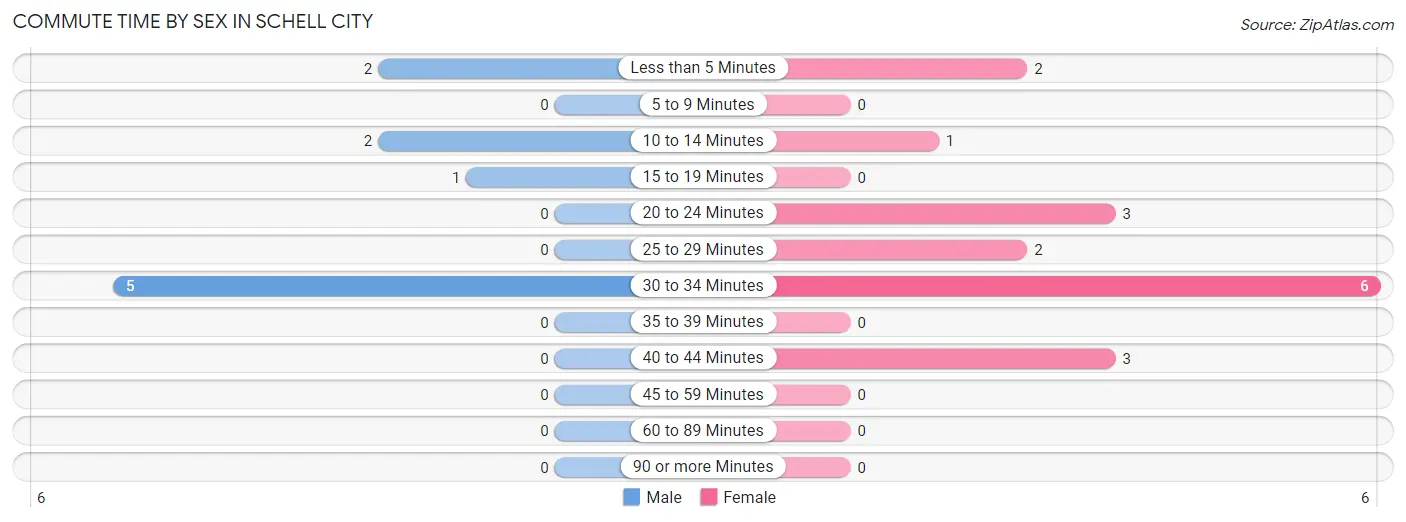
| Commute Time | Male | Female |
| Less than 5 Minutes | 2 (20.0%) | 2 (11.8%) |
| 5 to 9 Minutes | 0 (0.0%) | 0 (0.0%) |
| 10 to 14 Minutes | 2 (20.0%) | 1 (5.9%) |
| 15 to 19 Minutes | 1 (10.0%) | 0 (0.0%) |
| 20 to 24 Minutes | 0 (0.0%) | 3 (17.6%) |
| 25 to 29 Minutes | 0 (0.0%) | 2 (11.8%) |
| 30 to 34 Minutes | 5 (50.0%) | 6 (35.3%) |
| 35 to 39 Minutes | 0 (0.0%) | 0 (0.0%) |
| 40 to 44 Minutes | 0 (0.0%) | 3 (17.6%) |
| 45 to 59 Minutes | 0 (0.0%) | 0 (0.0%) |
| 60 to 89 Minutes | 0 (0.0%) | 0 (0.0%) |
| 90 or more Minutes | 0 (0.0%) | 0 (0.0%) |
Time of Departure to Work by Sex in Schell City
The most frequent times of departure to work in Schell City are 6:00 AM to 6:29 AM (3, 30.0%) for males and 6:00 AM to 6:29 AM (5, 29.4%) for females.
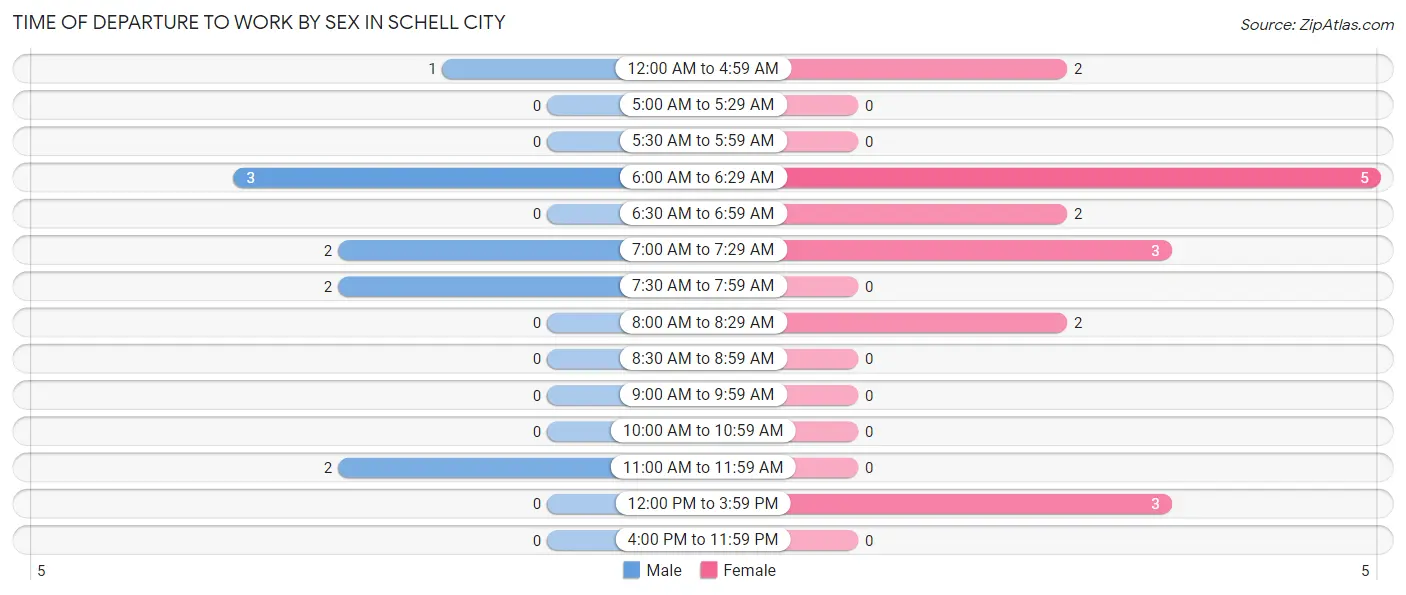
| Time of Departure | Male | Female |
| 12:00 AM to 4:59 AM | 1 (10.0%) | 2 (11.8%) |
| 5:00 AM to 5:29 AM | 0 (0.0%) | 0 (0.0%) |
| 5:30 AM to 5:59 AM | 0 (0.0%) | 0 (0.0%) |
| 6:00 AM to 6:29 AM | 3 (30.0%) | 5 (29.4%) |
| 6:30 AM to 6:59 AM | 0 (0.0%) | 2 (11.8%) |
| 7:00 AM to 7:29 AM | 2 (20.0%) | 3 (17.6%) |
| 7:30 AM to 7:59 AM | 2 (20.0%) | 0 (0.0%) |
| 8:00 AM to 8:29 AM | 0 (0.0%) | 2 (11.8%) |
| 8:30 AM to 8:59 AM | 0 (0.0%) | 0 (0.0%) |
| 9:00 AM to 9:59 AM | 0 (0.0%) | 0 (0.0%) |
| 10:00 AM to 10:59 AM | 0 (0.0%) | 0 (0.0%) |
| 11:00 AM to 11:59 AM | 2 (20.0%) | 0 (0.0%) |
| 12:00 PM to 3:59 PM | 0 (0.0%) | 3 (17.6%) |
| 4:00 PM to 11:59 PM | 0 (0.0%) | 0 (0.0%) |
| Total | 10 (100.0%) | 17 (100.0%) |
Housing Occupancy in Schell City
Occupancy by Ownership in Schell City
Of the total 73 dwellings in Schell City, owner-occupied units account for 57 (78.1%), while renter-occupied units make up 16 (21.9%).
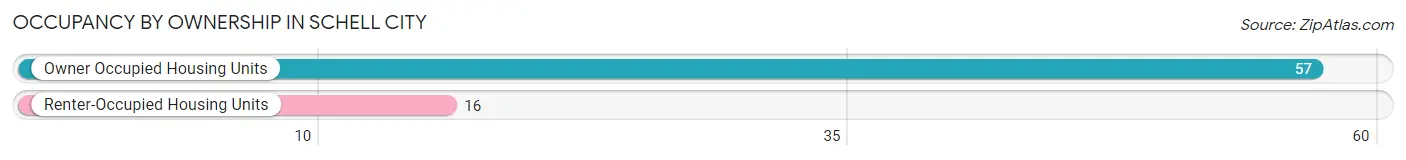
| Occupancy | # Housing Units | % Housing Units |
| Owner Occupied Housing Units | 57 | 78.1% |
| Renter-Occupied Housing Units | 16 | 21.9% |
| Total Occupied Housing Units | 73 | 100.0% |
Occupancy by Household Size in Schell City
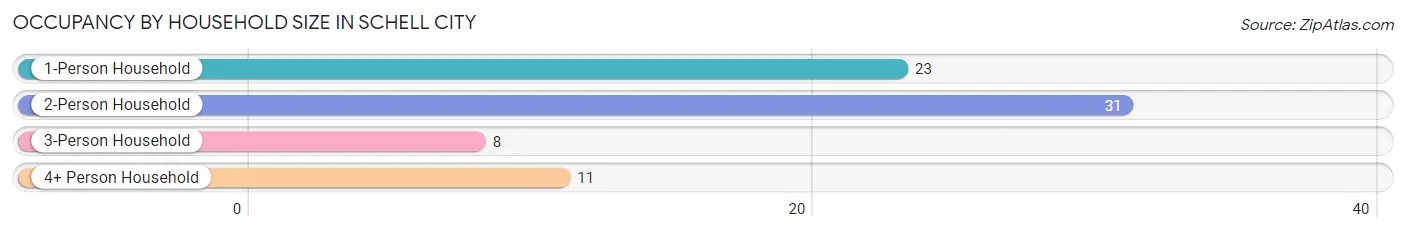
| Household Size | # Housing Units | % Housing Units |
| 1-Person Household | 23 | 31.5% |
| 2-Person Household | 31 | 42.5% |
| 3-Person Household | 8 | 11.0% |
| 4+ Person Household | 11 | 15.1% |
| Total Housing Units | 73 | 100.0% |
Occupancy by Ownership by Household Size in Schell City
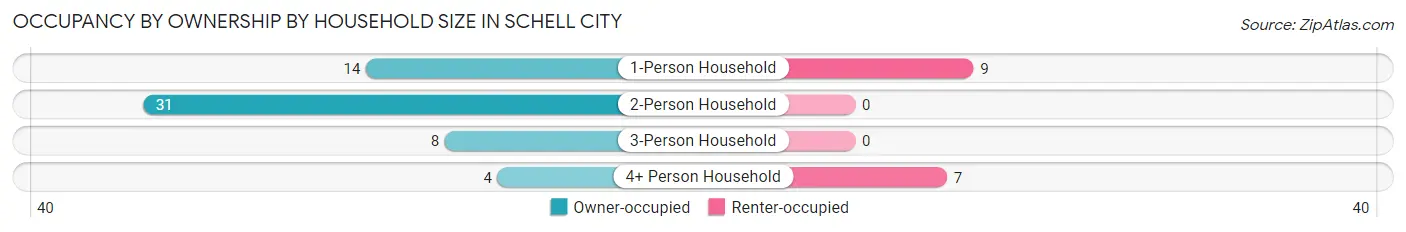
| Household Size | Owner-occupied | Renter-occupied |
| 1-Person Household | 14 (60.9%) | 9 (39.1%) |
| 2-Person Household | 31 (100.0%) | 0 (0.0%) |
| 3-Person Household | 8 (100.0%) | 0 (0.0%) |
| 4+ Person Household | 4 (36.4%) | 7 (63.6%) |
| Total Housing Units | 57 (78.1%) | 16 (21.9%) |
Occupancy by Educational Attainment in Schell City
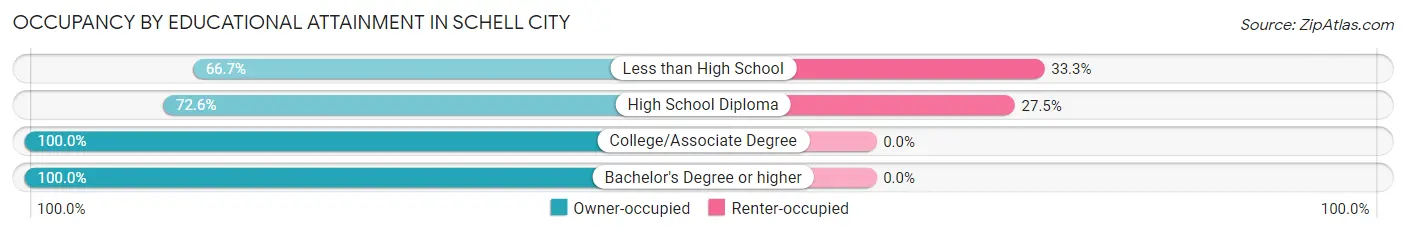
| Household Size | Owner-occupied | Renter-occupied |
| Less than High School | 4 (66.7%) | 2 (33.3%) |
| High School Diploma | 37 (72.6%) | 14 (27.5%) |
| College/Associate Degree | 15 (100.0%) | 0 (0.0%) |
| Bachelor's Degree or higher | 1 (100.0%) | 0 (0.0%) |
Occupancy by Age of Householder in Schell City
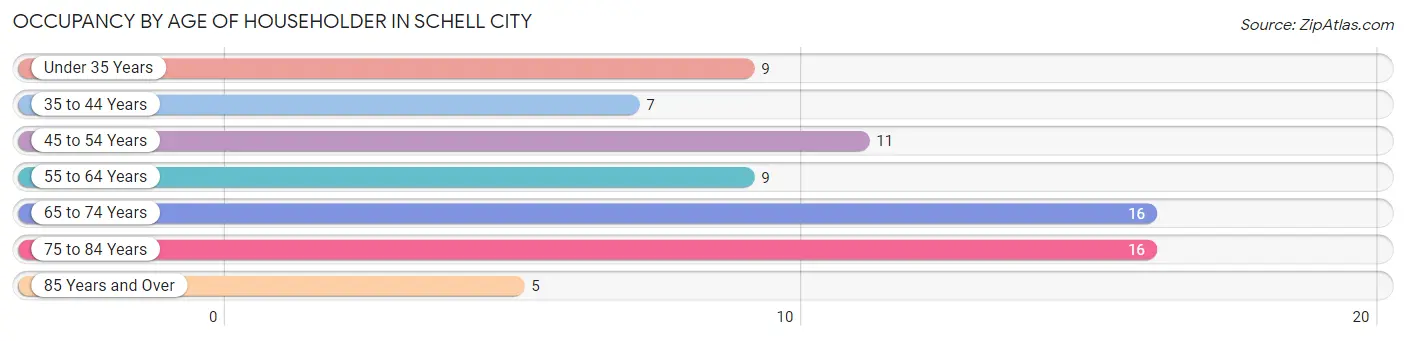
| Age Bracket | # Households | % Households |
| Under 35 Years | 9 | 12.3% |
| 35 to 44 Years | 7 | 9.6% |
| 45 to 54 Years | 11 | 15.1% |
| 55 to 64 Years | 9 | 12.3% |
| 65 to 74 Years | 16 | 21.9% |
| 75 to 84 Years | 16 | 21.9% |
| 85 Years and Over | 5 | 6.9% |
| Total | 73 | 100.0% |
Housing Finances in Schell City
Median Income by Occupancy in Schell City
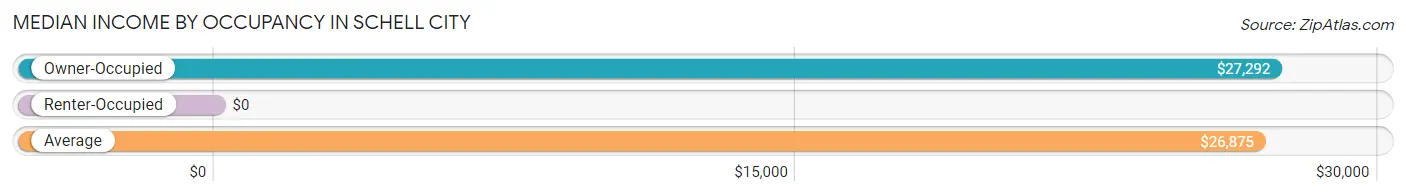
| Occupancy Type | # Households | Median Income |
| Owner-Occupied | 57 (78.1%) | $27,292 |
| Renter-Occupied | 16 (21.9%) | $0 |
| Average | 73 (100.0%) | $26,875 |
Occupancy by Householder Income Bracket in Schell City
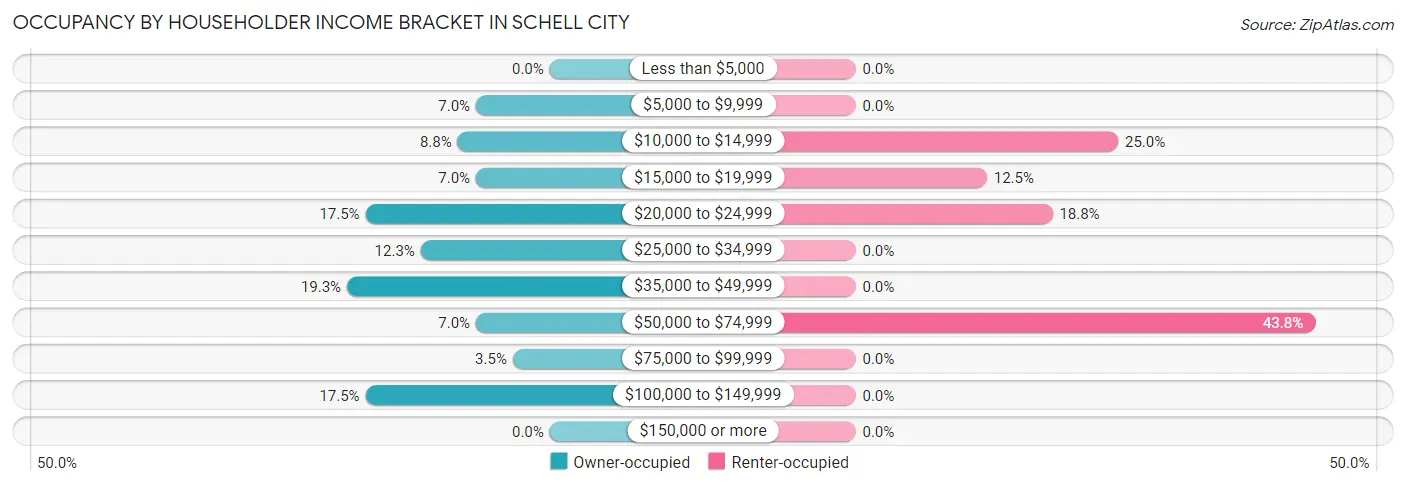
| Income Bracket | Owner-occupied | Renter-occupied |
| Less than $5,000 | 0 (0.0%) | 0 (0.0%) |
| $5,000 to $9,999 | 4 (7.0%) | 0 (0.0%) |
| $10,000 to $14,999 | 5 (8.8%) | 4 (25.0%) |
| $15,000 to $19,999 | 4 (7.0%) | 2 (12.5%) |
| $20,000 to $24,999 | 10 (17.5%) | 3 (18.8%) |
| $25,000 to $34,999 | 7 (12.3%) | 0 (0.0%) |
| $35,000 to $49,999 | 11 (19.3%) | 0 (0.0%) |
| $50,000 to $74,999 | 4 (7.0%) | 7 (43.8%) |
| $75,000 to $99,999 | 2 (3.5%) | 0 (0.0%) |
| $100,000 to $149,999 | 10 (17.5%) | 0 (0.0%) |
| $150,000 or more | 0 (0.0%) | 0 (0.0%) |
| Total | 57 (100.0%) | 16 (100.0%) |
Monthly Housing Cost Tiers in Schell City
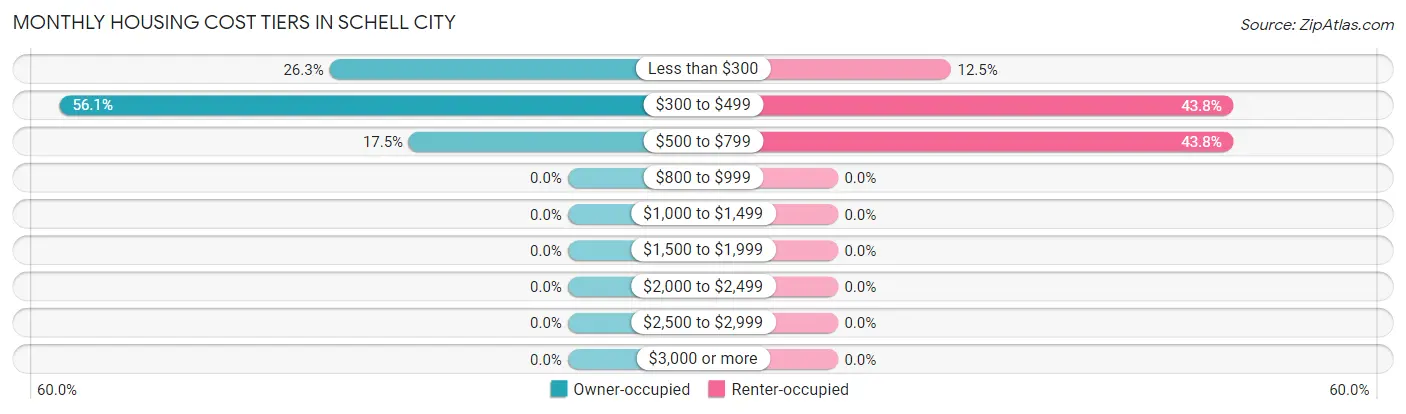
| Monthly Cost | Owner-occupied | Renter-occupied |
| Less than $300 | 15 (26.3%) | 2 (12.5%) |
| $300 to $499 | 32 (56.1%) | 7 (43.8%) |
| $500 to $799 | 10 (17.5%) | 7 (43.8%) |
| $800 to $999 | 0 (0.0%) | 0 (0.0%) |
| $1,000 to $1,499 | 0 (0.0%) | 0 (0.0%) |
| $1,500 to $1,999 | 0 (0.0%) | 0 (0.0%) |
| $2,000 to $2,499 | 0 (0.0%) | 0 (0.0%) |
| $2,500 to $2,999 | 0 (0.0%) | 0 (0.0%) |
| $3,000 or more | 0 (0.0%) | 0 (0.0%) |
| Total | 57 (100.0%) | 16 (100.0%) |
Physical Housing Characteristics in Schell City
Housing Structures in Schell City
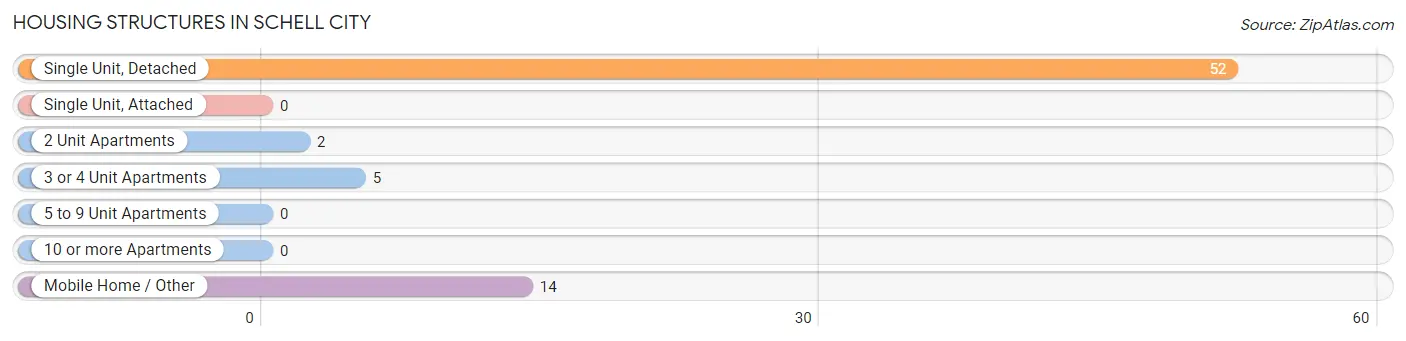
| Structure Type | # Housing Units | % Housing Units |
| Single Unit, Detached | 52 | 71.2% |
| Single Unit, Attached | 0 | 0.0% |
| 2 Unit Apartments | 2 | 2.7% |
| 3 or 4 Unit Apartments | 5 | 6.9% |
| 5 to 9 Unit Apartments | 0 | 0.0% |
| 10 or more Apartments | 0 | 0.0% |
| Mobile Home / Other | 14 | 19.2% |
| Total | 73 | 100.0% |
Housing Structures by Occupancy in Schell City
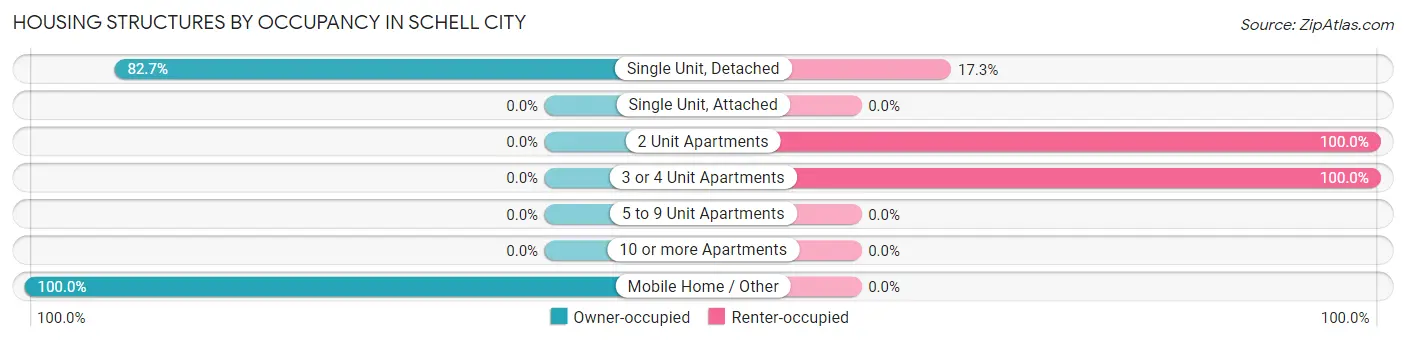
| Structure Type | Owner-occupied | Renter-occupied |
| Single Unit, Detached | 43 (82.7%) | 9 (17.3%) |
| Single Unit, Attached | 0 (0.0%) | 0 (0.0%) |
| 2 Unit Apartments | 0 (0.0%) | 2 (100.0%) |
| 3 or 4 Unit Apartments | 0 (0.0%) | 5 (100.0%) |
| 5 to 9 Unit Apartments | 0 (0.0%) | 0 (0.0%) |
| 10 or more Apartments | 0 (0.0%) | 0 (0.0%) |
| Mobile Home / Other | 14 (100.0%) | 0 (0.0%) |
| Total | 57 (78.1%) | 16 (21.9%) |
Housing Structures by Number of Rooms in Schell City
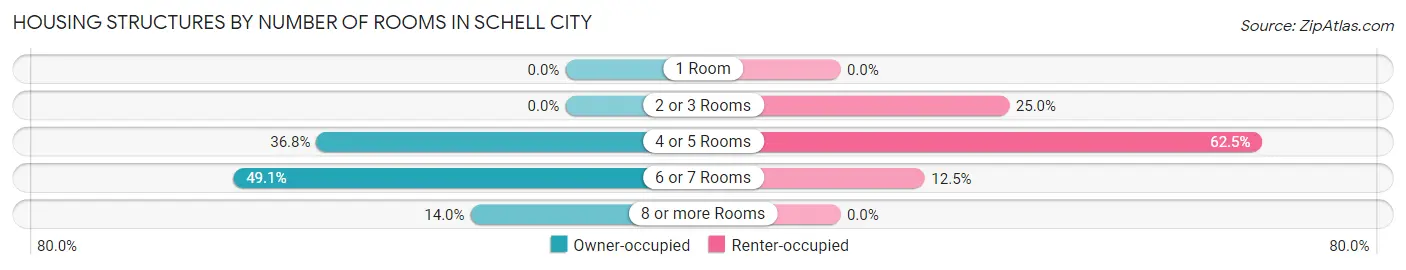
| Number of Rooms | Owner-occupied | Renter-occupied |
| 1 Room | 0 (0.0%) | 0 (0.0%) |
| 2 or 3 Rooms | 0 (0.0%) | 4 (25.0%) |
| 4 or 5 Rooms | 21 (36.8%) | 10 (62.5%) |
| 6 or 7 Rooms | 28 (49.1%) | 2 (12.5%) |
| 8 or more Rooms | 8 (14.0%) | 0 (0.0%) |
| Total | 57 (100.0%) | 16 (100.0%) |
Housing Structure by Heating Type in Schell City
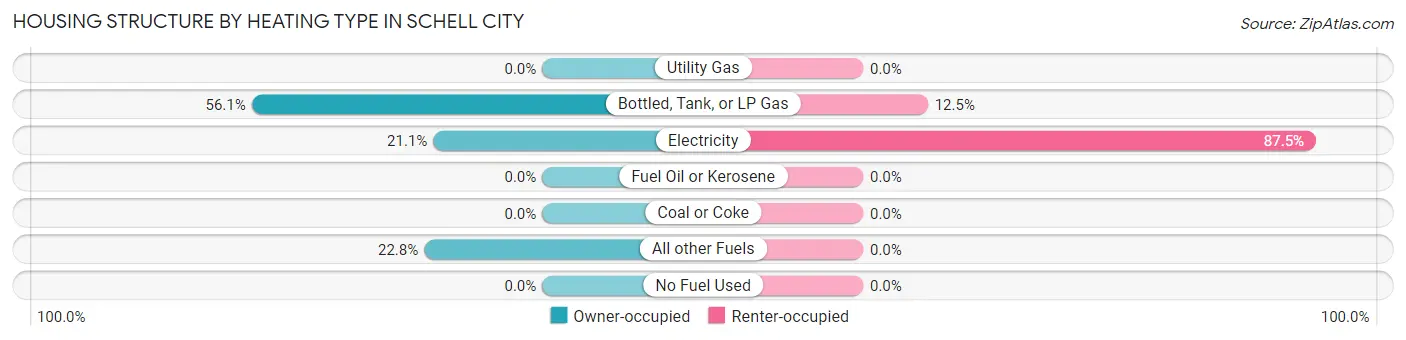
| Heating Type | Owner-occupied | Renter-occupied |
| Utility Gas | 0 (0.0%) | 0 (0.0%) |
| Bottled, Tank, or LP Gas | 32 (56.1%) | 2 (12.5%) |
| Electricity | 12 (21.0%) | 14 (87.5%) |
| Fuel Oil or Kerosene | 0 (0.0%) | 0 (0.0%) |
| Coal or Coke | 0 (0.0%) | 0 (0.0%) |
| All other Fuels | 13 (22.8%) | 0 (0.0%) |
| No Fuel Used | 0 (0.0%) | 0 (0.0%) |
| Total | 57 (100.0%) | 16 (100.0%) |
Household Vehicle Usage in Schell City
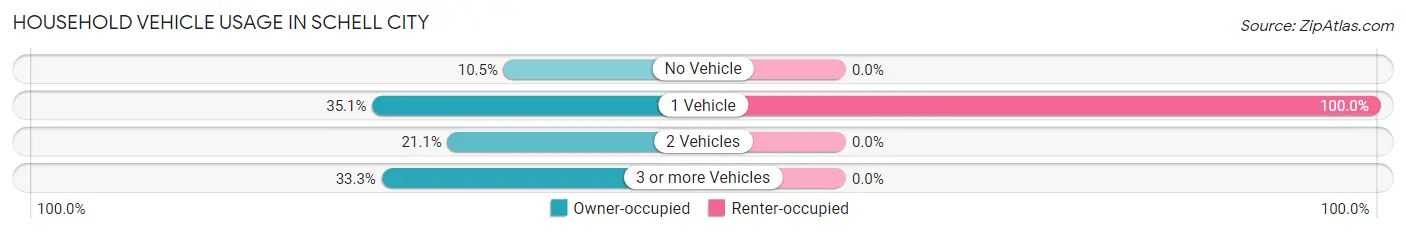
| Vehicles per Household | Owner-occupied | Renter-occupied |
| No Vehicle | 6 (10.5%) | 0 (0.0%) |
| 1 Vehicle | 20 (35.1%) | 16 (100.0%) |
| 2 Vehicles | 12 (21.0%) | 0 (0.0%) |
| 3 or more Vehicles | 19 (33.3%) | 0 (0.0%) |
| Total | 57 (100.0%) | 16 (100.0%) |
Real Estate & Mortgages in Schell City
Real Estate and Mortgage Overview in Schell City
| Characteristic | Without Mortgage | With Mortgage |
| Housing Units | 57 | 0 |
| Median Property Value | $50,800 | $0 |
| Median Household Income | $27,292 | $0 |
| Monthly Housing Costs | $379 | $0 |
| Real Estate Taxes | $457 | $0 |
Property Value by Mortgage Status in Schell City
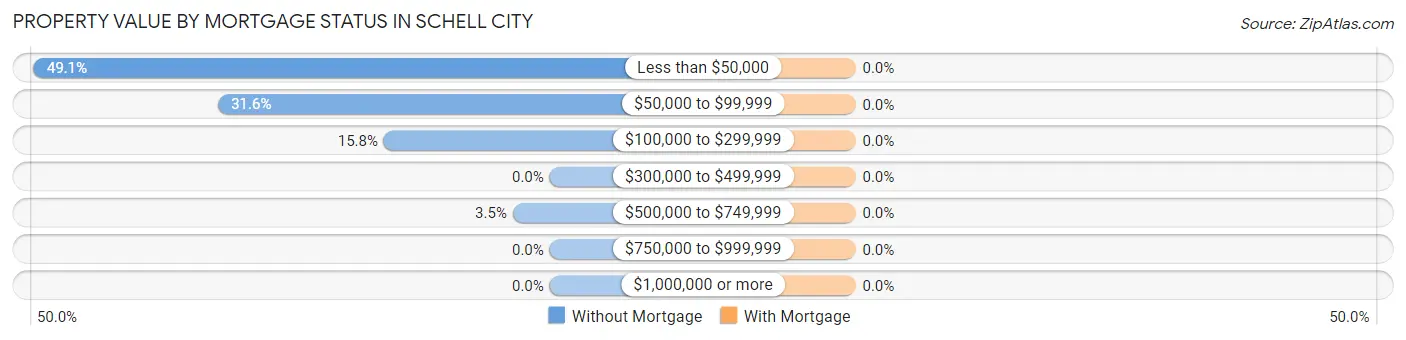
| Property Value | Without Mortgage | With Mortgage |
| Less than $50,000 | 28 (49.1%) | 0 (0.0%) |
| $50,000 to $99,999 | 18 (31.6%) | 0 (0.0%) |
| $100,000 to $299,999 | 9 (15.8%) | 0 (0.0%) |
| $300,000 to $499,999 | 0 (0.0%) | 0 (0.0%) |
| $500,000 to $749,999 | 2 (3.5%) | 0 (0.0%) |
| $750,000 to $999,999 | 0 (0.0%) | 0 (0.0%) |
| $1,000,000 or more | 0 (0.0%) | 0 (0.0%) |
| Total | 57 (100.0%) | 0 (0.0%) |
Household Income by Mortgage Status in Schell City
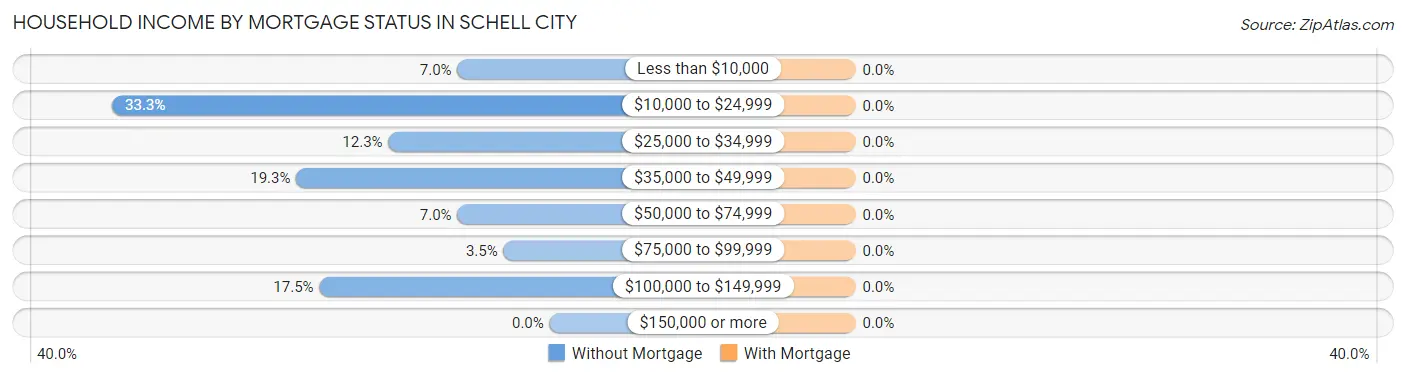
| Household Income | Without Mortgage | With Mortgage |
| Less than $10,000 | 4 (7.0%) | 0 (0.0%) |
| $10,000 to $24,999 | 19 (33.3%) | 0 (0.0%) |
| $25,000 to $34,999 | 7 (12.3%) | 0 (0.0%) |
| $35,000 to $49,999 | 11 (19.3%) | 0 (0.0%) |
| $50,000 to $74,999 | 4 (7.0%) | 0 (0.0%) |
| $75,000 to $99,999 | 2 (3.5%) | 0 (0.0%) |
| $100,000 to $149,999 | 10 (17.5%) | 0 (0.0%) |
| $150,000 or more | 0 (0.0%) | 0 (0.0%) |
| Total | 57 (100.0%) | 0 (0.0%) |
Property Value to Household Income Ratio in Schell City
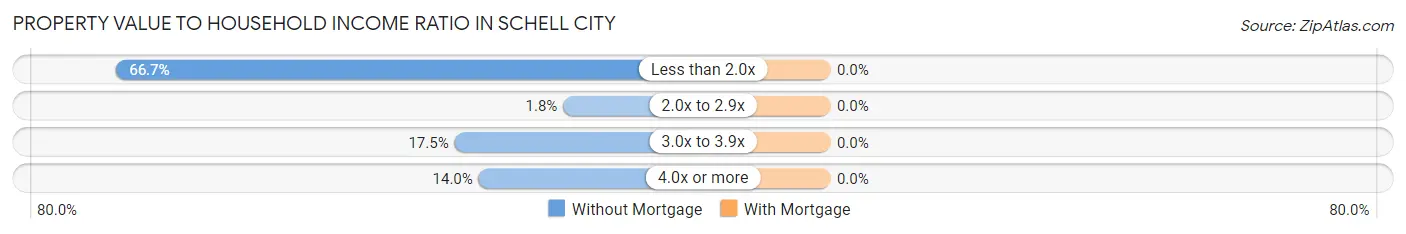
| Value-to-Income Ratio | Without Mortgage | With Mortgage |
| Less than 2.0x | 38 (66.7%) | 0 (0.0%) |
| 2.0x to 2.9x | 1 (1.8%) | 0 (0.0%) |
| 3.0x to 3.9x | 10 (17.5%) | 0 (0.0%) |
| 4.0x or more | 8 (14.0%) | 0 (0.0%) |
| Total | 57 (100.0%) | 0 (0.0%) |
Real Estate Taxes by Mortgage Status in Schell City
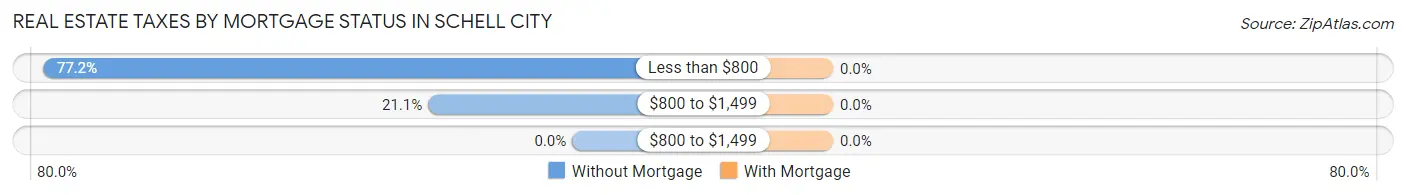
| Property Taxes | Without Mortgage | With Mortgage |
| Less than $800 | 44 (77.2%) | 0 (0.0%) |
| $800 to $1,499 | 12 (21.0%) | 0 (0.0%) |
| $800 to $1,499 | 0 (0.0%) | 0 (0.0%) |
| Total | 57 (100.0%) | 0 (0.0%) |
Health & Disability in Schell City
Health Insurance Coverage by Age in Schell City
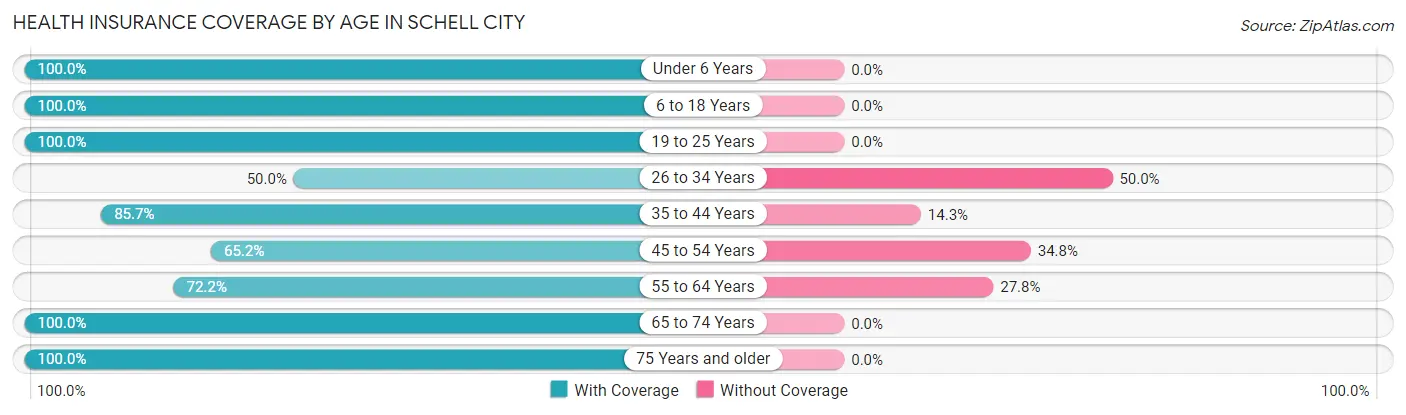
| Age Bracket | With Coverage | Without Coverage |
| Under 6 Years | 34 (100.0%) | 0 (0.0%) |
| 6 to 18 Years | 2 (100.0%) | 0 (0.0%) |
| 19 to 25 Years | 12 (100.0%) | 0 (0.0%) |
| 26 to 34 Years | 7 (50.0%) | 7 (50.0%) |
| 35 to 44 Years | 6 (85.7%) | 1 (14.3%) |
| 45 to 54 Years | 15 (65.2%) | 8 (34.8%) |
| 55 to 64 Years | 13 (72.2%) | 5 (27.8%) |
| 65 to 74 Years | 23 (100.0%) | 0 (0.0%) |
| 75 Years and older | 31 (100.0%) | 0 (0.0%) |
| Total | 143 (87.2%) | 21 (12.8%) |
Health Insurance Coverage by Citizenship Status in Schell City
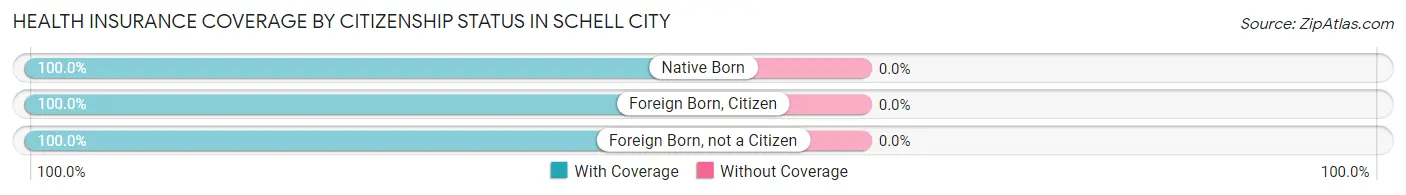
| Citizenship Status | With Coverage | Without Coverage |
| Native Born | 34 (100.0%) | 0 (0.0%) |
| Foreign Born, Citizen | 2 (100.0%) | 0 (0.0%) |
| Foreign Born, not a Citizen | 12 (100.0%) | 0 (0.0%) |
Health Insurance Coverage by Household Income in Schell City
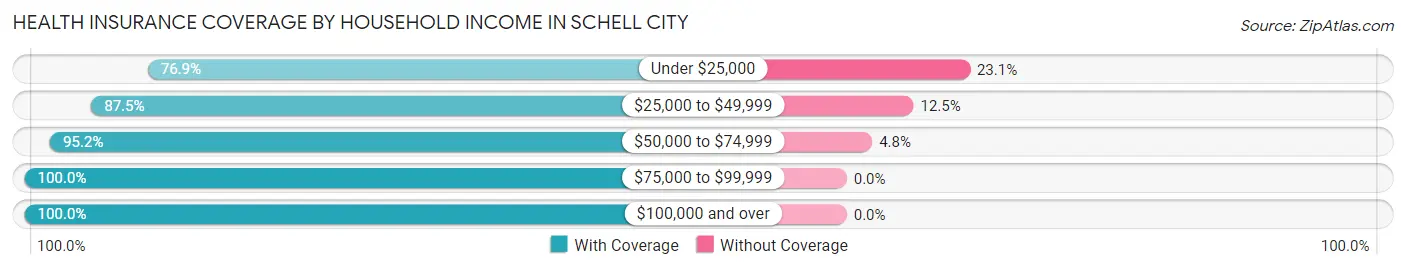
| Household Income | With Coverage | Without Coverage |
| Under $25,000 | 50 (76.9%) | 15 (23.1%) |
| $25,000 to $49,999 | 28 (87.5%) | 4 (12.5%) |
| $50,000 to $74,999 | 40 (95.2%) | 2 (4.8%) |
| $75,000 to $99,999 | 6 (100.0%) | 0 (0.0%) |
| $100,000 and over | 19 (100.0%) | 0 (0.0%) |
Public vs Private Health Insurance Coverage by Age in Schell City
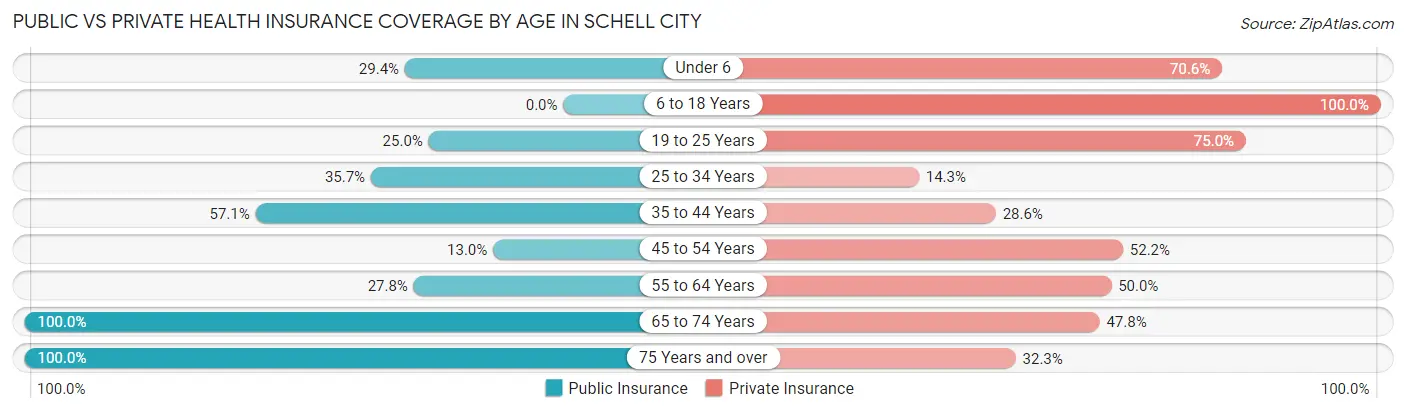
| Age Bracket | Public Insurance | Private Insurance |
| Under 6 | 10 (29.4%) | 24 (70.6%) |
| 6 to 18 Years | 0 (0.0%) | 2 (100.0%) |
| 19 to 25 Years | 3 (25.0%) | 9 (75.0%) |
| 25 to 34 Years | 5 (35.7%) | 2 (14.3%) |
| 35 to 44 Years | 4 (57.1%) | 2 (28.6%) |
| 45 to 54 Years | 3 (13.0%) | 12 (52.2%) |
| 55 to 64 Years | 5 (27.8%) | 9 (50.0%) |
| 65 to 74 Years | 23 (100.0%) | 11 (47.8%) |
| 75 Years and over | 31 (100.0%) | 10 (32.3%) |
| Total | 84 (51.2%) | 81 (49.4%) |
Disability Status by Sex by Age in Schell City
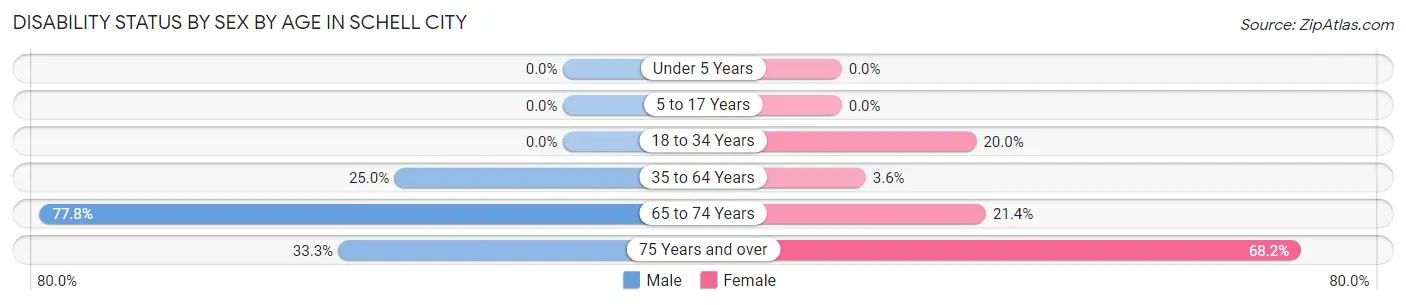
| Age Bracket | Male | Female |
| Under 5 Years | 0 (0.0%) | 0 (0.0%) |
| 5 to 17 Years | 0 (0.0%) | 0 (0.0%) |
| 18 to 34 Years | 0 (0.0%) | 3 (20.0%) |
| 35 to 64 Years | 5 (25.0%) | 1 (3.6%) |
| 65 to 74 Years | 7 (77.8%) | 3 (21.4%) |
| 75 Years and over | 3 (33.3%) | 15 (68.2%) |
Disability Class by Sex by Age in Schell City
Disability Class: Hearing Difficulty
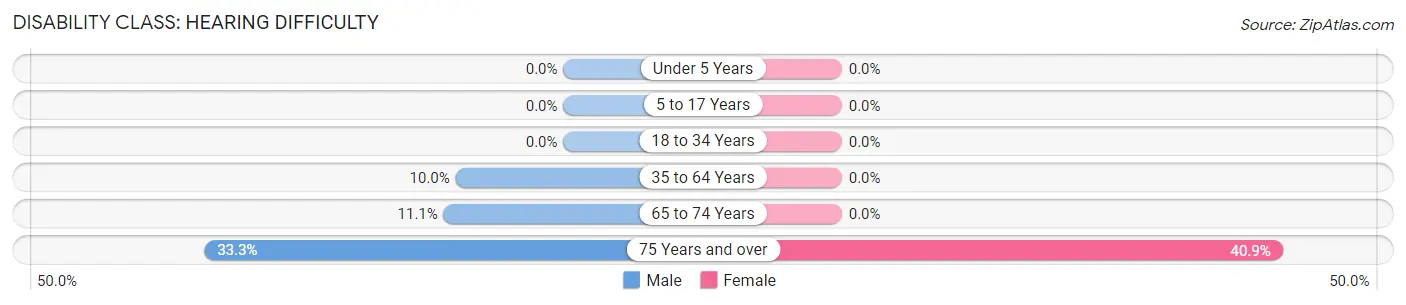
| Age Bracket | Male | Female |
| Under 5 Years | 0 (0.0%) | 0 (0.0%) |
| 5 to 17 Years | 0 (0.0%) | 0 (0.0%) |
| 18 to 34 Years | 0 (0.0%) | 0 (0.0%) |
| 35 to 64 Years | 2 (10.0%) | 0 (0.0%) |
| 65 to 74 Years | 1 (11.1%) | 0 (0.0%) |
| 75 Years and over | 3 (33.3%) | 9 (40.9%) |
Disability Class: Vision Difficulty
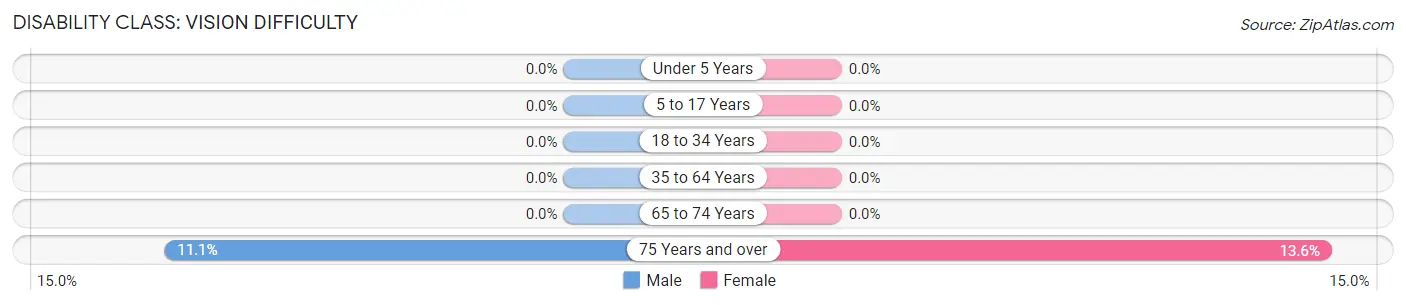
| Age Bracket | Male | Female |
| Under 5 Years | 0 (0.0%) | 0 (0.0%) |
| 5 to 17 Years | 0 (0.0%) | 0 (0.0%) |
| 18 to 34 Years | 0 (0.0%) | 0 (0.0%) |
| 35 to 64 Years | 0 (0.0%) | 0 (0.0%) |
| 65 to 74 Years | 0 (0.0%) | 0 (0.0%) |
| 75 Years and over | 1 (11.1%) | 3 (13.6%) |
Disability Class: Cognitive Difficulty
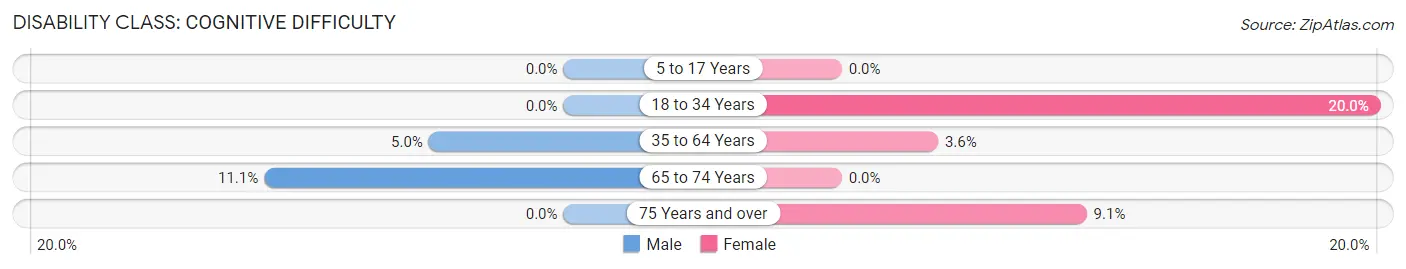
| Age Bracket | Male | Female |
| 5 to 17 Years | 0 (0.0%) | 0 (0.0%) |
| 18 to 34 Years | 0 (0.0%) | 3 (20.0%) |
| 35 to 64 Years | 1 (5.0%) | 1 (3.6%) |
| 65 to 74 Years | 1 (11.1%) | 0 (0.0%) |
| 75 Years and over | 0 (0.0%) | 2 (9.1%) |
Disability Class: Ambulatory Difficulty
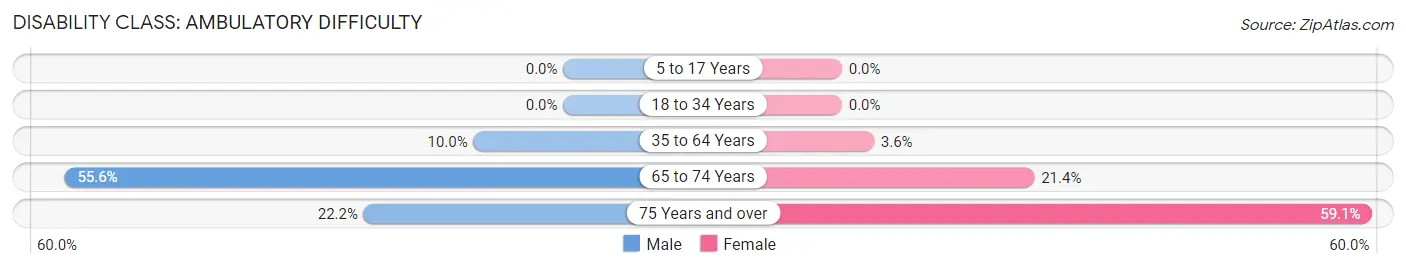
| Age Bracket | Male | Female |
| 5 to 17 Years | 0 (0.0%) | 0 (0.0%) |
| 18 to 34 Years | 0 (0.0%) | 0 (0.0%) |
| 35 to 64 Years | 2 (10.0%) | 1 (3.6%) |
| 65 to 74 Years | 5 (55.6%) | 3 (21.4%) |
| 75 Years and over | 2 (22.2%) | 13 (59.1%) |
Disability Class: Self-Care Difficulty
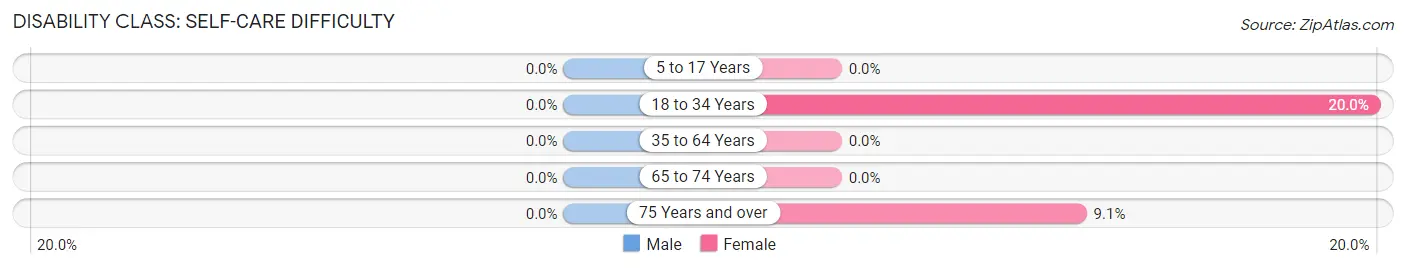
| Age Bracket | Male | Female |
| 5 to 17 Years | 0 (0.0%) | 0 (0.0%) |
| 18 to 34 Years | 0 (0.0%) | 3 (20.0%) |
| 35 to 64 Years | 0 (0.0%) | 0 (0.0%) |
| 65 to 74 Years | 0 (0.0%) | 0 (0.0%) |
| 75 Years and over | 0 (0.0%) | 2 (9.1%) |
Technology Access in Schell City
Computing Device Access in Schell City
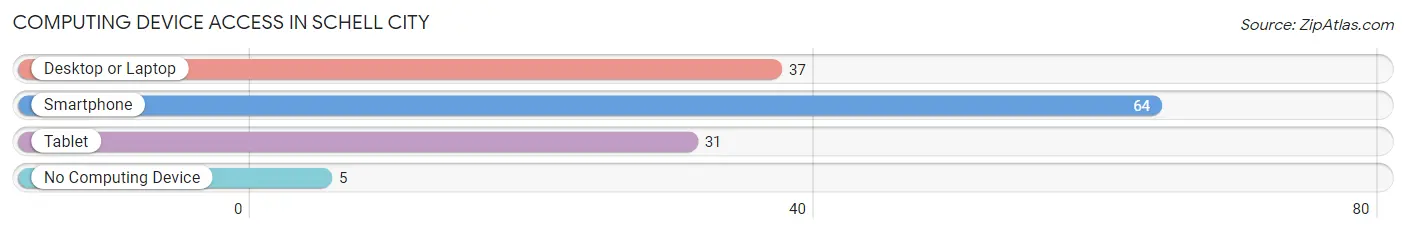
| Device Type | # Households | % Households |
| Desktop or Laptop | 37 | 50.7% |
| Smartphone | 64 | 87.7% |
| Tablet | 31 | 42.5% |
| No Computing Device | 5 | 6.9% |
| Total | 73 | 100.0% |
Internet Access in Schell City
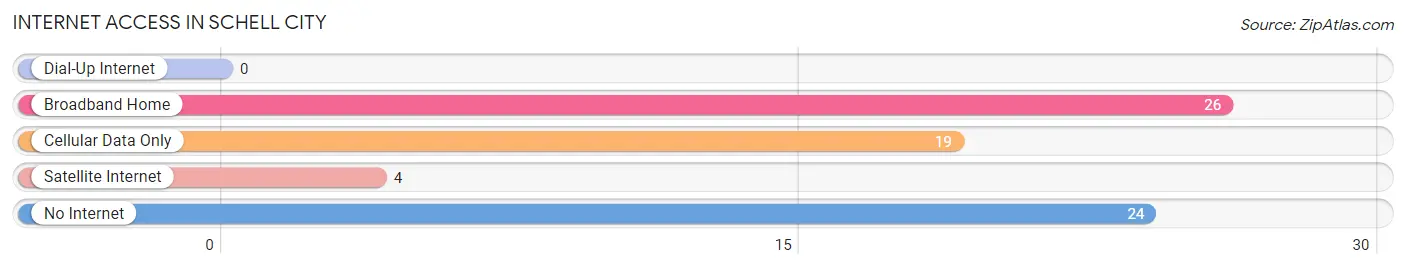
| Internet Type | # Households | % Households |
| Dial-Up Internet | 0 | 0.0% |
| Broadband Home | 26 | 35.6% |
| Cellular Data Only | 19 | 26.0% |
| Satellite Internet | 4 | 5.5% |
| No Internet | 24 | 32.9% |
| Total | 73 | 100.0% |
Schell City Summary
Schell City is a small town located in Vernon County, Missouri. It is situated in the southwestern corner of the state, near the border with Kansas. The town was founded in 1881 and has a population of approximately 200 people.
Geography
Schell City is located in the southwestern corner of Missouri, near the border with Kansas. It is situated in the Ozark Plateau region of the state, which is characterized by rolling hills and valleys. The town is located in the center of Vernon County, and is surrounded by the towns of Bronaugh, Deerfield, and Metz. The nearest major city is Joplin, which is located about 40 miles to the east.
The climate in Schell City is generally mild, with hot summers and cold winters. The average annual temperature is around 55 degrees Fahrenheit, and the average annual precipitation is around 40 inches.
Economy
The economy of Schell City is largely based on agriculture. The town is home to several farms, which produce a variety of crops, including corn, soybeans, wheat, and hay. The town also has a few small businesses, including a grocery store, a hardware store, and a restaurant.
Demographics
As of the 2010 census, the population of Schell City was 200 people. The racial makeup of the town was 97.5% White, 0.5% African American, 0.5% Native American, and 1.5% from other races. The median household income was $30,000, and the median family income was $35,000.
The town is served by the Schell City R-II School District, which includes an elementary school, a middle school, and a high school. The town also has a public library, a post office, and a volunteer fire department.
History
Schell City was founded in 1881 by German immigrants who had settled in the area. The town was named after one of the founders, John Schell. The town grew slowly over the years, and by the early 1900s, it had a population of around 500 people.
In the early 1900s, the town was home to several businesses, including a bank, a hotel, a blacksmith shop, and a general store. The town also had a newspaper, the Schell City Herald, which was published from 1902 to 1910.
In the 1920s, the town experienced a period of growth, as several new businesses opened, including a movie theater, a bowling alley, and a drug store. However, the Great Depression of the 1930s caused the town to decline, and by the 1940s, the population had dropped to around 200 people.
In the 1950s, the town experienced a period of revitalization, as several new businesses opened, including a grocery store, a hardware store, and a restaurant. The town also had a new school built in the 1950s, and a new library was opened in the 1960s.
Today, Schell City is a small, rural town with a population of around 200 people. The town is still largely agricultural, and the economy is based on farming and small businesses. The town is served by the Schell City R-II School District, and has a public library, a post office, and a volunteer fire department.
Common Questions
What is the Total Population of Schell City?
Total Population of Schell City is 164.
What is the Total Male Population of Schell City?
Total Male Population of Schell City is 73.
What is the Total Female Population of Schell City?
Total Female Population of Schell City is 91.
What is the Ratio of Males per 100 Females in Schell City?
There are 80.22 Males per 100 Females in Schell City.
What is the Ratio of Females per 100 Males in Schell City?
There are 124.66 Females per 100 Males in Schell City.
What is the Median Population Age in Schell City?
Median Population Age in Schell City is 53.5 Years.
What is the Average Family Size in Schell City
Average Family Size in Schell City is 2.9 People.
What is the Average Household Size in Schell City
Average Household Size in Schell City is 2.2 People.
What is Per Capita Income in Schell City?
Per Capita income in Schell City is $17,398.
What is the Median Family Income in Schell City?
Median Family Income in Schell City is $44,167.
What is the Median Household income in Schell City?
Median Household Income in Schell City is $26,875.
What is Family Income Deficit in Schell City?
Family Income Deficit in Schell City is $13,457.
Families that are below poverty line in Schell City earn $13,457 less on average than the poverty threshold level.
What is Inequality or Gini Index in Schell City?
Inequality or Gini Index in Schell City is 0.40.
How Large is the Labor Force in Schell City?
There are 38 People in the Labor Forcein in Schell City.
What is the Percentage of People in the Labor Force in Schell City?
29.5% of People are in the Labor Force in Schell City.
What is the Unemployment Rate in Schell City?
Unemployment Rate in Schell City is 5.3%.