Saginaw, MO
Saginaw Map
Saginaw Overview
305
TOTAL POPULATION
150
MALE POPULATION
155
FEMALE POPULATION
96.77
MALES / 100 FEMALES
103.33
FEMALES / 100 MALES
43.5
MEDIAN AGE
2.9
AVG FAMILY SIZE
2.5
AVG HOUSEHOLD SIZE
$27,354
PER CAPITA INCOME
$55,625
AVG FAMILY INCOME
$52,422
AVG HOUSEHOLD INCOME
34.3%
WAGE / INCOME GAP [ % ]
65.7¢/ $1
WAGE / INCOME GAP [ $ ]
0.40
INEQUALITY / GINI INDEX
129
LABOR FORCE [ PEOPLE ]
54.4%
PERCENT IN LABOR FORCE
2.3%
UNEMPLOYMENT RATE
Saginaw Area Codes
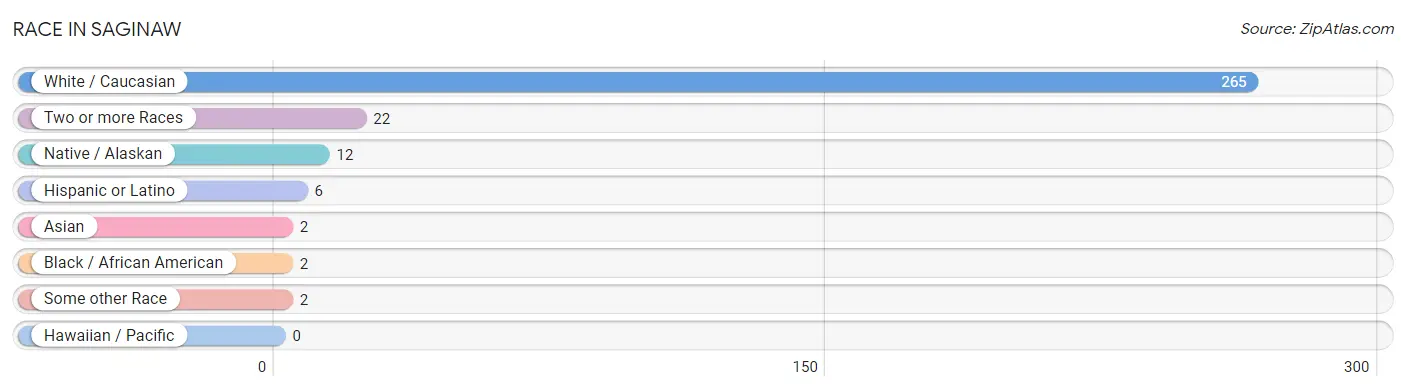
Race in Saginaw
The most populous races in Saginaw are White / Caucasian (265 | 86.9%), Two or more Races (22 | 7.2%), and Native / Alaskan (12 | 3.9%).
| Race | # Population | % Population |
| Asian | 2 | 0.7% |
| Black / African American | 2 | 0.7% |
| Hawaiian / Pacific | 0 | 0.0% |
| Hispanic or Latino | 6 | 2.0% |
| Native / Alaskan | 12 | 3.9% |
| White / Caucasian | 265 | 86.9% |
| Two or more Races | 22 | 7.2% |
| Some other Race | 2 | 0.7% |
| Total | 305 | 100.0% |
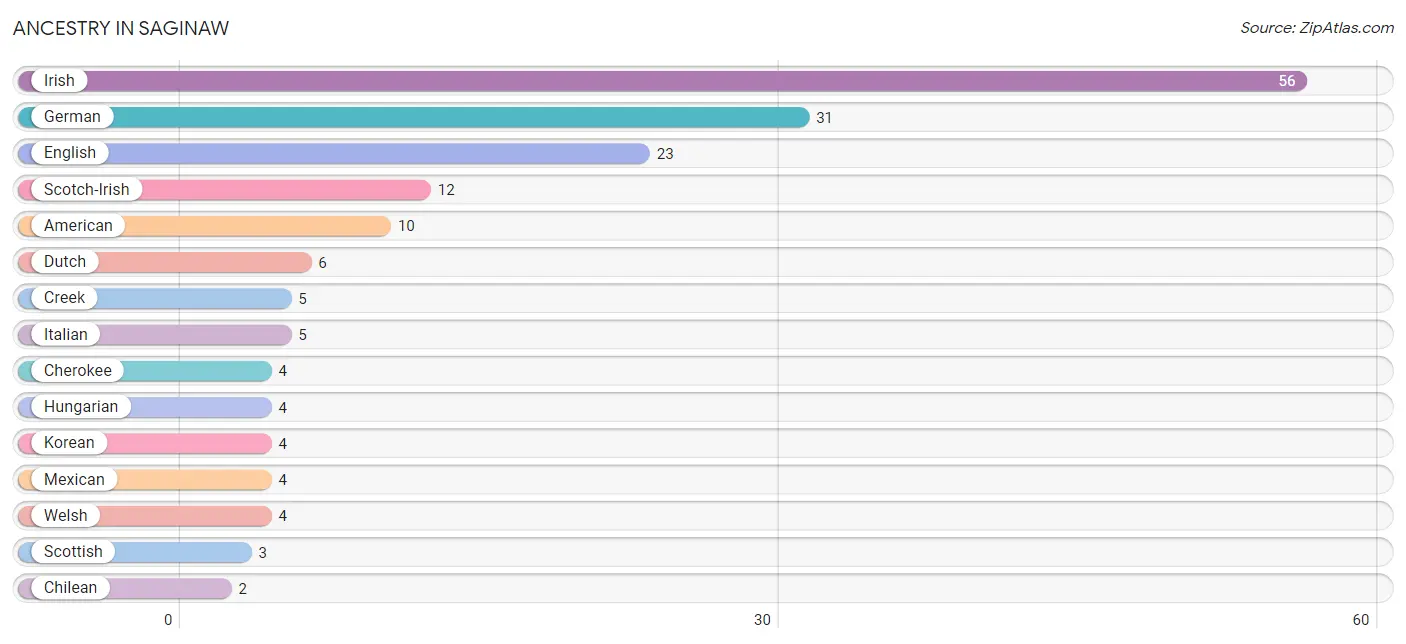
Ancestry in Saginaw
The most populous ancestries reported in Saginaw are Irish (56 | 18.4%), German (31 | 10.2%), English (23 | 7.5%), Scotch-Irish (12 | 3.9%), and American (10 | 3.3%), together accounting for 43.3% of all Saginaw residents.
| Ancestry | # Population | % Population |
| American | 10 | 3.3% |
| Cherokee | 4 | 1.3% |
| Chilean | 2 | 0.7% |
| Creek | 5 | 1.6% |
| Dutch | 6 | 2.0% |
| English | 23 | 7.5% |
| European | 2 | 0.7% |
| French | 2 | 0.7% |
| French Canadian | 2 | 0.7% |
| German | 31 | 10.2% |
| Hungarian | 4 | 1.3% |
| Irish | 56 | 18.4% |
| Italian | 5 | 1.6% |
| Jamaican | 2 | 0.7% |
| Korean | 4 | 1.3% |
| Mexican | 4 | 1.3% |
| Ottawa | 1 | 0.3% |
| Polish | 1 | 0.3% |
| Puget Sound Salish | 1 | 0.3% |
| Scandinavian | 2 | 0.7% |
| Scotch-Irish | 12 | 3.9% |
| Scottish | 3 | 1.0% |
| Sioux | 1 | 0.3% |
| South American | 2 | 0.7% |
| Welsh | 4 | 1.3% | View All 25 Rows |
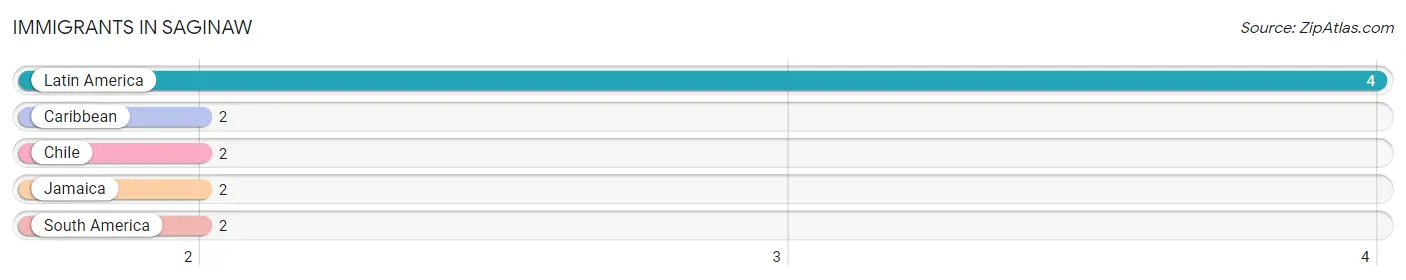
Immigrants in Saginaw
The most numerous immigrant groups reported in Saginaw came from Latin America (4 | 1.3%), Caribbean (2 | 0.7%), Chile (2 | 0.7%), Jamaica (2 | 0.7%), and South America (2 | 0.7%), together accounting for 4.0% of all Saginaw residents.
| Immigration Origin | # Population | % Population |
| Caribbean | 2 | 0.7% |
| Chile | 2 | 0.7% |
| Jamaica | 2 | 0.7% |
| Latin America | 4 | 1.3% |
| South America | 2 | 0.7% | View All 5 Rows |
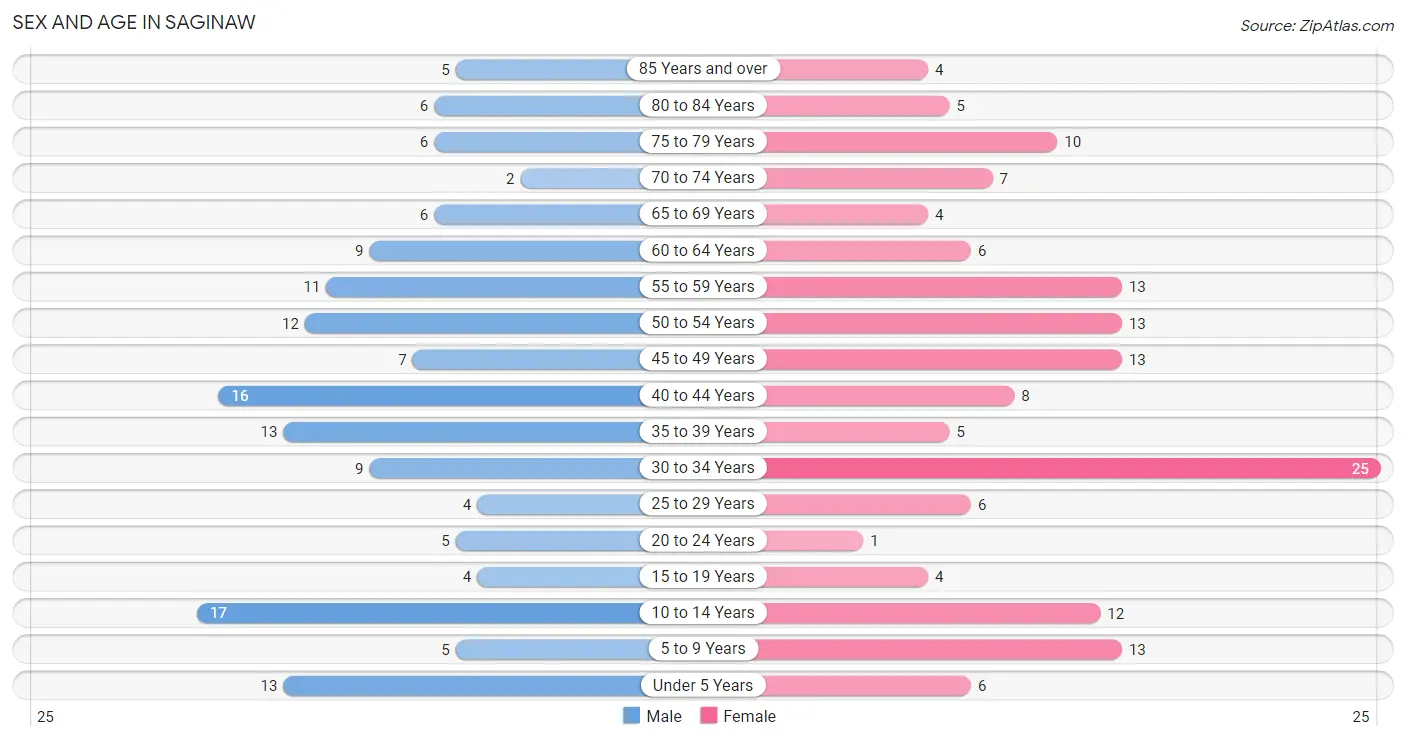
Sex and Age in Saginaw
Sex and Age in Saginaw
The most populous age groups in Saginaw are 10 to 14 Years (17 | 11.3%) for men and 30 to 34 Years (25 | 16.1%) for women.
| Age Bracket | Male | Female |
| Under 5 Years | 13 (8.7%) | 6 (3.9%) |
| 5 to 9 Years | 5 (3.3%) | 13 (8.4%) |
| 10 to 14 Years | 17 (11.3%) | 12 (7.7%) |
| 15 to 19 Years | 4 (2.7%) | 4 (2.6%) |
| 20 to 24 Years | 5 (3.3%) | 1 (0.6%) |
| 25 to 29 Years | 4 (2.7%) | 6 (3.9%) |
| 30 to 34 Years | 9 (6.0%) | 25 (16.1%) |
| 35 to 39 Years | 13 (8.7%) | 5 (3.2%) |
| 40 to 44 Years | 16 (10.7%) | 8 (5.2%) |
| 45 to 49 Years | 7 (4.7%) | 13 (8.4%) |
| 50 to 54 Years | 12 (8.0%) | 13 (8.4%) |
| 55 to 59 Years | 11 (7.3%) | 13 (8.4%) |
| 60 to 64 Years | 9 (6.0%) | 6 (3.9%) |
| 65 to 69 Years | 6 (4.0%) | 4 (2.6%) |
| 70 to 74 Years | 2 (1.3%) | 7 (4.5%) |
| 75 to 79 Years | 6 (4.0%) | 10 (6.5%) |
| 80 to 84 Years | 6 (4.0%) | 5 (3.2%) |
| 85 Years and over | 5 (3.3%) | 4 (2.6%) |
| Total | 150 (100.0%) | 155 (100.0%) |
Families and Households in Saginaw
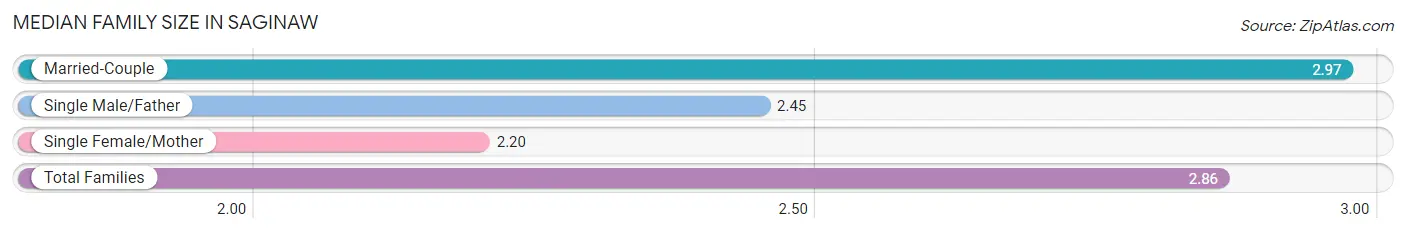
Median Family Size in Saginaw
The median family size in Saginaw is 2.86 persons per family, with married-couple families (67 | 80.7%) accounting for the largest median family size of 2.97 persons per family. On the other hand, single female/mother families (5 | 6.0%) represent the smallest median family size with 2.20 persons per family.
| Family Type | # Families | Family Size |
| Married-Couple | 67 (80.7%) | 2.97 |
| Single Male/Father | 11 (13.3%) | 2.45 |
| Single Female/Mother | 5 (6.0%) | 2.20 |
| Total Families | 83 (100.0%) | 2.86 |
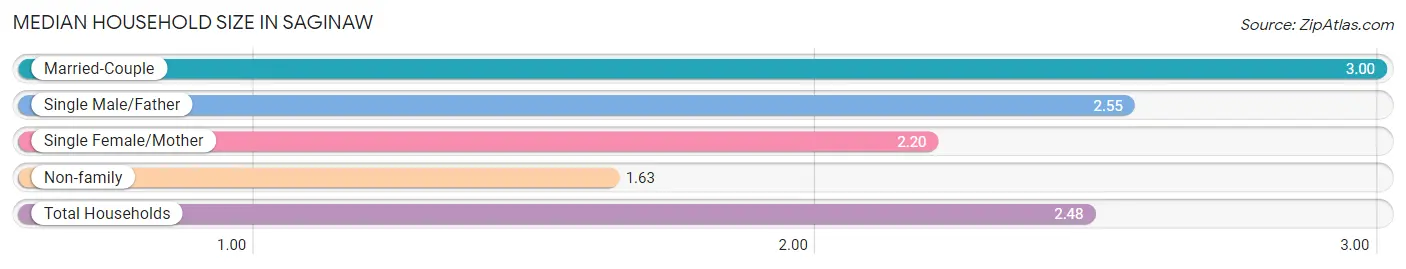
Median Household Size in Saginaw
The median household size in Saginaw is 2.48 persons per household, with married-couple households (67 | 54.5%) accounting for the largest median household size of 3 persons per household. non-family households (40 | 32.5%) represent the smallest median household size with 1.63 persons per household.
| Household Type | # Households | Household Size |
| Married-Couple | 67 (54.5%) | 3.00 |
| Single Male/Father | 11 (8.9%) | 2.55 |
| Single Female/Mother | 5 (4.1%) | 2.20 |
| Non-family | 40 (32.5%) | 1.63 |
| Total Households | 123 (100.0%) | 2.48 |
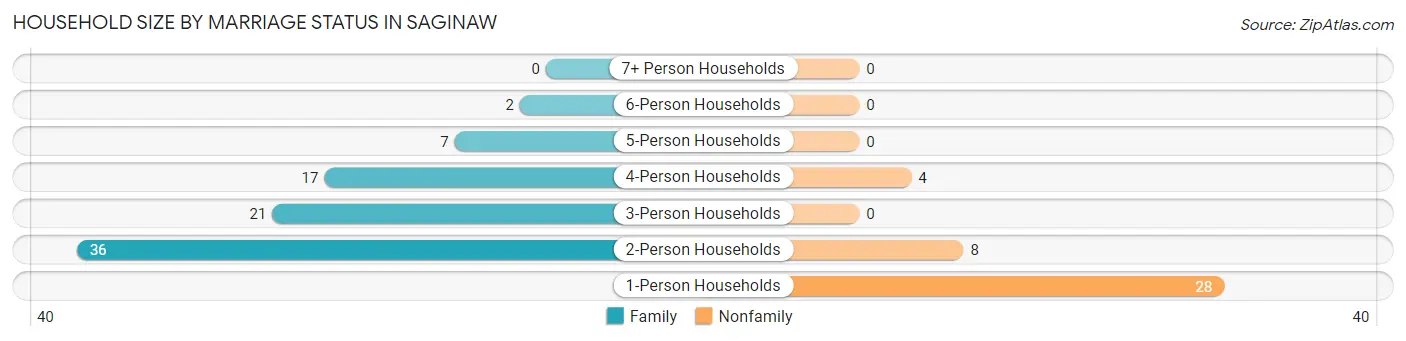
Household Size by Marriage Status in Saginaw
Out of a total of 123 households in Saginaw, 83 (67.5%) are family households, while 40 (32.5%) are nonfamily households. The most numerous type of family households are 2-person households, comprising 36, and the most common type of nonfamily households are 1-person households, comprising 28.
| Household Size | Family Households | Nonfamily Households |
| 1-Person Households | - | 28 (22.8%) |
| 2-Person Households | 36 (29.3%) | 8 (6.5%) |
| 3-Person Households | 21 (17.1%) | 0 (0.0%) |
| 4-Person Households | 17 (13.8%) | 4 (3.3%) |
| 5-Person Households | 7 (5.7%) | 0 (0.0%) |
| 6-Person Households | 2 (1.6%) | 0 (0.0%) |
| 7+ Person Households | 0 (0.0%) | 0 (0.0%) |
| Total | 83 (67.5%) | 40 (32.5%) |
Female Fertility in Saginaw
Fertility by Age in Saginaw
Average fertility rate in Saginaw is 113.0 births per 1,000 women. Women in the age bracket of 20 to 34 years have the highest fertility rate with 219.0 births per 1,000 women. Women in the age bracket of 20 to 34 years acount for 100.0% of all women with births.
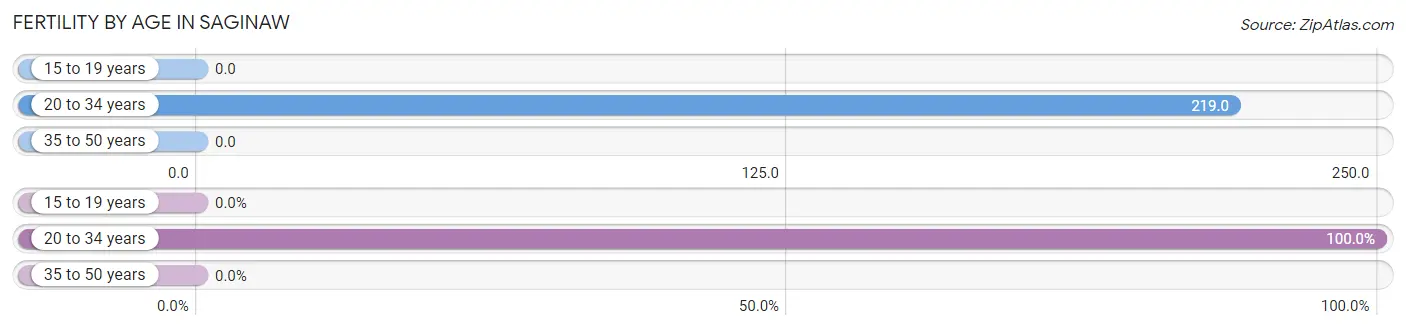
| Age Bracket | Women with Births | Births / 1,000 Women |
| 15 to 19 years | 0 (0.0%) | 0.0 |
| 20 to 34 years | 7 (100.0%) | 219.0 |
| 35 to 50 years | 0 (0.0%) | 0.0 |
| Total | 7 (100.0%) | 113.0 |
Fertility by Age by Marriage Status in Saginaw
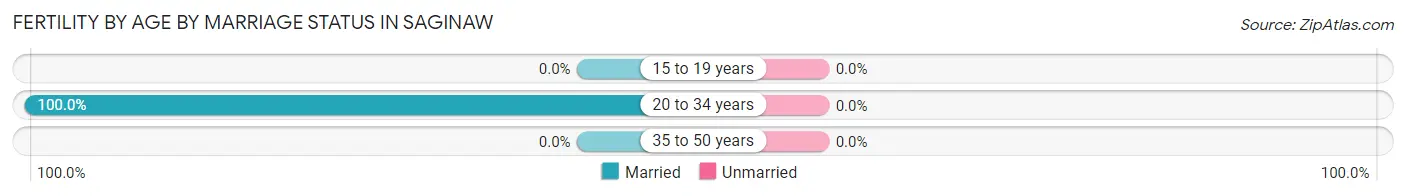
| Age Bracket | Married | Unmarried |
| 15 to 19 years | 0 (0.0%) | 0 (0.0%) |
| 20 to 34 years | 7 (100.0%) | 0 (0.0%) |
| 35 to 50 years | 0 (0.0%) | 0 (0.0%) |
| Total | 7 (100.0%) | 0 (0.0%) |
Fertility by Education in Saginaw
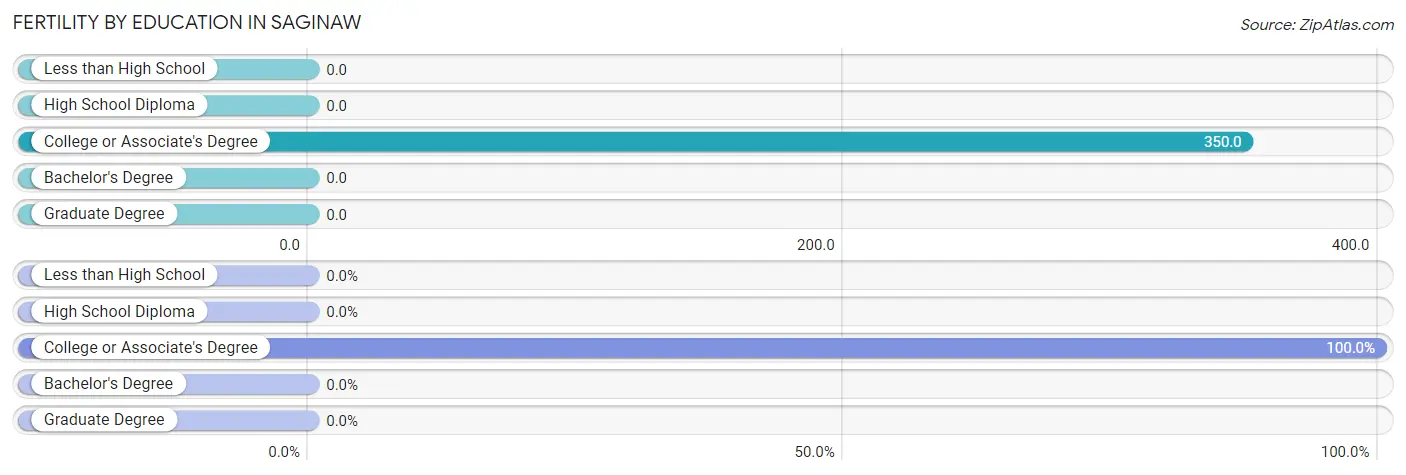
| Educational Attainment | Women with Births | Births / 1,000 Women |
| Less than High School | 0 (0.0%) | 0.0 |
| High School Diploma | 0 (0.0%) | 0.0 |
| College or Associate's Degree | 7 (100.0%) | 350.0 |
| Bachelor's Degree | 0 (0.0%) | 0.0 |
| Graduate Degree | 0 (0.0%) | 0.0 |
| Total | 7 (100.0%) | 113.0 |
Fertility by Education by Marriage Status in Saginaw
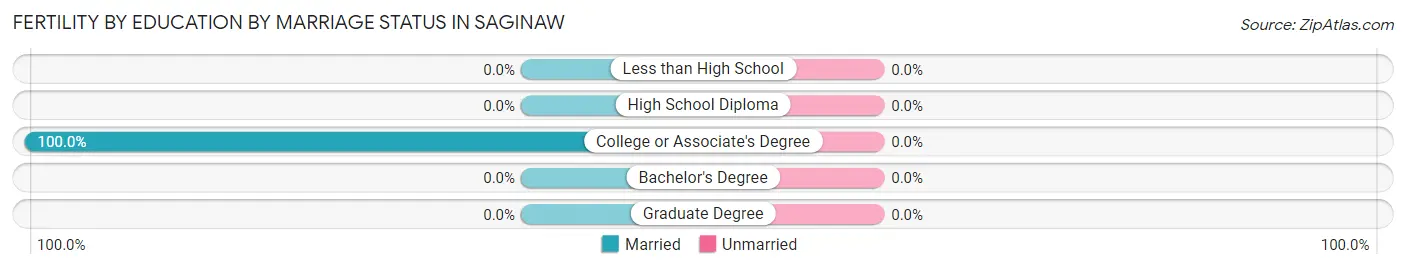
| Educational Attainment | Married | Unmarried |
| Less than High School | 0 (0.0%) | 0 (0.0%) |
| High School Diploma | 0 (0.0%) | 0 (0.0%) |
| College or Associate's Degree | 7 (100.0%) | 0 (0.0%) |
| Bachelor's Degree | 0 (0.0%) | 0 (0.0%) |
| Graduate Degree | 0 (0.0%) | 0 (0.0%) |
| Total | 7 (100.0%) | 0 (0.0%) |
Income in Saginaw
Income Overview in Saginaw
Per Capita Income in Saginaw is $27,354, while median incomes of families and households are $55,625 and $52,422 respectively.
| Characteristic | Number | Measure |
| Per Capita Income | 305 | $27,354 |
| Median Family Income | 83 | $55,625 |
| Mean Family Income | 83 | $79,378 |
| Median Household Income | 123 | $52,422 |
| Mean Household Income | 123 | $69,435 |
| Income Deficit | 83 | $0 |
| Wage / Income Gap (%) | 305 | 34.26% |
| Wage / Income Gap ($) | 305 | 65.74¢ per $1 |
| Gini / Inequality Index | 305 | 0.40 |
Earnings by Sex in Saginaw
Average Earnings in Saginaw are $35,156, $45,288 for men and $29,773 for women, a difference of 34.3%.
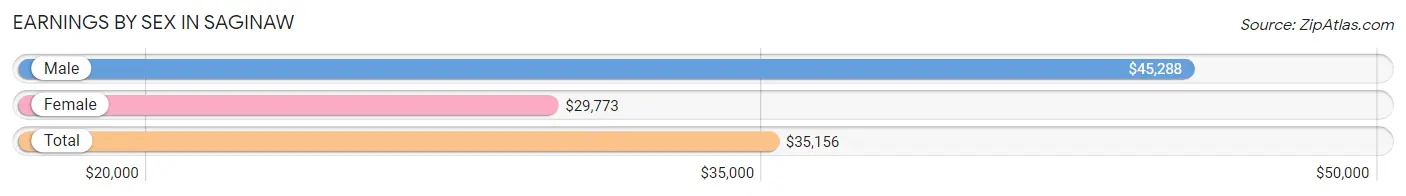
| Sex | Number | Average Earnings |
| Male | 81 (55.9%) | $45,288 |
| Female | 64 (44.1%) | $29,773 |
| Total | 145 (100.0%) | $35,156 |
Earnings by Sex by Income Bracket in Saginaw
The most common earnings brackets in Saginaw are $45,000 to $49,999 for men (13 | 16.1%) and $25,000 to $29,999 for women (13 | 20.3%).
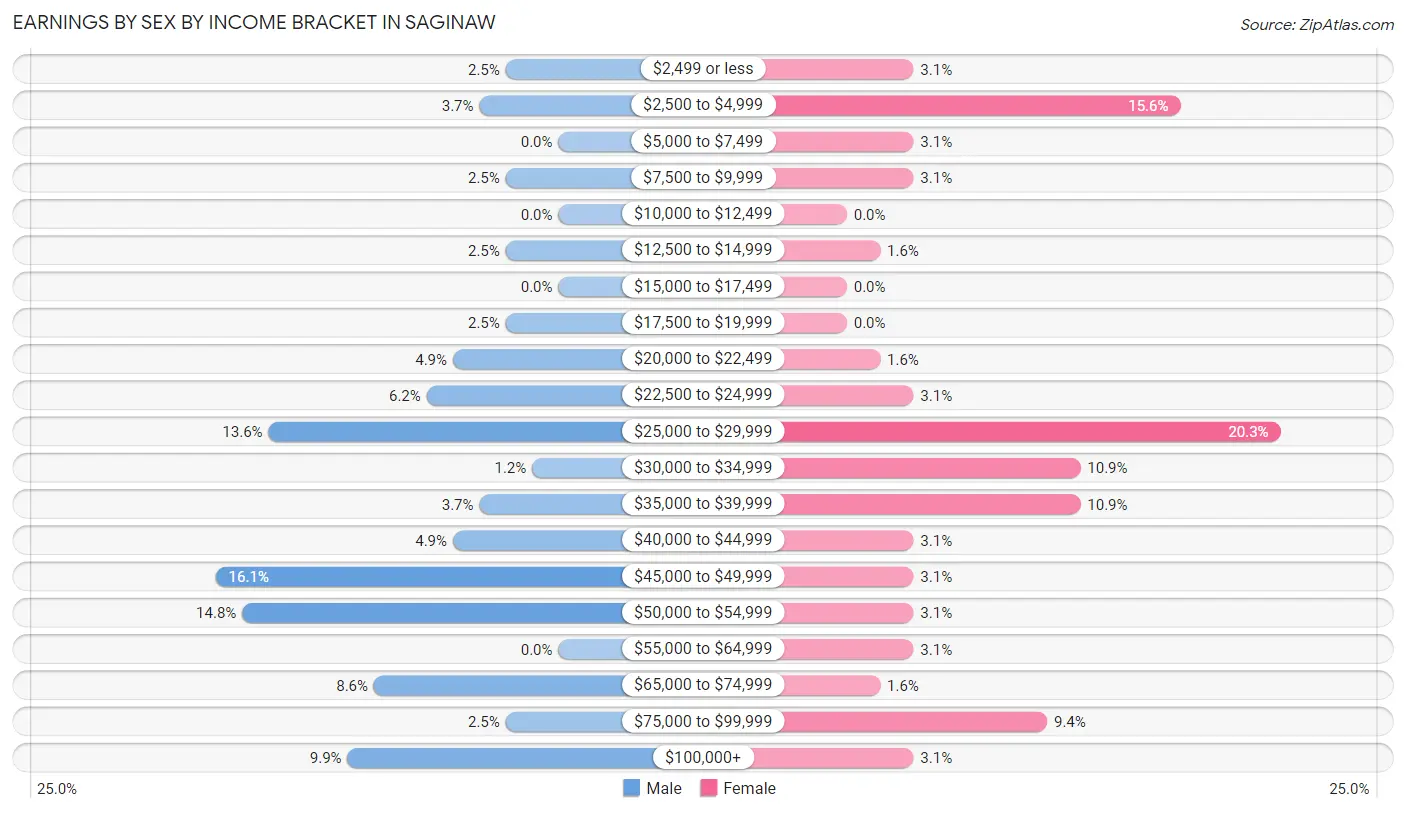
| Income | Male | Female |
| $2,499 or less | 2 (2.5%) | 2 (3.1%) |
| $2,500 to $4,999 | 3 (3.7%) | 10 (15.6%) |
| $5,000 to $7,499 | 0 (0.0%) | 2 (3.1%) |
| $7,500 to $9,999 | 2 (2.5%) | 2 (3.1%) |
| $10,000 to $12,499 | 0 (0.0%) | 0 (0.0%) |
| $12,500 to $14,999 | 2 (2.5%) | 1 (1.6%) |
| $15,000 to $17,499 | 0 (0.0%) | 0 (0.0%) |
| $17,500 to $19,999 | 2 (2.5%) | 0 (0.0%) |
| $20,000 to $22,499 | 4 (4.9%) | 1 (1.6%) |
| $22,500 to $24,999 | 5 (6.2%) | 2 (3.1%) |
| $25,000 to $29,999 | 11 (13.6%) | 13 (20.3%) |
| $30,000 to $34,999 | 1 (1.2%) | 7 (10.9%) |
| $35,000 to $39,999 | 3 (3.7%) | 7 (10.9%) |
| $40,000 to $44,999 | 4 (4.9%) | 2 (3.1%) |
| $45,000 to $49,999 | 13 (16.1%) | 2 (3.1%) |
| $50,000 to $54,999 | 12 (14.8%) | 2 (3.1%) |
| $55,000 to $64,999 | 0 (0.0%) | 2 (3.1%) |
| $65,000 to $74,999 | 7 (8.6%) | 1 (1.6%) |
| $75,000 to $99,999 | 2 (2.5%) | 6 (9.4%) |
| $100,000+ | 8 (9.9%) | 2 (3.1%) |
| Total | 81 (100.0%) | 64 (100.0%) |
Earnings by Sex by Educational Attainment in Saginaw
Average earnings in Saginaw are $45,769 for men and $30,313 for women, a difference of 33.8%. Men with an educational attainment of college or associate's degree enjoy the highest average annual earnings of $50,625, while those with high school diploma education earn the least with $45,341. Women with an educational attainment of high school diploma earn the most with the average annual earnings of $32,917, while those with college or associate's degree education have the smallest earnings of $28,750.
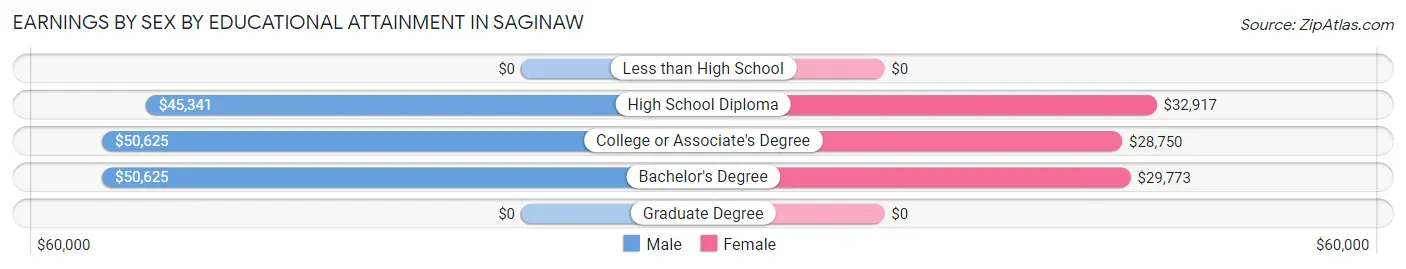
| Educational Attainment | Male Income | Female Income |
| Less than High School | - | - |
| High School Diploma | $45,341 | $32,917 |
| College or Associate's Degree | $50,625 | $28,750 |
| Bachelor's Degree | $50,625 | $29,773 |
| Graduate Degree | - | - |
| Total | $45,769 | $30,313 |
Family Income in Saginaw
Family Income Brackets in Saginaw
According to the Saginaw family income data, there are 29 families falling into the $50,000 to $74,999 income range, which is the most common income bracket and makes up 34.9% of all families.
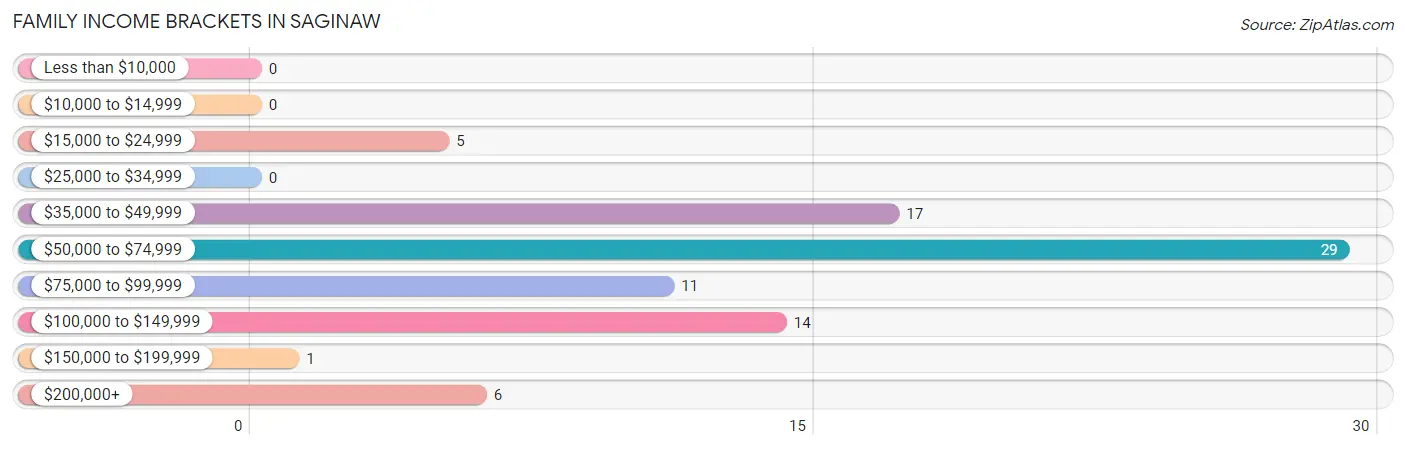
| Income Bracket | # Families | % Families |
| Less than $10,000 | 0 | 0.0% |
| $10,000 to $14,999 | 0 | 0.0% |
| $15,000 to $24,999 | 5 | 6.0% |
| $25,000 to $34,999 | 0 | 0.0% |
| $35,000 to $49,999 | 17 | 20.5% |
| $50,000 to $74,999 | 29 | 34.9% |
| $75,000 to $99,999 | 11 | 13.3% |
| $100,000 to $149,999 | 14 | 16.9% |
| $150,000 to $199,999 | 1 | 1.2% |
| $200,000+ | 6 | 7.2% |
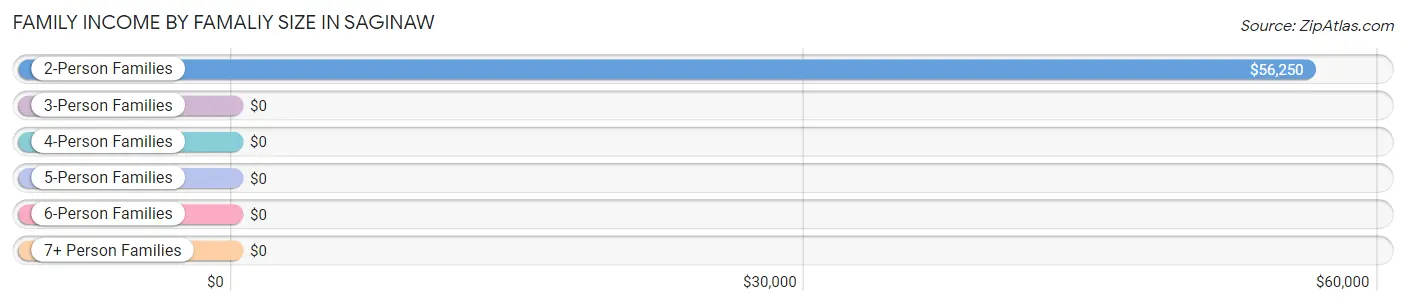
Family Income by Famaliy Size in Saginaw
2-person families (38 | 45.8%) account for the highest median family income in Saginaw with $56,250 per family, while 2-person families (38 | 45.8%) have the highest median income of $28,125 per family member.
| Income Bracket | # Families | Median Income |
| 2-Person Families | 38 (45.8%) | $56,250 |
| 3-Person Families | 21 (25.3%) | $0 |
| 4-Person Families | 15 (18.1%) | $0 |
| 5-Person Families | 7 (8.4%) | $0 |
| 6-Person Families | 2 (2.4%) | $0 |
| 7+ Person Families | 0 (0.0%) | $0 |
| Total | 83 (100.0%) | $55,625 |
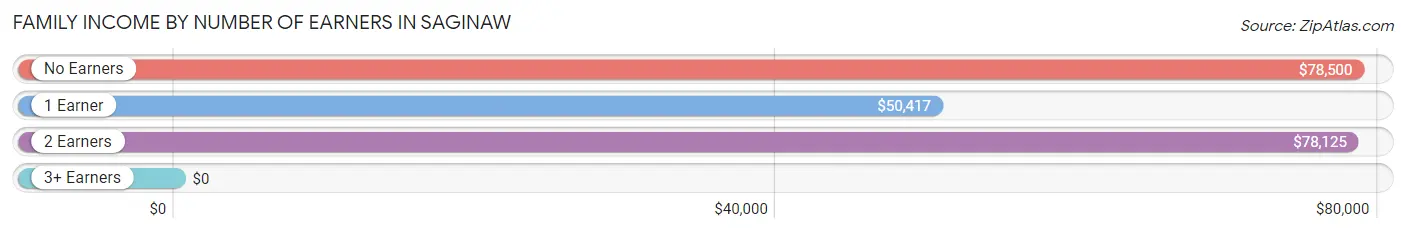
Family Income by Number of Earners in Saginaw
| Number of Earners | # Families | Median Income |
| No Earners | 10 (12.0%) | $78,500 |
| 1 Earner | 38 (45.8%) | $50,417 |
| 2 Earners | 29 (34.9%) | $78,125 |
| 3+ Earners | 6 (7.2%) | $0 |
| Total | 83 (100.0%) | $55,625 |
Household Income in Saginaw
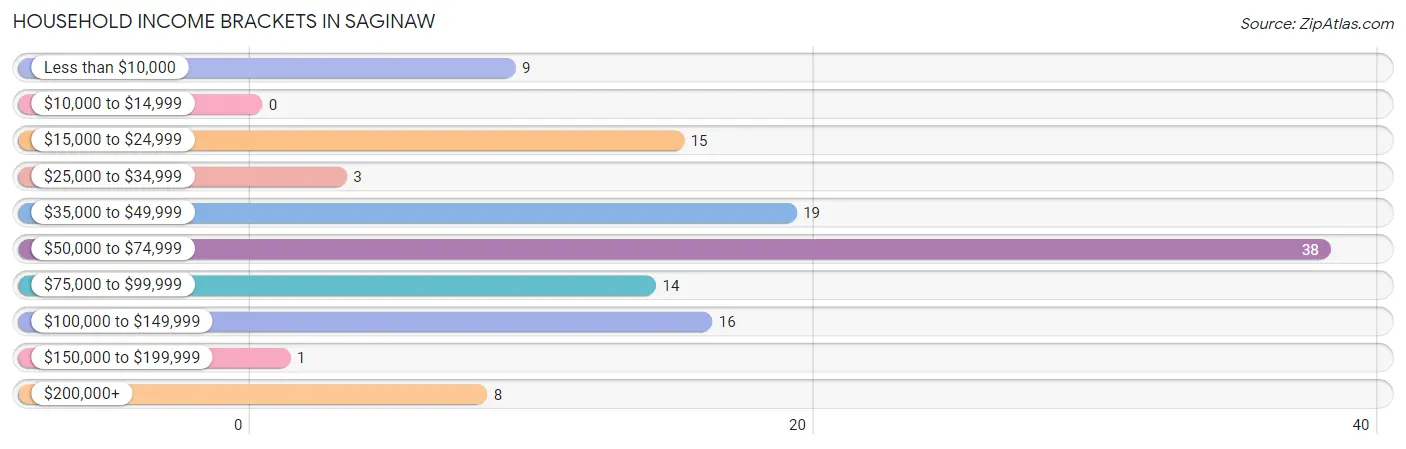
Household Income Brackets in Saginaw
With 38 households falling in the category, the $50,000 to $74,999 income range is the most frequent in Saginaw, accounting for 30.9% of all households.
| Income Bracket | # Households | % Households |
| Less than $10,000 | 9 | 7.3% |
| $10,000 to $14,999 | 0 | 0.0% |
| $15,000 to $24,999 | 15 | 12.2% |
| $25,000 to $34,999 | 3 | 2.4% |
| $35,000 to $49,999 | 19 | 15.4% |
| $50,000 to $74,999 | 38 | 30.9% |
| $75,000 to $99,999 | 14 | 11.4% |
| $100,000 to $149,999 | 16 | 13.0% |
| $150,000 to $199,999 | 1 | 0.8% |
| $200,000+ | 8 | 6.5% |
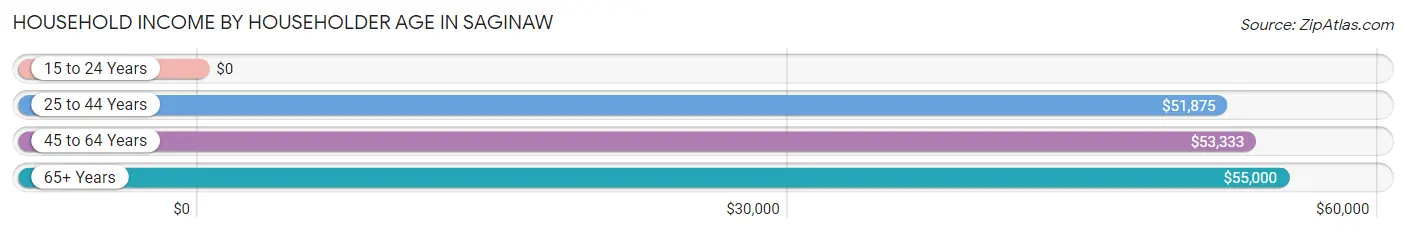
Household Income by Householder Age in Saginaw
The median household income in Saginaw is $52,422, with the highest median household income of $55,000 found in the 65+ years age bracket for the primary householder. A total of 38 households (30.9%) fall into this category. Meanwhile, the 15 to 24 years age bracket for the primary householder has the lowest median household income of $0, with 1 households (0.8%) in this group.
| Income Bracket | # Households | Median Income |
| 15 to 24 Years | 1 (0.8%) | $0 |
| 25 to 44 Years | 46 (37.4%) | $51,875 |
| 45 to 64 Years | 38 (30.9%) | $53,333 |
| 65+ Years | 38 (30.9%) | $55,000 |
| Total | 123 (100.0%) | $52,422 |
Poverty in Saginaw
Income Below Poverty by Sex and Age in Saginaw
With 9.3% poverty level for males and 7.6% for females among the residents of Saginaw, 45 to 54 year old males and 25 to 34 year old females are the most vulnerable to poverty, with 7 males (36.8%) and 6 females (19.4%) in their respective age groups living below the poverty level.
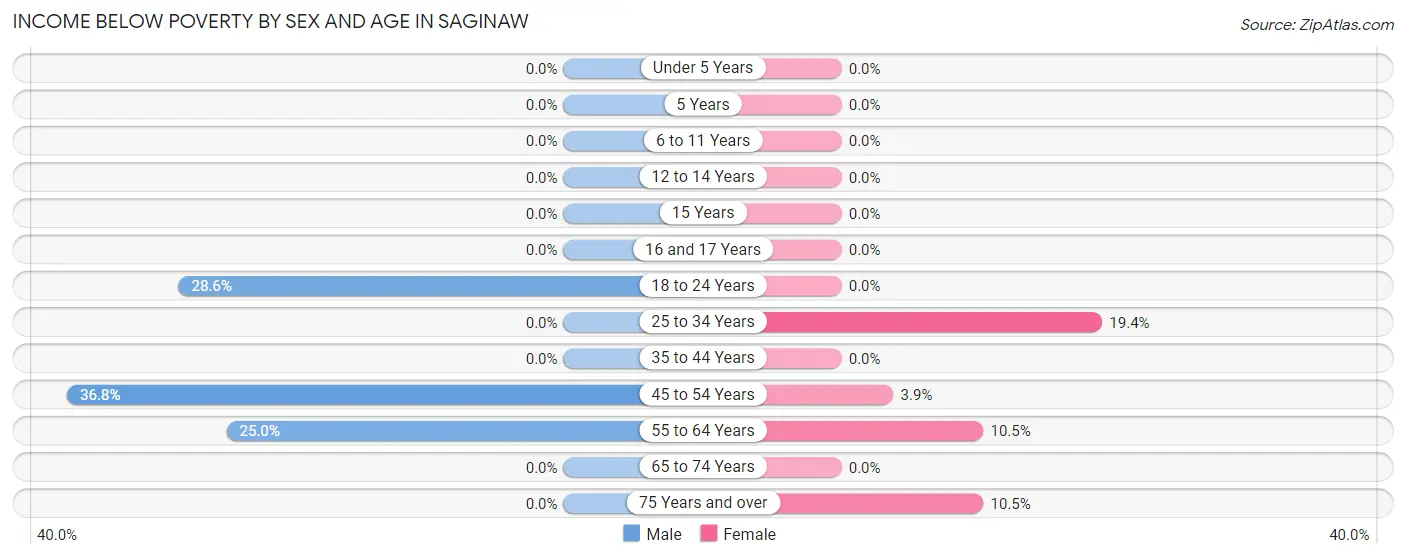
| Age Bracket | Male | Female |
| Under 5 Years | 0 (0.0%) | 0 (0.0%) |
| 5 Years | 0 (0.0%) | 0 (0.0%) |
| 6 to 11 Years | 0 (0.0%) | 0 (0.0%) |
| 12 to 14 Years | 0 (0.0%) | 0 (0.0%) |
| 15 Years | 0 (0.0%) | 0 (0.0%) |
| 16 and 17 Years | 0 (0.0%) | 0 (0.0%) |
| 18 to 24 Years | 2 (28.6%) | 0 (0.0%) |
| 25 to 34 Years | 0 (0.0%) | 6 (19.4%) |
| 35 to 44 Years | 0 (0.0%) | 0 (0.0%) |
| 45 to 54 Years | 7 (36.8%) | 1 (3.8%) |
| 55 to 64 Years | 5 (25.0%) | 2 (10.5%) |
| 65 to 74 Years | 0 (0.0%) | 0 (0.0%) |
| 75 Years and over | 0 (0.0%) | 2 (10.5%) |
| Total | 14 (9.3%) | 11 (7.6%) |
Income Above Poverty by Sex and Age in Saginaw
According to the poverty statistics in Saginaw, males aged under 5 years and females aged under 5 years are the age groups that are most secure financially, with 100.0% of males and 100.0% of females in these age groups living above the poverty line.
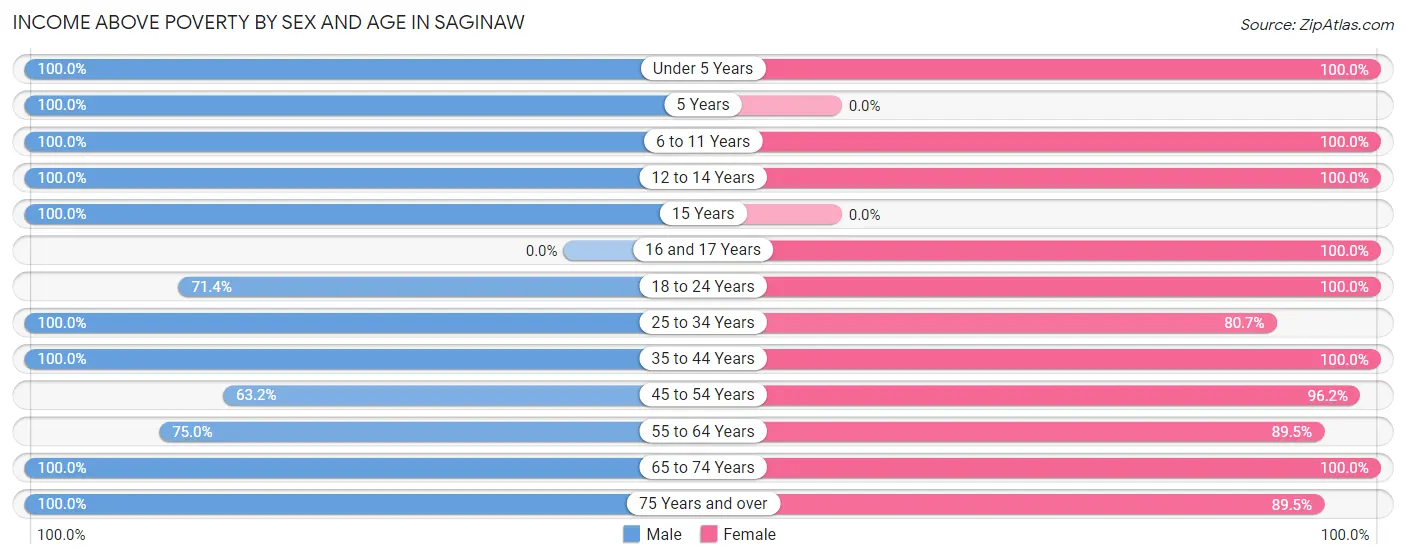
| Age Bracket | Male | Female |
| Under 5 Years | 13 (100.0%) | 6 (100.0%) |
| 5 Years | 2 (100.0%) | 0 (0.0%) |
| 6 to 11 Years | 8 (100.0%) | 12 (100.0%) |
| 12 to 14 Years | 12 (100.0%) | 2 (100.0%) |
| 15 Years | 2 (100.0%) | 0 (0.0%) |
| 16 and 17 Years | 0 (0.0%) | 4 (100.0%) |
| 18 to 24 Years | 5 (71.4%) | 1 (100.0%) |
| 25 to 34 Years | 13 (100.0%) | 25 (80.6%) |
| 35 to 44 Years | 29 (100.0%) | 13 (100.0%) |
| 45 to 54 Years | 12 (63.2%) | 25 (96.2%) |
| 55 to 64 Years | 15 (75.0%) | 17 (89.5%) |
| 65 to 74 Years | 8 (100.0%) | 11 (100.0%) |
| 75 Years and over | 17 (100.0%) | 17 (89.5%) |
| Total | 136 (90.7%) | 133 (92.4%) |
Income Below Poverty Among Married-Couple Families in Saginaw
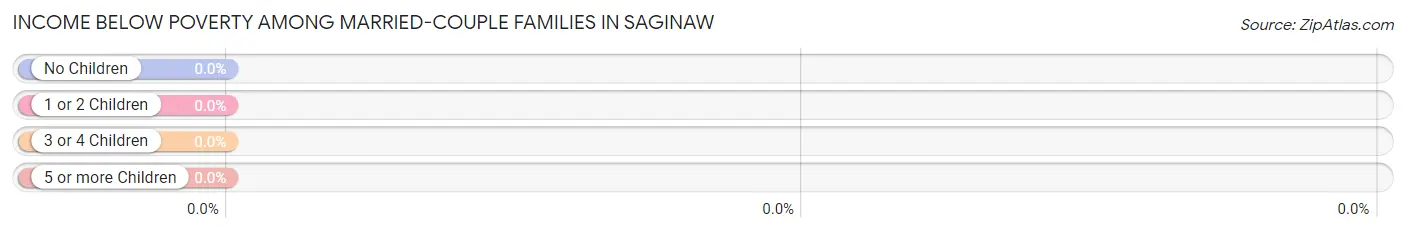
| Children | Above Poverty | Below Poverty |
| No Children | 37 (100.0%) | 0 (0.0%) |
| 1 or 2 Children | 21 (100.0%) | 0 (0.0%) |
| 3 or 4 Children | 9 (100.0%) | 0 (0.0%) |
| 5 or more Children | 0 (0.0%) | 0 (0.0%) |
| Total | 67 (100.0%) | 0 (0.0%) |
Income Below Poverty Among Single-Parent Households in Saginaw
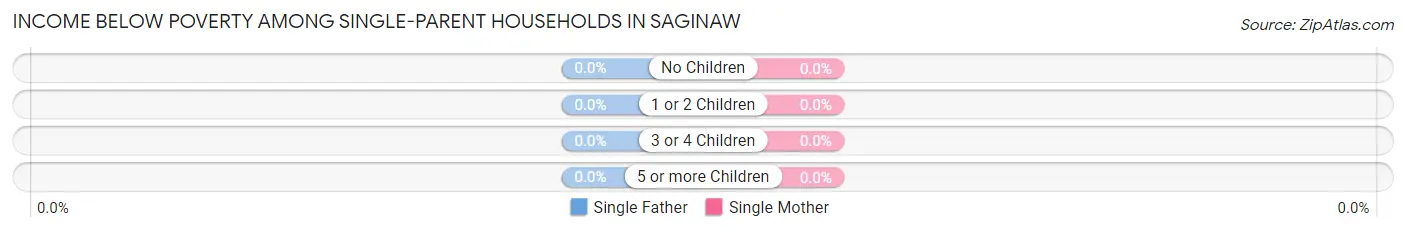
| Children | Single Father | Single Mother |
| No Children | 0 (0.0%) | 0 (0.0%) |
| 1 or 2 Children | 0 (0.0%) | 0 (0.0%) |
| 3 or 4 Children | 0 (0.0%) | 0 (0.0%) |
| 5 or more Children | 0 (0.0%) | 0 (0.0%) |
| Total | 0 (0.0%) | 0 (0.0%) |
Income Below Poverty Among Married-Couple vs Single-Parent Households in Saginaw
| Children | Married-Couple Families | Single-Parent Households |
| No Children | 0 (0.0%) | 0 (0.0%) |
| 1 or 2 Children | 0 (0.0%) | 0 (0.0%) |
| 3 or 4 Children | 0 (0.0%) | 0 (0.0%) |
| 5 or more Children | 0 (0.0%) | 0 (0.0%) |
| Total | 0 (0.0%) | 0 (0.0%) |
Employment Characteristics in Saginaw
Employment by Class of Employer in Saginaw
Among the 124 employed individuals in Saginaw, private company employees (85 | 68.5%), self-employed (not incorporated) (13 | 10.5%), and not-for-profit organizations (11 | 8.9%) make up the most common classes of employment.
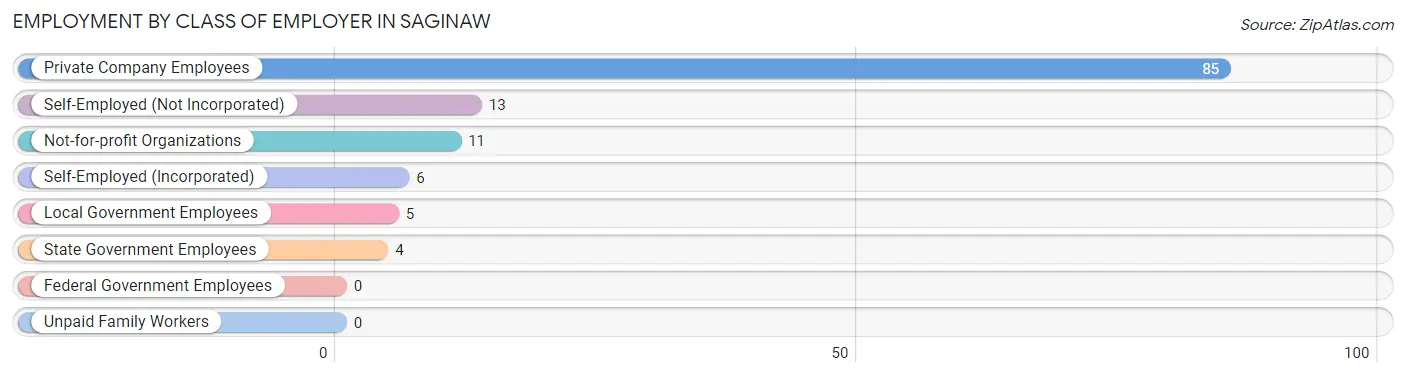
| Employer Class | # Employees | % Employees |
| Private Company Employees | 85 | 68.5% |
| Self-Employed (Incorporated) | 6 | 4.8% |
| Self-Employed (Not Incorporated) | 13 | 10.5% |
| Not-for-profit Organizations | 11 | 8.9% |
| Local Government Employees | 5 | 4.0% |
| State Government Employees | 4 | 3.2% |
| Federal Government Employees | 0 | 0.0% |
| Unpaid Family Workers | 0 | 0.0% |
| Total | 124 | 100.0% |
Employment Status by Age in Saginaw
According to the labor force statistics for Saginaw, out of the total population over 16 years of age (237), 54.4% or 129 individuals are in the labor force, with 2.3% or 3 of them unemployed. The age group with the highest labor force participation rate is 35 to 44 years, with 95.2% or 40 individuals in the labor force. Within the labor force, the 16 to 19 years age range has the highest percentage of unemployed individuals, with 60.0% or 3 of them being unemployed.
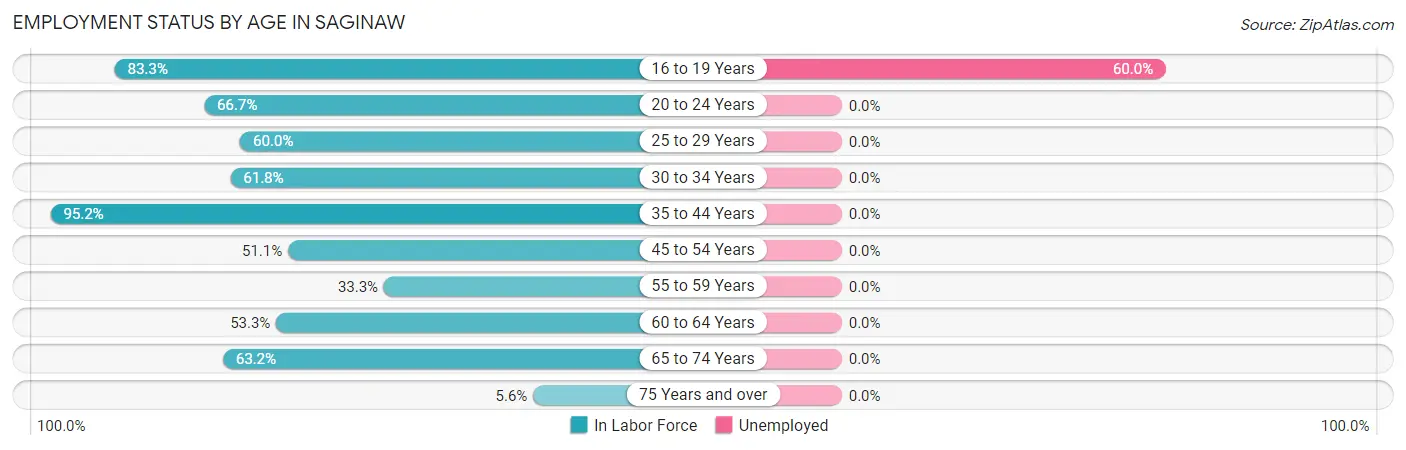
| Age Bracket | In Labor Force | Unemployed |
| 16 to 19 Years | 5 (83.3%) | 3 (60.0%) |
| 20 to 24 Years | 4 (66.7%) | 0 (0.0%) |
| 25 to 29 Years | 6 (60.0%) | 0 (0.0%) |
| 30 to 34 Years | 21 (61.8%) | 0 (0.0%) |
| 35 to 44 Years | 40 (95.2%) | 0 (0.0%) |
| 45 to 54 Years | 23 (51.1%) | 0 (0.0%) |
| 55 to 59 Years | 8 (33.3%) | 0 (0.0%) |
| 60 to 64 Years | 8 (53.3%) | 0 (0.0%) |
| 65 to 74 Years | 12 (63.2%) | 0 (0.0%) |
| 75 Years and over | 2 (5.6%) | 0 (0.0%) |
| Total | 129 (54.4%) | 3 (2.3%) |
Employment Status by Educational Attainment in Saginaw
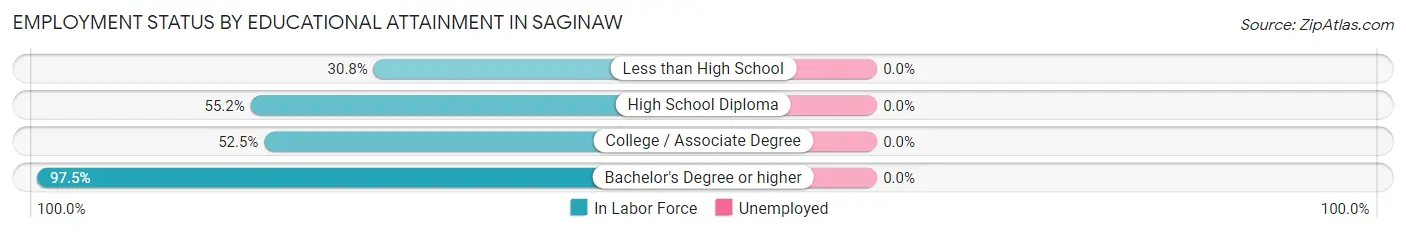
| Educational Attainment | In Labor Force | Unemployed |
| Less than High School | 4 (30.8%) | 0 (0.0%) |
| High School Diploma | 32 (55.2%) | 0 (0.0%) |
| College / Associate Degree | 31 (52.5%) | 0 (0.0%) |
| Bachelor's Degree or higher | 39 (97.5%) | 0 (0.0%) |
| Total | 106 (62.4%) | 0 (0.0%) |
Employment Occupations by Sex in Saginaw
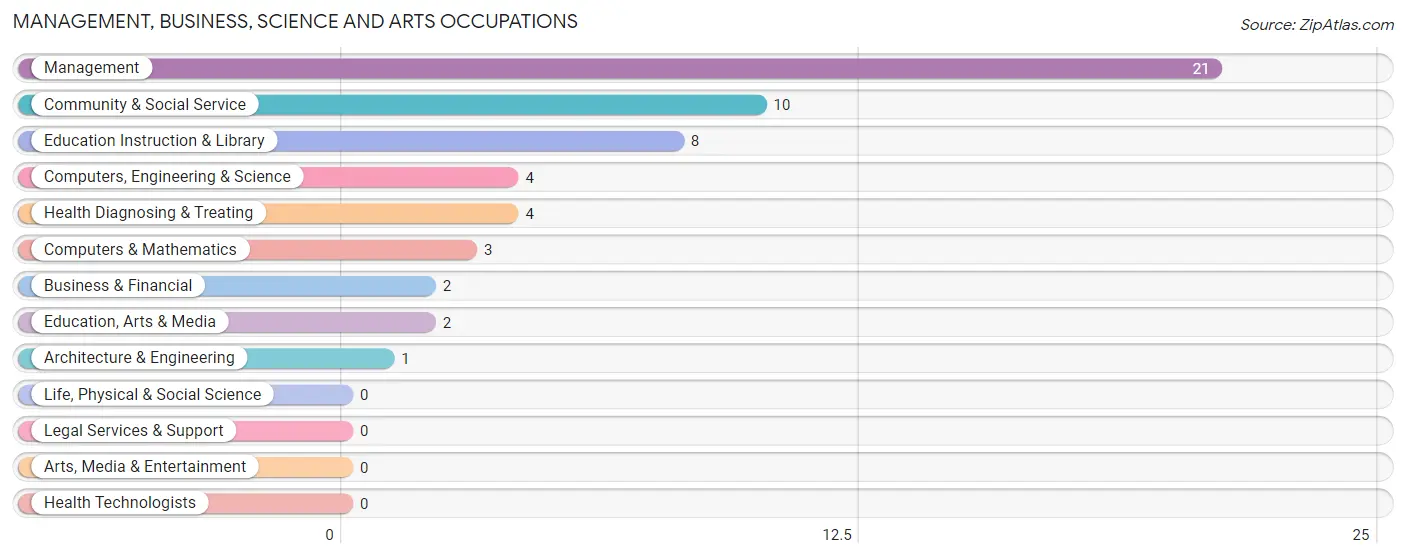
Management, Business, Science and Arts Occupations
The most common Management, Business, Science and Arts occupations in Saginaw are Management (21 | 16.7%), Community & Social Service (10 | 7.9%), Education Instruction & Library (8 | 6.4%), Computers, Engineering & Science (4 | 3.2%), and Health Diagnosing & Treating (4 | 3.2%).
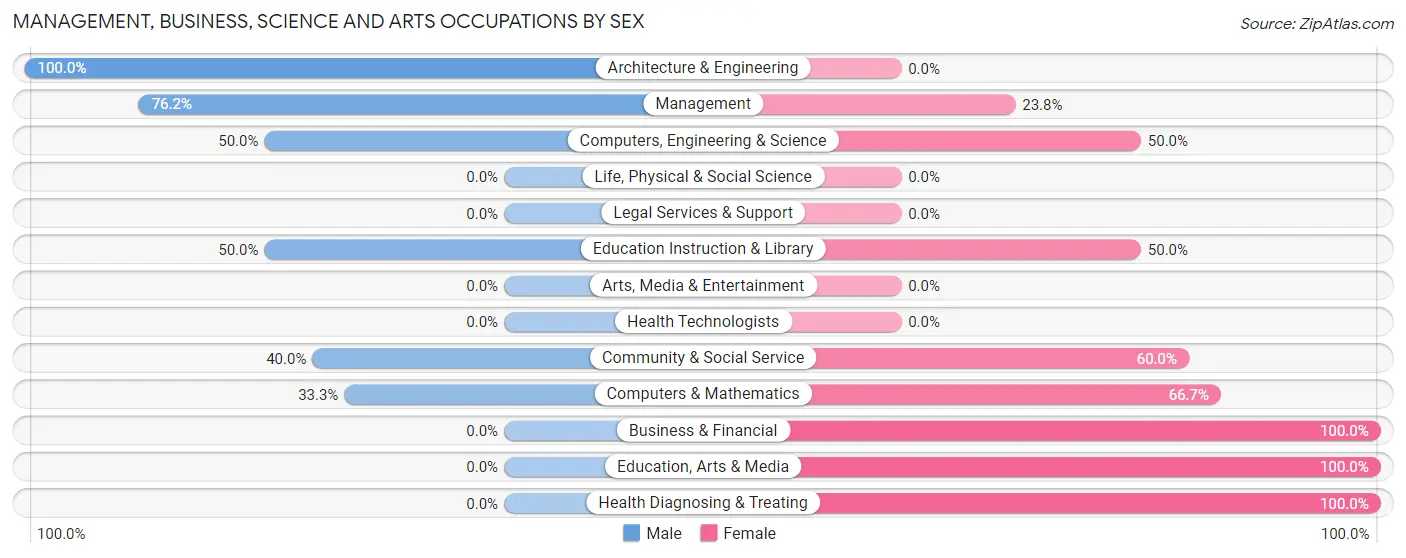
Management, Business, Science and Arts Occupations by Sex
Within the Management, Business, Science and Arts occupations in Saginaw, the most male-oriented occupations are Architecture & Engineering (100.0%), Management (76.2%), and Computers, Engineering & Science (50.0%), while the most female-oriented occupations are Business & Financial (100.0%), Education, Arts & Media (100.0%), and Health Diagnosing & Treating (100.0%).
| Occupation | Male | Female |
| Management | 16 (76.2%) | 5 (23.8%) |
| Business & Financial | 0 (0.0%) | 2 (100.0%) |
| Computers, Engineering & Science | 2 (50.0%) | 2 (50.0%) |
| Computers & Mathematics | 1 (33.3%) | 2 (66.7%) |
| Architecture & Engineering | 1 (100.0%) | 0 (0.0%) |
| Life, Physical & Social Science | 0 (0.0%) | 0 (0.0%) |
| Community & Social Service | 4 (40.0%) | 6 (60.0%) |
| Education, Arts & Media | 0 (0.0%) | 2 (100.0%) |
| Legal Services & Support | 0 (0.0%) | 0 (0.0%) |
| Education Instruction & Library | 4 (50.0%) | 4 (50.0%) |
| Arts, Media & Entertainment | 0 (0.0%) | 0 (0.0%) |
| Health Diagnosing & Treating | 0 (0.0%) | 4 (100.0%) |
| Health Technologists | 0 (0.0%) | 0 (0.0%) |
| Total (Category) | 22 (53.7%) | 19 (46.3%) |
| Total (Overall) | 74 (58.7%) | 52 (41.3%) |
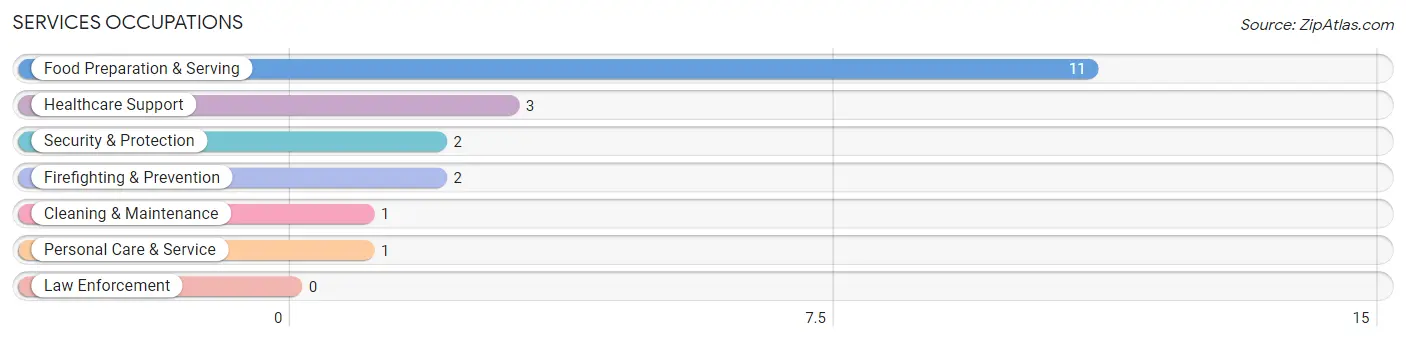
Services Occupations
The most common Services occupations in Saginaw are Food Preparation & Serving (11 | 8.7%), Healthcare Support (3 | 2.4%), Security & Protection (2 | 1.6%), Firefighting & Prevention (2 | 1.6%), and Cleaning & Maintenance (1 | 0.8%).
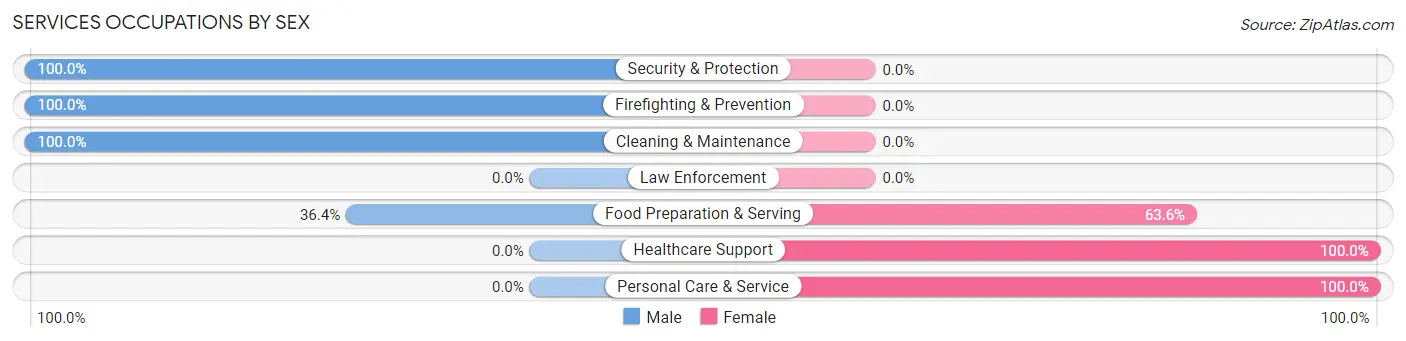
Services Occupations by Sex
Within the Services occupations in Saginaw, the most male-oriented occupations are Security & Protection (100.0%), Firefighting & Prevention (100.0%), and Cleaning & Maintenance (100.0%), while the most female-oriented occupations are Healthcare Support (100.0%), Personal Care & Service (100.0%), and Food Preparation & Serving (63.6%).
| Occupation | Male | Female |
| Healthcare Support | 0 (0.0%) | 3 (100.0%) |
| Security & Protection | 2 (100.0%) | 0 (0.0%) |
| Firefighting & Prevention | 2 (100.0%) | 0 (0.0%) |
| Law Enforcement | 0 (0.0%) | 0 (0.0%) |
| Food Preparation & Serving | 4 (36.4%) | 7 (63.6%) |
| Cleaning & Maintenance | 1 (100.0%) | 0 (0.0%) |
| Personal Care & Service | 0 (0.0%) | 1 (100.0%) |
| Total (Category) | 7 (38.9%) | 11 (61.1%) |
| Total (Overall) | 74 (58.7%) | 52 (41.3%) |
Sales and Office Occupations
The most common Sales and Office occupations in Saginaw are Office & Administration (24 | 19.1%), and Sales & Related (3 | 2.4%).
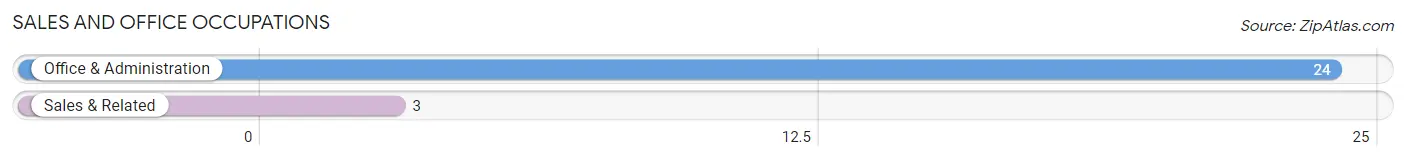
Sales and Office Occupations by Sex

| Occupation | Male | Female |
| Sales & Related | 3 (100.0%) | 0 (0.0%) |
| Office & Administration | 9 (37.5%) | 15 (62.5%) |
| Total (Category) | 12 (44.4%) | 15 (55.6%) |
| Total (Overall) | 74 (58.7%) | 52 (41.3%) |
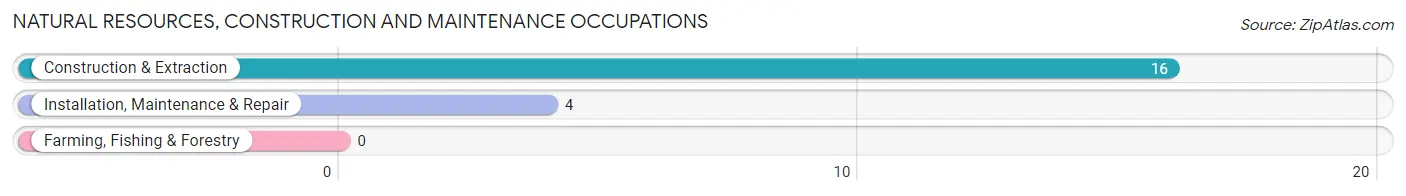
Natural Resources, Construction and Maintenance Occupations
The most common Natural Resources, Construction and Maintenance occupations in Saginaw are Construction & Extraction (16 | 12.7%), and Installation, Maintenance & Repair (4 | 3.2%).
Natural Resources, Construction and Maintenance Occupations by Sex
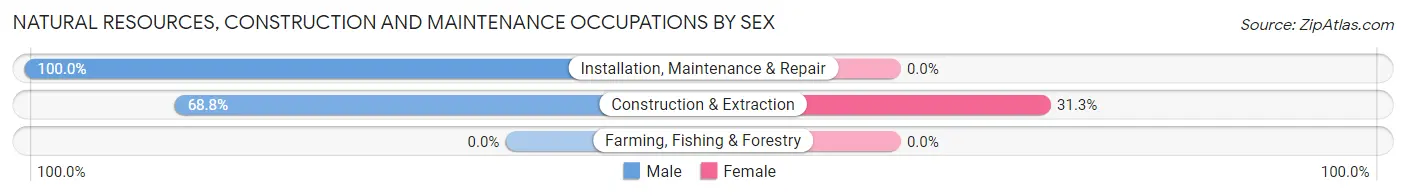
| Occupation | Male | Female |
| Farming, Fishing & Forestry | 0 (0.0%) | 0 (0.0%) |
| Construction & Extraction | 11 (68.8%) | 5 (31.2%) |
| Installation, Maintenance & Repair | 4 (100.0%) | 0 (0.0%) |
| Total (Category) | 15 (75.0%) | 5 (25.0%) |
| Total (Overall) | 74 (58.7%) | 52 (41.3%) |
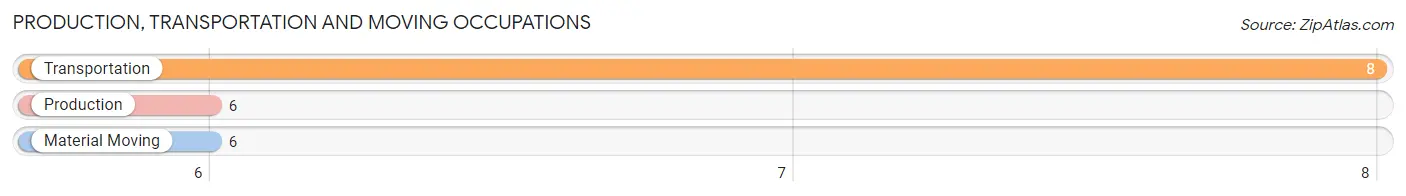
Production, Transportation and Moving Occupations
The most common Production, Transportation and Moving occupations in Saginaw are Transportation (8 | 6.4%), Production (6 | 4.8%), and Material Moving (6 | 4.8%).
Production, Transportation and Moving Occupations by Sex
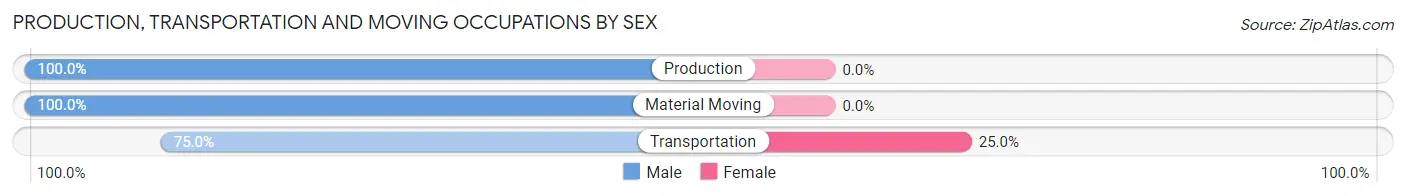
| Occupation | Male | Female |
| Production | 6 (100.0%) | 0 (0.0%) |
| Transportation | 6 (75.0%) | 2 (25.0%) |
| Material Moving | 6 (100.0%) | 0 (0.0%) |
| Total (Category) | 18 (90.0%) | 2 (10.0%) |
| Total (Overall) | 74 (58.7%) | 52 (41.3%) |
Employment Industries by Sex in Saginaw
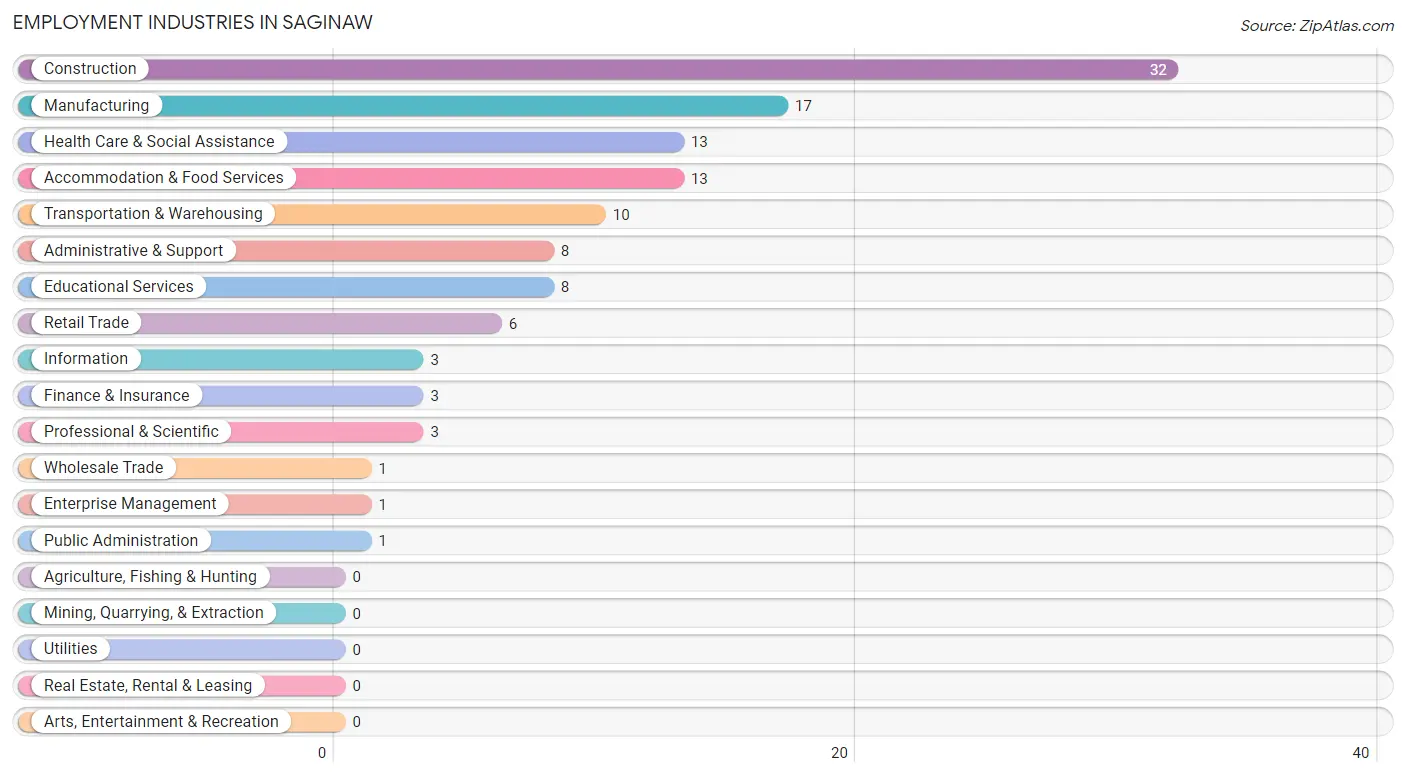
Employment Industries in Saginaw
The major employment industries in Saginaw include Construction (32 | 25.4%), Manufacturing (17 | 13.5%), Health Care & Social Assistance (13 | 10.3%), Accommodation & Food Services (13 | 10.3%), and Transportation & Warehousing (10 | 7.9%).
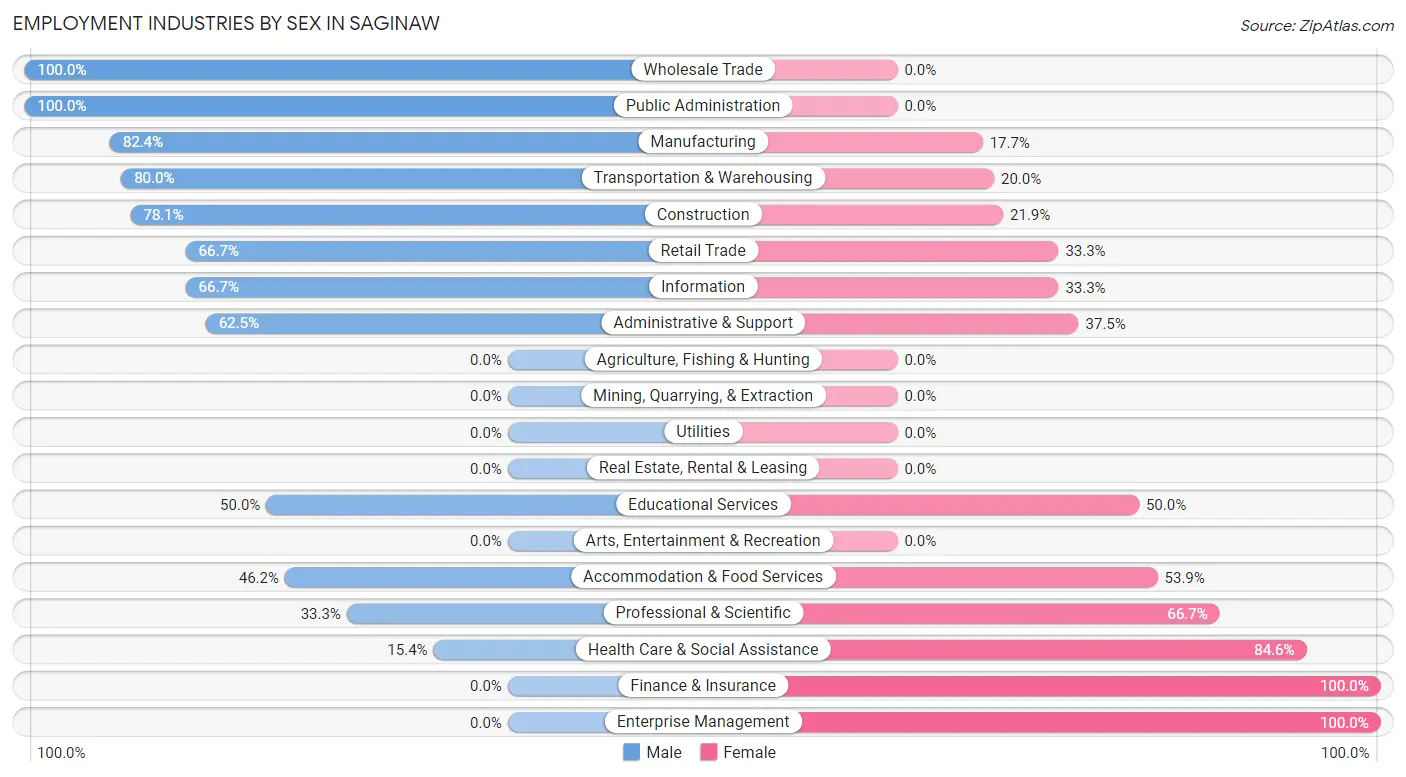
Employment Industries by Sex in Saginaw
The Saginaw industries that see more men than women are Wholesale Trade (100.0%), Public Administration (100.0%), and Manufacturing (82.4%), whereas the industries that tend to have a higher number of women are Finance & Insurance (100.0%), Enterprise Management (100.0%), and Health Care & Social Assistance (84.6%).
| Industry | Male | Female |
| Agriculture, Fishing & Hunting | 0 (0.0%) | 0 (0.0%) |
| Mining, Quarrying, & Extraction | 0 (0.0%) | 0 (0.0%) |
| Construction | 25 (78.1%) | 7 (21.9%) |
| Manufacturing | 14 (82.4%) | 3 (17.6%) |
| Wholesale Trade | 1 (100.0%) | 0 (0.0%) |
| Retail Trade | 4 (66.7%) | 2 (33.3%) |
| Transportation & Warehousing | 8 (80.0%) | 2 (20.0%) |
| Utilities | 0 (0.0%) | 0 (0.0%) |
| Information | 2 (66.7%) | 1 (33.3%) |
| Finance & Insurance | 0 (0.0%) | 3 (100.0%) |
| Real Estate, Rental & Leasing | 0 (0.0%) | 0 (0.0%) |
| Professional & Scientific | 1 (33.3%) | 2 (66.7%) |
| Enterprise Management | 0 (0.0%) | 1 (100.0%) |
| Administrative & Support | 5 (62.5%) | 3 (37.5%) |
| Educational Services | 4 (50.0%) | 4 (50.0%) |
| Health Care & Social Assistance | 2 (15.4%) | 11 (84.6%) |
| Arts, Entertainment & Recreation | 0 (0.0%) | 0 (0.0%) |
| Accommodation & Food Services | 6 (46.2%) | 7 (53.8%) |
| Public Administration | 1 (100.0%) | 0 (0.0%) |
| Total | 74 (58.7%) | 52 (41.3%) |
Education in Saginaw
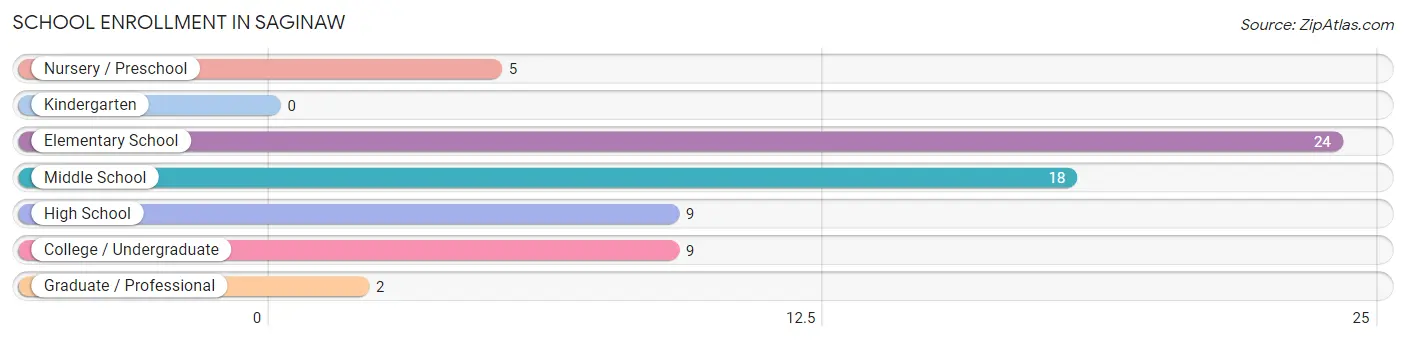
School Enrollment in Saginaw
The most common levels of schooling among the 67 students in Saginaw are elementary school (24 | 35.8%), middle school (18 | 26.9%), and high school (9 | 13.4%).
| School Level | # Students | % Students |
| Nursery / Preschool | 5 | 7.5% |
| Kindergarten | 0 | 0.0% |
| Elementary School | 24 | 35.8% |
| Middle School | 18 | 26.9% |
| High School | 9 | 13.4% |
| College / Undergraduate | 9 | 13.4% |
| Graduate / Professional | 2 | 3.0% |
| Total | 67 | 100.0% |
School Enrollment by Age by Funding Source in Saginaw
Out of a total of 67 students who are enrolled in schools in Saginaw, 14 (20.9%) attend a private institution, while the remaining 53 (79.1%) are enrolled in public schools. The age group of 35 years and over has the highest likelihood of being enrolled in private schools, with 2 (100.0% in the age bracket) enrolled. Conversely, the age group of 3 to 4 year olds has the lowest likelihood of being enrolled in a private school, with 3 (100.0% in the age bracket) attending a public institution.
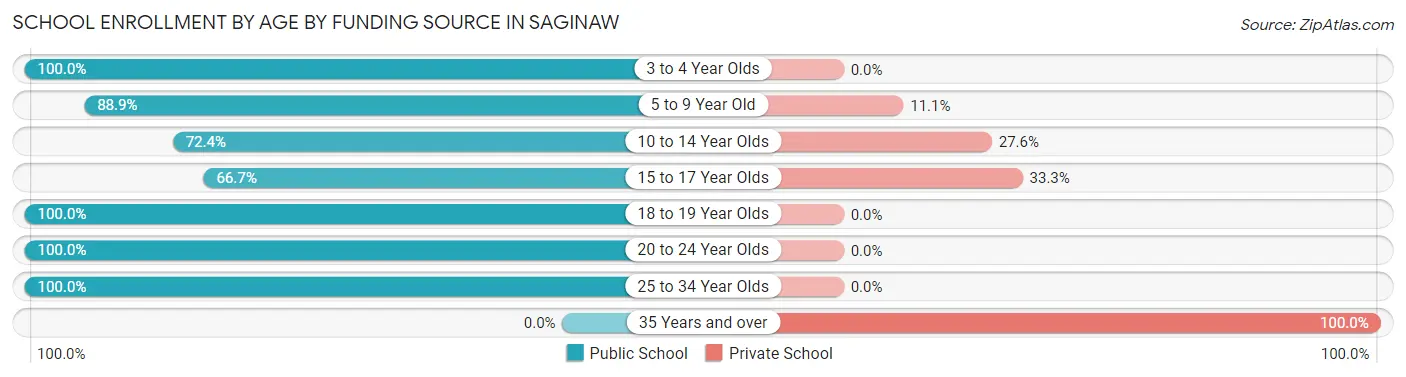
| Age Bracket | Public School | Private School |
| 3 to 4 Year Olds | 3 (100.0%) | 0 (0.0%) |
| 5 to 9 Year Old | 16 (88.9%) | 2 (11.1%) |
| 10 to 14 Year Olds | 21 (72.4%) | 8 (27.6%) |
| 15 to 17 Year Olds | 4 (66.7%) | 2 (33.3%) |
| 18 to 19 Year Olds | 2 (100.0%) | 0 (0.0%) |
| 20 to 24 Year Olds | 1 (100.0%) | 0 (0.0%) |
| 25 to 34 Year Olds | 6 (100.0%) | 0 (0.0%) |
| 35 Years and over | 0 (0.0%) | 2 (100.0%) |
| Total | 53 (79.1%) | 14 (20.9%) |
Educational Attainment by Field of Study in Saginaw
Education (16 | 25.8%), business (14 | 22.6%), bio, nature & agricultural (6 | 9.7%), computers & mathematics (5 | 8.1%), and visual & performing arts (5 | 8.1%) are the most common fields of study among 62 individuals in Saginaw who have obtained a bachelor's degree or higher.
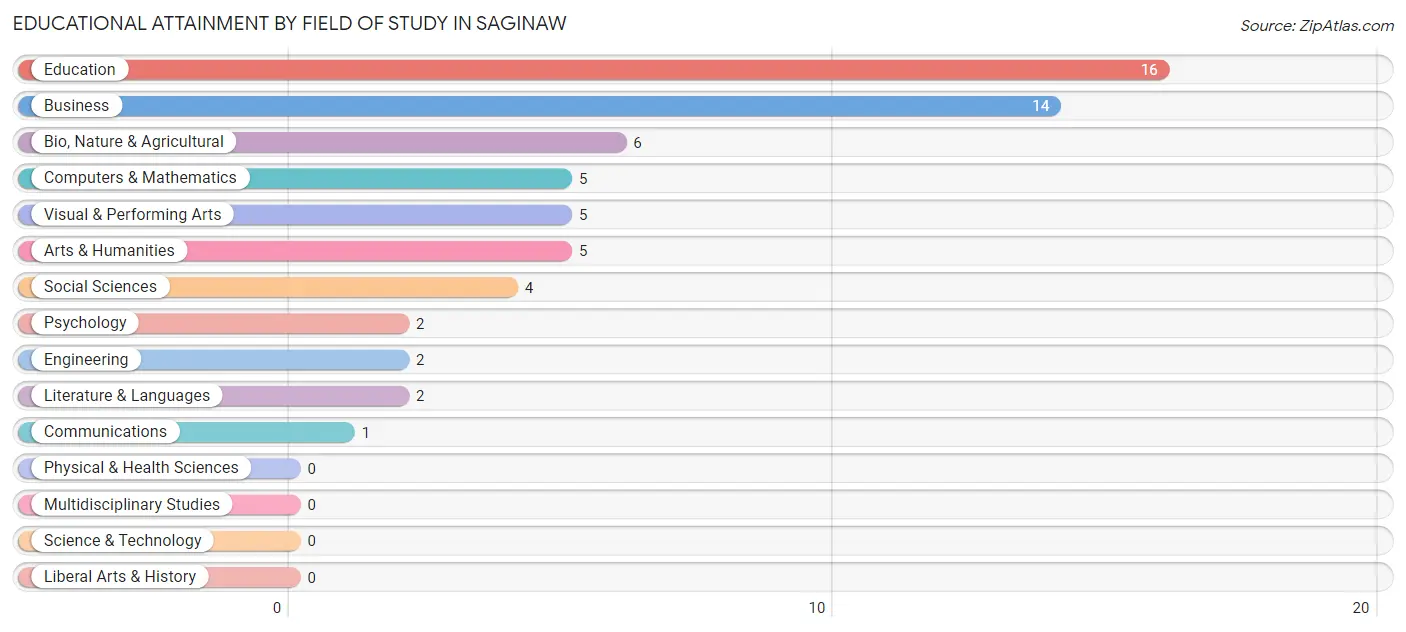
| Field of Study | # Graduates | % Graduates |
| Computers & Mathematics | 5 | 8.1% |
| Bio, Nature & Agricultural | 6 | 9.7% |
| Physical & Health Sciences | 0 | 0.0% |
| Psychology | 2 | 3.2% |
| Social Sciences | 4 | 6.5% |
| Engineering | 2 | 3.2% |
| Multidisciplinary Studies | 0 | 0.0% |
| Science & Technology | 0 | 0.0% |
| Business | 14 | 22.6% |
| Education | 16 | 25.8% |
| Literature & Languages | 2 | 3.2% |
| Liberal Arts & History | 0 | 0.0% |
| Visual & Performing Arts | 5 | 8.1% |
| Communications | 1 | 1.6% |
| Arts & Humanities | 5 | 8.1% |
| Total | 62 | 100.0% |
Transportation & Commute in Saginaw
Vehicle Availability by Sex in Saginaw
The most prevalent vehicle ownership categories in Saginaw are males with 2 vehicles (36, accounting for 50.0%) and females with 2 vehicles (26, making up 69.2%).
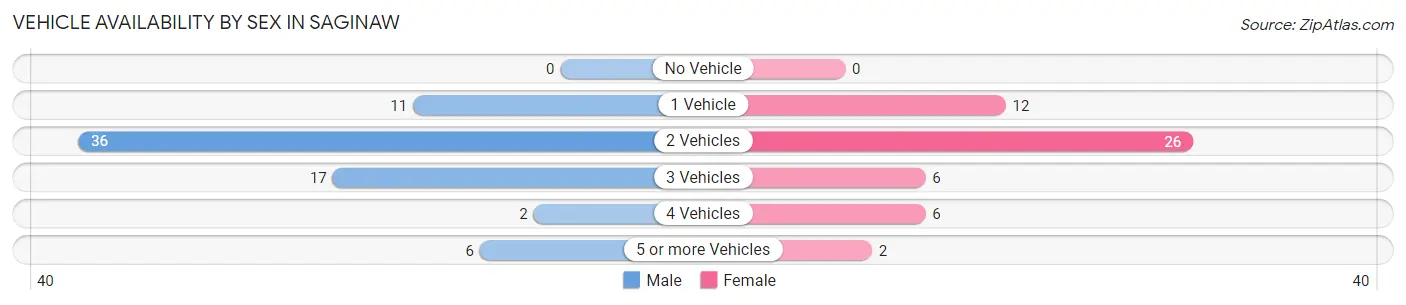
| Vehicles Available | Male | Female |
| No Vehicle | 0 (0.0%) | 0 (0.0%) |
| 1 Vehicle | 11 (15.3%) | 12 (23.1%) |
| 2 Vehicles | 36 (50.0%) | 26 (50.0%) |
| 3 Vehicles | 17 (23.6%) | 6 (11.5%) |
| 4 Vehicles | 2 (2.8%) | 6 (11.5%) |
| 5 or more Vehicles | 6 (8.3%) | 2 (3.8%) |
| Total | 72 (100.0%) | 52 (100.0%) |
Commute Time in Saginaw
The most frequently occuring commute durations in Saginaw are 15 to 19 minutes (35 commuters, 30.7%), 10 to 14 minutes (17 commuters, 14.9%), and 25 to 29 minutes (16 commuters, 14.0%).
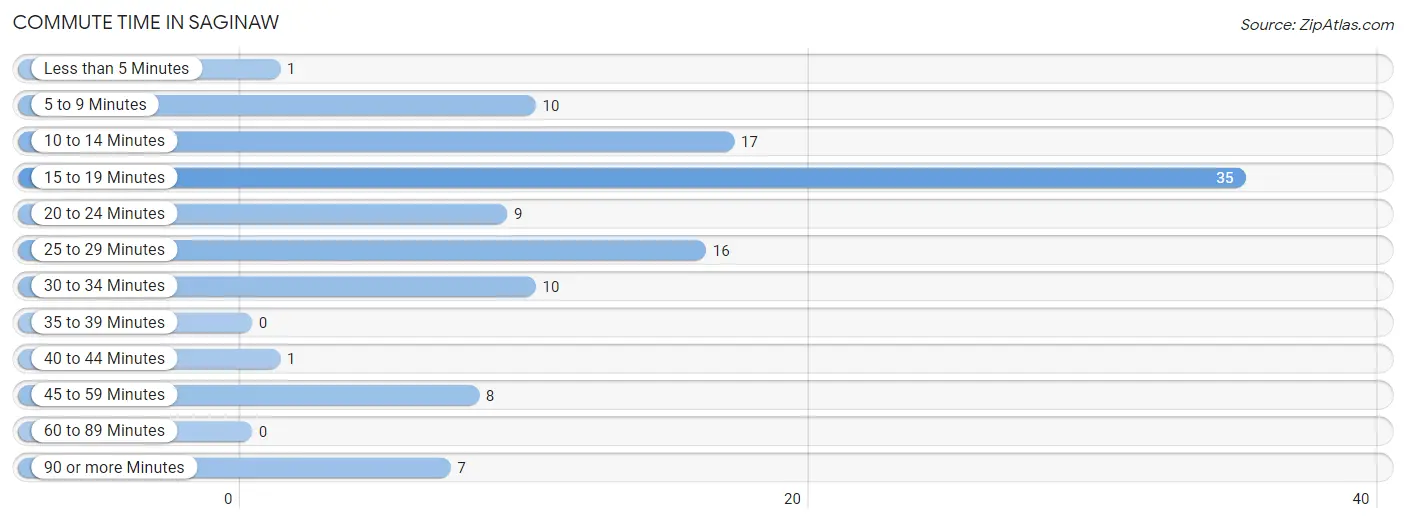
| Commute Time | # Commuters | % Commuters |
| Less than 5 Minutes | 1 | 0.9% |
| 5 to 9 Minutes | 10 | 8.8% |
| 10 to 14 Minutes | 17 | 14.9% |
| 15 to 19 Minutes | 35 | 30.7% |
| 20 to 24 Minutes | 9 | 7.9% |
| 25 to 29 Minutes | 16 | 14.0% |
| 30 to 34 Minutes | 10 | 8.8% |
| 35 to 39 Minutes | 0 | 0.0% |
| 40 to 44 Minutes | 1 | 0.9% |
| 45 to 59 Minutes | 8 | 7.0% |
| 60 to 89 Minutes | 0 | 0.0% |
| 90 or more Minutes | 7 | 6.1% |
Commute Time by Sex in Saginaw
The most common commute times in Saginaw are 15 to 19 minutes (21 commuters, 30.9%) for males and 15 to 19 minutes (14 commuters, 30.4%) for females.
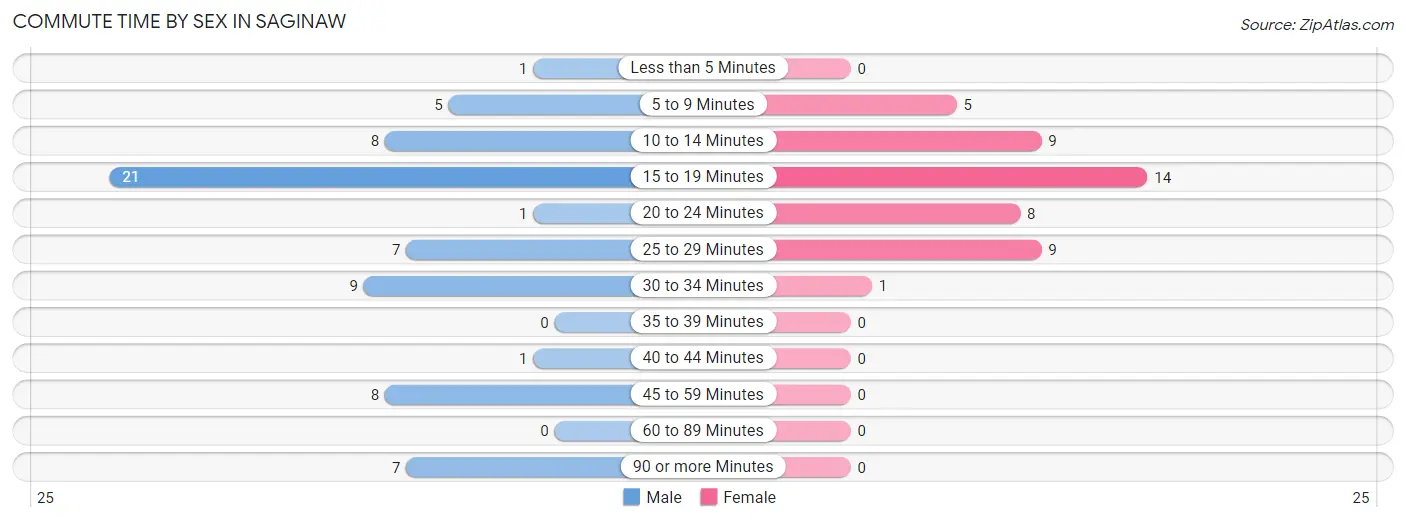
| Commute Time | Male | Female |
| Less than 5 Minutes | 1 (1.5%) | 0 (0.0%) |
| 5 to 9 Minutes | 5 (7.3%) | 5 (10.9%) |
| 10 to 14 Minutes | 8 (11.8%) | 9 (19.6%) |
| 15 to 19 Minutes | 21 (30.9%) | 14 (30.4%) |
| 20 to 24 Minutes | 1 (1.5%) | 8 (17.4%) |
| 25 to 29 Minutes | 7 (10.3%) | 9 (19.6%) |
| 30 to 34 Minutes | 9 (13.2%) | 1 (2.2%) |
| 35 to 39 Minutes | 0 (0.0%) | 0 (0.0%) |
| 40 to 44 Minutes | 1 (1.5%) | 0 (0.0%) |
| 45 to 59 Minutes | 8 (11.8%) | 0 (0.0%) |
| 60 to 89 Minutes | 0 (0.0%) | 0 (0.0%) |
| 90 or more Minutes | 7 (10.3%) | 0 (0.0%) |
Time of Departure to Work by Sex in Saginaw
The most frequent times of departure to work in Saginaw are 7:00 AM to 7:29 AM (29, 42.6%) for males and 7:30 AM to 7:59 AM (13, 28.3%) for females.
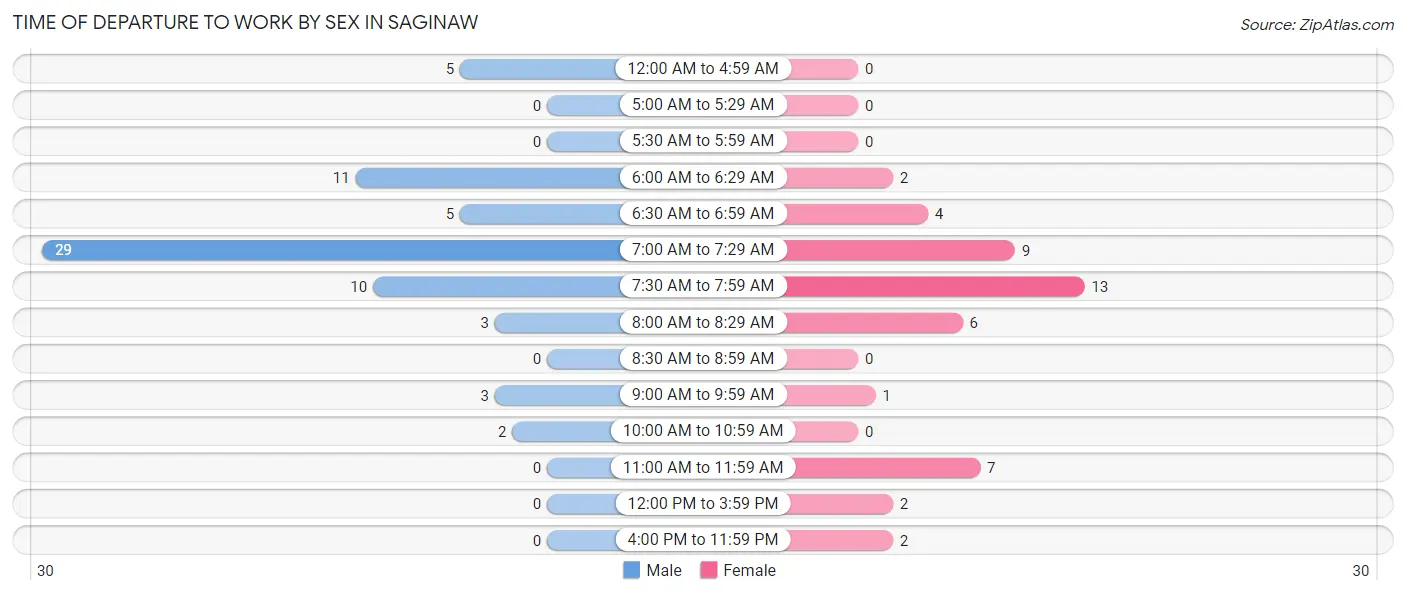
| Time of Departure | Male | Female |
| 12:00 AM to 4:59 AM | 5 (7.3%) | 0 (0.0%) |
| 5:00 AM to 5:29 AM | 0 (0.0%) | 0 (0.0%) |
| 5:30 AM to 5:59 AM | 0 (0.0%) | 0 (0.0%) |
| 6:00 AM to 6:29 AM | 11 (16.2%) | 2 (4.3%) |
| 6:30 AM to 6:59 AM | 5 (7.3%) | 4 (8.7%) |
| 7:00 AM to 7:29 AM | 29 (42.6%) | 9 (19.6%) |
| 7:30 AM to 7:59 AM | 10 (14.7%) | 13 (28.3%) |
| 8:00 AM to 8:29 AM | 3 (4.4%) | 6 (13.0%) |
| 8:30 AM to 8:59 AM | 0 (0.0%) | 0 (0.0%) |
| 9:00 AM to 9:59 AM | 3 (4.4%) | 1 (2.2%) |
| 10:00 AM to 10:59 AM | 2 (2.9%) | 0 (0.0%) |
| 11:00 AM to 11:59 AM | 0 (0.0%) | 7 (15.2%) |
| 12:00 PM to 3:59 PM | 0 (0.0%) | 2 (4.3%) |
| 4:00 PM to 11:59 PM | 0 (0.0%) | 2 (4.3%) |
| Total | 68 (100.0%) | 46 (100.0%) |
Housing Occupancy in Saginaw
Occupancy by Ownership in Saginaw
Of the total 123 dwellings in Saginaw, owner-occupied units account for 99 (80.5%), while renter-occupied units make up 24 (19.5%).
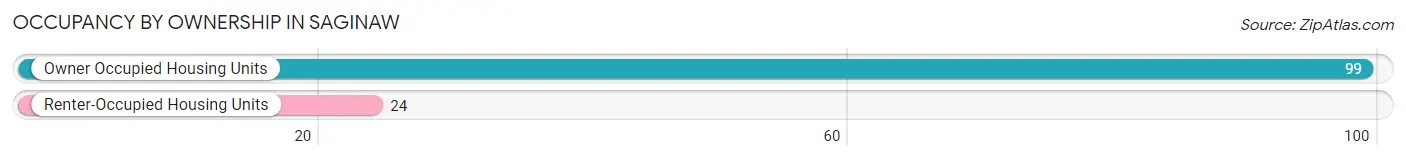
| Occupancy | # Housing Units | % Housing Units |
| Owner Occupied Housing Units | 99 | 80.5% |
| Renter-Occupied Housing Units | 24 | 19.5% |
| Total Occupied Housing Units | 123 | 100.0% |
Occupancy by Household Size in Saginaw
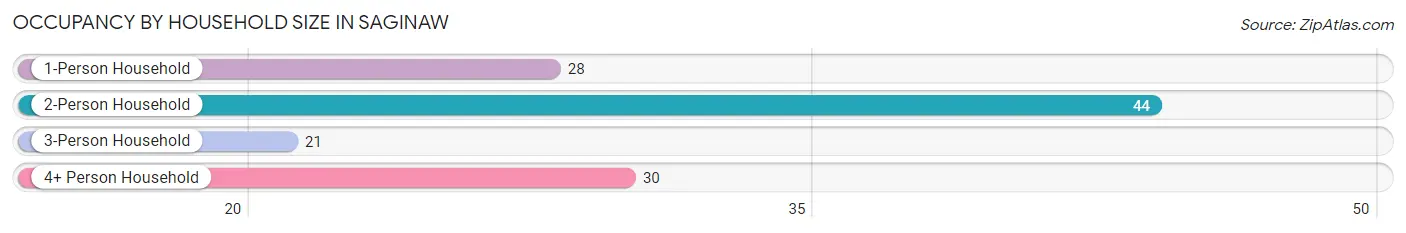
| Household Size | # Housing Units | % Housing Units |
| 1-Person Household | 28 | 22.8% |
| 2-Person Household | 44 | 35.8% |
| 3-Person Household | 21 | 17.1% |
| 4+ Person Household | 30 | 24.4% |
| Total Housing Units | 123 | 100.0% |
Occupancy by Ownership by Household Size in Saginaw
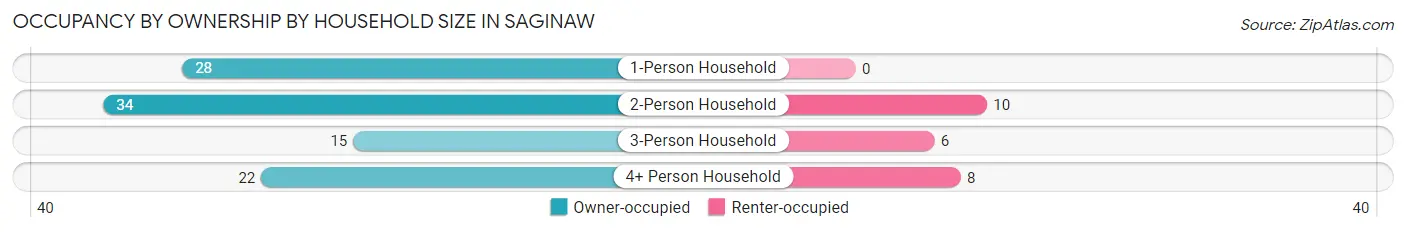
| Household Size | Owner-occupied | Renter-occupied |
| 1-Person Household | 28 (100.0%) | 0 (0.0%) |
| 2-Person Household | 34 (77.3%) | 10 (22.7%) |
| 3-Person Household | 15 (71.4%) | 6 (28.6%) |
| 4+ Person Household | 22 (73.3%) | 8 (26.7%) |
| Total Housing Units | 99 (80.5%) | 24 (19.5%) |
Occupancy by Educational Attainment in Saginaw
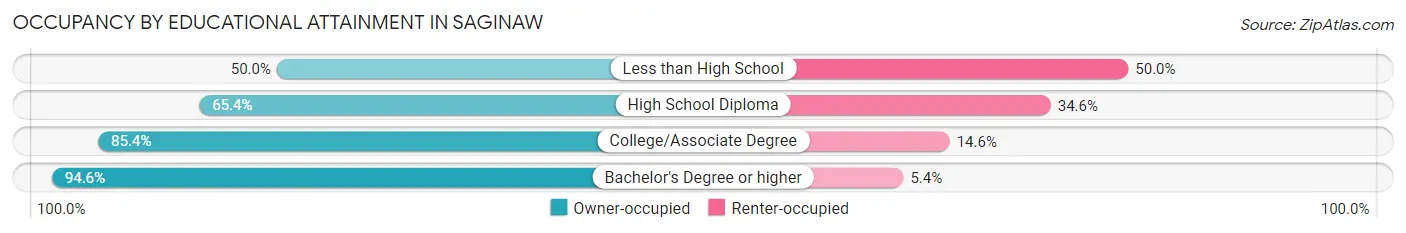
| Household Size | Owner-occupied | Renter-occupied |
| Less than High School | 6 (50.0%) | 6 (50.0%) |
| High School Diploma | 17 (65.4%) | 9 (34.6%) |
| College/Associate Degree | 41 (85.4%) | 7 (14.6%) |
| Bachelor's Degree or higher | 35 (94.6%) | 2 (5.4%) |
Occupancy by Age of Householder in Saginaw
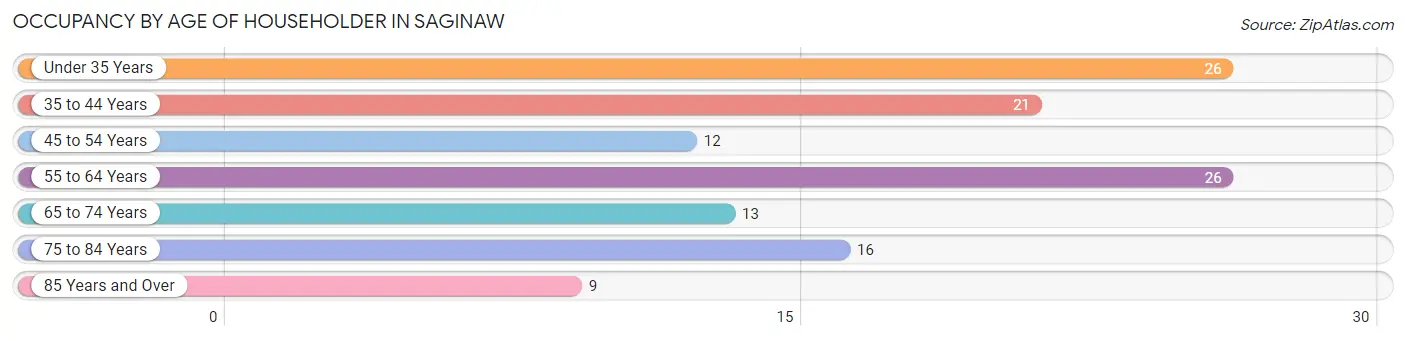
| Age Bracket | # Households | % Households |
| Under 35 Years | 26 | 21.1% |
| 35 to 44 Years | 21 | 17.1% |
| 45 to 54 Years | 12 | 9.8% |
| 55 to 64 Years | 26 | 21.1% |
| 65 to 74 Years | 13 | 10.6% |
| 75 to 84 Years | 16 | 13.0% |
| 85 Years and Over | 9 | 7.3% |
| Total | 123 | 100.0% |
Housing Finances in Saginaw
Median Income by Occupancy in Saginaw
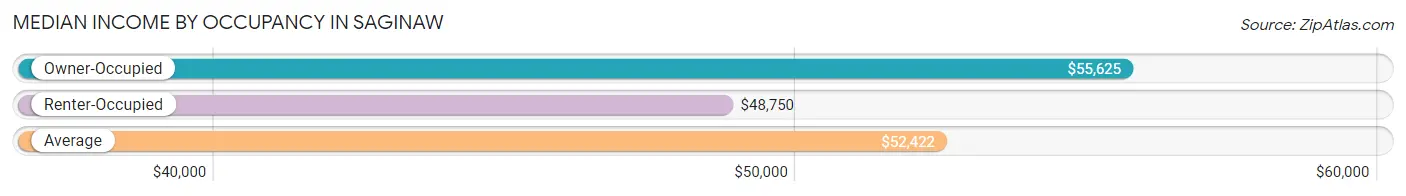
| Occupancy Type | # Households | Median Income |
| Owner-Occupied | 99 (80.5%) | $55,625 |
| Renter-Occupied | 24 (19.5%) | $48,750 |
| Average | 123 (100.0%) | $52,422 |
Occupancy by Householder Income Bracket in Saginaw
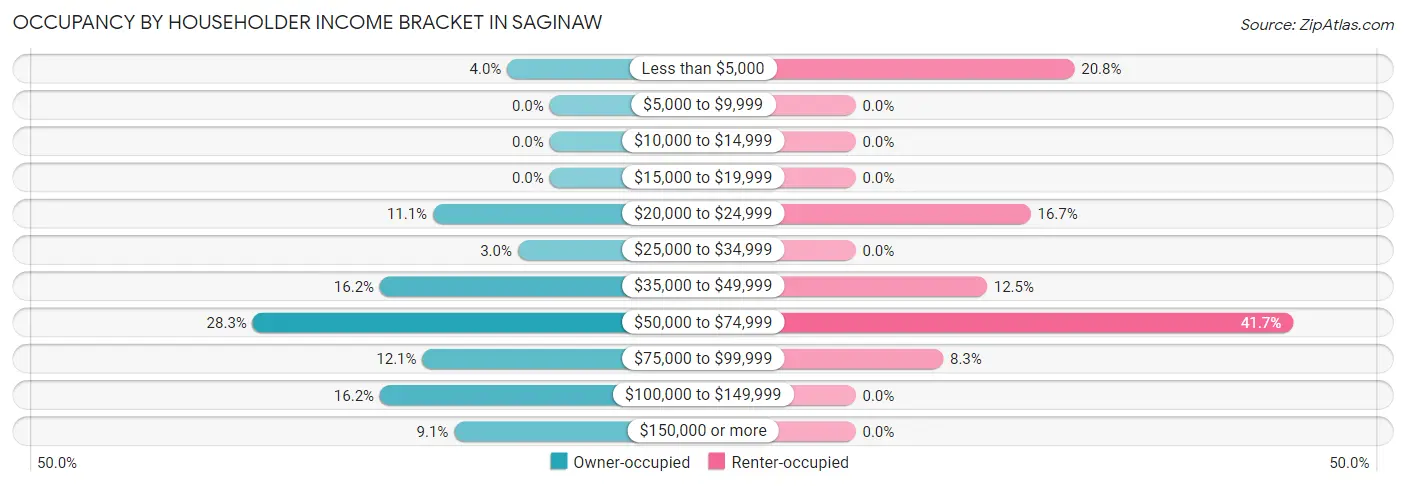
| Income Bracket | Owner-occupied | Renter-occupied |
| Less than $5,000 | 4 (4.0%) | 5 (20.8%) |
| $5,000 to $9,999 | 0 (0.0%) | 0 (0.0%) |
| $10,000 to $14,999 | 0 (0.0%) | 0 (0.0%) |
| $15,000 to $19,999 | 0 (0.0%) | 0 (0.0%) |
| $20,000 to $24,999 | 11 (11.1%) | 4 (16.7%) |
| $25,000 to $34,999 | 3 (3.0%) | 0 (0.0%) |
| $35,000 to $49,999 | 16 (16.2%) | 3 (12.5%) |
| $50,000 to $74,999 | 28 (28.3%) | 10 (41.7%) |
| $75,000 to $99,999 | 12 (12.1%) | 2 (8.3%) |
| $100,000 to $149,999 | 16 (16.2%) | 0 (0.0%) |
| $150,000 or more | 9 (9.1%) | 0 (0.0%) |
| Total | 99 (100.0%) | 24 (100.0%) |
Monthly Housing Cost Tiers in Saginaw
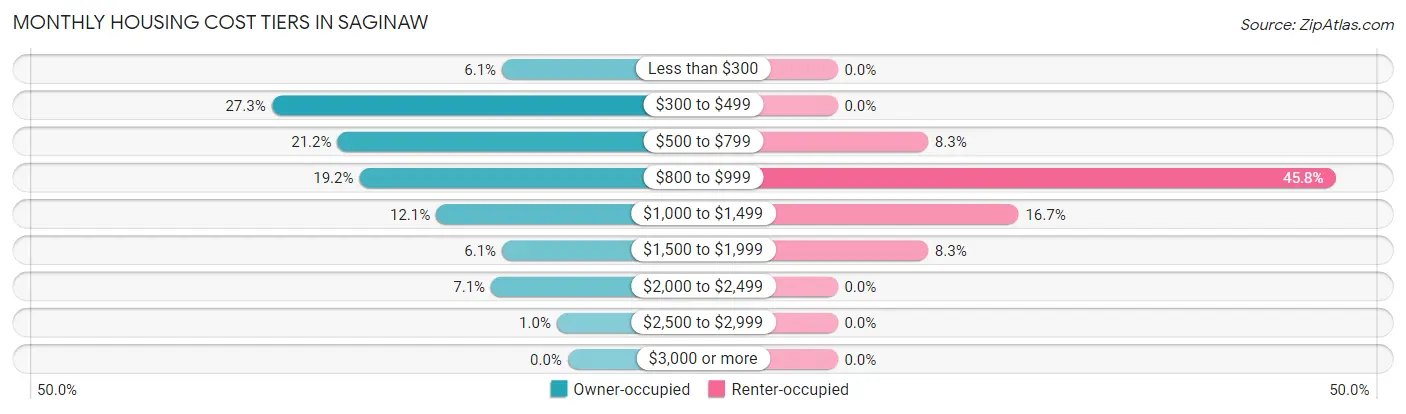
| Monthly Cost | Owner-occupied | Renter-occupied |
| Less than $300 | 6 (6.1%) | 0 (0.0%) |
| $300 to $499 | 27 (27.3%) | 0 (0.0%) |
| $500 to $799 | 21 (21.2%) | 2 (8.3%) |
| $800 to $999 | 19 (19.2%) | 11 (45.8%) |
| $1,000 to $1,499 | 12 (12.1%) | 4 (16.7%) |
| $1,500 to $1,999 | 6 (6.1%) | 2 (8.3%) |
| $2,000 to $2,499 | 7 (7.1%) | 0 (0.0%) |
| $2,500 to $2,999 | 1 (1.0%) | 0 (0.0%) |
| $3,000 or more | 0 (0.0%) | 0 (0.0%) |
| Total | 99 (100.0%) | 24 (100.0%) |
Physical Housing Characteristics in Saginaw
Housing Structures in Saginaw
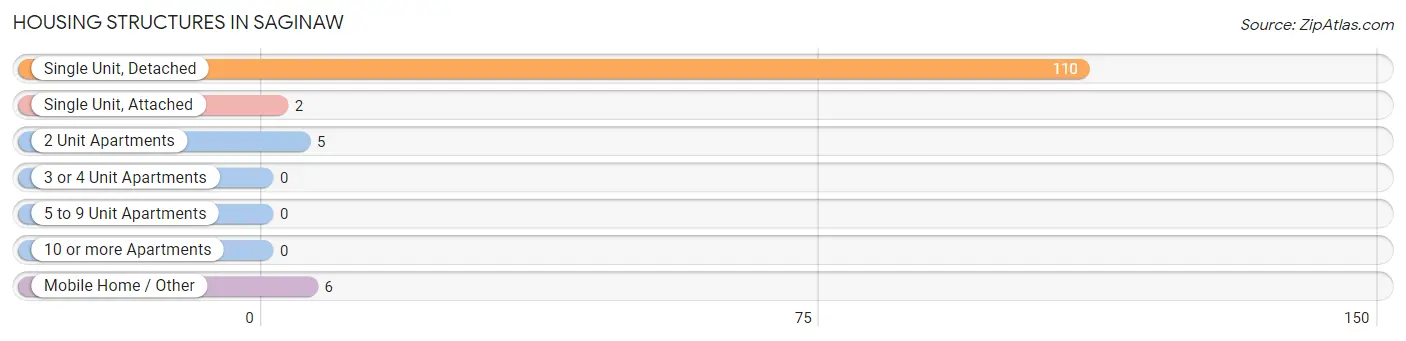
| Structure Type | # Housing Units | % Housing Units |
| Single Unit, Detached | 110 | 89.4% |
| Single Unit, Attached | 2 | 1.6% |
| 2 Unit Apartments | 5 | 4.1% |
| 3 or 4 Unit Apartments | 0 | 0.0% |
| 5 to 9 Unit Apartments | 0 | 0.0% |
| 10 or more Apartments | 0 | 0.0% |
| Mobile Home / Other | 6 | 4.9% |
| Total | 123 | 100.0% |
Housing Structures by Occupancy in Saginaw
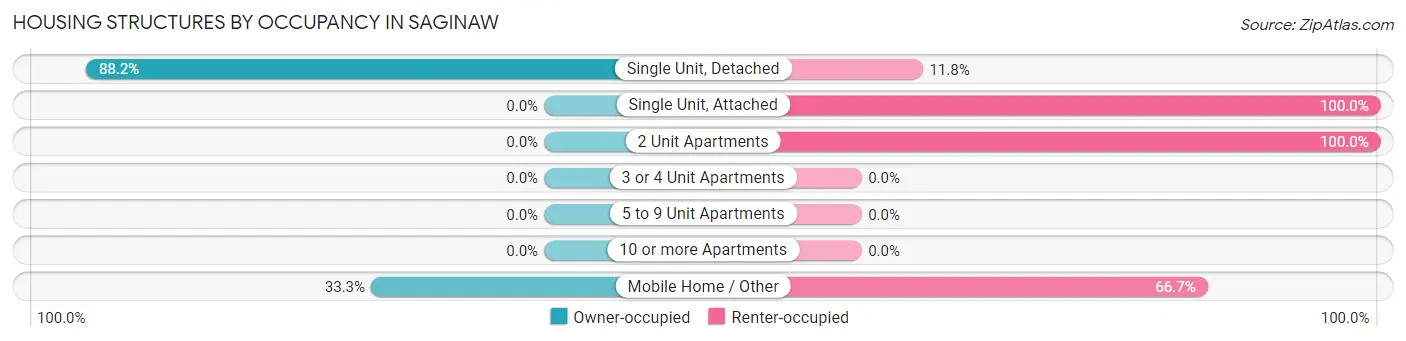
| Structure Type | Owner-occupied | Renter-occupied |
| Single Unit, Detached | 97 (88.2%) | 13 (11.8%) |
| Single Unit, Attached | 0 (0.0%) | 2 (100.0%) |
| 2 Unit Apartments | 0 (0.0%) | 5 (100.0%) |
| 3 or 4 Unit Apartments | 0 (0.0%) | 0 (0.0%) |
| 5 to 9 Unit Apartments | 0 (0.0%) | 0 (0.0%) |
| 10 or more Apartments | 0 (0.0%) | 0 (0.0%) |
| Mobile Home / Other | 2 (33.3%) | 4 (66.7%) |
| Total | 99 (80.5%) | 24 (19.5%) |
Housing Structures by Number of Rooms in Saginaw
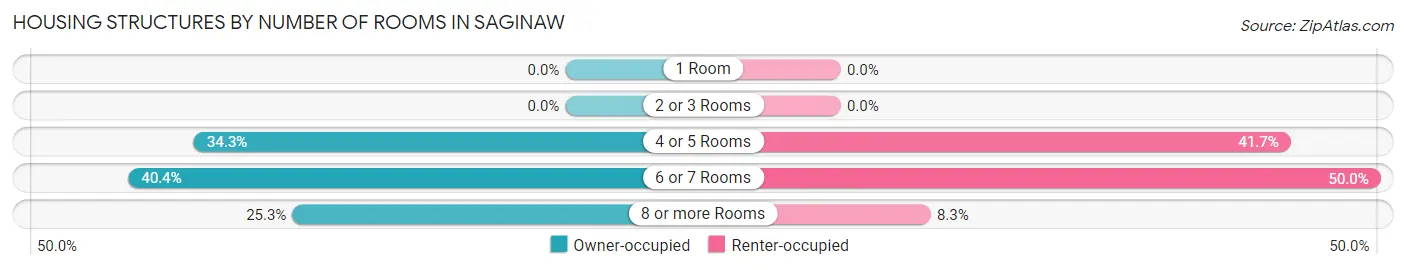
| Number of Rooms | Owner-occupied | Renter-occupied |
| 1 Room | 0 (0.0%) | 0 (0.0%) |
| 2 or 3 Rooms | 0 (0.0%) | 0 (0.0%) |
| 4 or 5 Rooms | 34 (34.3%) | 10 (41.7%) |
| 6 or 7 Rooms | 40 (40.4%) | 12 (50.0%) |
| 8 or more Rooms | 25 (25.3%) | 2 (8.3%) |
| Total | 99 (100.0%) | 24 (100.0%) |
Housing Structure by Heating Type in Saginaw
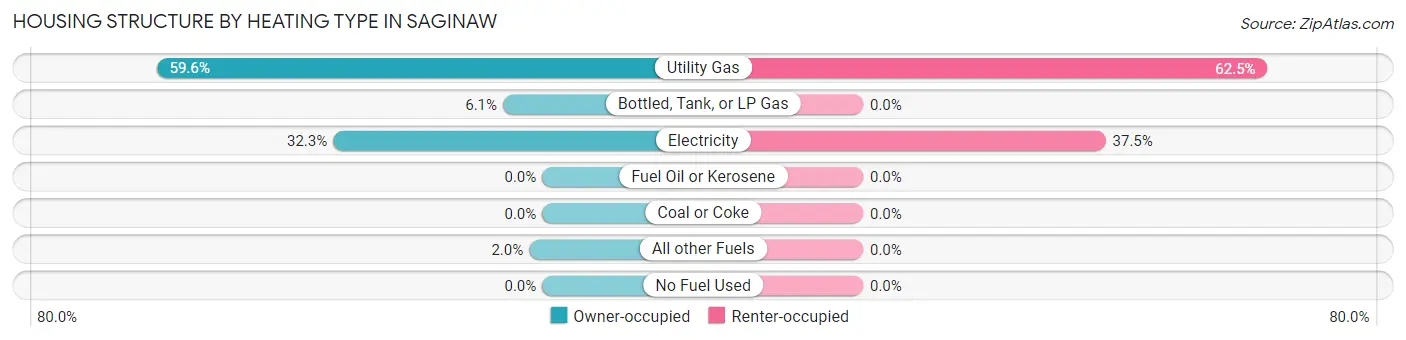
| Heating Type | Owner-occupied | Renter-occupied |
| Utility Gas | 59 (59.6%) | 15 (62.5%) |
| Bottled, Tank, or LP Gas | 6 (6.1%) | 0 (0.0%) |
| Electricity | 32 (32.3%) | 9 (37.5%) |
| Fuel Oil or Kerosene | 0 (0.0%) | 0 (0.0%) |
| Coal or Coke | 0 (0.0%) | 0 (0.0%) |
| All other Fuels | 2 (2.0%) | 0 (0.0%) |
| No Fuel Used | 0 (0.0%) | 0 (0.0%) |
| Total | 99 (100.0%) | 24 (100.0%) |
Household Vehicle Usage in Saginaw
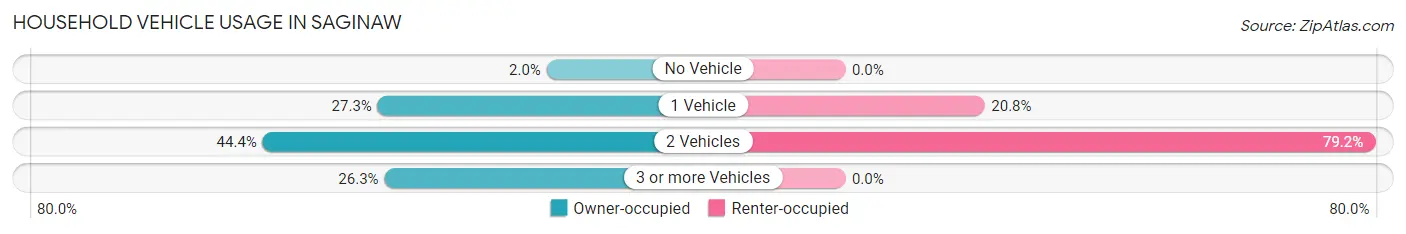
| Vehicles per Household | Owner-occupied | Renter-occupied |
| No Vehicle | 2 (2.0%) | 0 (0.0%) |
| 1 Vehicle | 27 (27.3%) | 5 (20.8%) |
| 2 Vehicles | 44 (44.4%) | 19 (79.2%) |
| 3 or more Vehicles | 26 (26.3%) | 0 (0.0%) |
| Total | 99 (100.0%) | 24 (100.0%) |
Real Estate & Mortgages in Saginaw
Real Estate and Mortgage Overview in Saginaw
| Characteristic | Without Mortgage | With Mortgage |
| Housing Units | 51 | 48 |
| Median Property Value | $158,800 | $185,000 |
| Median Household Income | $51,354 | $4 |
| Monthly Housing Costs | $398 | $0 |
| Real Estate Taxes | $1,217 | $0 |
Property Value by Mortgage Status in Saginaw
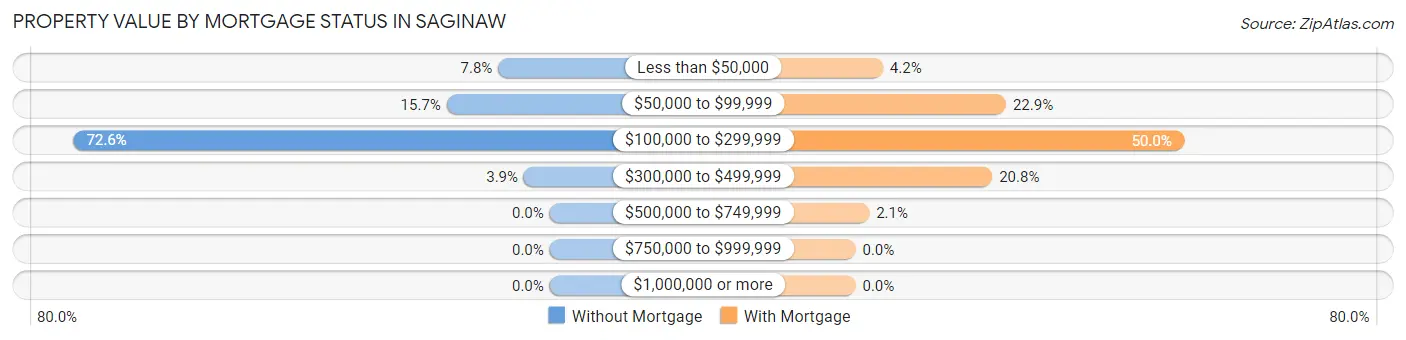
| Property Value | Without Mortgage | With Mortgage |
| Less than $50,000 | 4 (7.8%) | 2 (4.2%) |
| $50,000 to $99,999 | 8 (15.7%) | 11 (22.9%) |
| $100,000 to $299,999 | 37 (72.6%) | 24 (50.0%) |
| $300,000 to $499,999 | 2 (3.9%) | 10 (20.8%) |
| $500,000 to $749,999 | 0 (0.0%) | 1 (2.1%) |
| $750,000 to $999,999 | 0 (0.0%) | 0 (0.0%) |
| $1,000,000 or more | 0 (0.0%) | 0 (0.0%) |
| Total | 51 (100.0%) | 48 (100.0%) |
Household Income by Mortgage Status in Saginaw
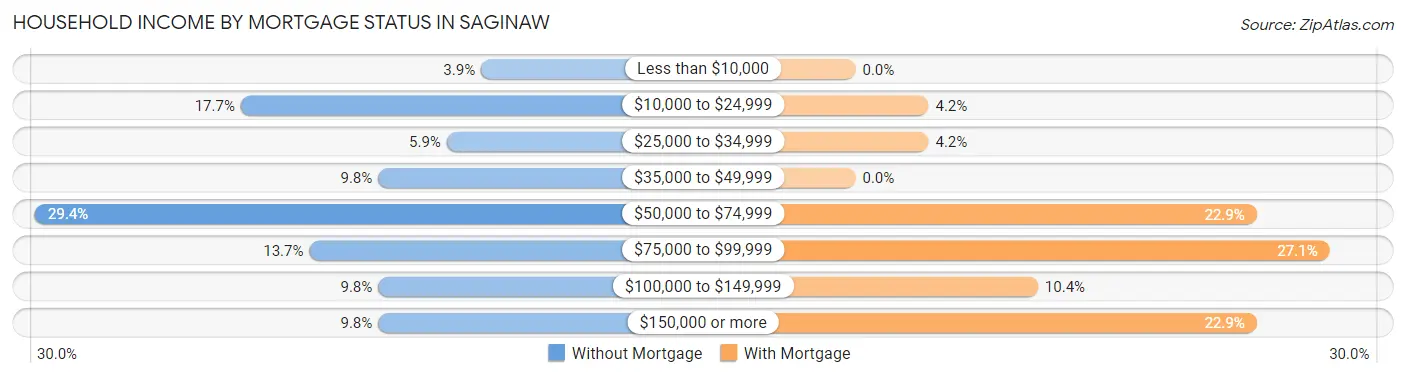
| Household Income | Without Mortgage | With Mortgage |
| Less than $10,000 | 2 (3.9%) | 0 (0.0%) |
| $10,000 to $24,999 | 9 (17.6%) | 2 (4.2%) |
| $25,000 to $34,999 | 3 (5.9%) | 2 (4.2%) |
| $35,000 to $49,999 | 5 (9.8%) | 0 (0.0%) |
| $50,000 to $74,999 | 15 (29.4%) | 11 (22.9%) |
| $75,000 to $99,999 | 7 (13.7%) | 13 (27.1%) |
| $100,000 to $149,999 | 5 (9.8%) | 5 (10.4%) |
| $150,000 or more | 5 (9.8%) | 11 (22.9%) |
| Total | 51 (100.0%) | 48 (100.0%) |
Property Value to Household Income Ratio in Saginaw
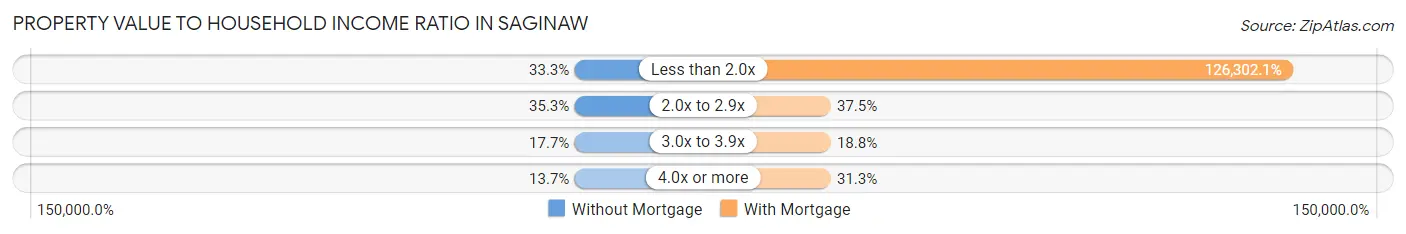
| Value-to-Income Ratio | Without Mortgage | With Mortgage |
| Less than 2.0x | 17 (33.3%) | 60,625 (126,302.1%) |
| 2.0x to 2.9x | 18 (35.3%) | 18 (37.5%) |
| 3.0x to 3.9x | 9 (17.6%) | 9 (18.8%) |
| 4.0x or more | 7 (13.7%) | 15 (31.2%) |
| Total | 51 (100.0%) | 48 (100.0%) |
Real Estate Taxes by Mortgage Status in Saginaw
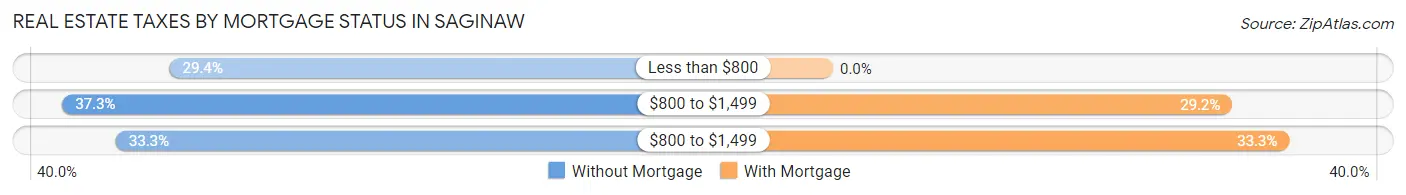
| Property Taxes | Without Mortgage | With Mortgage |
| Less than $800 | 15 (29.4%) | 0 (0.0%) |
| $800 to $1,499 | 19 (37.2%) | 14 (29.2%) |
| $800 to $1,499 | 17 (33.3%) | 16 (33.3%) |
| Total | 51 (100.0%) | 48 (100.0%) |
Health & Disability in Saginaw
Health Insurance Coverage by Age in Saginaw
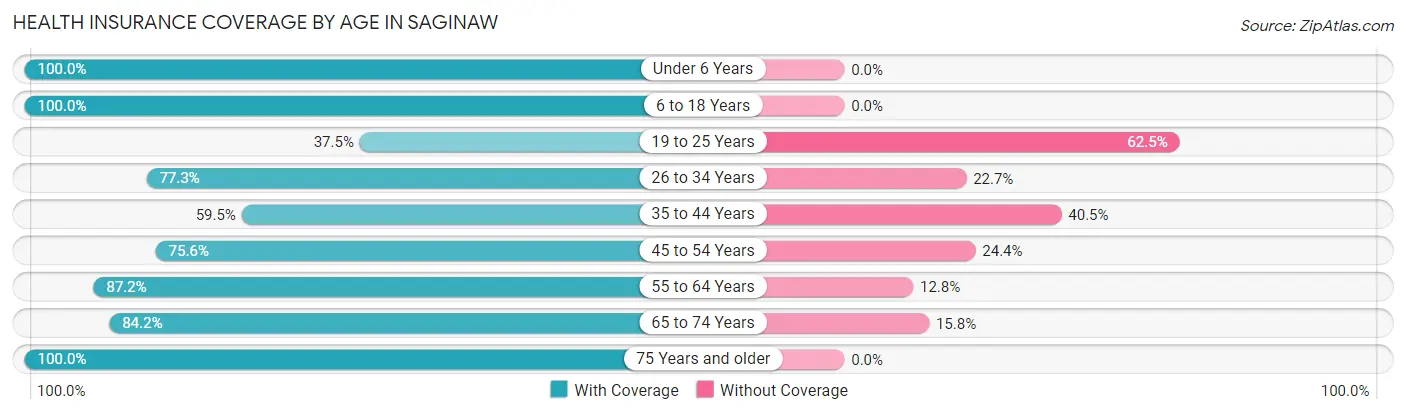
| Age Bracket | With Coverage | Without Coverage |
| Under 6 Years | 21 (100.0%) | 0 (0.0%) |
| 6 to 18 Years | 51 (100.0%) | 0 (0.0%) |
| 19 to 25 Years | 3 (37.5%) | 5 (62.5%) |
| 26 to 34 Years | 34 (77.3%) | 10 (22.7%) |
| 35 to 44 Years | 25 (59.5%) | 17 (40.5%) |
| 45 to 54 Years | 34 (75.6%) | 11 (24.4%) |
| 55 to 64 Years | 34 (87.2%) | 5 (12.8%) |
| 65 to 74 Years | 16 (84.2%) | 3 (15.8%) |
| 75 Years and older | 36 (100.0%) | 0 (0.0%) |
| Total | 254 (83.3%) | 51 (16.7%) |
Health Insurance Coverage by Citizenship Status in Saginaw
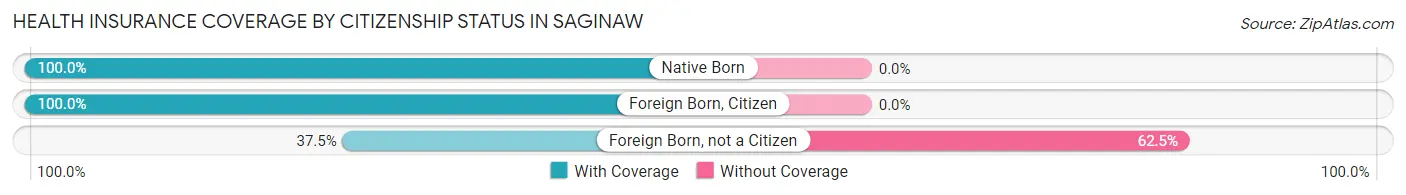
| Citizenship Status | With Coverage | Without Coverage |
| Native Born | 21 (100.0%) | 0 (0.0%) |
| Foreign Born, Citizen | 51 (100.0%) | 0 (0.0%) |
| Foreign Born, not a Citizen | 3 (37.5%) | 5 (62.5%) |
Health Insurance Coverage by Household Income in Saginaw
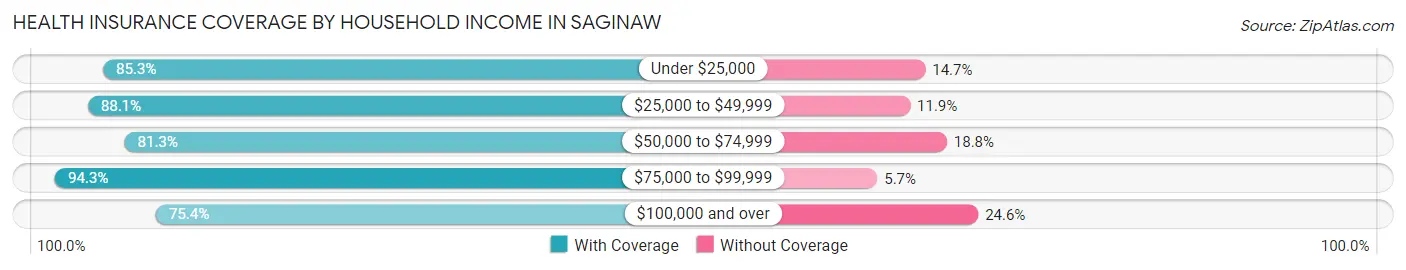
| Household Income | With Coverage | Without Coverage |
| Under $25,000 | 29 (85.3%) | 5 (14.7%) |
| $25,000 to $49,999 | 52 (88.1%) | 7 (11.9%) |
| $50,000 to $74,999 | 91 (81.2%) | 21 (18.8%) |
| $75,000 to $99,999 | 33 (94.3%) | 2 (5.7%) |
| $100,000 and over | 49 (75.4%) | 16 (24.6%) |
Public vs Private Health Insurance Coverage by Age in Saginaw
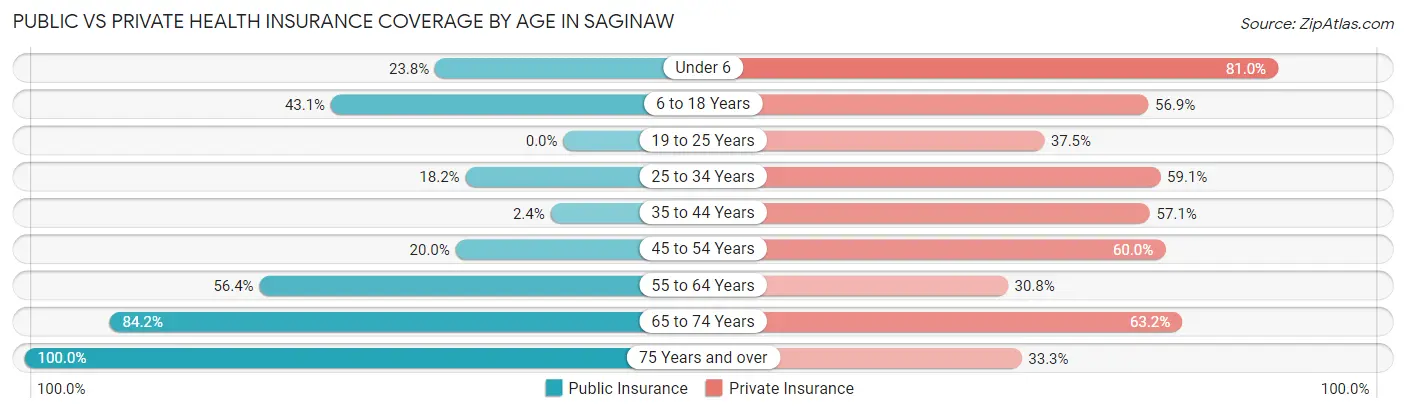
| Age Bracket | Public Insurance | Private Insurance |
| Under 6 | 5 (23.8%) | 17 (80.9%) |
| 6 to 18 Years | 22 (43.1%) | 29 (56.9%) |
| 19 to 25 Years | 0 (0.0%) | 3 (37.5%) |
| 25 to 34 Years | 8 (18.2%) | 26 (59.1%) |
| 35 to 44 Years | 1 (2.4%) | 24 (57.1%) |
| 45 to 54 Years | 9 (20.0%) | 27 (60.0%) |
| 55 to 64 Years | 22 (56.4%) | 12 (30.8%) |
| 65 to 74 Years | 16 (84.2%) | 12 (63.2%) |
| 75 Years and over | 36 (100.0%) | 12 (33.3%) |
| Total | 119 (39.0%) | 162 (53.1%) |
Disability Status by Sex by Age in Saginaw
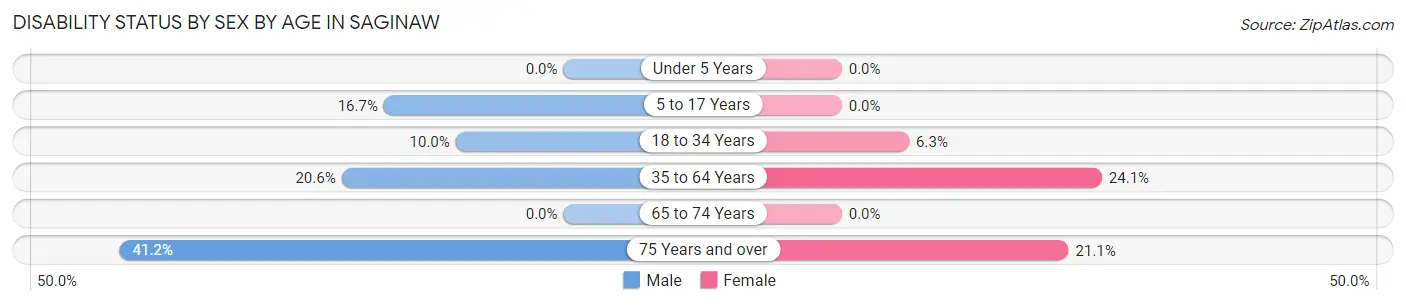
| Age Bracket | Male | Female |
| Under 5 Years | 0 (0.0%) | 0 (0.0%) |
| 5 to 17 Years | 4 (16.7%) | 0 (0.0%) |
| 18 to 34 Years | 2 (10.0%) | 2 (6.2%) |
| 35 to 64 Years | 14 (20.6%) | 14 (24.1%) |
| 65 to 74 Years | 0 (0.0%) | 0 (0.0%) |
| 75 Years and over | 7 (41.2%) | 4 (21.0%) |
Disability Class by Sex by Age in Saginaw
Disability Class: Hearing Difficulty
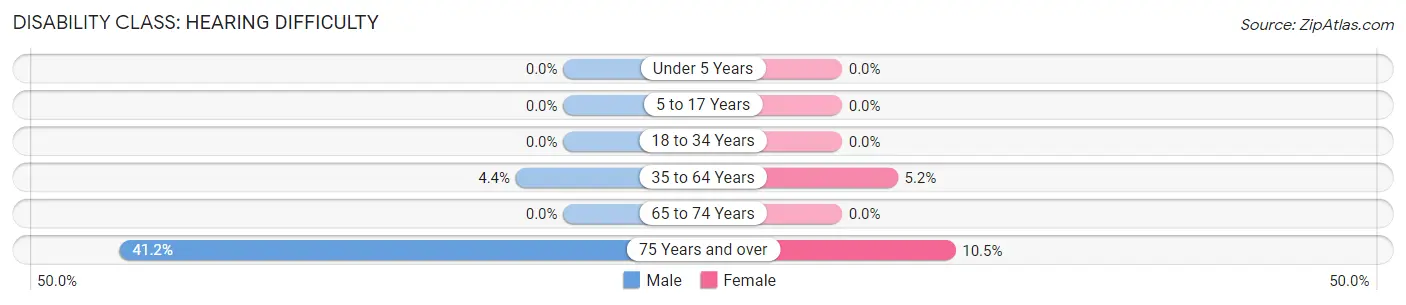
| Age Bracket | Male | Female |
| Under 5 Years | 0 (0.0%) | 0 (0.0%) |
| 5 to 17 Years | 0 (0.0%) | 0 (0.0%) |
| 18 to 34 Years | 0 (0.0%) | 0 (0.0%) |
| 35 to 64 Years | 3 (4.4%) | 3 (5.2%) |
| 65 to 74 Years | 0 (0.0%) | 0 (0.0%) |
| 75 Years and over | 7 (41.2%) | 2 (10.5%) |
Disability Class: Vision Difficulty
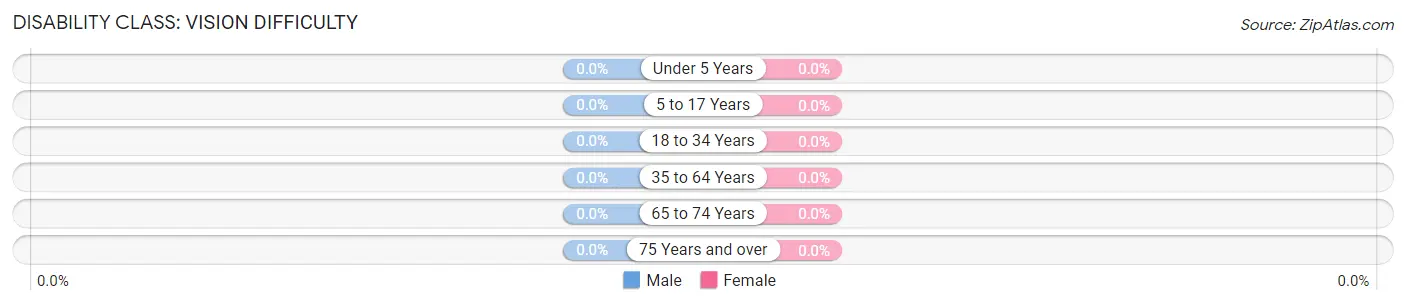
| Age Bracket | Male | Female |
| Under 5 Years | 0 (0.0%) | 0 (0.0%) |
| 5 to 17 Years | 0 (0.0%) | 0 (0.0%) |
| 18 to 34 Years | 0 (0.0%) | 0 (0.0%) |
| 35 to 64 Years | 0 (0.0%) | 0 (0.0%) |
| 65 to 74 Years | 0 (0.0%) | 0 (0.0%) |
| 75 Years and over | 0 (0.0%) | 0 (0.0%) |
Disability Class: Cognitive Difficulty
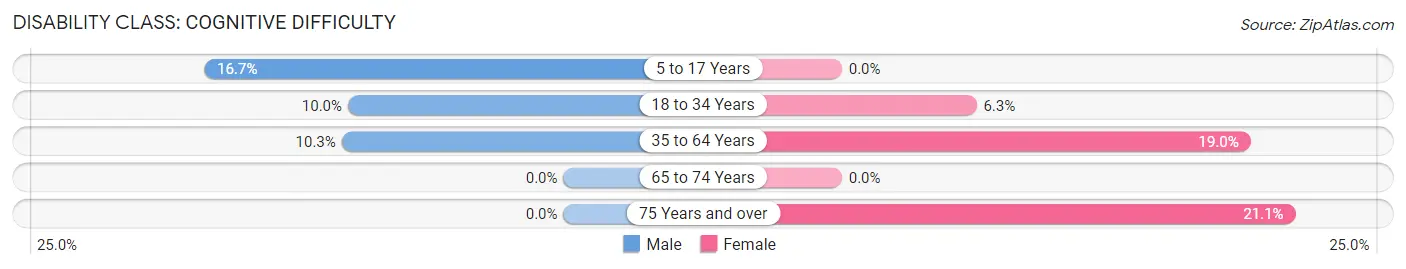
| Age Bracket | Male | Female |
| 5 to 17 Years | 4 (16.7%) | 0 (0.0%) |
| 18 to 34 Years | 2 (10.0%) | 2 (6.2%) |
| 35 to 64 Years | 7 (10.3%) | 11 (19.0%) |
| 65 to 74 Years | 0 (0.0%) | 0 (0.0%) |
| 75 Years and over | 0 (0.0%) | 4 (21.0%) |
Disability Class: Ambulatory Difficulty
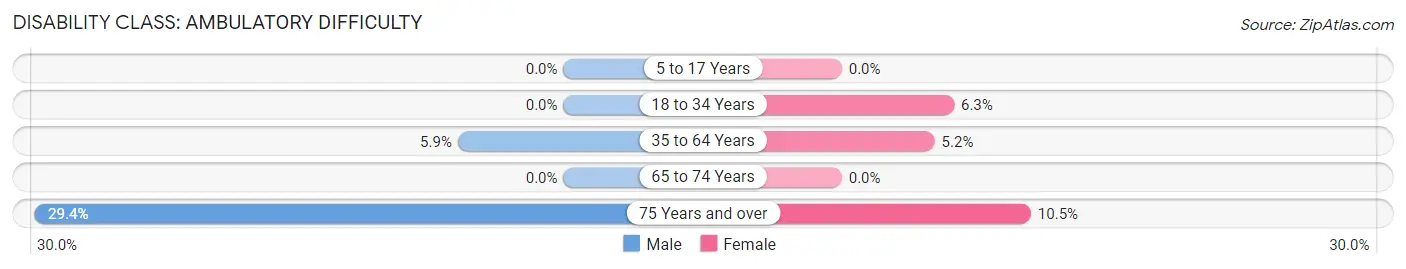
| Age Bracket | Male | Female |
| 5 to 17 Years | 0 (0.0%) | 0 (0.0%) |
| 18 to 34 Years | 0 (0.0%) | 2 (6.2%) |
| 35 to 64 Years | 4 (5.9%) | 3 (5.2%) |
| 65 to 74 Years | 0 (0.0%) | 0 (0.0%) |
| 75 Years and over | 5 (29.4%) | 2 (10.5%) |
Disability Class: Self-Care Difficulty
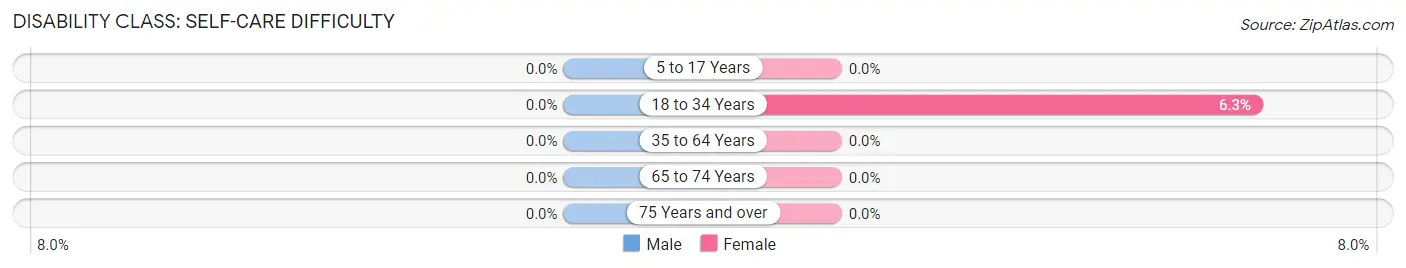
| Age Bracket | Male | Female |
| 5 to 17 Years | 0 (0.0%) | 0 (0.0%) |
| 18 to 34 Years | 0 (0.0%) | 2 (6.2%) |
| 35 to 64 Years | 0 (0.0%) | 0 (0.0%) |
| 65 to 74 Years | 0 (0.0%) | 0 (0.0%) |
| 75 Years and over | 0 (0.0%) | 0 (0.0%) |
Technology Access in Saginaw
Computing Device Access in Saginaw
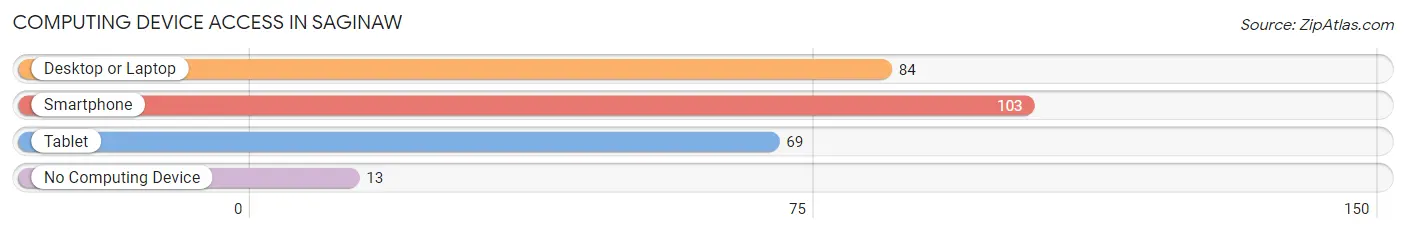
| Device Type | # Households | % Households |
| Desktop or Laptop | 84 | 68.3% |
| Smartphone | 103 | 83.7% |
| Tablet | 69 | 56.1% |
| No Computing Device | 13 | 10.6% |
| Total | 123 | 100.0% |
Internet Access in Saginaw
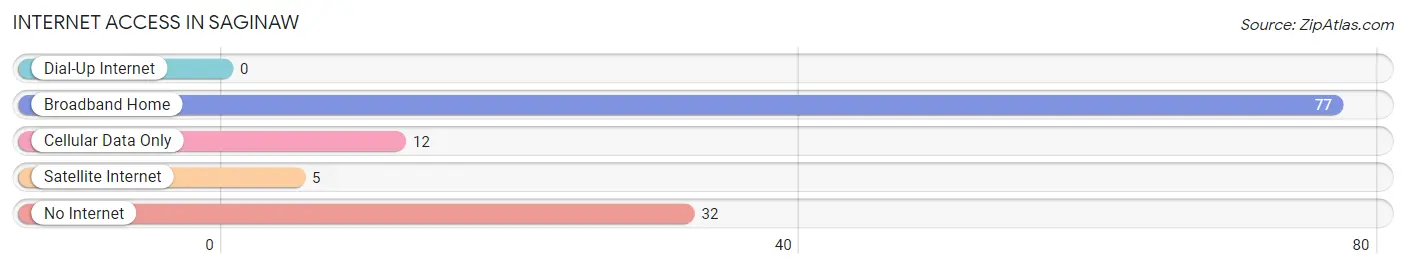
| Internet Type | # Households | % Households |
| Dial-Up Internet | 0 | 0.0% |
| Broadband Home | 77 | 62.6% |
| Cellular Data Only | 12 | 9.8% |
| Satellite Internet | 5 | 4.1% |
| No Internet | 32 | 26.0% |
| Total | 123 | 100.0% |
Saginaw Summary
Saginaw is a small city located in the state of Missouri, United States. It is situated in the northwest corner of the state, in the Ozark Mountains region. The city is located in Taney County, and is part of the Branson, Missouri Metropolitan Statistical Area. As of the 2010 census, the population of Saginaw was 1,845.
History
Saginaw was founded in 1883 by a group of settlers from the nearby town of Forsyth. The town was named after the Saginaw River, which runs through the area. The settlers were attracted to the area due to its abundance of natural resources, including timber, minerals, and water.
The town quickly grew, and by the early 1900s, it had become a thriving community. The town was home to several businesses, including a sawmill, a grist mill, a general store, and a hotel. The town also had a post office, a school, and a church.
In the early 1900s, the town was also home to a large number of German immigrants. These immigrants brought with them their culture and traditions, which are still evident in the town today.
Geography
Saginaw is located in the Ozark Mountains region of Missouri. The city is situated in the northwest corner of the state, in Taney County. The city is located at an elevation of 1,072 feet (326 m).
The city is located near the White River, which is a tributary of the James River. The city is also located near the Mark Twain National Forest, which is a popular destination for outdoor recreation.
The climate in Saginaw is humid subtropical, with hot, humid summers and mild winters. The average annual temperature is 57°F (14°C). The average annual precipitation is 44 inches (112 cm).
Economy
The economy of Saginaw is largely based on tourism and agriculture. The city is home to several tourist attractions, including the Saginaw Valley Museum, the Saginaw Valley Zoo, and the Saginaw Valley State Park.
The city is also home to several agricultural businesses, including dairy farms, cattle farms, and poultry farms. The city is also home to several manufacturing businesses, including a furniture factory and a woodworking factory.
Demographics
As of the 2010 census, the population of Saginaw was 1,845. The racial makeup of the city was 95.3% White, 0.7% African American, 0.3% Native American, 0.2% Asian, 0.1% Pacific Islander, 1.2% from other races, and 2.3% from two or more races. Hispanic or Latino of any race were 3.2% of the population.
The median income for a household in the city was $35,938, and the median income for a family was $41,250. The per capita income for the city was $17,845. About 11.2% of families and 14.2% of the population were below the poverty line, including 19.2% of those under age 18 and 8.3% of those age 65 or over.
Common Questions
What is the Total Population of Saginaw?
Total Population of Saginaw is 305.
What is the Total Male Population of Saginaw?
Total Male Population of Saginaw is 150.
What is the Total Female Population of Saginaw?
Total Female Population of Saginaw is 155.
What is the Ratio of Males per 100 Females in Saginaw?
There are 96.77 Males per 100 Females in Saginaw.
What is the Ratio of Females per 100 Males in Saginaw?
There are 103.33 Females per 100 Males in Saginaw.
What is the Median Population Age in Saginaw?
Median Population Age in Saginaw is 43.5 Years.
What is the Average Family Size in Saginaw
Average Family Size in Saginaw is 2.9 People.
What is the Average Household Size in Saginaw
Average Household Size in Saginaw is 2.5 People.
What is Per Capita Income in Saginaw?
Per Capita income in Saginaw is $27,354.
What is the Median Family Income in Saginaw?
Median Family Income in Saginaw is $55,625.
What is the Median Household income in Saginaw?
Median Household Income in Saginaw is $52,422.
What is Income or Wage Gap in Saginaw?
Income or Wage Gap in Saginaw is 34.3%.
Women in Saginaw earn 65.7 cents for every dollar earned by a man.
What is Inequality or Gini Index in Saginaw?
Inequality or Gini Index in Saginaw is 0.40.
How Large is the Labor Force in Saginaw?
There are 129 People in the Labor Forcein in Saginaw.
What is the Percentage of People in the Labor Force in Saginaw?
54.4% of People are in the Labor Force in Saginaw.
What is the Unemployment Rate in Saginaw?
Unemployment Rate in Saginaw is 2.3%.