Paynesville, MO
Paynesville Map
Paynesville Overview
41
TOTAL POPULATION
27
MALE POPULATION
14
FEMALE POPULATION
192.86
MALES / 100 FEMALES
51.85
FEMALES / 100 MALES
55.9
MEDIAN AGE
2.3
AVG FAMILY SIZE
1.7
AVG HOUSEHOLD SIZE
$27,298
PER CAPITA INCOME
$64,063
AVG FAMILY INCOME
$60,000
AVG HOUSEHOLD INCOME
0.29
INEQUALITY / GINI INDEX
9
LABOR FORCE [ PEOPLE ]
23.7%
PERCENT IN LABOR FORCE
Paynesville Area Codes
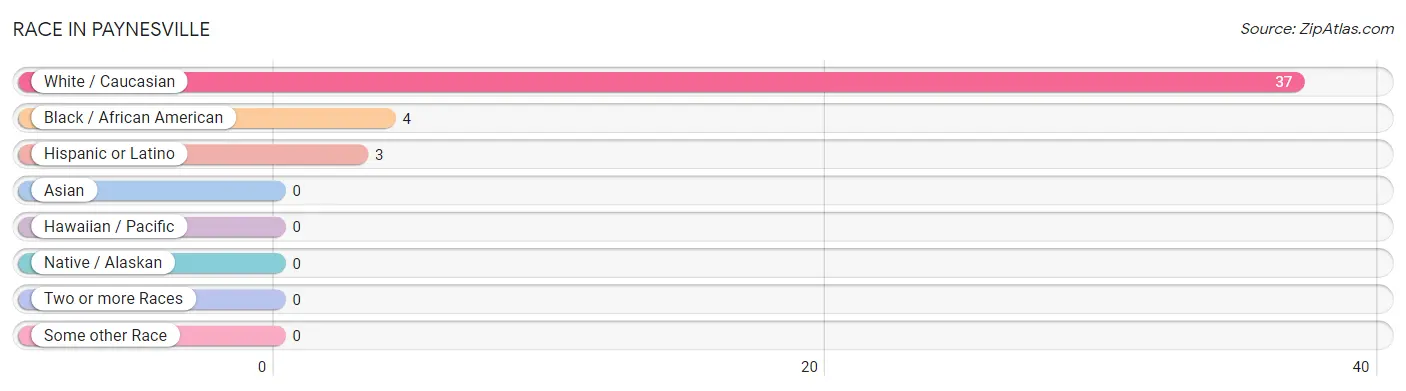
Race in Paynesville
The most populous races in Paynesville are White / Caucasian (37 | 90.2%), Black / African American (4 | 9.8%), and Hispanic or Latino (3 | 7.3%).
| Race | # Population | % Population |
| Asian | 0 | 0.0% |
| Black / African American | 4 | 9.8% |
| Hawaiian / Pacific | 0 | 0.0% |
| Hispanic or Latino | 3 | 7.3% |
| Native / Alaskan | 0 | 0.0% |
| White / Caucasian | 37 | 90.2% |
| Two or more Races | 0 | 0.0% |
| Some other Race | 0 | 0.0% |
| Total | 41 | 100.0% |
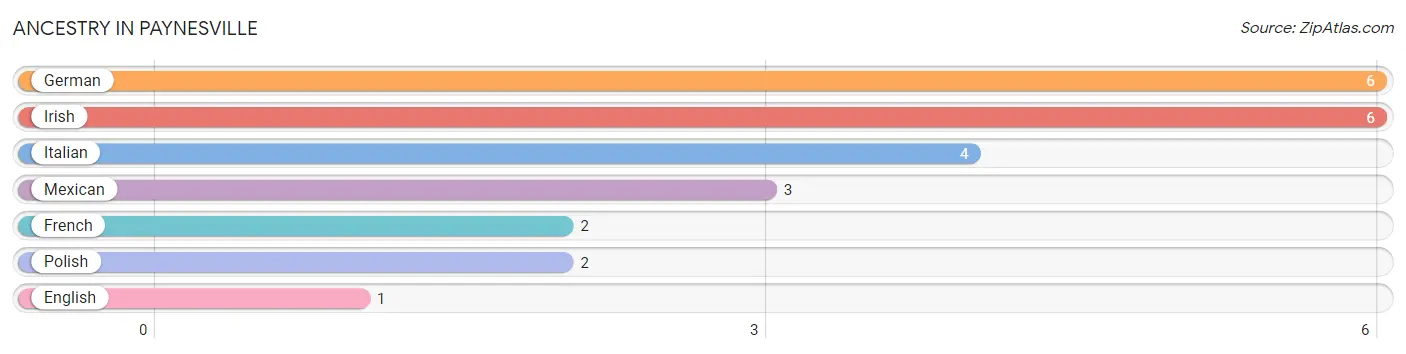
Ancestry in Paynesville
The most populous ancestries reported in Paynesville are German (6 | 14.6%), Irish (6 | 14.6%), Italian (4 | 9.8%), Mexican (3 | 7.3%), and French (2 | 4.9%), together accounting for 51.2% of all Paynesville residents.
| Ancestry | # Population | % Population |
| English | 1 | 2.4% |
| French | 2 | 4.9% |
| German | 6 | 14.6% |
| Irish | 6 | 14.6% |
| Italian | 4 | 9.8% |
| Mexican | 3 | 7.3% |
| Polish | 2 | 4.9% | View All 7 Rows |
Immigrants in Paynesville

| Immigration Origin | # Population | % Population | View All 0 Rows |
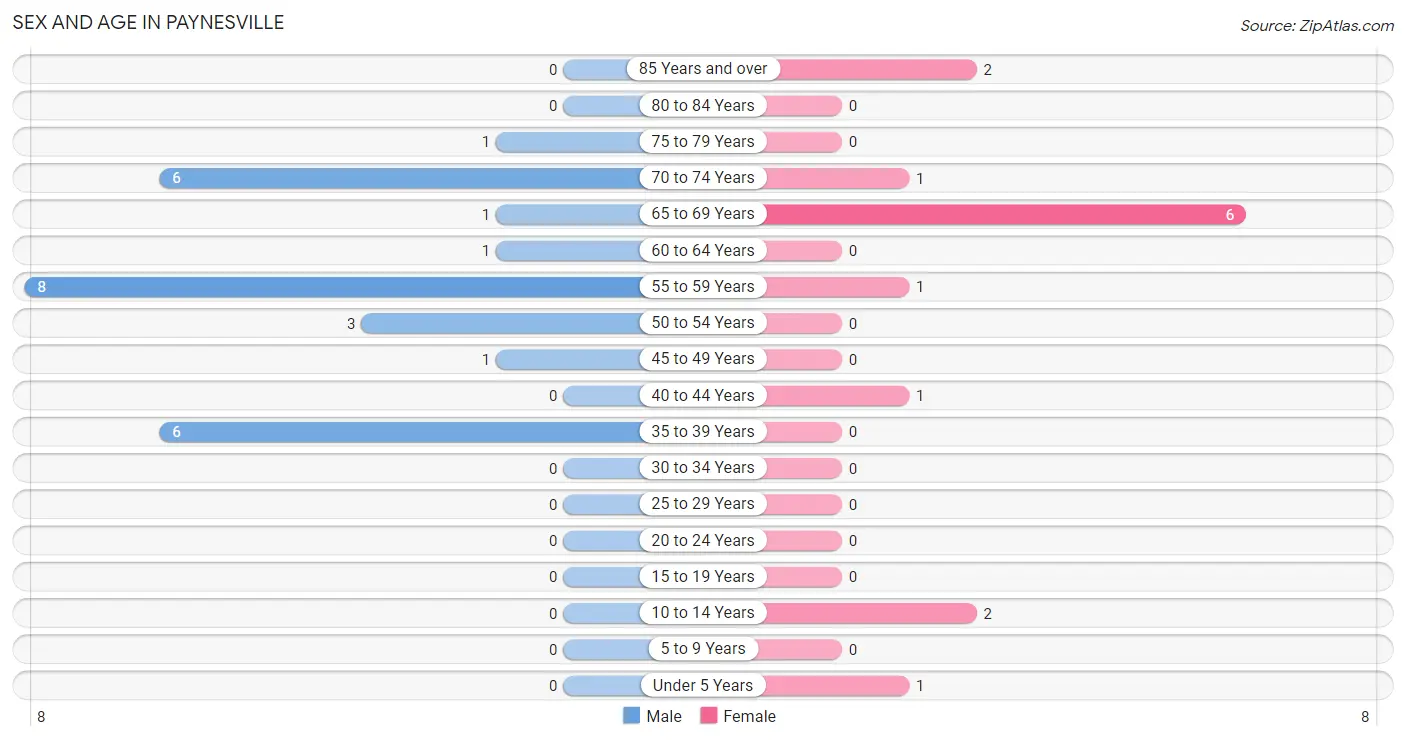
Sex and Age in Paynesville
Sex and Age in Paynesville
The most populous age groups in Paynesville are 55 to 59 Years (8 | 29.6%) for men and 65 to 69 Years (6 | 42.9%) for women.
| Age Bracket | Male | Female |
| Under 5 Years | 0 (0.0%) | 1 (7.1%) |
| 5 to 9 Years | 0 (0.0%) | 0 (0.0%) |
| 10 to 14 Years | 0 (0.0%) | 2 (14.3%) |
| 15 to 19 Years | 0 (0.0%) | 0 (0.0%) |
| 20 to 24 Years | 0 (0.0%) | 0 (0.0%) |
| 25 to 29 Years | 0 (0.0%) | 0 (0.0%) |
| 30 to 34 Years | 0 (0.0%) | 0 (0.0%) |
| 35 to 39 Years | 6 (22.2%) | 0 (0.0%) |
| 40 to 44 Years | 0 (0.0%) | 1 (7.1%) |
| 45 to 49 Years | 1 (3.7%) | 0 (0.0%) |
| 50 to 54 Years | 3 (11.1%) | 0 (0.0%) |
| 55 to 59 Years | 8 (29.6%) | 1 (7.1%) |
| 60 to 64 Years | 1 (3.7%) | 0 (0.0%) |
| 65 to 69 Years | 1 (3.7%) | 6 (42.9%) |
| 70 to 74 Years | 6 (22.2%) | 1 (7.1%) |
| 75 to 79 Years | 1 (3.7%) | 0 (0.0%) |
| 80 to 84 Years | 0 (0.0%) | 0 (0.0%) |
| 85 Years and over | 0 (0.0%) | 2 (14.3%) |
| Total | 27 (100.0%) | 14 (100.0%) |
Families and Households in Paynesville
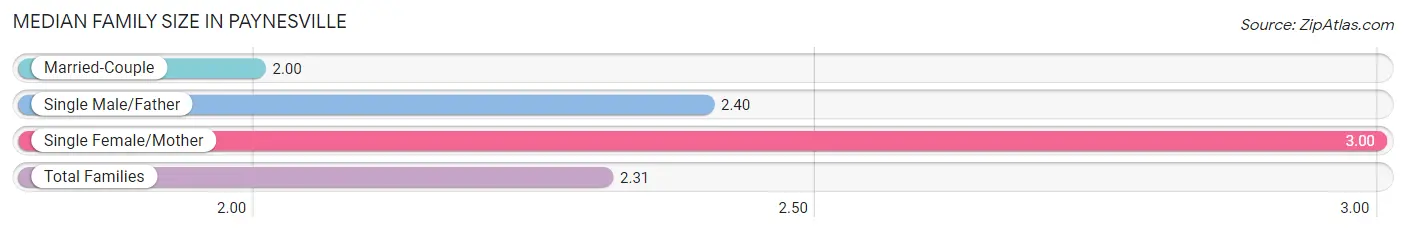
Median Family Size in Paynesville
The median family size in Paynesville is 2.31 persons per family, with single female/mother families (2 | 15.4%) accounting for the largest median family size of 3 persons per family. On the other hand, married-couple families (6 | 46.2%) represent the smallest median family size with 2.00 persons per family.
| Family Type | # Families | Family Size |
| Married-Couple | 6 (46.2%) | 2.00 |
| Single Male/Father | 5 (38.5%) | 2.40 |
| Single Female/Mother | 2 (15.4%) | 3.00 |
| Total Families | 13 (100.0%) | 2.31 |
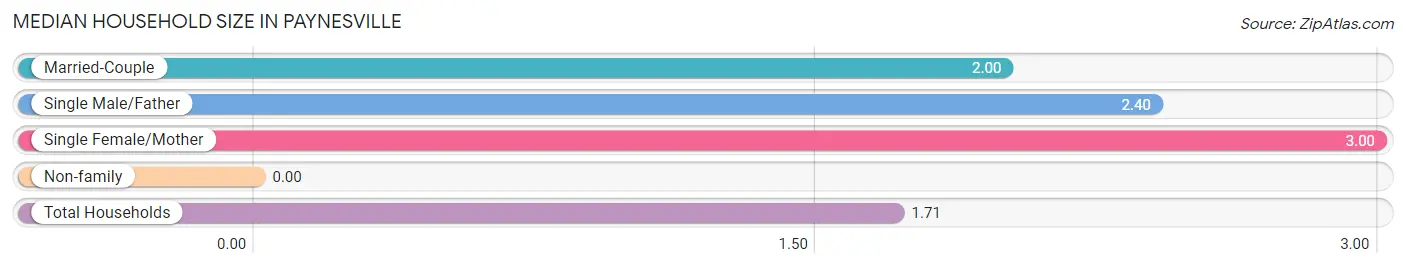
Median Household Size in Paynesville
| Household Type | # Households | Household Size |
| Married-Couple | 6 (25.0%) | 2.00 |
| Single Male/Father | 5 (20.8%) | 2.40 |
| Single Female/Mother | 2 (8.3%) | 3.00 |
| Non-family | 11 (45.8%) | - |
| Total Households | 24 (100.0%) | 1.71 |
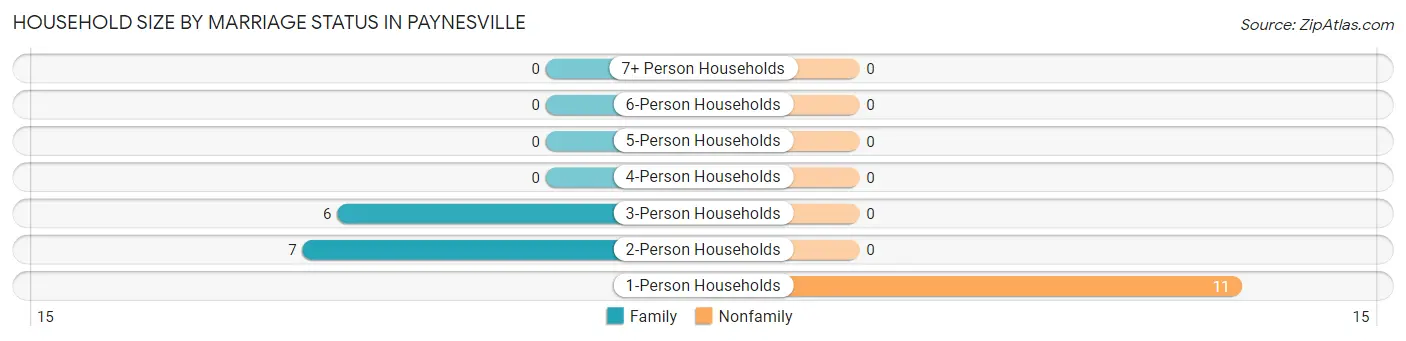
Household Size by Marriage Status in Paynesville
Out of a total of 24 households in Paynesville, 13 (54.2%) are family households, while 11 (45.8%) are nonfamily households. The most numerous type of family households are 2-person households, comprising 7, and the most common type of nonfamily households are 1-person households, comprising 11.
| Household Size | Family Households | Nonfamily Households |
| 1-Person Households | - | 11 (45.8%) |
| 2-Person Households | 7 (29.2%) | 0 (0.0%) |
| 3-Person Households | 6 (25.0%) | 0 (0.0%) |
| 4-Person Households | 0 (0.0%) | 0 (0.0%) |
| 5-Person Households | 0 (0.0%) | 0 (0.0%) |
| 6-Person Households | 0 (0.0%) | 0 (0.0%) |
| 7+ Person Households | 0 (0.0%) | 0 (0.0%) |
| Total | 13 (54.2%) | 11 (45.8%) |
Female Fertility in Paynesville
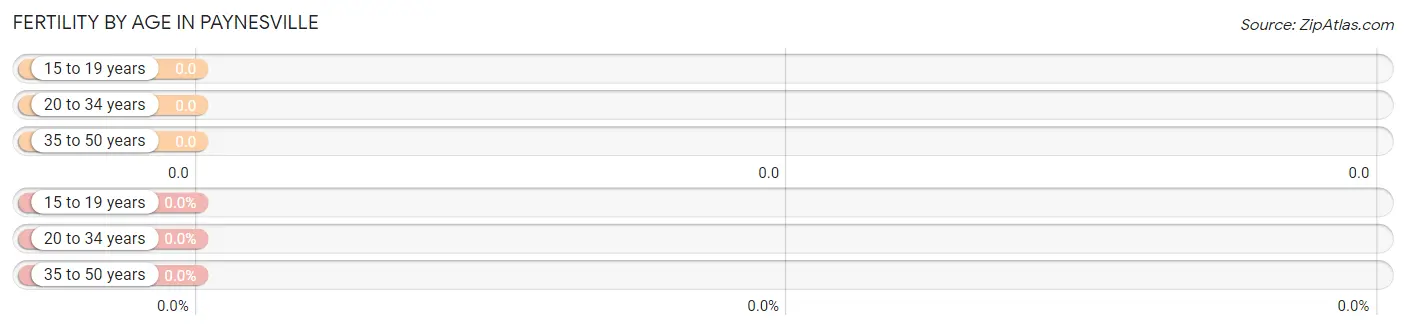
Fertility by Age in Paynesville
| Age Bracket | Women with Births | Births / 1,000 Women |
| 15 to 19 years | 0 (0.0%) | 0.0 |
| 20 to 34 years | 0 (0.0%) | 0.0 |
| 35 to 50 years | 0 (0.0%) | 0.0 |
| Total | 0 (0.0%) | 0.0 |
Fertility by Age by Marriage Status in Paynesville
| Age Bracket | Married | Unmarried |
| 15 to 19 years | 0 (0.0%) | 0 (0.0%) |
| 20 to 34 years | 0 (0.0%) | 0 (0.0%) |
| 35 to 50 years | 0 (0.0%) | 0 (0.0%) |
| Total | 0 (0.0%) | 0 (0.0%) |
Fertility by Education in Paynesville
| Educational Attainment | Women with Births | Births / 1,000 Women |
| Less than High School | 0 (0.0%) | 0.0 |
| High School Diploma | 0 (0.0%) | 0.0 |
| College or Associate's Degree | 0 (0.0%) | 0.0 |
| Bachelor's Degree | 0 (0.0%) | 0.0 |
| Graduate Degree | 0 (0.0%) | 0.0 |
| Total | 0 (0.0%) | 0.0 |
Fertility by Education by Marriage Status in Paynesville
| Educational Attainment | Married | Unmarried |
| Less than High School | 0 (0.0%) | 0 (0.0%) |
| High School Diploma | 0 (0.0%) | 0 (0.0%) |
| College or Associate's Degree | 0 (0.0%) | 0 (0.0%) |
| Bachelor's Degree | 0 (0.0%) | 0 (0.0%) |
| Graduate Degree | 0 (0.0%) | 0 (0.0%) |
| Total | 0 (0.0%) | 0 (0.0%) |
Income in Paynesville
Income Overview in Paynesville
Per Capita Income in Paynesville is $27,298, while median incomes of families and households are $64,063 and $60,000 respectively.
| Characteristic | Number | Measure |
| Per Capita Income | 41 | $27,298 |
| Median Family Income | 13 | $64,063 |
| Mean Family Income | 13 | $66,123 |
| Median Household Income | 24 | $60,000 |
| Mean Household Income | 24 | $53,033 |
| Income Deficit | 13 | $0 |
| Wage / Income Gap (%) | 41 | 0.00% |
| Wage / Income Gap ($) | 41 | 100.00¢ per $1 |
| Gini / Inequality Index | 41 | 0.29 |
Earnings by Sex in Paynesville
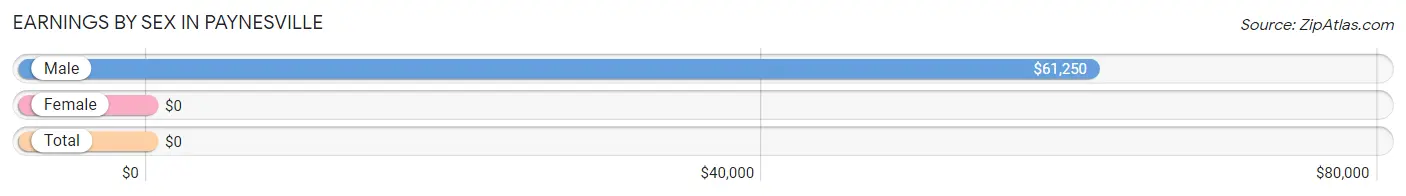
| Sex | Number | Average Earnings |
| Male | 9 (69.2%) | $61,250 |
| Female | 4 (30.8%) | $0 |
| Total | 13 (100.0%) | $0 |
Earnings by Sex by Income Bracket in Paynesville
The most common earnings brackets in Paynesville are $55,000 to $64,999 for men (3 | 33.3%) and $2,499 or less for women (2 | 50.0%).
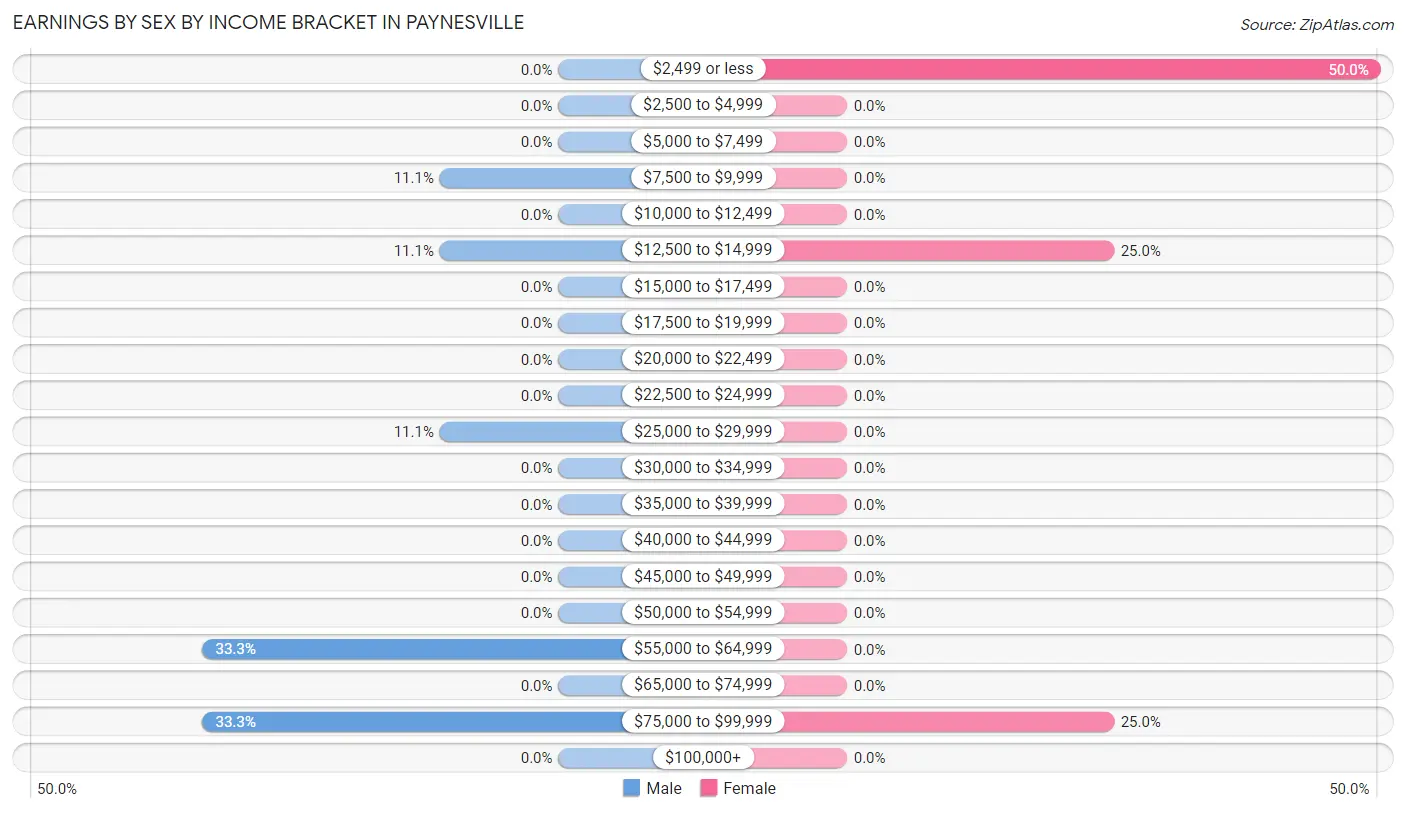
| Income | Male | Female |
| $2,499 or less | 0 (0.0%) | 2 (50.0%) |
| $2,500 to $4,999 | 0 (0.0%) | 0 (0.0%) |
| $5,000 to $7,499 | 0 (0.0%) | 0 (0.0%) |
| $7,500 to $9,999 | 1 (11.1%) | 0 (0.0%) |
| $10,000 to $12,499 | 0 (0.0%) | 0 (0.0%) |
| $12,500 to $14,999 | 1 (11.1%) | 1 (25.0%) |
| $15,000 to $17,499 | 0 (0.0%) | 0 (0.0%) |
| $17,500 to $19,999 | 0 (0.0%) | 0 (0.0%) |
| $20,000 to $22,499 | 0 (0.0%) | 0 (0.0%) |
| $22,500 to $24,999 | 0 (0.0%) | 0 (0.0%) |
| $25,000 to $29,999 | 1 (11.1%) | 0 (0.0%) |
| $30,000 to $34,999 | 0 (0.0%) | 0 (0.0%) |
| $35,000 to $39,999 | 0 (0.0%) | 0 (0.0%) |
| $40,000 to $44,999 | 0 (0.0%) | 0 (0.0%) |
| $45,000 to $49,999 | 0 (0.0%) | 0 (0.0%) |
| $50,000 to $54,999 | 0 (0.0%) | 0 (0.0%) |
| $55,000 to $64,999 | 3 (33.3%) | 0 (0.0%) |
| $65,000 to $74,999 | 0 (0.0%) | 0 (0.0%) |
| $75,000 to $99,999 | 3 (33.3%) | 1 (25.0%) |
| $100,000+ | 0 (0.0%) | 0 (0.0%) |
| Total | 9 (100.0%) | 4 (100.0%) |
Earnings by Sex by Educational Attainment in Paynesville
| Educational Attainment | Male Income | Female Income |
| Less than High School | - | - |
| High School Diploma | - | - |
| College or Associate's Degree | - | - |
| Bachelor's Degree | - | - |
| Graduate Degree | - | - |
| Total | $61,250 | $0 |
Family Income in Paynesville
Family Income Brackets in Paynesville
According to the Paynesville family income data, there are 7 families falling into the $50,000 to $74,999 income range, which is the most common income bracket and makes up 53.8% of all families.
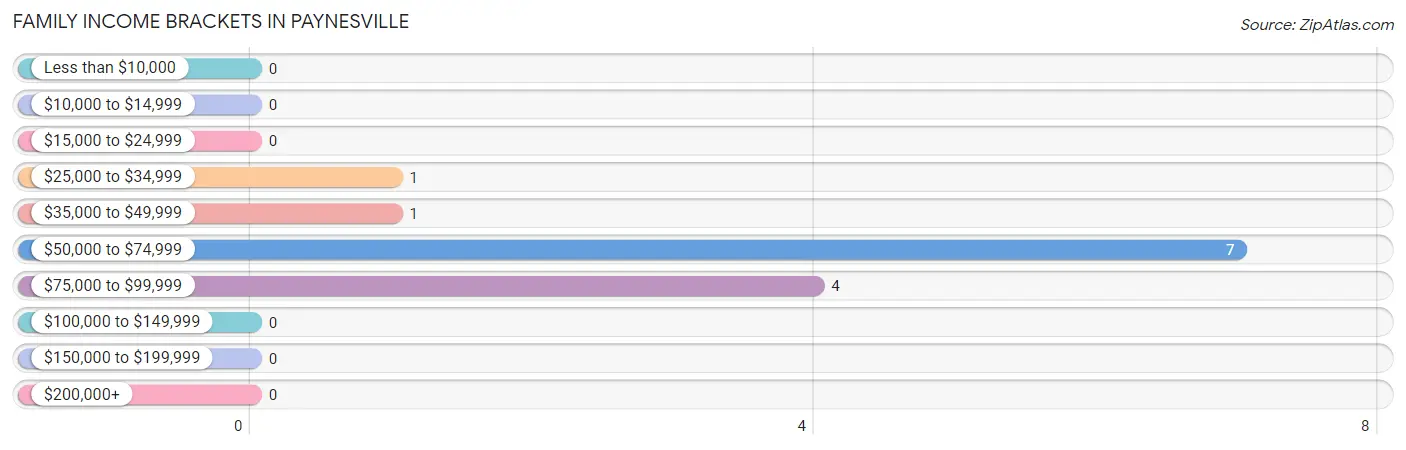
| Income Bracket | # Families | % Families |
| Less than $10,000 | 0 | 0.0% |
| $10,000 to $14,999 | 0 | 0.0% |
| $15,000 to $24,999 | 0 | 0.0% |
| $25,000 to $34,999 | 1 | 7.7% |
| $35,000 to $49,999 | 1 | 7.7% |
| $50,000 to $74,999 | 7 | 53.8% |
| $75,000 to $99,999 | 4 | 30.8% |
| $100,000 to $149,999 | 0 | 0.0% |
| $150,000 to $199,999 | 0 | 0.0% |
| $200,000+ | 0 | 0.0% |
Family Income by Famaliy Size in Paynesville
3-person families (6 | 46.2%) account for the highest median family income in Paynesville with $73,750 per family, while 2-person families (7 | 53.8%) have the highest median income of $32,032 per family member.
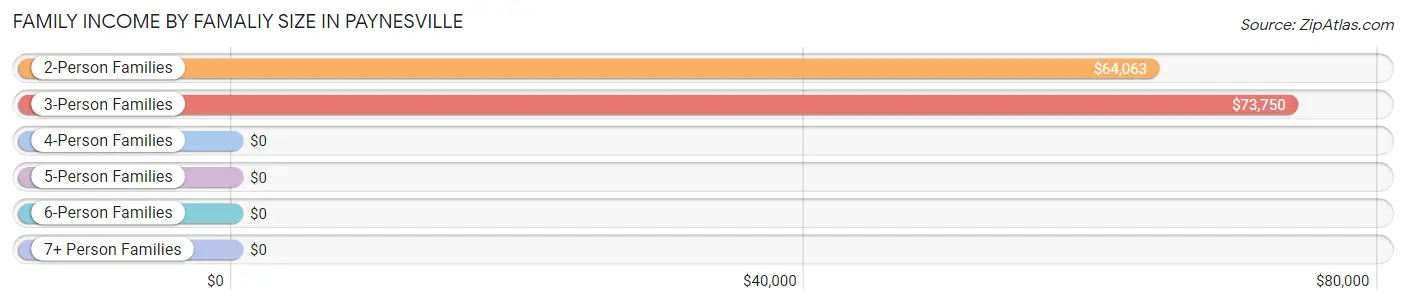
| Income Bracket | # Families | Median Income |
| 2-Person Families | 7 (53.8%) | $64,063 |
| 3-Person Families | 6 (46.2%) | $73,750 |
| 4-Person Families | 0 (0.0%) | $0 |
| 5-Person Families | 0 (0.0%) | $0 |
| 6-Person Families | 0 (0.0%) | $0 |
| 7+ Person Families | 0 (0.0%) | $0 |
| Total | 13 (100.0%) | $64,063 |
Family Income by Number of Earners in Paynesville
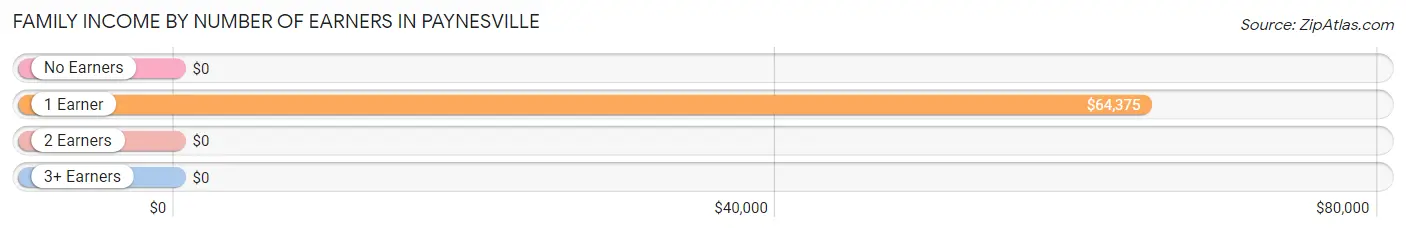
| Number of Earners | # Families | Median Income |
| No Earners | 1 (7.7%) | $0 |
| 1 Earner | 12 (92.3%) | $64,375 |
| 2 Earners | 0 (0.0%) | $0 |
| 3+ Earners | 0 (0.0%) | $0 |
| Total | 13 (100.0%) | $64,063 |
Household Income in Paynesville
Household Income Brackets in Paynesville
With 7 households falling in the category, the $15,000 to $24,999 income range is the most frequent in Paynesville, accounting for 29.2% of all households.
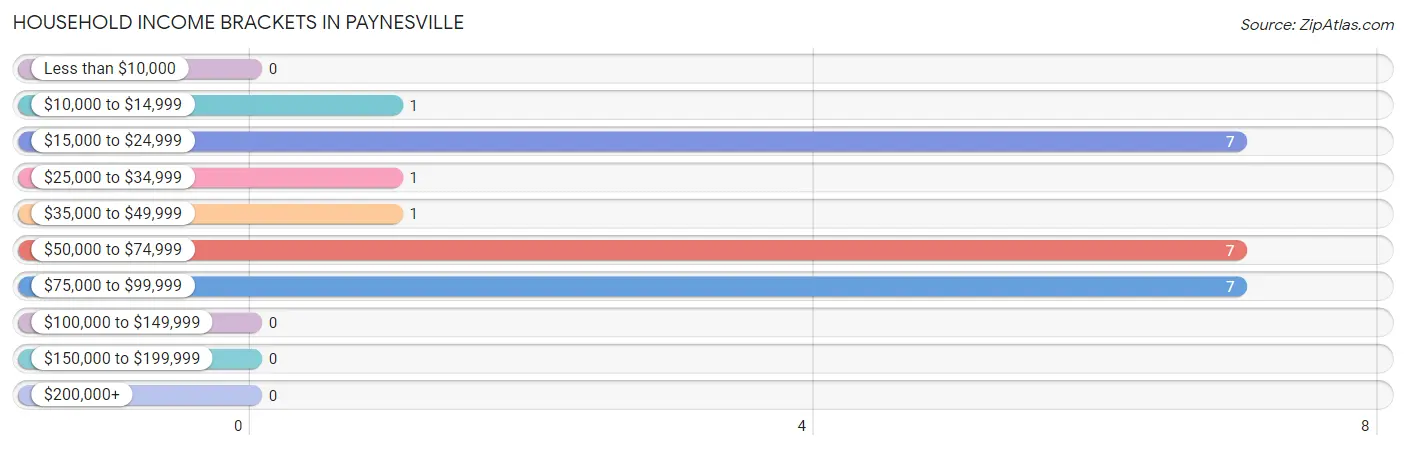
| Income Bracket | # Households | % Households |
| Less than $10,000 | 0 | 0.0% |
| $10,000 to $14,999 | 1 | 4.2% |
| $15,000 to $24,999 | 7 | 29.2% |
| $25,000 to $34,999 | 1 | 4.2% |
| $35,000 to $49,999 | 1 | 4.2% |
| $50,000 to $74,999 | 7 | 29.2% |
| $75,000 to $99,999 | 7 | 29.2% |
| $100,000 to $149,999 | 0 | 0.0% |
| $150,000 to $199,999 | 0 | 0.0% |
| $200,000+ | 0 | 0.0% |
Household Income by Householder Age in Paynesville
The median household income in Paynesville is $60,000, with the highest median household income of $63,125 found in the 65+ years age bracket for the primary householder. A total of 8 households (33.3%) fall into this category.
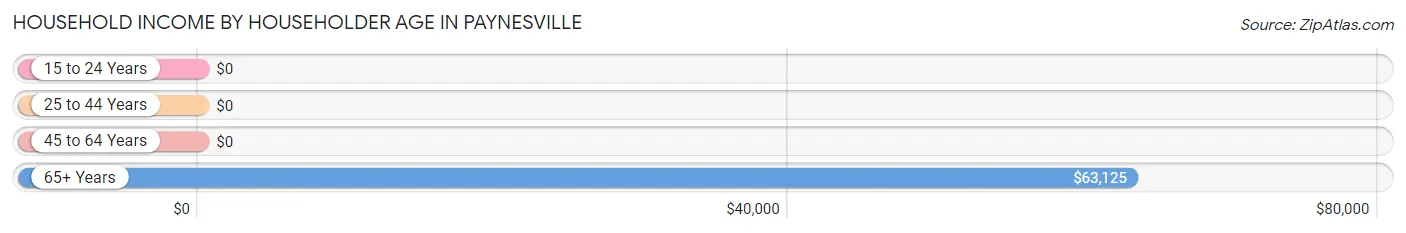
| Income Bracket | # Households | Median Income |
| 15 to 24 Years | 0 (0.0%) | $0 |
| 25 to 44 Years | 3 (12.5%) | $0 |
| 45 to 64 Years | 13 (54.2%) | $0 |
| 65+ Years | 8 (33.3%) | $63,125 |
| Total | 24 (100.0%) | $60,000 |
Poverty in Paynesville
Income Below Poverty by Sex and Age in Paynesville
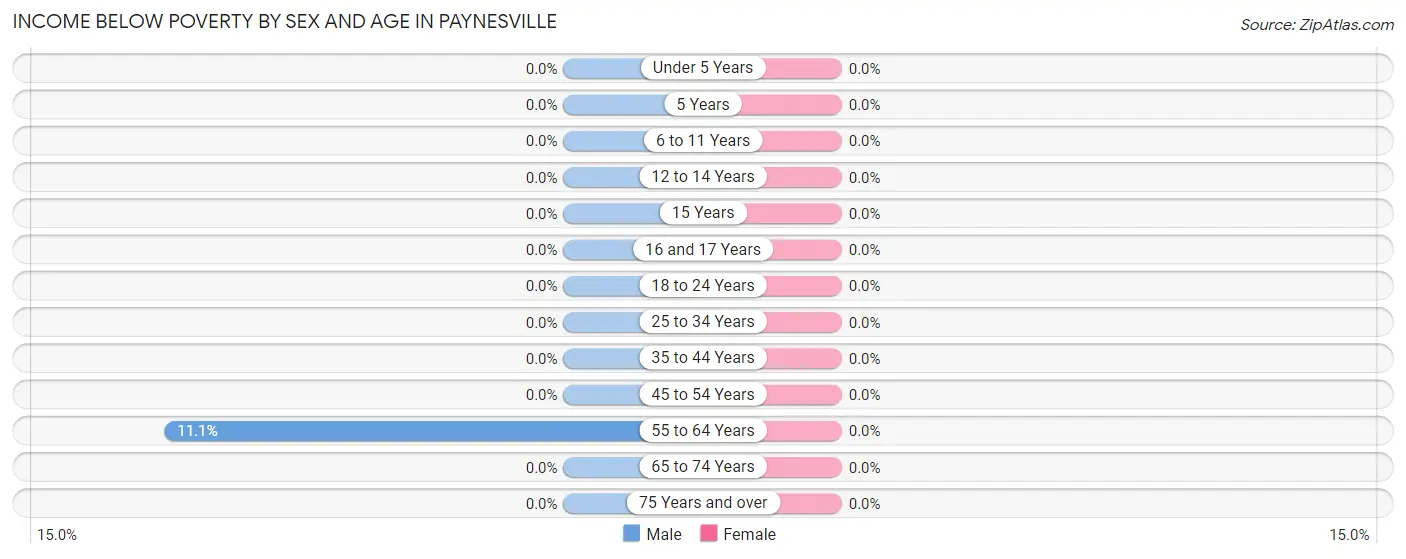
| Age Bracket | Male | Female |
| Under 5 Years | 0 (0.0%) | 0 (0.0%) |
| 5 Years | 0 (0.0%) | 0 (0.0%) |
| 6 to 11 Years | 0 (0.0%) | 0 (0.0%) |
| 12 to 14 Years | 0 (0.0%) | 0 (0.0%) |
| 15 Years | 0 (0.0%) | 0 (0.0%) |
| 16 and 17 Years | 0 (0.0%) | 0 (0.0%) |
| 18 to 24 Years | 0 (0.0%) | 0 (0.0%) |
| 25 to 34 Years | 0 (0.0%) | 0 (0.0%) |
| 35 to 44 Years | 0 (0.0%) | 0 (0.0%) |
| 45 to 54 Years | 0 (0.0%) | 0 (0.0%) |
| 55 to 64 Years | 1 (11.1%) | 0 (0.0%) |
| 65 to 74 Years | 0 (0.0%) | 0 (0.0%) |
| 75 Years and over | 0 (0.0%) | 0 (0.0%) |
| Total | 1 (3.7%) | 0 (0.0%) |
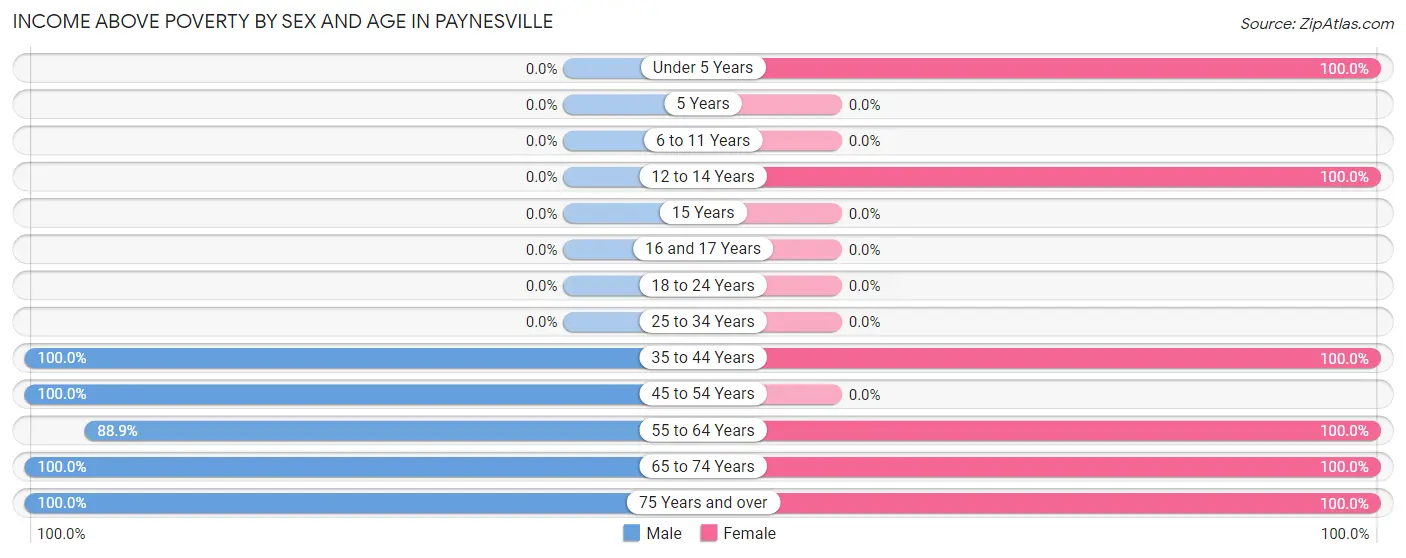
Income Above Poverty by Sex and Age in Paynesville
According to the poverty statistics in Paynesville, males aged 35 to 44 years and females aged under 5 years are the age groups that are most secure financially, with 100.0% of males and 100.0% of females in these age groups living above the poverty line.
| Age Bracket | Male | Female |
| Under 5 Years | 0 (0.0%) | 1 (100.0%) |
| 5 Years | 0 (0.0%) | 0 (0.0%) |
| 6 to 11 Years | 0 (0.0%) | 0 (0.0%) |
| 12 to 14 Years | 0 (0.0%) | 2 (100.0%) |
| 15 Years | 0 (0.0%) | 0 (0.0%) |
| 16 and 17 Years | 0 (0.0%) | 0 (0.0%) |
| 18 to 24 Years | 0 (0.0%) | 0 (0.0%) |
| 25 to 34 Years | 0 (0.0%) | 0 (0.0%) |
| 35 to 44 Years | 6 (100.0%) | 1 (100.0%) |
| 45 to 54 Years | 4 (100.0%) | 0 (0.0%) |
| 55 to 64 Years | 8 (88.9%) | 1 (100.0%) |
| 65 to 74 Years | 7 (100.0%) | 7 (100.0%) |
| 75 Years and over | 1 (100.0%) | 2 (100.0%) |
| Total | 26 (96.3%) | 14 (100.0%) |
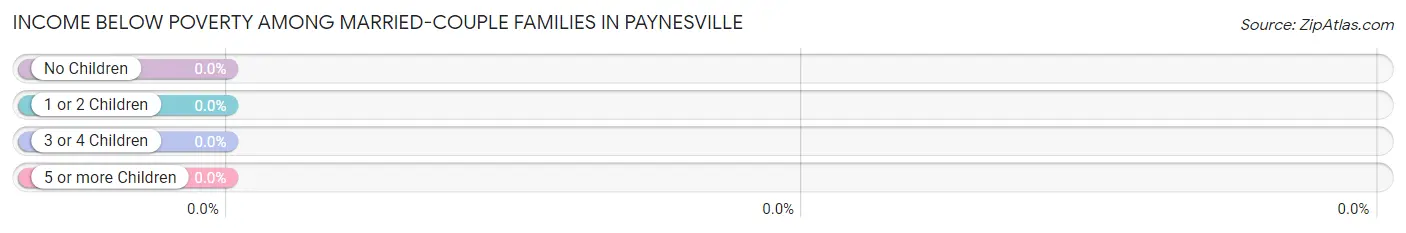
Income Below Poverty Among Married-Couple Families in Paynesville
| Children | Above Poverty | Below Poverty |
| No Children | 3 (100.0%) | 0 (0.0%) |
| 1 or 2 Children | 3 (100.0%) | 0 (0.0%) |
| 3 or 4 Children | 0 (0.0%) | 0 (0.0%) |
| 5 or more Children | 0 (0.0%) | 0 (0.0%) |
| Total | 6 (100.0%) | 0 (0.0%) |
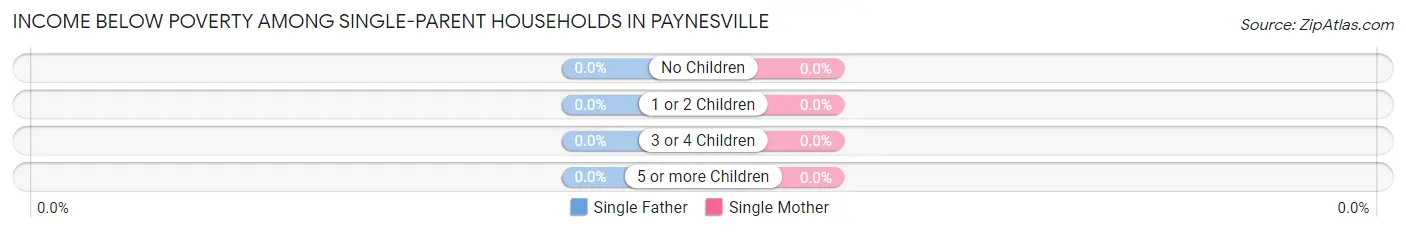
Income Below Poverty Among Single-Parent Households in Paynesville
| Children | Single Father | Single Mother |
| No Children | 0 (0.0%) | 0 (0.0%) |
| 1 or 2 Children | 0 (0.0%) | 0 (0.0%) |
| 3 or 4 Children | 0 (0.0%) | 0 (0.0%) |
| 5 or more Children | 0 (0.0%) | 0 (0.0%) |
| Total | 0 (0.0%) | 0 (0.0%) |
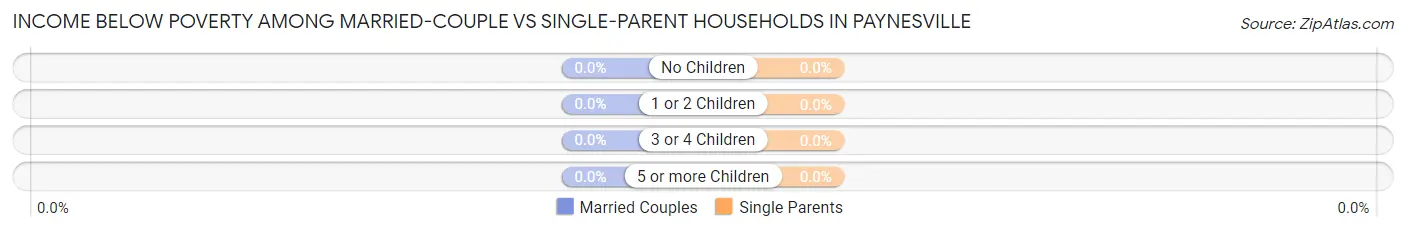
Income Below Poverty Among Married-Couple vs Single-Parent Households in Paynesville
| Children | Married-Couple Families | Single-Parent Households |
| No Children | 0 (0.0%) | 0 (0.0%) |
| 1 or 2 Children | 0 (0.0%) | 0 (0.0%) |
| 3 or 4 Children | 0 (0.0%) | 0 (0.0%) |
| 5 or more Children | 0 (0.0%) | 0 (0.0%) |
| Total | 0 (0.0%) | 0 (0.0%) |
Employment Characteristics in Paynesville
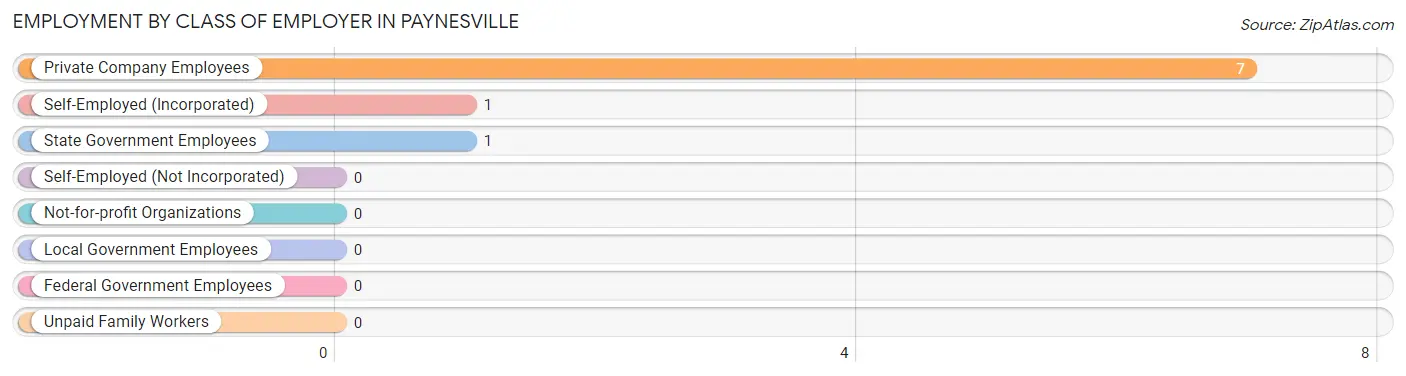
Employment by Class of Employer in Paynesville
Among the 9 employed individuals in Paynesville, private company employees (7 | 77.8%), self-employed (incorporated) (1 | 11.1%), and state government employees (1 | 11.1%) make up the most common classes of employment.
| Employer Class | # Employees | % Employees |
| Private Company Employees | 7 | 77.8% |
| Self-Employed (Incorporated) | 1 | 11.1% |
| Self-Employed (Not Incorporated) | 0 | 0.0% |
| Not-for-profit Organizations | 0 | 0.0% |
| Local Government Employees | 0 | 0.0% |
| State Government Employees | 1 | 11.1% |
| Federal Government Employees | 0 | 0.0% |
| Unpaid Family Workers | 0 | 0.0% |
| Total | 9 | 100.0% |
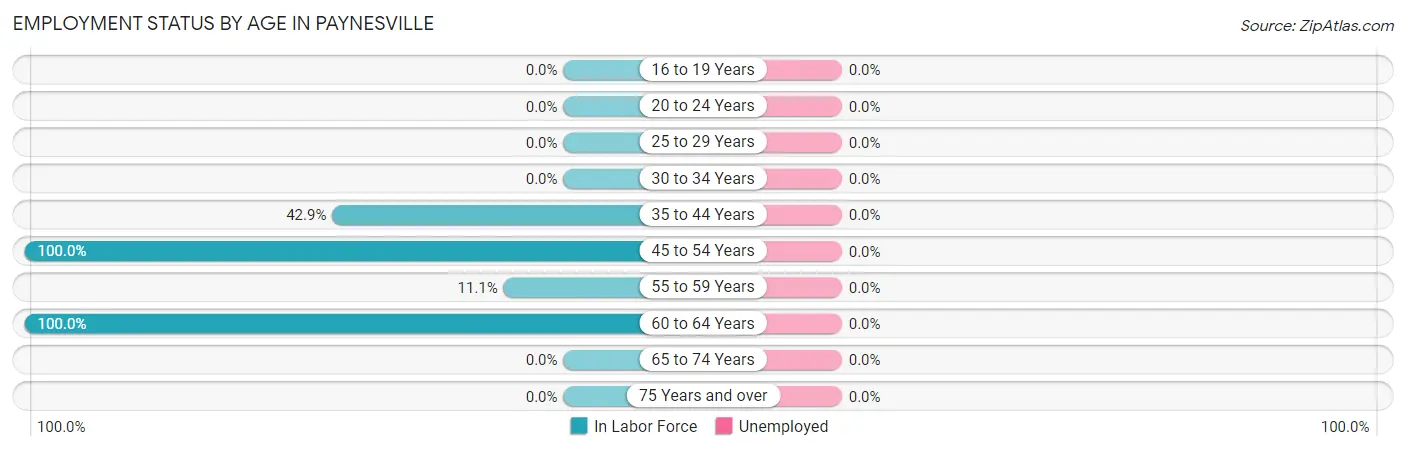
Employment Status by Age in Paynesville
| Age Bracket | In Labor Force | Unemployed |
| 16 to 19 Years | 0 (0.0%) | 0 (0.0%) |
| 20 to 24 Years | 0 (0.0%) | 0 (0.0%) |
| 25 to 29 Years | 0 (0.0%) | 0 (0.0%) |
| 30 to 34 Years | 0 (0.0%) | 0 (0.0%) |
| 35 to 44 Years | 3 (42.9%) | 0 (0.0%) |
| 45 to 54 Years | 4 (100.0%) | 0 (0.0%) |
| 55 to 59 Years | 1 (11.1%) | 0 (0.0%) |
| 60 to 64 Years | 1 (100.0%) | 0 (0.0%) |
| 65 to 74 Years | 0 (0.0%) | 0 (0.0%) |
| 75 Years and over | 0 (0.0%) | 0 (0.0%) |
| Total | 9 (23.7%) | 0 (0.0%) |
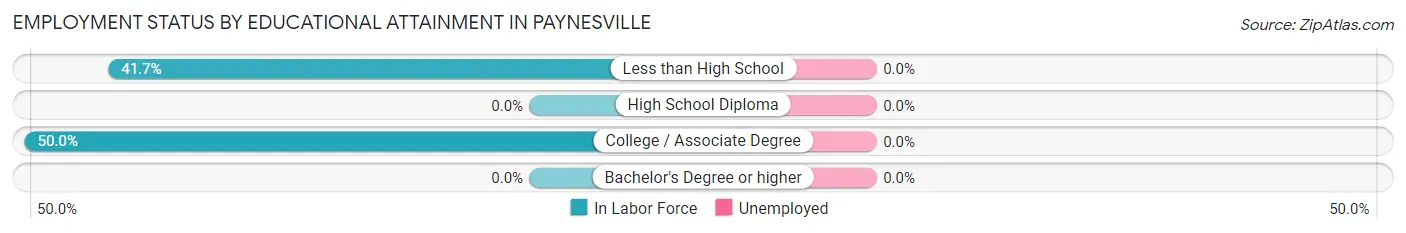
Employment Status by Educational Attainment in Paynesville
| Educational Attainment | In Labor Force | Unemployed |
| Less than High School | 5 (41.7%) | 0 (0.0%) |
| High School Diploma | 0 (0.0%) | 0 (0.0%) |
| College / Associate Degree | 4 (50.0%) | 0 (0.0%) |
| Bachelor's Degree or higher | 0 (0.0%) | 0 (0.0%) |
| Total | 9 (42.9%) | 0 (0.0%) |
Employment Occupations by Sex in Paynesville
Management, Business, Science and Arts Occupations
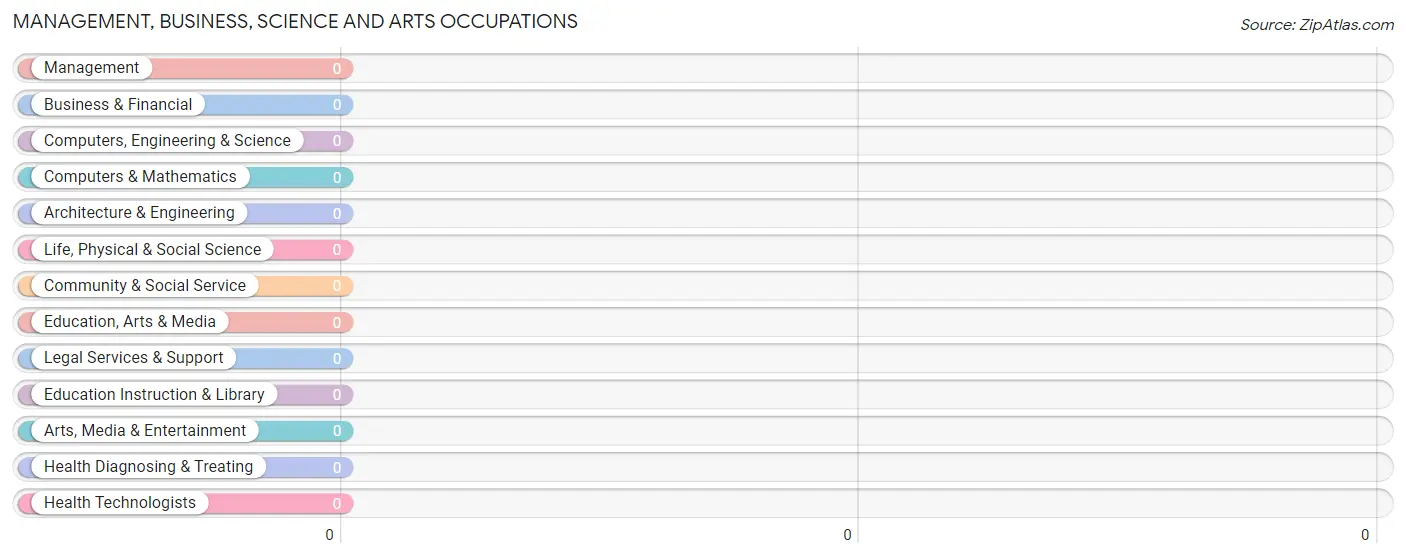
Management, Business, Science and Arts Occupations by Sex
| Occupation | Male | Female |
| Management | 0 (0.0%) | 0 (0.0%) |
| Business & Financial | 0 (0.0%) | 0 (0.0%) |
| Computers, Engineering & Science | 0 (0.0%) | 0 (0.0%) |
| Computers & Mathematics | 0 (0.0%) | 0 (0.0%) |
| Architecture & Engineering | 0 (0.0%) | 0 (0.0%) |
| Life, Physical & Social Science | 0 (0.0%) | 0 (0.0%) |
| Community & Social Service | 0 (0.0%) | 0 (0.0%) |
| Education, Arts & Media | 0 (0.0%) | 0 (0.0%) |
| Legal Services & Support | 0 (0.0%) | 0 (0.0%) |
| Education Instruction & Library | 0 (0.0%) | 0 (0.0%) |
| Arts, Media & Entertainment | 0 (0.0%) | 0 (0.0%) |
| Health Diagnosing & Treating | 0 (0.0%) | 0 (0.0%) |
| Health Technologists | 0 (0.0%) | 0 (0.0%) |
| Total (Category) | 0 (0.0%) | 0 (0.0%) |
| Total (Overall) | 8 (88.9%) | 1 (11.1%) |
Services Occupations
The most common Services occupations in Paynesville are , and Food Preparation & Serving (1 | 11.1%).
Services Occupations by Sex
| Occupation | Male | Female |
| Healthcare Support | 0 (0.0%) | 0 (0.0%) |
| Security & Protection | 0 (0.0%) | 0 (0.0%) |
| Firefighting & Prevention | 0 (0.0%) | 0 (0.0%) |
| Law Enforcement | 0 (0.0%) | 0 (0.0%) |
| Food Preparation & Serving | 1 (100.0%) | 0 (0.0%) |
| Cleaning & Maintenance | 0 (0.0%) | 0 (0.0%) |
| Personal Care & Service | 0 (0.0%) | 0 (0.0%) |
| Total (Category) | 1 (100.0%) | 0 (0.0%) |
| Total (Overall) | 8 (88.9%) | 1 (11.1%) |
Sales and Office Occupations
The most common Sales and Office occupations in Paynesville are , and Office & Administration (1 | 11.1%).
Sales and Office Occupations by Sex
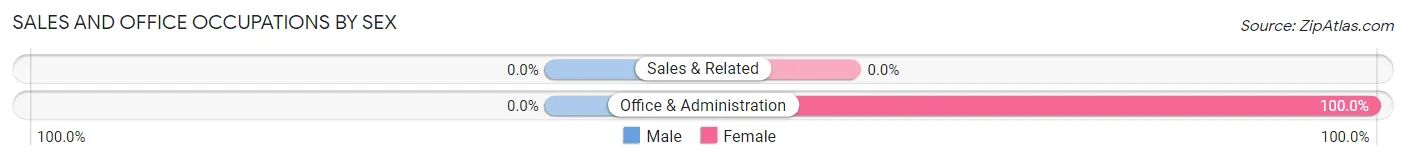
| Occupation | Male | Female |
| Sales & Related | 0 (0.0%) | 0 (0.0%) |
| Office & Administration | 0 (0.0%) | 1 (100.0%) |
| Total (Category) | 0 (0.0%) | 1 (100.0%) |
| Total (Overall) | 8 (88.9%) | 1 (11.1%) |
Natural Resources, Construction and Maintenance Occupations
The most common Natural Resources, Construction and Maintenance occupations in Paynesville are Construction & Extraction (3 | 33.3%), and Installation, Maintenance & Repair (3 | 33.3%).
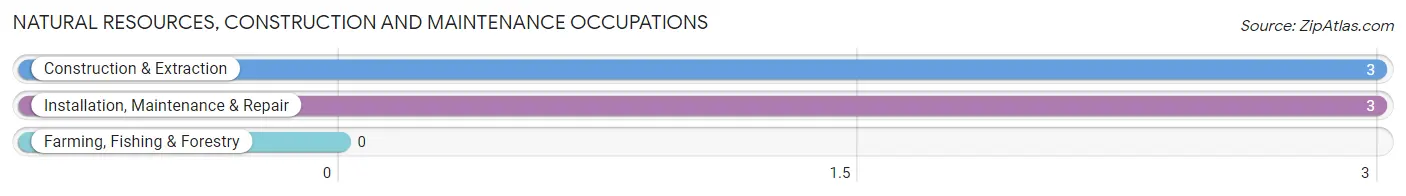
Natural Resources, Construction and Maintenance Occupations by Sex
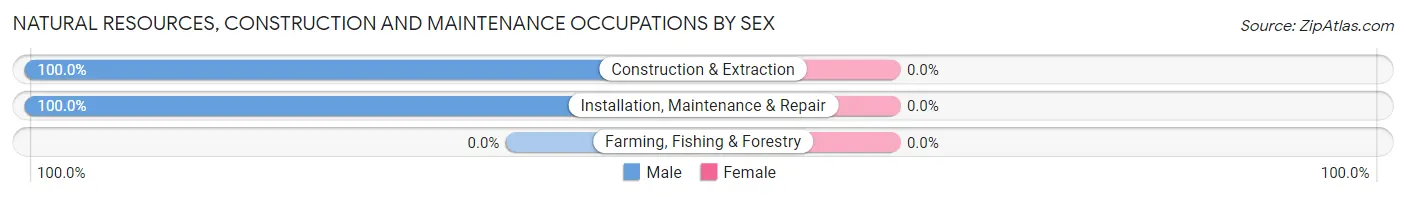
| Occupation | Male | Female |
| Farming, Fishing & Forestry | 0 (0.0%) | 0 (0.0%) |
| Construction & Extraction | 3 (100.0%) | 0 (0.0%) |
| Installation, Maintenance & Repair | 3 (100.0%) | 0 (0.0%) |
| Total (Category) | 6 (100.0%) | 0 (0.0%) |
| Total (Overall) | 8 (88.9%) | 1 (11.1%) |
Production, Transportation and Moving Occupations
The most common Production, Transportation and Moving occupations in Paynesville are , and Transportation (1 | 11.1%).
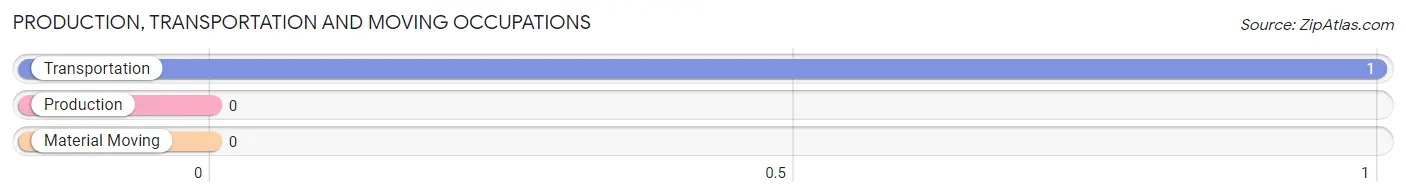
Production, Transportation and Moving Occupations by Sex
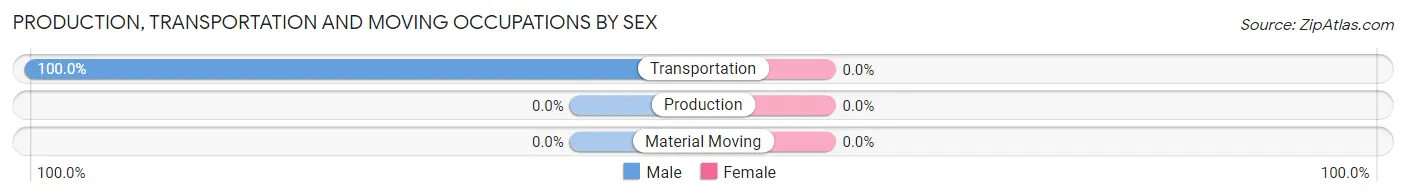
| Occupation | Male | Female |
| Production | 0 (0.0%) | 0 (0.0%) |
| Transportation | 1 (100.0%) | 0 (0.0%) |
| Material Moving | 0 (0.0%) | 0 (0.0%) |
| Total (Category) | 1 (100.0%) | 0 (0.0%) |
| Total (Overall) | 8 (88.9%) | 1 (11.1%) |
Employment Industries by Sex in Paynesville
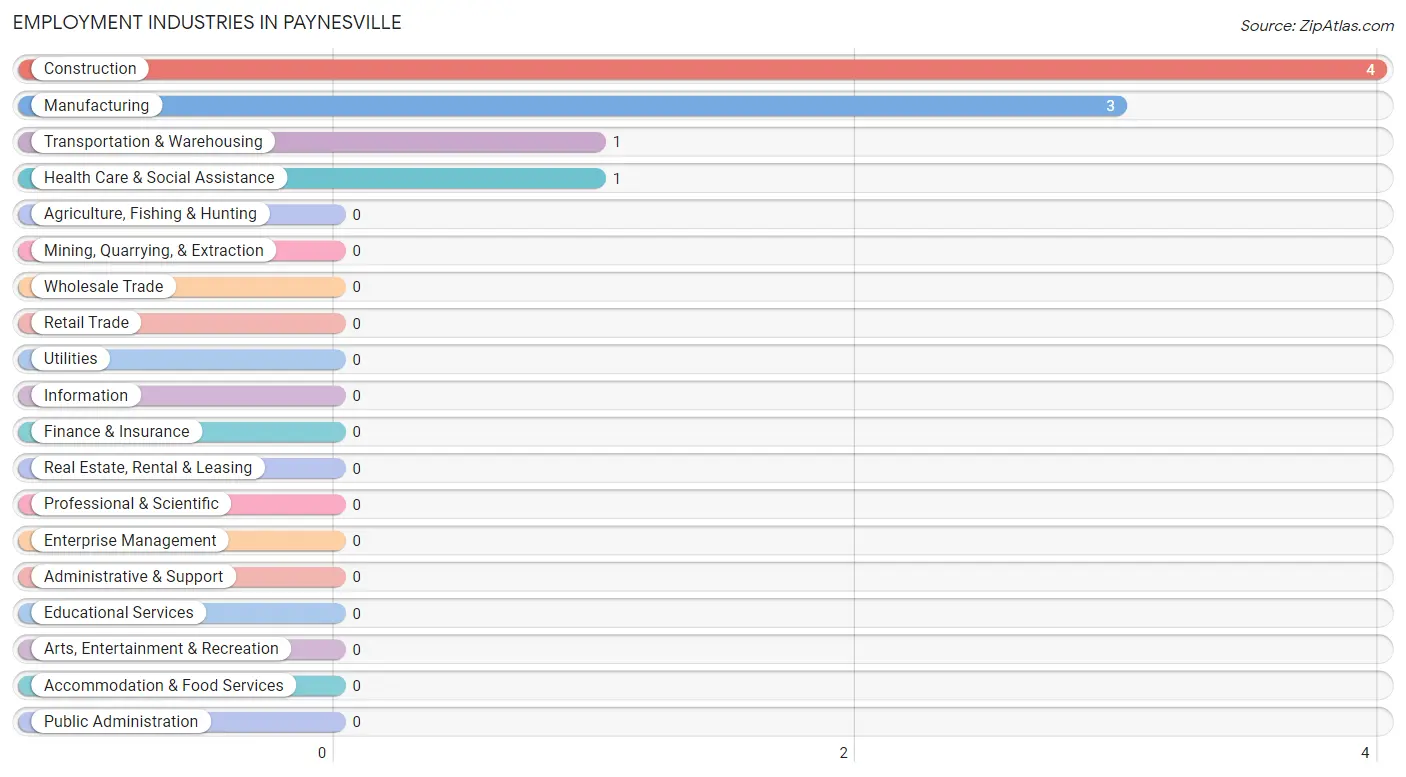
Employment Industries in Paynesville
The major employment industries in Paynesville include Construction (4 | 44.4%), Manufacturing (3 | 33.3%), Transportation & Warehousing (1 | 11.1%), and Health Care & Social Assistance (1 | 11.1%).
Employment Industries by Sex in Paynesville
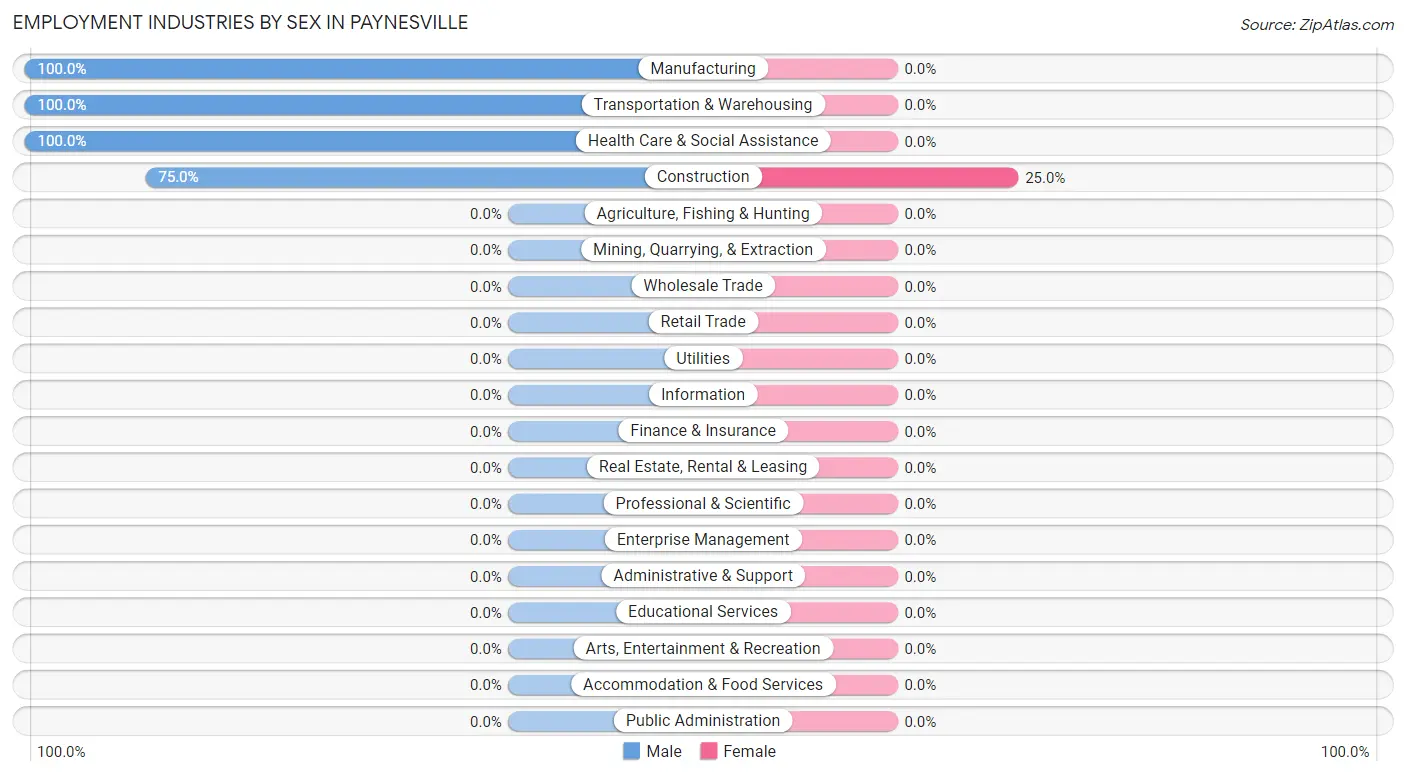
| Industry | Male | Female |
| Agriculture, Fishing & Hunting | 0 (0.0%) | 0 (0.0%) |
| Mining, Quarrying, & Extraction | 0 (0.0%) | 0 (0.0%) |
| Construction | 3 (75.0%) | 1 (25.0%) |
| Manufacturing | 3 (100.0%) | 0 (0.0%) |
| Wholesale Trade | 0 (0.0%) | 0 (0.0%) |
| Retail Trade | 0 (0.0%) | 0 (0.0%) |
| Transportation & Warehousing | 1 (100.0%) | 0 (0.0%) |
| Utilities | 0 (0.0%) | 0 (0.0%) |
| Information | 0 (0.0%) | 0 (0.0%) |
| Finance & Insurance | 0 (0.0%) | 0 (0.0%) |
| Real Estate, Rental & Leasing | 0 (0.0%) | 0 (0.0%) |
| Professional & Scientific | 0 (0.0%) | 0 (0.0%) |
| Enterprise Management | 0 (0.0%) | 0 (0.0%) |
| Administrative & Support | 0 (0.0%) | 0 (0.0%) |
| Educational Services | 0 (0.0%) | 0 (0.0%) |
| Health Care & Social Assistance | 1 (100.0%) | 0 (0.0%) |
| Arts, Entertainment & Recreation | 0 (0.0%) | 0 (0.0%) |
| Accommodation & Food Services | 0 (0.0%) | 0 (0.0%) |
| Public Administration | 0 (0.0%) | 0 (0.0%) |
| Total | 8 (88.9%) | 1 (11.1%) |
Education in Paynesville
School Enrollment in Paynesville
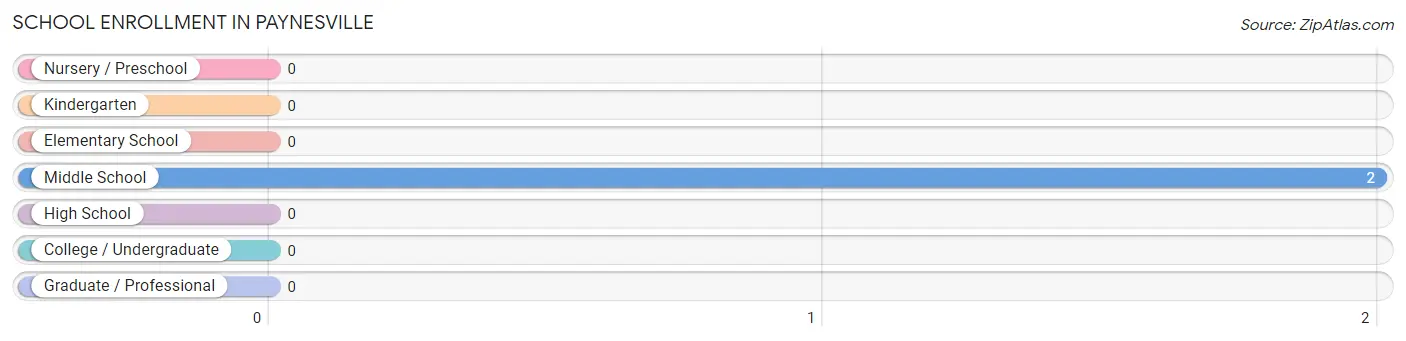
| School Level | # Students | % Students |
| Nursery / Preschool | 0 | 0.0% |
| Kindergarten | 0 | 0.0% |
| Elementary School | 0 | 0.0% |
| Middle School | 2 | 100.0% |
| High School | 0 | 0.0% |
| College / Undergraduate | 0 | 0.0% |
| Graduate / Professional | 0 | 0.0% |
| Total | 2 | 100.0% |
School Enrollment by Age by Funding Source in Paynesville
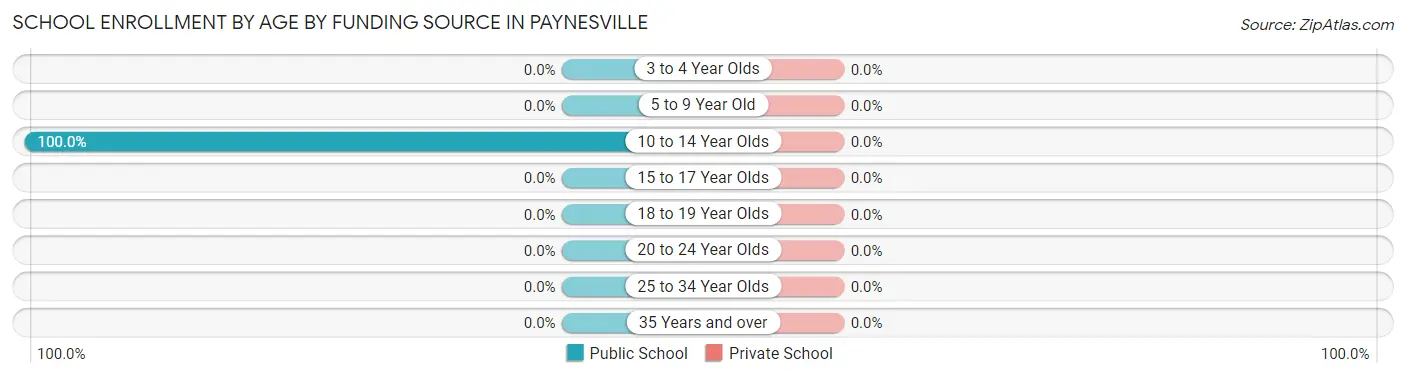
| Age Bracket | Public School | Private School |
| 3 to 4 Year Olds | 0 (0.0%) | 0 (0.0%) |
| 5 to 9 Year Old | 0 (0.0%) | 0 (0.0%) |
| 10 to 14 Year Olds | 2 (100.0%) | 0 (0.0%) |
| 15 to 17 Year Olds | 0 (0.0%) | 0 (0.0%) |
| 18 to 19 Year Olds | 0 (0.0%) | 0 (0.0%) |
| 20 to 24 Year Olds | 0 (0.0%) | 0 (0.0%) |
| 25 to 34 Year Olds | 0 (0.0%) | 0 (0.0%) |
| 35 Years and over | 0 (0.0%) | 0 (0.0%) |
| Total | 2 (100.0%) | 0 (0.0%) |
Educational Attainment by Field of Study in Paynesville
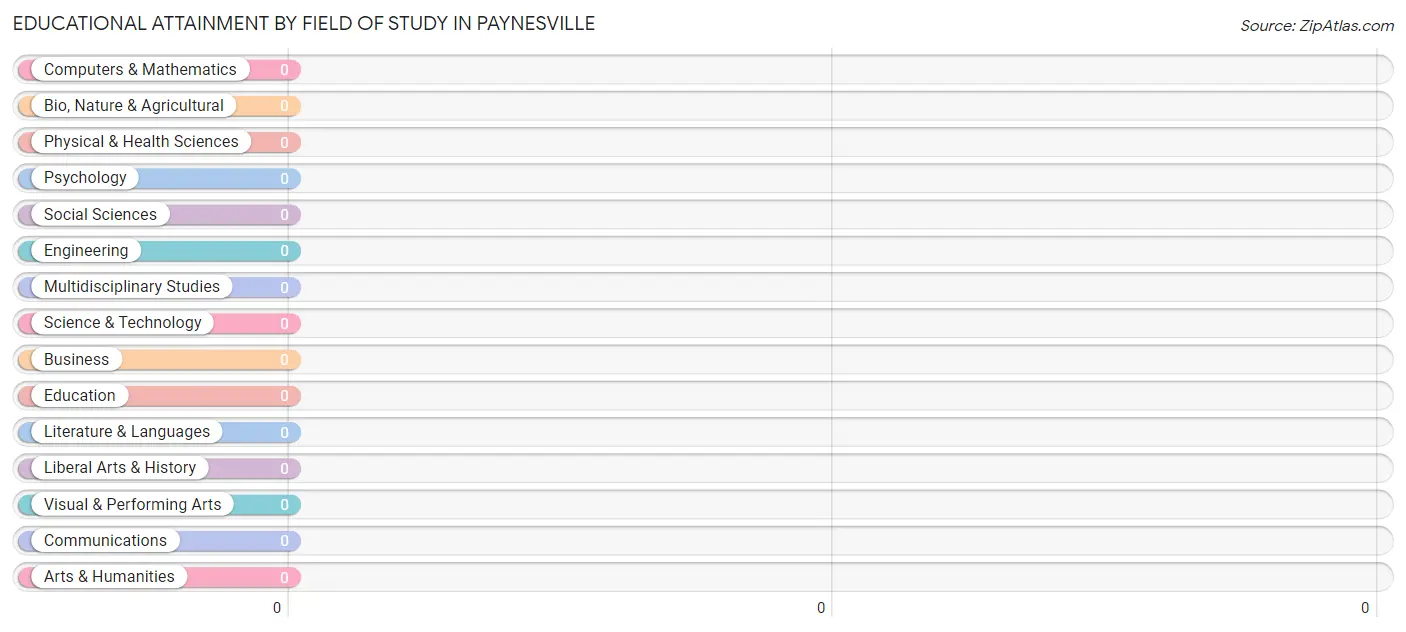
| Field of Study | # Graduates | % Graduates |
| Computers & Mathematics | 0 | 0.0% |
| Bio, Nature & Agricultural | 0 | 0.0% |
| Physical & Health Sciences | 0 | 0.0% |
| Psychology | 0 | 0.0% |
| Social Sciences | 0 | 0.0% |
| Engineering | 0 | 0.0% |
| Multidisciplinary Studies | 0 | 0.0% |
| Science & Technology | 0 | 0.0% |
| Business | 0 | 0.0% |
| Education | 0 | 0.0% |
| Literature & Languages | 0 | 0.0% |
| Liberal Arts & History | 0 | 0.0% |
| Visual & Performing Arts | 0 | 0.0% |
| Communications | 0 | 0.0% |
| Arts & Humanities | 0 | 0.0% |
| Total | 0 | 0.0% |
Transportation & Commute in Paynesville
Vehicle Availability by Sex in Paynesville
The most prevalent vehicle ownership categories in Paynesville are males with 2 vehicles (8, accounting for 100.0%) and females with 2 vehicles (1, making up 800.0%).
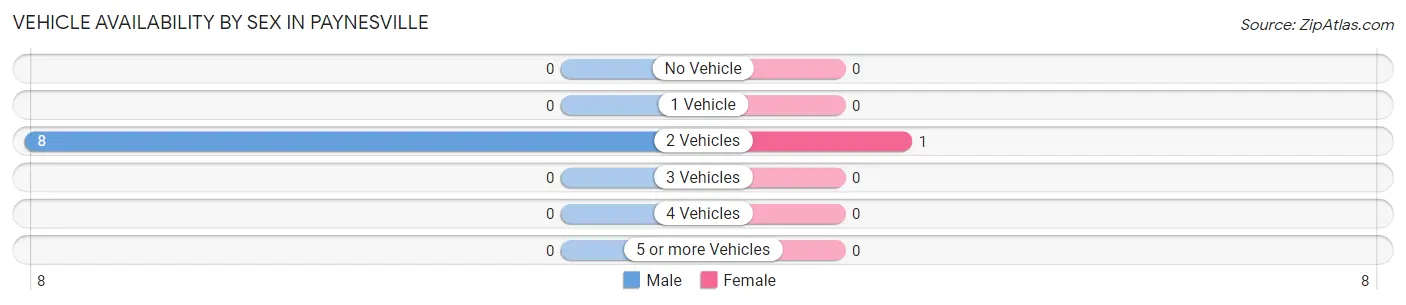
| Vehicles Available | Male | Female |
| No Vehicle | 0 (0.0%) | 0 (0.0%) |
| 1 Vehicle | 0 (0.0%) | 0 (0.0%) |
| 2 Vehicles | 8 (100.0%) | 1 (100.0%) |
| 3 Vehicles | 0 (0.0%) | 0 (0.0%) |
| 4 Vehicles | 0 (0.0%) | 0 (0.0%) |
| 5 or more Vehicles | 0 (0.0%) | 0 (0.0%) |
| Total | 8 (100.0%) | 1 (100.0%) |
Commute Time in Paynesville
The most frequently occuring commute durations in Paynesville are 30 to 34 minutes (5 commuters, 55.6%), 90 or more minutes (3 commuters, 33.3%), and 40 to 44 minutes (1 commuters, 11.1%).
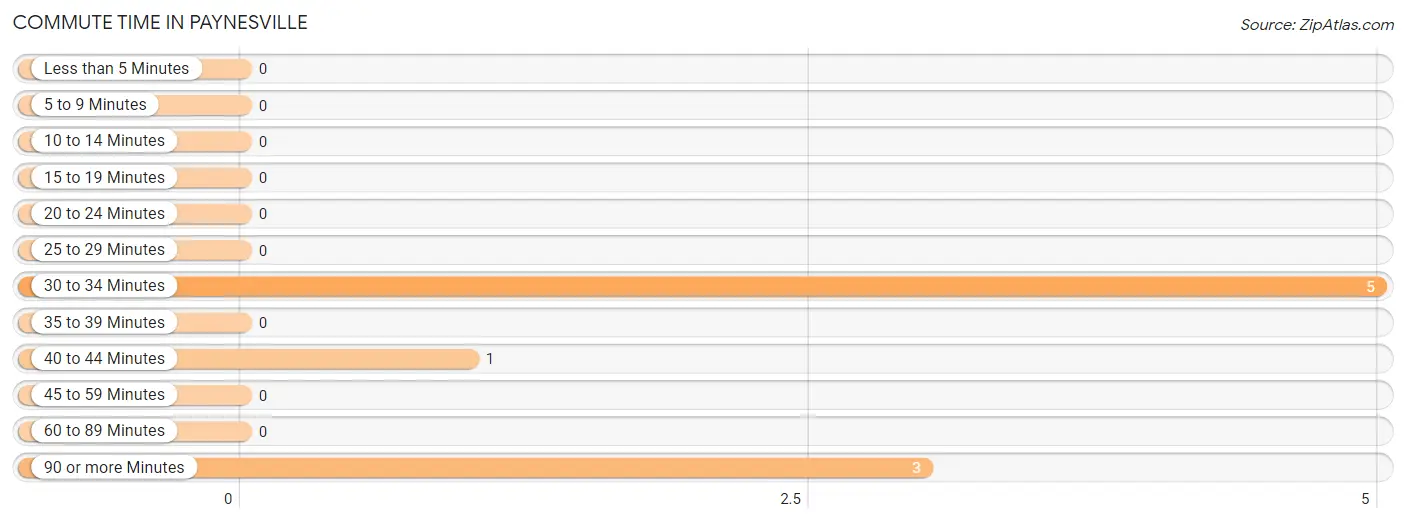
| Commute Time | # Commuters | % Commuters |
| Less than 5 Minutes | 0 | 0.0% |
| 5 to 9 Minutes | 0 | 0.0% |
| 10 to 14 Minutes | 0 | 0.0% |
| 15 to 19 Minutes | 0 | 0.0% |
| 20 to 24 Minutes | 0 | 0.0% |
| 25 to 29 Minutes | 0 | 0.0% |
| 30 to 34 Minutes | 5 | 55.6% |
| 35 to 39 Minutes | 0 | 0.0% |
| 40 to 44 Minutes | 1 | 11.1% |
| 45 to 59 Minutes | 0 | 0.0% |
| 60 to 89 Minutes | 0 | 0.0% |
| 90 or more Minutes | 3 | 33.3% |
Commute Time by Sex in Paynesville
The most common commute times in Paynesville are 30 to 34 minutes (4 commuters, 50.0%) for males and 30 to 34 minutes (1 commuters, 100.0%) for females.
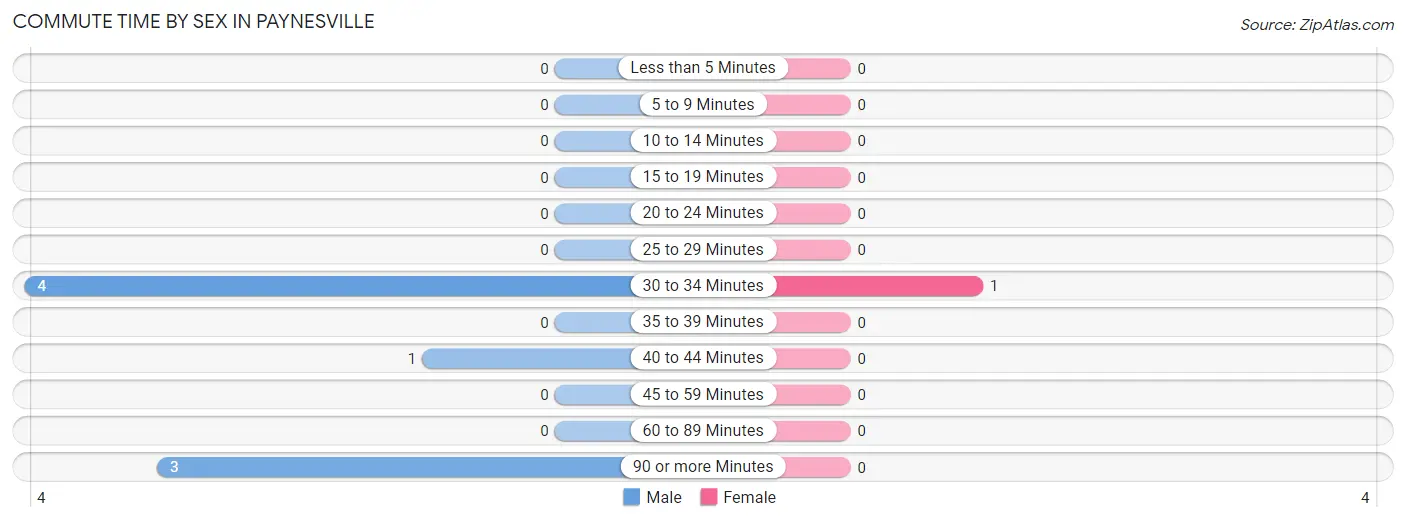
| Commute Time | Male | Female |
| Less than 5 Minutes | 0 (0.0%) | 0 (0.0%) |
| 5 to 9 Minutes | 0 (0.0%) | 0 (0.0%) |
| 10 to 14 Minutes | 0 (0.0%) | 0 (0.0%) |
| 15 to 19 Minutes | 0 (0.0%) | 0 (0.0%) |
| 20 to 24 Minutes | 0 (0.0%) | 0 (0.0%) |
| 25 to 29 Minutes | 0 (0.0%) | 0 (0.0%) |
| 30 to 34 Minutes | 4 (50.0%) | 1 (100.0%) |
| 35 to 39 Minutes | 0 (0.0%) | 0 (0.0%) |
| 40 to 44 Minutes | 1 (12.5%) | 0 (0.0%) |
| 45 to 59 Minutes | 0 (0.0%) | 0 (0.0%) |
| 60 to 89 Minutes | 0 (0.0%) | 0 (0.0%) |
| 90 or more Minutes | 3 (37.5%) | 0 (0.0%) |
Time of Departure to Work by Sex in Paynesville
The most frequent times of departure to work in Paynesville are 5:00 AM to 5:29 AM (4, 50.0%) for males and 6:30 AM to 6:59 AM (1, 100.0%) for females.
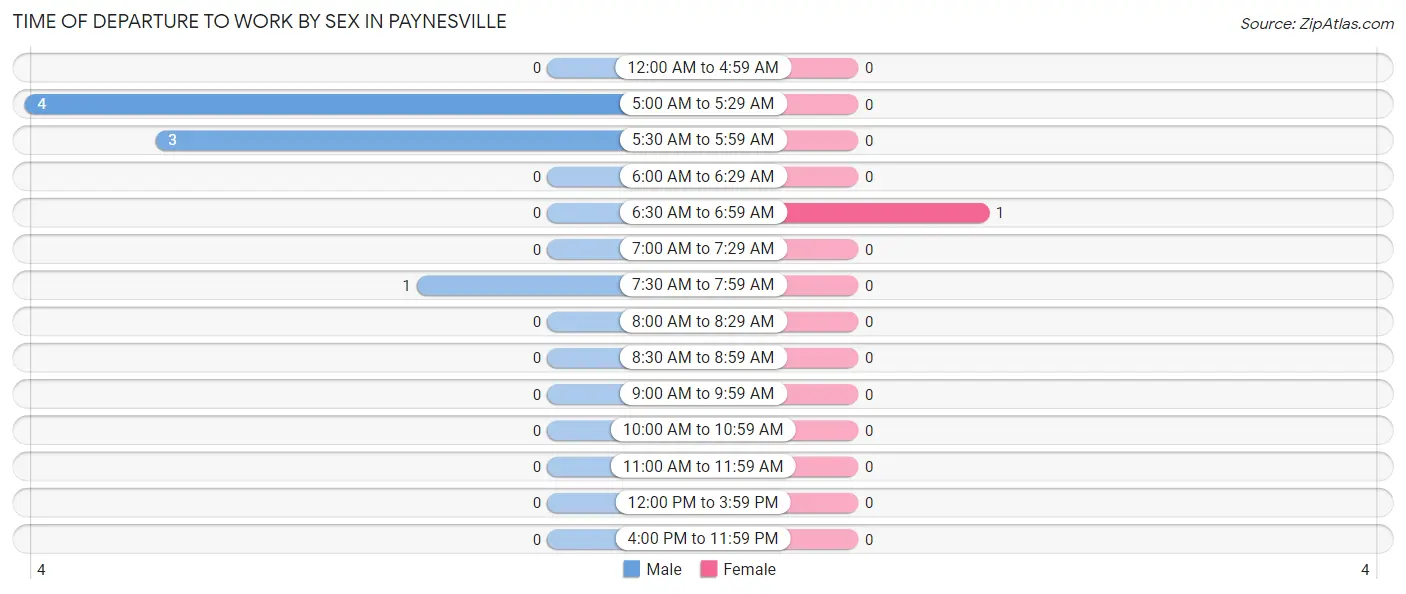
| Time of Departure | Male | Female |
| 12:00 AM to 4:59 AM | 0 (0.0%) | 0 (0.0%) |
| 5:00 AM to 5:29 AM | 4 (50.0%) | 0 (0.0%) |
| 5:30 AM to 5:59 AM | 3 (37.5%) | 0 (0.0%) |
| 6:00 AM to 6:29 AM | 0 (0.0%) | 0 (0.0%) |
| 6:30 AM to 6:59 AM | 0 (0.0%) | 1 (100.0%) |
| 7:00 AM to 7:29 AM | 0 (0.0%) | 0 (0.0%) |
| 7:30 AM to 7:59 AM | 1 (12.5%) | 0 (0.0%) |
| 8:00 AM to 8:29 AM | 0 (0.0%) | 0 (0.0%) |
| 8:30 AM to 8:59 AM | 0 (0.0%) | 0 (0.0%) |
| 9:00 AM to 9:59 AM | 0 (0.0%) | 0 (0.0%) |
| 10:00 AM to 10:59 AM | 0 (0.0%) | 0 (0.0%) |
| 11:00 AM to 11:59 AM | 0 (0.0%) | 0 (0.0%) |
| 12:00 PM to 3:59 PM | 0 (0.0%) | 0 (0.0%) |
| 4:00 PM to 11:59 PM | 0 (0.0%) | 0 (0.0%) |
| Total | 8 (100.0%) | 1 (100.0%) |
Housing Occupancy in Paynesville
Occupancy by Ownership in Paynesville
Of the total 24 dwellings in Paynesville, owner-occupied units account for 16 (66.7%), while renter-occupied units make up 8 (33.3%).
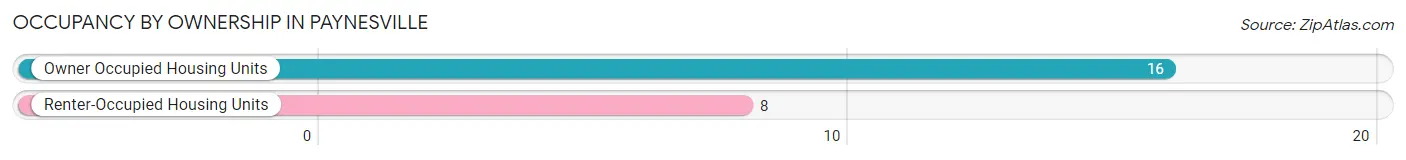
| Occupancy | # Housing Units | % Housing Units |
| Owner Occupied Housing Units | 16 | 66.7% |
| Renter-Occupied Housing Units | 8 | 33.3% |
| Total Occupied Housing Units | 24 | 100.0% |
Occupancy by Household Size in Paynesville
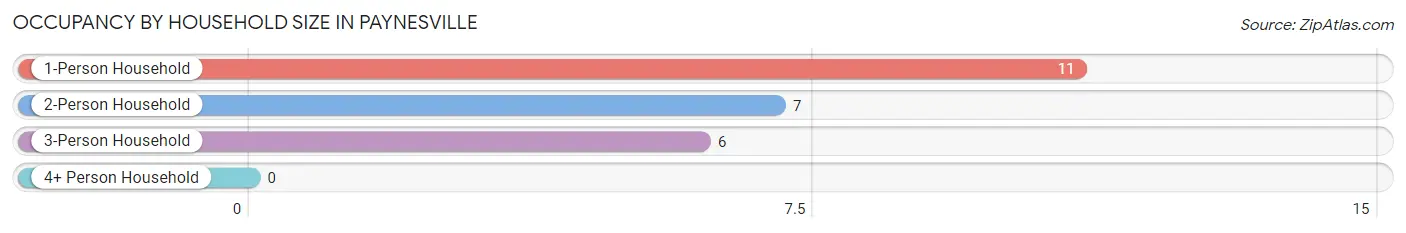
| Household Size | # Housing Units | % Housing Units |
| 1-Person Household | 11 | 45.8% |
| 2-Person Household | 7 | 29.2% |
| 3-Person Household | 6 | 25.0% |
| 4+ Person Household | 0 | 0.0% |
| Total Housing Units | 24 | 100.0% |
Occupancy by Ownership by Household Size in Paynesville
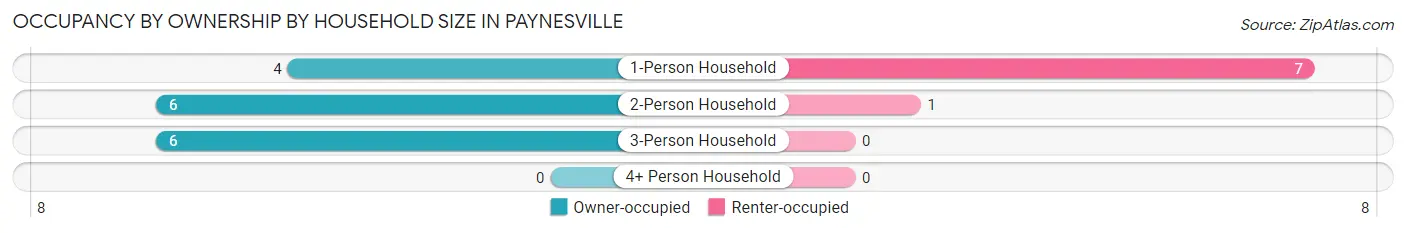
| Household Size | Owner-occupied | Renter-occupied |
| 1-Person Household | 4 (36.4%) | 7 (63.6%) |
| 2-Person Household | 6 (85.7%) | 1 (14.3%) |
| 3-Person Household | 6 (100.0%) | 0 (0.0%) |
| 4+ Person Household | 0 (0.0%) | 0 (0.0%) |
| Total Housing Units | 16 (66.7%) | 8 (33.3%) |
Occupancy by Educational Attainment in Paynesville
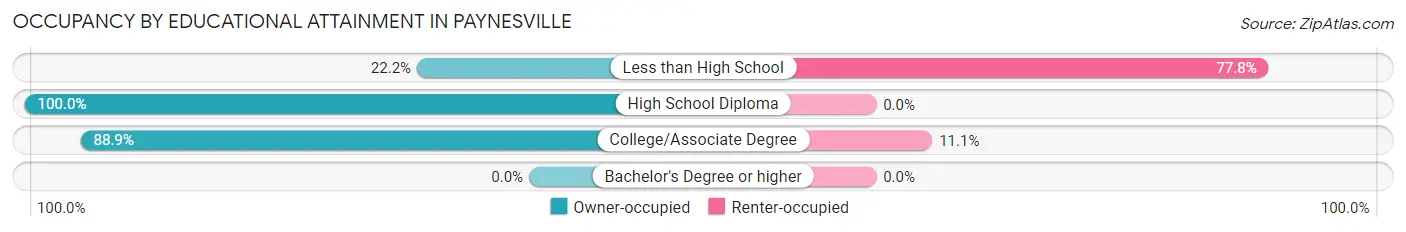
| Household Size | Owner-occupied | Renter-occupied |
| Less than High School | 2 (22.2%) | 7 (77.8%) |
| High School Diploma | 6 (100.0%) | 0 (0.0%) |
| College/Associate Degree | 8 (88.9%) | 1 (11.1%) |
| Bachelor's Degree or higher | 0 (0.0%) | 0 (0.0%) |
Occupancy by Age of Householder in Paynesville
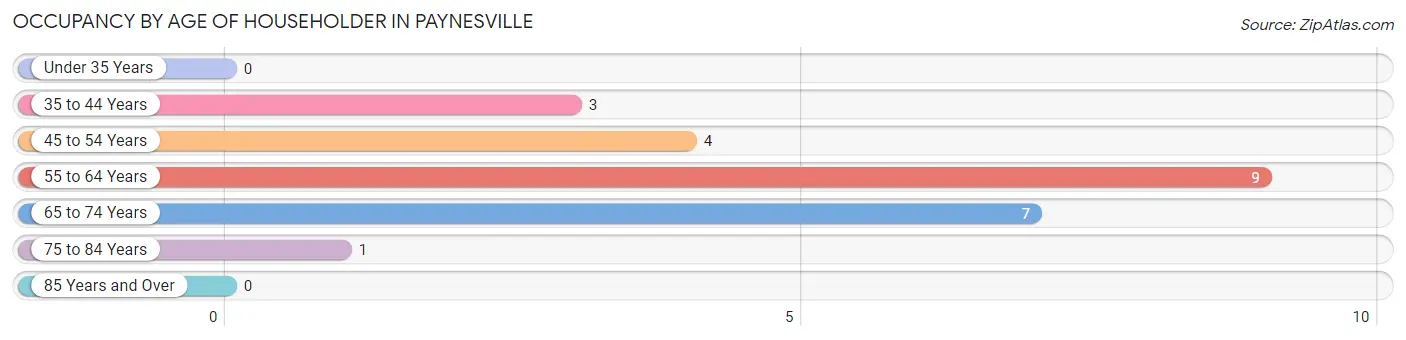
| Age Bracket | # Households | % Households |
| Under 35 Years | 0 | 0.0% |
| 35 to 44 Years | 3 | 12.5% |
| 45 to 54 Years | 4 | 16.7% |
| 55 to 64 Years | 9 | 37.5% |
| 65 to 74 Years | 7 | 29.2% |
| 75 to 84 Years | 1 | 4.2% |
| 85 Years and Over | 0 | 0.0% |
| Total | 24 | 100.0% |
Housing Finances in Paynesville
Median Income by Occupancy in Paynesville
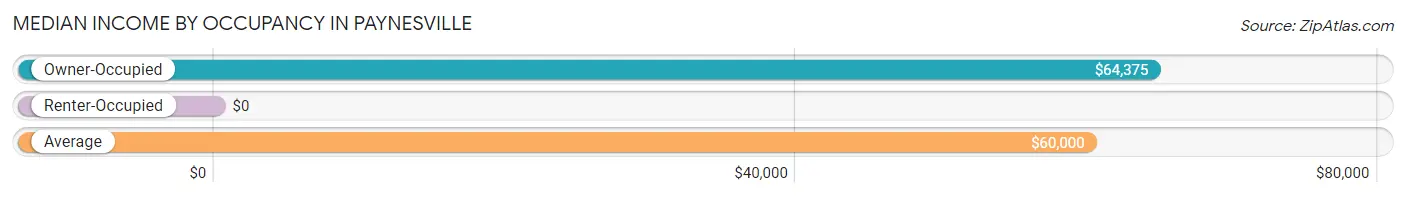
| Occupancy Type | # Households | Median Income |
| Owner-Occupied | 16 (66.7%) | $64,375 |
| Renter-Occupied | 8 (33.3%) | $0 |
| Average | 24 (100.0%) | $60,000 |
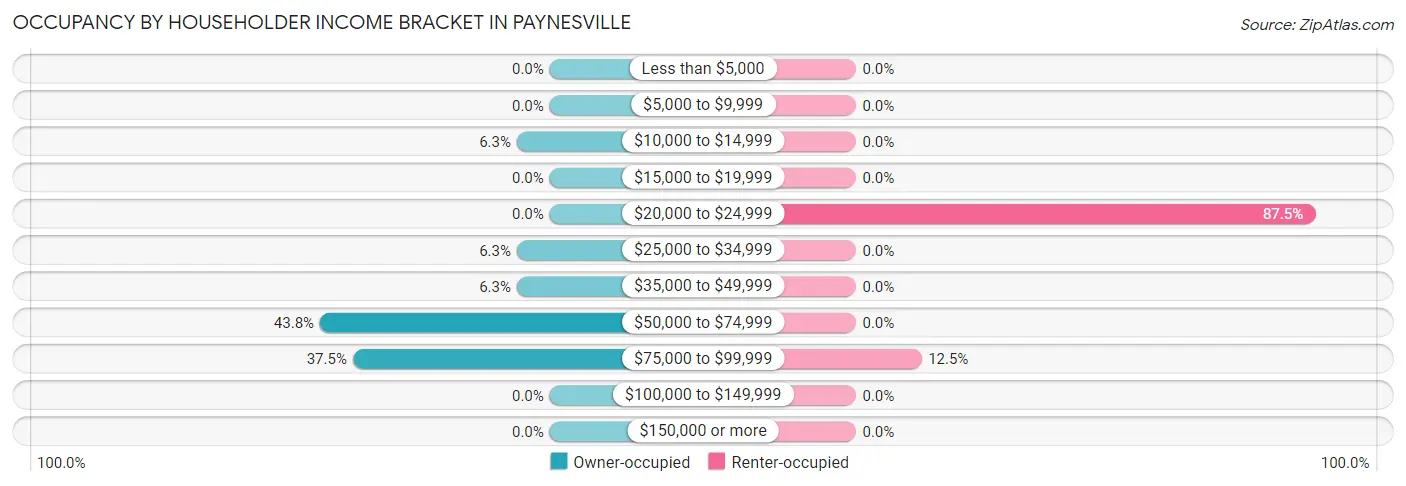
Occupancy by Householder Income Bracket in Paynesville
| Income Bracket | Owner-occupied | Renter-occupied |
| Less than $5,000 | 0 (0.0%) | 0 (0.0%) |
| $5,000 to $9,999 | 0 (0.0%) | 0 (0.0%) |
| $10,000 to $14,999 | 1 (6.2%) | 0 (0.0%) |
| $15,000 to $19,999 | 0 (0.0%) | 0 (0.0%) |
| $20,000 to $24,999 | 0 (0.0%) | 7 (87.5%) |
| $25,000 to $34,999 | 1 (6.2%) | 0 (0.0%) |
| $35,000 to $49,999 | 1 (6.2%) | 0 (0.0%) |
| $50,000 to $74,999 | 7 (43.8%) | 0 (0.0%) |
| $75,000 to $99,999 | 6 (37.5%) | 1 (12.5%) |
| $100,000 to $149,999 | 0 (0.0%) | 0 (0.0%) |
| $150,000 or more | 0 (0.0%) | 0 (0.0%) |
| Total | 16 (100.0%) | 8 (100.0%) |
Monthly Housing Cost Tiers in Paynesville
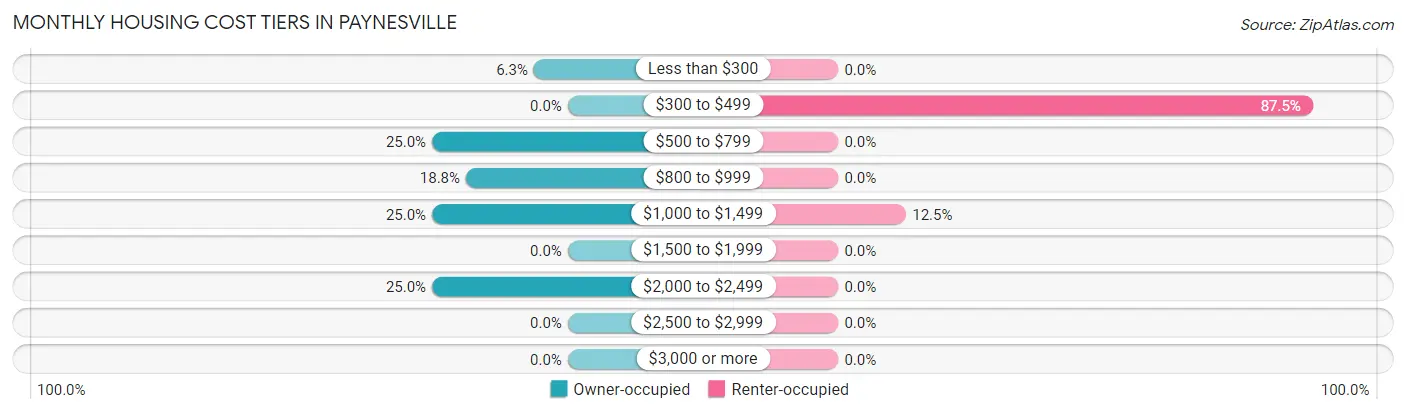
| Monthly Cost | Owner-occupied | Renter-occupied |
| Less than $300 | 1 (6.2%) | 0 (0.0%) |
| $300 to $499 | 0 (0.0%) | 7 (87.5%) |
| $500 to $799 | 4 (25.0%) | 0 (0.0%) |
| $800 to $999 | 3 (18.8%) | 0 (0.0%) |
| $1,000 to $1,499 | 4 (25.0%) | 1 (12.5%) |
| $1,500 to $1,999 | 0 (0.0%) | 0 (0.0%) |
| $2,000 to $2,499 | 4 (25.0%) | 0 (0.0%) |
| $2,500 to $2,999 | 0 (0.0%) | 0 (0.0%) |
| $3,000 or more | 0 (0.0%) | 0 (0.0%) |
| Total | 16 (100.0%) | 8 (100.0%) |
Physical Housing Characteristics in Paynesville
Housing Structures in Paynesville
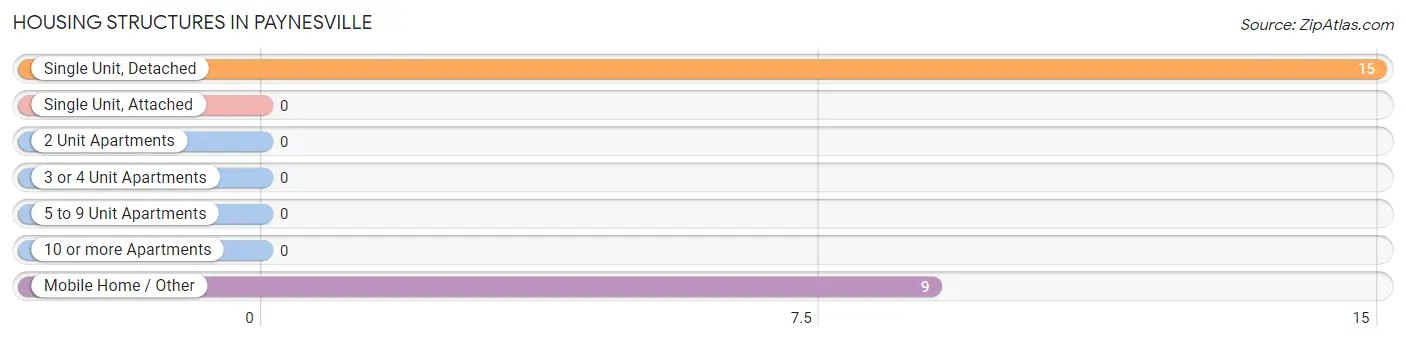
| Structure Type | # Housing Units | % Housing Units |
| Single Unit, Detached | 15 | 62.5% |
| Single Unit, Attached | 0 | 0.0% |
| 2 Unit Apartments | 0 | 0.0% |
| 3 or 4 Unit Apartments | 0 | 0.0% |
| 5 to 9 Unit Apartments | 0 | 0.0% |
| 10 or more Apartments | 0 | 0.0% |
| Mobile Home / Other | 9 | 37.5% |
| Total | 24 | 100.0% |
Housing Structures by Occupancy in Paynesville
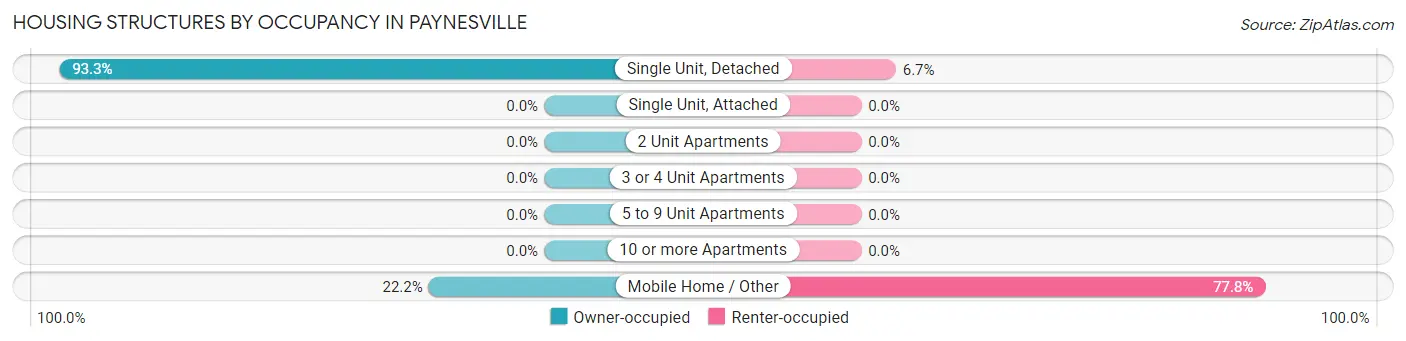
| Structure Type | Owner-occupied | Renter-occupied |
| Single Unit, Detached | 14 (93.3%) | 1 (6.7%) |
| Single Unit, Attached | 0 (0.0%) | 0 (0.0%) |
| 2 Unit Apartments | 0 (0.0%) | 0 (0.0%) |
| 3 or 4 Unit Apartments | 0 (0.0%) | 0 (0.0%) |
| 5 to 9 Unit Apartments | 0 (0.0%) | 0 (0.0%) |
| 10 or more Apartments | 0 (0.0%) | 0 (0.0%) |
| Mobile Home / Other | 2 (22.2%) | 7 (77.8%) |
| Total | 16 (66.7%) | 8 (33.3%) |
Housing Structures by Number of Rooms in Paynesville
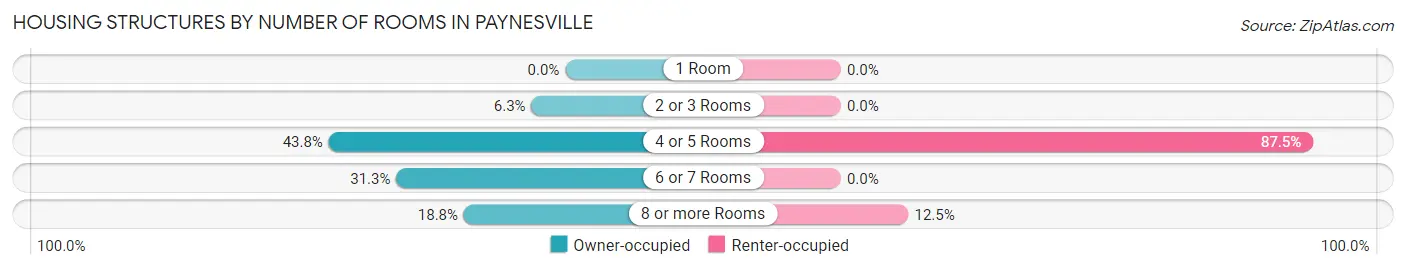
| Number of Rooms | Owner-occupied | Renter-occupied |
| 1 Room | 0 (0.0%) | 0 (0.0%) |
| 2 or 3 Rooms | 1 (6.2%) | 0 (0.0%) |
| 4 or 5 Rooms | 7 (43.8%) | 7 (87.5%) |
| 6 or 7 Rooms | 5 (31.2%) | 0 (0.0%) |
| 8 or more Rooms | 3 (18.8%) | 1 (12.5%) |
| Total | 16 (100.0%) | 8 (100.0%) |
Housing Structure by Heating Type in Paynesville
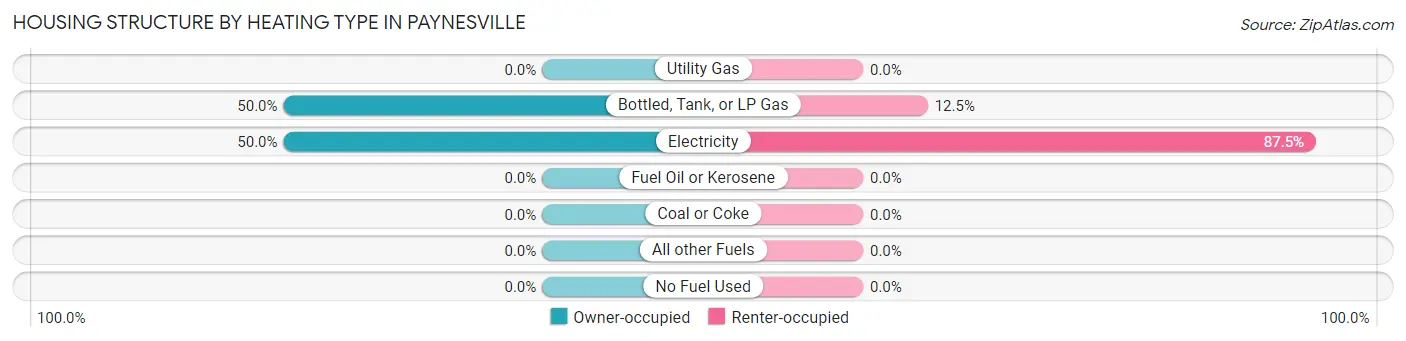
| Heating Type | Owner-occupied | Renter-occupied |
| Utility Gas | 0 (0.0%) | 0 (0.0%) |
| Bottled, Tank, or LP Gas | 8 (50.0%) | 1 (12.5%) |
| Electricity | 8 (50.0%) | 7 (87.5%) |
| Fuel Oil or Kerosene | 0 (0.0%) | 0 (0.0%) |
| Coal or Coke | 0 (0.0%) | 0 (0.0%) |
| All other Fuels | 0 (0.0%) | 0 (0.0%) |
| No Fuel Used | 0 (0.0%) | 0 (0.0%) |
| Total | 16 (100.0%) | 8 (100.0%) |
Household Vehicle Usage in Paynesville
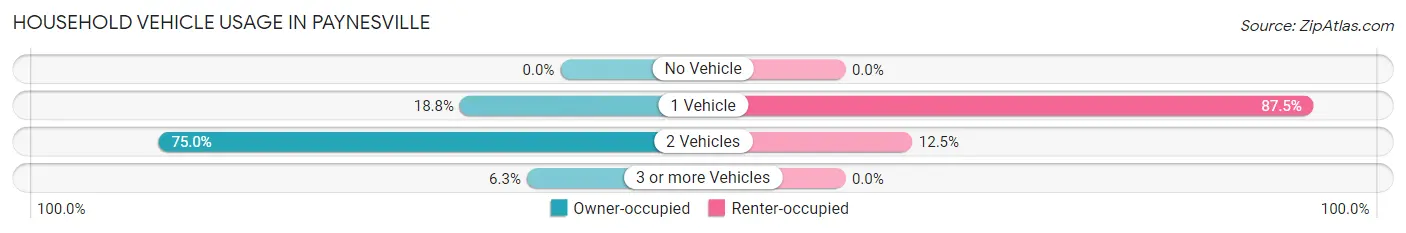
| Vehicles per Household | Owner-occupied | Renter-occupied |
| No Vehicle | 0 (0.0%) | 0 (0.0%) |
| 1 Vehicle | 3 (18.8%) | 7 (87.5%) |
| 2 Vehicles | 12 (75.0%) | 1 (12.5%) |
| 3 or more Vehicles | 1 (6.2%) | 0 (0.0%) |
| Total | 16 (100.0%) | 8 (100.0%) |
Real Estate & Mortgages in Paynesville
Real Estate and Mortgage Overview in Paynesville
| Characteristic | Without Mortgage | With Mortgage |
| Housing Units | 5 | 11 |
| Median Property Value | - | - |
| Median Household Income | - | - |
| Monthly Housing Costs | $717 | $0 |
| Real Estate Taxes | - | - |
Property Value by Mortgage Status in Paynesville
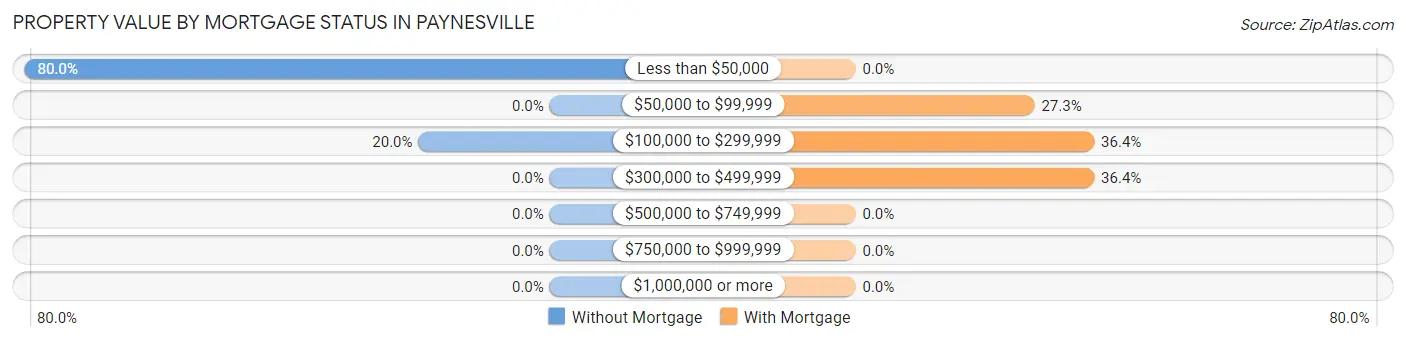
| Property Value | Without Mortgage | With Mortgage |
| Less than $50,000 | 4 (80.0%) | 0 (0.0%) |
| $50,000 to $99,999 | 0 (0.0%) | 3 (27.3%) |
| $100,000 to $299,999 | 1 (20.0%) | 4 (36.4%) |
| $300,000 to $499,999 | 0 (0.0%) | 4 (36.4%) |
| $500,000 to $749,999 | 0 (0.0%) | 0 (0.0%) |
| $750,000 to $999,999 | 0 (0.0%) | 0 (0.0%) |
| $1,000,000 or more | 0 (0.0%) | 0 (0.0%) |
| Total | 5 (100.0%) | 11 (100.0%) |
Household Income by Mortgage Status in Paynesville
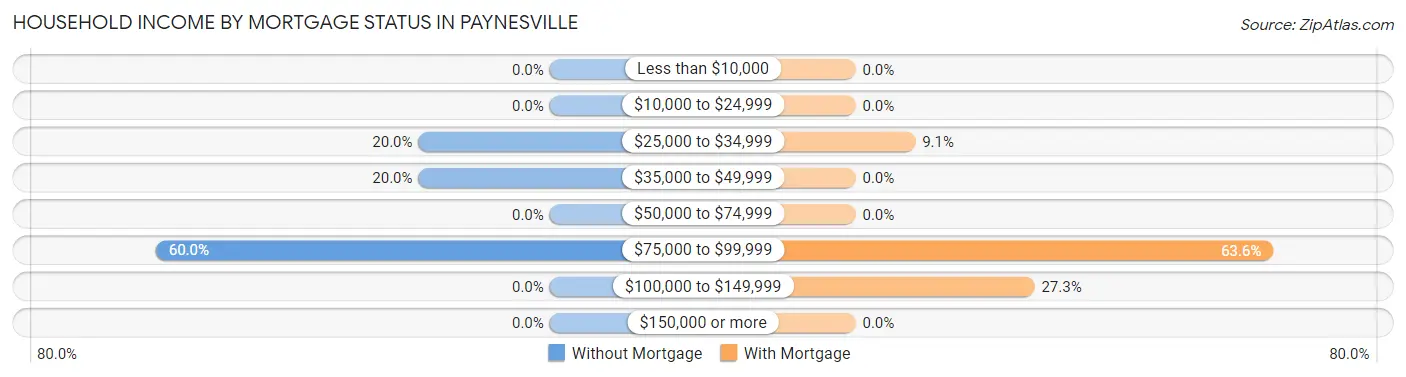
| Household Income | Without Mortgage | With Mortgage |
| Less than $10,000 | 0 (0.0%) | 0 (0.0%) |
| $10,000 to $24,999 | 0 (0.0%) | 0 (0.0%) |
| $25,000 to $34,999 | 1 (20.0%) | 1 (9.1%) |
| $35,000 to $49,999 | 1 (20.0%) | 0 (0.0%) |
| $50,000 to $74,999 | 0 (0.0%) | 0 (0.0%) |
| $75,000 to $99,999 | 3 (60.0%) | 7 (63.6%) |
| $100,000 to $149,999 | 0 (0.0%) | 3 (27.3%) |
| $150,000 or more | 0 (0.0%) | 0 (0.0%) |
| Total | 5 (100.0%) | 11 (100.0%) |
Property Value to Household Income Ratio in Paynesville
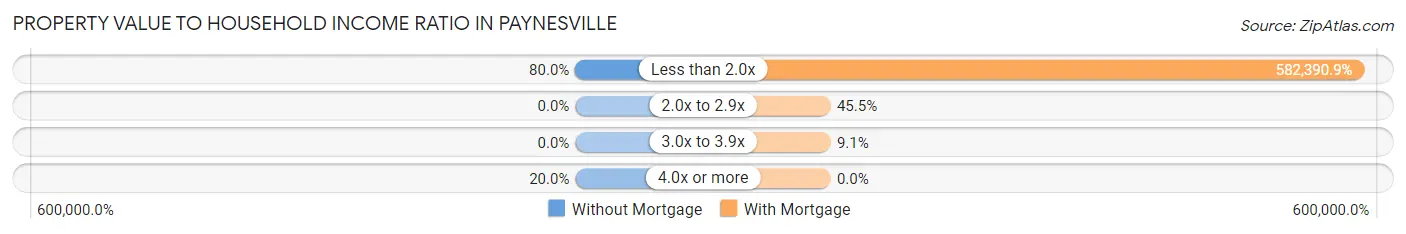
| Value-to-Income Ratio | Without Mortgage | With Mortgage |
| Less than 2.0x | 4 (80.0%) | 64,063 (582,390.9%) |
| 2.0x to 2.9x | 0 (0.0%) | 5 (45.5%) |
| 3.0x to 3.9x | 0 (0.0%) | 1 (9.1%) |
| 4.0x or more | 1 (20.0%) | 0 (0.0%) |
| Total | 5 (100.0%) | 11 (100.0%) |
Real Estate Taxes by Mortgage Status in Paynesville
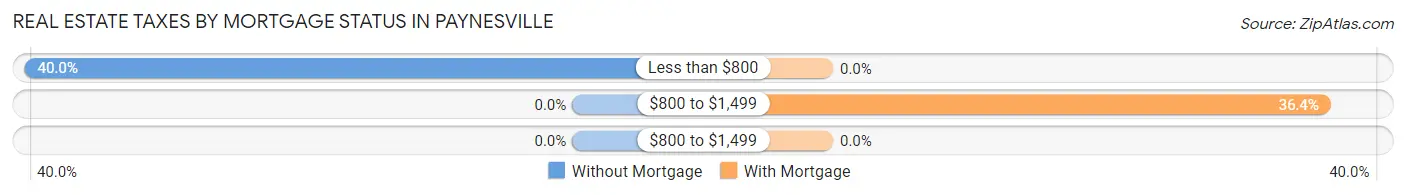
| Property Taxes | Without Mortgage | With Mortgage |
| Less than $800 | 2 (40.0%) | 0 (0.0%) |
| $800 to $1,499 | 0 (0.0%) | 4 (36.4%) |
| $800 to $1,499 | 0 (0.0%) | 0 (0.0%) |
| Total | 5 (100.0%) | 11 (100.0%) |
Health & Disability in Paynesville
Health Insurance Coverage by Age in Paynesville
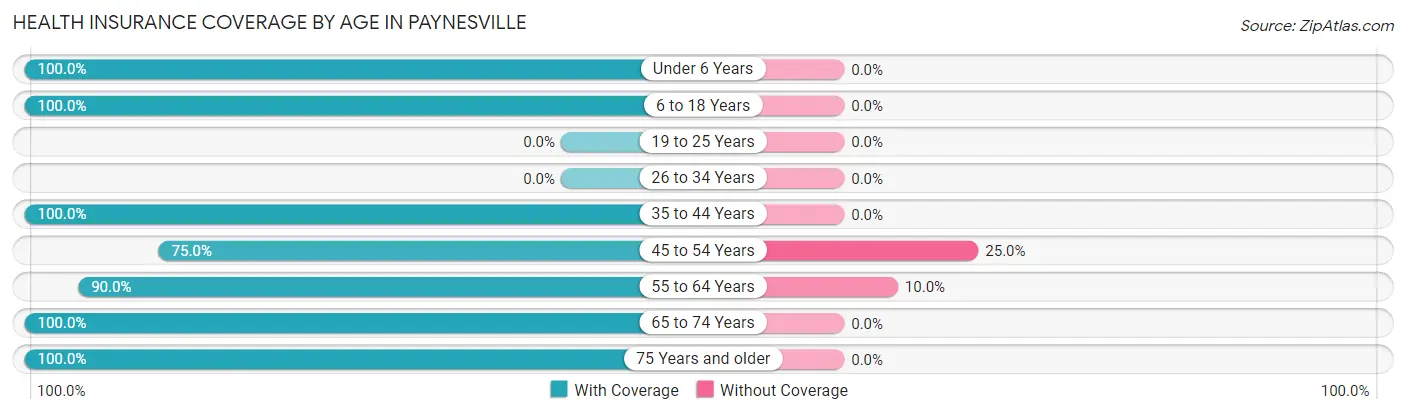
| Age Bracket | With Coverage | Without Coverage |
| Under 6 Years | 1 (100.0%) | 0 (0.0%) |
| 6 to 18 Years | 2 (100.0%) | 0 (0.0%) |
| 19 to 25 Years | 0 (0.0%) | 0 (0.0%) |
| 26 to 34 Years | 0 (0.0%) | 0 (0.0%) |
| 35 to 44 Years | 7 (100.0%) | 0 (0.0%) |
| 45 to 54 Years | 3 (75.0%) | 1 (25.0%) |
| 55 to 64 Years | 9 (90.0%) | 1 (10.0%) |
| 65 to 74 Years | 14 (100.0%) | 0 (0.0%) |
| 75 Years and older | 3 (100.0%) | 0 (0.0%) |
| Total | 39 (95.1%) | 2 (4.9%) |
Health Insurance Coverage by Citizenship Status in Paynesville
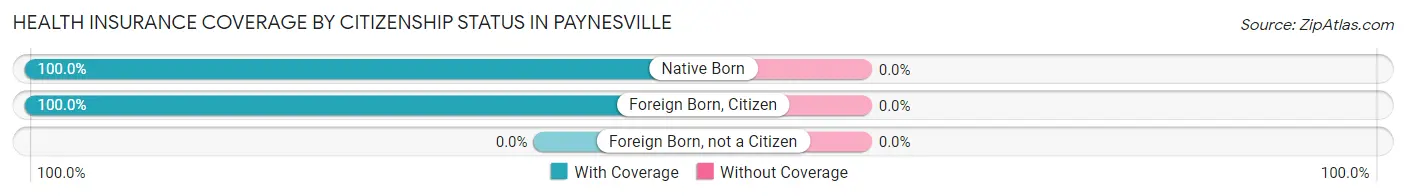
| Citizenship Status | With Coverage | Without Coverage |
| Native Born | 1 (100.0%) | 0 (0.0%) |
| Foreign Born, Citizen | 2 (100.0%) | 0 (0.0%) |
| Foreign Born, not a Citizen | 0 (0.0%) | 0 (0.0%) |
Health Insurance Coverage by Household Income in Paynesville
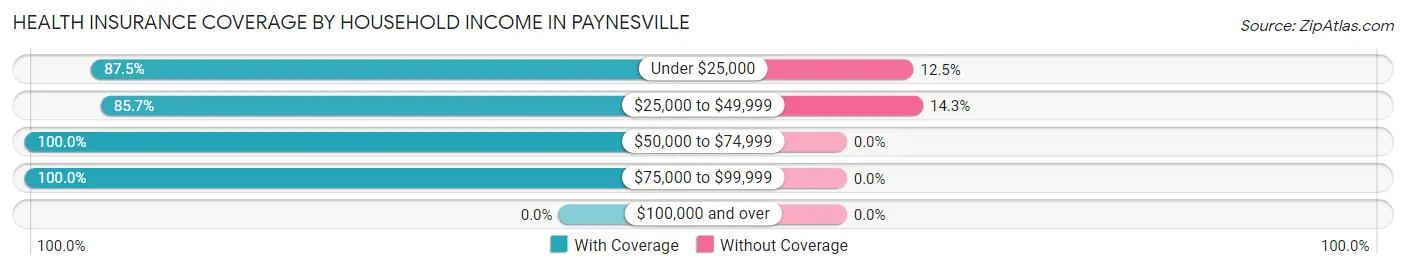
| Household Income | With Coverage | Without Coverage |
| Under $25,000 | 7 (87.5%) | 1 (12.5%) |
| $25,000 to $49,999 | 6 (85.7%) | 1 (14.3%) |
| $50,000 to $74,999 | 16 (100.0%) | 0 (0.0%) |
| $75,000 to $99,999 | 10 (100.0%) | 0 (0.0%) |
| $100,000 and over | 0 (0.0%) | 0 (0.0%) |
Public vs Private Health Insurance Coverage by Age in Paynesville
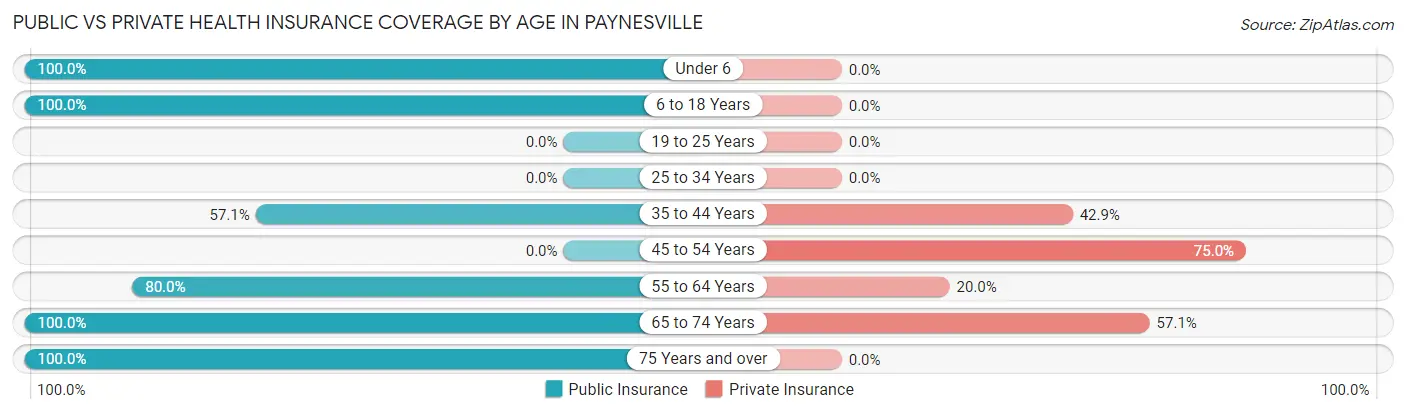
| Age Bracket | Public Insurance | Private Insurance |
| Under 6 | 1 (100.0%) | 0 (0.0%) |
| 6 to 18 Years | 2 (100.0%) | 0 (0.0%) |
| 19 to 25 Years | 0 (0.0%) | 0 (0.0%) |
| 25 to 34 Years | 0 (0.0%) | 0 (0.0%) |
| 35 to 44 Years | 4 (57.1%) | 3 (42.9%) |
| 45 to 54 Years | 0 (0.0%) | 3 (75.0%) |
| 55 to 64 Years | 8 (80.0%) | 2 (20.0%) |
| 65 to 74 Years | 14 (100.0%) | 8 (57.1%) |
| 75 Years and over | 3 (100.0%) | 0 (0.0%) |
| Total | 32 (78.0%) | 16 (39.0%) |
Disability Status by Sex by Age in Paynesville
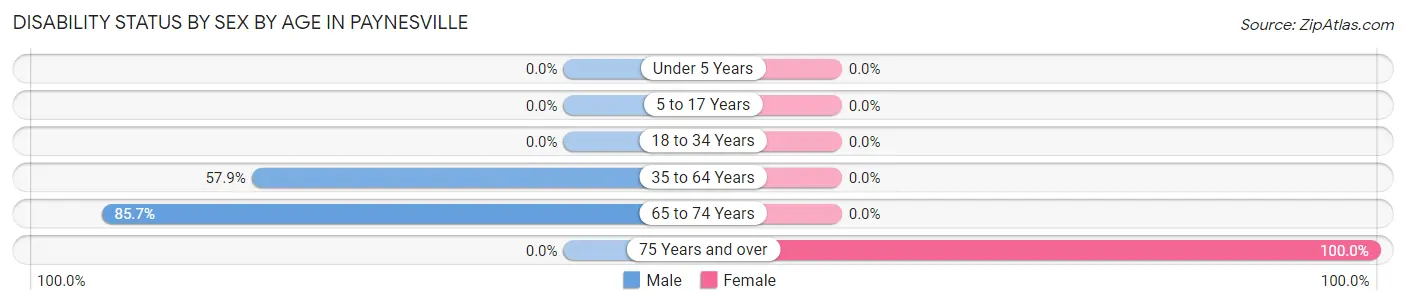
| Age Bracket | Male | Female |
| Under 5 Years | 0 (0.0%) | 0 (0.0%) |
| 5 to 17 Years | 0 (0.0%) | 0 (0.0%) |
| 18 to 34 Years | 0 (0.0%) | 0 (0.0%) |
| 35 to 64 Years | 11 (57.9%) | 0 (0.0%) |
| 65 to 74 Years | 6 (85.7%) | 0 (0.0%) |
| 75 Years and over | 0 (0.0%) | 2 (100.0%) |
Disability Class by Sex by Age in Paynesville
Disability Class: Hearing Difficulty
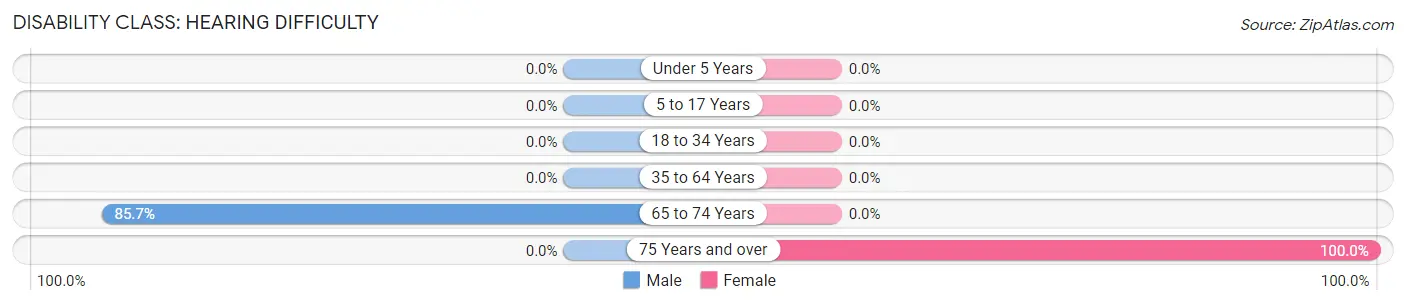
| Age Bracket | Male | Female |
| Under 5 Years | 0 (0.0%) | 0 (0.0%) |
| 5 to 17 Years | 0 (0.0%) | 0 (0.0%) |
| 18 to 34 Years | 0 (0.0%) | 0 (0.0%) |
| 35 to 64 Years | 0 (0.0%) | 0 (0.0%) |
| 65 to 74 Years | 6 (85.7%) | 0 (0.0%) |
| 75 Years and over | 0 (0.0%) | 2 (100.0%) |
Disability Class: Vision Difficulty
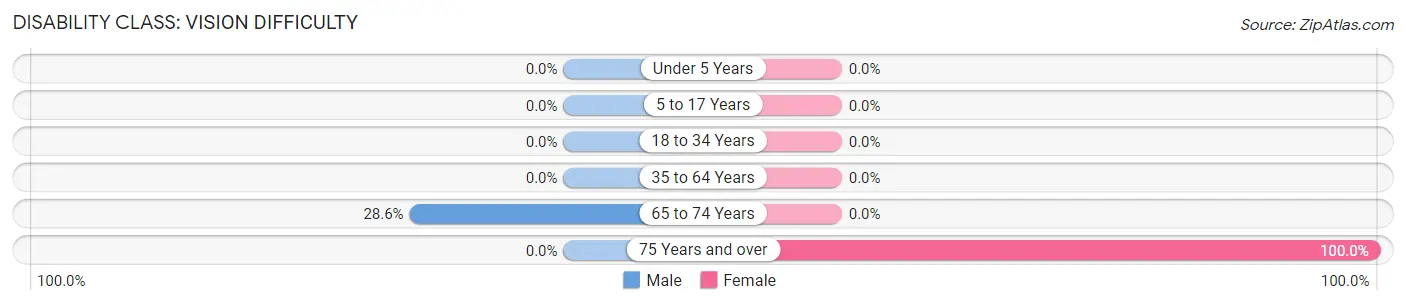
| Age Bracket | Male | Female |
| Under 5 Years | 0 (0.0%) | 0 (0.0%) |
| 5 to 17 Years | 0 (0.0%) | 0 (0.0%) |
| 18 to 34 Years | 0 (0.0%) | 0 (0.0%) |
| 35 to 64 Years | 0 (0.0%) | 0 (0.0%) |
| 65 to 74 Years | 2 (28.6%) | 0 (0.0%) |
| 75 Years and over | 0 (0.0%) | 2 (100.0%) |
Disability Class: Cognitive Difficulty
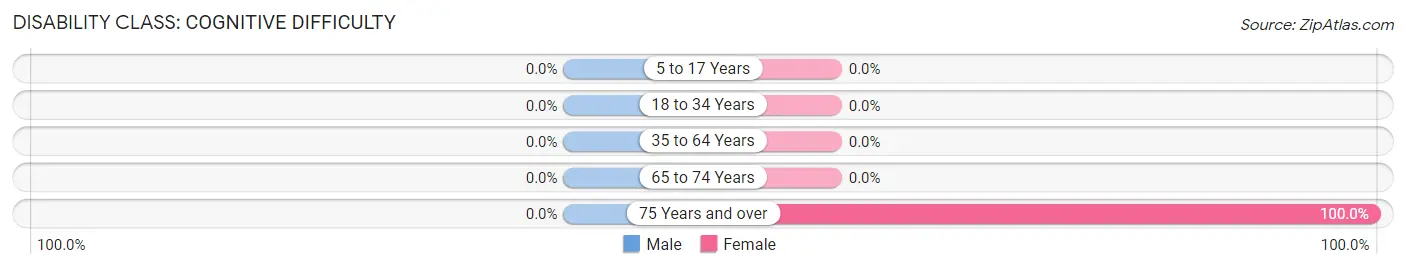
| Age Bracket | Male | Female |
| 5 to 17 Years | 0 (0.0%) | 0 (0.0%) |
| 18 to 34 Years | 0 (0.0%) | 0 (0.0%) |
| 35 to 64 Years | 0 (0.0%) | 0 (0.0%) |
| 65 to 74 Years | 0 (0.0%) | 0 (0.0%) |
| 75 Years and over | 0 (0.0%) | 2 (100.0%) |
Disability Class: Ambulatory Difficulty
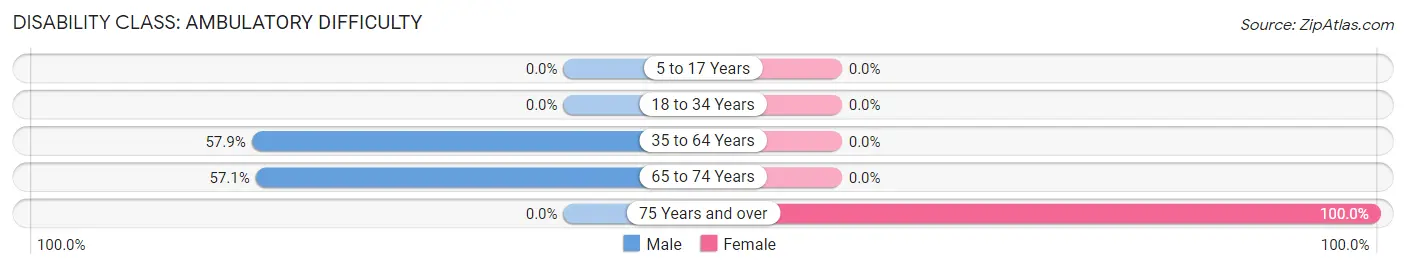
| Age Bracket | Male | Female |
| 5 to 17 Years | 0 (0.0%) | 0 (0.0%) |
| 18 to 34 Years | 0 (0.0%) | 0 (0.0%) |
| 35 to 64 Years | 11 (57.9%) | 0 (0.0%) |
| 65 to 74 Years | 4 (57.1%) | 0 (0.0%) |
| 75 Years and over | 0 (0.0%) | 2 (100.0%) |
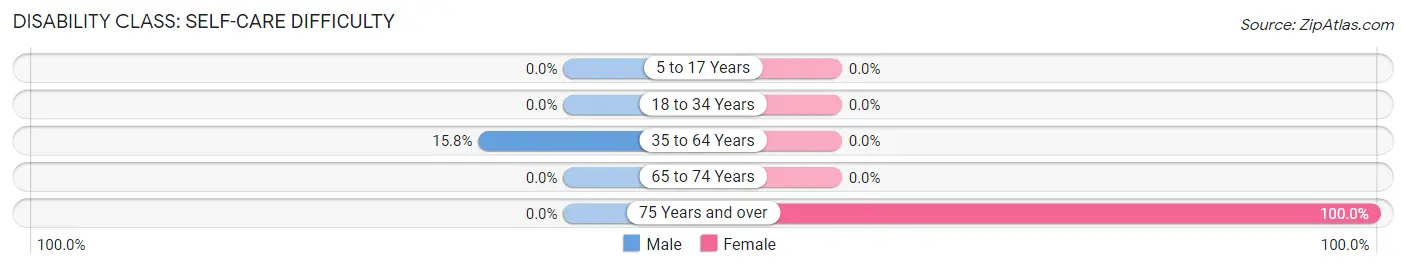
Disability Class: Self-Care Difficulty
| Age Bracket | Male | Female |
| 5 to 17 Years | 0 (0.0%) | 0 (0.0%) |
| 18 to 34 Years | 0 (0.0%) | 0 (0.0%) |
| 35 to 64 Years | 3 (15.8%) | 0 (0.0%) |
| 65 to 74 Years | 0 (0.0%) | 0 (0.0%) |
| 75 Years and over | 0 (0.0%) | 2 (100.0%) |
Technology Access in Paynesville
Computing Device Access in Paynesville
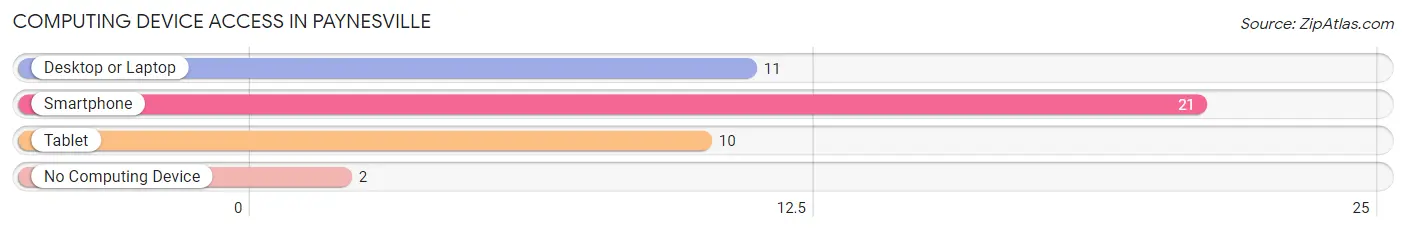
| Device Type | # Households | % Households |
| Desktop or Laptop | 11 | 45.8% |
| Smartphone | 21 | 87.5% |
| Tablet | 10 | 41.7% |
| No Computing Device | 2 | 8.3% |
| Total | 24 | 100.0% |
Internet Access in Paynesville
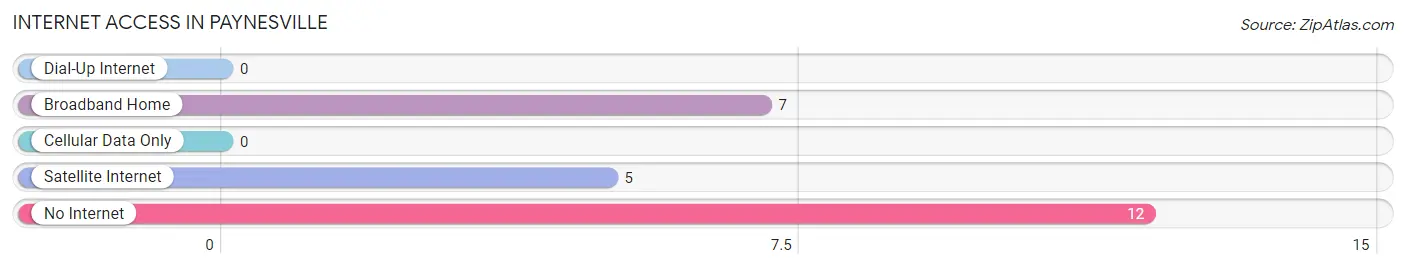
| Internet Type | # Households | % Households |
| Dial-Up Internet | 0 | 0.0% |
| Broadband Home | 7 | 29.2% |
| Cellular Data Only | 0 | 0.0% |
| Satellite Internet | 5 | 20.8% |
| No Internet | 12 | 50.0% |
| Total | 24 | 100.0% |
Paynesville Summary
Paynesville, Missouri is a small town located in the southeastern corner of the state, in the Ozark Mountains. It is situated in Phelps County, and is part of the Rolla, Missouri Metropolitan Statistical Area. The town was founded in 1883 and has a population of just over 500 people.
History
Paynesville was founded in 1883 by William Payne, a former Confederate soldier. He named the town after himself and it was incorporated in 1887. The town was originally a farming community, but it soon became a center for timber and coal mining. The town was also home to a number of sawmills and gristmills.
In the early 1900s, the town was home to a number of businesses, including a hotel, a general store, a blacksmith shop, a livery stable, and a post office. The town also had a school, a church, and a cemetery.
In the 1920s, the town began to decline as the timber and coal industries declined. The Great Depression further exacerbated the town’s economic woes. However, the town was able to survive and in the 1950s, the town began to experience a resurgence. The town was able to attract new businesses and industries, including a furniture factory and a canning factory.
Geography
Paynesville is located in the Ozark Mountains in Phelps County, Missouri. The town is situated at the intersection of Missouri State Highways 63 and 68. The town is located about 25 miles south of Rolla, Missouri and about 50 miles north of Springfield, Missouri.
The town is situated in a hilly area and is surrounded by forests and rolling hills. The town is located in a valley and is surrounded by the Mark Twain National Forest. The town is located at an elevation of 890 feet above sea level.
Economy
The economy of Paynesville is largely based on agriculture and tourism. The town is home to a number of farms, which produce a variety of crops, including corn, soybeans, wheat, and hay. The town is also home to a number of small businesses, including restaurants, shops, and a hardware store.
The town is also home to a number of tourist attractions, including the Ozark National Scenic Riverways, which is a popular destination for canoeing, fishing, and camping. The town is also home to a number of historic sites, including the Payne-Gentry House, which is listed on the National Register of Historic Places.
Demographics
As of the 2010 census, the population of Paynesville was 514. The town has a total area of 0.7 square miles, all of which is land. The town has a population density of 735 people per square mile.
The racial makeup of the town is 97.3% White, 0.6% African American, 0.2% Native American, 0.2% Asian, 0.2% from other races, and 1.6% from two or more races. The median household income in the town is $37,500 and the median family income is $41,250. The per capita income in the town is $17,857.
Conclusion
Paynesville, Missouri is a small town located in the Ozark Mountains in Phelps County. The town was founded in 1883 and has a population of just over 500 people. The town’s economy is largely based on agriculture and tourism. The town is home to a number of farms, businesses, and tourist attractions. The town has a population that is 97.3% White and has a median household income of $37,500.
Common Questions
What is the Total Population of Paynesville?
Total Population of Paynesville is 41.
What is the Total Male Population of Paynesville?
Total Male Population of Paynesville is 27.
What is the Total Female Population of Paynesville?
Total Female Population of Paynesville is 14.
What is the Ratio of Males per 100 Females in Paynesville?
There are 192.86 Males per 100 Females in Paynesville.
What is the Ratio of Females per 100 Males in Paynesville?
There are 51.85 Females per 100 Males in Paynesville.
What is the Median Population Age in Paynesville?
Median Population Age in Paynesville is 55.9 Years.
What is the Average Family Size in Paynesville
Average Family Size in Paynesville is 2.3 People.
What is the Average Household Size in Paynesville
Average Household Size in Paynesville is 1.7 People.
What is Per Capita Income in Paynesville?
Per Capita income in Paynesville is $27,298.
What is the Median Family Income in Paynesville?
Median Family Income in Paynesville is $64,063.
What is the Median Household income in Paynesville?
Median Household Income in Paynesville is $60,000.
What is Inequality or Gini Index in Paynesville?
Inequality or Gini Index in Paynesville is 0.29.
How Large is the Labor Force in Paynesville?
There are 9 People in the Labor Forcein in Paynesville.
What is the Percentage of People in the Labor Force in Paynesville?
23.7% of People are in the Labor Force in Paynesville.