Moline Acres, MO
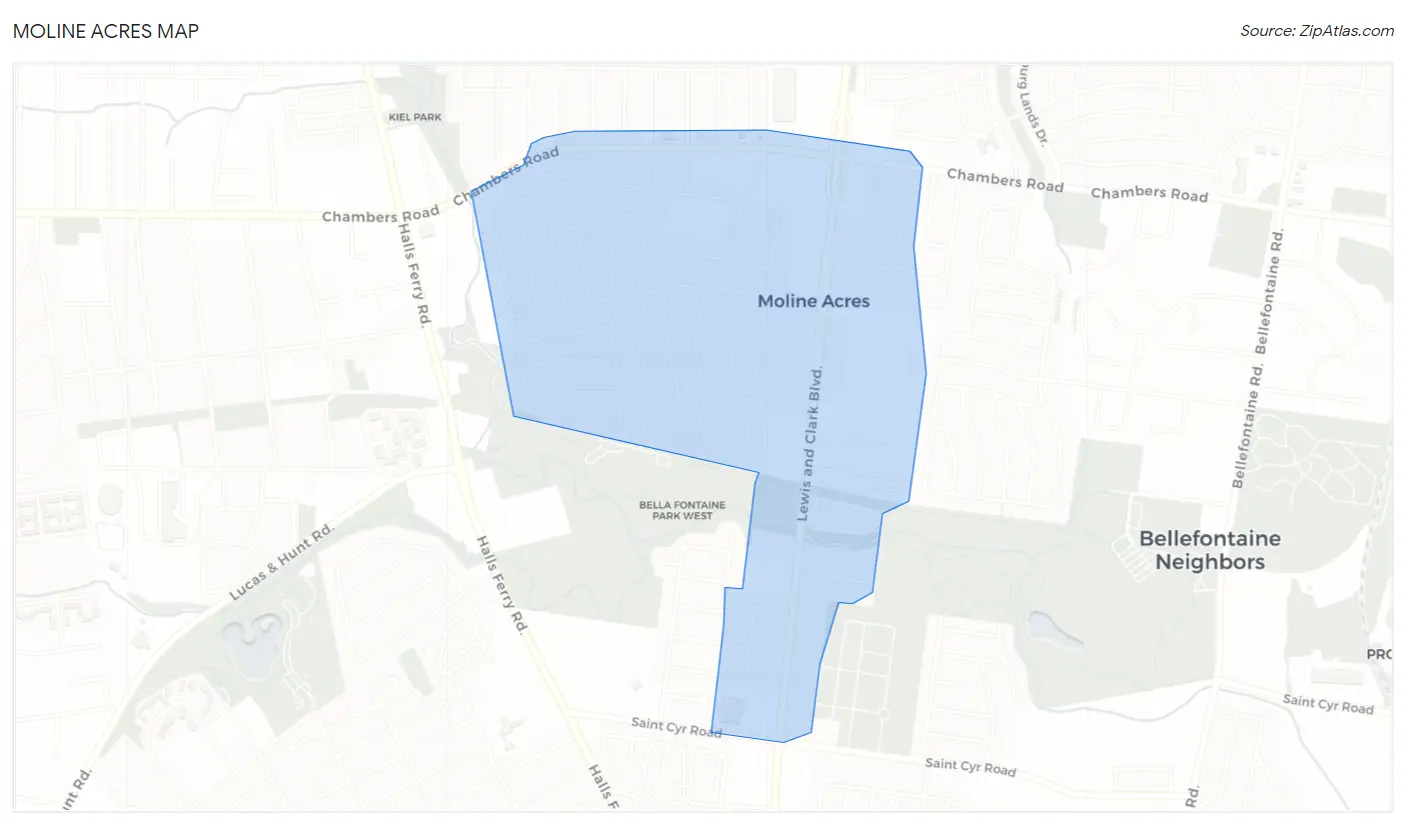
Moline Acres Map
Moline Acres Overview
2,815
TOTAL POPULATION
1,258
MALE POPULATION
1,557
FEMALE POPULATION
80.80
MALES / 100 FEMALES
123.77
FEMALES / 100 MALES
40.0
MEDIAN AGE
3.0
AVG FAMILY SIZE
2.4
AVG HOUSEHOLD SIZE
$20,636
PER CAPITA INCOME
$52,804
AVG FAMILY INCOME
$50,352
AVG HOUSEHOLD INCOME
14.3%
WAGE / INCOME GAP [ % ]
85.7¢/ $1
WAGE / INCOME GAP [ $ ]
$10,707
FAMILY INCOME DEFICIT
0.36
INEQUALITY / GINI INDEX
1,117
LABOR FORCE [ PEOPLE ]
50.9%
PERCENT IN LABOR FORCE
15.0%
UNEMPLOYMENT RATE
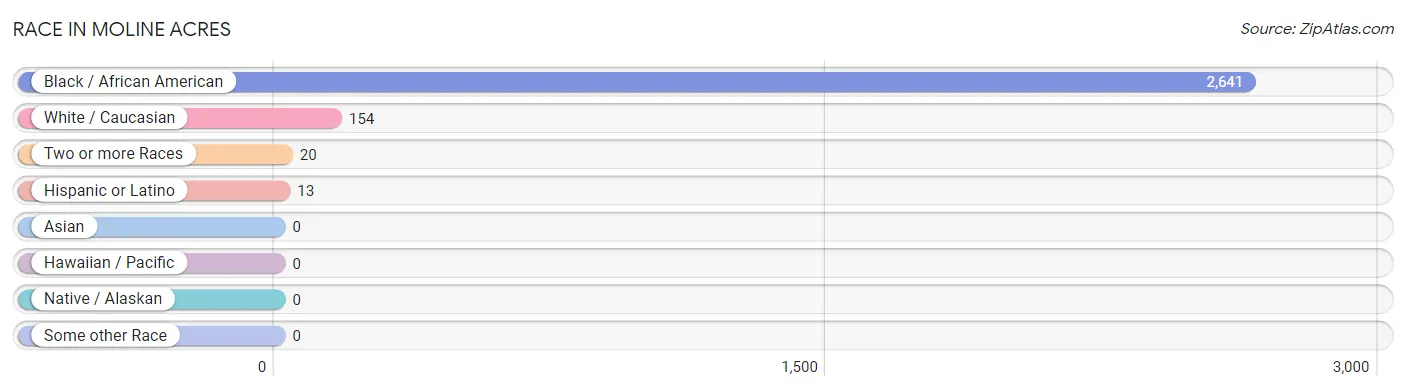
Race in Moline Acres
The most populous races in Moline Acres are Black / African American (2,641 | 93.8%), White / Caucasian (154 | 5.5%), and Two or more Races (20 | 0.7%).
| Race | # Population | % Population |
| Asian | 0 | 0.0% |
| Black / African American | 2,641 | 93.8% |
| Hawaiian / Pacific | 0 | 0.0% |
| Hispanic or Latino | 13 | 0.5% |
| Native / Alaskan | 0 | 0.0% |
| White / Caucasian | 154 | 5.5% |
| Two or more Races | 20 | 0.7% |
| Some other Race | 0 | 0.0% |
| Total | 2,815 | 100.0% |
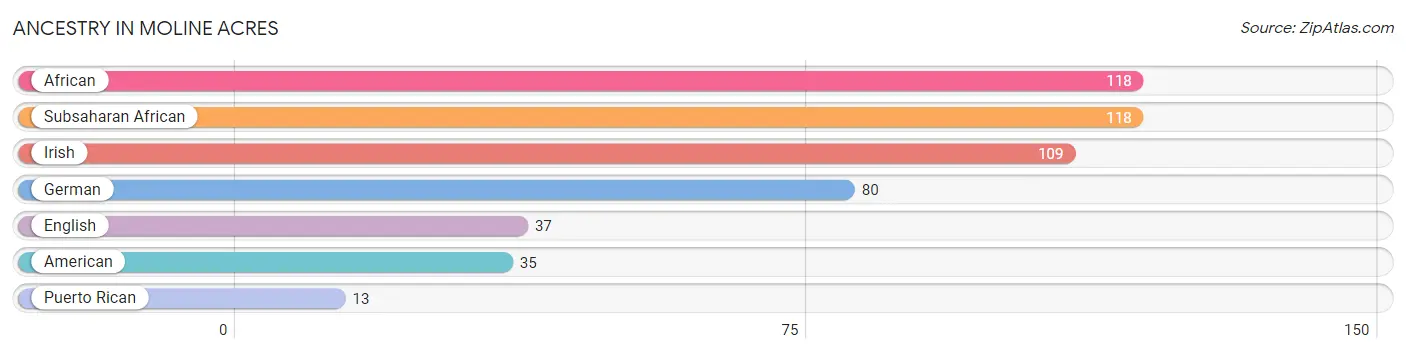
Ancestry in Moline Acres
The most populous ancestries reported in Moline Acres are African (118 | 4.2%), Subsaharan African (118 | 4.2%), Irish (109 | 3.9%), German (80 | 2.8%), and English (37 | 1.3%), together accounting for 16.4% of all Moline Acres residents.
| Ancestry | # Population | % Population |
| African | 118 | 4.2% |
| American | 35 | 1.2% |
| English | 37 | 1.3% |
| German | 80 | 2.8% |
| Irish | 109 | 3.9% |
| Puerto Rican | 13 | 0.5% |
| Subsaharan African | 118 | 4.2% | View All 7 Rows |
Immigrants in Moline Acres

| Immigration Origin | # Population | % Population | View All 0 Rows |
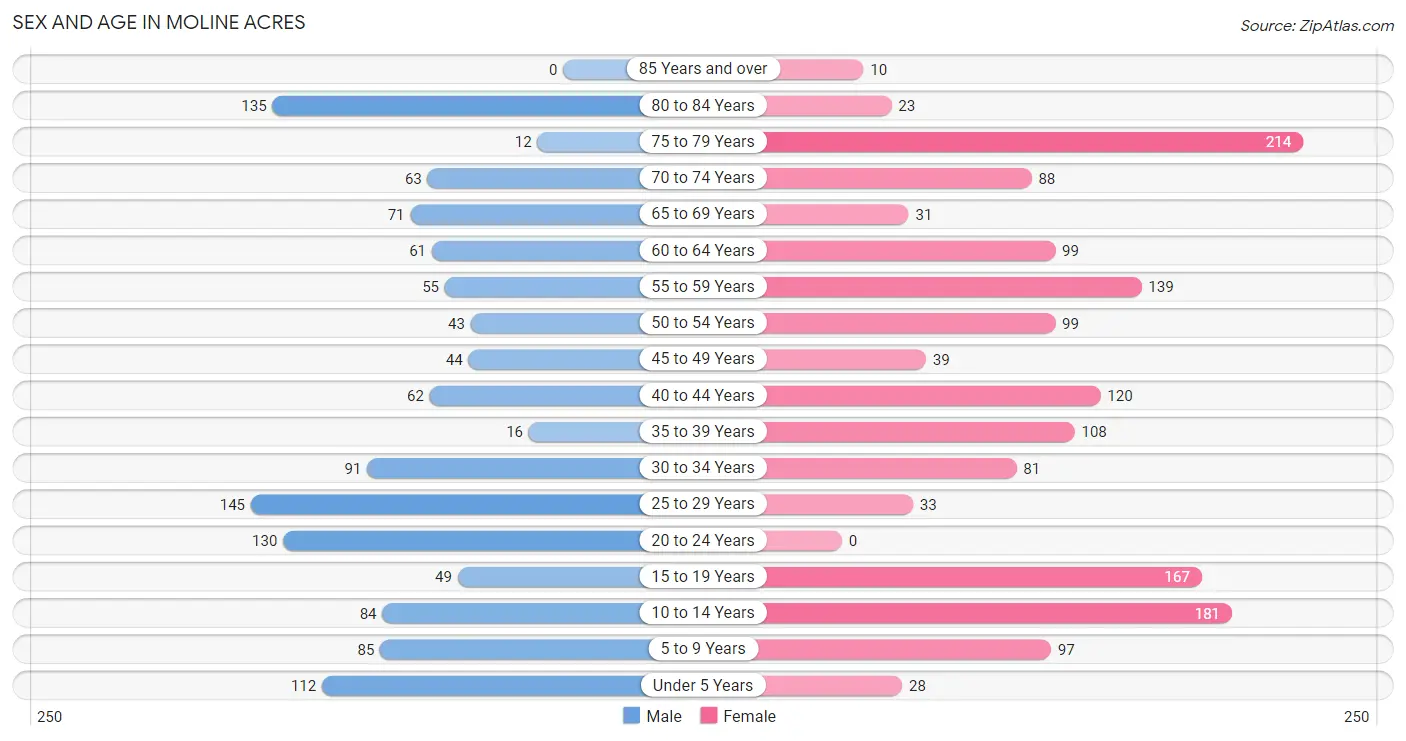
Sex and Age in Moline Acres
Sex and Age in Moline Acres
The most populous age groups in Moline Acres are 25 to 29 Years (145 | 11.5%) for men and 75 to 79 Years (214 | 13.7%) for women.
| Age Bracket | Male | Female |
| Under 5 Years | 112 (8.9%) | 28 (1.8%) |
| 5 to 9 Years | 85 (6.8%) | 97 (6.2%) |
| 10 to 14 Years | 84 (6.7%) | 181 (11.6%) |
| 15 to 19 Years | 49 (3.9%) | 167 (10.7%) |
| 20 to 24 Years | 130 (10.3%) | 0 (0.0%) |
| 25 to 29 Years | 145 (11.5%) | 33 (2.1%) |
| 30 to 34 Years | 91 (7.2%) | 81 (5.2%) |
| 35 to 39 Years | 16 (1.3%) | 108 (6.9%) |
| 40 to 44 Years | 62 (4.9%) | 120 (7.7%) |
| 45 to 49 Years | 44 (3.5%) | 39 (2.5%) |
| 50 to 54 Years | 43 (3.4%) | 99 (6.4%) |
| 55 to 59 Years | 55 (4.4%) | 139 (8.9%) |
| 60 to 64 Years | 61 (4.9%) | 99 (6.4%) |
| 65 to 69 Years | 71 (5.6%) | 31 (2.0%) |
| 70 to 74 Years | 63 (5.0%) | 88 (5.7%) |
| 75 to 79 Years | 12 (0.9%) | 214 (13.7%) |
| 80 to 84 Years | 135 (10.7%) | 23 (1.5%) |
| 85 Years and over | 0 (0.0%) | 10 (0.6%) |
| Total | 1,258 (100.0%) | 1,557 (100.0%) |
Families and Households in Moline Acres
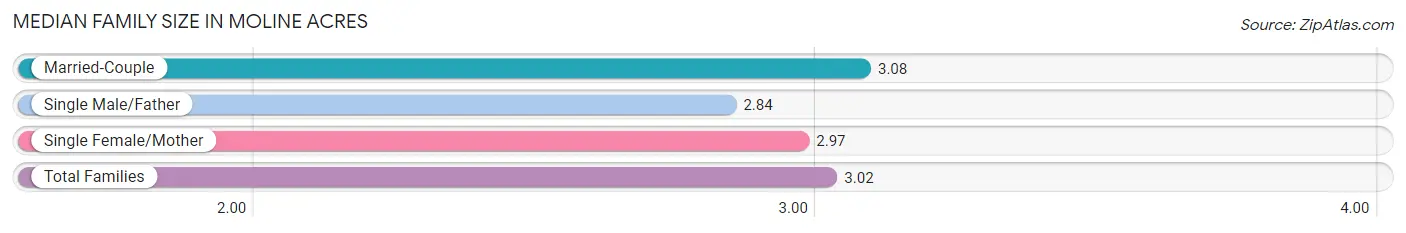
Median Family Size in Moline Acres
The median family size in Moline Acres is 3.02 persons per family, with married-couple families (374 | 47.5%) accounting for the largest median family size of 3.08 persons per family. On the other hand, single male/father families (19 | 2.4%) represent the smallest median family size with 2.84 persons per family.
| Family Type | # Families | Family Size |
| Married-Couple | 374 (47.5%) | 3.08 |
| Single Male/Father | 19 (2.4%) | 2.84 |
| Single Female/Mother | 395 (50.1%) | 2.97 |
| Total Families | 788 (100.0%) | 3.02 |
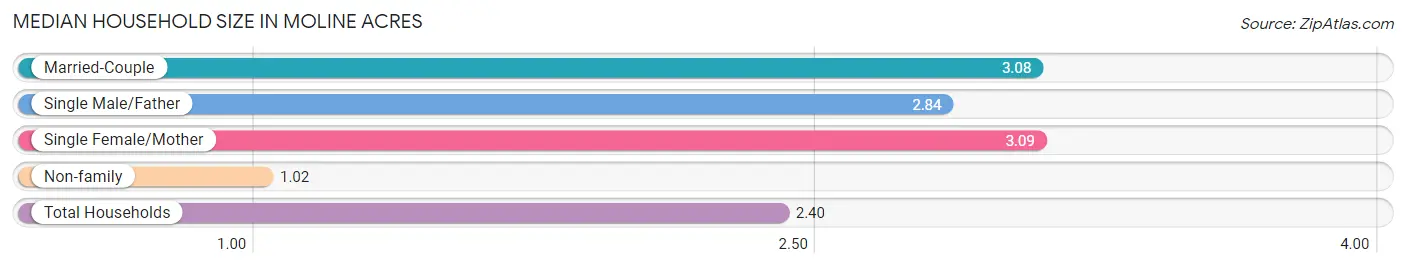
Median Household Size in Moline Acres
The median household size in Moline Acres is 2.40 persons per household, with single female/mother households (395 | 33.7%) accounting for the largest median household size of 3.09 persons per household. non-family households (383 | 32.7%) represent the smallest median household size with 1.02 persons per household.
| Household Type | # Households | Household Size |
| Married-Couple | 374 (31.9%) | 3.08 |
| Single Male/Father | 19 (1.6%) | 2.84 |
| Single Female/Mother | 395 (33.7%) | 3.09 |
| Non-family | 383 (32.7%) | 1.02 |
| Total Households | 1,171 (100.0%) | 2.40 |
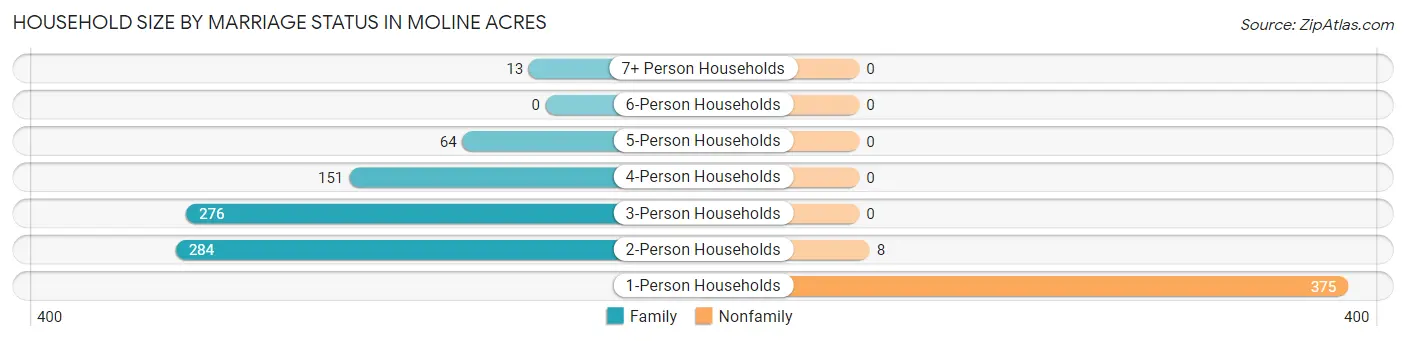
Household Size by Marriage Status in Moline Acres
Out of a total of 1,171 households in Moline Acres, 788 (67.3%) are family households, while 383 (32.7%) are nonfamily households. The most numerous type of family households are 2-person households, comprising 284, and the most common type of nonfamily households are 1-person households, comprising 375.
| Household Size | Family Households | Nonfamily Households |
| 1-Person Households | - | 375 (32.0%) |
| 2-Person Households | 284 (24.2%) | 8 (0.7%) |
| 3-Person Households | 276 (23.6%) | 0 (0.0%) |
| 4-Person Households | 151 (12.9%) | 0 (0.0%) |
| 5-Person Households | 64 (5.5%) | 0 (0.0%) |
| 6-Person Households | 0 (0.0%) | 0 (0.0%) |
| 7+ Person Households | 13 (1.1%) | 0 (0.0%) |
| Total | 788 (67.3%) | 383 (32.7%) |
Female Fertility in Moline Acres
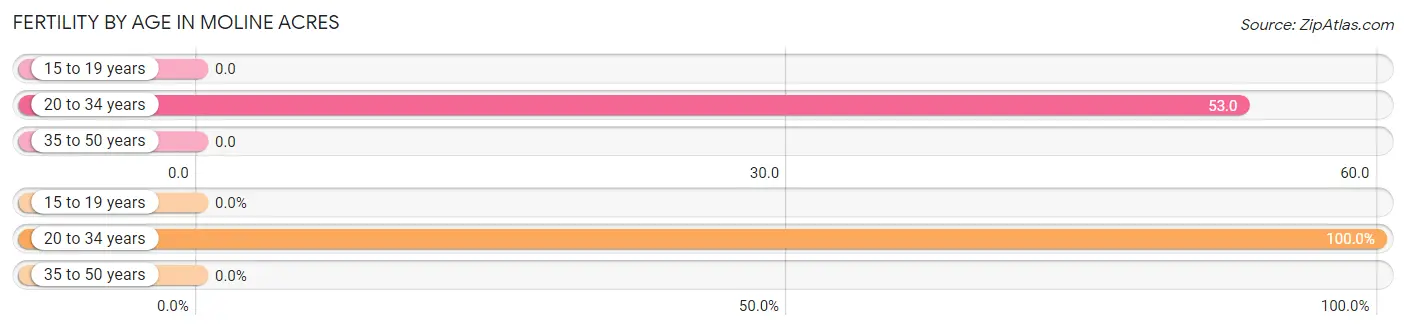
Fertility by Age in Moline Acres
Average fertility rate in Moline Acres is 10.0 births per 1,000 women. Women in the age bracket of 20 to 34 years have the highest fertility rate with 53.0 births per 1,000 women. Women in the age bracket of 20 to 34 years acount for 100.0% of all women with births.
| Age Bracket | Women with Births | Births / 1,000 Women |
| 15 to 19 years | 0 (0.0%) | 0.0 |
| 20 to 34 years | 6 (100.0%) | 53.0 |
| 35 to 50 years | 0 (0.0%) | 0.0 |
| Total | 6 (100.0%) | 10.0 |
Fertility by Age by Marriage Status in Moline Acres
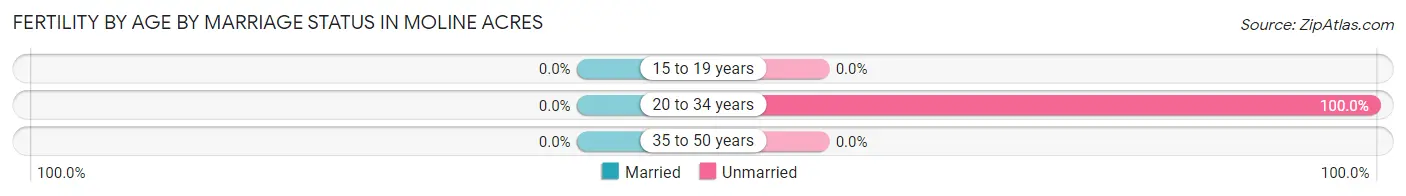
| Age Bracket | Married | Unmarried |
| 15 to 19 years | 0 (0.0%) | 0 (0.0%) |
| 20 to 34 years | 0 (0.0%) | 6 (100.0%) |
| 35 to 50 years | 0 (0.0%) | 0 (0.0%) |
| Total | 0 (0.0%) | 6 (100.0%) |
Fertility by Education in Moline Acres
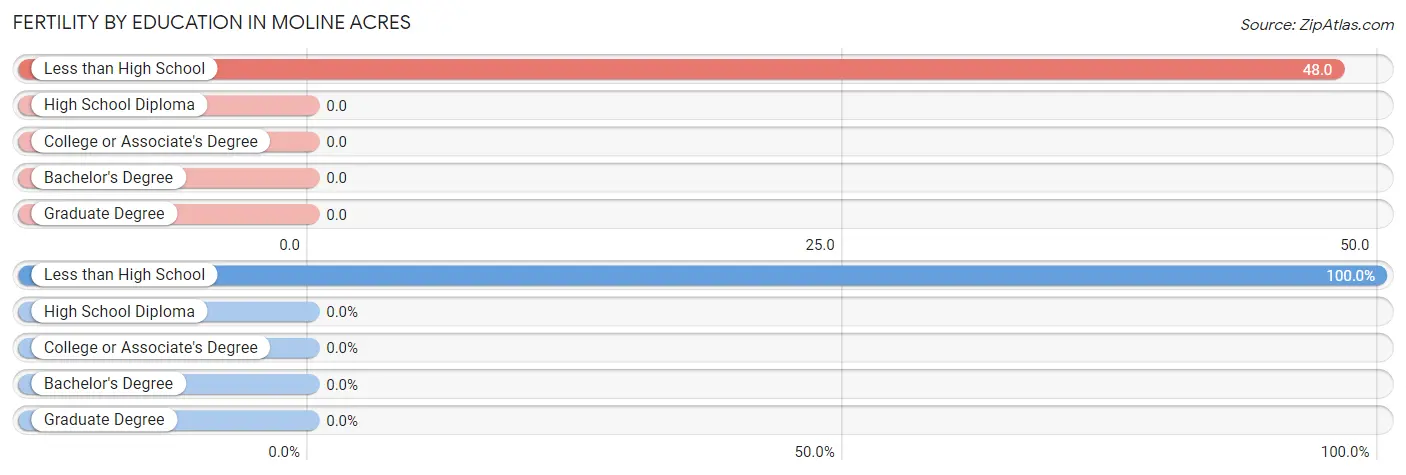
| Educational Attainment | Women with Births | Births / 1,000 Women |
| Less than High School | 6 (100.0%) | 48.0 |
| High School Diploma | 0 (0.0%) | 0.0 |
| College or Associate's Degree | 0 (0.0%) | 0.0 |
| Bachelor's Degree | 0 (0.0%) | 0.0 |
| Graduate Degree | 0 (0.0%) | 0.0 |
| Total | 6 (100.0%) | 10.0 |
Fertility by Education by Marriage Status in Moline Acres
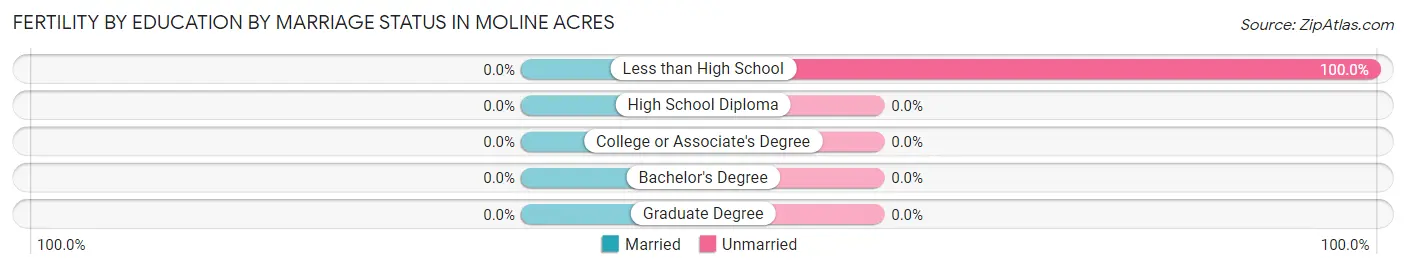
| Educational Attainment | Married | Unmarried |
| Less than High School | 0 (0.0%) | 6 (100.0%) |
| High School Diploma | 0 (0.0%) | 0 (0.0%) |
| College or Associate's Degree | 0 (0.0%) | 0 (0.0%) |
| Bachelor's Degree | 0 (0.0%) | 0 (0.0%) |
| Graduate Degree | 0 (0.0%) | 0 (0.0%) |
| Total | 0 (0.0%) | 6 (100.0%) |
Income in Moline Acres
Income Overview in Moline Acres
Per Capita Income in Moline Acres is $20,636, while median incomes of families and households are $52,804 and $50,352 respectively.
| Characteristic | Number | Measure |
| Per Capita Income | 2,815 | $20,636 |
| Median Family Income | 788 | $52,804 |
| Mean Family Income | 788 | $55,578 |
| Median Household Income | 1,171 | $50,352 |
| Mean Household Income | 1,171 | $49,777 |
| Income Deficit | 788 | $10,707 |
| Wage / Income Gap (%) | 2,815 | 14.29% |
| Wage / Income Gap ($) | 2,815 | 85.71¢ per $1 |
| Gini / Inequality Index | 2,815 | 0.36 |
Earnings by Sex in Moline Acres
Average Earnings in Moline Acres are $26,571, $23,654 for men and $27,598 for women, a difference of 14.3%.
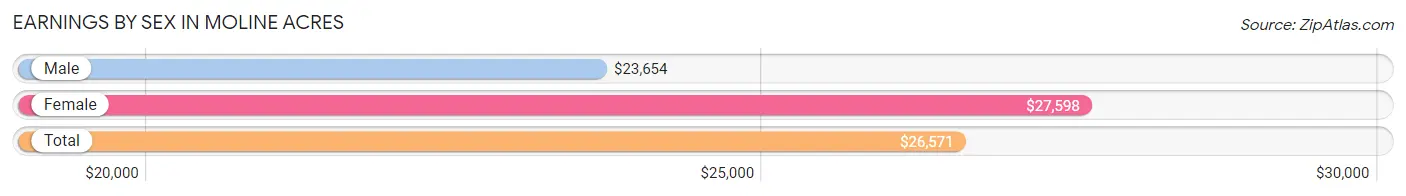
| Sex | Number | Average Earnings |
| Male | 566 (51.1%) | $23,654 |
| Female | 542 (48.9%) | $27,598 |
| Total | 1,108 (100.0%) | $26,571 |
Earnings by Sex by Income Bracket in Moline Acres
The most common earnings brackets in Moline Acres are $10,000 to $12,499 for men (83 | 14.7%) and $25,000 to $29,999 for women (121 | 22.3%).
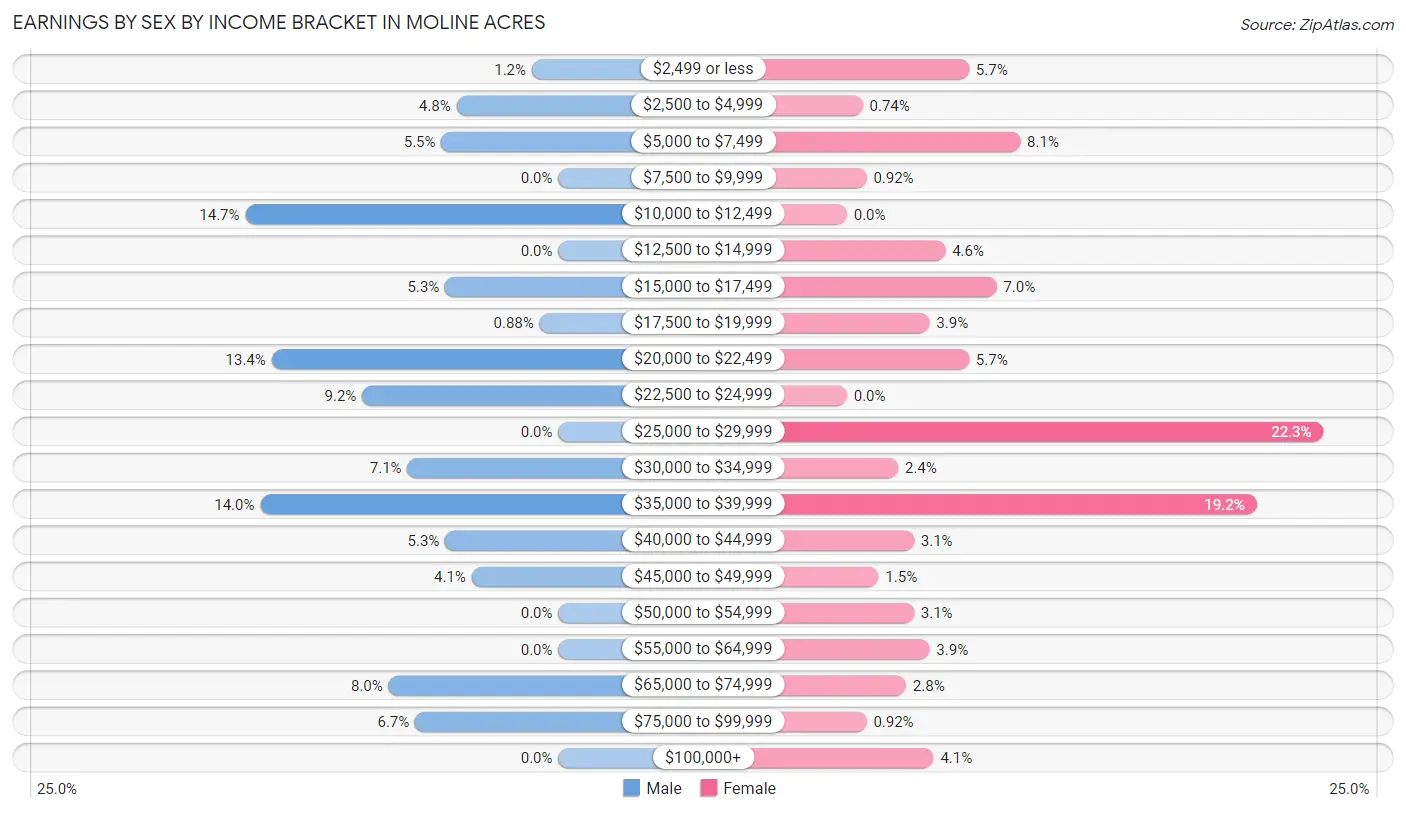
| Income | Male | Female |
| $2,499 or less | 7 (1.2%) | 31 (5.7%) |
| $2,500 to $4,999 | 27 (4.8%) | 4 (0.7%) |
| $5,000 to $7,499 | 31 (5.5%) | 44 (8.1%) |
| $7,500 to $9,999 | 0 (0.0%) | 5 (0.9%) |
| $10,000 to $12,499 | 83 (14.7%) | 0 (0.0%) |
| $12,500 to $14,999 | 0 (0.0%) | 25 (4.6%) |
| $15,000 to $17,499 | 30 (5.3%) | 38 (7.0%) |
| $17,500 to $19,999 | 5 (0.9%) | 21 (3.9%) |
| $20,000 to $22,499 | 76 (13.4%) | 31 (5.7%) |
| $22,500 to $24,999 | 52 (9.2%) | 0 (0.0%) |
| $25,000 to $29,999 | 0 (0.0%) | 121 (22.3%) |
| $30,000 to $34,999 | 40 (7.1%) | 13 (2.4%) |
| $35,000 to $39,999 | 79 (14.0%) | 104 (19.2%) |
| $40,000 to $44,999 | 30 (5.3%) | 17 (3.1%) |
| $45,000 to $49,999 | 23 (4.1%) | 8 (1.5%) |
| $50,000 to $54,999 | 0 (0.0%) | 17 (3.1%) |
| $55,000 to $64,999 | 0 (0.0%) | 21 (3.9%) |
| $65,000 to $74,999 | 45 (8.0%) | 15 (2.8%) |
| $75,000 to $99,999 | 38 (6.7%) | 5 (0.9%) |
| $100,000+ | 0 (0.0%) | 22 (4.1%) |
| Total | 566 (100.0%) | 542 (100.0%) |
Earnings by Sex by Educational Attainment in Moline Acres
Average earnings in Moline Acres are $35,137 for men and $31,250 for women, a difference of 11.1%. Men with an educational attainment of college or associate's degree enjoy the highest average annual earnings of $35,521, while those with high school diploma education earn the least with $22,056. Women with an educational attainment of college or associate's degree earn the most with the average annual earnings of $35,707, while those with high school diploma education have the smallest earnings of $25,795.
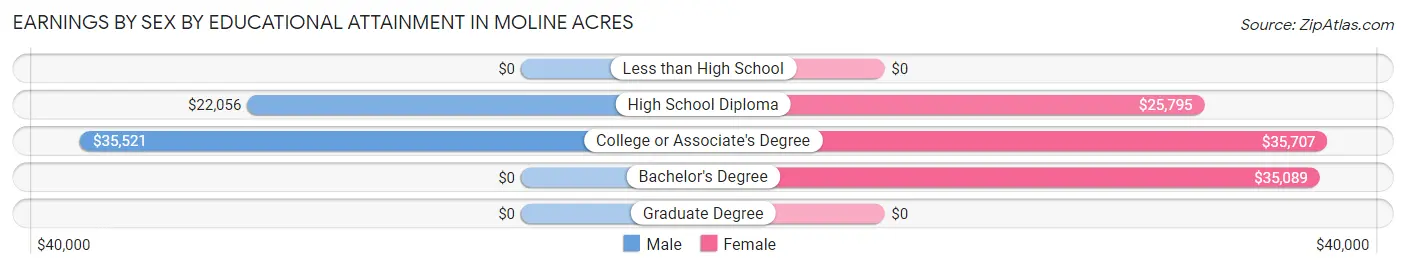
| Educational Attainment | Male Income | Female Income |
| Less than High School | - | - |
| High School Diploma | $22,056 | $25,795 |
| College or Associate's Degree | $35,521 | $35,707 |
| Bachelor's Degree | - | - |
| Graduate Degree | - | - |
| Total | $35,137 | $31,250 |
Family Income in Moline Acres
Family Income Brackets in Moline Acres
According to the Moline Acres family income data, there are 368 families falling into the $50,000 to $74,999 income range, which is the most common income bracket and makes up 46.7% of all families. Conversely, the $200,000+ income bracket is the least frequent group with only 5 families (0.6%) belonging to this category.
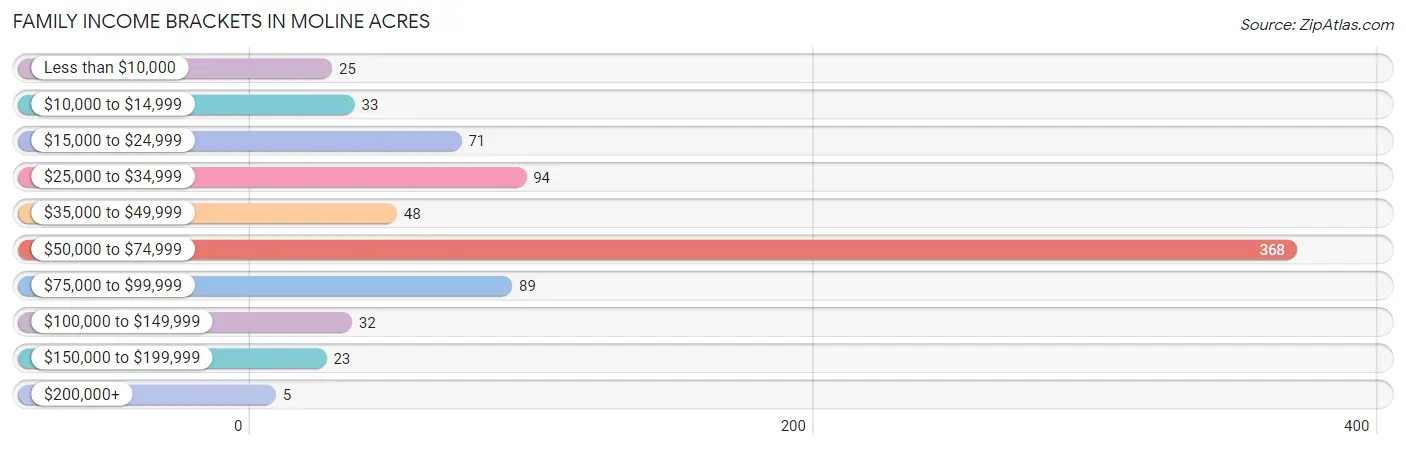
| Income Bracket | # Families | % Families |
| Less than $10,000 | 25 | 3.2% |
| $10,000 to $14,999 | 33 | 4.2% |
| $15,000 to $24,999 | 71 | 9.0% |
| $25,000 to $34,999 | 94 | 11.9% |
| $35,000 to $49,999 | 48 | 6.1% |
| $50,000 to $74,999 | 368 | 46.7% |
| $75,000 to $99,999 | 89 | 11.3% |
| $100,000 to $149,999 | 32 | 4.1% |
| $150,000 to $199,999 | 23 | 2.9% |
| $200,000+ | 5 | 0.6% |
Family Income by Famaliy Size in Moline Acres
3-person families (251 | 31.9%) account for the highest median family income in Moline Acres with $54,861 per family, while 2-person families (309 | 39.2%) have the highest median income of $25,320 per family member.
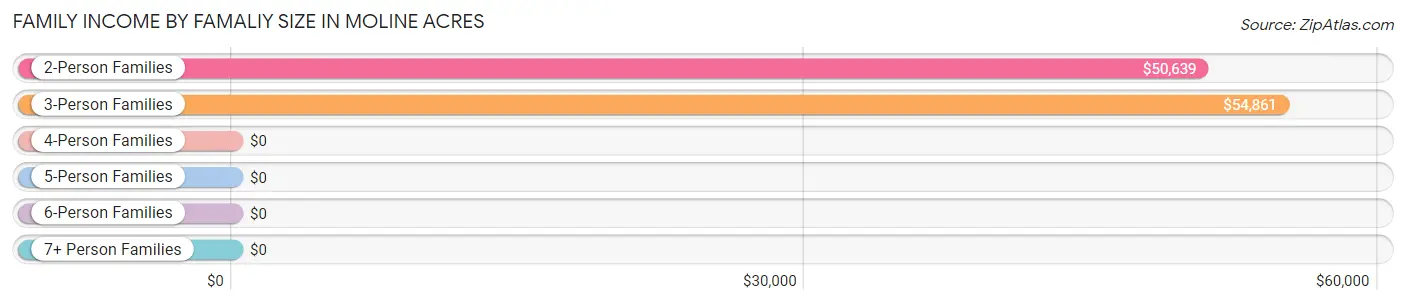
| Income Bracket | # Families | Median Income |
| 2-Person Families | 309 (39.2%) | $50,639 |
| 3-Person Families | 251 (31.9%) | $54,861 |
| 4-Person Families | 151 (19.2%) | $0 |
| 5-Person Families | 64 (8.1%) | $0 |
| 6-Person Families | 13 (1.7%) | $0 |
| 7+ Person Families | 0 (0.0%) | $0 |
| Total | 788 (100.0%) | $52,804 |
Family Income by Number of Earners in Moline Acres
The median family income in Moline Acres is $52,804, with families comprising 3+ earners (72) having the highest median family income of $86,696, while families with no earners (161) have the lowest median family income of $50,323, accounting for 9.1% and 20.4% of families, respectively.
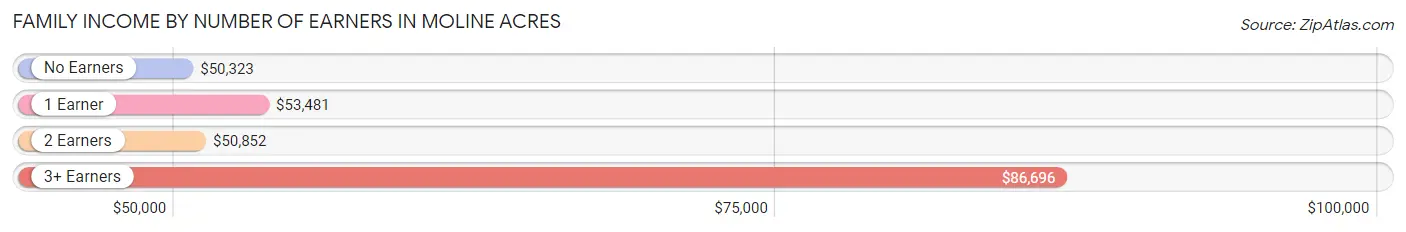
| Number of Earners | # Families | Median Income |
| No Earners | 161 (20.4%) | $50,323 |
| 1 Earner | 432 (54.8%) | $53,481 |
| 2 Earners | 123 (15.6%) | $50,852 |
| 3+ Earners | 72 (9.1%) | $86,696 |
| Total | 788 (100.0%) | $52,804 |
Household Income in Moline Acres
Household Income Brackets in Moline Acres
With 395 households falling in the category, the $50,000 to $74,999 income range is the most frequent in Moline Acres, accounting for 33.7% of all households. In contrast, only 5 households (0.4%) fall into the $200,000+ income bracket, making it the least populous group.
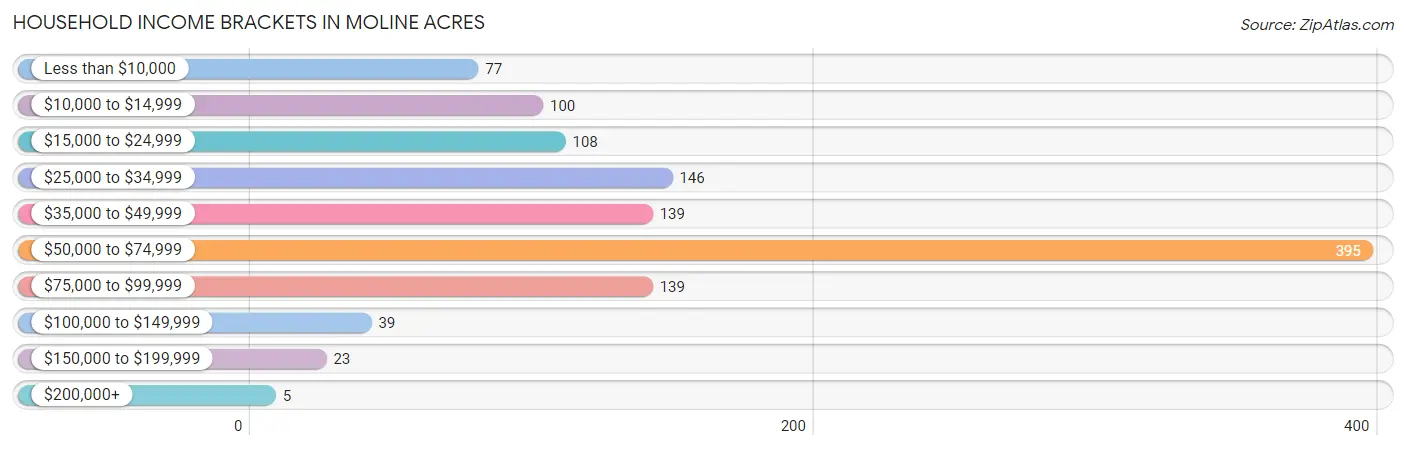
| Income Bracket | # Households | % Households |
| Less than $10,000 | 77 | 6.6% |
| $10,000 to $14,999 | 100 | 8.5% |
| $15,000 to $24,999 | 108 | 9.2% |
| $25,000 to $34,999 | 146 | 12.5% |
| $35,000 to $49,999 | 139 | 11.9% |
| $50,000 to $74,999 | 395 | 33.7% |
| $75,000 to $99,999 | 139 | 11.9% |
| $100,000 to $149,999 | 39 | 3.3% |
| $150,000 to $199,999 | 23 | 2.0% |
| $200,000+ | 5 | 0.4% |
Household Income by Householder Age in Moline Acres
The median household income in Moline Acres is $50,352, with the highest median household income of $53,030 found in the 65+ years age bracket for the primary householder. A total of 536 households (45.8%) fall into this category.
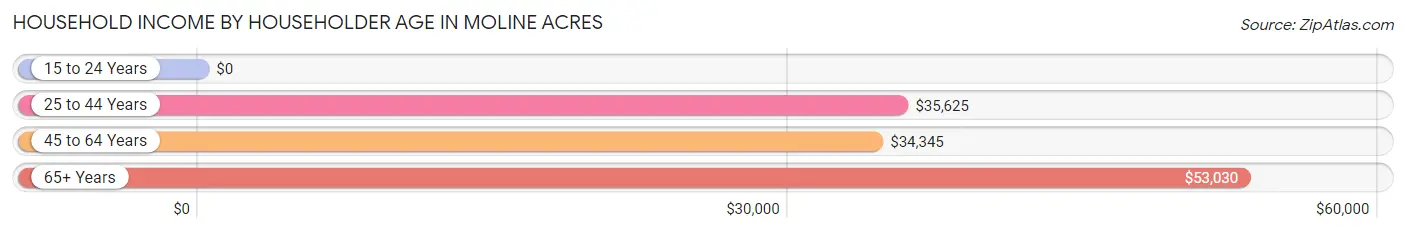
| Income Bracket | # Households | Median Income |
| 15 to 24 Years | 0 (0.0%) | $0 |
| 25 to 44 Years | 324 (27.7%) | $35,625 |
| 45 to 64 Years | 311 (26.6%) | $34,345 |
| 65+ Years | 536 (45.8%) | $53,030 |
| Total | 1,171 (100.0%) | $50,352 |
Poverty in Moline Acres
Income Below Poverty by Sex and Age in Moline Acres
With 23.1% poverty level for males and 21.1% for females among the residents of Moline Acres, 5 year old males and under 5 year old females are the most vulnerable to poverty, with 17 males (100.0%) and 17 females (60.7%) in their respective age groups living below the poverty level.
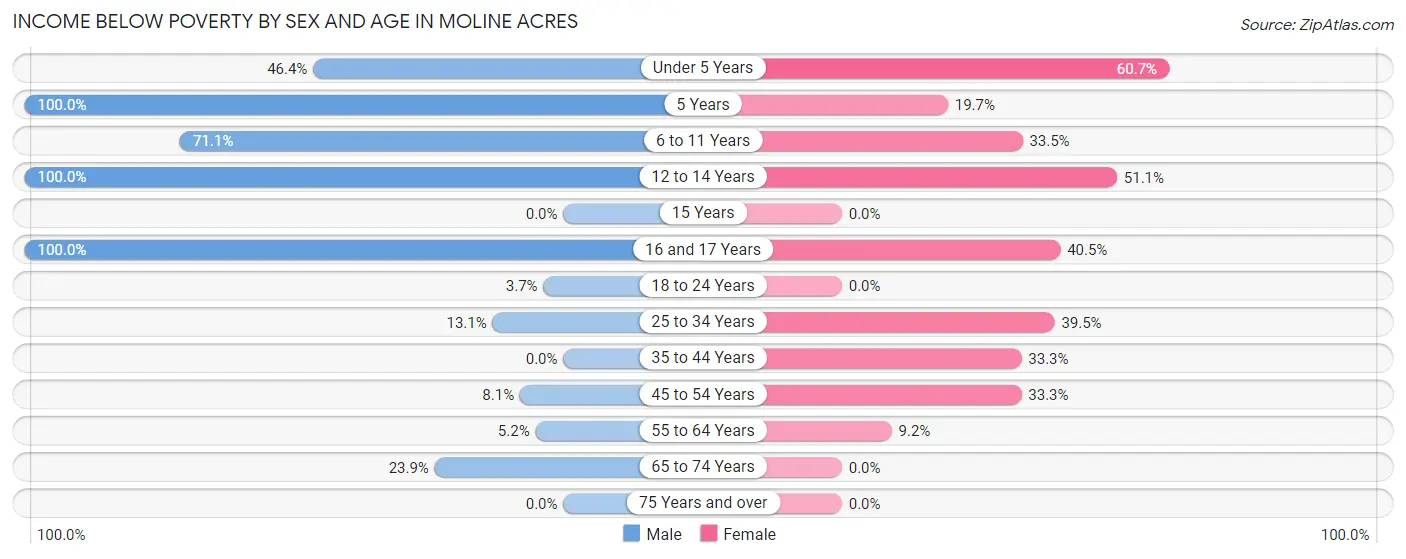
| Age Bracket | Male | Female |
| Under 5 Years | 52 (46.4%) | 17 (60.7%) |
| 5 Years | 17 (100.0%) | 12 (19.7%) |
| 6 to 11 Years | 69 (71.1%) | 57 (33.5%) |
| 12 to 14 Years | 55 (100.0%) | 24 (51.1%) |
| 15 Years | 0 (0.0%) | 0 (0.0%) |
| 16 and 17 Years | 17 (100.0%) | 30 (40.5%) |
| 18 to 24 Years | 5 (3.7%) | 0 (0.0%) |
| 25 to 34 Years | 31 (13.1%) | 45 (39.5%) |
| 35 to 44 Years | 0 (0.0%) | 76 (33.3%) |
| 45 to 54 Years | 7 (8.1%) | 46 (33.3%) |
| 55 to 64 Years | 6 (5.2%) | 22 (9.2%) |
| 65 to 74 Years | 32 (23.9%) | 0 (0.0%) |
| 75 Years and over | 0 (0.0%) | 0 (0.0%) |
| Total | 291 (23.1%) | 329 (21.1%) |
Income Above Poverty by Sex and Age in Moline Acres
According to the poverty statistics in Moline Acres, males aged 15 years and females aged 15 years are the age groups that are most secure financially, with 100.0% of males and 100.0% of females in these age groups living above the poverty line.
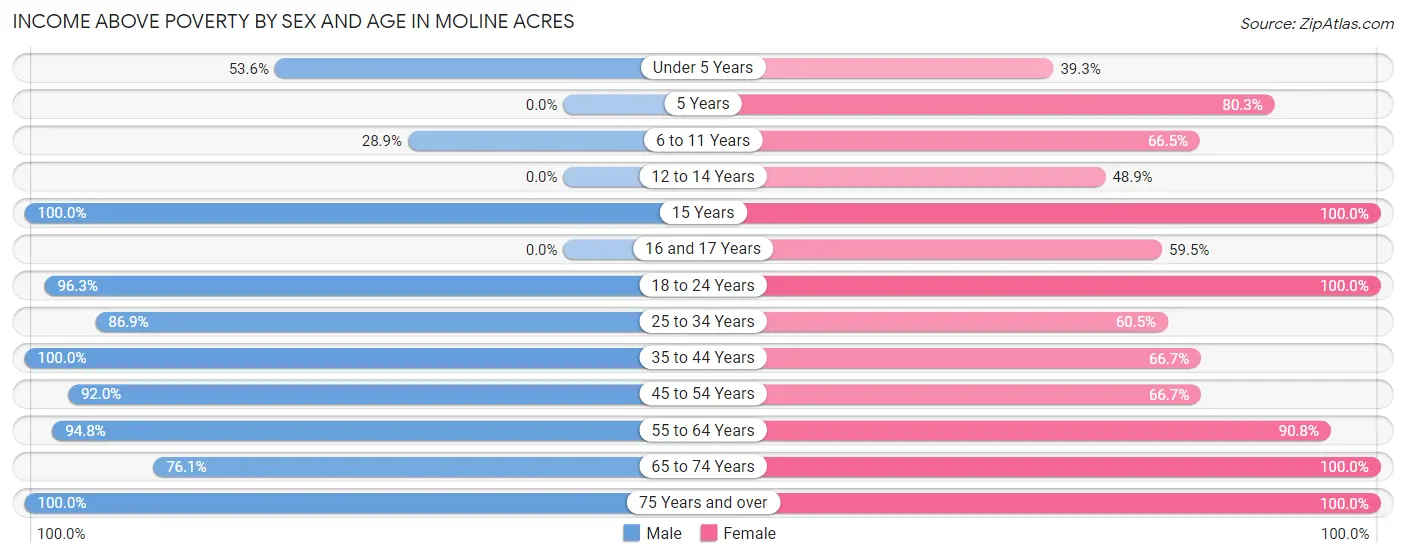
| Age Bracket | Male | Female |
| Under 5 Years | 60 (53.6%) | 11 (39.3%) |
| 5 Years | 0 (0.0%) | 49 (80.3%) |
| 6 to 11 Years | 28 (28.9%) | 113 (66.5%) |
| 12 to 14 Years | 0 (0.0%) | 23 (48.9%) |
| 15 Years | 27 (100.0%) | 7 (100.0%) |
| 16 and 17 Years | 0 (0.0%) | 44 (59.5%) |
| 18 to 24 Years | 130 (96.3%) | 86 (100.0%) |
| 25 to 34 Years | 205 (86.9%) | 69 (60.5%) |
| 35 to 44 Years | 78 (100.0%) | 152 (66.7%) |
| 45 to 54 Years | 80 (91.9%) | 92 (66.7%) |
| 55 to 64 Years | 110 (94.8%) | 216 (90.8%) |
| 65 to 74 Years | 102 (76.1%) | 119 (100.0%) |
| 75 Years and over | 147 (100.0%) | 247 (100.0%) |
| Total | 967 (76.9%) | 1,228 (78.9%) |
Income Below Poverty Among Married-Couple Families in Moline Acres
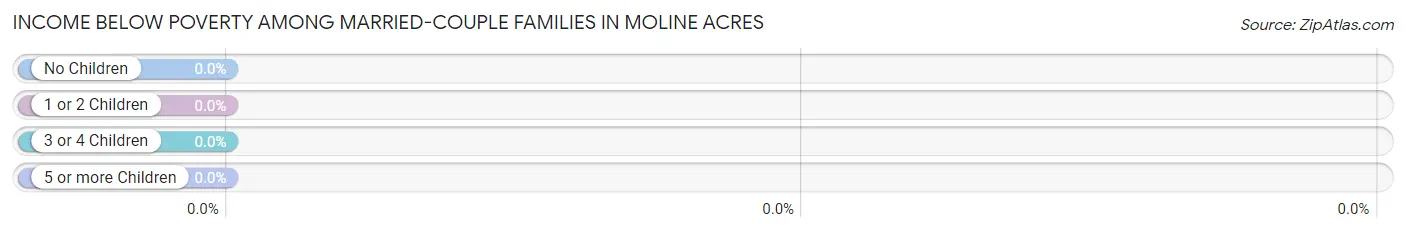
| Children | Above Poverty | Below Poverty |
| No Children | 237 (100.0%) | 0 (0.0%) |
| 1 or 2 Children | 114 (100.0%) | 0 (0.0%) |
| 3 or 4 Children | 23 (100.0%) | 0 (0.0%) |
| 5 or more Children | 0 (0.0%) | 0 (0.0%) |
| Total | 374 (100.0%) | 0 (0.0%) |
Income Below Poverty Among Single-Parent Households in Moline Acres
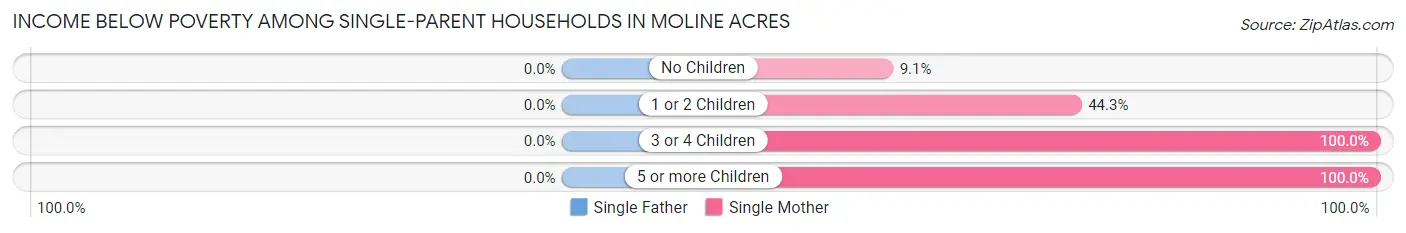
| Children | Single Father | Single Mother |
| No Children | 0 (0.0%) | 20 (9.1%) |
| 1 or 2 Children | 0 (0.0%) | 50 (44.3%) |
| 3 or 4 Children | 0 (0.0%) | 50 (100.0%) |
| 5 or more Children | 0 (0.0%) | 13 (100.0%) |
| Total | 0 (0.0%) | 133 (33.7%) |
Income Below Poverty Among Married-Couple vs Single-Parent Households in Moline Acres
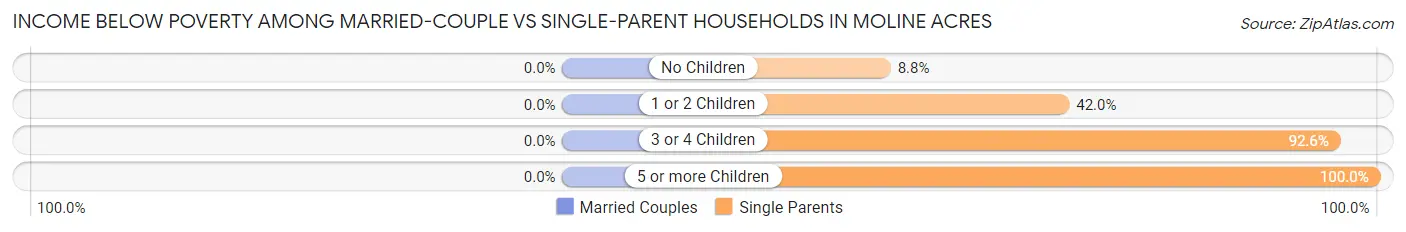
| Children | Married-Couple Families | Single-Parent Households |
| No Children | 0 (0.0%) | 20 (8.8%) |
| 1 or 2 Children | 0 (0.0%) | 50 (42.0%) |
| 3 or 4 Children | 0 (0.0%) | 50 (92.6%) |
| 5 or more Children | 0 (0.0%) | 13 (100.0%) |
| Total | 0 (0.0%) | 133 (32.1%) |
Employment Characteristics in Moline Acres
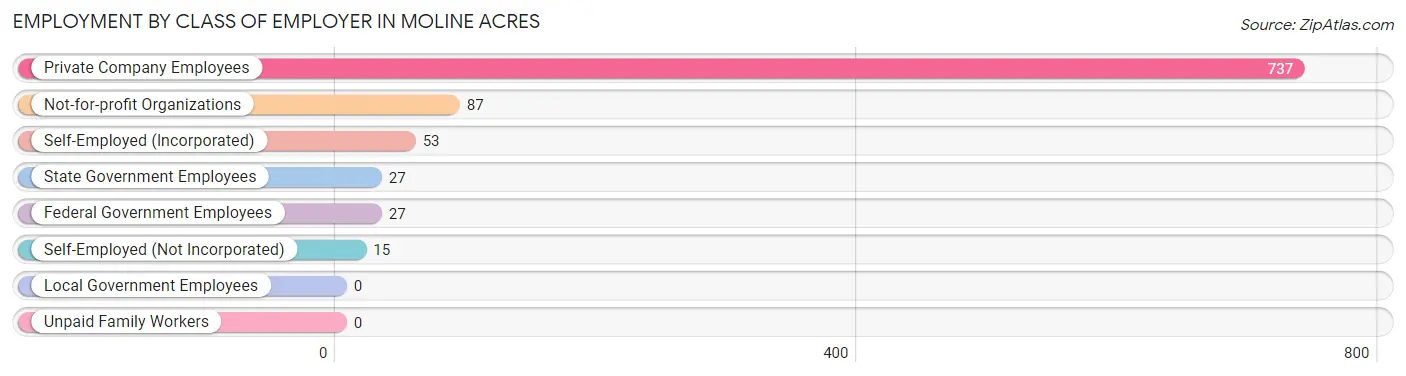
Employment by Class of Employer in Moline Acres
Among the 946 employed individuals in Moline Acres, private company employees (737 | 77.9%), not-for-profit organizations (87 | 9.2%), and self-employed (incorporated) (53 | 5.6%) make up the most common classes of employment.
| Employer Class | # Employees | % Employees |
| Private Company Employees | 737 | 77.9% |
| Self-Employed (Incorporated) | 53 | 5.6% |
| Self-Employed (Not Incorporated) | 15 | 1.6% |
| Not-for-profit Organizations | 87 | 9.2% |
| Local Government Employees | 0 | 0.0% |
| State Government Employees | 27 | 2.9% |
| Federal Government Employees | 27 | 2.9% |
| Unpaid Family Workers | 0 | 0.0% |
| Total | 946 | 100.0% |
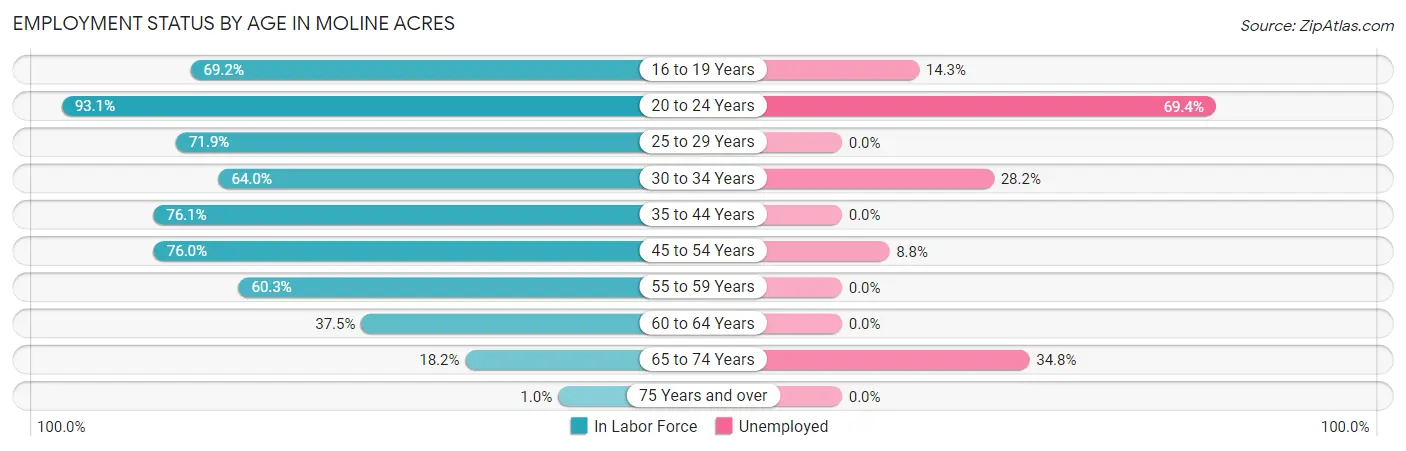
Employment Status by Age in Moline Acres
According to the labor force statistics for Moline Acres, out of the total population over 16 years of age (2,194), 50.9% or 1,117 individuals are in the labor force, with 15.0% or 168 of them unemployed. The age group with the highest labor force participation rate is 20 to 24 years, with 93.1% or 121 individuals in the labor force. Within the labor force, the 20 to 24 years age range has the highest percentage of unemployed individuals, with 69.4% or 84 of them being unemployed.
| Age Bracket | In Labor Force | Unemployed |
| 16 to 19 Years | 126 (69.2%) | 18 (14.3%) |
| 20 to 24 Years | 121 (93.1%) | 84 (69.4%) |
| 25 to 29 Years | 128 (71.9%) | 0 (0.0%) |
| 30 to 34 Years | 110 (64.0%) | 31 (28.2%) |
| 35 to 44 Years | 233 (76.1%) | 0 (0.0%) |
| 45 to 54 Years | 171 (76.0%) | 15 (8.8%) |
| 55 to 59 Years | 117 (60.3%) | 0 (0.0%) |
| 60 to 64 Years | 60 (37.5%) | 0 (0.0%) |
| 65 to 74 Years | 46 (18.2%) | 16 (34.8%) |
| 75 Years and over | 4 (1.0%) | 0 (0.0%) |
| Total | 1,117 (50.9%) | 168 (15.0%) |
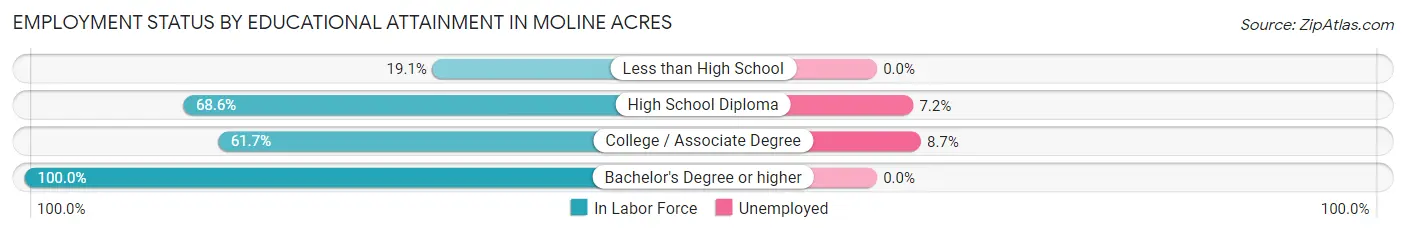
Employment Status by Educational Attainment in Moline Acres
According to labor force statistics for Moline Acres, 66.3% of individuals (819) out of the total population between 25 and 64 years of age (1,235) are in the labor force, with 5.8% or 48 of them being unemployed. The group with the highest labor force participation rate are those with the educational attainment of bachelor's degree or higher, with 100.0% or 198 individuals in the labor force. Within the labor force, individuals with college / associate degree education have the highest percentage of unemployment, with 8.7% or 28 of them being unemployed.
| Educational Attainment | In Labor Force | Unemployed |
| Less than High School | 21 (19.1%) | 0 (0.0%) |
| High School Diploma | 279 (68.6%) | 29 (7.2%) |
| College / Associate Degree | 321 (61.7%) | 45 (8.7%) |
| Bachelor's Degree or higher | 198 (100.0%) | 0 (0.0%) |
| Total | 819 (66.3%) | 72 (5.8%) |
Employment Occupations by Sex in Moline Acres
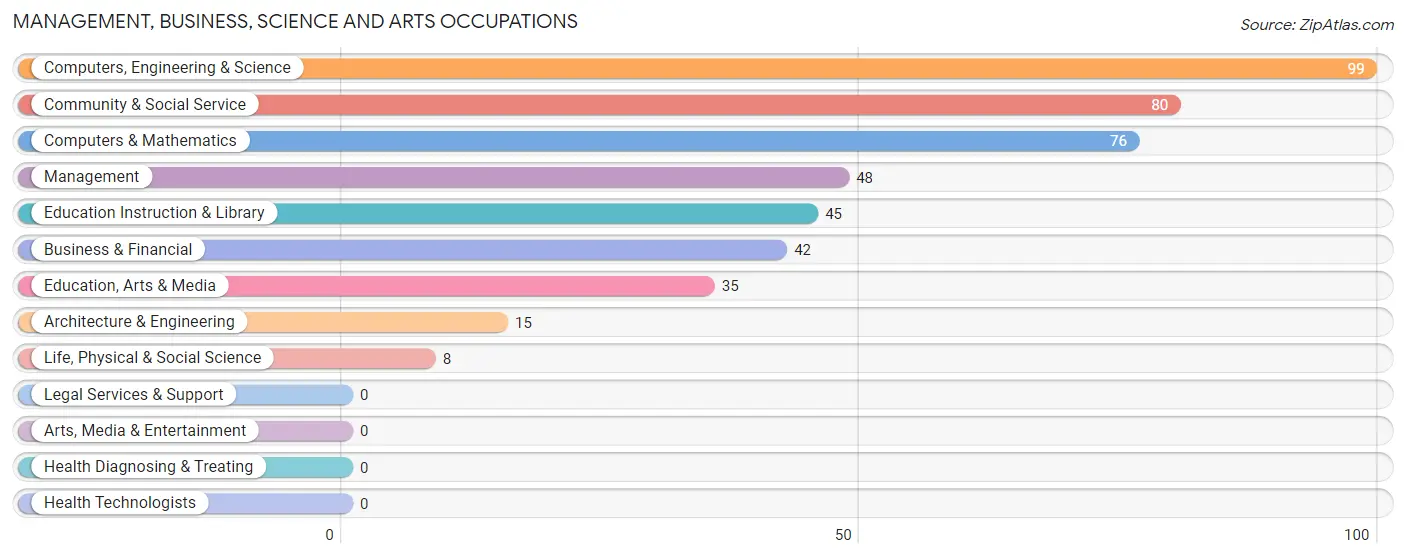
Management, Business, Science and Arts Occupations
The most common Management, Business, Science and Arts occupations in Moline Acres are Computers, Engineering & Science (99 | 10.6%), Community & Social Service (80 | 8.6%), Computers & Mathematics (76 | 8.2%), Management (48 | 5.2%), and Education Instruction & Library (45 | 4.8%).
Management, Business, Science and Arts Occupations by Sex
Within the Management, Business, Science and Arts occupations in Moline Acres, the most male-oriented occupations are Architecture & Engineering (100.0%), Education, Arts & Media (65.7%), and Computers, Engineering & Science (40.4%), while the most female-oriented occupations are Management (100.0%), Life, Physical & Social Science (100.0%), and Education Instruction & Library (100.0%).
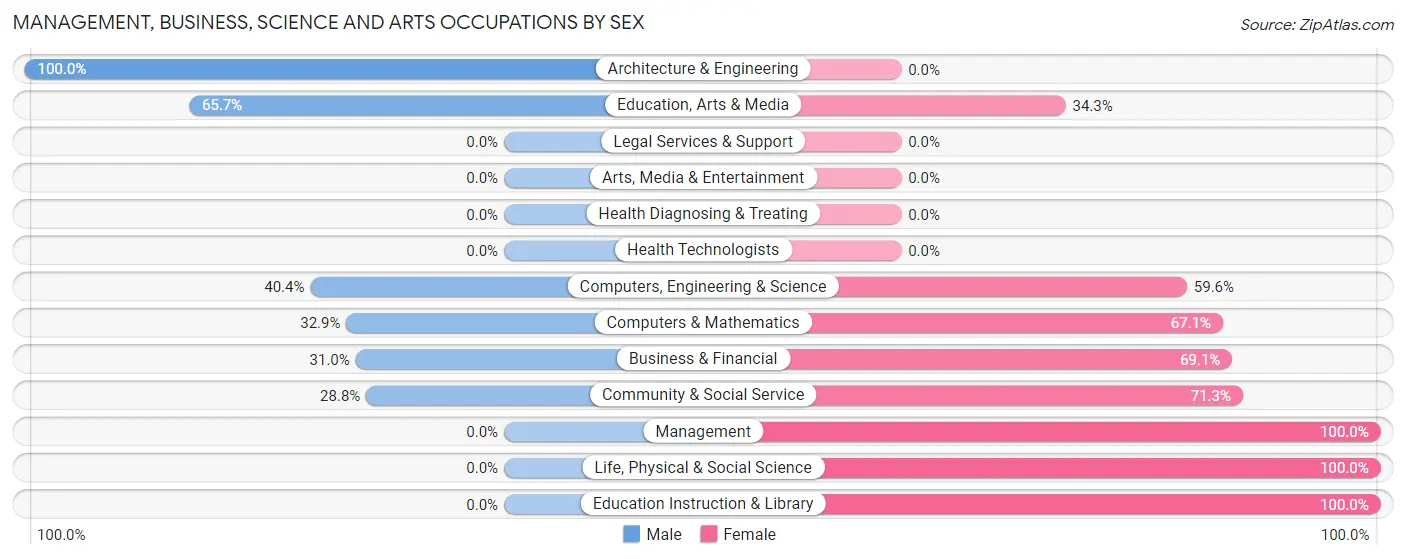
| Occupation | Male | Female |
| Management | 0 (0.0%) | 48 (100.0%) |
| Business & Financial | 13 (30.9%) | 29 (69.1%) |
| Computers, Engineering & Science | 40 (40.4%) | 59 (59.6%) |
| Computers & Mathematics | 25 (32.9%) | 51 (67.1%) |
| Architecture & Engineering | 15 (100.0%) | 0 (0.0%) |
| Life, Physical & Social Science | 0 (0.0%) | 8 (100.0%) |
| Community & Social Service | 23 (28.7%) | 57 (71.3%) |
| Education, Arts & Media | 23 (65.7%) | 12 (34.3%) |
| Legal Services & Support | 0 (0.0%) | 0 (0.0%) |
| Education Instruction & Library | 0 (0.0%) | 45 (100.0%) |
| Arts, Media & Entertainment | 0 (0.0%) | 0 (0.0%) |
| Health Diagnosing & Treating | 0 (0.0%) | 0 (0.0%) |
| Health Technologists | 0 (0.0%) | 0 (0.0%) |
| Total (Category) | 76 (28.2%) | 193 (71.8%) |
| Total (Overall) | 425 (45.7%) | 506 (54.3%) |
Services Occupations
The most common Services occupations in Moline Acres are Healthcare Support (128 | 13.8%), Personal Care & Service (28 | 3.0%), Food Preparation & Serving (22 | 2.4%), Security & Protection (17 | 1.8%), and Firefighting & Prevention (17 | 1.8%).
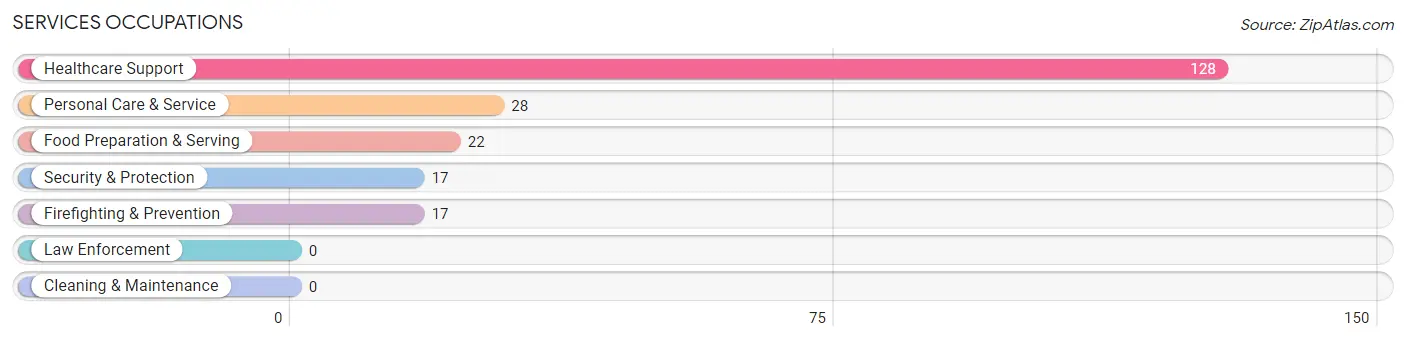
Services Occupations by Sex
Within the Services occupations in Moline Acres, the most male-oriented occupations are Security & Protection (100.0%), Firefighting & Prevention (100.0%), and Food Preparation & Serving (100.0%), while the most female-oriented occupations are Personal Care & Service (100.0%), and Healthcare Support (96.9%).
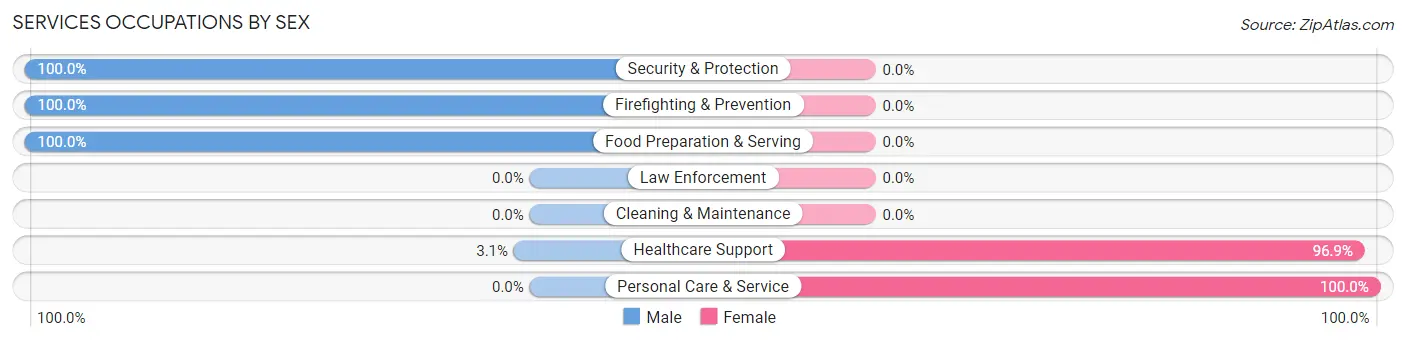
| Occupation | Male | Female |
| Healthcare Support | 4 (3.1%) | 124 (96.9%) |
| Security & Protection | 17 (100.0%) | 0 (0.0%) |
| Firefighting & Prevention | 17 (100.0%) | 0 (0.0%) |
| Law Enforcement | 0 (0.0%) | 0 (0.0%) |
| Food Preparation & Serving | 22 (100.0%) | 0 (0.0%) |
| Cleaning & Maintenance | 0 (0.0%) | 0 (0.0%) |
| Personal Care & Service | 0 (0.0%) | 28 (100.0%) |
| Total (Category) | 43 (22.1%) | 152 (77.9%) |
| Total (Overall) | 425 (45.7%) | 506 (54.3%) |
Sales and Office Occupations
The most common Sales and Office occupations in Moline Acres are Sales & Related (129 | 13.9%), and Office & Administration (105 | 11.3%).
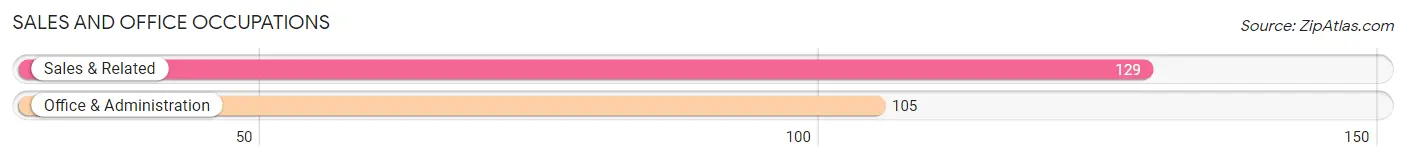
Sales and Office Occupations by Sex
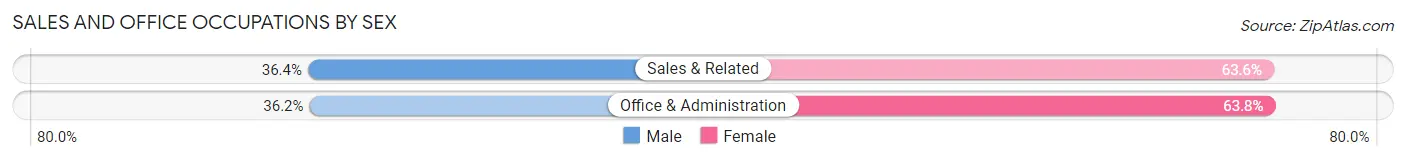
| Occupation | Male | Female |
| Sales & Related | 47 (36.4%) | 82 (63.6%) |
| Office & Administration | 38 (36.2%) | 67 (63.8%) |
| Total (Category) | 85 (36.3%) | 149 (63.7%) |
| Total (Overall) | 425 (45.7%) | 506 (54.3%) |
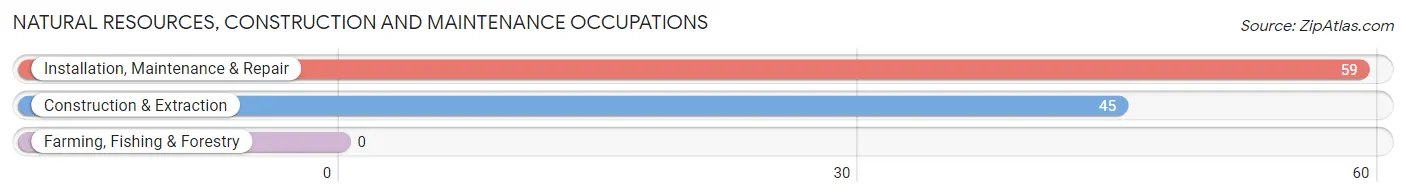
Natural Resources, Construction and Maintenance Occupations
The most common Natural Resources, Construction and Maintenance occupations in Moline Acres are Installation, Maintenance & Repair (59 | 6.3%), and Construction & Extraction (45 | 4.8%).
Natural Resources, Construction and Maintenance Occupations by Sex
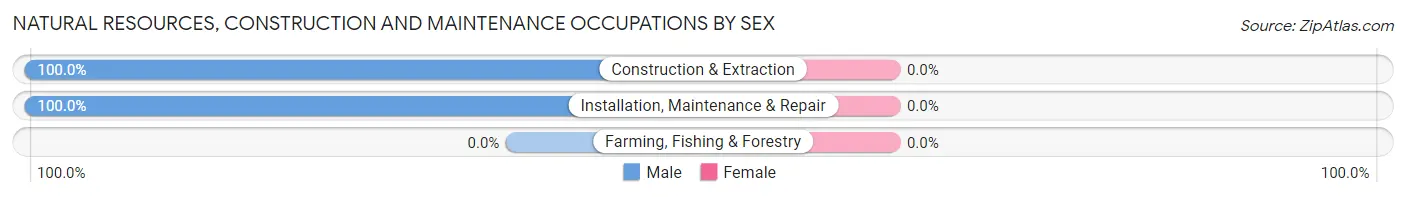
| Occupation | Male | Female |
| Farming, Fishing & Forestry | 0 (0.0%) | 0 (0.0%) |
| Construction & Extraction | 45 (100.0%) | 0 (0.0%) |
| Installation, Maintenance & Repair | 59 (100.0%) | 0 (0.0%) |
| Total (Category) | 104 (100.0%) | 0 (0.0%) |
| Total (Overall) | 425 (45.7%) | 506 (54.3%) |
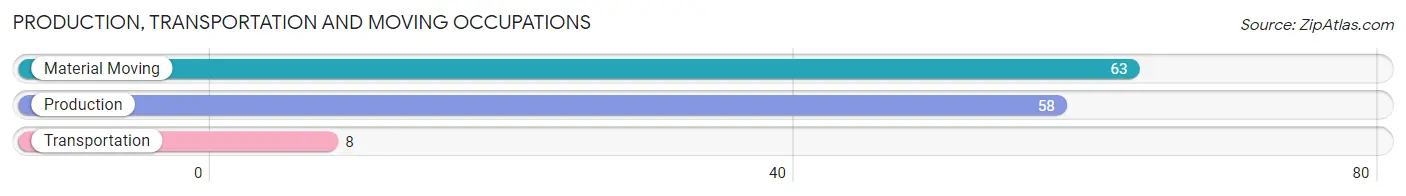
Production, Transportation and Moving Occupations
The most common Production, Transportation and Moving occupations in Moline Acres are Material Moving (63 | 6.8%), Production (58 | 6.2%), and Transportation (8 | 0.9%).
Production, Transportation and Moving Occupations by Sex
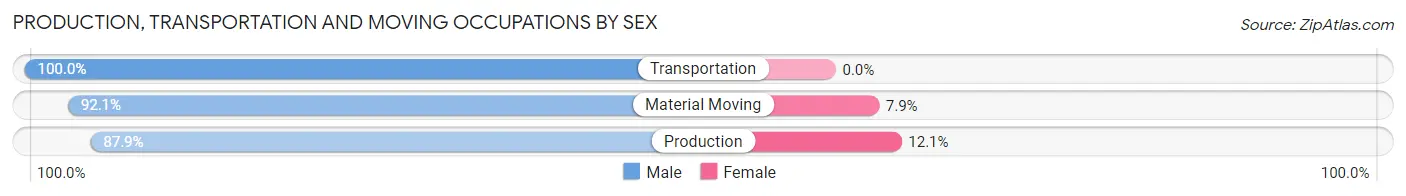
| Occupation | Male | Female |
| Production | 51 (87.9%) | 7 (12.1%) |
| Transportation | 8 (100.0%) | 0 (0.0%) |
| Material Moving | 58 (92.1%) | 5 (7.9%) |
| Total (Category) | 117 (90.7%) | 12 (9.3%) |
| Total (Overall) | 425 (45.7%) | 506 (54.3%) |
Employment Industries by Sex in Moline Acres
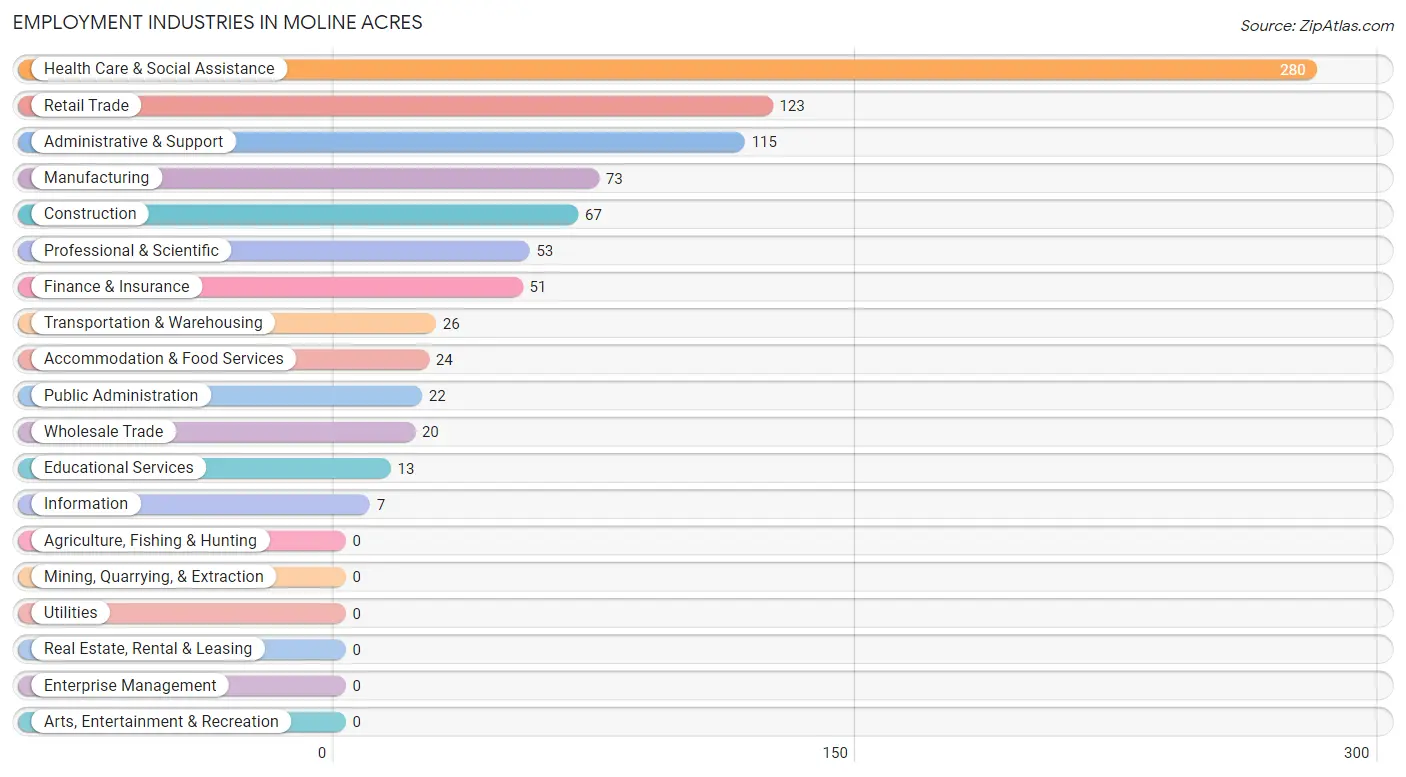
Employment Industries in Moline Acres
The major employment industries in Moline Acres include Health Care & Social Assistance (280 | 30.1%), Retail Trade (123 | 13.2%), Administrative & Support (115 | 12.3%), Manufacturing (73 | 7.8%), and Construction (67 | 7.2%).
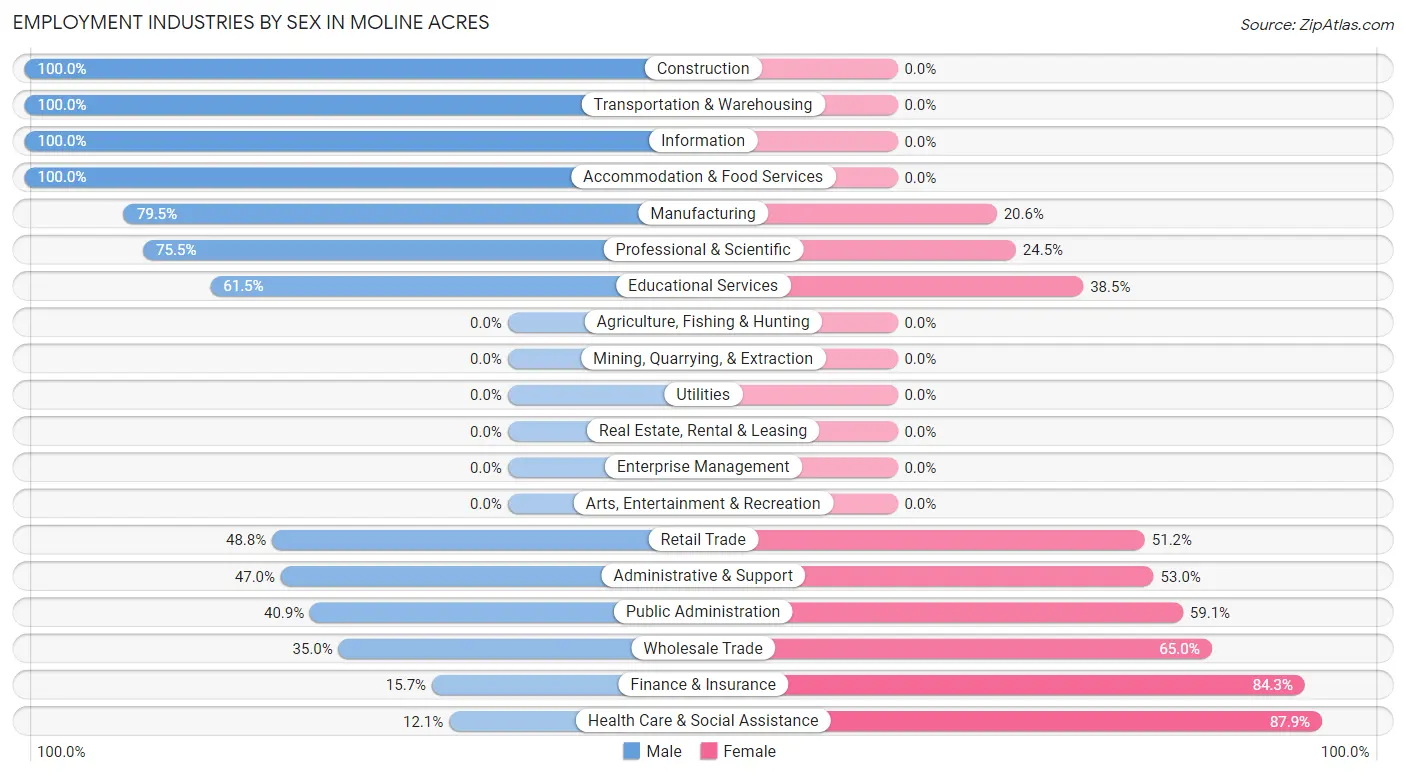
Employment Industries by Sex in Moline Acres
The Moline Acres industries that see more men than women are Construction (100.0%), Transportation & Warehousing (100.0%), and Information (100.0%), whereas the industries that tend to have a higher number of women are Health Care & Social Assistance (87.9%), Finance & Insurance (84.3%), and Wholesale Trade (65.0%).
| Industry | Male | Female |
| Agriculture, Fishing & Hunting | 0 (0.0%) | 0 (0.0%) |
| Mining, Quarrying, & Extraction | 0 (0.0%) | 0 (0.0%) |
| Construction | 67 (100.0%) | 0 (0.0%) |
| Manufacturing | 58 (79.4%) | 15 (20.5%) |
| Wholesale Trade | 7 (35.0%) | 13 (65.0%) |
| Retail Trade | 60 (48.8%) | 63 (51.2%) |
| Transportation & Warehousing | 26 (100.0%) | 0 (0.0%) |
| Utilities | 0 (0.0%) | 0 (0.0%) |
| Information | 7 (100.0%) | 0 (0.0%) |
| Finance & Insurance | 8 (15.7%) | 43 (84.3%) |
| Real Estate, Rental & Leasing | 0 (0.0%) | 0 (0.0%) |
| Professional & Scientific | 40 (75.5%) | 13 (24.5%) |
| Enterprise Management | 0 (0.0%) | 0 (0.0%) |
| Administrative & Support | 54 (47.0%) | 61 (53.0%) |
| Educational Services | 8 (61.5%) | 5 (38.5%) |
| Health Care & Social Assistance | 34 (12.1%) | 246 (87.9%) |
| Arts, Entertainment & Recreation | 0 (0.0%) | 0 (0.0%) |
| Accommodation & Food Services | 24 (100.0%) | 0 (0.0%) |
| Public Administration | 9 (40.9%) | 13 (59.1%) |
| Total | 425 (45.7%) | 506 (54.3%) |
Education in Moline Acres
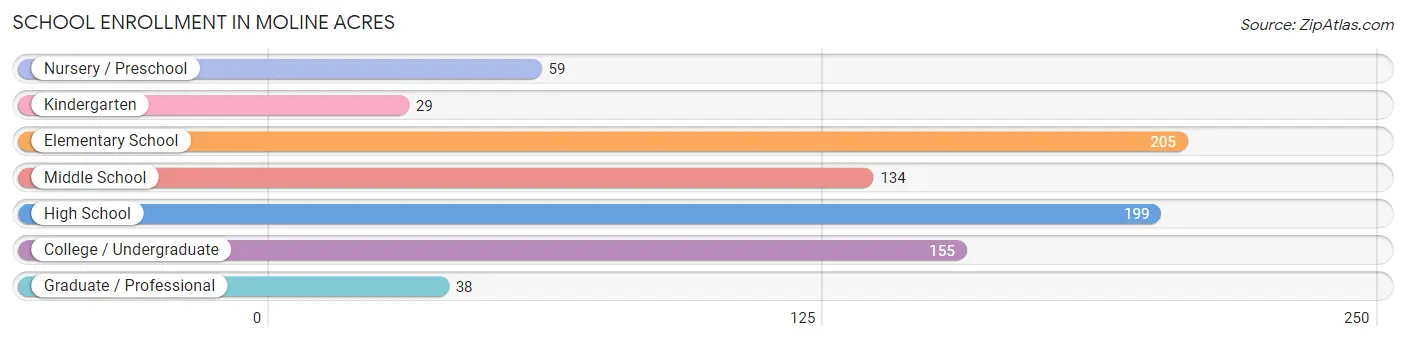
School Enrollment in Moline Acres
The most common levels of schooling among the 819 students in Moline Acres are elementary school (205 | 25.0%), high school (199 | 24.3%), and college / undergraduate (155 | 18.9%).
| School Level | # Students | % Students |
| Nursery / Preschool | 59 | 7.2% |
| Kindergarten | 29 | 3.5% |
| Elementary School | 205 | 25.0% |
| Middle School | 134 | 16.4% |
| High School | 199 | 24.3% |
| College / Undergraduate | 155 | 18.9% |
| Graduate / Professional | 38 | 4.6% |
| Total | 819 | 100.0% |
School Enrollment by Age by Funding Source in Moline Acres
Out of a total of 819 students who are enrolled in schools in Moline Acres, 83 (10.1%) attend a private institution, while the remaining 736 (89.9%) are enrolled in public schools. The age group of 20 to 24 year olds has the highest likelihood of being enrolled in private schools, with 8 (100.0% in the age bracket) enrolled. Conversely, the age group of 3 to 4 year olds has the lowest likelihood of being enrolled in a private school, with 40 (100.0% in the age bracket) attending a public institution.
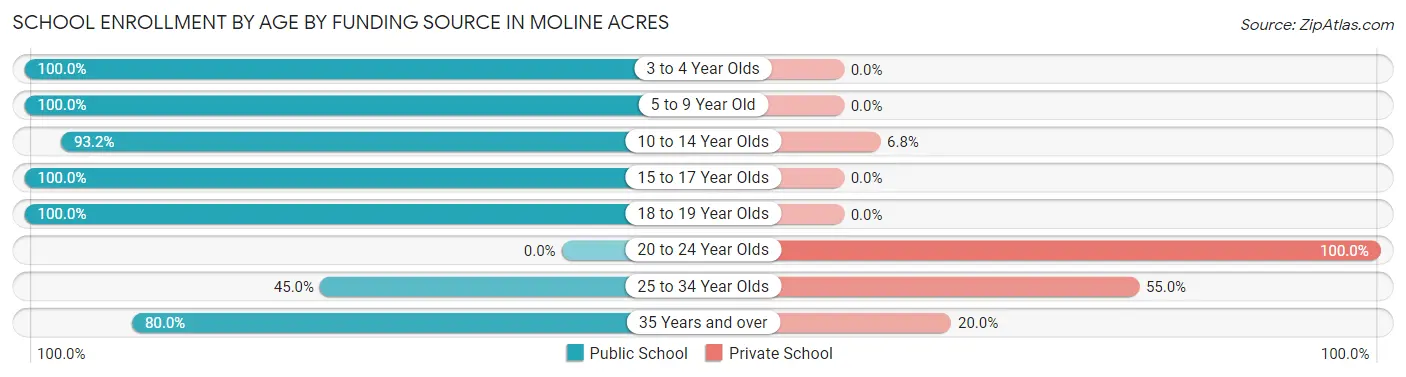
| Age Bracket | Public School | Private School |
| 3 to 4 Year Olds | 40 (100.0%) | 0 (0.0%) |
| 5 to 9 Year Old | 145 (100.0%) | 0 (0.0%) |
| 10 to 14 Year Olds | 247 (93.2%) | 18 (6.8%) |
| 15 to 17 Year Olds | 125 (100.0%) | 0 (0.0%) |
| 18 to 19 Year Olds | 91 (100.0%) | 0 (0.0%) |
| 20 to 24 Year Olds | 0 (0.0%) | 8 (100.0%) |
| 25 to 34 Year Olds | 36 (45.0%) | 44 (55.0%) |
| 35 Years and over | 52 (80.0%) | 13 (20.0%) |
| Total | 736 (89.9%) | 83 (10.1%) |
Educational Attainment by Field of Study in Moline Acres
Arts & humanities (74 | 28.0%), business (55 | 20.8%), computers & mathematics (40 | 15.1%), science & technology (39 | 14.8%), and communications (23 | 8.7%) are the most common fields of study among 264 individuals in Moline Acres who have obtained a bachelor's degree or higher.
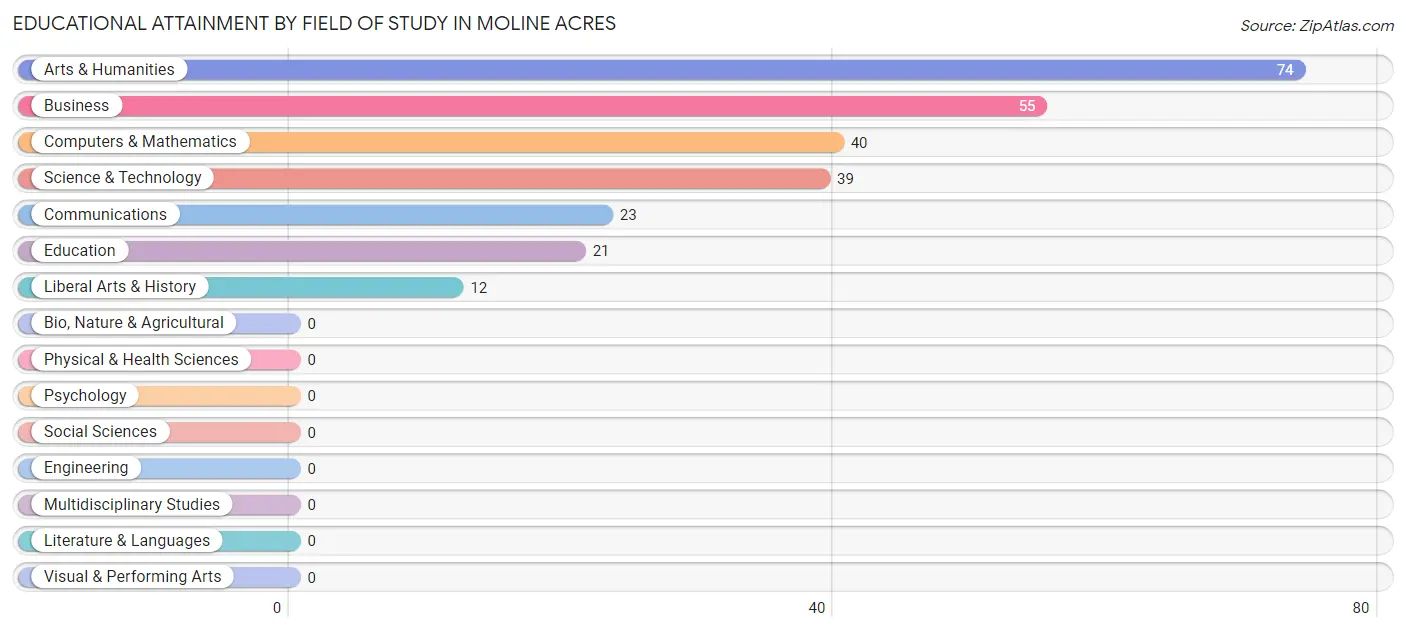
| Field of Study | # Graduates | % Graduates |
| Computers & Mathematics | 40 | 15.1% |
| Bio, Nature & Agricultural | 0 | 0.0% |
| Physical & Health Sciences | 0 | 0.0% |
| Psychology | 0 | 0.0% |
| Social Sciences | 0 | 0.0% |
| Engineering | 0 | 0.0% |
| Multidisciplinary Studies | 0 | 0.0% |
| Science & Technology | 39 | 14.8% |
| Business | 55 | 20.8% |
| Education | 21 | 8.0% |
| Literature & Languages | 0 | 0.0% |
| Liberal Arts & History | 12 | 4.5% |
| Visual & Performing Arts | 0 | 0.0% |
| Communications | 23 | 8.7% |
| Arts & Humanities | 74 | 28.0% |
| Total | 264 | 100.0% |
Transportation & Commute in Moline Acres
Vehicle Availability by Sex in Moline Acres
The most prevalent vehicle ownership categories in Moline Acres are males with 2 vehicles (184, accounting for 41.3%) and females with 2 vehicles (113, making up 36.8%).
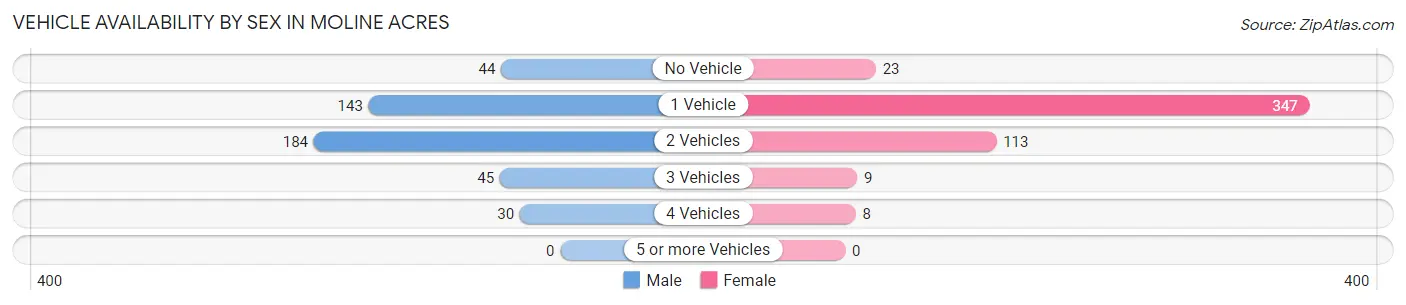
| Vehicles Available | Male | Female |
| No Vehicle | 44 (9.9%) | 23 (4.6%) |
| 1 Vehicle | 143 (32.1%) | 347 (69.4%) |
| 2 Vehicles | 184 (41.3%) | 113 (22.6%) |
| 3 Vehicles | 45 (10.1%) | 9 (1.8%) |
| 4 Vehicles | 30 (6.7%) | 8 (1.6%) |
| 5 or more Vehicles | 0 (0.0%) | 0 (0.0%) |
| Total | 446 (100.0%) | 500 (100.0%) |
Commute Time in Moline Acres
The most frequently occuring commute durations in Moline Acres are 15 to 19 minutes (131 commuters, 17.2%), 10 to 14 minutes (127 commuters, 16.6%), and 30 to 34 minutes (97 commuters, 12.7%).
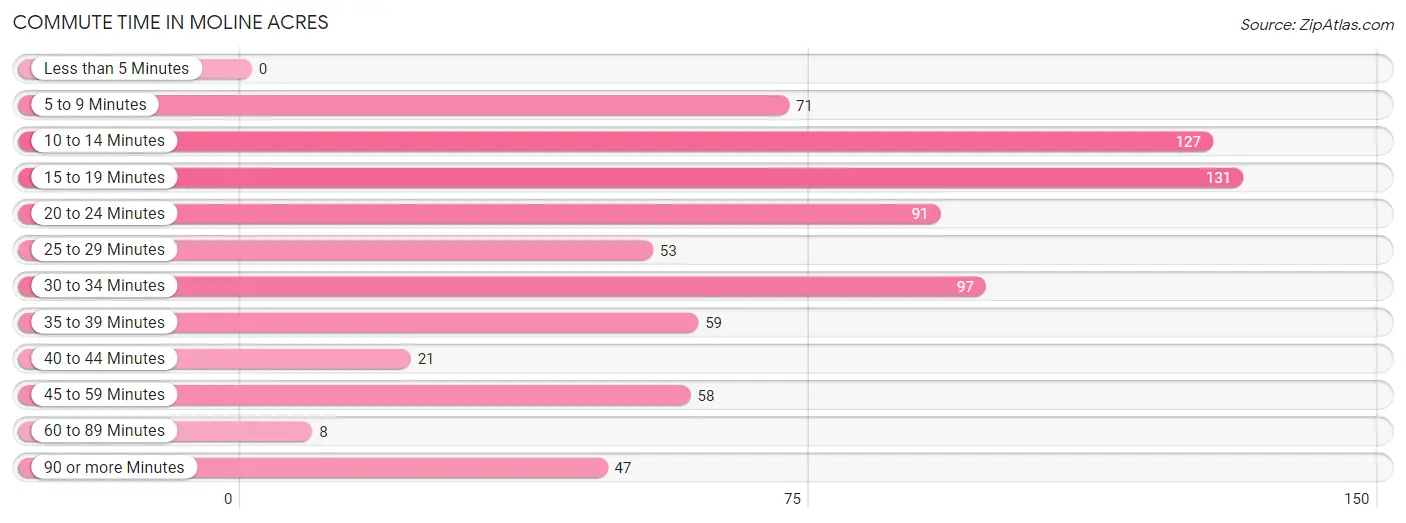
| Commute Time | # Commuters | % Commuters |
| Less than 5 Minutes | 0 | 0.0% |
| 5 to 9 Minutes | 71 | 9.3% |
| 10 to 14 Minutes | 127 | 16.6% |
| 15 to 19 Minutes | 131 | 17.2% |
| 20 to 24 Minutes | 91 | 11.9% |
| 25 to 29 Minutes | 53 | 7.0% |
| 30 to 34 Minutes | 97 | 12.7% |
| 35 to 39 Minutes | 59 | 7.7% |
| 40 to 44 Minutes | 21 | 2.8% |
| 45 to 59 Minutes | 58 | 7.6% |
| 60 to 89 Minutes | 8 | 1.1% |
| 90 or more Minutes | 47 | 6.2% |
Commute Time by Sex in Moline Acres
The most common commute times in Moline Acres are 20 to 24 minutes (80 commuters, 22.9%) for males and 15 to 19 minutes (94 commuters, 22.7%) for females.
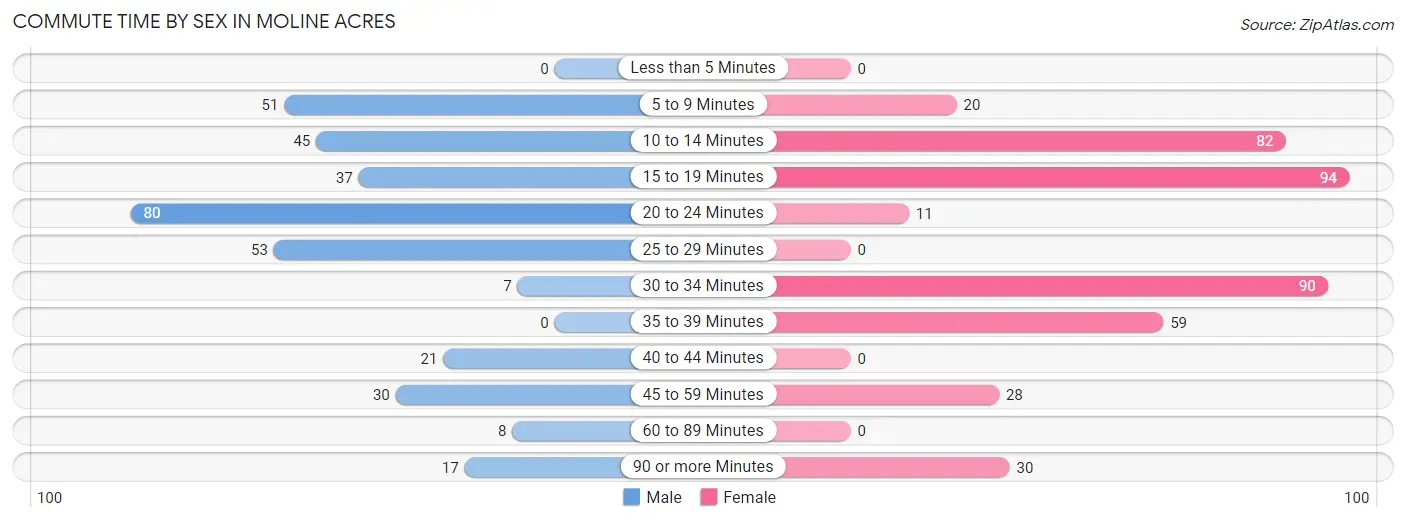
| Commute Time | Male | Female |
| Less than 5 Minutes | 0 (0.0%) | 0 (0.0%) |
| 5 to 9 Minutes | 51 (14.6%) | 20 (4.8%) |
| 10 to 14 Minutes | 45 (12.9%) | 82 (19.8%) |
| 15 to 19 Minutes | 37 (10.6%) | 94 (22.7%) |
| 20 to 24 Minutes | 80 (22.9%) | 11 (2.7%) |
| 25 to 29 Minutes | 53 (15.2%) | 0 (0.0%) |
| 30 to 34 Minutes | 7 (2.0%) | 90 (21.7%) |
| 35 to 39 Minutes | 0 (0.0%) | 59 (14.2%) |
| 40 to 44 Minutes | 21 (6.0%) | 0 (0.0%) |
| 45 to 59 Minutes | 30 (8.6%) | 28 (6.8%) |
| 60 to 89 Minutes | 8 (2.3%) | 0 (0.0%) |
| 90 or more Minutes | 17 (4.9%) | 30 (7.2%) |
Time of Departure to Work by Sex in Moline Acres
The most frequent times of departure to work in Moline Acres are 12:00 PM to 3:59 PM (118, 33.8%) for males and 12:00 PM to 3:59 PM (99, 23.9%) for females.
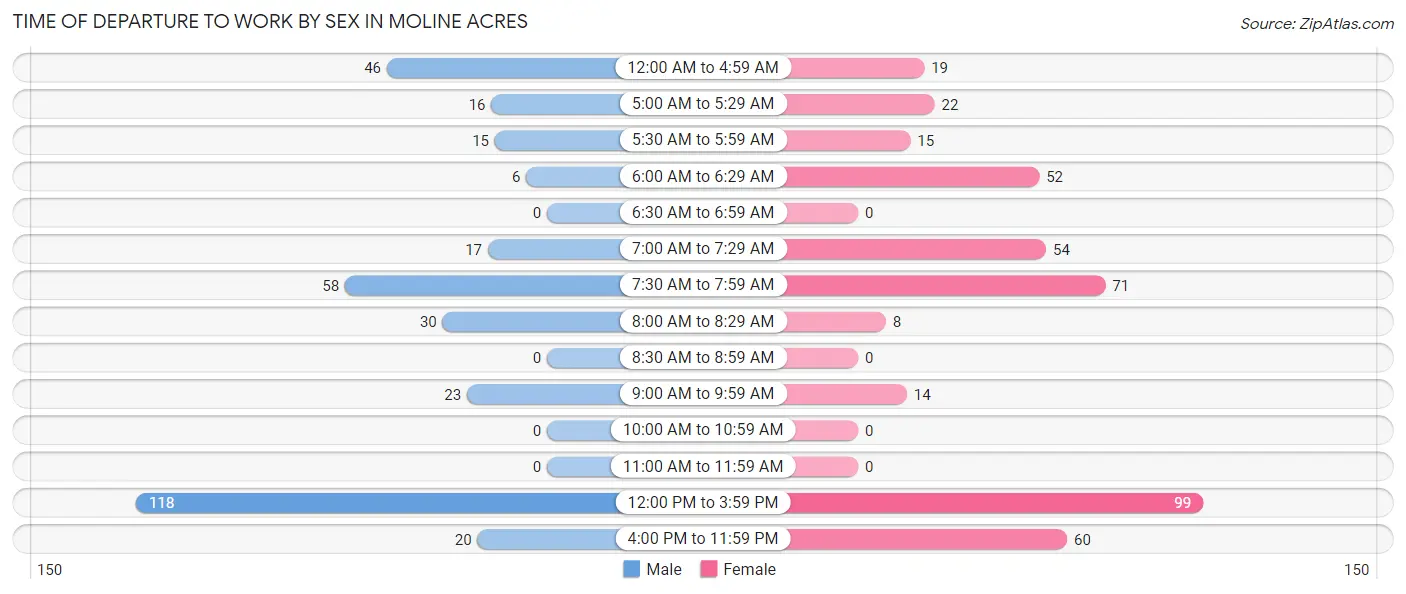
| Time of Departure | Male | Female |
| 12:00 AM to 4:59 AM | 46 (13.2%) | 19 (4.6%) |
| 5:00 AM to 5:29 AM | 16 (4.6%) | 22 (5.3%) |
| 5:30 AM to 5:59 AM | 15 (4.3%) | 15 (3.6%) |
| 6:00 AM to 6:29 AM | 6 (1.7%) | 52 (12.6%) |
| 6:30 AM to 6:59 AM | 0 (0.0%) | 0 (0.0%) |
| 7:00 AM to 7:29 AM | 17 (4.9%) | 54 (13.0%) |
| 7:30 AM to 7:59 AM | 58 (16.6%) | 71 (17.2%) |
| 8:00 AM to 8:29 AM | 30 (8.6%) | 8 (1.9%) |
| 8:30 AM to 8:59 AM | 0 (0.0%) | 0 (0.0%) |
| 9:00 AM to 9:59 AM | 23 (6.6%) | 14 (3.4%) |
| 10:00 AM to 10:59 AM | 0 (0.0%) | 0 (0.0%) |
| 11:00 AM to 11:59 AM | 0 (0.0%) | 0 (0.0%) |
| 12:00 PM to 3:59 PM | 118 (33.8%) | 99 (23.9%) |
| 4:00 PM to 11:59 PM | 20 (5.7%) | 60 (14.5%) |
| Total | 349 (100.0%) | 414 (100.0%) |
Housing Occupancy in Moline Acres
Occupancy by Ownership in Moline Acres
Of the total 1,171 dwellings in Moline Acres, owner-occupied units account for 630 (53.8%), while renter-occupied units make up 541 (46.2%).
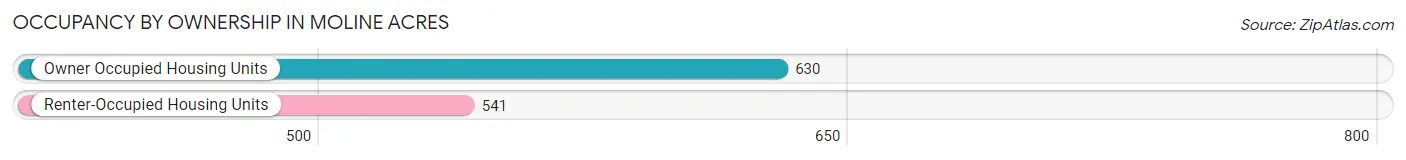
| Occupancy | # Housing Units | % Housing Units |
| Owner Occupied Housing Units | 630 | 53.8% |
| Renter-Occupied Housing Units | 541 | 46.2% |
| Total Occupied Housing Units | 1,171 | 100.0% |
Occupancy by Household Size in Moline Acres
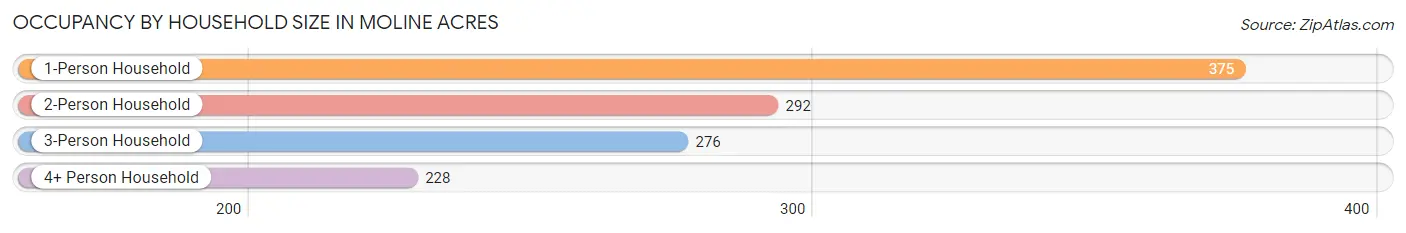
| Household Size | # Housing Units | % Housing Units |
| 1-Person Household | 375 | 32.0% |
| 2-Person Household | 292 | 24.9% |
| 3-Person Household | 276 | 23.6% |
| 4+ Person Household | 228 | 19.5% |
| Total Housing Units | 1,171 | 100.0% |
Occupancy by Ownership by Household Size in Moline Acres
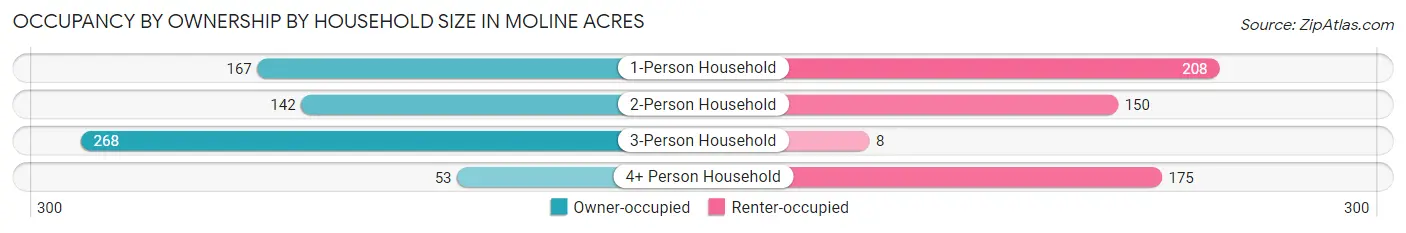
| Household Size | Owner-occupied | Renter-occupied |
| 1-Person Household | 167 (44.5%) | 208 (55.5%) |
| 2-Person Household | 142 (48.6%) | 150 (51.4%) |
| 3-Person Household | 268 (97.1%) | 8 (2.9%) |
| 4+ Person Household | 53 (23.3%) | 175 (76.7%) |
| Total Housing Units | 630 (53.8%) | 541 (46.2%) |
Occupancy by Educational Attainment in Moline Acres
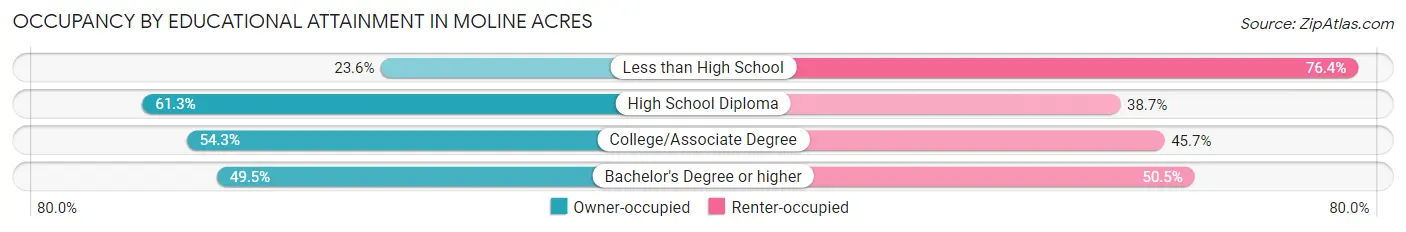
| Household Size | Owner-occupied | Renter-occupied |
| Less than High School | 25 (23.6%) | 81 (76.4%) |
| High School Diploma | 317 (61.3%) | 200 (38.7%) |
| College/Associate Degree | 189 (54.3%) | 159 (45.7%) |
| Bachelor's Degree or higher | 99 (49.5%) | 101 (50.5%) |
Occupancy by Age of Householder in Moline Acres
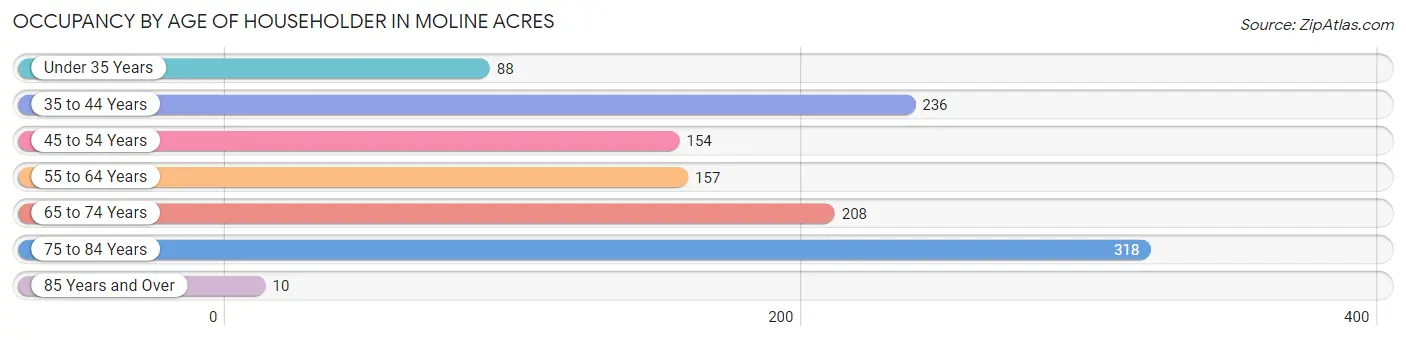
| Age Bracket | # Households | % Households |
| Under 35 Years | 88 | 7.5% |
| 35 to 44 Years | 236 | 20.2% |
| 45 to 54 Years | 154 | 13.2% |
| 55 to 64 Years | 157 | 13.4% |
| 65 to 74 Years | 208 | 17.8% |
| 75 to 84 Years | 318 | 27.2% |
| 85 Years and Over | 10 | 0.9% |
| Total | 1,171 | 100.0% |
Housing Finances in Moline Acres
Median Income by Occupancy in Moline Acres
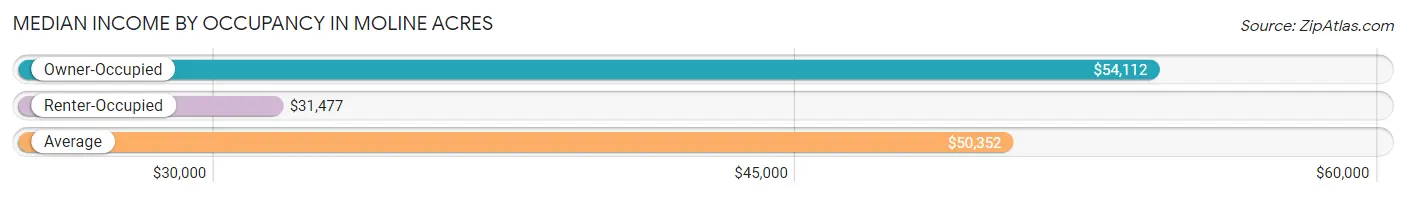
| Occupancy Type | # Households | Median Income |
| Owner-Occupied | 630 (53.8%) | $54,112 |
| Renter-Occupied | 541 (46.2%) | $31,477 |
| Average | 1,171 (100.0%) | $50,352 |
Occupancy by Householder Income Bracket in Moline Acres
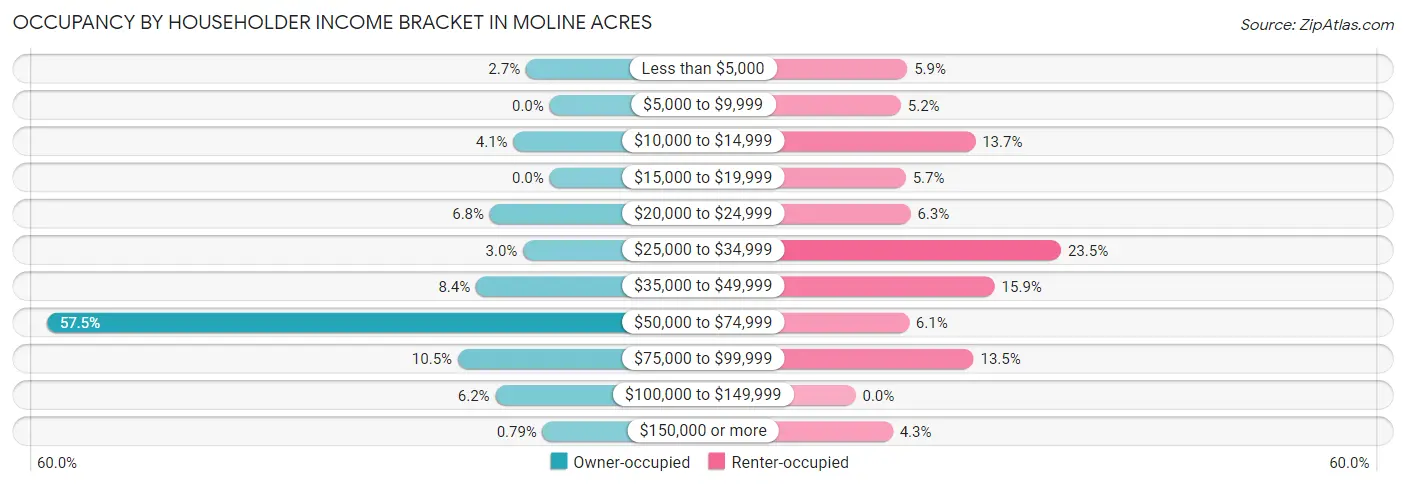
| Income Bracket | Owner-occupied | Renter-occupied |
| Less than $5,000 | 17 (2.7%) | 32 (5.9%) |
| $5,000 to $9,999 | 0 (0.0%) | 28 (5.2%) |
| $10,000 to $14,999 | 26 (4.1%) | 74 (13.7%) |
| $15,000 to $19,999 | 0 (0.0%) | 31 (5.7%) |
| $20,000 to $24,999 | 43 (6.8%) | 34 (6.3%) |
| $25,000 to $34,999 | 19 (3.0%) | 127 (23.5%) |
| $35,000 to $49,999 | 53 (8.4%) | 86 (15.9%) |
| $50,000 to $74,999 | 362 (57.5%) | 33 (6.1%) |
| $75,000 to $99,999 | 66 (10.5%) | 73 (13.5%) |
| $100,000 to $149,999 | 39 (6.2%) | 0 (0.0%) |
| $150,000 or more | 5 (0.8%) | 23 (4.3%) |
| Total | 630 (100.0%) | 541 (100.0%) |
Monthly Housing Cost Tiers in Moline Acres
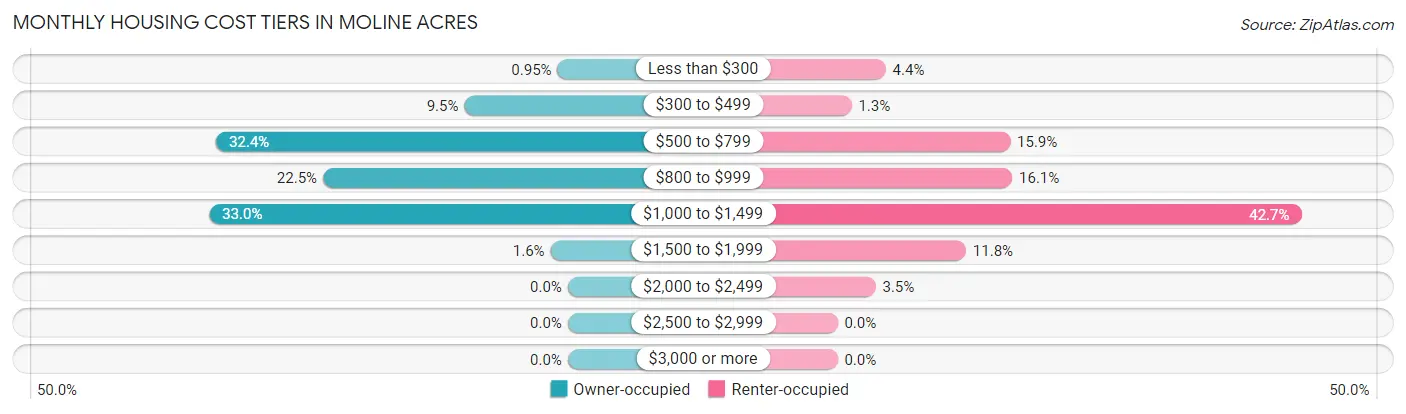
| Monthly Cost | Owner-occupied | Renter-occupied |
| Less than $300 | 6 (0.9%) | 24 (4.4%) |
| $300 to $499 | 60 (9.5%) | 7 (1.3%) |
| $500 to $799 | 204 (32.4%) | 86 (15.9%) |
| $800 to $999 | 142 (22.5%) | 87 (16.1%) |
| $1,000 to $1,499 | 208 (33.0%) | 231 (42.7%) |
| $1,500 to $1,999 | 10 (1.6%) | 64 (11.8%) |
| $2,000 to $2,499 | 0 (0.0%) | 19 (3.5%) |
| $2,500 to $2,999 | 0 (0.0%) | 0 (0.0%) |
| $3,000 or more | 0 (0.0%) | 0 (0.0%) |
| Total | 630 (100.0%) | 541 (100.0%) |
Physical Housing Characteristics in Moline Acres
Housing Structures in Moline Acres
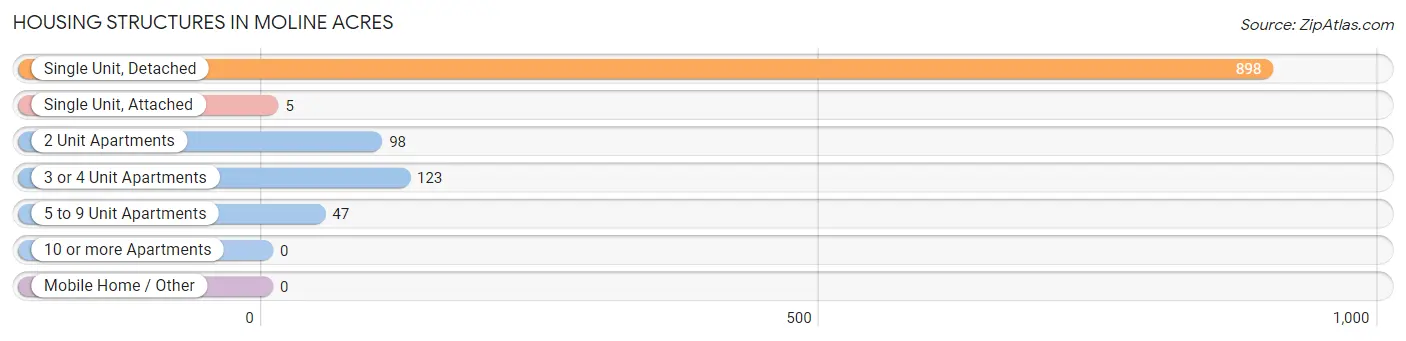
| Structure Type | # Housing Units | % Housing Units |
| Single Unit, Detached | 898 | 76.7% |
| Single Unit, Attached | 5 | 0.4% |
| 2 Unit Apartments | 98 | 8.4% |
| 3 or 4 Unit Apartments | 123 | 10.5% |
| 5 to 9 Unit Apartments | 47 | 4.0% |
| 10 or more Apartments | 0 | 0.0% |
| Mobile Home / Other | 0 | 0.0% |
| Total | 1,171 | 100.0% |
Housing Structures by Occupancy in Moline Acres
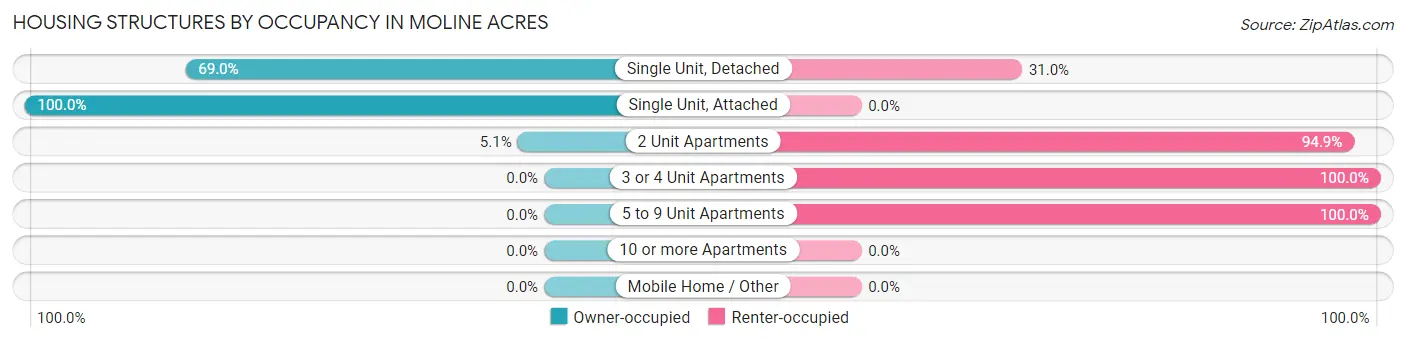
| Structure Type | Owner-occupied | Renter-occupied |
| Single Unit, Detached | 620 (69.0%) | 278 (31.0%) |
| Single Unit, Attached | 5 (100.0%) | 0 (0.0%) |
| 2 Unit Apartments | 5 (5.1%) | 93 (94.9%) |
| 3 or 4 Unit Apartments | 0 (0.0%) | 123 (100.0%) |
| 5 to 9 Unit Apartments | 0 (0.0%) | 47 (100.0%) |
| 10 or more Apartments | 0 (0.0%) | 0 (0.0%) |
| Mobile Home / Other | 0 (0.0%) | 0 (0.0%) |
| Total | 630 (53.8%) | 541 (46.2%) |
Housing Structures by Number of Rooms in Moline Acres
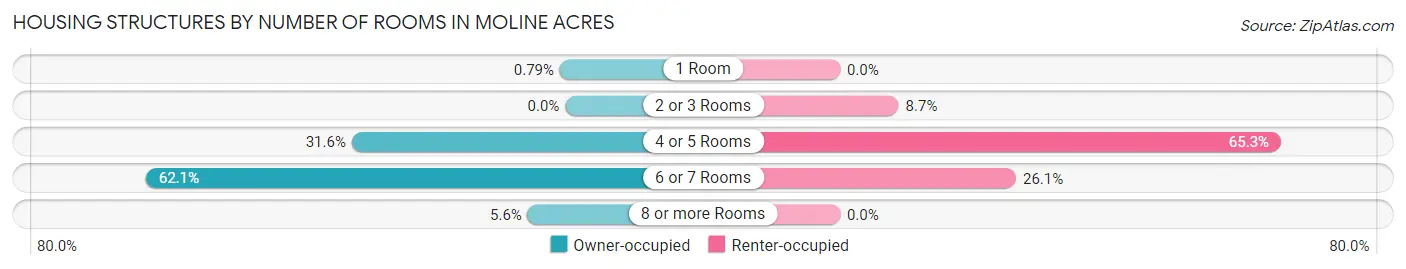
| Number of Rooms | Owner-occupied | Renter-occupied |
| 1 Room | 5 (0.8%) | 0 (0.0%) |
| 2 or 3 Rooms | 0 (0.0%) | 47 (8.7%) |
| 4 or 5 Rooms | 199 (31.6%) | 353 (65.2%) |
| 6 or 7 Rooms | 391 (62.1%) | 141 (26.1%) |
| 8 or more Rooms | 35 (5.6%) | 0 (0.0%) |
| Total | 630 (100.0%) | 541 (100.0%) |
Housing Structure by Heating Type in Moline Acres
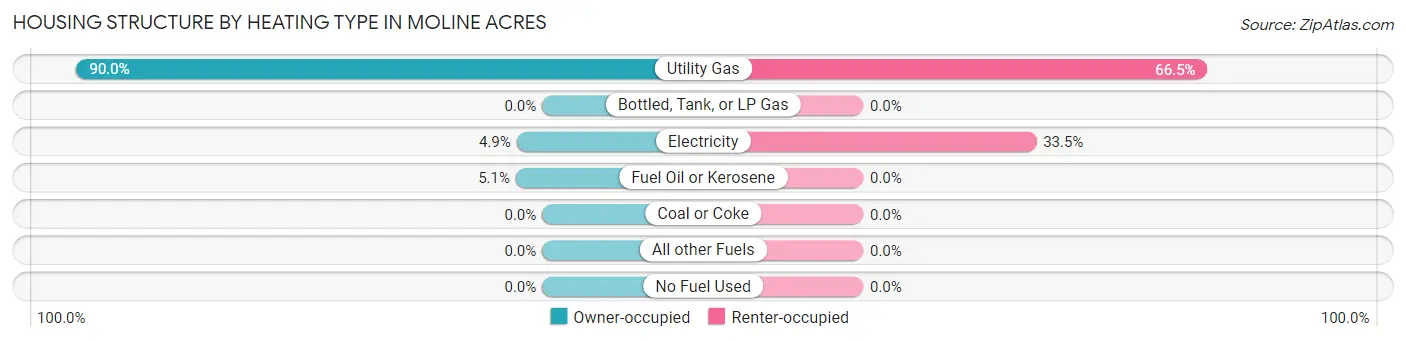
| Heating Type | Owner-occupied | Renter-occupied |
| Utility Gas | 567 (90.0%) | 360 (66.5%) |
| Bottled, Tank, or LP Gas | 0 (0.0%) | 0 (0.0%) |
| Electricity | 31 (4.9%) | 181 (33.5%) |
| Fuel Oil or Kerosene | 32 (5.1%) | 0 (0.0%) |
| Coal or Coke | 0 (0.0%) | 0 (0.0%) |
| All other Fuels | 0 (0.0%) | 0 (0.0%) |
| No Fuel Used | 0 (0.0%) | 0 (0.0%) |
| Total | 630 (100.0%) | 541 (100.0%) |
Household Vehicle Usage in Moline Acres
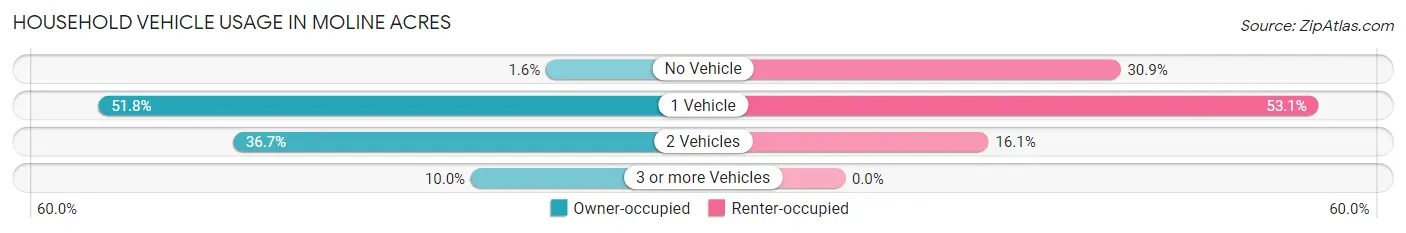
| Vehicles per Household | Owner-occupied | Renter-occupied |
| No Vehicle | 10 (1.6%) | 167 (30.9%) |
| 1 Vehicle | 326 (51.7%) | 287 (53.0%) |
| 2 Vehicles | 231 (36.7%) | 87 (16.1%) |
| 3 or more Vehicles | 63 (10.0%) | 0 (0.0%) |
| Total | 630 (100.0%) | 541 (100.0%) |
Real Estate & Mortgages in Moline Acres
Real Estate and Mortgage Overview in Moline Acres
| Characteristic | Without Mortgage | With Mortgage |
| Housing Units | 267 | 363 |
| Median Property Value | $84,000 | $67,800 |
| Median Household Income | $60,502 | $5 |
| Monthly Housing Costs | $548 | $0 |
| Real Estate Taxes | $1,692 | $99 |
Property Value by Mortgage Status in Moline Acres
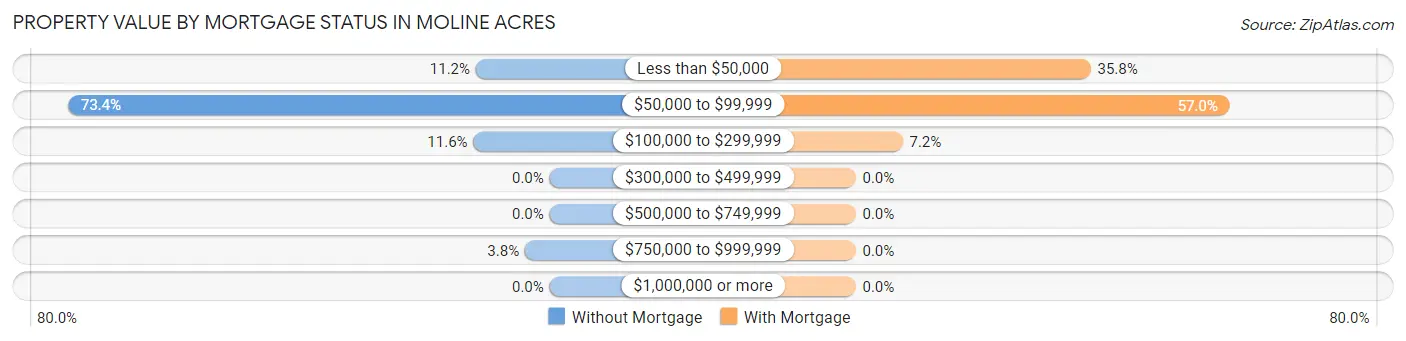
| Property Value | Without Mortgage | With Mortgage |
| Less than $50,000 | 30 (11.2%) | 130 (35.8%) |
| $50,000 to $99,999 | 196 (73.4%) | 207 (57.0%) |
| $100,000 to $299,999 | 31 (11.6%) | 26 (7.2%) |
| $300,000 to $499,999 | 0 (0.0%) | 0 (0.0%) |
| $500,000 to $749,999 | 0 (0.0%) | 0 (0.0%) |
| $750,000 to $999,999 | 10 (3.7%) | 0 (0.0%) |
| $1,000,000 or more | 0 (0.0%) | 0 (0.0%) |
| Total | 267 (100.0%) | 363 (100.0%) |
Household Income by Mortgage Status in Moline Acres
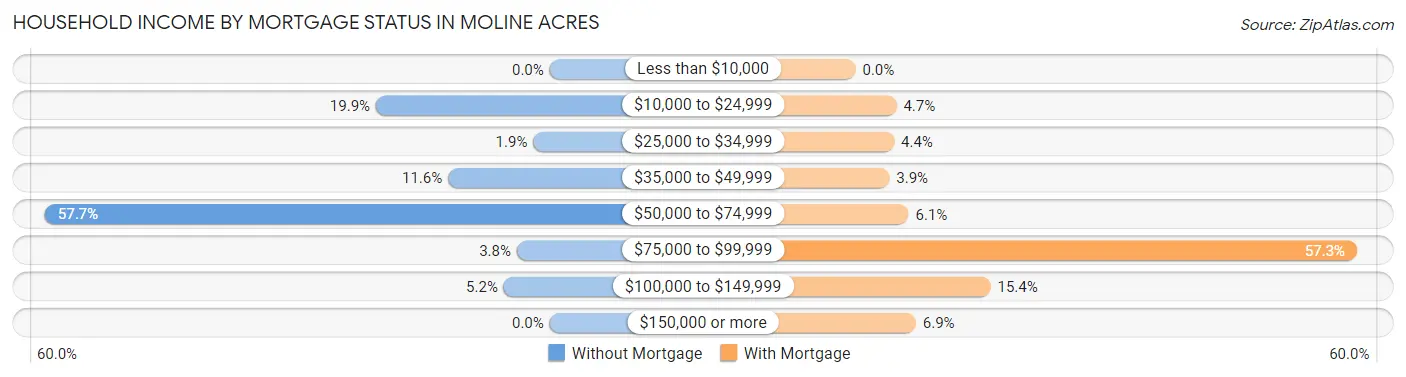
| Household Income | Without Mortgage | With Mortgage |
| Less than $10,000 | 0 (0.0%) | 0 (0.0%) |
| $10,000 to $24,999 | 53 (19.9%) | 17 (4.7%) |
| $25,000 to $34,999 | 5 (1.9%) | 16 (4.4%) |
| $35,000 to $49,999 | 31 (11.6%) | 14 (3.9%) |
| $50,000 to $74,999 | 154 (57.7%) | 22 (6.1%) |
| $75,000 to $99,999 | 10 (3.7%) | 208 (57.3%) |
| $100,000 to $149,999 | 14 (5.2%) | 56 (15.4%) |
| $150,000 or more | 0 (0.0%) | 25 (6.9%) |
| Total | 267 (100.0%) | 363 (100.0%) |
Property Value to Household Income Ratio in Moline Acres
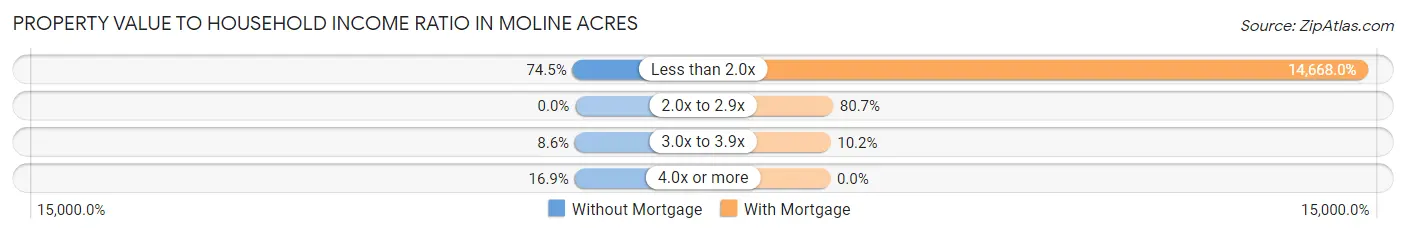
| Value-to-Income Ratio | Without Mortgage | With Mortgage |
| Less than 2.0x | 199 (74.5%) | 53,245 (14,668.0%) |
| 2.0x to 2.9x | 0 (0.0%) | 293 (80.7%) |
| 3.0x to 3.9x | 23 (8.6%) | 37 (10.2%) |
| 4.0x or more | 45 (16.9%) | 0 (0.0%) |
| Total | 267 (100.0%) | 363 (100.0%) |
Real Estate Taxes by Mortgage Status in Moline Acres
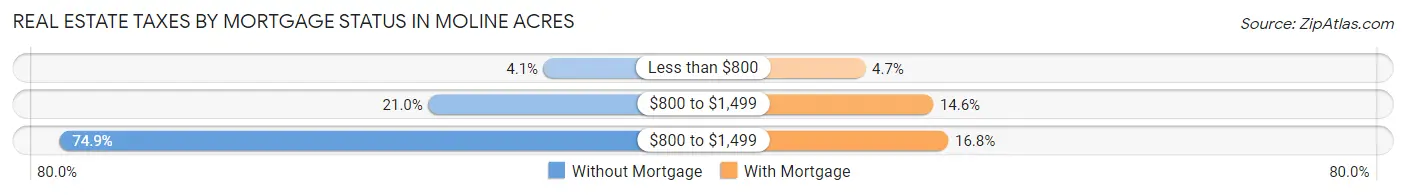
| Property Taxes | Without Mortgage | With Mortgage |
| Less than $800 | 11 (4.1%) | 17 (4.7%) |
| $800 to $1,499 | 56 (21.0%) | 53 (14.6%) |
| $800 to $1,499 | 200 (74.9%) | 61 (16.8%) |
| Total | 267 (100.0%) | 363 (100.0%) |
Health & Disability in Moline Acres
Health Insurance Coverage by Age in Moline Acres
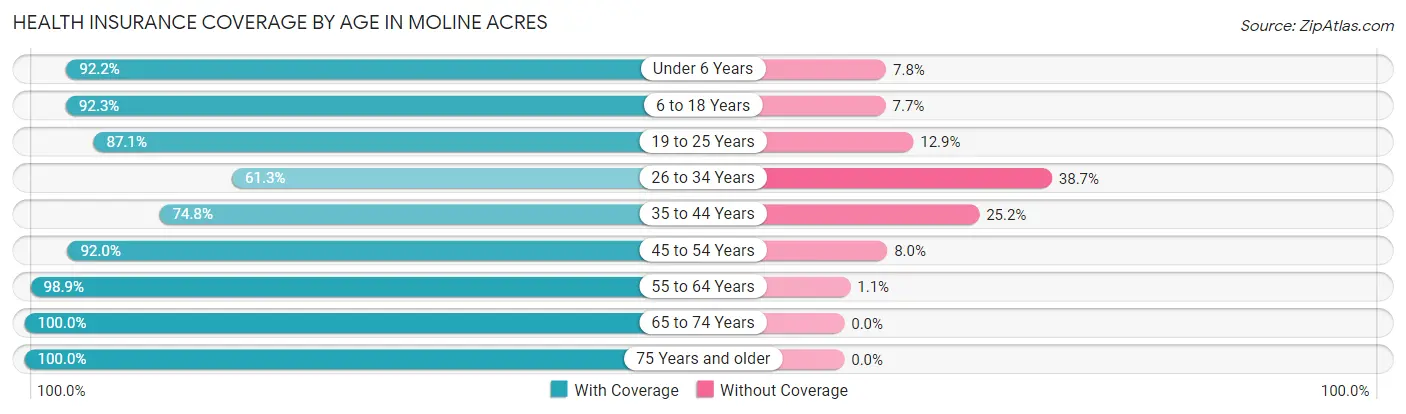
| Age Bracket | With Coverage | Without Coverage |
| Under 6 Years | 201 (92.2%) | 17 (7.8%) |
| 6 to 18 Years | 491 (92.3%) | 41 (7.7%) |
| 19 to 25 Years | 176 (87.1%) | 26 (12.9%) |
| 26 to 34 Years | 190 (61.3%) | 120 (38.7%) |
| 35 to 44 Years | 229 (74.8%) | 77 (25.2%) |
| 45 to 54 Years | 207 (92.0%) | 18 (8.0%) |
| 55 to 64 Years | 350 (98.9%) | 4 (1.1%) |
| 65 to 74 Years | 253 (100.0%) | 0 (0.0%) |
| 75 Years and older | 394 (100.0%) | 0 (0.0%) |
| Total | 2,491 (89.2%) | 303 (10.8%) |
Health Insurance Coverage by Citizenship Status in Moline Acres
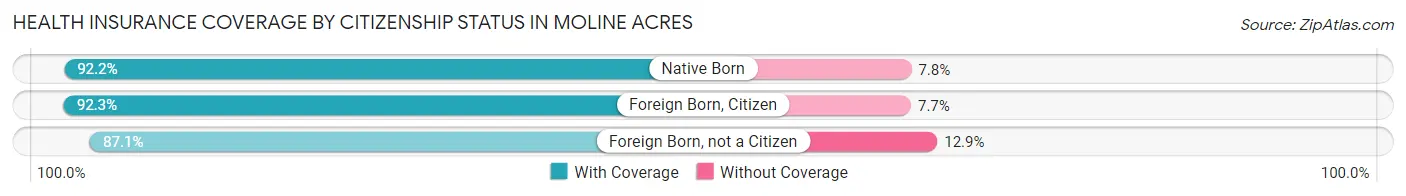
| Citizenship Status | With Coverage | Without Coverage |
| Native Born | 201 (92.2%) | 17 (7.8%) |
| Foreign Born, Citizen | 491 (92.3%) | 41 (7.7%) |
| Foreign Born, not a Citizen | 176 (87.1%) | 26 (12.9%) |
Health Insurance Coverage by Household Income in Moline Acres
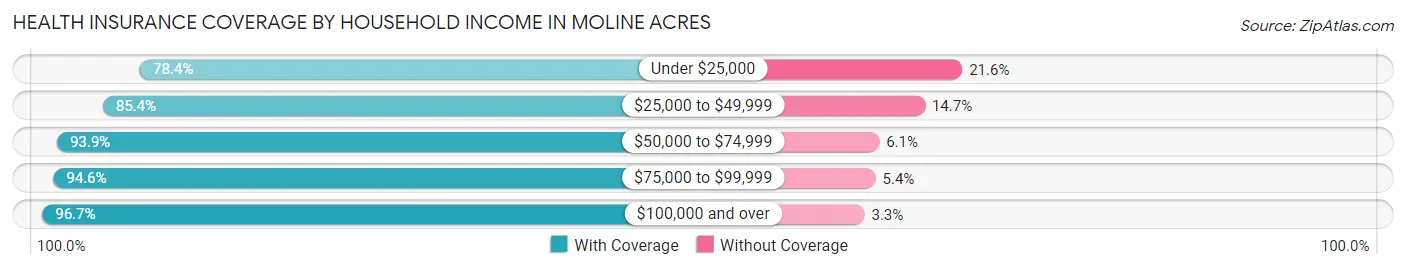
| Household Income | With Coverage | Without Coverage |
| Under $25,000 | 482 (78.4%) | 133 (21.6%) |
| $25,000 to $49,999 | 472 (85.4%) | 81 (14.6%) |
| $50,000 to $74,999 | 866 (93.9%) | 56 (6.1%) |
| $75,000 to $99,999 | 438 (94.6%) | 25 (5.4%) |
| $100,000 and over | 233 (96.7%) | 8 (3.3%) |
Public vs Private Health Insurance Coverage by Age in Moline Acres
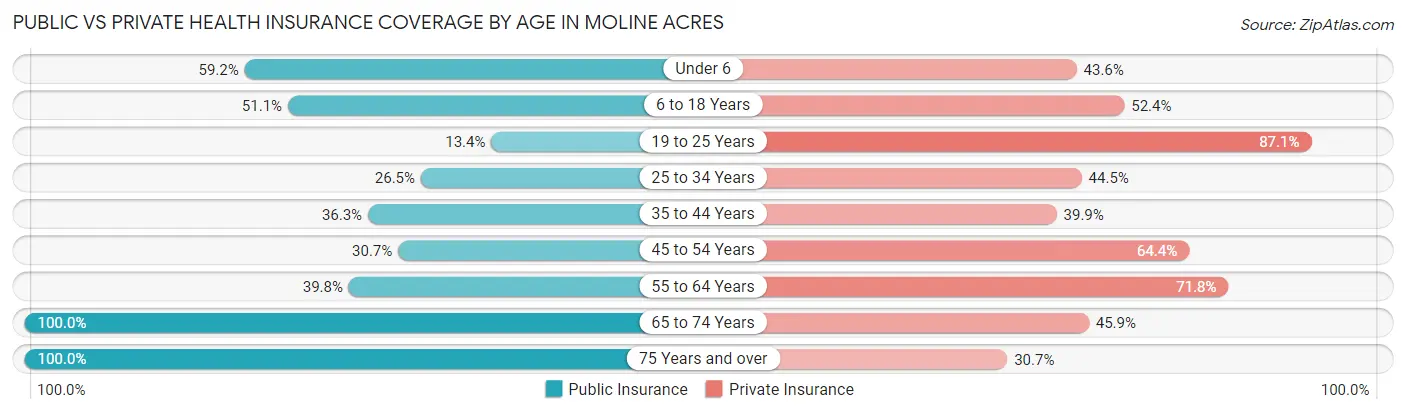
| Age Bracket | Public Insurance | Private Insurance |
| Under 6 | 129 (59.2%) | 95 (43.6%) |
| 6 to 18 Years | 272 (51.1%) | 279 (52.4%) |
| 19 to 25 Years | 27 (13.4%) | 176 (87.1%) |
| 25 to 34 Years | 82 (26.5%) | 138 (44.5%) |
| 35 to 44 Years | 111 (36.3%) | 122 (39.9%) |
| 45 to 54 Years | 69 (30.7%) | 145 (64.4%) |
| 55 to 64 Years | 141 (39.8%) | 254 (71.8%) |
| 65 to 74 Years | 253 (100.0%) | 116 (45.9%) |
| 75 Years and over | 394 (100.0%) | 121 (30.7%) |
| Total | 1,478 (52.9%) | 1,446 (51.7%) |
Disability Status by Sex by Age in Moline Acres
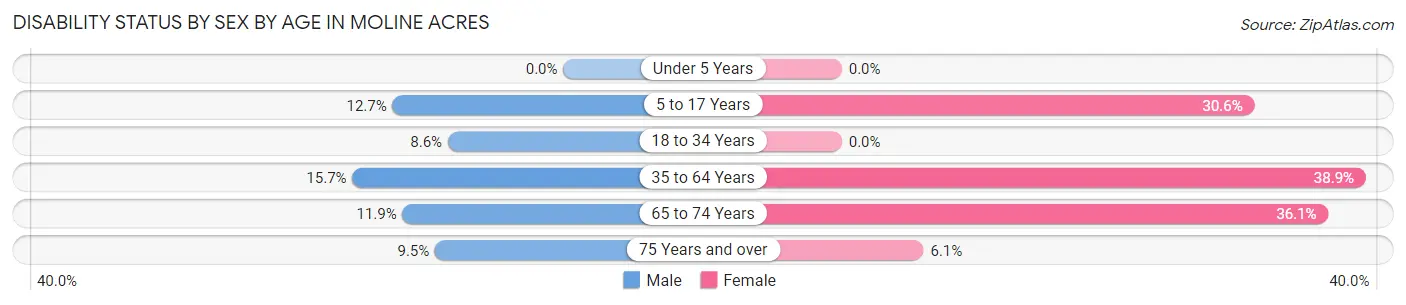
| Age Bracket | Male | Female |
| Under 5 Years | 0 (0.0%) | 0 (0.0%) |
| 5 to 17 Years | 27 (12.7%) | 110 (30.6%) |
| 18 to 34 Years | 30 (8.6%) | 0 (0.0%) |
| 35 to 64 Years | 44 (15.7%) | 235 (38.9%) |
| 65 to 74 Years | 16 (11.9%) | 43 (36.1%) |
| 75 Years and over | 14 (9.5%) | 15 (6.1%) |
Disability Class by Sex by Age in Moline Acres
Disability Class: Hearing Difficulty
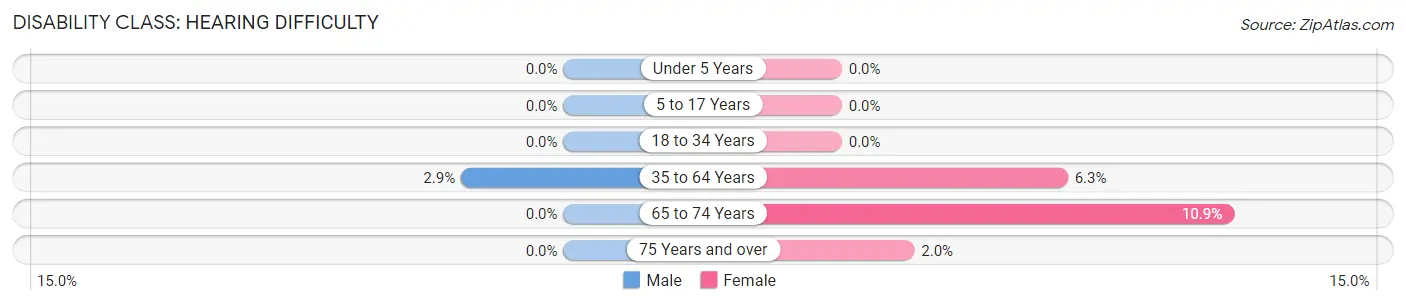
| Age Bracket | Male | Female |
| Under 5 Years | 0 (0.0%) | 0 (0.0%) |
| 5 to 17 Years | 0 (0.0%) | 0 (0.0%) |
| 18 to 34 Years | 0 (0.0%) | 0 (0.0%) |
| 35 to 64 Years | 8 (2.9%) | 38 (6.3%) |
| 65 to 74 Years | 0 (0.0%) | 13 (10.9%) |
| 75 Years and over | 0 (0.0%) | 5 (2.0%) |
Disability Class: Vision Difficulty
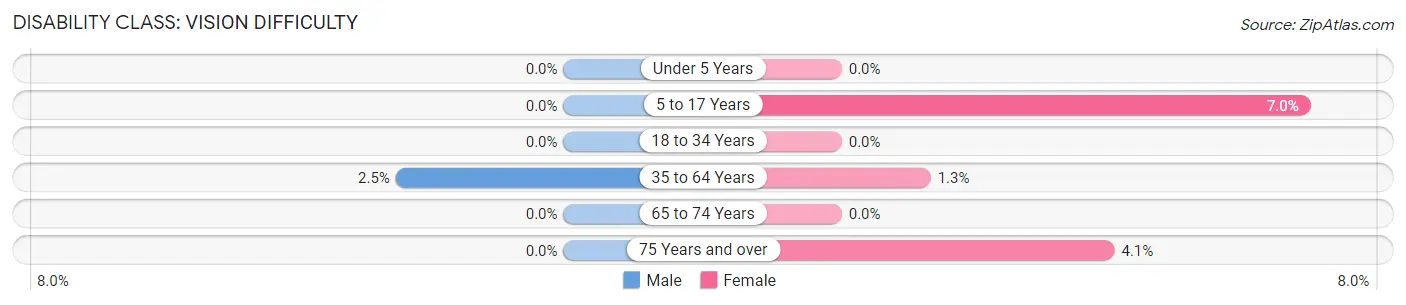
| Age Bracket | Male | Female |
| Under 5 Years | 0 (0.0%) | 0 (0.0%) |
| 5 to 17 Years | 0 (0.0%) | 25 (7.0%) |
| 18 to 34 Years | 0 (0.0%) | 0 (0.0%) |
| 35 to 64 Years | 7 (2.5%) | 8 (1.3%) |
| 65 to 74 Years | 0 (0.0%) | 0 (0.0%) |
| 75 Years and over | 0 (0.0%) | 10 (4.1%) |
Disability Class: Cognitive Difficulty
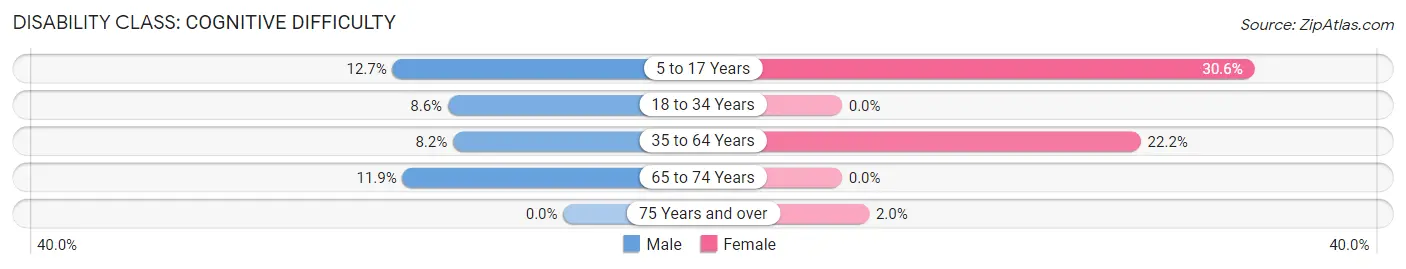
| Age Bracket | Male | Female |
| 5 to 17 Years | 27 (12.7%) | 110 (30.6%) |
| 18 to 34 Years | 30 (8.6%) | 0 (0.0%) |
| 35 to 64 Years | 23 (8.2%) | 134 (22.2%) |
| 65 to 74 Years | 16 (11.9%) | 0 (0.0%) |
| 75 Years and over | 0 (0.0%) | 5 (2.0%) |
Disability Class: Ambulatory Difficulty
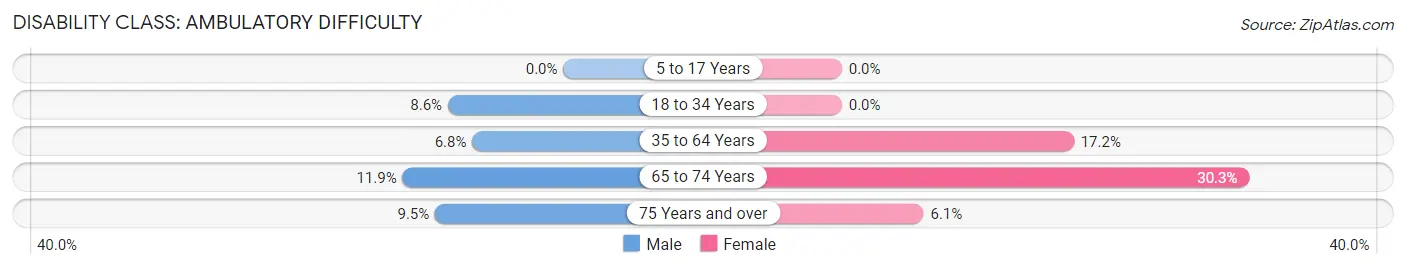
| Age Bracket | Male | Female |
| 5 to 17 Years | 0 (0.0%) | 0 (0.0%) |
| 18 to 34 Years | 30 (8.6%) | 0 (0.0%) |
| 35 to 64 Years | 19 (6.8%) | 104 (17.2%) |
| 65 to 74 Years | 16 (11.9%) | 36 (30.2%) |
| 75 Years and over | 14 (9.5%) | 15 (6.1%) |
Disability Class: Self-Care Difficulty
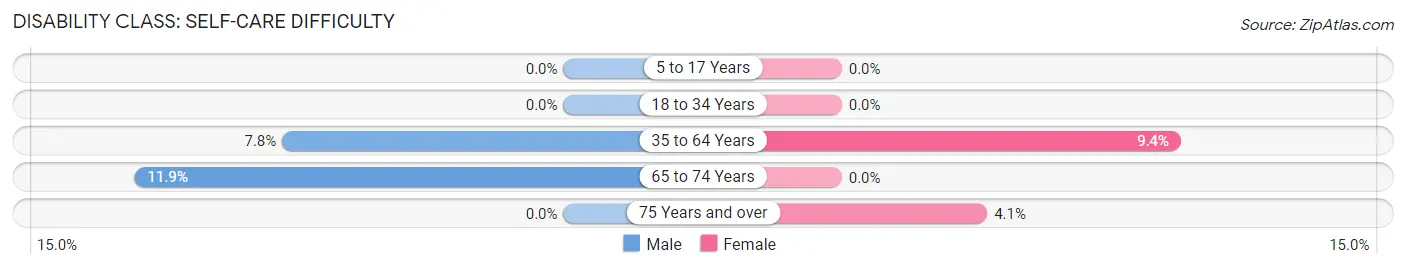
| Age Bracket | Male | Female |
| 5 to 17 Years | 0 (0.0%) | 0 (0.0%) |
| 18 to 34 Years | 0 (0.0%) | 0 (0.0%) |
| 35 to 64 Years | 22 (7.8%) | 57 (9.4%) |
| 65 to 74 Years | 16 (11.9%) | 0 (0.0%) |
| 75 Years and over | 0 (0.0%) | 10 (4.1%) |
Technology Access in Moline Acres
Computing Device Access in Moline Acres
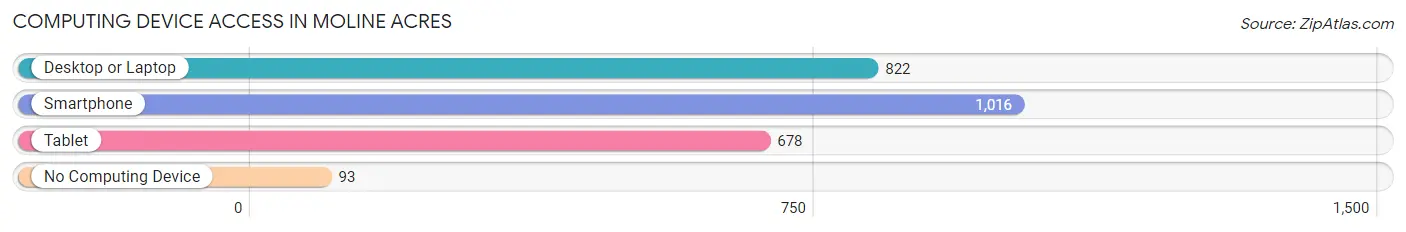
| Device Type | # Households | % Households |
| Desktop or Laptop | 822 | 70.2% |
| Smartphone | 1,016 | 86.8% |
| Tablet | 678 | 57.9% |
| No Computing Device | 93 | 7.9% |
| Total | 1,171 | 100.0% |
Internet Access in Moline Acres
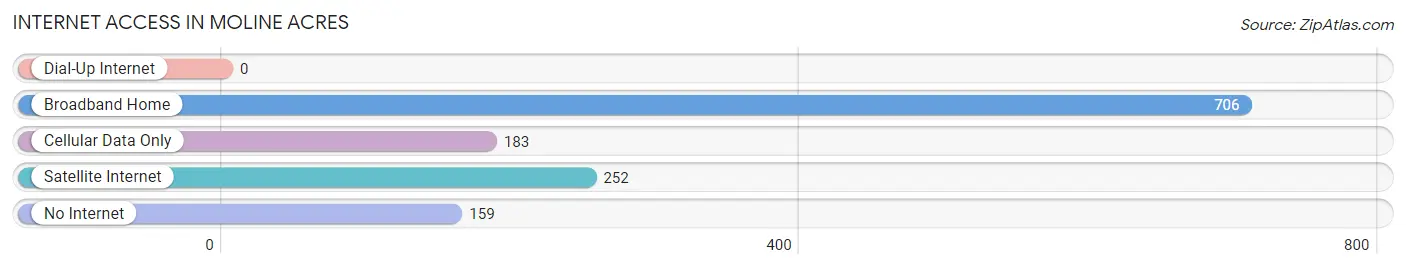
| Internet Type | # Households | % Households |
| Dial-Up Internet | 0 | 0.0% |
| Broadband Home | 706 | 60.3% |
| Cellular Data Only | 183 | 15.6% |
| Satellite Internet | 252 | 21.5% |
| No Internet | 159 | 13.6% |
| Total | 1,171 | 100.0% |
Moline Acres Summary
Moline Acres is a small city located in St. Louis County, Missouri. It is situated just north of the city of St. Louis and is part of the Greater St. Louis metropolitan area. The city was incorporated in 1945 and has a population of approximately 2,500 people.
Geography
Moline Acres is located in the northwest corner of St. Louis County, Missouri. It is bordered by the city of St. Louis to the south, Jennings to the west, and Bellefontaine Neighbors to the east. The city is situated on the banks of the Missouri River and is part of the Greater St. Louis metropolitan area. The city has a total area of 0.7 square miles, all of which is land.
History
Moline Acres was founded in 1945 by a group of African American veterans who had returned from World War II. The city was named after the Moline family, who had owned the land since the late 1800s. The city was incorporated in 1945 and was the first African American-majority city in St. Louis County.
In the 1950s, Moline Acres experienced a period of rapid growth and development. The city was home to a variety of businesses, including a grocery store, a gas station, a barber shop, and a beauty salon. The city also had its own school district, which was established in 1954.
In the 1960s, the city experienced a period of decline as many of its businesses closed and its population decreased. The city was also affected by the construction of Interstate 70, which cut through the city and caused the displacement of many of its residents.
Economy
Moline Acres has a small but diverse economy. The city is home to a variety of businesses, including restaurants, retail stores, and professional services. The city also has a number of industrial and manufacturing businesses, including a plastics factory and a metal fabrication plant.
The city is also home to a number of government offices, including the St. Louis County Police Department and the St. Louis County Department of Health. The city is also home to a number of educational institutions, including the Moline Acres Elementary School and the Moline Acres Middle School.
Demographics
As of the 2010 census, Moline Acres had a population of 2,500 people. The racial makeup of the city was 79.2% African American, 15.2% White, 0.8% Asian, 0.4% Native American, and 4.4% from other races. The median household income was $30,938 and the median family income was $37,500.
Conclusion
Moline Acres is a small city located in St. Louis County, Missouri. It was founded in 1945 by a group of African American veterans and has a population of approximately 2,500 people. The city has a small but diverse economy and is home to a variety of businesses, government offices, and educational institutions. The city has a population that is predominantly African American and has a median household income of $30,938.
Common Questions
What is the Total Population of Moline Acres?
Total Population of Moline Acres is 2,815.
What is the Total Male Population of Moline Acres?
Total Male Population of Moline Acres is 1,258.
What is the Total Female Population of Moline Acres?
Total Female Population of Moline Acres is 1,557.
What is the Ratio of Males per 100 Females in Moline Acres?
There are 80.80 Males per 100 Females in Moline Acres.
What is the Ratio of Females per 100 Males in Moline Acres?
There are 123.77 Females per 100 Males in Moline Acres.
What is the Median Population Age in Moline Acres?
Median Population Age in Moline Acres is 40.0 Years.
What is the Average Family Size in Moline Acres
Average Family Size in Moline Acres is 3.0 People.
What is the Average Household Size in Moline Acres
Average Household Size in Moline Acres is 2.4 People.
What is Per Capita Income in Moline Acres?
Per Capita income in Moline Acres is $20,636.
What is the Median Family Income in Moline Acres?
Median Family Income in Moline Acres is $52,804.
What is the Median Household income in Moline Acres?
Median Household Income in Moline Acres is $50,352.
What is Income or Wage Gap in Moline Acres?
Income or Wage Gap in Moline Acres is 14.3%.
Women in Moline Acres earn 85.7 cents for every dollar earned by a man.
What is Family Income Deficit in Moline Acres?
Family Income Deficit in Moline Acres is $10,707.
Families that are below poverty line in Moline Acres earn $10,707 less on average than the poverty threshold level.
What is Inequality or Gini Index in Moline Acres?
Inequality or Gini Index in Moline Acres is 0.36.
How Large is the Labor Force in Moline Acres?
There are 1,117 People in the Labor Forcein in Moline Acres.
What is the Percentage of People in the Labor Force in Moline Acres?
50.9% of People are in the Labor Force in Moline Acres.
What is the Unemployment Rate in Moline Acres?
Unemployment Rate in Moline Acres is 15.0%.