Martinsburg, MO
Martinsburg Map
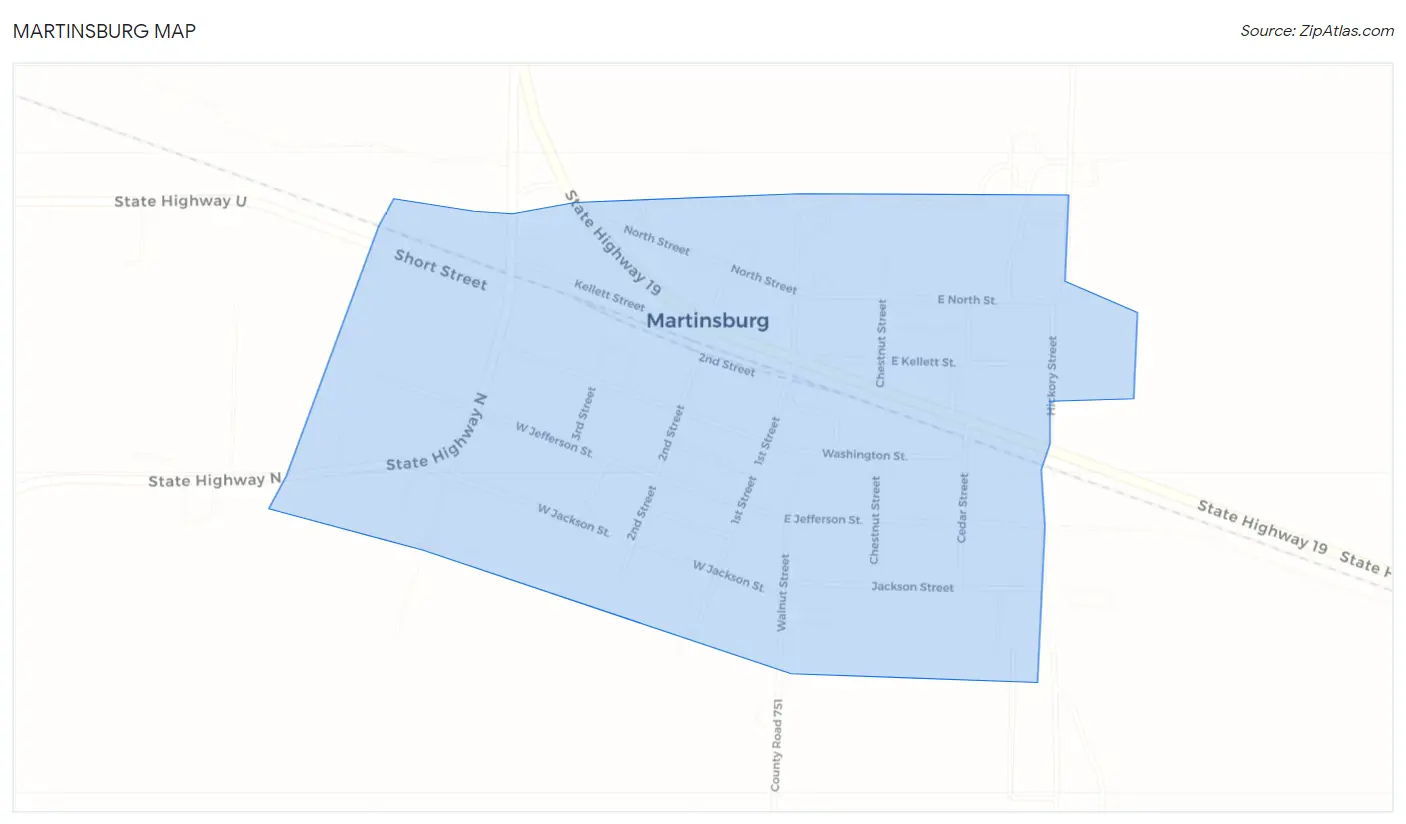
Martinsburg Overview
559
TOTAL POPULATION
179
MALE POPULATION
380
FEMALE POPULATION
47.11
MALES / 100 FEMALES
212.29
FEMALES / 100 MALES
39.5
MEDIAN AGE
2.8
AVG FAMILY SIZE
2.7
AVG HOUSEHOLD SIZE
$15,287
PER CAPITA INCOME
$31,757
AVG FAMILY INCOME
$31,696
AVG HOUSEHOLD INCOME
0.35
INEQUALITY / GINI INDEX
262
LABOR FORCE [ PEOPLE ]
66.3%
PERCENT IN LABOR FORCE
1.6%
UNEMPLOYMENT RATE
Martinsburg Zip Codes
Martinsburg Area Codes
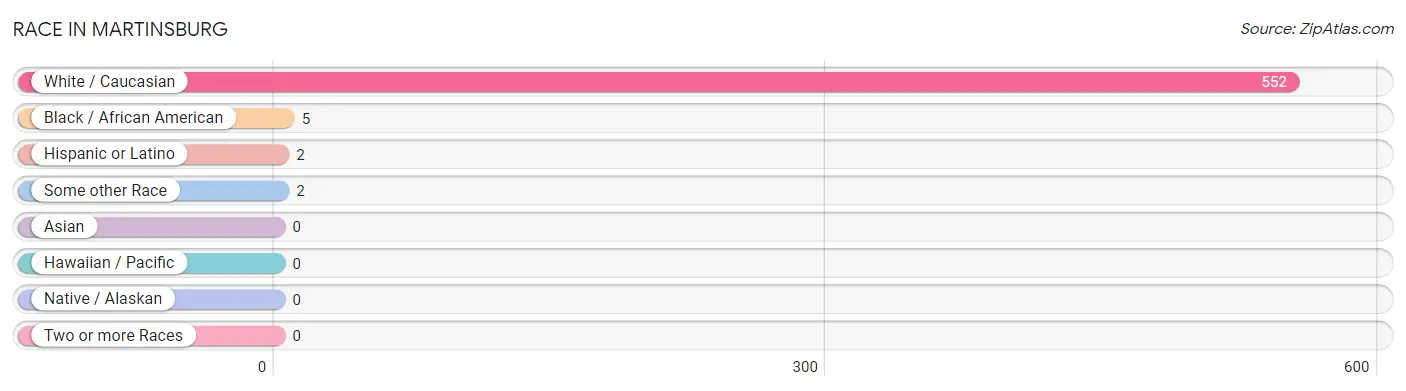
Race in Martinsburg
The most populous races in Martinsburg are White / Caucasian (552 | 98.8%), Black / African American (5 | 0.9%), and Hispanic or Latino (2 | 0.4%).
| Race | # Population | % Population |
| Asian | 0 | 0.0% |
| Black / African American | 5 | 0.9% |
| Hawaiian / Pacific | 0 | 0.0% |
| Hispanic or Latino | 2 | 0.4% |
| Native / Alaskan | 0 | 0.0% |
| White / Caucasian | 552 | 98.8% |
| Two or more Races | 0 | 0.0% |
| Some other Race | 2 | 0.4% |
| Total | 559 | 100.0% |
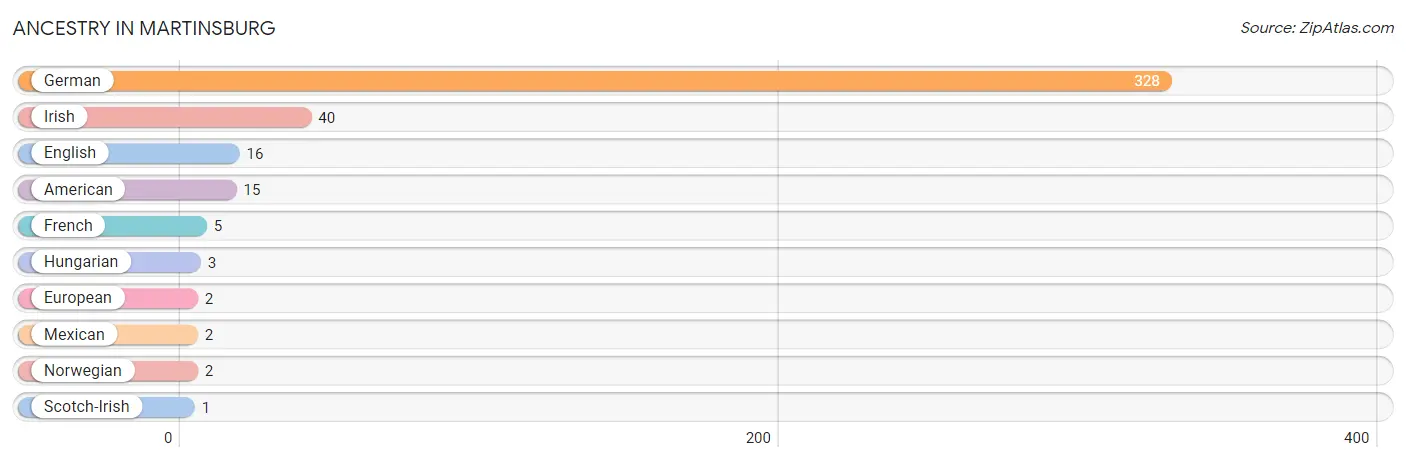
Ancestry in Martinsburg
The most populous ancestries reported in Martinsburg are German (328 | 58.7%), Irish (40 | 7.2%), English (16 | 2.9%), American (15 | 2.7%), and French (5 | 0.9%), together accounting for 72.3% of all Martinsburg residents.
| Ancestry | # Population | % Population |
| American | 15 | 2.7% |
| English | 16 | 2.9% |
| European | 2 | 0.4% |
| French | 5 | 0.9% |
| German | 328 | 58.7% |
| Hungarian | 3 | 0.5% |
| Irish | 40 | 7.2% |
| Mexican | 2 | 0.4% |
| Norwegian | 2 | 0.4% |
| Scotch-Irish | 1 | 0.2% | View All 10 Rows |
Immigrants in Martinsburg

| Immigration Origin | # Population | % Population | View All 0 Rows |
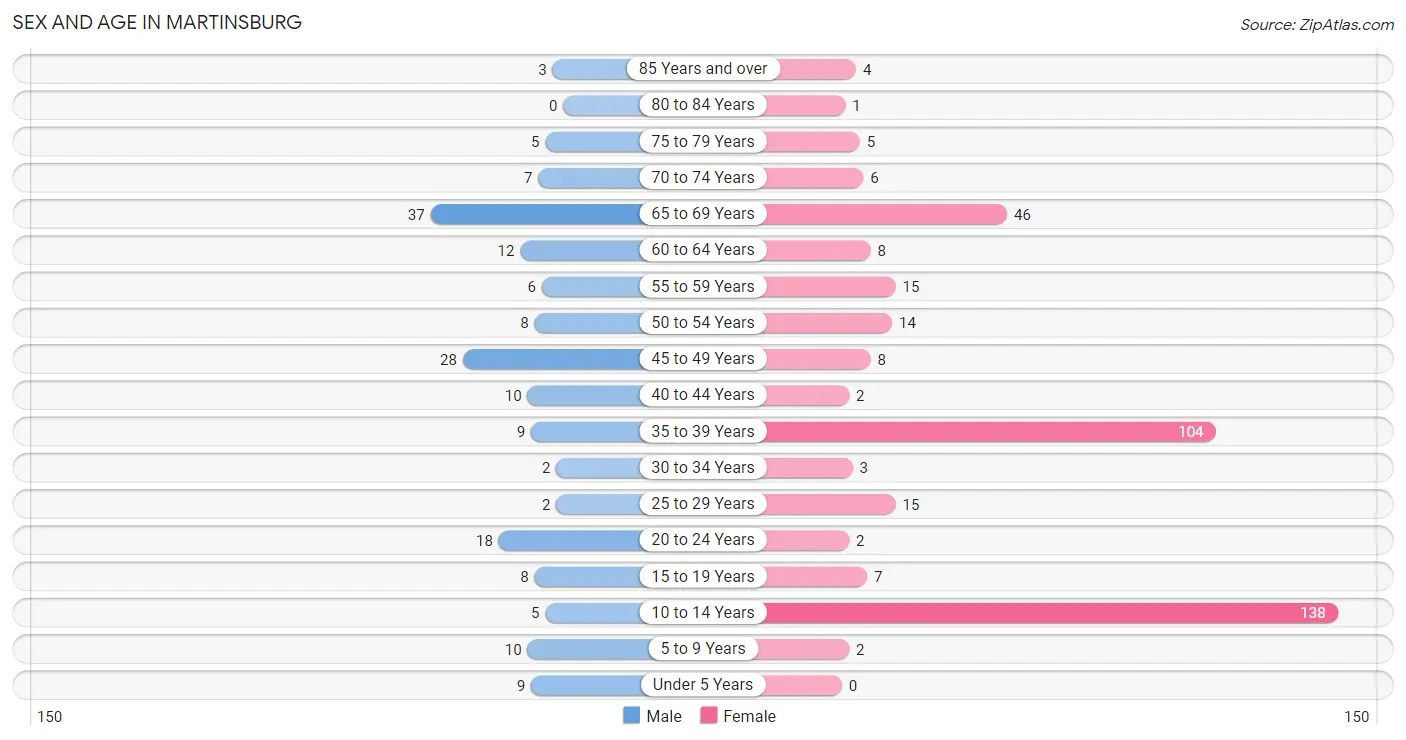
Sex and Age in Martinsburg
Sex and Age in Martinsburg
The most populous age groups in Martinsburg are 65 to 69 Years (37 | 20.7%) for men and 10 to 14 Years (138 | 36.3%) for women.
| Age Bracket | Male | Female |
| Under 5 Years | 9 (5.0%) | 0 (0.0%) |
| 5 to 9 Years | 10 (5.6%) | 2 (0.5%) |
| 10 to 14 Years | 5 (2.8%) | 138 (36.3%) |
| 15 to 19 Years | 8 (4.5%) | 7 (1.8%) |
| 20 to 24 Years | 18 (10.1%) | 2 (0.5%) |
| 25 to 29 Years | 2 (1.1%) | 15 (4.0%) |
| 30 to 34 Years | 2 (1.1%) | 3 (0.8%) |
| 35 to 39 Years | 9 (5.0%) | 104 (27.4%) |
| 40 to 44 Years | 10 (5.6%) | 2 (0.5%) |
| 45 to 49 Years | 28 (15.6%) | 8 (2.1%) |
| 50 to 54 Years | 8 (4.5%) | 14 (3.7%) |
| 55 to 59 Years | 6 (3.4%) | 15 (4.0%) |
| 60 to 64 Years | 12 (6.7%) | 8 (2.1%) |
| 65 to 69 Years | 37 (20.7%) | 46 (12.1%) |
| 70 to 74 Years | 7 (3.9%) | 6 (1.6%) |
| 75 to 79 Years | 5 (2.8%) | 5 (1.3%) |
| 80 to 84 Years | 0 (0.0%) | 1 (0.3%) |
| 85 Years and over | 3 (1.7%) | 4 (1.1%) |
| Total | 179 (100.0%) | 380 (100.0%) |
Families and Households in Martinsburg
Median Family Size in Martinsburg
The median family size in Martinsburg is 2.75 persons per family, with single female/mother families (4 | 2.6%) accounting for the largest median family size of 4.5 persons per family. On the other hand, single male/father families (4 | 2.6%) represent the smallest median family size with 2.50 persons per family.
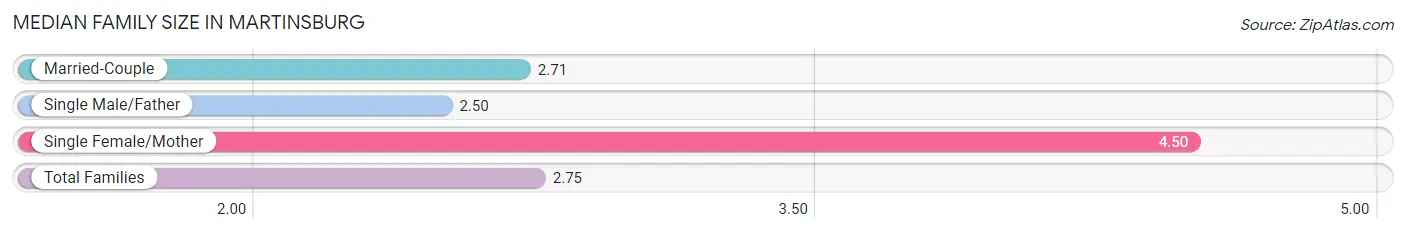
| Family Type | # Families | Family Size |
| Married-Couple | 146 (94.8%) | 2.71 |
| Single Male/Father | 4 (2.6%) | 2.50 |
| Single Female/Mother | 4 (2.6%) | 4.50 |
| Total Families | 154 (100.0%) | 2.75 |
Median Household Size in Martinsburg
The median household size in Martinsburg is 2.70 persons per household, with single female/mother households (4 | 1.9%) accounting for the largest median household size of 5 persons per household. non-family households (53 | 25.6%) represent the smallest median household size with 2.47 persons per household.

| Household Type | # Households | Household Size |
| Married-Couple | 146 (70.5%) | 2.71 |
| Single Male/Father | 4 (1.9%) | 3.25 |
| Single Female/Mother | 4 (1.9%) | 5.00 |
| Non-family | 53 (25.6%) | 2.47 |
| Total Households | 207 (100.0%) | 2.70 |
Household Size by Marriage Status in Martinsburg
Out of a total of 207 households in Martinsburg, 154 (74.4%) are family households, while 53 (25.6%) are nonfamily households. The most numerous type of family households are 4-person households, comprising 112, and the most common type of nonfamily households are 1-person households, comprising 52.

| Household Size | Family Households | Nonfamily Households |
| 1-Person Households | - | 52 (25.1%) |
| 2-Person Households | 26 (12.6%) | 0 (0.0%) |
| 3-Person Households | 11 (5.3%) | 1 (0.5%) |
| 4-Person Households | 112 (54.1%) | 0 (0.0%) |
| 5-Person Households | 5 (2.4%) | 0 (0.0%) |
| 6-Person Households | 0 (0.0%) | 0 (0.0%) |
| 7+ Person Households | 0 (0.0%) | 0 (0.0%) |
| Total | 154 (74.4%) | 53 (25.6%) |
Female Fertility in Martinsburg
Fertility by Age in Martinsburg
| Age Bracket | Women with Births | Births / 1,000 Women |
| 15 to 19 years | 0 (0.0%) | 0.0 |
| 20 to 34 years | 0 (0.0%) | 0.0 |
| 35 to 50 years | 0 (0.0%) | 0.0 |
| Total | 0 (0.0%) | 0.0 |
Fertility by Age by Marriage Status in Martinsburg
| Age Bracket | Married | Unmarried |
| 15 to 19 years | 0 (0.0%) | 0 (0.0%) |
| 20 to 34 years | 0 (0.0%) | 0 (0.0%) |
| 35 to 50 years | 0 (0.0%) | 0 (0.0%) |
| Total | 0 (0.0%) | 0 (0.0%) |
Fertility by Education in Martinsburg
| Educational Attainment | Women with Births | Births / 1,000 Women |
| Less than High School | 0 (0.0%) | 0.0 |
| High School Diploma | 0 (0.0%) | 0.0 |
| College or Associate's Degree | 0 (0.0%) | 0.0 |
| Bachelor's Degree | 0 (0.0%) | 0.0 |
| Graduate Degree | 0 (0.0%) | 0.0 |
| Total | 0 (0.0%) | 0.0 |
Fertility by Education by Marriage Status in Martinsburg
| Educational Attainment | Married | Unmarried |
| Less than High School | 0 (0.0%) | 0 (0.0%) |
| High School Diploma | 0 (0.0%) | 0 (0.0%) |
| College or Associate's Degree | 0 (0.0%) | 0 (0.0%) |
| Bachelor's Degree | 0 (0.0%) | 0 (0.0%) |
| Graduate Degree | 0 (0.0%) | 0 (0.0%) |
| Total | 0 (0.0%) | 0 (0.0%) |
Income in Martinsburg
Income Overview in Martinsburg
Per Capita Income in Martinsburg is $15,287, while median incomes of families and households are $31,757 and $31,696 respectively.
| Characteristic | Number | Measure |
| Per Capita Income | 559 | $15,287 |
| Median Family Income | 154 | $31,757 |
| Mean Family Income | 154 | $49,429 |
| Median Household Income | 207 | $31,696 |
| Mean Household Income | 207 | $45,947 |
| Income Deficit | 154 | $0 |
| Wage / Income Gap (%) | 559 | 0.00% |
| Wage / Income Gap ($) | 559 | 100.00¢ per $1 |
| Gini / Inequality Index | 559 | 0.35 |
Earnings by Sex in Martinsburg
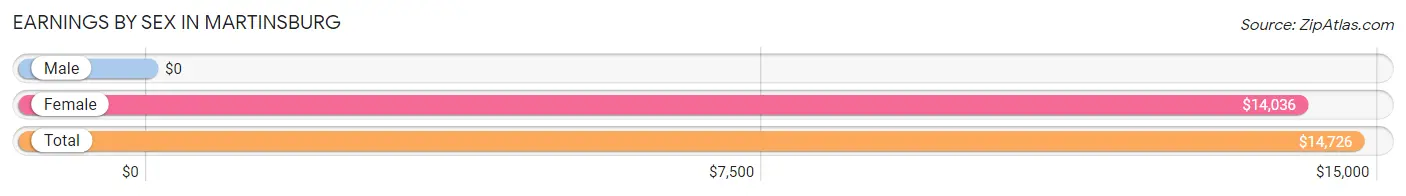
| Sex | Number | Average Earnings |
| Male | 104 (37.6%) | $0 |
| Female | 173 (62.5%) | $14,036 |
| Total | 277 (100.0%) | $14,726 |
Earnings by Sex by Income Bracket in Martinsburg
The most common earnings brackets in Martinsburg are $15,000 to $17,499 for men (24 | 23.1%) and $12,500 to $14,999 for women (105 | 60.7%).
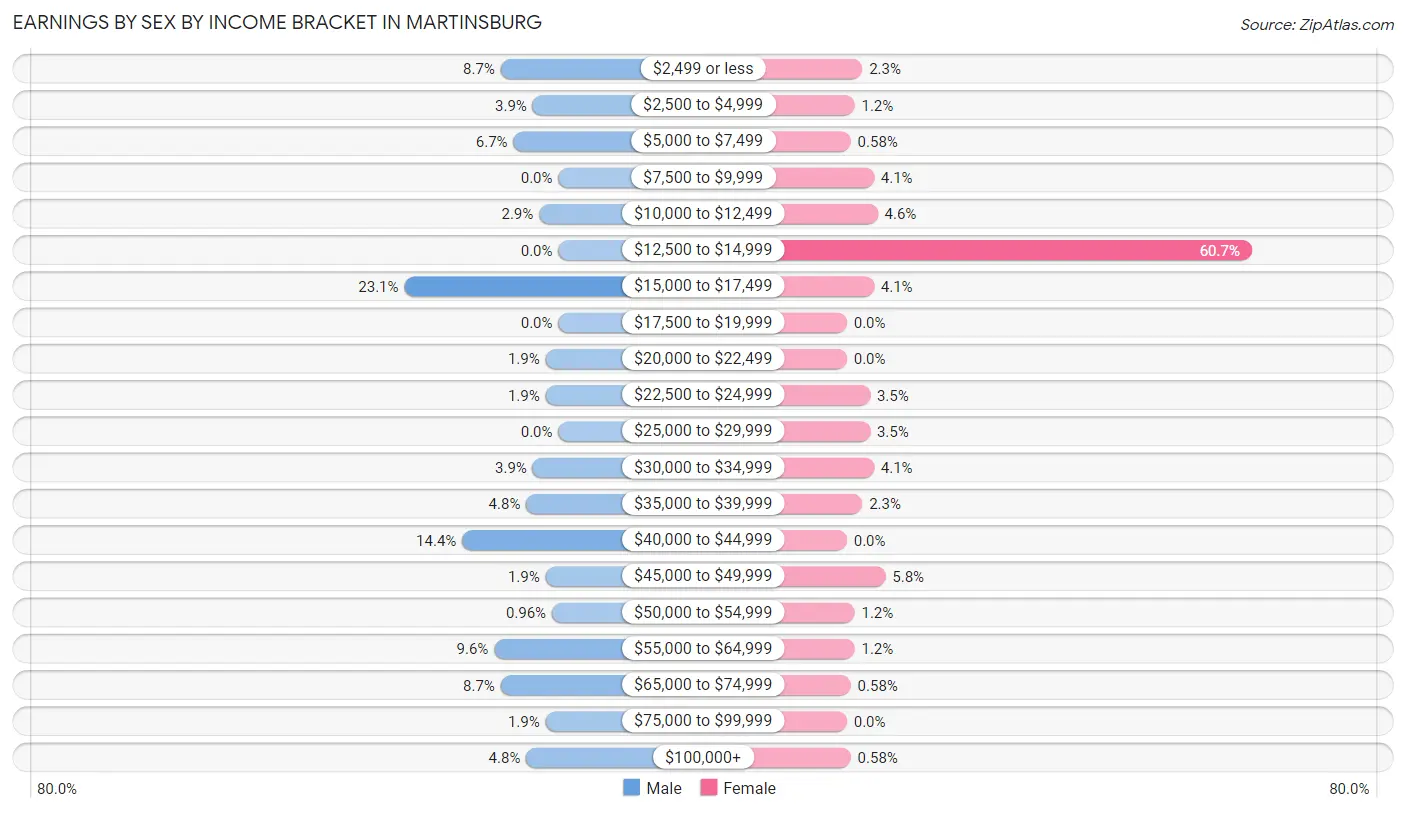
| Income | Male | Female |
| $2,499 or less | 9 (8.6%) | 4 (2.3%) |
| $2,500 to $4,999 | 4 (3.8%) | 2 (1.2%) |
| $5,000 to $7,499 | 7 (6.7%) | 1 (0.6%) |
| $7,500 to $9,999 | 0 (0.0%) | 7 (4.1%) |
| $10,000 to $12,499 | 3 (2.9%) | 8 (4.6%) |
| $12,500 to $14,999 | 0 (0.0%) | 105 (60.7%) |
| $15,000 to $17,499 | 24 (23.1%) | 7 (4.1%) |
| $17,500 to $19,999 | 0 (0.0%) | 0 (0.0%) |
| $20,000 to $22,499 | 2 (1.9%) | 0 (0.0%) |
| $22,500 to $24,999 | 2 (1.9%) | 6 (3.5%) |
| $25,000 to $29,999 | 0 (0.0%) | 6 (3.5%) |
| $30,000 to $34,999 | 4 (3.8%) | 7 (4.1%) |
| $35,000 to $39,999 | 5 (4.8%) | 4 (2.3%) |
| $40,000 to $44,999 | 15 (14.4%) | 0 (0.0%) |
| $45,000 to $49,999 | 2 (1.9%) | 10 (5.8%) |
| $50,000 to $54,999 | 1 (1.0%) | 2 (1.2%) |
| $55,000 to $64,999 | 10 (9.6%) | 2 (1.2%) |
| $65,000 to $74,999 | 9 (8.6%) | 1 (0.6%) |
| $75,000 to $99,999 | 2 (1.9%) | 0 (0.0%) |
| $100,000+ | 5 (4.8%) | 1 (0.6%) |
| Total | 104 (100.0%) | 173 (100.0%) |
Earnings by Sex by Educational Attainment in Martinsburg
Average earnings in Martinsburg are $34,375 for men and $14,071 for women, a difference of 59.1%. Men with an educational attainment of bachelor's degree enjoy the highest average annual earnings of $58,750, while those with college or associate's degree education earn the least with $56,667. Women with an educational attainment of graduate degree earn the most with the average annual earnings of $46,750, while those with college or associate's degree education have the smallest earnings of $13,700.

| Educational Attainment | Male Income | Female Income |
| Less than High School | - | - |
| High School Diploma | - | - |
| College or Associate's Degree | $56,667 | $13,700 |
| Bachelor's Degree | $58,750 | $38,750 |
| Graduate Degree | - | - |
| Total | $34,375 | $14,071 |
Family Income in Martinsburg
Family Income Brackets in Martinsburg
According to the Martinsburg family income data, there are 106 families falling into the $25,000 to $34,999 income range, which is the most common income bracket and makes up 68.8% of all families.
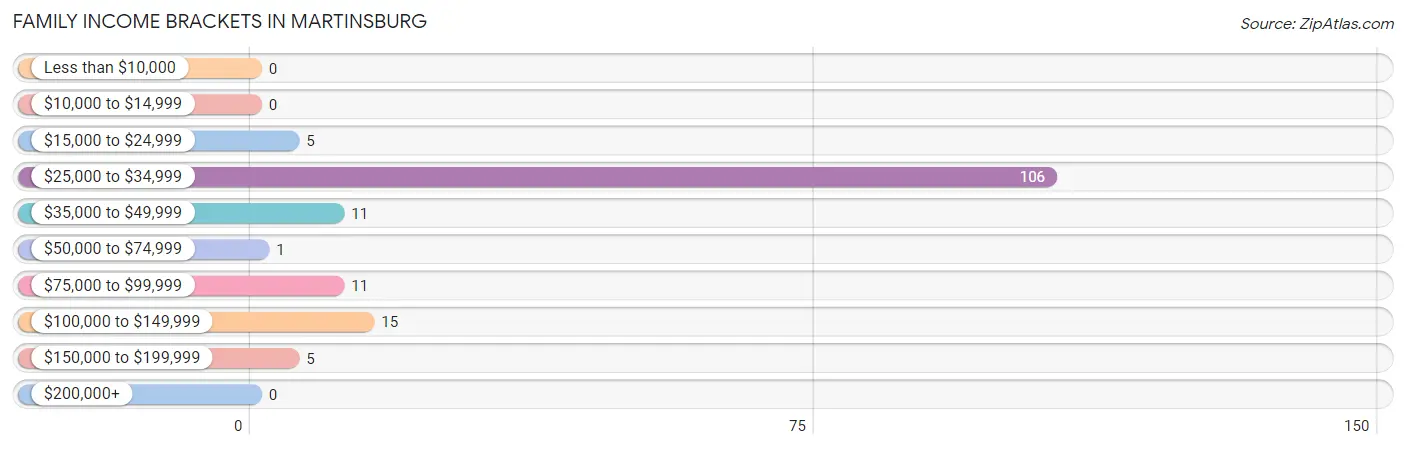
| Income Bracket | # Families | % Families |
| Less than $10,000 | 0 | 0.0% |
| $10,000 to $14,999 | 0 | 0.0% |
| $15,000 to $24,999 | 5 | 3.2% |
| $25,000 to $34,999 | 106 | 68.8% |
| $35,000 to $49,999 | 11 | 7.1% |
| $50,000 to $74,999 | 1 | 0.6% |
| $75,000 to $99,999 | 11 | 7.1% |
| $100,000 to $149,999 | 15 | 9.7% |
| $150,000 to $199,999 | 5 | 3.2% |
| $200,000+ | 0 | 0.0% |
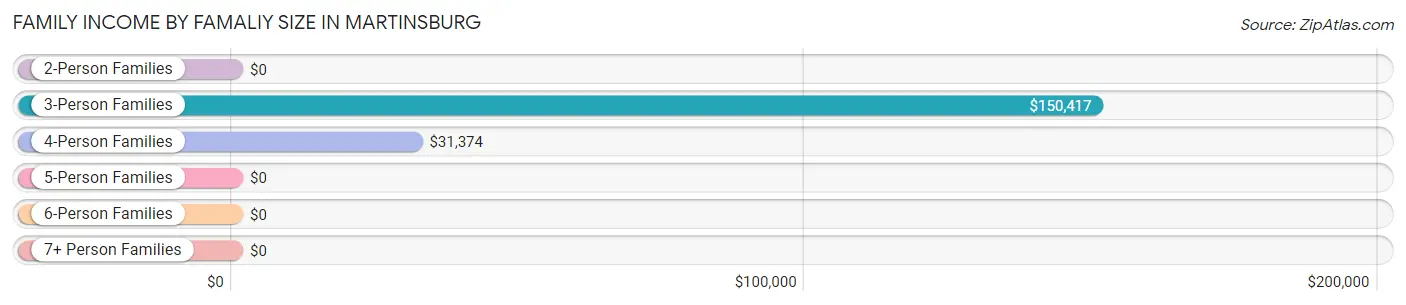
Family Income by Famaliy Size in Martinsburg
3-person families (9 | 5.8%) account for the highest median family income in Martinsburg with $150,417 per family, while 3-person families (9 | 5.8%) have the highest median income of $50,139 per family member.
| Income Bracket | # Families | Median Income |
| 2-Person Families | 28 (18.2%) | $0 |
| 3-Person Families | 9 (5.8%) | $150,417 |
| 4-Person Families | 113 (73.4%) | $31,374 |
| 5-Person Families | 4 (2.6%) | $0 |
| 6-Person Families | 0 (0.0%) | $0 |
| 7+ Person Families | 0 (0.0%) | $0 |
| Total | 154 (100.0%) | $31,757 |
Family Income by Number of Earners in Martinsburg
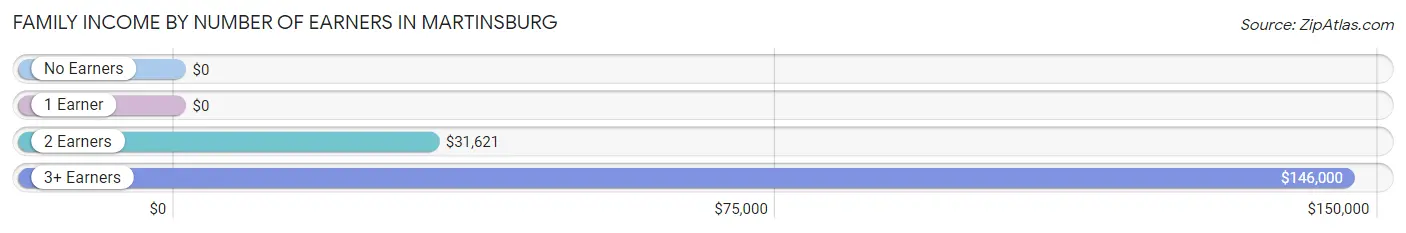
| Number of Earners | # Families | Median Income |
| No Earners | 3 (1.9%) | $0 |
| 1 Earner | 10 (6.5%) | $0 |
| 2 Earners | 131 (85.1%) | $31,621 |
| 3+ Earners | 10 (6.5%) | $146,000 |
| Total | 154 (100.0%) | $31,757 |
Household Income in Martinsburg
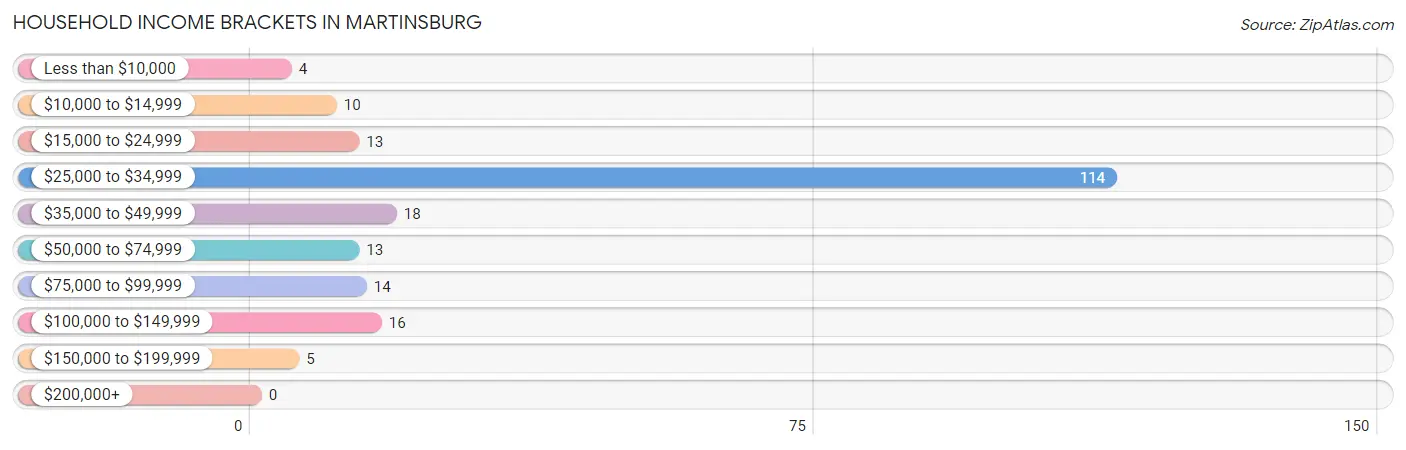
Household Income Brackets in Martinsburg
With 114 households falling in the category, the $25,000 to $34,999 income range is the most frequent in Martinsburg, accounting for 55.1% of all households.
| Income Bracket | # Households | % Households |
| Less than $10,000 | 4 | 1.9% |
| $10,000 to $14,999 | 10 | 4.8% |
| $15,000 to $24,999 | 13 | 6.3% |
| $25,000 to $34,999 | 114 | 55.1% |
| $35,000 to $49,999 | 18 | 8.7% |
| $50,000 to $74,999 | 13 | 6.3% |
| $75,000 to $99,999 | 14 | 6.8% |
| $100,000 to $149,999 | 16 | 7.7% |
| $150,000 to $199,999 | 5 | 2.4% |
| $200,000+ | 0 | 0.0% |
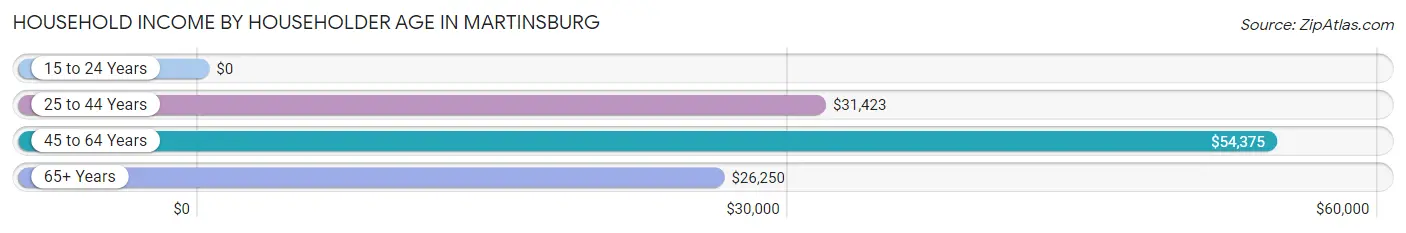
Household Income by Householder Age in Martinsburg
The median household income in Martinsburg is $31,696, with the highest median household income of $54,375 found in the 45 to 64 years age bracket for the primary householder. A total of 50 households (24.1%) fall into this category. Meanwhile, the 15 to 24 years age bracket for the primary householder has the lowest median household income of $0, with 2 households (1.0%) in this group.
| Income Bracket | # Households | Median Income |
| 15 to 24 Years | 2 (1.0%) | $0 |
| 25 to 44 Years | 125 (60.4%) | $31,423 |
| 45 to 64 Years | 50 (24.1%) | $54,375 |
| 65+ Years | 30 (14.5%) | $26,250 |
| Total | 207 (100.0%) | $31,696 |
Poverty in Martinsburg
Income Below Poverty by Sex and Age in Martinsburg
With 26.3% poverty level for males and 13.2% for females among the residents of Martinsburg, 65 to 74 year old males and 65 to 74 year old females are the most vulnerable to poverty, with 40 males (90.9%) and 43 females (82.7%) in their respective age groups living below the poverty level.
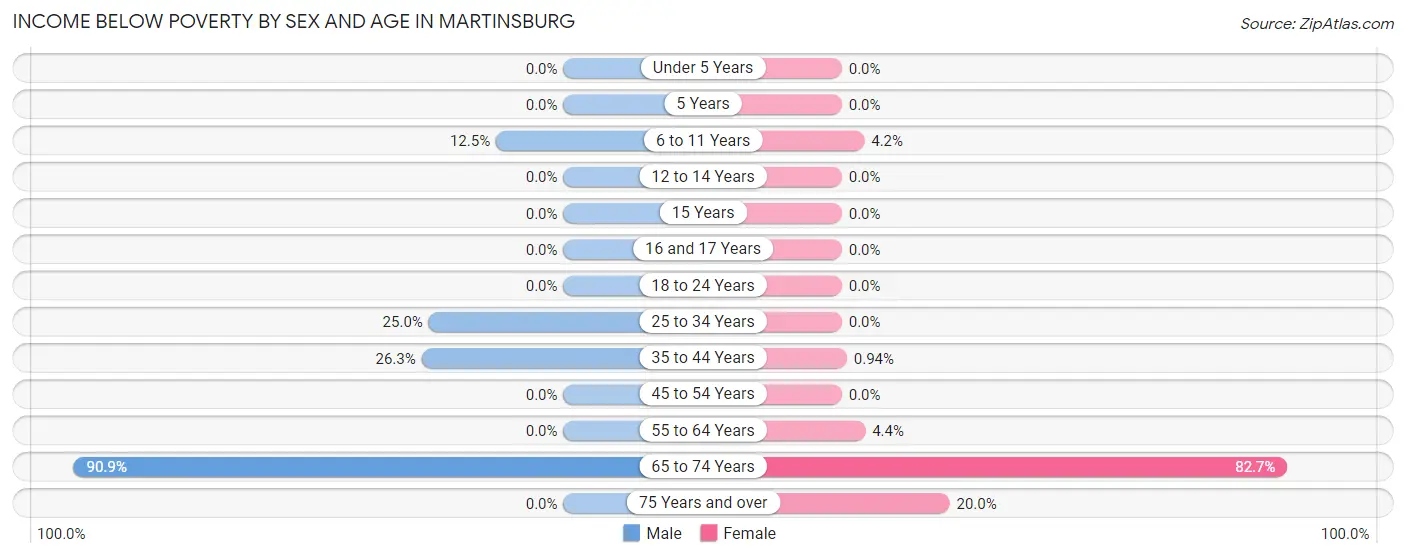
| Age Bracket | Male | Female |
| Under 5 Years | 0 (0.0%) | 0 (0.0%) |
| 5 Years | 0 (0.0%) | 0 (0.0%) |
| 6 to 11 Years | 1 (12.5%) | 3 (4.2%) |
| 12 to 14 Years | 0 (0.0%) | 0 (0.0%) |
| 15 Years | 0 (0.0%) | 0 (0.0%) |
| 16 and 17 Years | 0 (0.0%) | 0 (0.0%) |
| 18 to 24 Years | 0 (0.0%) | 0 (0.0%) |
| 25 to 34 Years | 1 (25.0%) | 0 (0.0%) |
| 35 to 44 Years | 5 (26.3%) | 1 (0.9%) |
| 45 to 54 Years | 0 (0.0%) | 0 (0.0%) |
| 55 to 64 Years | 0 (0.0%) | 1 (4.3%) |
| 65 to 74 Years | 40 (90.9%) | 43 (82.7%) |
| 75 Years and over | 0 (0.0%) | 2 (20.0%) |
| Total | 47 (26.3%) | 50 (13.2%) |
Income Above Poverty by Sex and Age in Martinsburg
According to the poverty statistics in Martinsburg, males aged under 5 years and females aged 12 to 14 years are the age groups that are most secure financially, with 100.0% of males and 100.0% of females in these age groups living above the poverty line.
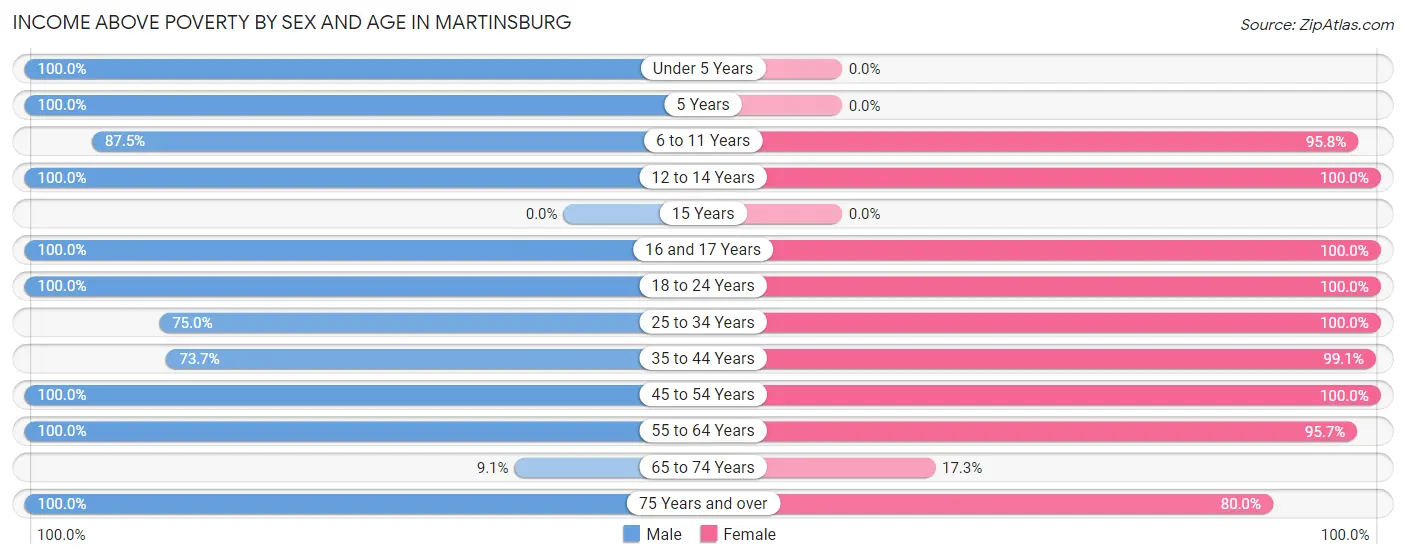
| Age Bracket | Male | Female |
| Under 5 Years | 9 (100.0%) | 0 (0.0%) |
| 5 Years | 3 (100.0%) | 0 (0.0%) |
| 6 to 11 Years | 7 (87.5%) | 69 (95.8%) |
| 12 to 14 Years | 4 (100.0%) | 68 (100.0%) |
| 15 Years | 0 (0.0%) | 0 (0.0%) |
| 16 and 17 Years | 5 (100.0%) | 4 (100.0%) |
| 18 to 24 Years | 21 (100.0%) | 5 (100.0%) |
| 25 to 34 Years | 3 (75.0%) | 18 (100.0%) |
| 35 to 44 Years | 14 (73.7%) | 105 (99.1%) |
| 45 to 54 Years | 36 (100.0%) | 22 (100.0%) |
| 55 to 64 Years | 18 (100.0%) | 22 (95.7%) |
| 65 to 74 Years | 4 (9.1%) | 9 (17.3%) |
| 75 Years and over | 8 (100.0%) | 8 (80.0%) |
| Total | 132 (73.7%) | 330 (86.8%) |
Income Below Poverty Among Married-Couple Families in Martinsburg
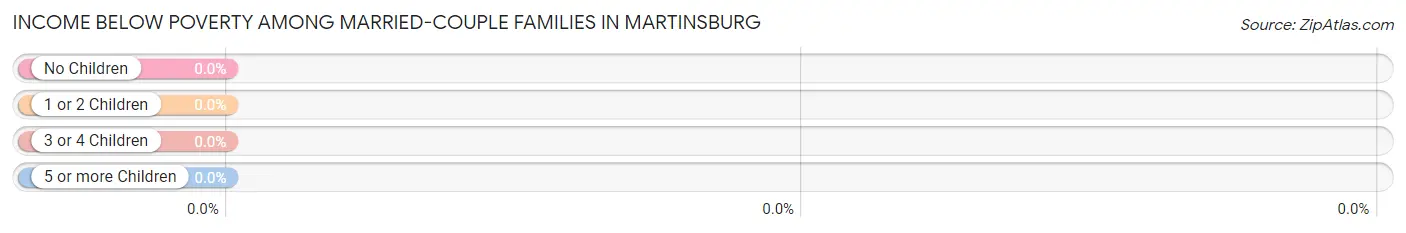
| Children | Above Poverty | Below Poverty |
| No Children | 31 (100.0%) | 0 (0.0%) |
| 1 or 2 Children | 111 (100.0%) | 0 (0.0%) |
| 3 or 4 Children | 4 (100.0%) | 0 (0.0%) |
| 5 or more Children | 0 (0.0%) | 0 (0.0%) |
| Total | 146 (100.0%) | 0 (0.0%) |
Income Below Poverty Among Single-Parent Households in Martinsburg
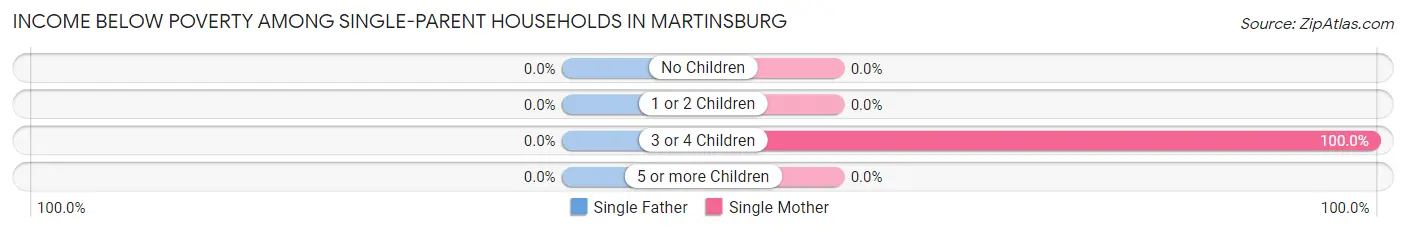
| Children | Single Father | Single Mother |
| No Children | 0 (0.0%) | 0 (0.0%) |
| 1 or 2 Children | 0 (0.0%) | 0 (0.0%) |
| 3 or 4 Children | 0 (0.0%) | 1 (100.0%) |
| 5 or more Children | 0 (0.0%) | 0 (0.0%) |
| Total | 0 (0.0%) | 1 (25.0%) |
Income Below Poverty Among Married-Couple vs Single-Parent Households in Martinsburg
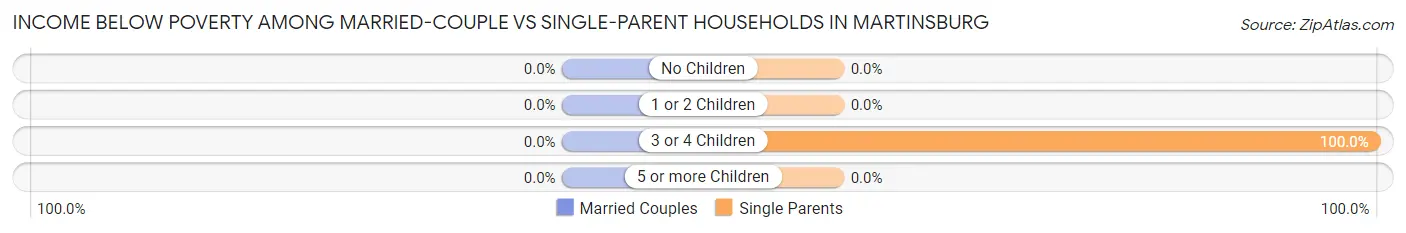
| Children | Married-Couple Families | Single-Parent Households |
| No Children | 0 (0.0%) | 0 (0.0%) |
| 1 or 2 Children | 0 (0.0%) | 0 (0.0%) |
| 3 or 4 Children | 0 (0.0%) | 1 (100.0%) |
| 5 or more Children | 0 (0.0%) | 0 (0.0%) |
| Total | 0 (0.0%) | 1 (12.5%) |
Employment Characteristics in Martinsburg
Employment by Class of Employer in Martinsburg
Among the 256 employed individuals in Martinsburg, private company employees (122 | 47.7%), local government employees (112 | 43.8%), and self-employed (not incorporated) (6 | 2.3%) make up the most common classes of employment.
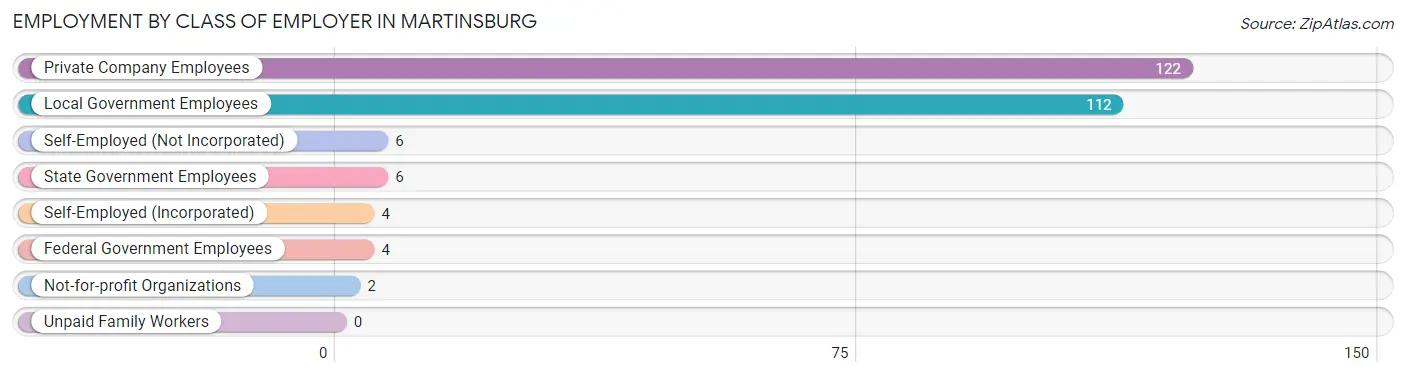
| Employer Class | # Employees | % Employees |
| Private Company Employees | 122 | 47.7% |
| Self-Employed (Incorporated) | 4 | 1.6% |
| Self-Employed (Not Incorporated) | 6 | 2.3% |
| Not-for-profit Organizations | 2 | 0.8% |
| Local Government Employees | 112 | 43.8% |
| State Government Employees | 6 | 2.3% |
| Federal Government Employees | 4 | 1.6% |
| Unpaid Family Workers | 0 | 0.0% |
| Total | 256 | 100.0% |
Employment Status by Age in Martinsburg
According to the labor force statistics for Martinsburg, out of the total population over 16 years of age (395), 66.3% or 262 individuals are in the labor force, with 1.6% or 4 of them unemployed. The age group with the highest labor force participation rate is 25 to 29 years, with 100.0% or 17 individuals in the labor force. Within the labor force, the 25 to 29 years age range has the highest percentage of unemployed individuals, with 5.9% or 1 of them being unemployed.
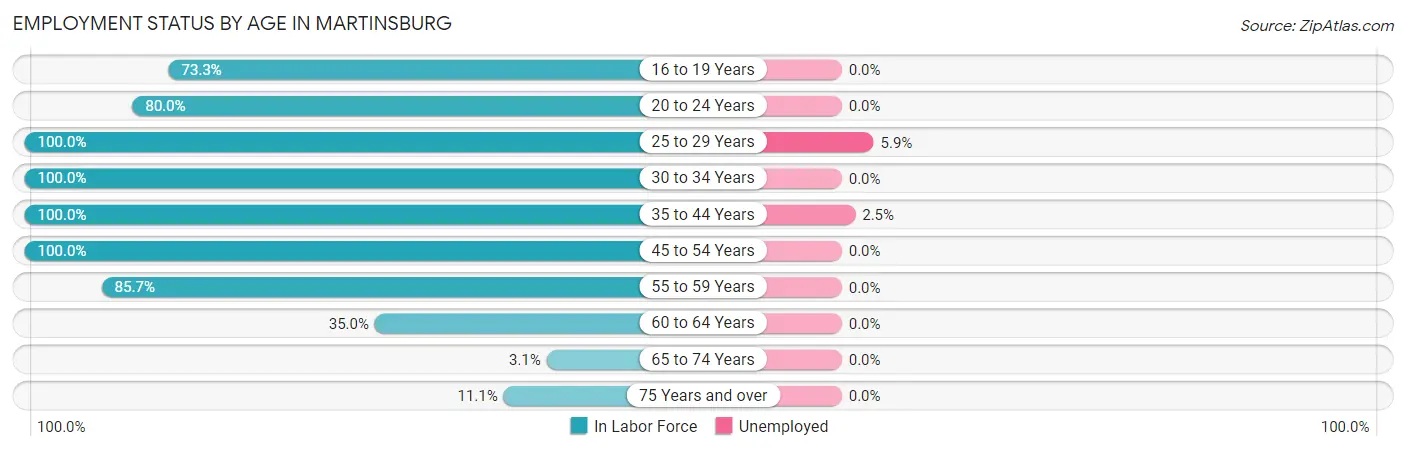
| Age Bracket | In Labor Force | Unemployed |
| 16 to 19 Years | 11 (73.3%) | 0 (0.0%) |
| 20 to 24 Years | 16 (80.0%) | 0 (0.0%) |
| 25 to 29 Years | 17 (100.0%) | 1 (5.9%) |
| 30 to 34 Years | 5 (100.0%) | 0 (0.0%) |
| 35 to 44 Years | 125 (100.0%) | 3 (2.5%) |
| 45 to 54 Years | 58 (100.0%) | 0 (0.0%) |
| 55 to 59 Years | 18 (85.7%) | 0 (0.0%) |
| 60 to 64 Years | 7 (35.0%) | 0 (0.0%) |
| 65 to 74 Years | 3 (3.1%) | 0 (0.0%) |
| 75 Years and over | 2 (11.1%) | 0 (0.0%) |
| Total | 262 (66.3%) | 4 (1.6%) |
Employment Status by Educational Attainment in Martinsburg
According to labor force statistics for Martinsburg, 93.5% of individuals (230) out of the total population between 25 and 64 years of age (246) are in the labor force, with 1.8% or 4 of them being unemployed. The group with the highest labor force participation rate are those with the educational attainment of bachelor's degree or higher, with 100.0% or 30 individuals in the labor force. Within the labor force, individuals with high school diploma education have the highest percentage of unemployment, with 3.1% or 2 of them being unemployed.
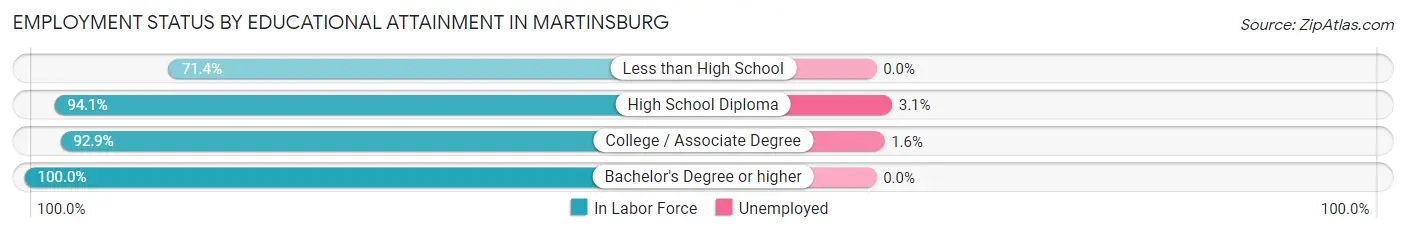
| Educational Attainment | In Labor Force | Unemployed |
| Less than High School | 5 (71.4%) | 0 (0.0%) |
| High School Diploma | 64 (94.1%) | 2 (3.1%) |
| College / Associate Degree | 131 (92.9%) | 2 (1.6%) |
| Bachelor's Degree or higher | 30 (100.0%) | 0 (0.0%) |
| Total | 230 (93.5%) | 4 (1.8%) |
Employment Occupations by Sex in Martinsburg
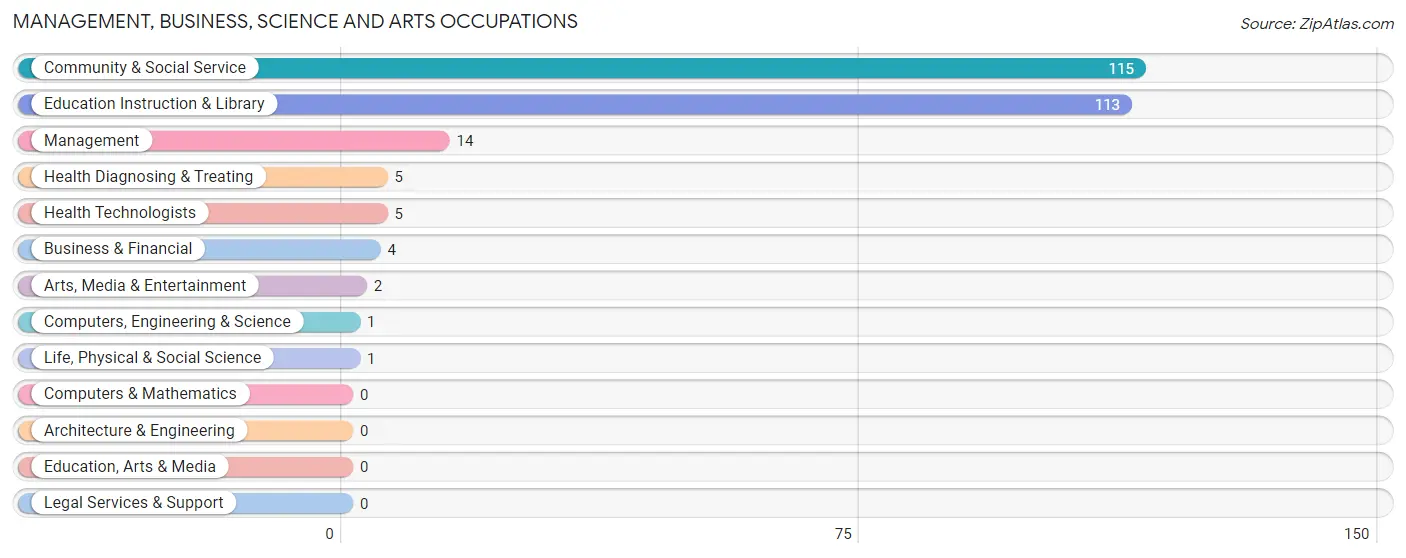
Management, Business, Science and Arts Occupations
The most common Management, Business, Science and Arts occupations in Martinsburg are Community & Social Service (115 | 45.3%), Education Instruction & Library (113 | 44.5%), Management (14 | 5.5%), Health Diagnosing & Treating (5 | 2.0%), and Health Technologists (5 | 2.0%).
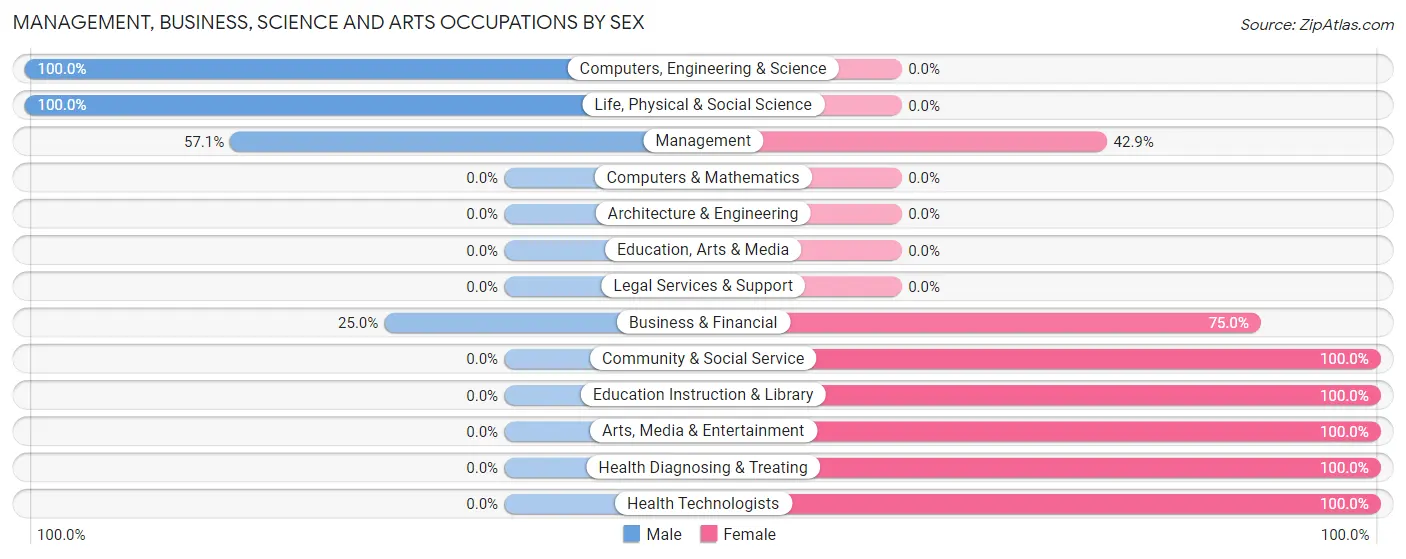
Management, Business, Science and Arts Occupations by Sex
Within the Management, Business, Science and Arts occupations in Martinsburg, the most male-oriented occupations are Computers, Engineering & Science (100.0%), Life, Physical & Social Science (100.0%), and Management (57.1%), while the most female-oriented occupations are Community & Social Service (100.0%), Education Instruction & Library (100.0%), and Arts, Media & Entertainment (100.0%).
| Occupation | Male | Female |
| Management | 8 (57.1%) | 6 (42.9%) |
| Business & Financial | 1 (25.0%) | 3 (75.0%) |
| Computers, Engineering & Science | 1 (100.0%) | 0 (0.0%) |
| Computers & Mathematics | 0 (0.0%) | 0 (0.0%) |
| Architecture & Engineering | 0 (0.0%) | 0 (0.0%) |
| Life, Physical & Social Science | 1 (100.0%) | 0 (0.0%) |
| Community & Social Service | 0 (0.0%) | 115 (100.0%) |
| Education, Arts & Media | 0 (0.0%) | 0 (0.0%) |
| Legal Services & Support | 0 (0.0%) | 0 (0.0%) |
| Education Instruction & Library | 0 (0.0%) | 113 (100.0%) |
| Arts, Media & Entertainment | 0 (0.0%) | 2 (100.0%) |
| Health Diagnosing & Treating | 0 (0.0%) | 5 (100.0%) |
| Health Technologists | 0 (0.0%) | 5 (100.0%) |
| Total (Category) | 10 (7.2%) | 129 (92.8%) |
| Total (Overall) | 89 (35.0%) | 165 (65.0%) |
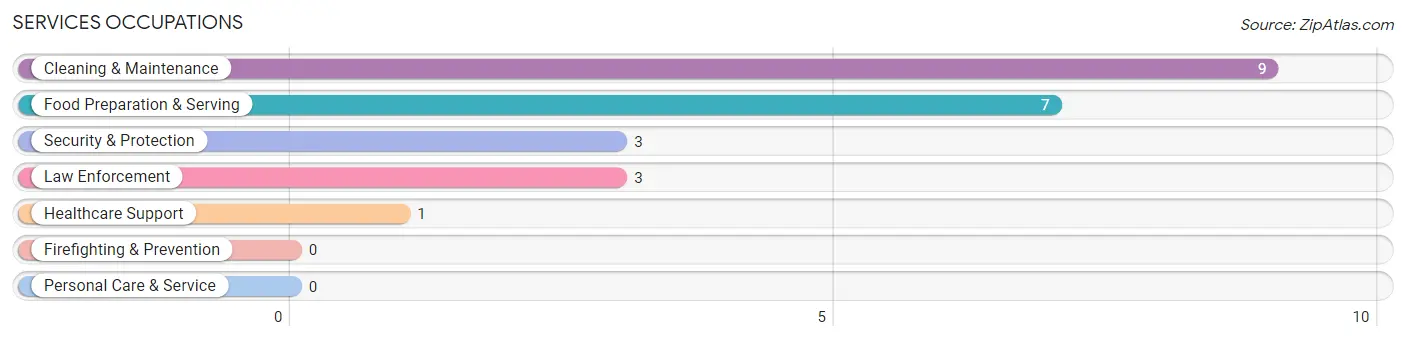
Services Occupations
The most common Services occupations in Martinsburg are Cleaning & Maintenance (9 | 3.5%), Food Preparation & Serving (7 | 2.8%), Security & Protection (3 | 1.2%), Law Enforcement (3 | 1.2%), and Healthcare Support (1 | 0.4%).
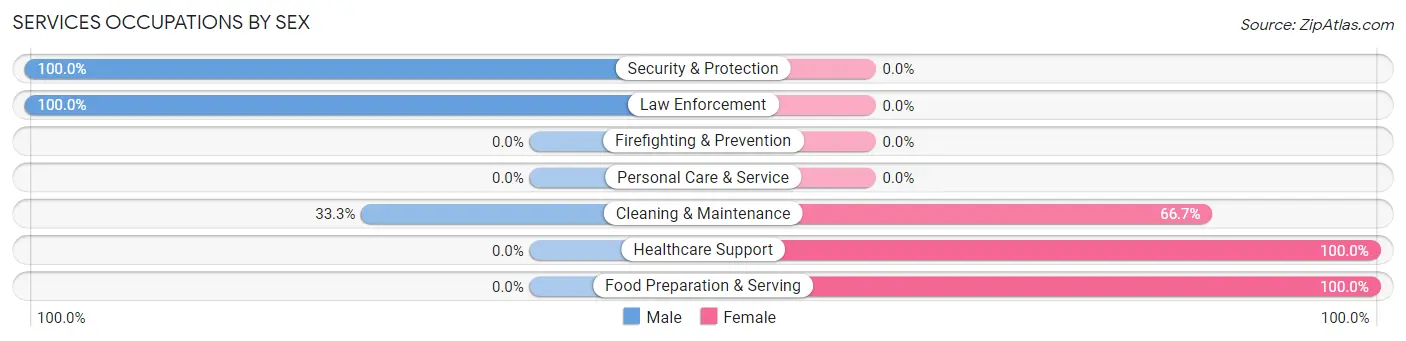
Services Occupations by Sex
Within the Services occupations in Martinsburg, the most male-oriented occupations are Security & Protection (100.0%), Law Enforcement (100.0%), and Cleaning & Maintenance (33.3%), while the most female-oriented occupations are Healthcare Support (100.0%), Food Preparation & Serving (100.0%), and Cleaning & Maintenance (66.7%).
| Occupation | Male | Female |
| Healthcare Support | 0 (0.0%) | 1 (100.0%) |
| Security & Protection | 3 (100.0%) | 0 (0.0%) |
| Firefighting & Prevention | 0 (0.0%) | 0 (0.0%) |
| Law Enforcement | 3 (100.0%) | 0 (0.0%) |
| Food Preparation & Serving | 0 (0.0%) | 7 (100.0%) |
| Cleaning & Maintenance | 3 (33.3%) | 6 (66.7%) |
| Personal Care & Service | 0 (0.0%) | 0 (0.0%) |
| Total (Category) | 6 (30.0%) | 14 (70.0%) |
| Total (Overall) | 89 (35.0%) | 165 (65.0%) |
Sales and Office Occupations
The most common Sales and Office occupations in Martinsburg are Sales & Related (13 | 5.1%), and Office & Administration (12 | 4.7%).
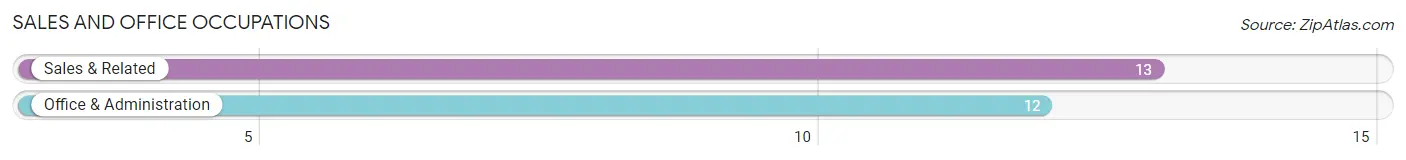
Sales and Office Occupations by Sex
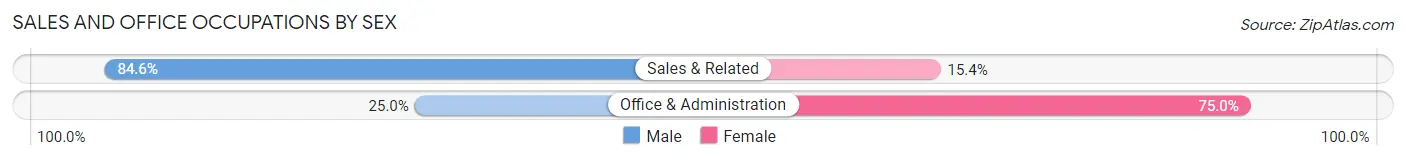
| Occupation | Male | Female |
| Sales & Related | 11 (84.6%) | 2 (15.4%) |
| Office & Administration | 3 (25.0%) | 9 (75.0%) |
| Total (Category) | 14 (56.0%) | 11 (44.0%) |
| Total (Overall) | 89 (35.0%) | 165 (65.0%) |
Natural Resources, Construction and Maintenance Occupations
The most common Natural Resources, Construction and Maintenance occupations in Martinsburg are Installation, Maintenance & Repair (4 | 1.6%), Farming, Fishing & Forestry (2 | 0.8%), and Construction & Extraction (2 | 0.8%).
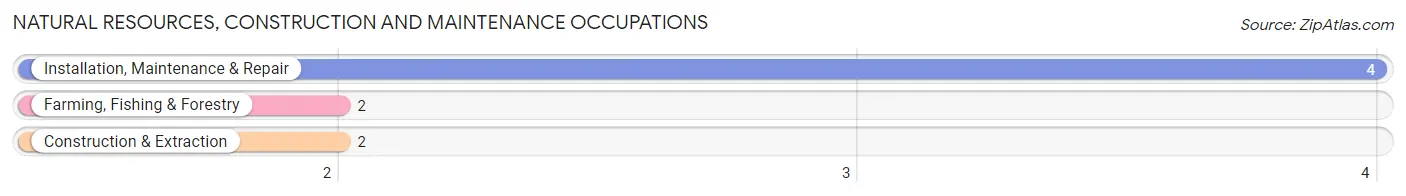
Natural Resources, Construction and Maintenance Occupations by Sex
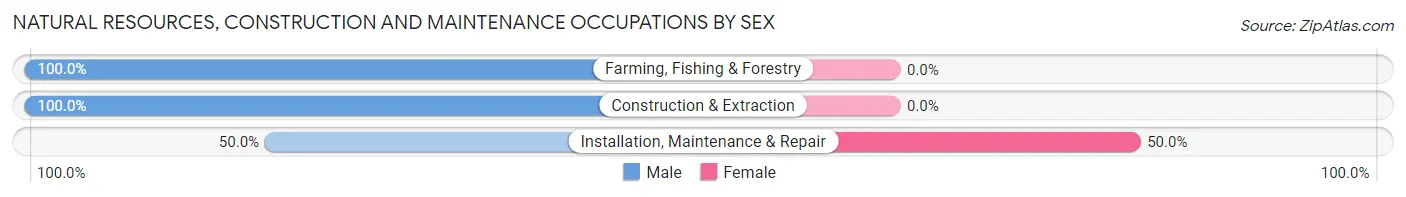
| Occupation | Male | Female |
| Farming, Fishing & Forestry | 2 (100.0%) | 0 (0.0%) |
| Construction & Extraction | 2 (100.0%) | 0 (0.0%) |
| Installation, Maintenance & Repair | 2 (50.0%) | 2 (50.0%) |
| Total (Category) | 6 (75.0%) | 2 (25.0%) |
| Total (Overall) | 89 (35.0%) | 165 (65.0%) |
Production, Transportation and Moving Occupations
The most common Production, Transportation and Moving occupations in Martinsburg are Transportation (27 | 10.6%), Material Moving (20 | 7.9%), and Production (15 | 5.9%).
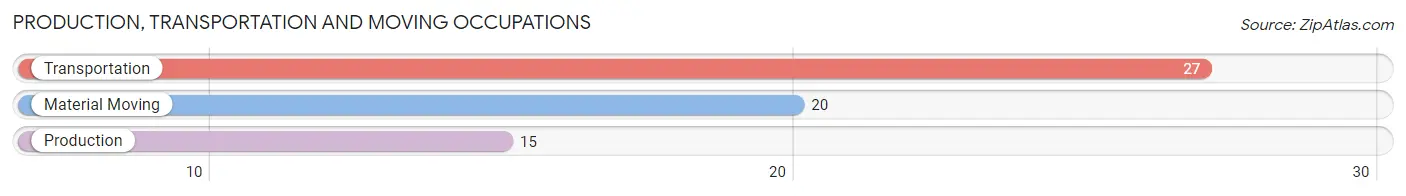
Production, Transportation and Moving Occupations by Sex
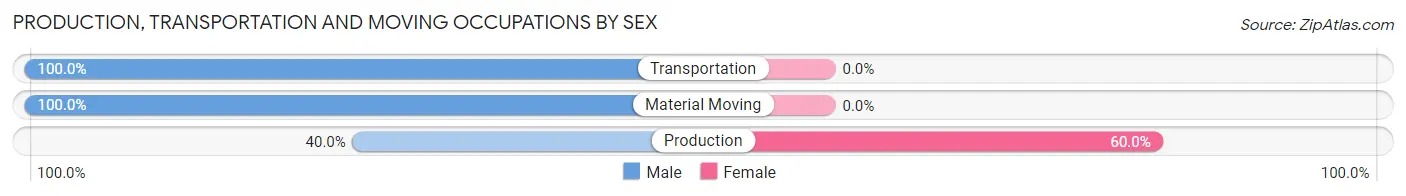
| Occupation | Male | Female |
| Production | 6 (40.0%) | 9 (60.0%) |
| Transportation | 27 (100.0%) | 0 (0.0%) |
| Material Moving | 20 (100.0%) | 0 (0.0%) |
| Total (Category) | 53 (85.5%) | 9 (14.5%) |
| Total (Overall) | 89 (35.0%) | 165 (65.0%) |
Employment Industries by Sex in Martinsburg
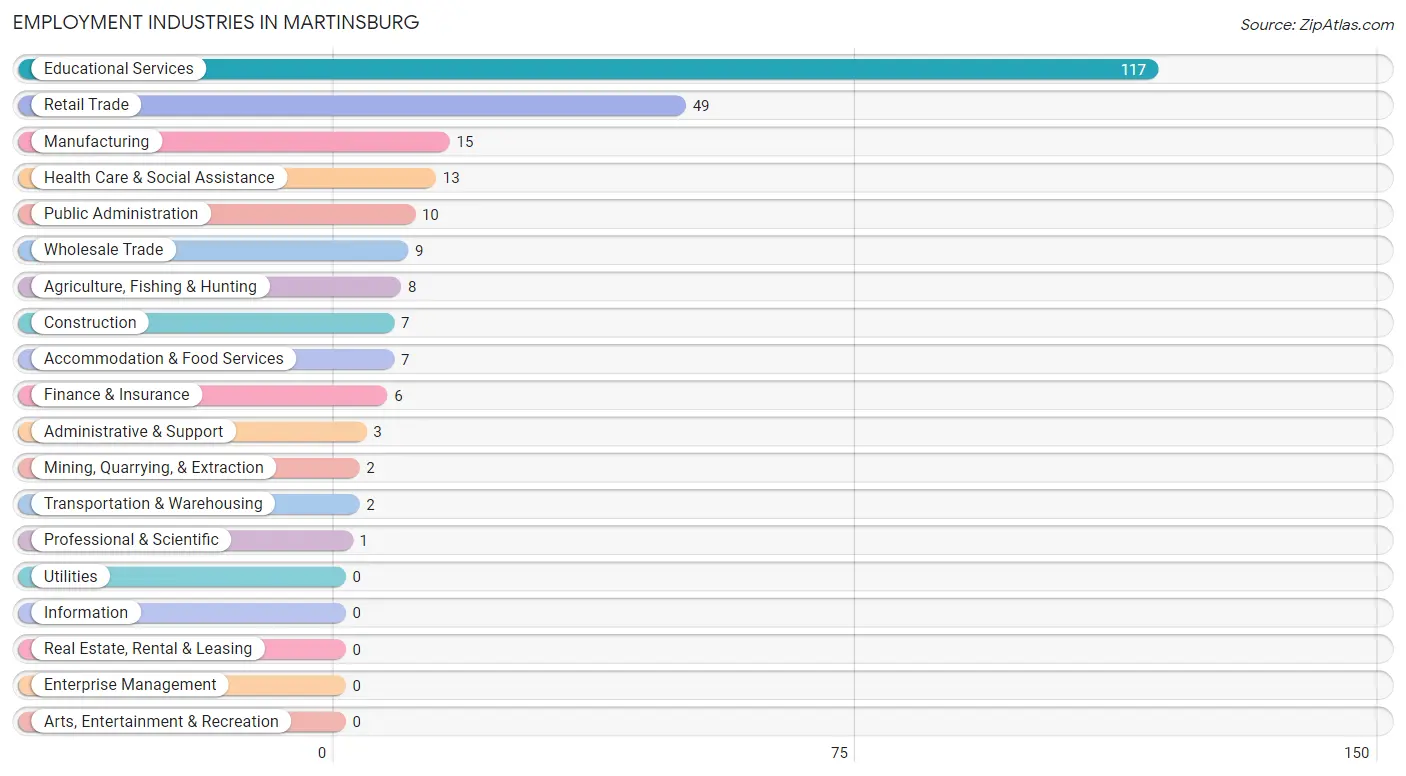
Employment Industries in Martinsburg
The major employment industries in Martinsburg include Educational Services (117 | 46.1%), Retail Trade (49 | 19.3%), Manufacturing (15 | 5.9%), Health Care & Social Assistance (13 | 5.1%), and Public Administration (10 | 3.9%).
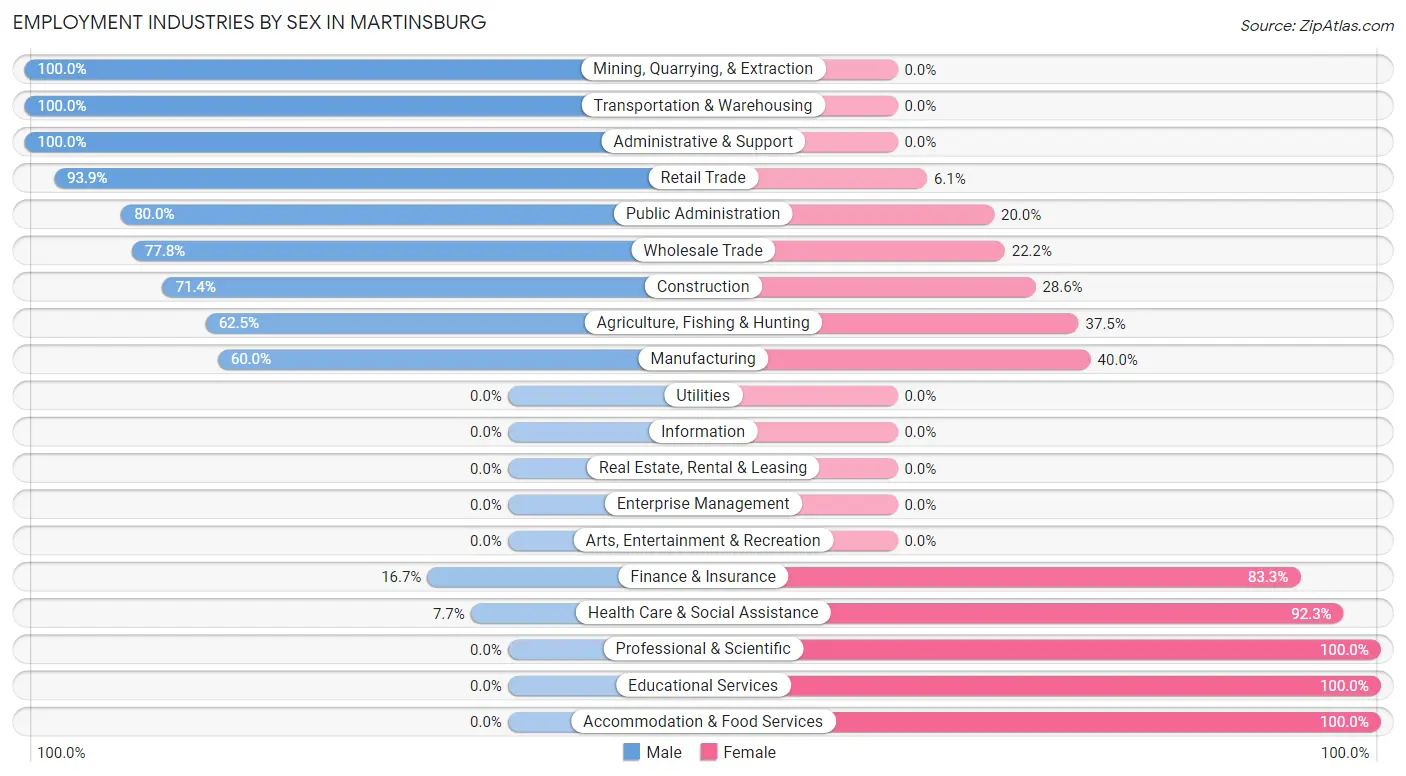
Employment Industries by Sex in Martinsburg
The Martinsburg industries that see more men than women are Mining, Quarrying, & Extraction (100.0%), Transportation & Warehousing (100.0%), and Administrative & Support (100.0%), whereas the industries that tend to have a higher number of women are Professional & Scientific (100.0%), Educational Services (100.0%), and Accommodation & Food Services (100.0%).
| Industry | Male | Female |
| Agriculture, Fishing & Hunting | 5 (62.5%) | 3 (37.5%) |
| Mining, Quarrying, & Extraction | 2 (100.0%) | 0 (0.0%) |
| Construction | 5 (71.4%) | 2 (28.6%) |
| Manufacturing | 9 (60.0%) | 6 (40.0%) |
| Wholesale Trade | 7 (77.8%) | 2 (22.2%) |
| Retail Trade | 46 (93.9%) | 3 (6.1%) |
| Transportation & Warehousing | 2 (100.0%) | 0 (0.0%) |
| Utilities | 0 (0.0%) | 0 (0.0%) |
| Information | 0 (0.0%) | 0 (0.0%) |
| Finance & Insurance | 1 (16.7%) | 5 (83.3%) |
| Real Estate, Rental & Leasing | 0 (0.0%) | 0 (0.0%) |
| Professional & Scientific | 0 (0.0%) | 1 (100.0%) |
| Enterprise Management | 0 (0.0%) | 0 (0.0%) |
| Administrative & Support | 3 (100.0%) | 0 (0.0%) |
| Educational Services | 0 (0.0%) | 117 (100.0%) |
| Health Care & Social Assistance | 1 (7.7%) | 12 (92.3%) |
| Arts, Entertainment & Recreation | 0 (0.0%) | 0 (0.0%) |
| Accommodation & Food Services | 0 (0.0%) | 7 (100.0%) |
| Public Administration | 8 (80.0%) | 2 (20.0%) |
| Total | 89 (35.0%) | 165 (65.0%) |
Education in Martinsburg
School Enrollment in Martinsburg
The most common levels of schooling among the 167 students in Martinsburg are middle school (76 | 45.5%), elementary school (74 | 44.3%), and high school (9 | 5.4%).
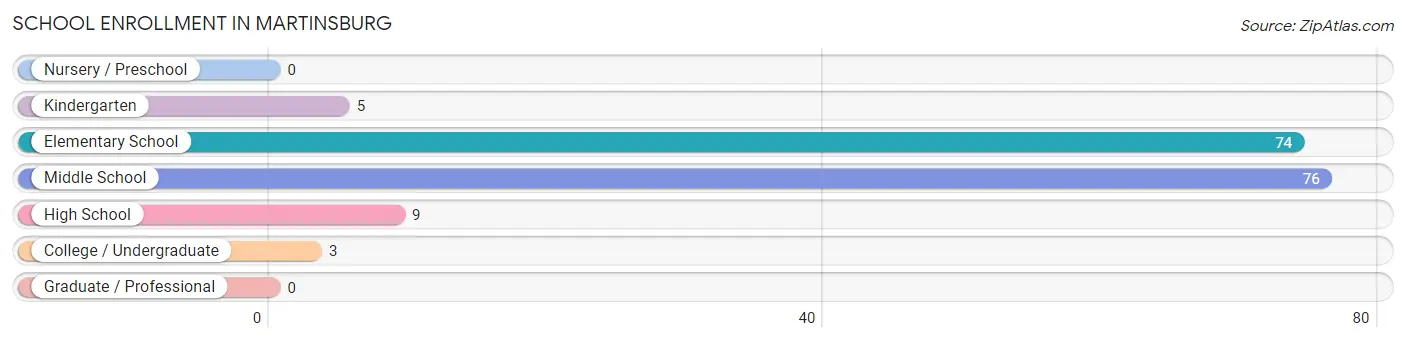
| School Level | # Students | % Students |
| Nursery / Preschool | 0 | 0.0% |
| Kindergarten | 5 | 3.0% |
| Elementary School | 74 | 44.3% |
| Middle School | 76 | 45.5% |
| High School | 9 | 5.4% |
| College / Undergraduate | 3 | 1.8% |
| Graduate / Professional | 0 | 0.0% |
| Total | 167 | 100.0% |
School Enrollment by Age by Funding Source in Martinsburg
Out of a total of 167 students who are enrolled in schools in Martinsburg, 9 (5.4%) attend a private institution, while the remaining 158 (94.6%) are enrolled in public schools. The age group of 5 to 9 year old has the highest likelihood of being enrolled in private schools, with 2 (16.7% in the age bracket) enrolled. Conversely, the age group of 15 to 17 year olds has the lowest likelihood of being enrolled in a private school, with 9 (100.0% in the age bracket) attending a public institution.
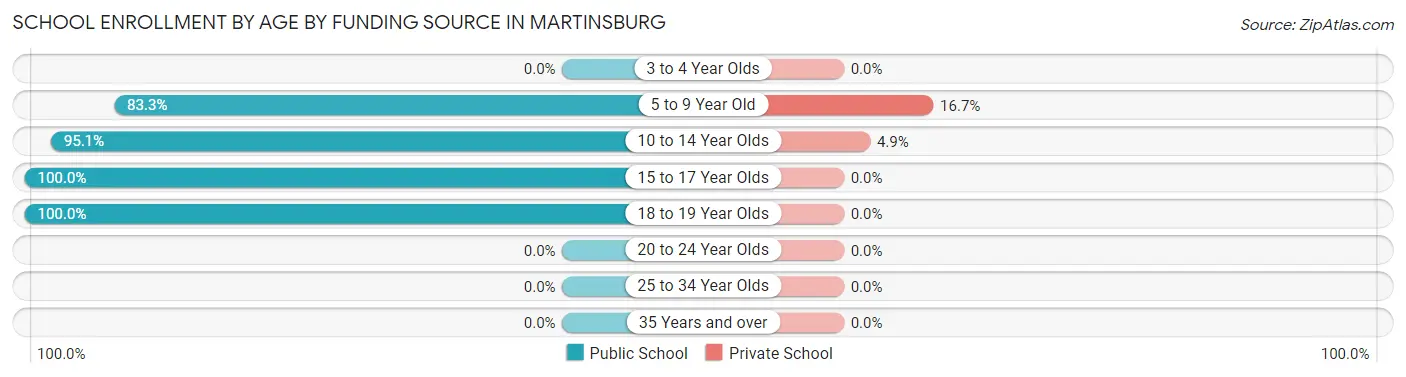
| Age Bracket | Public School | Private School |
| 3 to 4 Year Olds | 0 (0.0%) | 0 (0.0%) |
| 5 to 9 Year Old | 10 (83.3%) | 2 (16.7%) |
| 10 to 14 Year Olds | 136 (95.1%) | 7 (4.9%) |
| 15 to 17 Year Olds | 9 (100.0%) | 0 (0.0%) |
| 18 to 19 Year Olds | 3 (100.0%) | 0 (0.0%) |
| 20 to 24 Year Olds | 0 (0.0%) | 0 (0.0%) |
| 25 to 34 Year Olds | 0 (0.0%) | 0 (0.0%) |
| 35 Years and over | 0 (0.0%) | 0 (0.0%) |
| Total | 158 (94.6%) | 9 (5.4%) |
Educational Attainment by Field of Study in Martinsburg
Bio, nature & agricultural (10 | 27.0%), business (9 | 24.3%), education (7 | 18.9%), arts & humanities (6 | 16.2%), and science & technology (2 | 5.4%) are the most common fields of study among 37 individuals in Martinsburg who have obtained a bachelor's degree or higher.
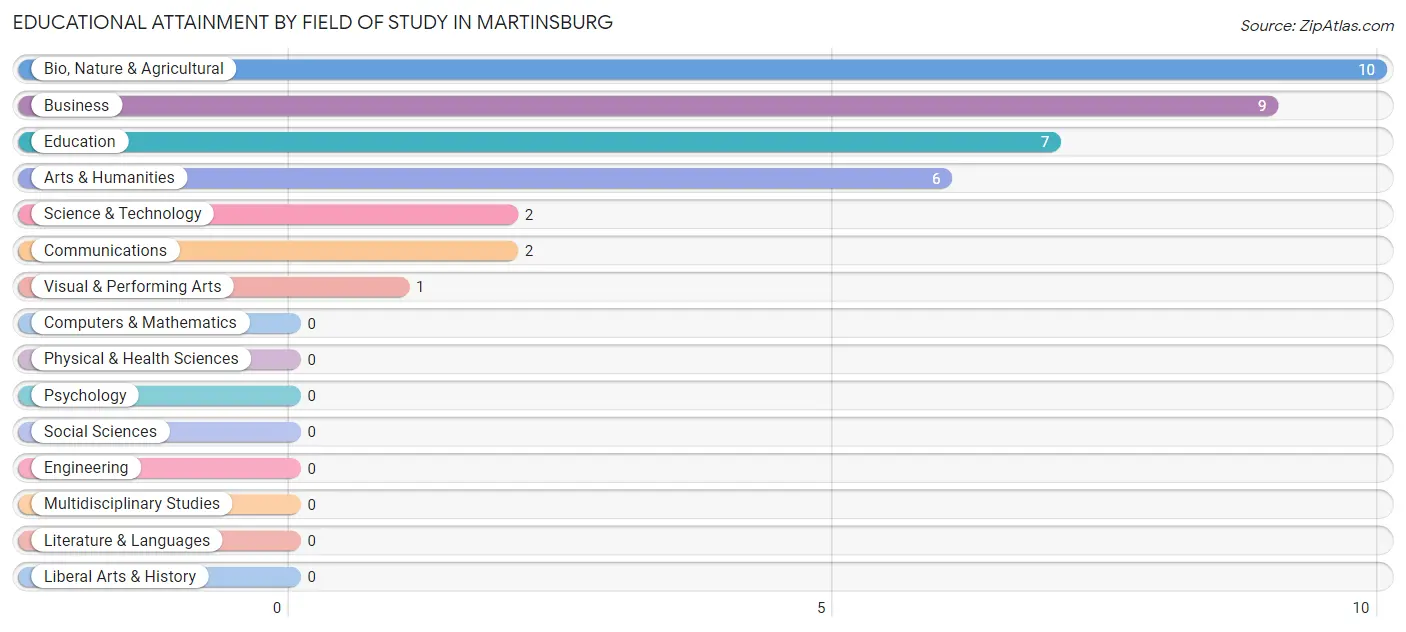
| Field of Study | # Graduates | % Graduates |
| Computers & Mathematics | 0 | 0.0% |
| Bio, Nature & Agricultural | 10 | 27.0% |
| Physical & Health Sciences | 0 | 0.0% |
| Psychology | 0 | 0.0% |
| Social Sciences | 0 | 0.0% |
| Engineering | 0 | 0.0% |
| Multidisciplinary Studies | 0 | 0.0% |
| Science & Technology | 2 | 5.4% |
| Business | 9 | 24.3% |
| Education | 7 | 18.9% |
| Literature & Languages | 0 | 0.0% |
| Liberal Arts & History | 0 | 0.0% |
| Visual & Performing Arts | 1 | 2.7% |
| Communications | 2 | 5.4% |
| Arts & Humanities | 6 | 16.2% |
| Total | 37 | 100.0% |
Transportation & Commute in Martinsburg
Vehicle Availability by Sex in Martinsburg
The most prevalent vehicle ownership categories in Martinsburg are males with 4 vehicles (41, accounting for 44.6%) and females with 4 vehicles (105, making up 25.0%).
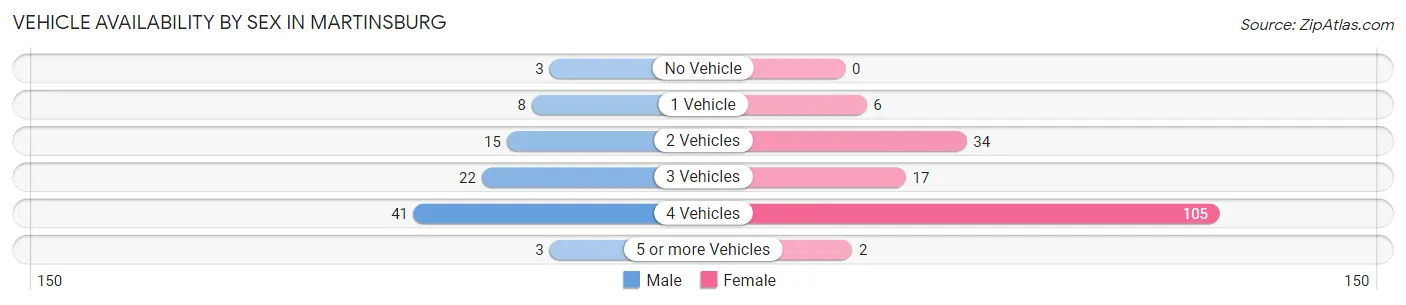
| Vehicles Available | Male | Female |
| No Vehicle | 3 (3.3%) | 0 (0.0%) |
| 1 Vehicle | 8 (8.7%) | 6 (3.7%) |
| 2 Vehicles | 15 (16.3%) | 34 (20.7%) |
| 3 Vehicles | 22 (23.9%) | 17 (10.4%) |
| 4 Vehicles | 41 (44.6%) | 105 (64.0%) |
| 5 or more Vehicles | 3 (3.3%) | 2 (1.2%) |
| Total | 92 (100.0%) | 164 (100.0%) |
Commute Time in Martinsburg
The most frequently occuring commute durations in Martinsburg are 5 to 9 minutes (125 commuters, 50.4%), 10 to 14 minutes (35 commuters, 14.1%), and 30 to 34 minutes (20 commuters, 8.1%).
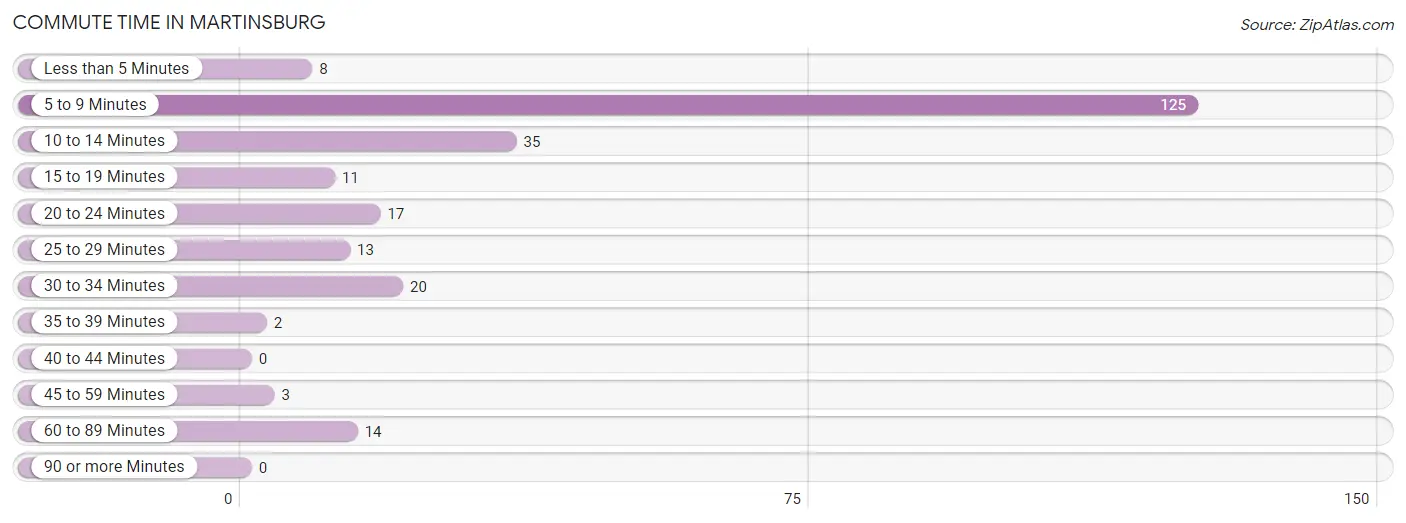
| Commute Time | # Commuters | % Commuters |
| Less than 5 Minutes | 8 | 3.2% |
| 5 to 9 Minutes | 125 | 50.4% |
| 10 to 14 Minutes | 35 | 14.1% |
| 15 to 19 Minutes | 11 | 4.4% |
| 20 to 24 Minutes | 17 | 6.9% |
| 25 to 29 Minutes | 13 | 5.2% |
| 30 to 34 Minutes | 20 | 8.1% |
| 35 to 39 Minutes | 2 | 0.8% |
| 40 to 44 Minutes | 0 | 0.0% |
| 45 to 59 Minutes | 3 | 1.2% |
| 60 to 89 Minutes | 14 | 5.7% |
| 90 or more Minutes | 0 | 0.0% |
Commute Time by Sex in Martinsburg
The most common commute times in Martinsburg are 10 to 14 minutes (33 commuters, 37.1%) for males and 5 to 9 minutes (110 commuters, 69.2%) for females.
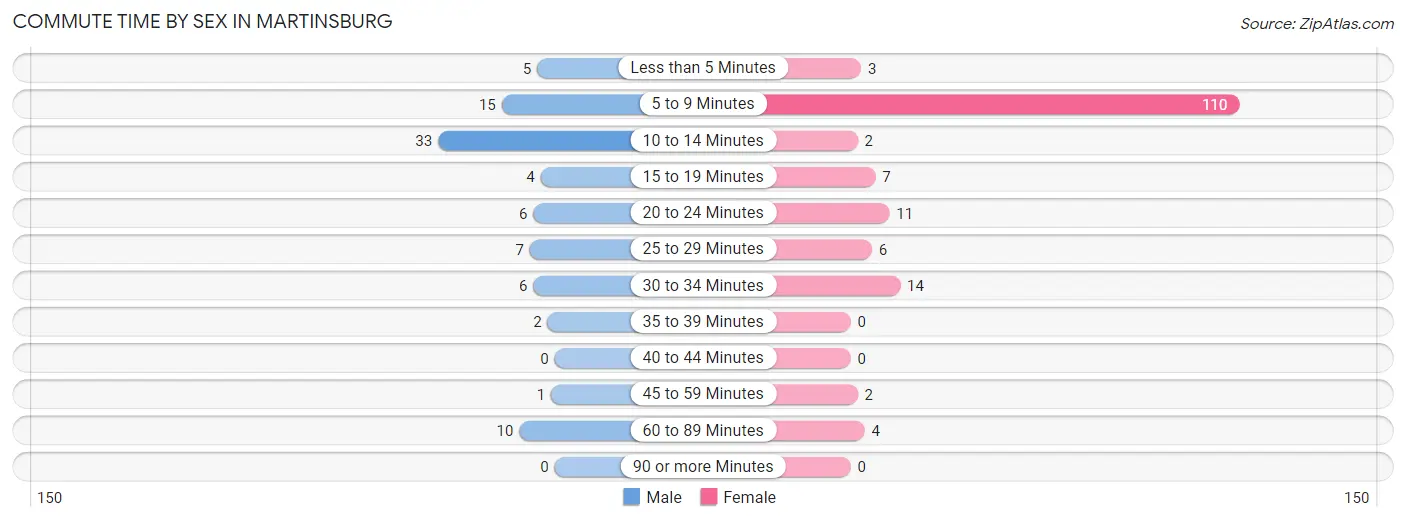
| Commute Time | Male | Female |
| Less than 5 Minutes | 5 (5.6%) | 3 (1.9%) |
| 5 to 9 Minutes | 15 (16.9%) | 110 (69.2%) |
| 10 to 14 Minutes | 33 (37.1%) | 2 (1.3%) |
| 15 to 19 Minutes | 4 (4.5%) | 7 (4.4%) |
| 20 to 24 Minutes | 6 (6.7%) | 11 (6.9%) |
| 25 to 29 Minutes | 7 (7.9%) | 6 (3.8%) |
| 30 to 34 Minutes | 6 (6.7%) | 14 (8.8%) |
| 35 to 39 Minutes | 2 (2.2%) | 0 (0.0%) |
| 40 to 44 Minutes | 0 (0.0%) | 0 (0.0%) |
| 45 to 59 Minutes | 1 (1.1%) | 2 (1.3%) |
| 60 to 89 Minutes | 10 (11.2%) | 4 (2.5%) |
| 90 or more Minutes | 0 (0.0%) | 0 (0.0%) |
Time of Departure to Work by Sex in Martinsburg
The most frequent times of departure to work in Martinsburg are 6:30 AM to 6:59 AM (23, 25.8%) for males and 7:30 AM to 7:59 AM (110, 69.2%) for females.
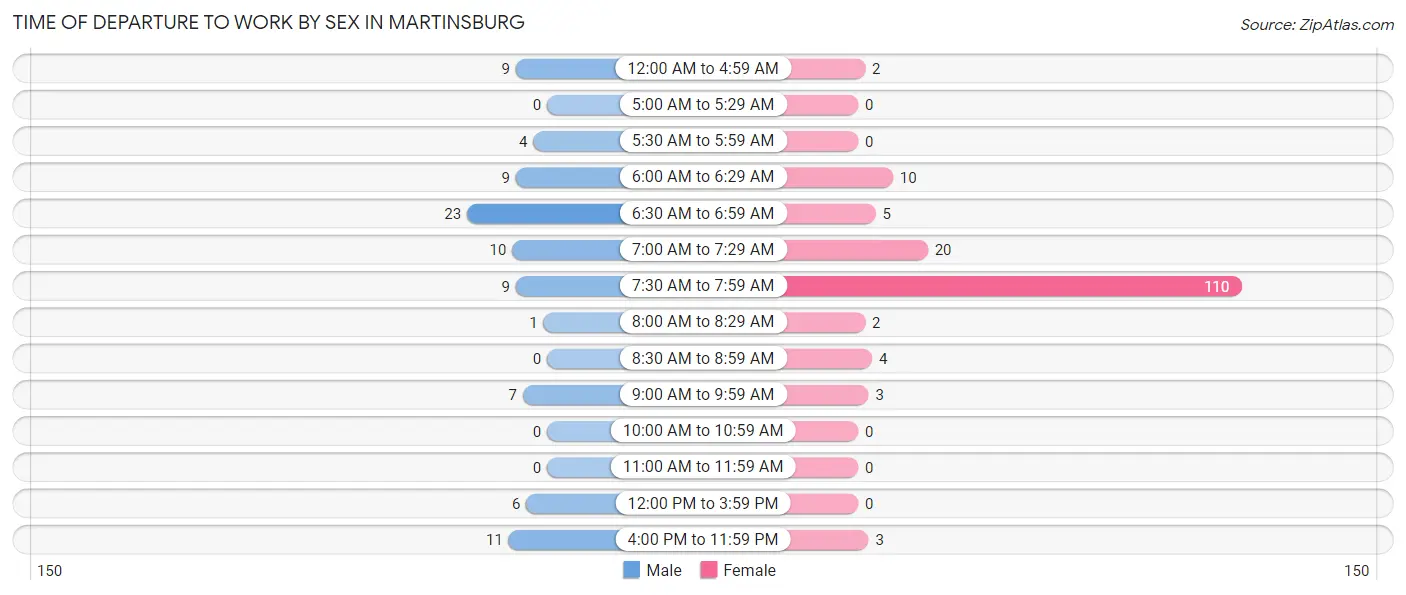
| Time of Departure | Male | Female |
| 12:00 AM to 4:59 AM | 9 (10.1%) | 2 (1.3%) |
| 5:00 AM to 5:29 AM | 0 (0.0%) | 0 (0.0%) |
| 5:30 AM to 5:59 AM | 4 (4.5%) | 0 (0.0%) |
| 6:00 AM to 6:29 AM | 9 (10.1%) | 10 (6.3%) |
| 6:30 AM to 6:59 AM | 23 (25.8%) | 5 (3.1%) |
| 7:00 AM to 7:29 AM | 10 (11.2%) | 20 (12.6%) |
| 7:30 AM to 7:59 AM | 9 (10.1%) | 110 (69.2%) |
| 8:00 AM to 8:29 AM | 1 (1.1%) | 2 (1.3%) |
| 8:30 AM to 8:59 AM | 0 (0.0%) | 4 (2.5%) |
| 9:00 AM to 9:59 AM | 7 (7.9%) | 3 (1.9%) |
| 10:00 AM to 10:59 AM | 0 (0.0%) | 0 (0.0%) |
| 11:00 AM to 11:59 AM | 0 (0.0%) | 0 (0.0%) |
| 12:00 PM to 3:59 PM | 6 (6.7%) | 0 (0.0%) |
| 4:00 PM to 11:59 PM | 11 (12.4%) | 3 (1.9%) |
| Total | 89 (100.0%) | 159 (100.0%) |
Housing Occupancy in Martinsburg
Occupancy by Ownership in Martinsburg
Of the total 207 dwellings in Martinsburg, owner-occupied units account for 179 (86.5%), while renter-occupied units make up 28 (13.5%).
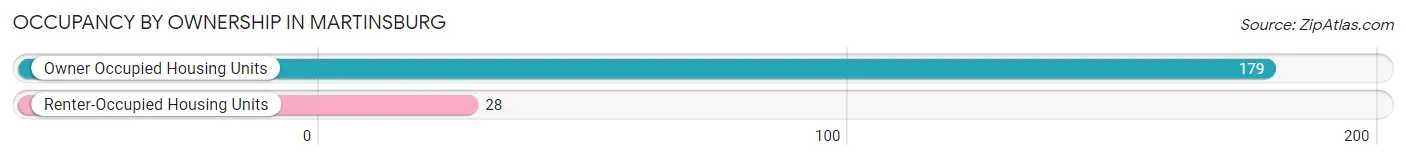
| Occupancy | # Housing Units | % Housing Units |
| Owner Occupied Housing Units | 179 | 86.5% |
| Renter-Occupied Housing Units | 28 | 13.5% |
| Total Occupied Housing Units | 207 | 100.0% |
Occupancy by Household Size in Martinsburg
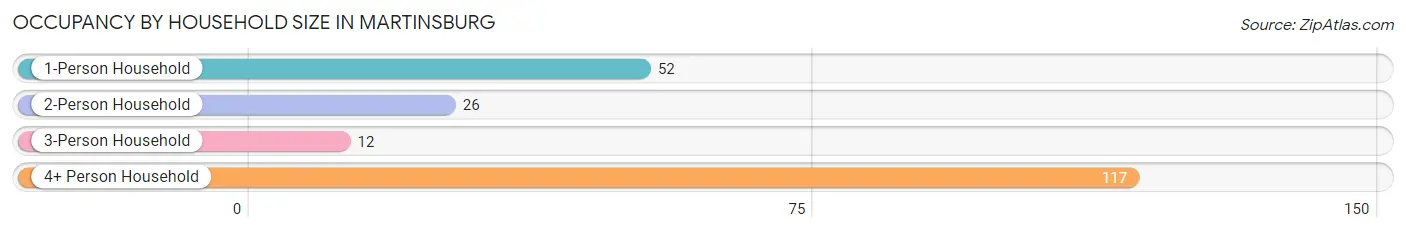
| Household Size | # Housing Units | % Housing Units |
| 1-Person Household | 52 | 25.1% |
| 2-Person Household | 26 | 12.6% |
| 3-Person Household | 12 | 5.8% |
| 4+ Person Household | 117 | 56.5% |
| Total Housing Units | 207 | 100.0% |
Occupancy by Ownership by Household Size in Martinsburg
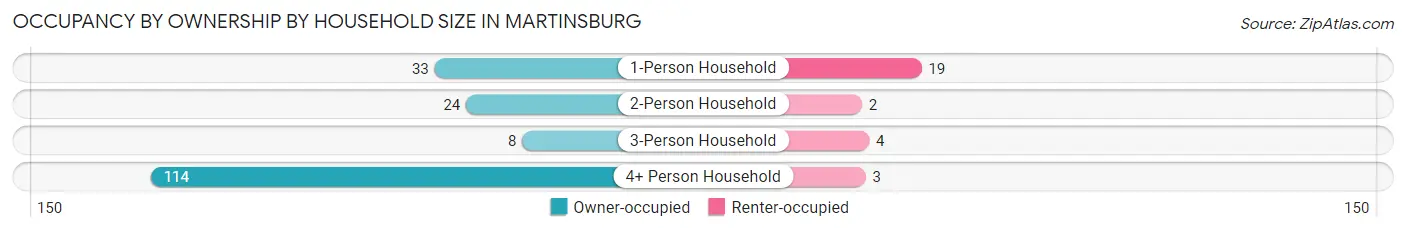
| Household Size | Owner-occupied | Renter-occupied |
| 1-Person Household | 33 (63.5%) | 19 (36.5%) |
| 2-Person Household | 24 (92.3%) | 2 (7.7%) |
| 3-Person Household | 8 (66.7%) | 4 (33.3%) |
| 4+ Person Household | 114 (97.4%) | 3 (2.6%) |
| Total Housing Units | 179 (86.5%) | 28 (13.5%) |
Occupancy by Educational Attainment in Martinsburg
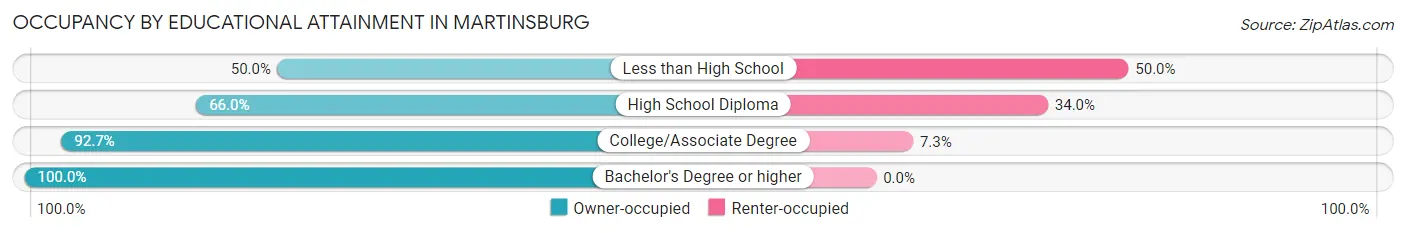
| Household Size | Owner-occupied | Renter-occupied |
| Less than High School | 2 (50.0%) | 2 (50.0%) |
| High School Diploma | 31 (66.0%) | 16 (34.0%) |
| College/Associate Degree | 127 (92.7%) | 10 (7.3%) |
| Bachelor's Degree or higher | 19 (100.0%) | 0 (0.0%) |
Occupancy by Age of Householder in Martinsburg
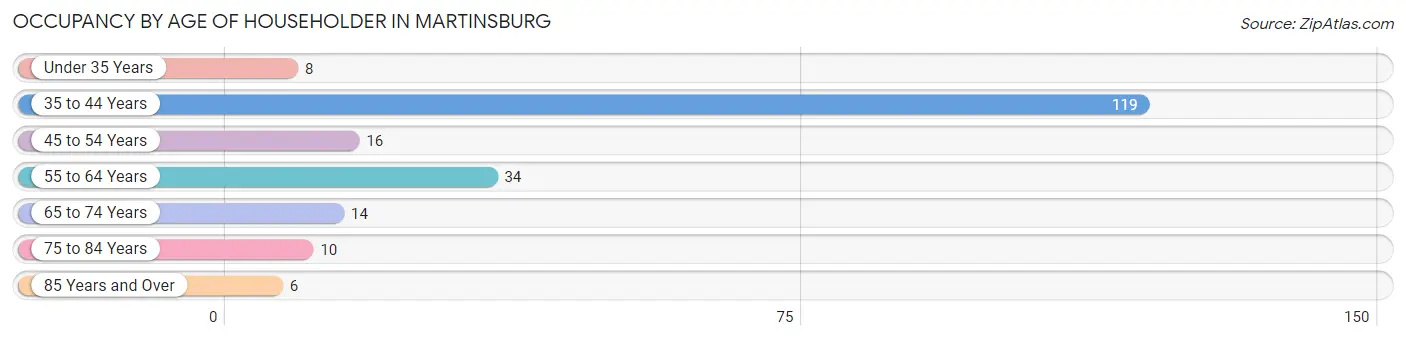
| Age Bracket | # Households | % Households |
| Under 35 Years | 8 | 3.9% |
| 35 to 44 Years | 119 | 57.5% |
| 45 to 54 Years | 16 | 7.7% |
| 55 to 64 Years | 34 | 16.4% |
| 65 to 74 Years | 14 | 6.8% |
| 75 to 84 Years | 10 | 4.8% |
| 85 Years and Over | 6 | 2.9% |
| Total | 207 | 100.0% |
Housing Finances in Martinsburg
Median Income by Occupancy in Martinsburg
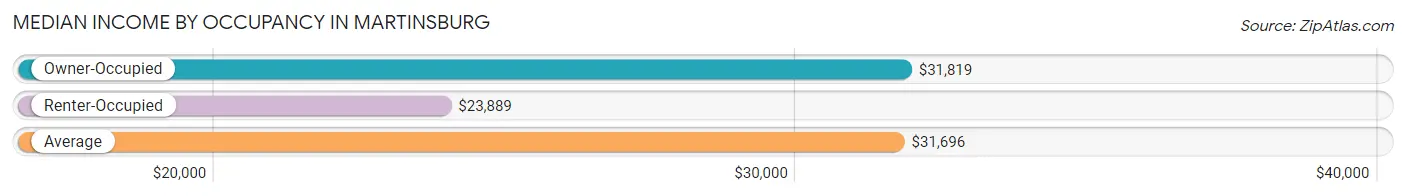
| Occupancy Type | # Households | Median Income |
| Owner-Occupied | 179 (86.5%) | $31,819 |
| Renter-Occupied | 28 (13.5%) | $23,889 |
| Average | 207 (100.0%) | $31,696 |
Occupancy by Householder Income Bracket in Martinsburg
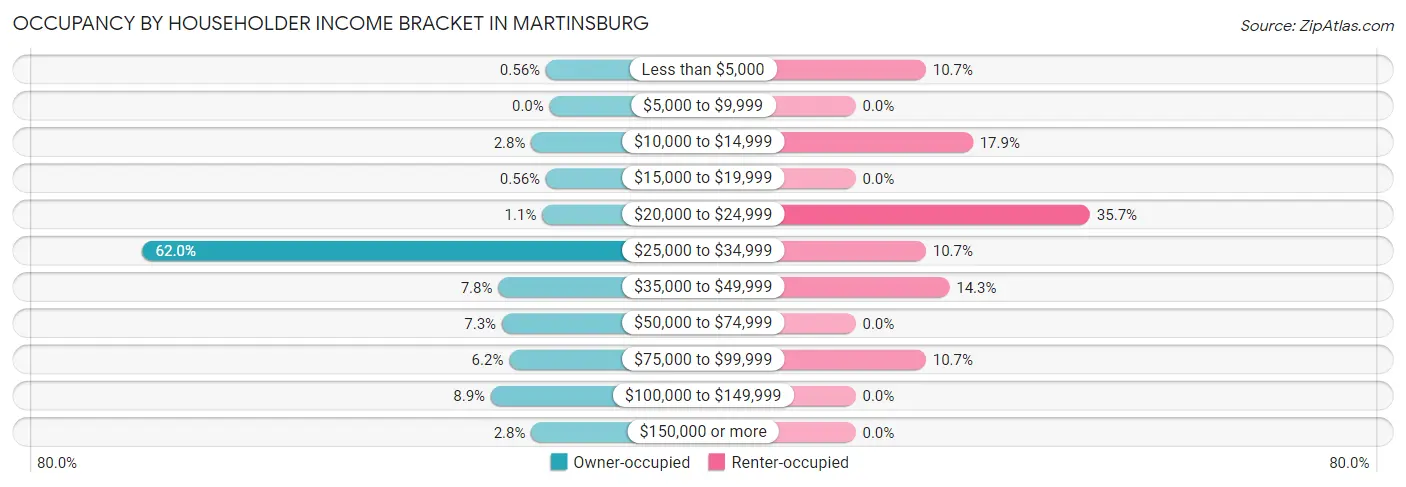
| Income Bracket | Owner-occupied | Renter-occupied |
| Less than $5,000 | 1 (0.6%) | 3 (10.7%) |
| $5,000 to $9,999 | 0 (0.0%) | 0 (0.0%) |
| $10,000 to $14,999 | 5 (2.8%) | 5 (17.9%) |
| $15,000 to $19,999 | 1 (0.6%) | 0 (0.0%) |
| $20,000 to $24,999 | 2 (1.1%) | 10 (35.7%) |
| $25,000 to $34,999 | 111 (62.0%) | 3 (10.7%) |
| $35,000 to $49,999 | 14 (7.8%) | 4 (14.3%) |
| $50,000 to $74,999 | 13 (7.3%) | 0 (0.0%) |
| $75,000 to $99,999 | 11 (6.1%) | 3 (10.7%) |
| $100,000 to $149,999 | 16 (8.9%) | 0 (0.0%) |
| $150,000 or more | 5 (2.8%) | 0 (0.0%) |
| Total | 179 (100.0%) | 28 (100.0%) |
Monthly Housing Cost Tiers in Martinsburg
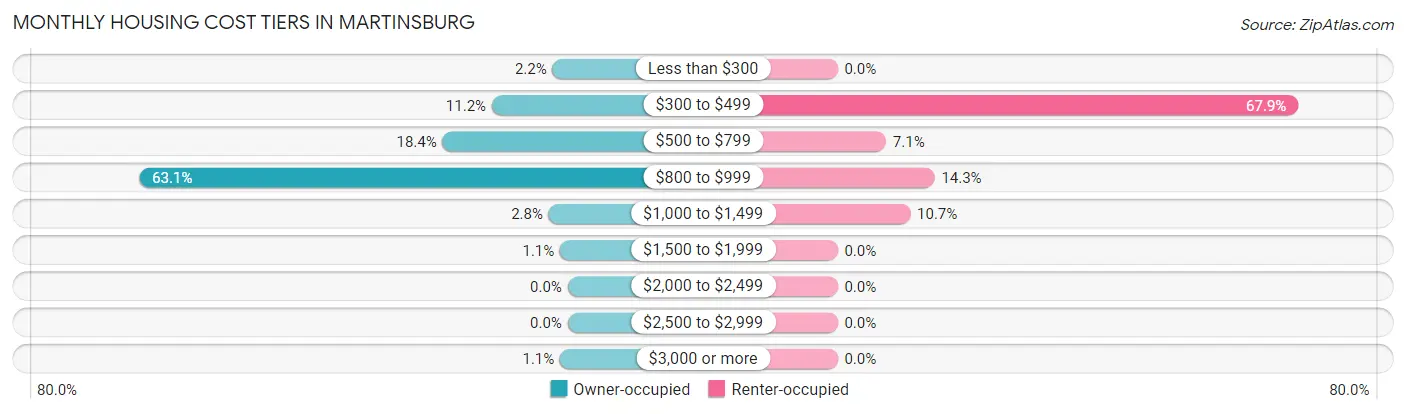
| Monthly Cost | Owner-occupied | Renter-occupied |
| Less than $300 | 4 (2.2%) | 0 (0.0%) |
| $300 to $499 | 20 (11.2%) | 19 (67.9%) |
| $500 to $799 | 33 (18.4%) | 2 (7.1%) |
| $800 to $999 | 113 (63.1%) | 4 (14.3%) |
| $1,000 to $1,499 | 5 (2.8%) | 3 (10.7%) |
| $1,500 to $1,999 | 2 (1.1%) | 0 (0.0%) |
| $2,000 to $2,499 | 0 (0.0%) | 0 (0.0%) |
| $2,500 to $2,999 | 0 (0.0%) | 0 (0.0%) |
| $3,000 or more | 2 (1.1%) | 0 (0.0%) |
| Total | 179 (100.0%) | 28 (100.0%) |
Physical Housing Characteristics in Martinsburg
Housing Structures in Martinsburg
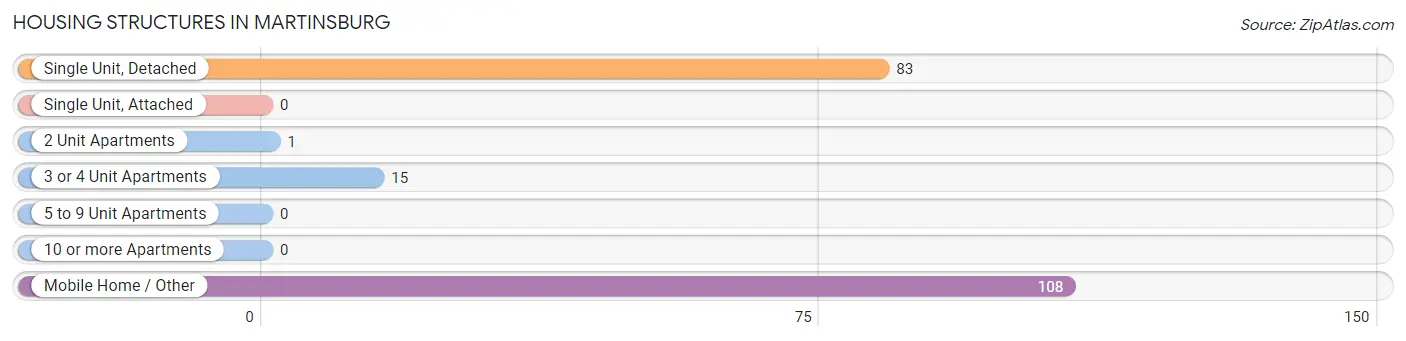
| Structure Type | # Housing Units | % Housing Units |
| Single Unit, Detached | 83 | 40.1% |
| Single Unit, Attached | 0 | 0.0% |
| 2 Unit Apartments | 1 | 0.5% |
| 3 or 4 Unit Apartments | 15 | 7.2% |
| 5 to 9 Unit Apartments | 0 | 0.0% |
| 10 or more Apartments | 0 | 0.0% |
| Mobile Home / Other | 108 | 52.2% |
| Total | 207 | 100.0% |
Housing Structures by Occupancy in Martinsburg
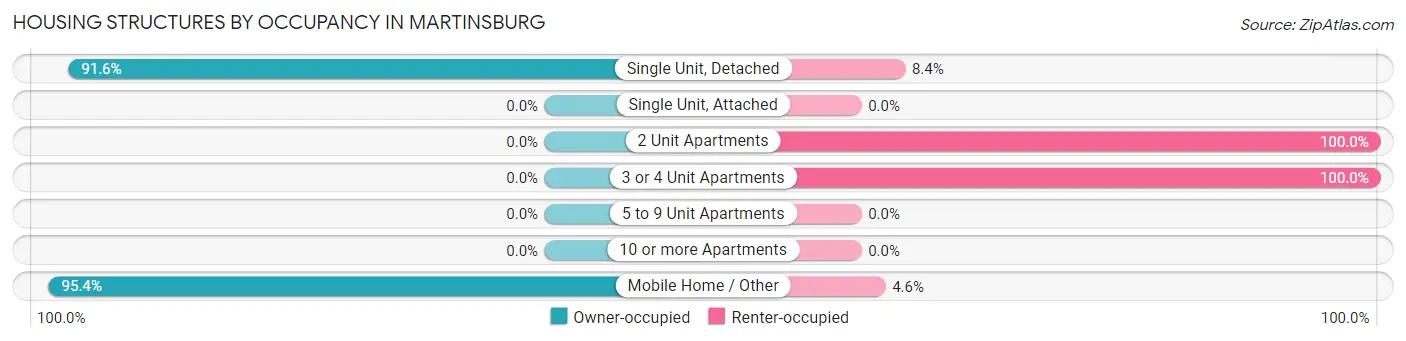
| Structure Type | Owner-occupied | Renter-occupied |
| Single Unit, Detached | 76 (91.6%) | 7 (8.4%) |
| Single Unit, Attached | 0 (0.0%) | 0 (0.0%) |
| 2 Unit Apartments | 0 (0.0%) | 1 (100.0%) |
| 3 or 4 Unit Apartments | 0 (0.0%) | 15 (100.0%) |
| 5 to 9 Unit Apartments | 0 (0.0%) | 0 (0.0%) |
| 10 or more Apartments | 0 (0.0%) | 0 (0.0%) |
| Mobile Home / Other | 103 (95.4%) | 5 (4.6%) |
| Total | 179 (86.5%) | 28 (13.5%) |
Housing Structures by Number of Rooms in Martinsburg
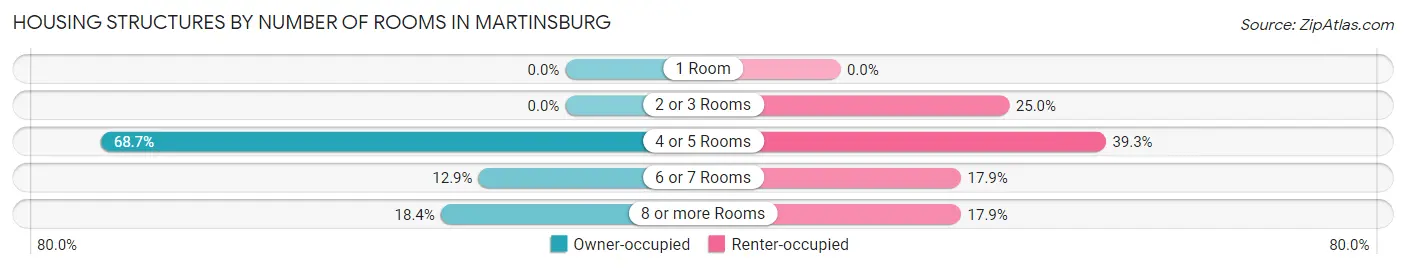
| Number of Rooms | Owner-occupied | Renter-occupied |
| 1 Room | 0 (0.0%) | 0 (0.0%) |
| 2 or 3 Rooms | 0 (0.0%) | 7 (25.0%) |
| 4 or 5 Rooms | 123 (68.7%) | 11 (39.3%) |
| 6 or 7 Rooms | 23 (12.9%) | 5 (17.9%) |
| 8 or more Rooms | 33 (18.4%) | 5 (17.9%) |
| Total | 179 (100.0%) | 28 (100.0%) |
Housing Structure by Heating Type in Martinsburg

| Heating Type | Owner-occupied | Renter-occupied |
| Utility Gas | 42 (23.5%) | 1 (3.6%) |
| Bottled, Tank, or LP Gas | 6 (3.4%) | 2 (7.1%) |
| Electricity | 126 (70.4%) | 24 (85.7%) |
| Fuel Oil or Kerosene | 0 (0.0%) | 0 (0.0%) |
| Coal or Coke | 0 (0.0%) | 0 (0.0%) |
| All other Fuels | 5 (2.8%) | 1 (3.6%) |
| No Fuel Used | 0 (0.0%) | 0 (0.0%) |
| Total | 179 (100.0%) | 28 (100.0%) |
Household Vehicle Usage in Martinsburg
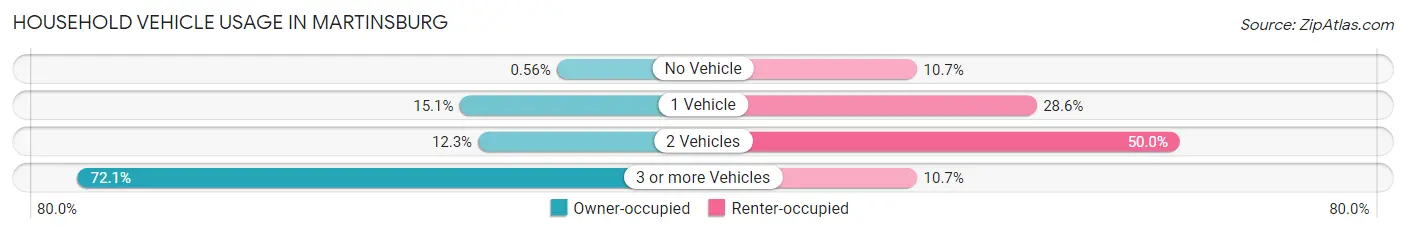
| Vehicles per Household | Owner-occupied | Renter-occupied |
| No Vehicle | 1 (0.6%) | 3 (10.7%) |
| 1 Vehicle | 27 (15.1%) | 8 (28.6%) |
| 2 Vehicles | 22 (12.3%) | 14 (50.0%) |
| 3 or more Vehicles | 129 (72.1%) | 3 (10.7%) |
| Total | 179 (100.0%) | 28 (100.0%) |
Real Estate & Mortgages in Martinsburg
Real Estate and Mortgage Overview in Martinsburg
| Characteristic | Without Mortgage | With Mortgage |
| Housing Units | 46 | 133 |
| Median Property Value | $182,700 | $23,300 |
| Median Household Income | $48,750 | $2 |
| Monthly Housing Costs | $490 | $0 |
| Real Estate Taxes | $1,100 | $0 |
Property Value by Mortgage Status in Martinsburg
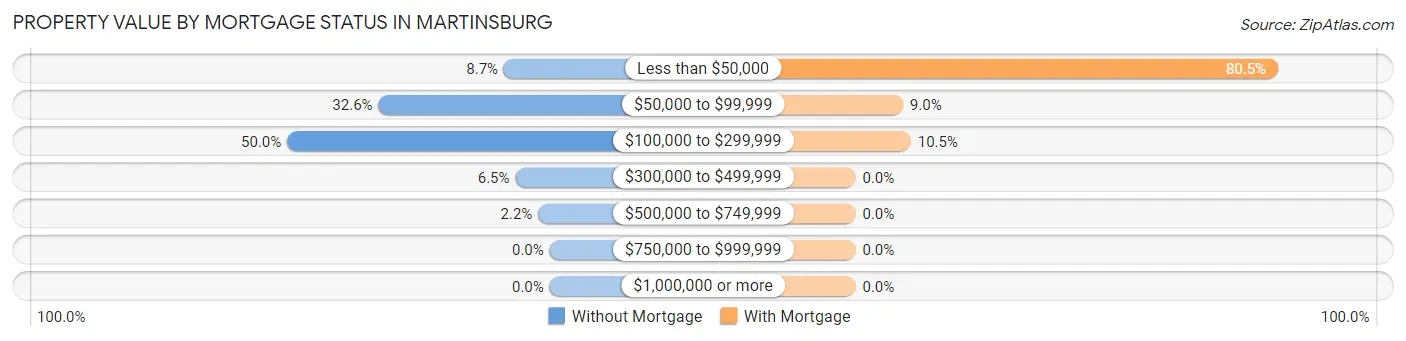
| Property Value | Without Mortgage | With Mortgage |
| Less than $50,000 | 4 (8.7%) | 107 (80.4%) |
| $50,000 to $99,999 | 15 (32.6%) | 12 (9.0%) |
| $100,000 to $299,999 | 23 (50.0%) | 14 (10.5%) |
| $300,000 to $499,999 | 3 (6.5%) | 0 (0.0%) |
| $500,000 to $749,999 | 1 (2.2%) | 0 (0.0%) |
| $750,000 to $999,999 | 0 (0.0%) | 0 (0.0%) |
| $1,000,000 or more | 0 (0.0%) | 0 (0.0%) |
| Total | 46 (100.0%) | 133 (100.0%) |
Household Income by Mortgage Status in Martinsburg
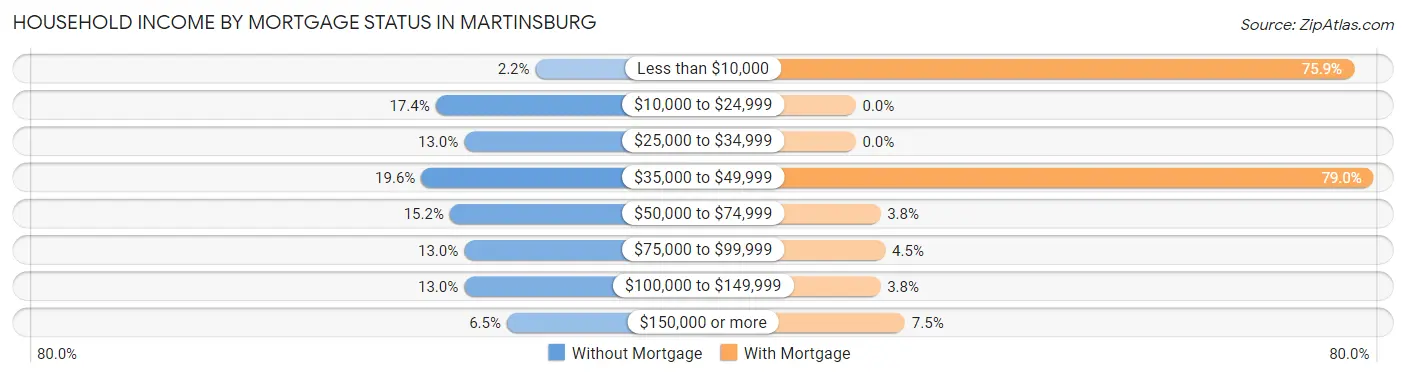
| Household Income | Without Mortgage | With Mortgage |
| Less than $10,000 | 1 (2.2%) | 101 (75.9%) |
| $10,000 to $24,999 | 8 (17.4%) | 0 (0.0%) |
| $25,000 to $34,999 | 6 (13.0%) | 0 (0.0%) |
| $35,000 to $49,999 | 9 (19.6%) | 105 (78.9%) |
| $50,000 to $74,999 | 7 (15.2%) | 5 (3.8%) |
| $75,000 to $99,999 | 6 (13.0%) | 6 (4.5%) |
| $100,000 to $149,999 | 6 (13.0%) | 5 (3.8%) |
| $150,000 or more | 3 (6.5%) | 10 (7.5%) |
| Total | 46 (100.0%) | 133 (100.0%) |
Property Value to Household Income Ratio in Martinsburg
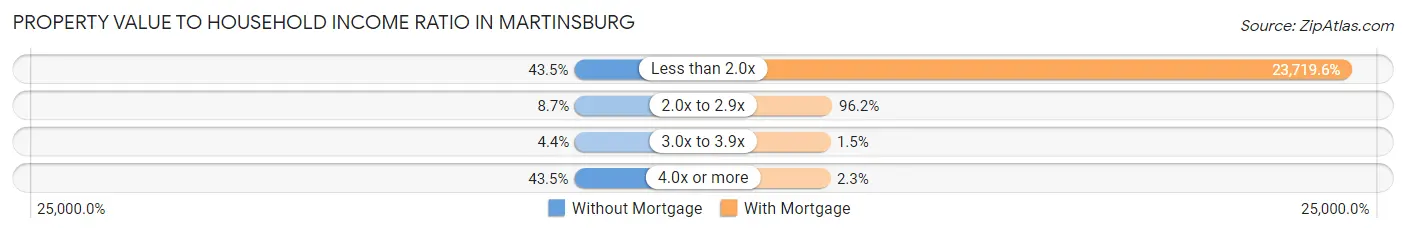
| Value-to-Income Ratio | Without Mortgage | With Mortgage |
| Less than 2.0x | 20 (43.5%) | 31,547 (23,719.6%) |
| 2.0x to 2.9x | 4 (8.7%) | 128 (96.2%) |
| 3.0x to 3.9x | 2 (4.3%) | 2 (1.5%) |
| 4.0x or more | 20 (43.5%) | 3 (2.3%) |
| Total | 46 (100.0%) | 133 (100.0%) |
Real Estate Taxes by Mortgage Status in Martinsburg
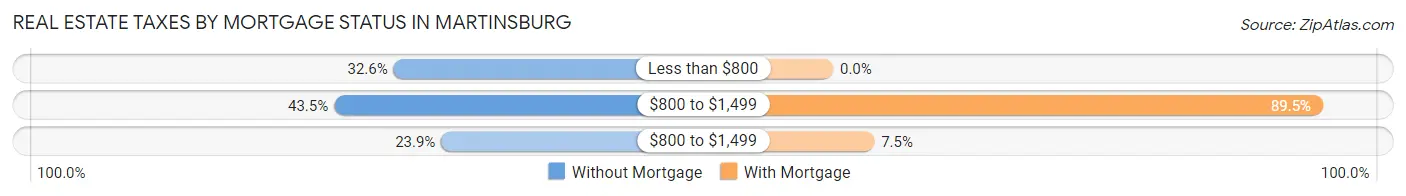
| Property Taxes | Without Mortgage | With Mortgage |
| Less than $800 | 15 (32.6%) | 0 (0.0%) |
| $800 to $1,499 | 20 (43.5%) | 119 (89.5%) |
| $800 to $1,499 | 11 (23.9%) | 10 (7.5%) |
| Total | 46 (100.0%) | 133 (100.0%) |
Health & Disability in Martinsburg
Health Insurance Coverage by Age in Martinsburg
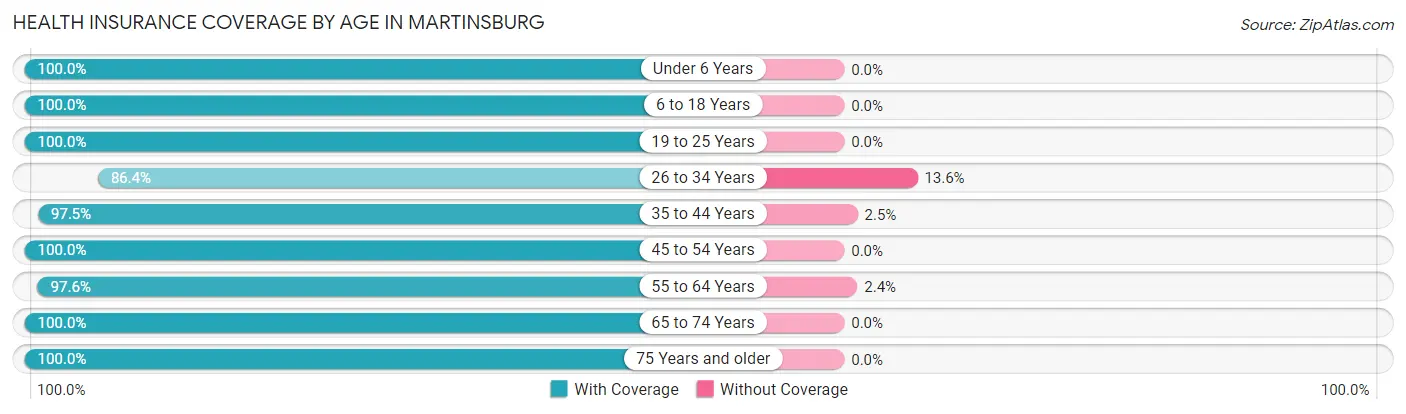
| Age Bracket | With Coverage | Without Coverage |
| Under 6 Years | 12 (100.0%) | 0 (0.0%) |
| 6 to 18 Years | 161 (100.0%) | 0 (0.0%) |
| 19 to 25 Years | 26 (100.0%) | 0 (0.0%) |
| 26 to 34 Years | 19 (86.4%) | 3 (13.6%) |
| 35 to 44 Years | 118 (97.5%) | 3 (2.5%) |
| 45 to 54 Years | 58 (100.0%) | 0 (0.0%) |
| 55 to 64 Years | 40 (97.6%) | 1 (2.4%) |
| 65 to 74 Years | 96 (100.0%) | 0 (0.0%) |
| 75 Years and older | 18 (100.0%) | 0 (0.0%) |
| Total | 548 (98.7%) | 7 (1.3%) |
Health Insurance Coverage by Citizenship Status in Martinsburg
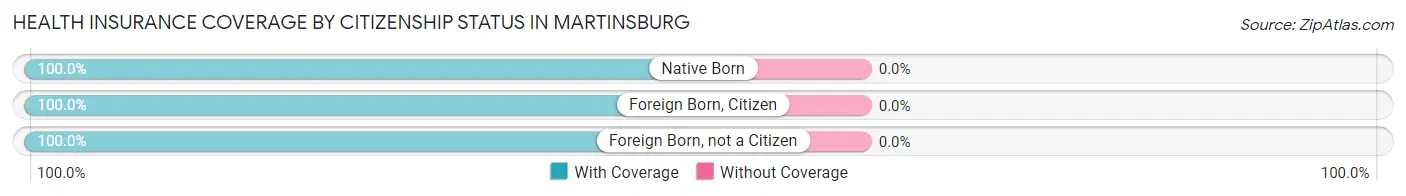
| Citizenship Status | With Coverage | Without Coverage |
| Native Born | 12 (100.0%) | 0 (0.0%) |
| Foreign Born, Citizen | 161 (100.0%) | 0 (0.0%) |
| Foreign Born, not a Citizen | 26 (100.0%) | 0 (0.0%) |
Health Insurance Coverage by Household Income in Martinsburg
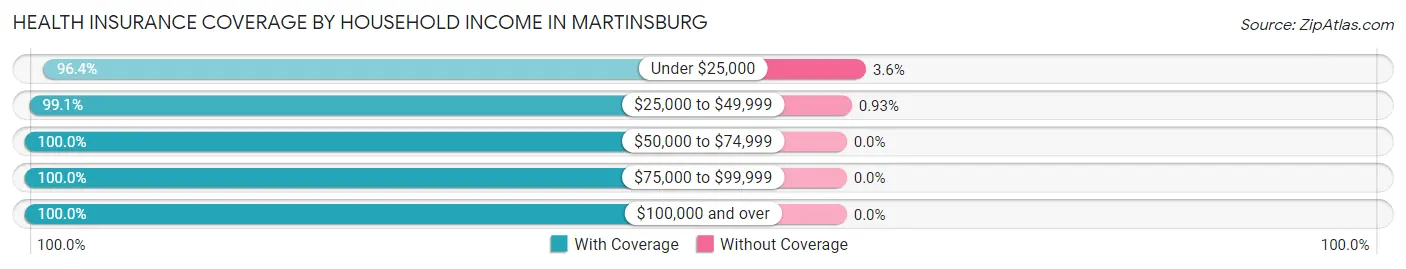
| Household Income | With Coverage | Without Coverage |
| Under $25,000 | 107 (96.4%) | 4 (3.6%) |
| $25,000 to $49,999 | 319 (99.1%) | 3 (0.9%) |
| $50,000 to $74,999 | 17 (100.0%) | 0 (0.0%) |
| $75,000 to $99,999 | 26 (100.0%) | 0 (0.0%) |
| $100,000 and over | 79 (100.0%) | 0 (0.0%) |
Public vs Private Health Insurance Coverage by Age in Martinsburg

| Age Bracket | Public Insurance | Private Insurance |
| Under 6 | 0 (0.0%) | 12 (100.0%) |
| 6 to 18 Years | 9 (5.6%) | 152 (94.4%) |
| 19 to 25 Years | 3 (11.5%) | 23 (88.5%) |
| 25 to 34 Years | 0 (0.0%) | 19 (86.4%) |
| 35 to 44 Years | 5 (4.1%) | 115 (95.0%) |
| 45 to 54 Years | 0 (0.0%) | 58 (100.0%) |
| 55 to 64 Years | 10 (24.4%) | 30 (73.2%) |
| 65 to 74 Years | 96 (100.0%) | 6 (6.2%) |
| 75 Years and over | 18 (100.0%) | 8 (44.4%) |
| Total | 141 (25.4%) | 423 (76.2%) |
Disability Status by Sex by Age in Martinsburg
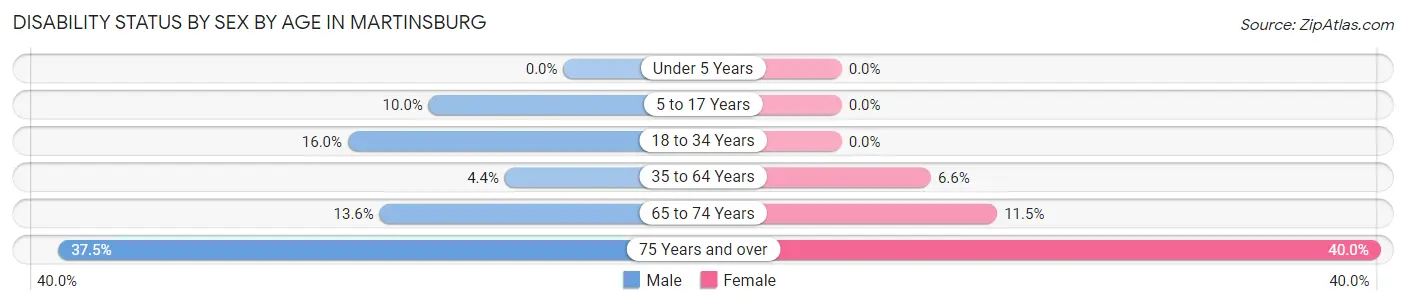
| Age Bracket | Male | Female |
| Under 5 Years | 0 (0.0%) | 0 (0.0%) |
| 5 to 17 Years | 2 (10.0%) | 0 (0.0%) |
| 18 to 34 Years | 4 (16.0%) | 0 (0.0%) |
| 35 to 64 Years | 3 (4.3%) | 10 (6.6%) |
| 65 to 74 Years | 6 (13.6%) | 6 (11.5%) |
| 75 Years and over | 3 (37.5%) | 4 (40.0%) |
Disability Class by Sex by Age in Martinsburg
Disability Class: Hearing Difficulty

| Age Bracket | Male | Female |
| Under 5 Years | 0 (0.0%) | 0 (0.0%) |
| 5 to 17 Years | 2 (10.0%) | 0 (0.0%) |
| 18 to 34 Years | 0 (0.0%) | 0 (0.0%) |
| 35 to 64 Years | 3 (4.3%) | 0 (0.0%) |
| 65 to 74 Years | 1 (2.3%) | 1 (1.9%) |
| 75 Years and over | 3 (37.5%) | 1 (10.0%) |
Disability Class: Vision Difficulty
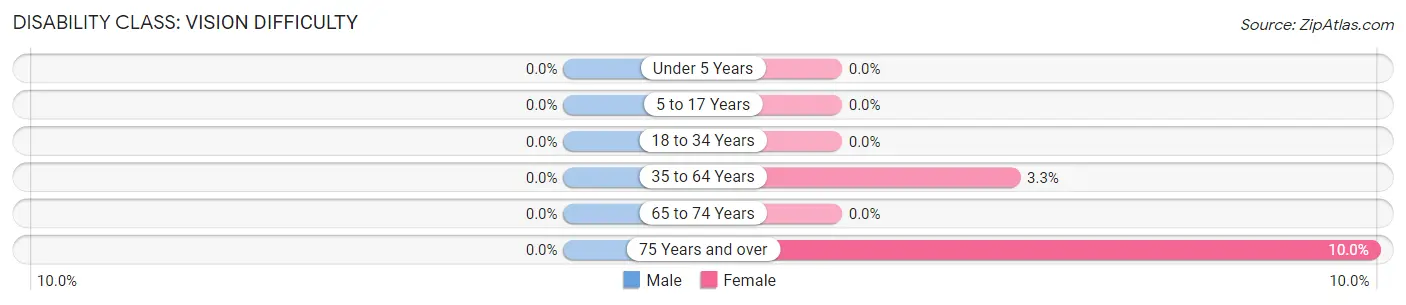
| Age Bracket | Male | Female |
| Under 5 Years | 0 (0.0%) | 0 (0.0%) |
| 5 to 17 Years | 0 (0.0%) | 0 (0.0%) |
| 18 to 34 Years | 0 (0.0%) | 0 (0.0%) |
| 35 to 64 Years | 0 (0.0%) | 5 (3.3%) |
| 65 to 74 Years | 0 (0.0%) | 0 (0.0%) |
| 75 Years and over | 0 (0.0%) | 1 (10.0%) |
Disability Class: Cognitive Difficulty
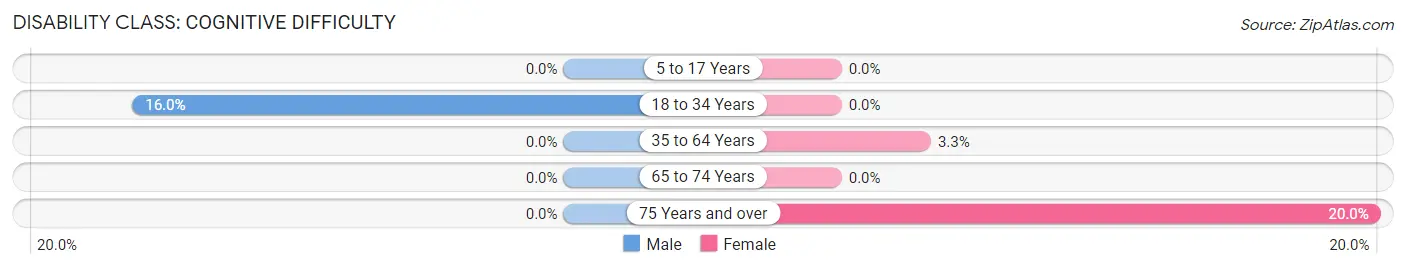
| Age Bracket | Male | Female |
| 5 to 17 Years | 0 (0.0%) | 0 (0.0%) |
| 18 to 34 Years | 4 (16.0%) | 0 (0.0%) |
| 35 to 64 Years | 0 (0.0%) | 5 (3.3%) |
| 65 to 74 Years | 0 (0.0%) | 0 (0.0%) |
| 75 Years and over | 0 (0.0%) | 2 (20.0%) |
Disability Class: Ambulatory Difficulty
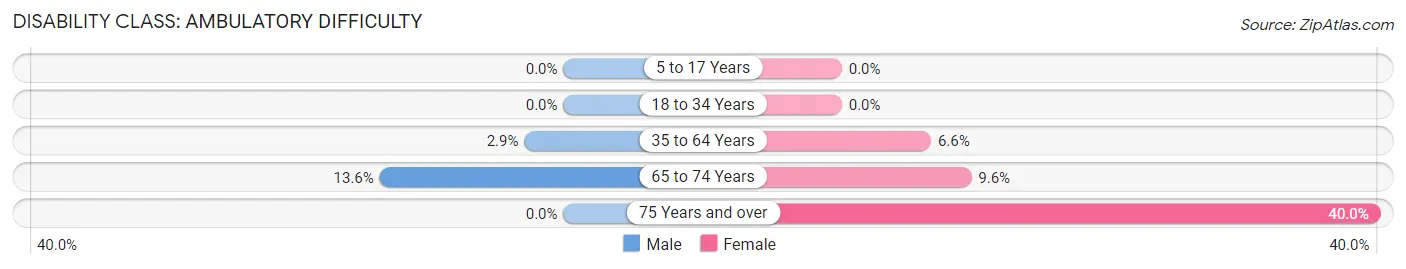
| Age Bracket | Male | Female |
| 5 to 17 Years | 0 (0.0%) | 0 (0.0%) |
| 18 to 34 Years | 0 (0.0%) | 0 (0.0%) |
| 35 to 64 Years | 2 (2.9%) | 10 (6.6%) |
| 65 to 74 Years | 6 (13.6%) | 5 (9.6%) |
| 75 Years and over | 0 (0.0%) | 4 (40.0%) |
Disability Class: Self-Care Difficulty
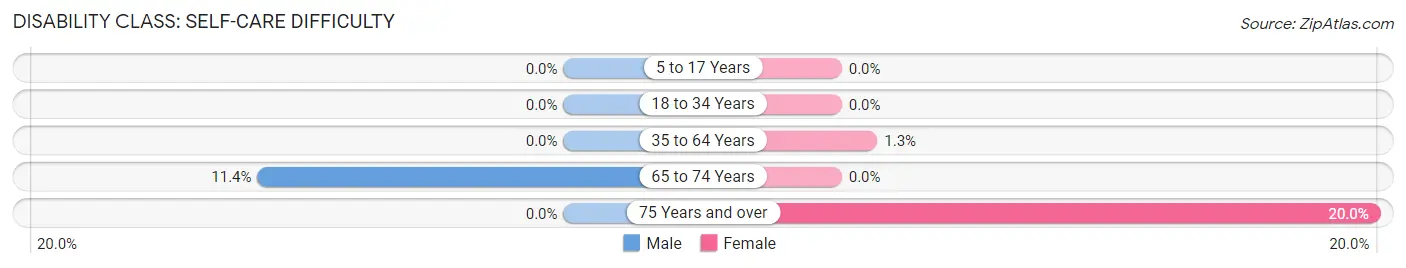
| Age Bracket | Male | Female |
| 5 to 17 Years | 0 (0.0%) | 0 (0.0%) |
| 18 to 34 Years | 0 (0.0%) | 0 (0.0%) |
| 35 to 64 Years | 0 (0.0%) | 2 (1.3%) |
| 65 to 74 Years | 5 (11.4%) | 0 (0.0%) |
| 75 Years and over | 0 (0.0%) | 2 (20.0%) |
Technology Access in Martinsburg
Computing Device Access in Martinsburg
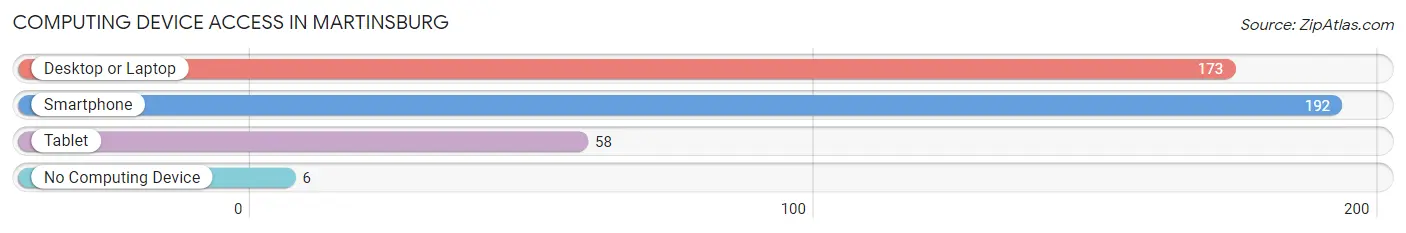
| Device Type | # Households | % Households |
| Desktop or Laptop | 173 | 83.6% |
| Smartphone | 192 | 92.7% |
| Tablet | 58 | 28.0% |
| No Computing Device | 6 | 2.9% |
| Total | 207 | 100.0% |
Internet Access in Martinsburg
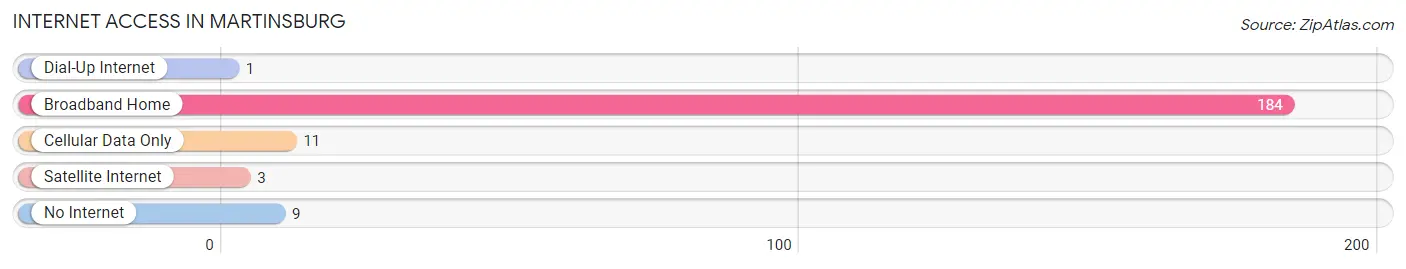
| Internet Type | # Households | % Households |
| Dial-Up Internet | 1 | 0.5% |
| Broadband Home | 184 | 88.9% |
| Cellular Data Only | 11 | 5.3% |
| Satellite Internet | 3 | 1.5% |
| No Internet | 9 | 4.3% |
| Total | 207 | 100.0% |
Martinsburg Summary
Martinsburg, Missouri is a small town located in the northeast corner of the state, in the heart of the Ozark Mountains. It is situated in the foothills of the Ozarks, and is surrounded by rolling hills and lush forests. The town is located in St. Francois County, and is part of the Farmington Micropolitan Statistical Area. The population of Martinsburg was estimated to be 1,072 in 2019.
History
Martinsburg was founded in 1819 by a group of settlers from Kentucky and Tennessee. The town was named after the first settler, John Martin, who had purchased the land from the local Native Americans. The town was originally a farming community, and the settlers grew corn, wheat, and other crops. The town was also known for its iron ore deposits, which were mined and used to make tools and weapons.
In the late 1800s, the town began to grow and develop. The railroad was built through the town, and the first post office was established in 1883. The town also had a school, a bank, and several stores.
Geography
Martinsburg is located in the northeast corner of Missouri, in the foothills of the Ozark Mountains. The town is situated in the St. Francois River Valley, and is surrounded by rolling hills and lush forests. The town is located about 30 miles from the Mississippi River, and is about an hour and a half drive from St. Louis.
The climate in Martinsburg is humid subtropical, with hot summers and mild winters. The average temperature in the summer is around 80 degrees Fahrenheit, and the average temperature in the winter is around 40 degrees Fahrenheit. The town receives an average of 45 inches of rain per year.
Economy
The economy of Martinsburg is largely based on agriculture and tourism. The town is home to several farms, which produce corn, wheat, soybeans, and other crops. The town is also home to several wineries, which produce a variety of wines.
Tourism is also an important part of the economy. The town is home to several historic sites, including the Old Stone Church, the Old Courthouse, and the Old Jail. The town also has several parks and recreational areas, including the Ozark National Scenic Riverways.
Demographics
As of 2019, the population of Martinsburg was estimated to be 1,072. The town is predominantly white, with about 95% of the population being white. The median household income is $41,000, and the median home value is $90,000. The town has a low unemployment rate, and the poverty rate is about 10%.
Martinsburg is a small town with a rich history and a vibrant economy. The town is home to several farms, wineries, and historic sites, and is a popular destination for tourists. The town is also home to a diverse population, with a mix of races and cultures.
Common Questions
What is the Total Population of Martinsburg?
Total Population of Martinsburg is 559.
What is the Total Male Population of Martinsburg?
Total Male Population of Martinsburg is 179.
What is the Total Female Population of Martinsburg?
Total Female Population of Martinsburg is 380.
What is the Ratio of Males per 100 Females in Martinsburg?
There are 47.11 Males per 100 Females in Martinsburg.
What is the Ratio of Females per 100 Males in Martinsburg?
There are 212.29 Females per 100 Males in Martinsburg.
What is the Median Population Age in Martinsburg?
Median Population Age in Martinsburg is 39.5 Years.
What is the Average Family Size in Martinsburg
Average Family Size in Martinsburg is 2.8 People.
What is the Average Household Size in Martinsburg
Average Household Size in Martinsburg is 2.7 People.
What is Per Capita Income in Martinsburg?
Per Capita income in Martinsburg is $15,287.
What is the Median Family Income in Martinsburg?
Median Family Income in Martinsburg is $31,757.
What is the Median Household income in Martinsburg?
Median Household Income in Martinsburg is $31,696.
What is Inequality or Gini Index in Martinsburg?
Inequality or Gini Index in Martinsburg is 0.35.
How Large is the Labor Force in Martinsburg?
There are 262 People in the Labor Forcein in Martinsburg.
What is the Percentage of People in the Labor Force in Martinsburg?
66.3% of People are in the Labor Force in Martinsburg.
What is the Unemployment Rate in Martinsburg?
Unemployment Rate in Martinsburg is 1.6%.