Lock Springs, MO
Lock Springs Map
Lock Springs Overview
40
TOTAL POPULATION
24
MALE POPULATION
16
FEMALE POPULATION
150.00
MALES / 100 FEMALES
66.67
FEMALES / 100 MALES
35.5
MEDIAN AGE
3.0
AVG FAMILY SIZE
3.1
AVG HOUSEHOLD SIZE
$63,058
PER CAPITA INCOME
$100,833
AVG FAMILY INCOME
$101,250
AVG HOUSEHOLD INCOME
0.55
INEQUALITY / GINI INDEX
15
LABOR FORCE [ PEOPLE ]
51.7%
PERCENT IN LABOR FORCE
Lock Springs Zip Codes
Lock Springs Area Codes
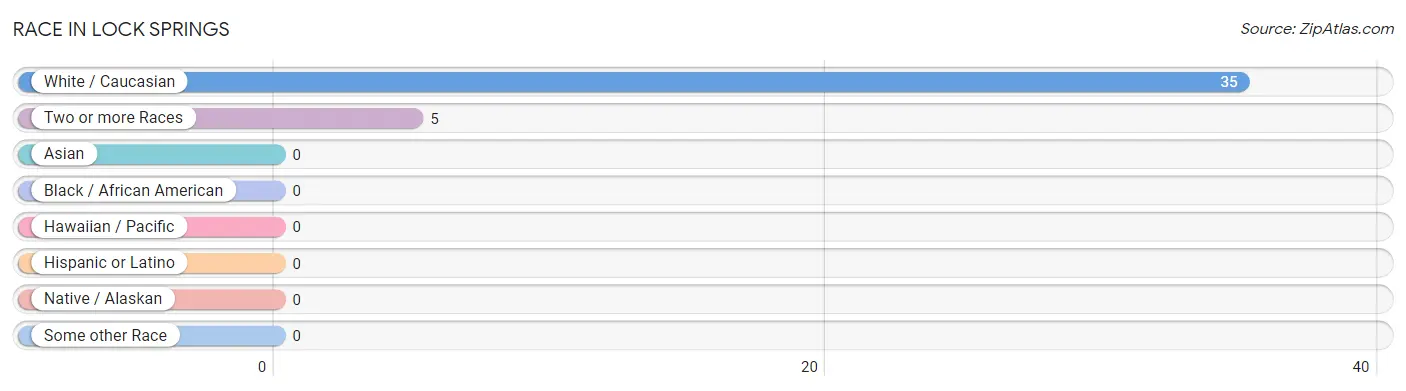
Race in Lock Springs
The most populous races in Lock Springs are White / Caucasian (35 | 87.5%), and Two or more Races (5 | 12.5%).
| Race | # Population | % Population |
| Asian | 0 | 0.0% |
| Black / African American | 0 | 0.0% |
| Hawaiian / Pacific | 0 | 0.0% |
| Hispanic or Latino | 0 | 0.0% |
| Native / Alaskan | 0 | 0.0% |
| White / Caucasian | 35 | 87.5% |
| Two or more Races | 5 | 12.5% |
| Some other Race | 0 | 0.0% |
| Total | 40 | 100.0% |
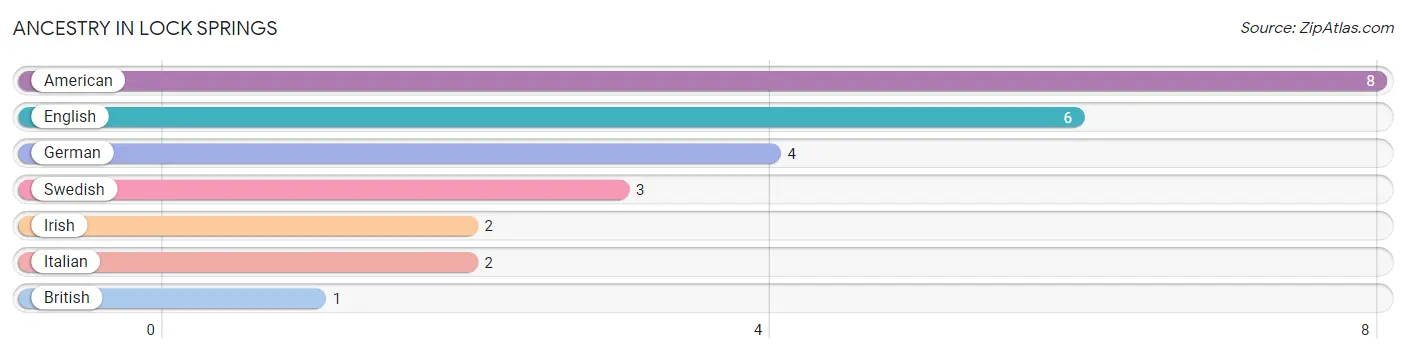
Ancestry in Lock Springs
The most populous ancestries reported in Lock Springs are American (8 | 20.0%), English (6 | 15.0%), German (4 | 10.0%), Swedish (3 | 7.5%), and Irish (2 | 5.0%), together accounting for 57.5% of all Lock Springs residents.
| Ancestry | # Population | % Population |
| American | 8 | 20.0% |
| British | 1 | 2.5% |
| English | 6 | 15.0% |
| German | 4 | 10.0% |
| Irish | 2 | 5.0% |
| Italian | 2 | 5.0% |
| Swedish | 3 | 7.5% | View All 7 Rows |
Immigrants in Lock Springs

| Immigration Origin | # Population | % Population | View All 0 Rows |
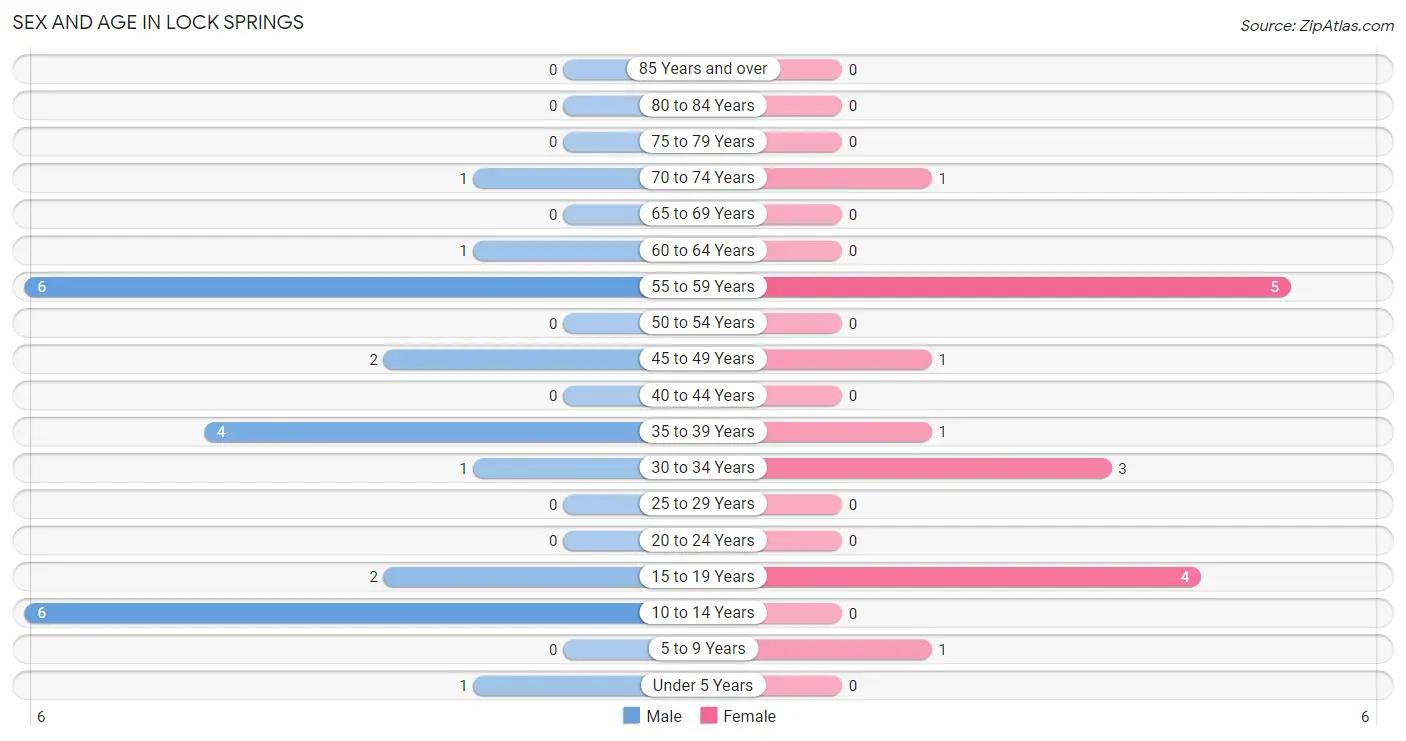
Sex and Age in Lock Springs
Sex and Age in Lock Springs
The most populous age groups in Lock Springs are 10 to 14 Years (6 | 25.0%) for men and 55 to 59 Years (5 | 31.2%) for women.
| Age Bracket | Male | Female |
| Under 5 Years | 1 (4.2%) | 0 (0.0%) |
| 5 to 9 Years | 0 (0.0%) | 1 (6.2%) |
| 10 to 14 Years | 6 (25.0%) | 0 (0.0%) |
| 15 to 19 Years | 2 (8.3%) | 4 (25.0%) |
| 20 to 24 Years | 0 (0.0%) | 0 (0.0%) |
| 25 to 29 Years | 0 (0.0%) | 0 (0.0%) |
| 30 to 34 Years | 1 (4.2%) | 3 (18.8%) |
| 35 to 39 Years | 4 (16.7%) | 1 (6.2%) |
| 40 to 44 Years | 0 (0.0%) | 0 (0.0%) |
| 45 to 49 Years | 2 (8.3%) | 1 (6.2%) |
| 50 to 54 Years | 0 (0.0%) | 0 (0.0%) |
| 55 to 59 Years | 6 (25.0%) | 5 (31.2%) |
| 60 to 64 Years | 1 (4.2%) | 0 (0.0%) |
| 65 to 69 Years | 0 (0.0%) | 0 (0.0%) |
| 70 to 74 Years | 1 (4.2%) | 1 (6.2%) |
| 75 to 79 Years | 0 (0.0%) | 0 (0.0%) |
| 80 to 84 Years | 0 (0.0%) | 0 (0.0%) |
| 85 Years and over | 0 (0.0%) | 0 (0.0%) |
| Total | 24 (100.0%) | 16 (100.0%) |
Families and Households in Lock Springs
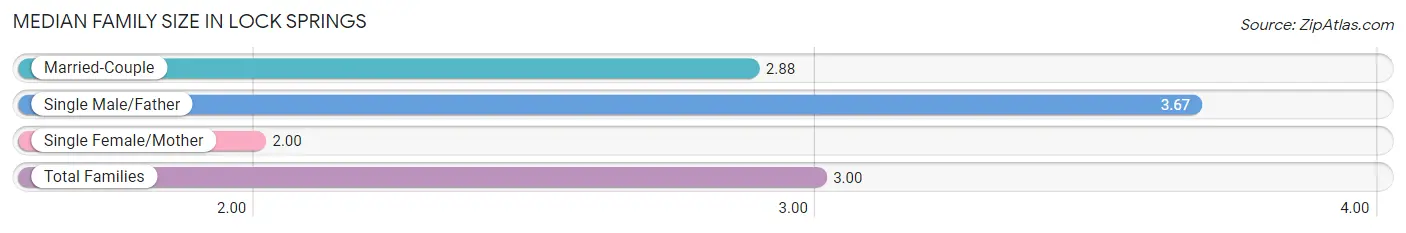
Median Family Size in Lock Springs
The median family size in Lock Springs is 3.00 persons per family, with single male/father families (3 | 25.0%) accounting for the largest median family size of 3.67 persons per family. On the other hand, single female/mother families (1 | 8.3%) represent the smallest median family size with 2.00 persons per family.
| Family Type | # Families | Family Size |
| Married-Couple | 8 (66.7%) | 2.88 |
| Single Male/Father | 3 (25.0%) | 3.67 |
| Single Female/Mother | 1 (8.3%) | 2.00 |
| Total Families | 12 (100.0%) | 3.00 |
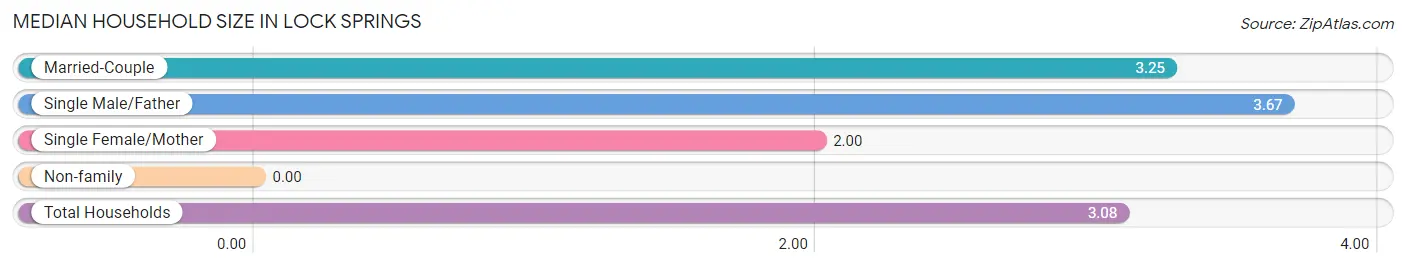
Median Household Size in Lock Springs
| Household Type | # Households | Household Size |
| Married-Couple | 8 (61.5%) | 3.25 |
| Single Male/Father | 3 (23.1%) | 3.67 |
| Single Female/Mother | 1 (7.7%) | 2.00 |
| Non-family | 1 (7.7%) | - |
| Total Households | 13 (100.0%) | 3.08 |
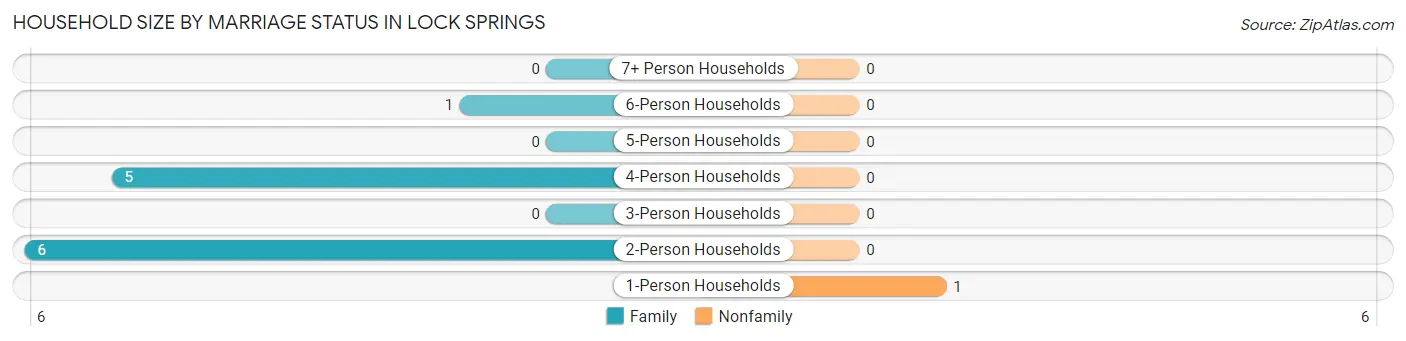
Household Size by Marriage Status in Lock Springs
Out of a total of 13 households in Lock Springs, 12 (92.3%) are family households, while 1 (7.7%) are nonfamily households. The most numerous type of family households are 2-person households, comprising 6, and the most common type of nonfamily households are 1-person households, comprising 1.
| Household Size | Family Households | Nonfamily Households |
| 1-Person Households | - | 1 (7.7%) |
| 2-Person Households | 6 (46.2%) | 0 (0.0%) |
| 3-Person Households | 0 (0.0%) | 0 (0.0%) |
| 4-Person Households | 5 (38.5%) | 0 (0.0%) |
| 5-Person Households | 0 (0.0%) | 0 (0.0%) |
| 6-Person Households | 1 (7.7%) | 0 (0.0%) |
| 7+ Person Households | 0 (0.0%) | 0 (0.0%) |
| Total | 12 (92.3%) | 1 (7.7%) |
Female Fertility in Lock Springs
Fertility by Age in Lock Springs
| Age Bracket | Women with Births | Births / 1,000 Women |
| 15 to 19 years | 0 (0.0%) | 0.0 |
| 20 to 34 years | 0 (0.0%) | 0.0 |
| 35 to 50 years | 0 (0.0%) | 0.0 |
| Total | 0 (0.0%) | 0.0 |
Fertility by Age by Marriage Status in Lock Springs
| Age Bracket | Married | Unmarried |
| 15 to 19 years | 0 (0.0%) | 0 (0.0%) |
| 20 to 34 years | 0 (0.0%) | 0 (0.0%) |
| 35 to 50 years | 0 (0.0%) | 0 (0.0%) |
| Total | 0 (0.0%) | 0 (0.0%) |
Fertility by Education in Lock Springs
| Educational Attainment | Women with Births | Births / 1,000 Women |
| Less than High School | 0 (0.0%) | 0.0 |
| High School Diploma | 0 (0.0%) | 0.0 |
| College or Associate's Degree | 0 (0.0%) | 0.0 |
| Bachelor's Degree | 0 (0.0%) | 0.0 |
| Graduate Degree | 0 (0.0%) | 0.0 |
| Total | 0 (0.0%) | 0.0 |
Fertility by Education by Marriage Status in Lock Springs
| Educational Attainment | Married | Unmarried |
| Less than High School | 0 (0.0%) | 0 (0.0%) |
| High School Diploma | 0 (0.0%) | 0 (0.0%) |
| College or Associate's Degree | 0 (0.0%) | 0 (0.0%) |
| Bachelor's Degree | 0 (0.0%) | 0 (0.0%) |
| Graduate Degree | 0 (0.0%) | 0 (0.0%) |
| Total | 0 (0.0%) | 0 (0.0%) |
Income in Lock Springs
Income Overview in Lock Springs
Per Capita Income in Lock Springs is $63,058, while median incomes of families and households are $100,833 and $101,250 respectively.
| Characteristic | Number | Measure |
| Per Capita Income | 40 | $63,058 |
| Median Family Income | 12 | $100,833 |
| Mean Family Income | 12 | $85,875 |
| Median Household Income | 13 | $101,250 |
| Mean Household Income | 13 | $173,277 |
| Income Deficit | 12 | $0 |
| Wage / Income Gap (%) | 40 | 0.00% |
| Wage / Income Gap ($) | 40 | 100.00¢ per $1 |
| Gini / Inequality Index | 40 | 0.55 |
Earnings by Sex in Lock Springs
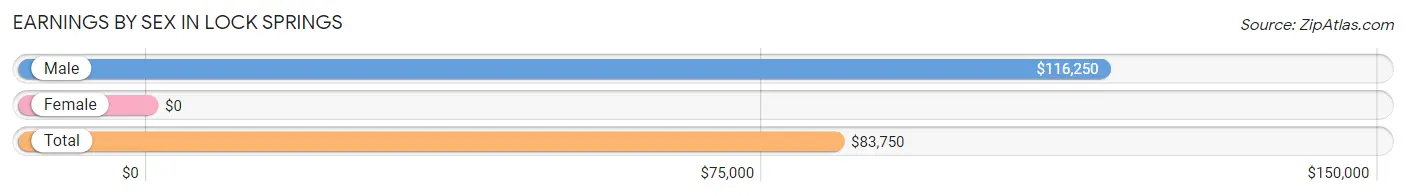
| Sex | Number | Average Earnings |
| Male | 12 (63.2%) | $116,250 |
| Female | 7 (36.8%) | $0 |
| Total | 19 (100.0%) | $83,750 |
Earnings by Sex by Income Bracket in Lock Springs
The most common earnings brackets in Lock Springs are $100,000+ for men (6 | 50.0%) and $2,500 to $4,999 for women (3 | 42.9%).
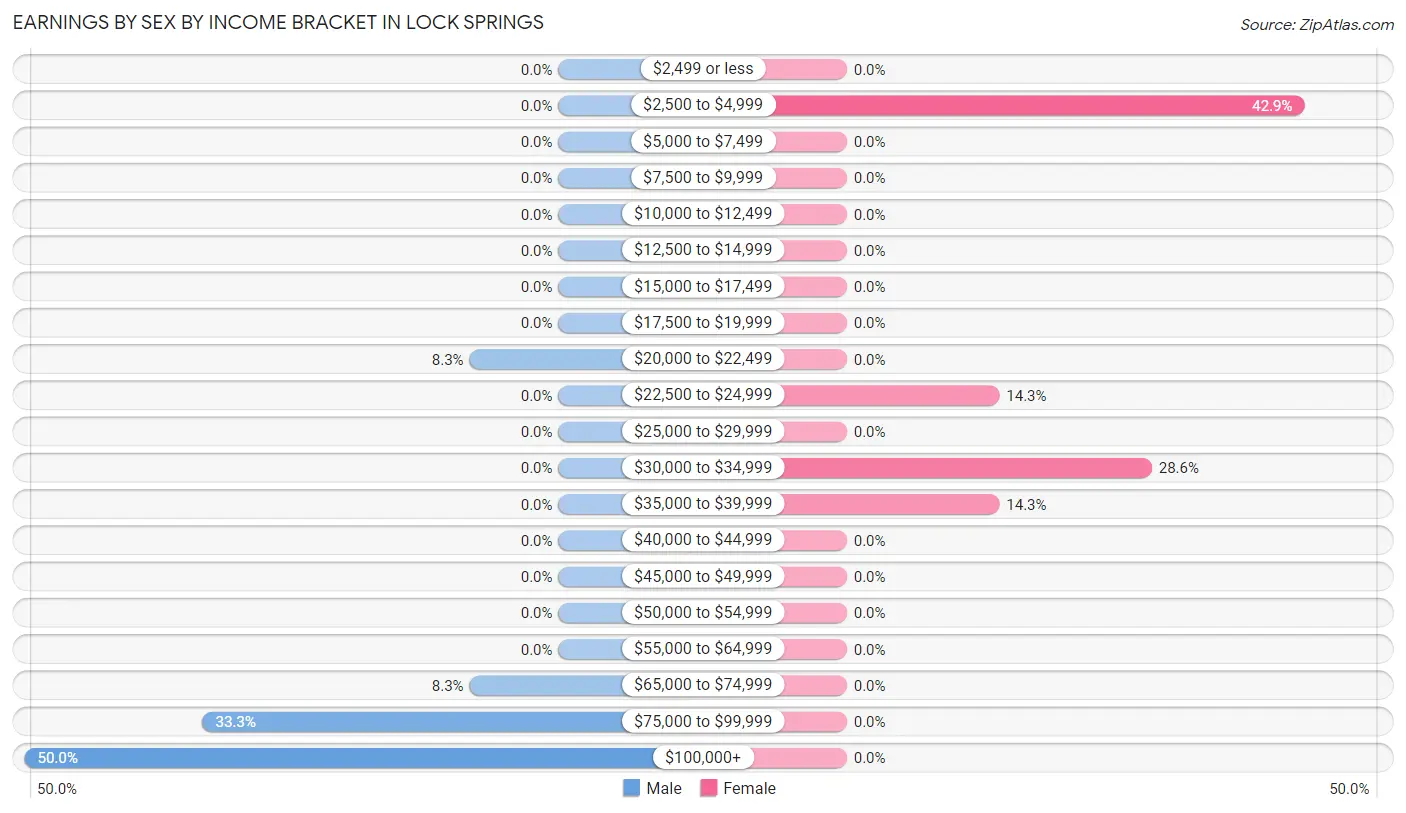
| Income | Male | Female |
| $2,499 or less | 0 (0.0%) | 0 (0.0%) |
| $2,500 to $4,999 | 0 (0.0%) | 3 (42.9%) |
| $5,000 to $7,499 | 0 (0.0%) | 0 (0.0%) |
| $7,500 to $9,999 | 0 (0.0%) | 0 (0.0%) |
| $10,000 to $12,499 | 0 (0.0%) | 0 (0.0%) |
| $12,500 to $14,999 | 0 (0.0%) | 0 (0.0%) |
| $15,000 to $17,499 | 0 (0.0%) | 0 (0.0%) |
| $17,500 to $19,999 | 0 (0.0%) | 0 (0.0%) |
| $20,000 to $22,499 | 1 (8.3%) | 0 (0.0%) |
| $22,500 to $24,999 | 0 (0.0%) | 1 (14.3%) |
| $25,000 to $29,999 | 0 (0.0%) | 0 (0.0%) |
| $30,000 to $34,999 | 0 (0.0%) | 2 (28.6%) |
| $35,000 to $39,999 | 0 (0.0%) | 1 (14.3%) |
| $40,000 to $44,999 | 0 (0.0%) | 0 (0.0%) |
| $45,000 to $49,999 | 0 (0.0%) | 0 (0.0%) |
| $50,000 to $54,999 | 0 (0.0%) | 0 (0.0%) |
| $55,000 to $64,999 | 0 (0.0%) | 0 (0.0%) |
| $65,000 to $74,999 | 1 (8.3%) | 0 (0.0%) |
| $75,000 to $99,999 | 4 (33.3%) | 0 (0.0%) |
| $100,000+ | 6 (50.0%) | 0 (0.0%) |
| Total | 12 (100.0%) | 7 (100.0%) |
Earnings by Sex by Educational Attainment in Lock Springs
Average earnings in Lock Springs are $116,250 for men and $28,750 for women, a difference of 75.3%. Men with an educational attainment of high school diploma enjoy the highest average annual earnings of $116,250, while those with high school diploma education earn the least with $116,250. Women with an educational attainment of college or associate's degree earn the most with the average annual earnings of $23,750, while those with college or associate's degree education have the smallest earnings of $23,750.
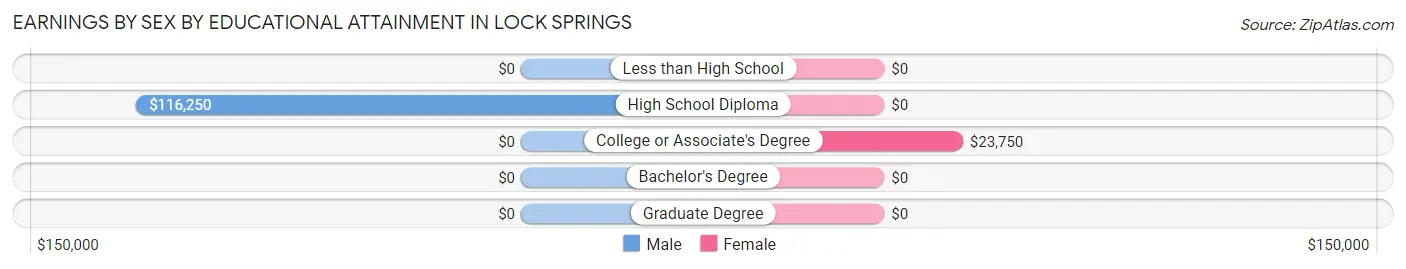
| Educational Attainment | Male Income | Female Income |
| Less than High School | - | - |
| High School Diploma | $116,250 | $0 |
| College or Associate's Degree | - | - |
| Bachelor's Degree | - | - |
| Graduate Degree | - | - |
| Total | $116,250 | $28,750 |
Family Income in Lock Springs
Family Income Brackets in Lock Springs
According to the Lock Springs family income data, there are 7 families falling into the $100,000 to $149,999 income range, which is the most common income bracket and makes up 58.3% of all families.
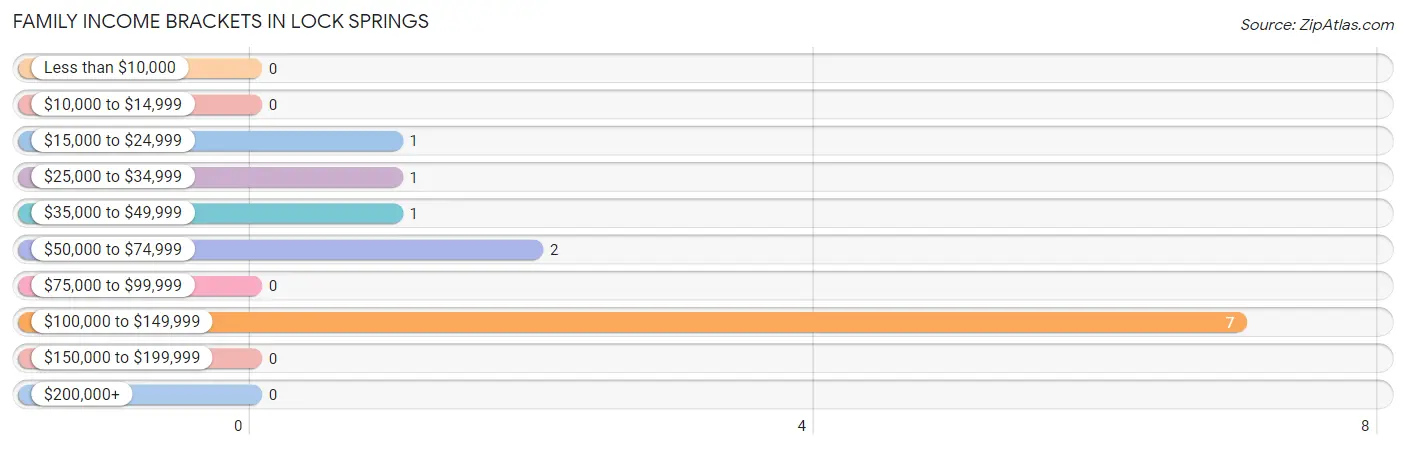
| Income Bracket | # Families | % Families |
| Less than $10,000 | 0 | 0.0% |
| $10,000 to $14,999 | 0 | 0.0% |
| $15,000 to $24,999 | 1 | 8.3% |
| $25,000 to $34,999 | 1 | 8.3% |
| $35,000 to $49,999 | 1 | 8.3% |
| $50,000 to $74,999 | 2 | 16.7% |
| $75,000 to $99,999 | 0 | 0.0% |
| $100,000 to $149,999 | 7 | 58.3% |
| $150,000 to $199,999 | 0 | 0.0% |
| $200,000+ | 0 | 0.0% |
Family Income by Famaliy Size in Lock Springs
2-person families (6 | 50.0%) account for the highest median family income in Lock Springs with $125,000 per family, while 2-person families (6 | 50.0%) have the highest median income of $62,500 per family member.
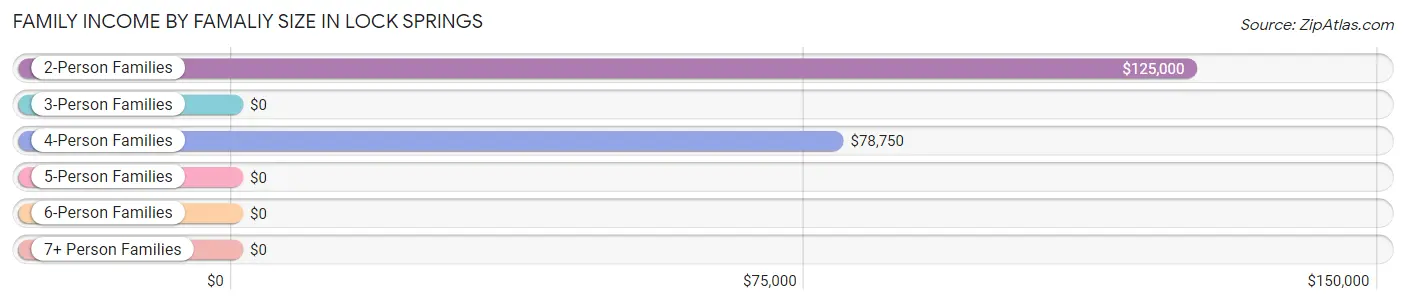
| Income Bracket | # Families | Median Income |
| 2-Person Families | 6 (50.0%) | $125,000 |
| 3-Person Families | 0 (0.0%) | $0 |
| 4-Person Families | 6 (50.0%) | $78,750 |
| 5-Person Families | 0 (0.0%) | $0 |
| 6-Person Families | 0 (0.0%) | $0 |
| 7+ Person Families | 0 (0.0%) | $0 |
| Total | 12 (100.0%) | $100,833 |
Family Income by Number of Earners in Lock Springs
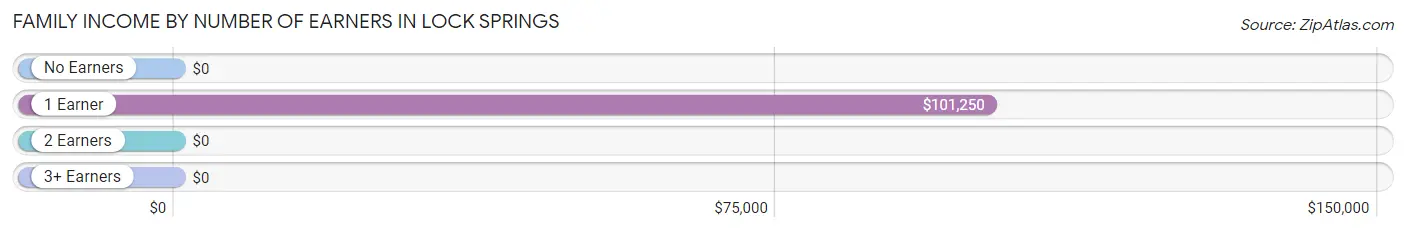
| Number of Earners | # Families | Median Income |
| No Earners | 1 (8.3%) | $0 |
| 1 Earner | 9 (75.0%) | $101,250 |
| 2 Earners | 2 (16.7%) | $0 |
| 3+ Earners | 0 (0.0%) | $0 |
| Total | 12 (100.0%) | $100,833 |
Household Income in Lock Springs
Household Income Brackets in Lock Springs
With 7 households falling in the category, the $100,000 to $149,999 income range is the most frequent in Lock Springs, accounting for 53.8% of all households.
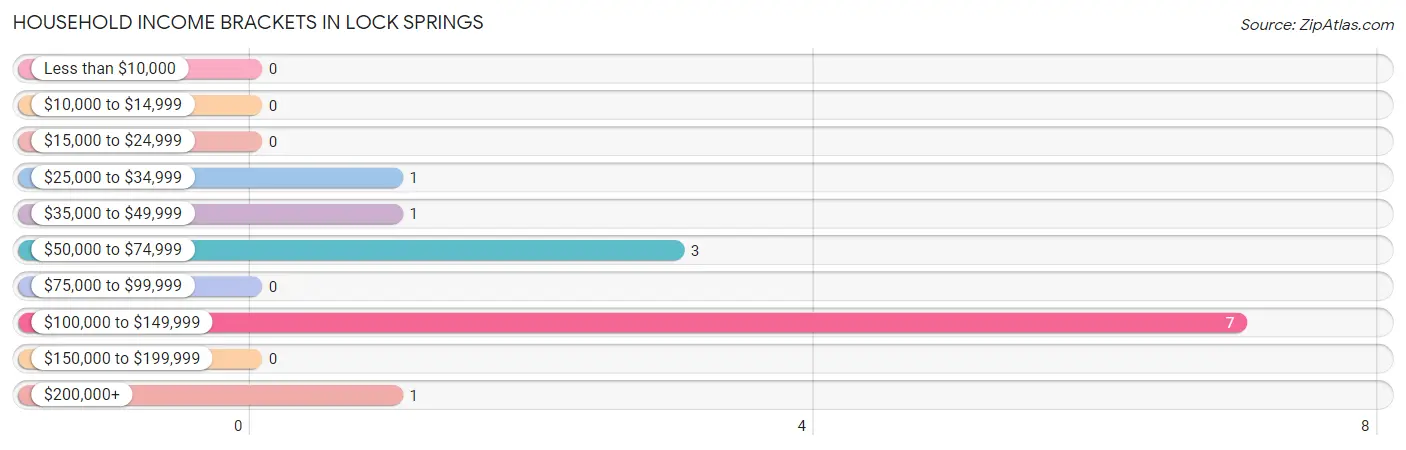
| Income Bracket | # Households | % Households |
| Less than $10,000 | 0 | 0.0% |
| $10,000 to $14,999 | 0 | 0.0% |
| $15,000 to $24,999 | 0 | 0.0% |
| $25,000 to $34,999 | 1 | 7.7% |
| $35,000 to $49,999 | 1 | 7.7% |
| $50,000 to $74,999 | 3 | 23.1% |
| $75,000 to $99,999 | 0 | 0.0% |
| $100,000 to $149,999 | 7 | 53.8% |
| $150,000 to $199,999 | 0 | 0.0% |
| $200,000+ | 1 | 7.7% |
Household Income by Householder Age in Lock Springs
The median household income in Lock Springs is $101,250, with the highest median household income of $116,250 found in the 45 to 64 years age bracket for the primary householder. A total of 7 households (53.8%) fall into this category.
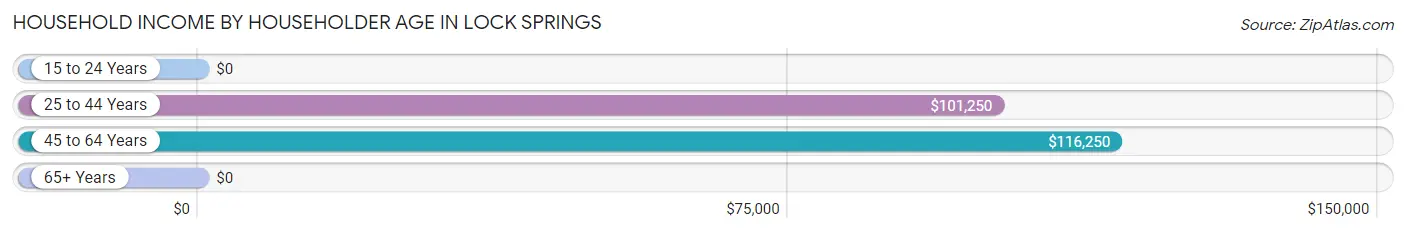
| Income Bracket | # Households | Median Income |
| 15 to 24 Years | 0 (0.0%) | $0 |
| 25 to 44 Years | 5 (38.5%) | $101,250 |
| 45 to 64 Years | 7 (53.8%) | $116,250 |
| 65+ Years | 1 (7.7%) | $0 |
| Total | 13 (100.0%) | $101,250 |
Poverty in Lock Springs
Income Below Poverty by Sex and Age in Lock Springs
With 8.3% poverty level for males and 25.0% for females among the residents of Lock Springs, under 5 year old males and 5 year old females are the most vulnerable to poverty, with 1 males (100.0%) and 1 females (100.0%) in their respective age groups living below the poverty level.
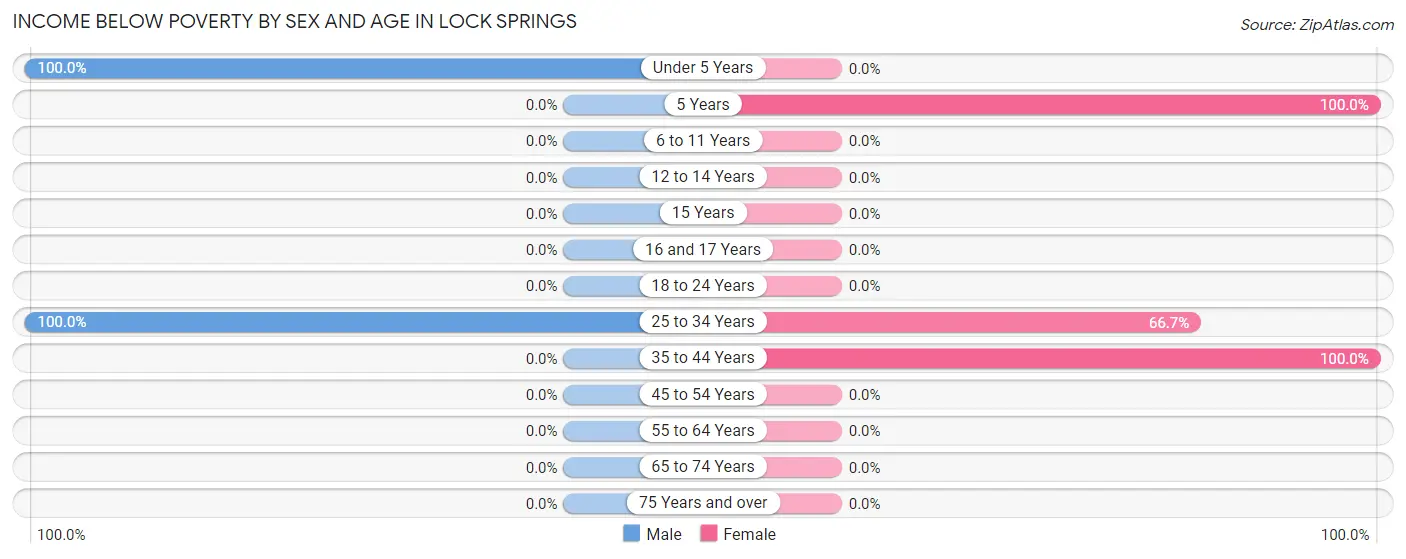
| Age Bracket | Male | Female |
| Under 5 Years | 1 (100.0%) | 0 (0.0%) |
| 5 Years | 0 (0.0%) | 1 (100.0%) |
| 6 to 11 Years | 0 (0.0%) | 0 (0.0%) |
| 12 to 14 Years | 0 (0.0%) | 0 (0.0%) |
| 15 Years | 0 (0.0%) | 0 (0.0%) |
| 16 and 17 Years | 0 (0.0%) | 0 (0.0%) |
| 18 to 24 Years | 0 (0.0%) | 0 (0.0%) |
| 25 to 34 Years | 1 (100.0%) | 2 (66.7%) |
| 35 to 44 Years | 0 (0.0%) | 1 (100.0%) |
| 45 to 54 Years | 0 (0.0%) | 0 (0.0%) |
| 55 to 64 Years | 0 (0.0%) | 0 (0.0%) |
| 65 to 74 Years | 0 (0.0%) | 0 (0.0%) |
| 75 Years and over | 0 (0.0%) | 0 (0.0%) |
| Total | 2 (8.3%) | 4 (25.0%) |
Income Above Poverty by Sex and Age in Lock Springs
According to the poverty statistics in Lock Springs, males aged 6 to 11 years and females aged 15 years are the age groups that are most secure financially, with 100.0% of males and 100.0% of females in these age groups living above the poverty line.
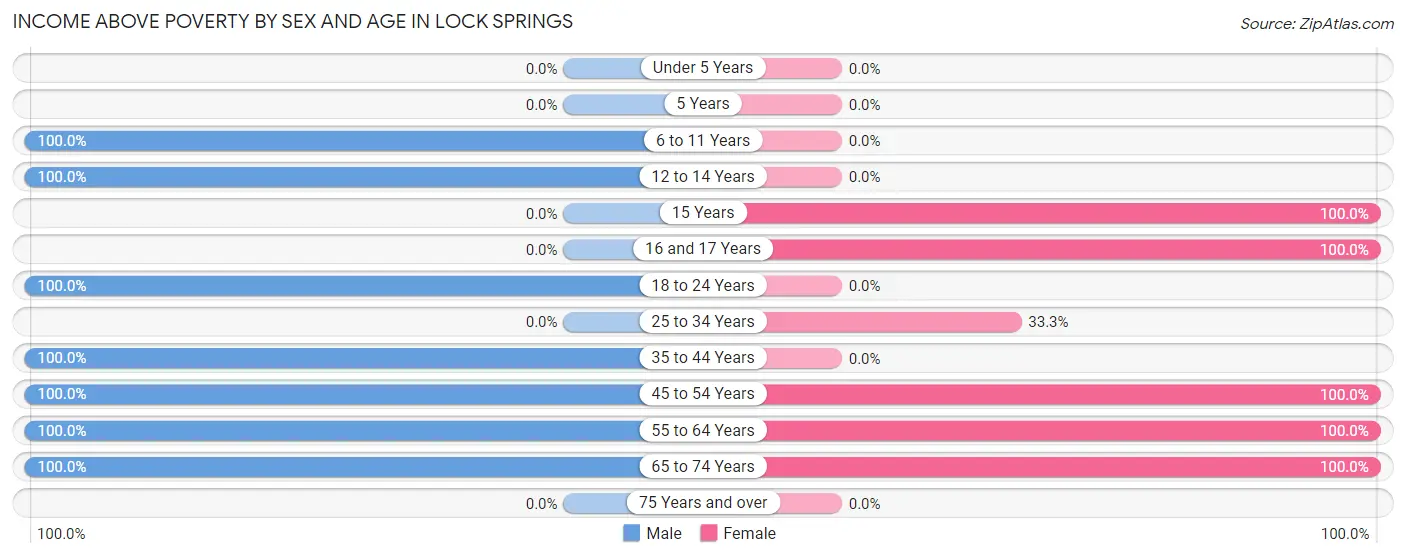
| Age Bracket | Male | Female |
| Under 5 Years | 0 (0.0%) | 0 (0.0%) |
| 5 Years | 0 (0.0%) | 0 (0.0%) |
| 6 to 11 Years | 4 (100.0%) | 0 (0.0%) |
| 12 to 14 Years | 2 (100.0%) | 0 (0.0%) |
| 15 Years | 0 (0.0%) | 3 (100.0%) |
| 16 and 17 Years | 0 (0.0%) | 1 (100.0%) |
| 18 to 24 Years | 2 (100.0%) | 0 (0.0%) |
| 25 to 34 Years | 0 (0.0%) | 1 (33.3%) |
| 35 to 44 Years | 4 (100.0%) | 0 (0.0%) |
| 45 to 54 Years | 2 (100.0%) | 1 (100.0%) |
| 55 to 64 Years | 7 (100.0%) | 5 (100.0%) |
| 65 to 74 Years | 1 (100.0%) | 1 (100.0%) |
| 75 Years and over | 0 (0.0%) | 0 (0.0%) |
| Total | 22 (91.7%) | 12 (75.0%) |
Income Below Poverty Among Married-Couple Families in Lock Springs
The poverty statistics for married-couple families in Lock Springs show that 12.5% or 1 of the total 8 families live below the poverty line. Families with 1 or 2 children have the highest poverty rate of 33.3%, comprising of 1 families. On the other hand, families with no children have the lowest poverty rate of 0.0%, which includes 0 families.
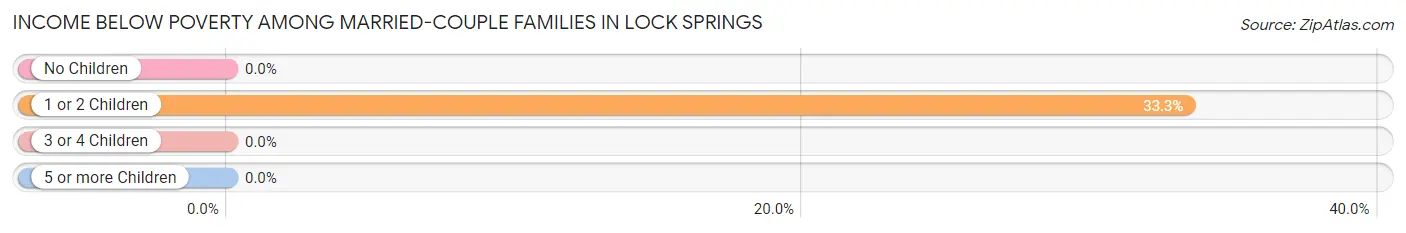
| Children | Above Poverty | Below Poverty |
| No Children | 5 (100.0%) | 0 (0.0%) |
| 1 or 2 Children | 2 (66.7%) | 1 (33.3%) |
| 3 or 4 Children | 0 (0.0%) | 0 (0.0%) |
| 5 or more Children | 0 (0.0%) | 0 (0.0%) |
| Total | 7 (87.5%) | 1 (12.5%) |
Income Below Poverty Among Single-Parent Households in Lock Springs
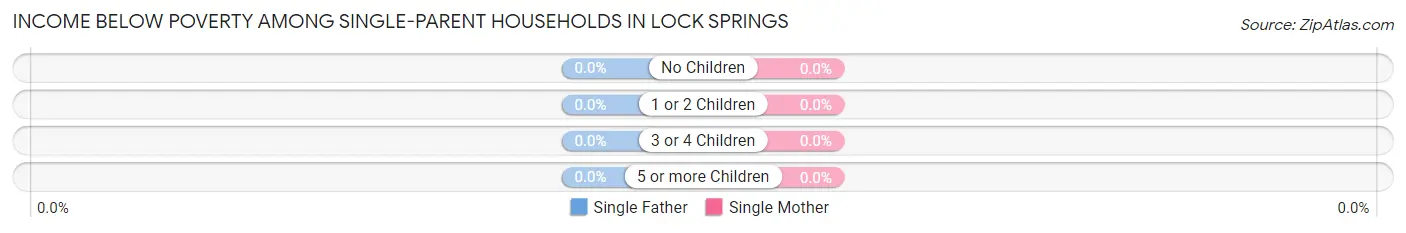
| Children | Single Father | Single Mother |
| No Children | 0 (0.0%) | 0 (0.0%) |
| 1 or 2 Children | 0 (0.0%) | 0 (0.0%) |
| 3 or 4 Children | 0 (0.0%) | 0 (0.0%) |
| 5 or more Children | 0 (0.0%) | 0 (0.0%) |
| Total | 0 (0.0%) | 0 (0.0%) |
Income Below Poverty Among Married-Couple vs Single-Parent Households in Lock Springs
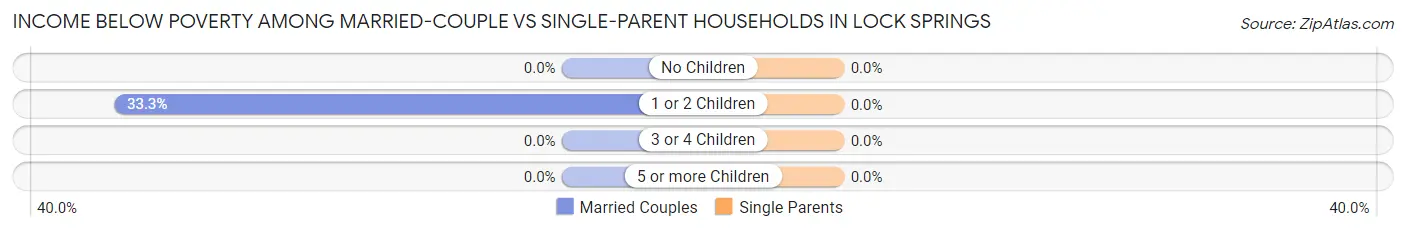
| Children | Married-Couple Families | Single-Parent Households |
| No Children | 0 (0.0%) | 0 (0.0%) |
| 1 or 2 Children | 1 (33.3%) | 0 (0.0%) |
| 3 or 4 Children | 0 (0.0%) | 0 (0.0%) |
| 5 or more Children | 0 (0.0%) | 0 (0.0%) |
| Total | 1 (12.5%) | 0 (0.0%) |
Employment Characteristics in Lock Springs
Employment by Class of Employer in Lock Springs
Among the 15 employed individuals in Lock Springs, private company employees (11 | 73.3%), self-employed (not incorporated) (3 | 20.0%), and self-employed (incorporated) (1 | 6.7%) make up the most common classes of employment.
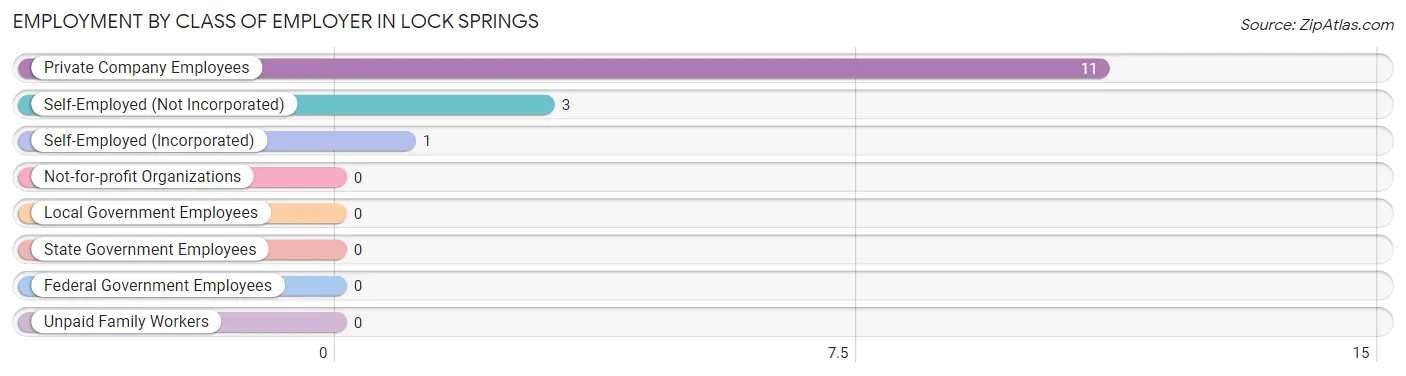
| Employer Class | # Employees | % Employees |
| Private Company Employees | 11 | 73.3% |
| Self-Employed (Incorporated) | 1 | 6.7% |
| Self-Employed (Not Incorporated) | 3 | 20.0% |
| Not-for-profit Organizations | 0 | 0.0% |
| Local Government Employees | 0 | 0.0% |
| State Government Employees | 0 | 0.0% |
| Federal Government Employees | 0 | 0.0% |
| Unpaid Family Workers | 0 | 0.0% |
| Total | 15 | 100.0% |
Employment Status by Age in Lock Springs
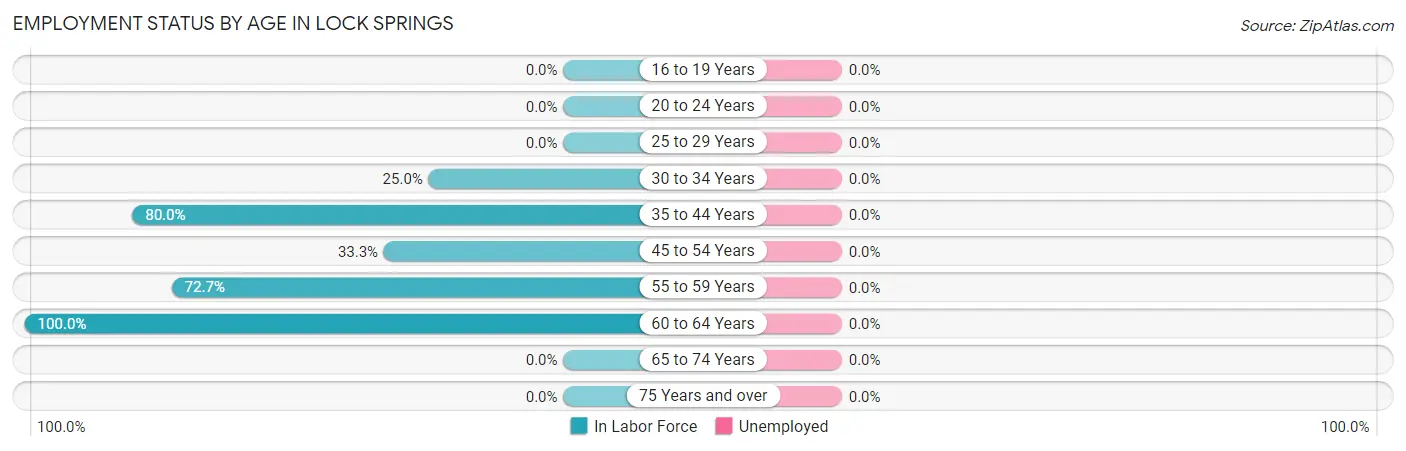
| Age Bracket | In Labor Force | Unemployed |
| 16 to 19 Years | 0 (0.0%) | 0 (0.0%) |
| 20 to 24 Years | 0 (0.0%) | 0 (0.0%) |
| 25 to 29 Years | 0 (0.0%) | 0 (0.0%) |
| 30 to 34 Years | 1 (25.0%) | 0 (0.0%) |
| 35 to 44 Years | 4 (80.0%) | 0 (0.0%) |
| 45 to 54 Years | 1 (33.3%) | 0 (0.0%) |
| 55 to 59 Years | 8 (72.7%) | 0 (0.0%) |
| 60 to 64 Years | 1 (100.0%) | 0 (0.0%) |
| 65 to 74 Years | 0 (0.0%) | 0 (0.0%) |
| 75 Years and over | 0 (0.0%) | 0 (0.0%) |
| Total | 15 (51.7%) | 0 (0.0%) |
Employment Status by Educational Attainment in Lock Springs
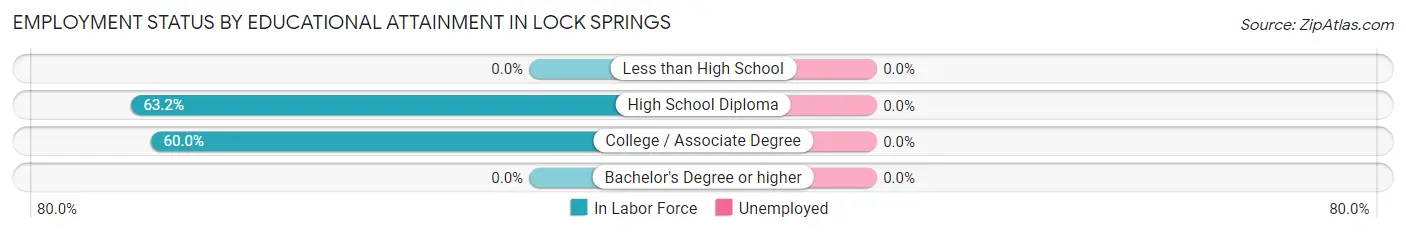
| Educational Attainment | In Labor Force | Unemployed |
| Less than High School | 0 (0.0%) | 0 (0.0%) |
| High School Diploma | 12 (63.2%) | 0 (0.0%) |
| College / Associate Degree | 3 (60.0%) | 0 (0.0%) |
| Bachelor's Degree or higher | 0 (0.0%) | 0 (0.0%) |
| Total | 15 (62.5%) | 0 (0.0%) |
Employment Occupations by Sex in Lock Springs
Management, Business, Science and Arts Occupations
The most common Management, Business, Science and Arts occupations in Lock Springs are , and Management (7 | 46.7%).
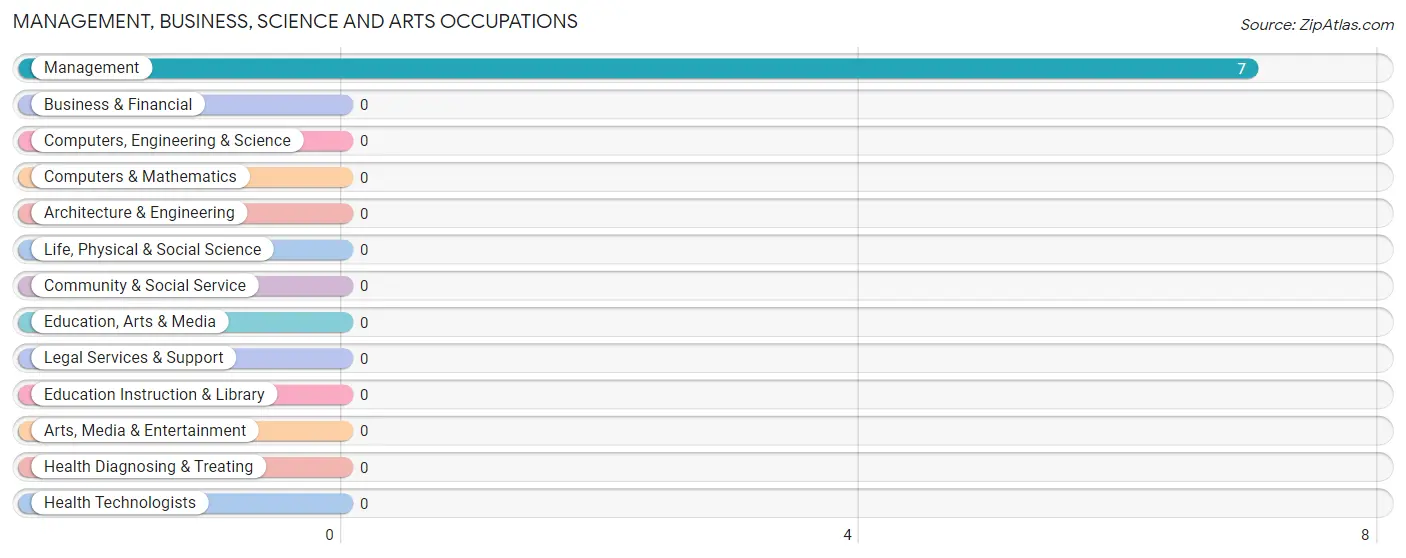
Management, Business, Science and Arts Occupations by Sex
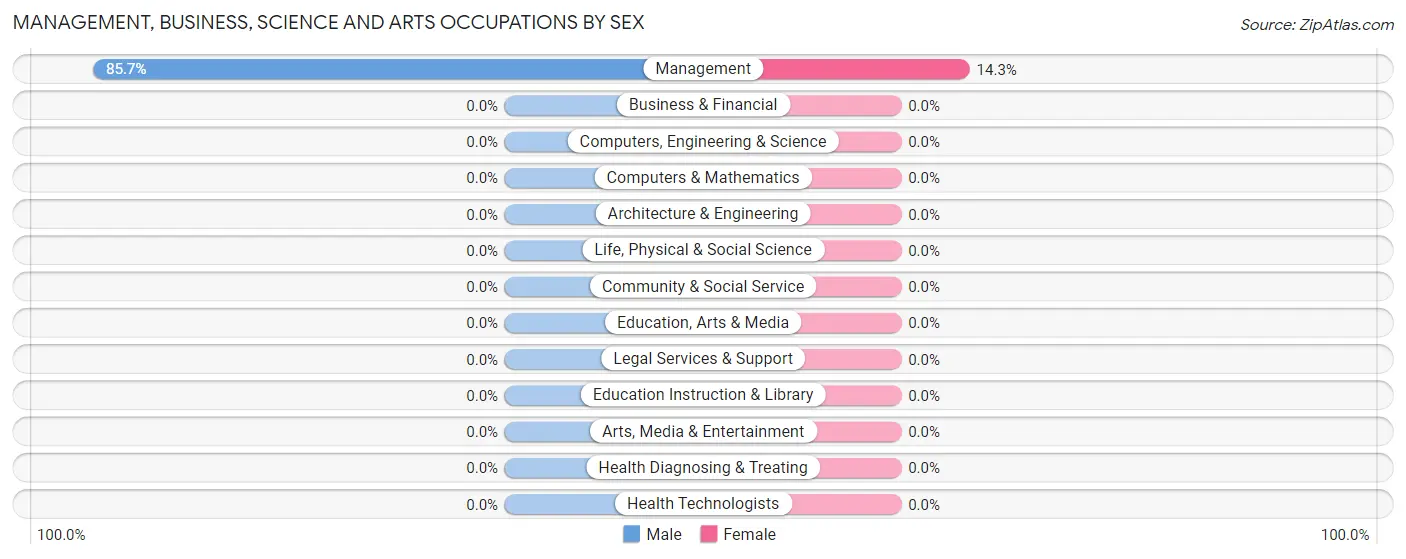
| Occupation | Male | Female |
| Management | 6 (85.7%) | 1 (14.3%) |
| Business & Financial | 0 (0.0%) | 0 (0.0%) |
| Computers, Engineering & Science | 0 (0.0%) | 0 (0.0%) |
| Computers & Mathematics | 0 (0.0%) | 0 (0.0%) |
| Architecture & Engineering | 0 (0.0%) | 0 (0.0%) |
| Life, Physical & Social Science | 0 (0.0%) | 0 (0.0%) |
| Community & Social Service | 0 (0.0%) | 0 (0.0%) |
| Education, Arts & Media | 0 (0.0%) | 0 (0.0%) |
| Legal Services & Support | 0 (0.0%) | 0 (0.0%) |
| Education Instruction & Library | 0 (0.0%) | 0 (0.0%) |
| Arts, Media & Entertainment | 0 (0.0%) | 0 (0.0%) |
| Health Diagnosing & Treating | 0 (0.0%) | 0 (0.0%) |
| Health Technologists | 0 (0.0%) | 0 (0.0%) |
| Total (Category) | 6 (85.7%) | 1 (14.3%) |
| Total (Overall) | 11 (73.3%) | 4 (26.7%) |
Services Occupations
The most common Services occupations in Lock Springs are , and Cleaning & Maintenance (1 | 6.7%).
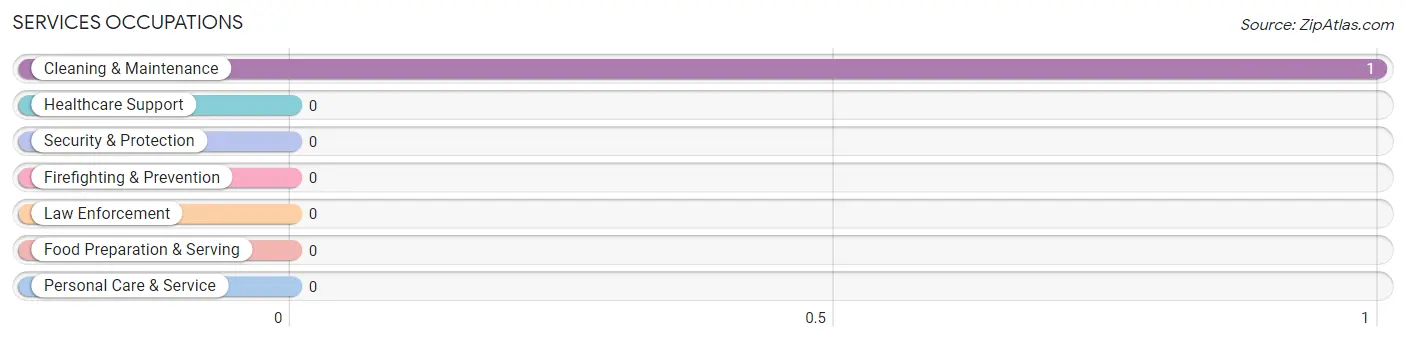
Services Occupations by Sex
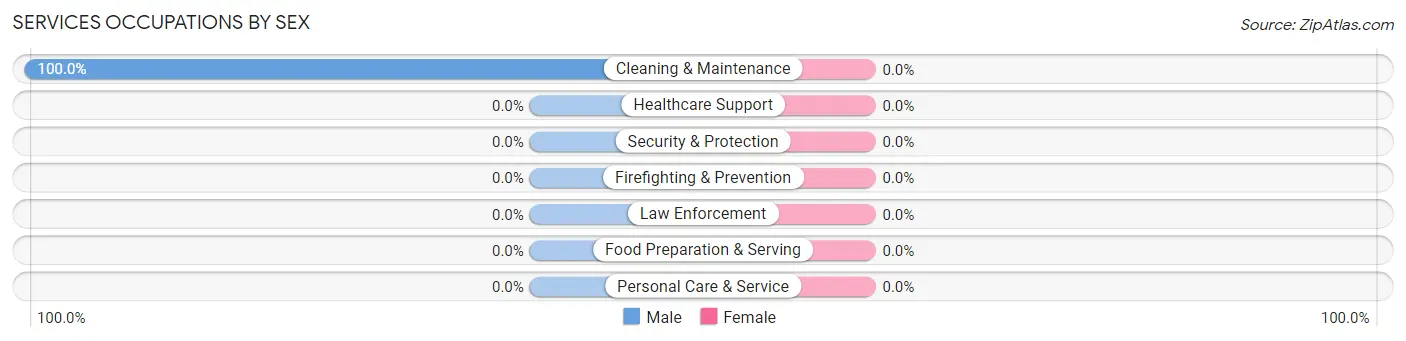
| Occupation | Male | Female |
| Healthcare Support | 0 (0.0%) | 0 (0.0%) |
| Security & Protection | 0 (0.0%) | 0 (0.0%) |
| Firefighting & Prevention | 0 (0.0%) | 0 (0.0%) |
| Law Enforcement | 0 (0.0%) | 0 (0.0%) |
| Food Preparation & Serving | 0 (0.0%) | 0 (0.0%) |
| Cleaning & Maintenance | 1 (100.0%) | 0 (0.0%) |
| Personal Care & Service | 0 (0.0%) | 0 (0.0%) |
| Total (Category) | 1 (100.0%) | 0 (0.0%) |
| Total (Overall) | 11 (73.3%) | 4 (26.7%) |
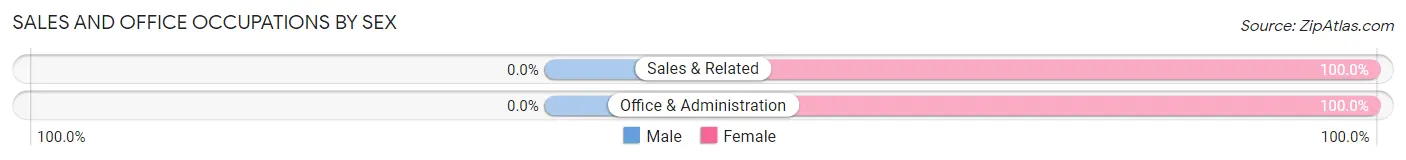
Sales and Office Occupations
The most common Sales and Office occupations in Lock Springs are Sales & Related (2 | 13.3%), and Office & Administration (1 | 6.7%).
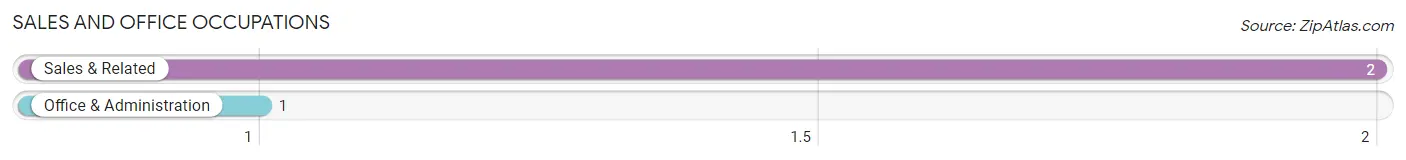
Sales and Office Occupations by Sex
| Occupation | Male | Female |
| Sales & Related | 0 (0.0%) | 2 (100.0%) |
| Office & Administration | 0 (0.0%) | 1 (100.0%) |
| Total (Category) | 0 (0.0%) | 3 (100.0%) |
| Total (Overall) | 11 (73.3%) | 4 (26.7%) |
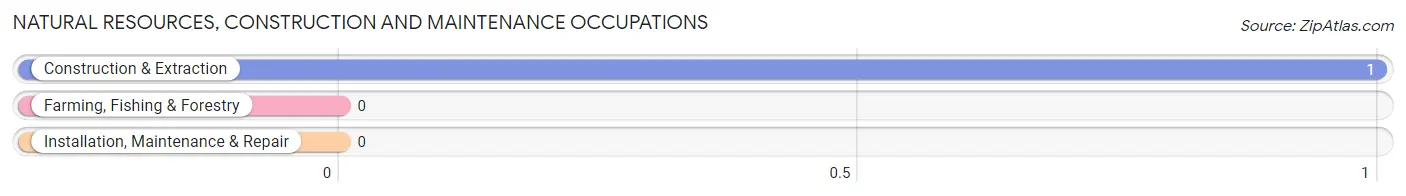
Natural Resources, Construction and Maintenance Occupations
The most common Natural Resources, Construction and Maintenance occupations in Lock Springs are , and Construction & Extraction (1 | 6.7%).
Natural Resources, Construction and Maintenance Occupations by Sex
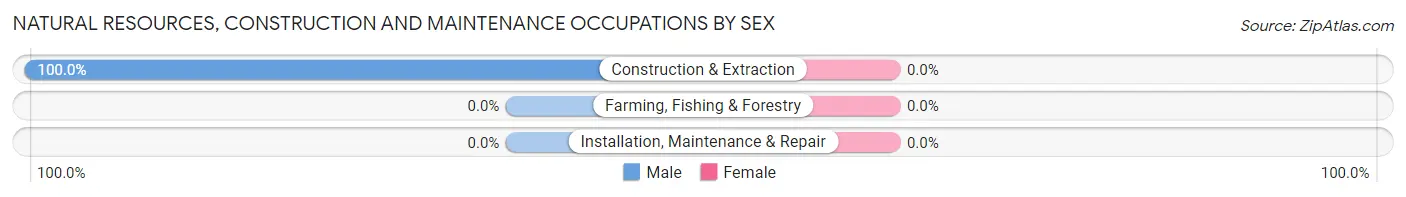
| Occupation | Male | Female |
| Farming, Fishing & Forestry | 0 (0.0%) | 0 (0.0%) |
| Construction & Extraction | 1 (100.0%) | 0 (0.0%) |
| Installation, Maintenance & Repair | 0 (0.0%) | 0 (0.0%) |
| Total (Category) | 1 (100.0%) | 0 (0.0%) |
| Total (Overall) | 11 (73.3%) | 4 (26.7%) |
Production, Transportation and Moving Occupations
The most common Production, Transportation and Moving occupations in Lock Springs are , and Transportation (3 | 20.0%).
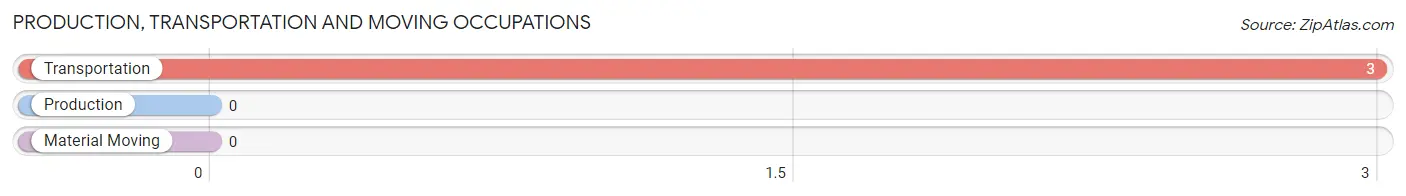
Production, Transportation and Moving Occupations by Sex
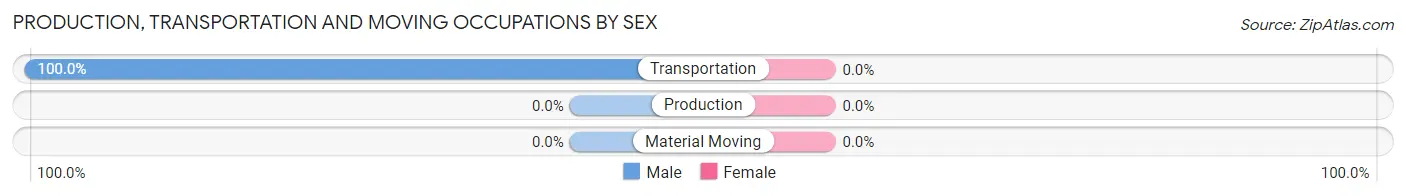
| Occupation | Male | Female |
| Production | 0 (0.0%) | 0 (0.0%) |
| Transportation | 3 (100.0%) | 0 (0.0%) |
| Material Moving | 0 (0.0%) | 0 (0.0%) |
| Total (Category) | 3 (100.0%) | 0 (0.0%) |
| Total (Overall) | 11 (73.3%) | 4 (26.7%) |
Employment Industries by Sex in Lock Springs
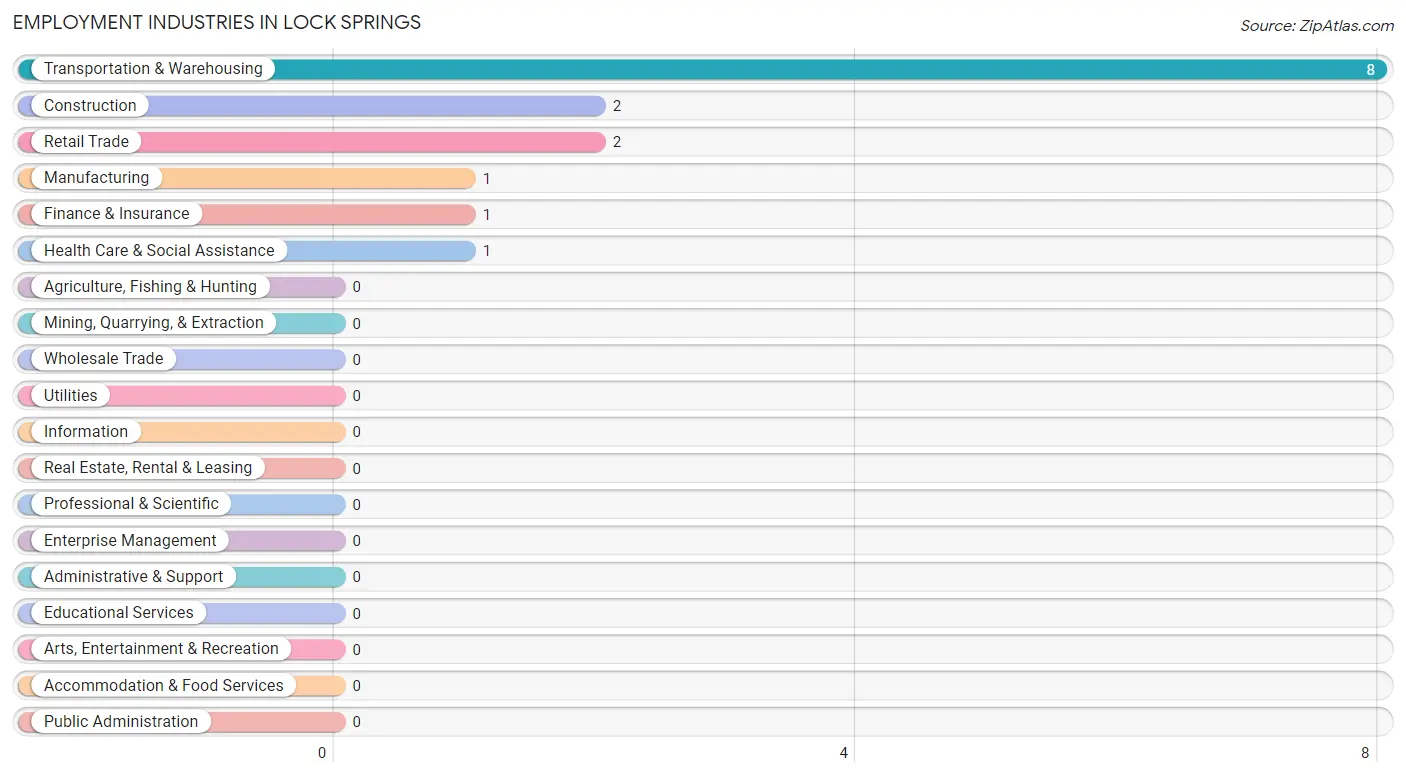
Employment Industries in Lock Springs
The major employment industries in Lock Springs include Transportation & Warehousing (8 | 53.3%), Construction (2 | 13.3%), Retail Trade (2 | 13.3%), Manufacturing (1 | 6.7%), and Finance & Insurance (1 | 6.7%).
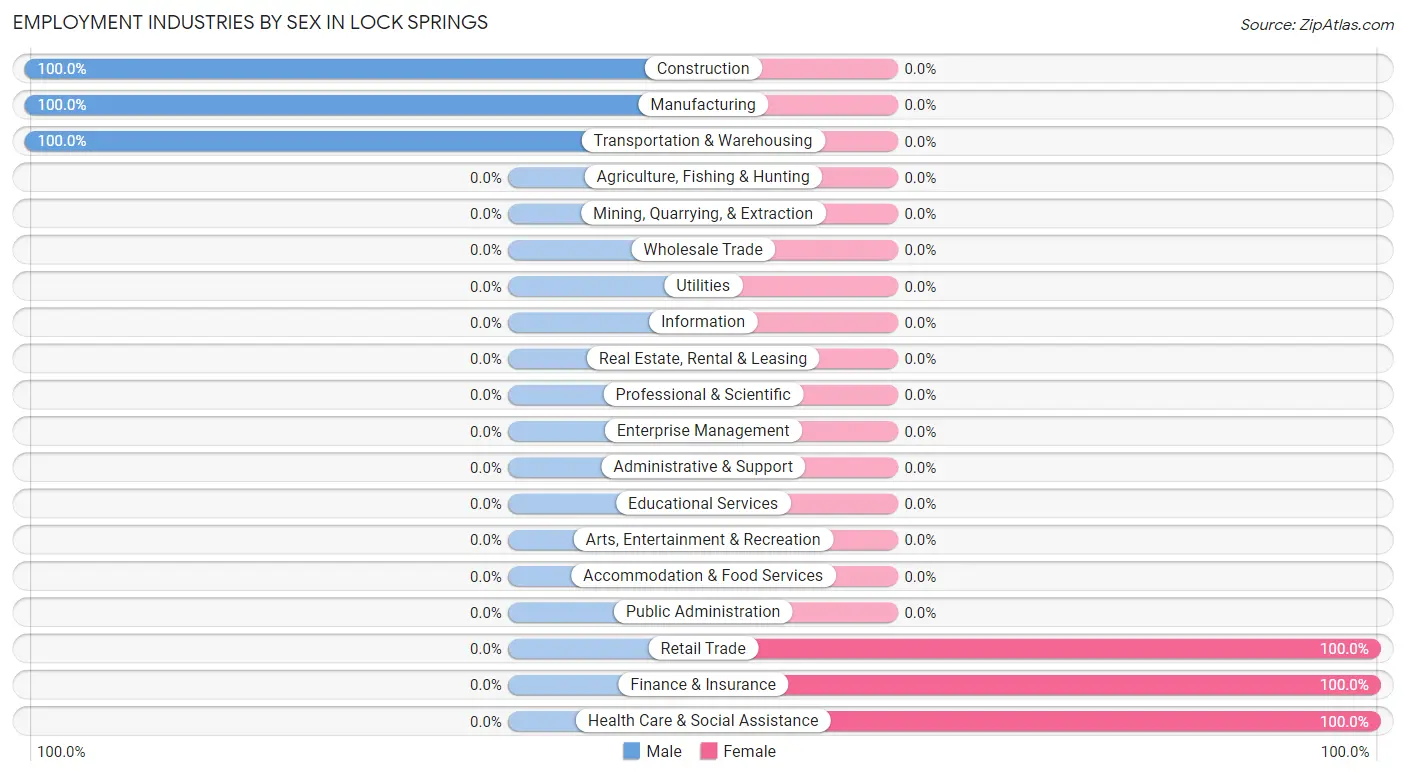
Employment Industries by Sex in Lock Springs
The Lock Springs industries that see more men than women are Construction (100.0%), Manufacturing (100.0%), and Transportation & Warehousing (100.0%), whereas the industries that tend to have a higher number of women are Retail Trade (100.0%), Finance & Insurance (100.0%), and Health Care & Social Assistance (100.0%).
| Industry | Male | Female |
| Agriculture, Fishing & Hunting | 0 (0.0%) | 0 (0.0%) |
| Mining, Quarrying, & Extraction | 0 (0.0%) | 0 (0.0%) |
| Construction | 2 (100.0%) | 0 (0.0%) |
| Manufacturing | 1 (100.0%) | 0 (0.0%) |
| Wholesale Trade | 0 (0.0%) | 0 (0.0%) |
| Retail Trade | 0 (0.0%) | 2 (100.0%) |
| Transportation & Warehousing | 8 (100.0%) | 0 (0.0%) |
| Utilities | 0 (0.0%) | 0 (0.0%) |
| Information | 0 (0.0%) | 0 (0.0%) |
| Finance & Insurance | 0 (0.0%) | 1 (100.0%) |
| Real Estate, Rental & Leasing | 0 (0.0%) | 0 (0.0%) |
| Professional & Scientific | 0 (0.0%) | 0 (0.0%) |
| Enterprise Management | 0 (0.0%) | 0 (0.0%) |
| Administrative & Support | 0 (0.0%) | 0 (0.0%) |
| Educational Services | 0 (0.0%) | 0 (0.0%) |
| Health Care & Social Assistance | 0 (0.0%) | 1 (100.0%) |
| Arts, Entertainment & Recreation | 0 (0.0%) | 0 (0.0%) |
| Accommodation & Food Services | 0 (0.0%) | 0 (0.0%) |
| Public Administration | 0 (0.0%) | 0 (0.0%) |
| Total | 11 (73.3%) | 4 (26.7%) |
Education in Lock Springs
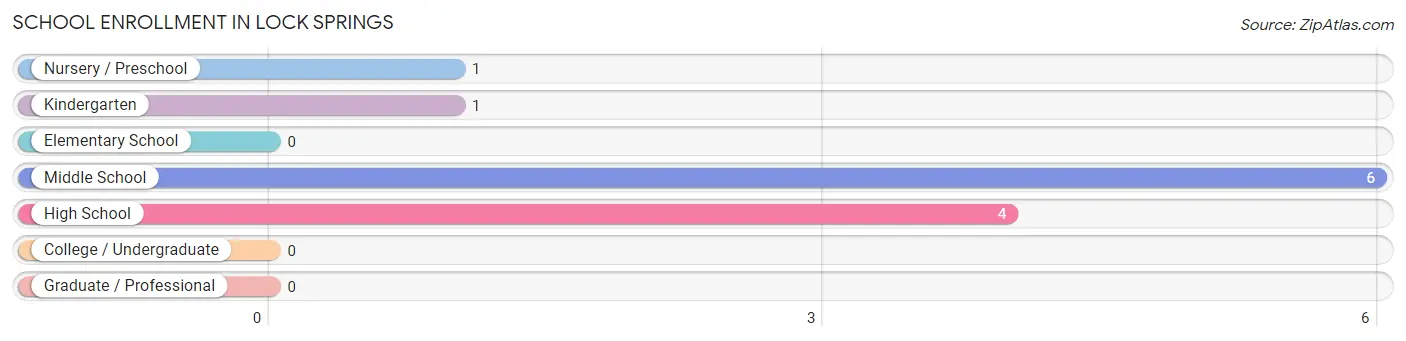
School Enrollment in Lock Springs
The most common levels of schooling among the 12 students in Lock Springs are middle school (6 | 50.0%), high school (4 | 33.3%), and nursery / preschool (1 | 8.3%).
| School Level | # Students | % Students |
| Nursery / Preschool | 1 | 8.3% |
| Kindergarten | 1 | 8.3% |
| Elementary School | 0 | 0.0% |
| Middle School | 6 | 50.0% |
| High School | 4 | 33.3% |
| College / Undergraduate | 0 | 0.0% |
| Graduate / Professional | 0 | 0.0% |
| Total | 12 | 100.0% |
School Enrollment by Age by Funding Source in Lock Springs
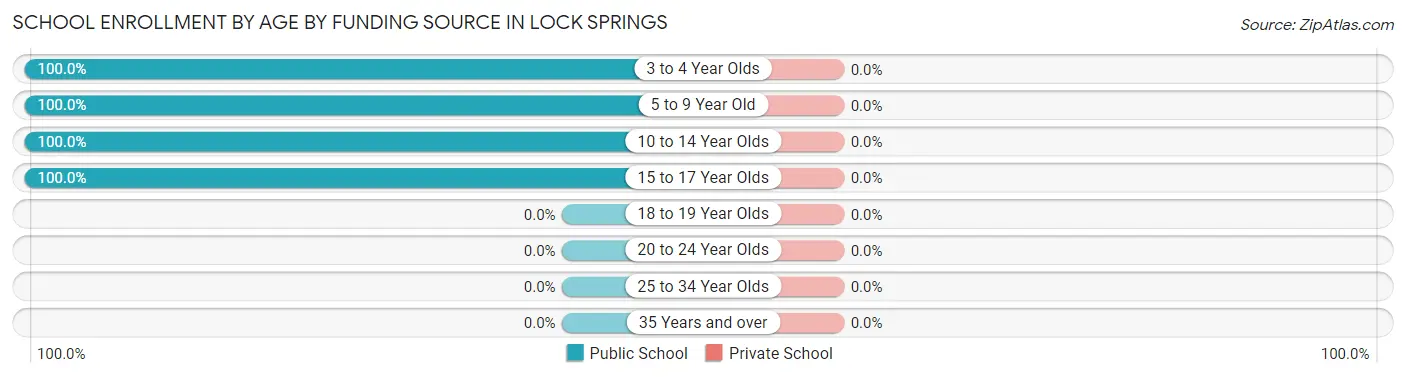
| Age Bracket | Public School | Private School |
| 3 to 4 Year Olds | 1 (100.0%) | 0 (0.0%) |
| 5 to 9 Year Old | 1 (100.0%) | 0 (0.0%) |
| 10 to 14 Year Olds | 6 (100.0%) | 0 (0.0%) |
| 15 to 17 Year Olds | 4 (100.0%) | 0 (0.0%) |
| 18 to 19 Year Olds | 0 (0.0%) | 0 (0.0%) |
| 20 to 24 Year Olds | 0 (0.0%) | 0 (0.0%) |
| 25 to 34 Year Olds | 0 (0.0%) | 0 (0.0%) |
| 35 Years and over | 0 (0.0%) | 0 (0.0%) |
| Total | 12 (100.0%) | 0 (0.0%) |
Educational Attainment by Field of Study in Lock Springs
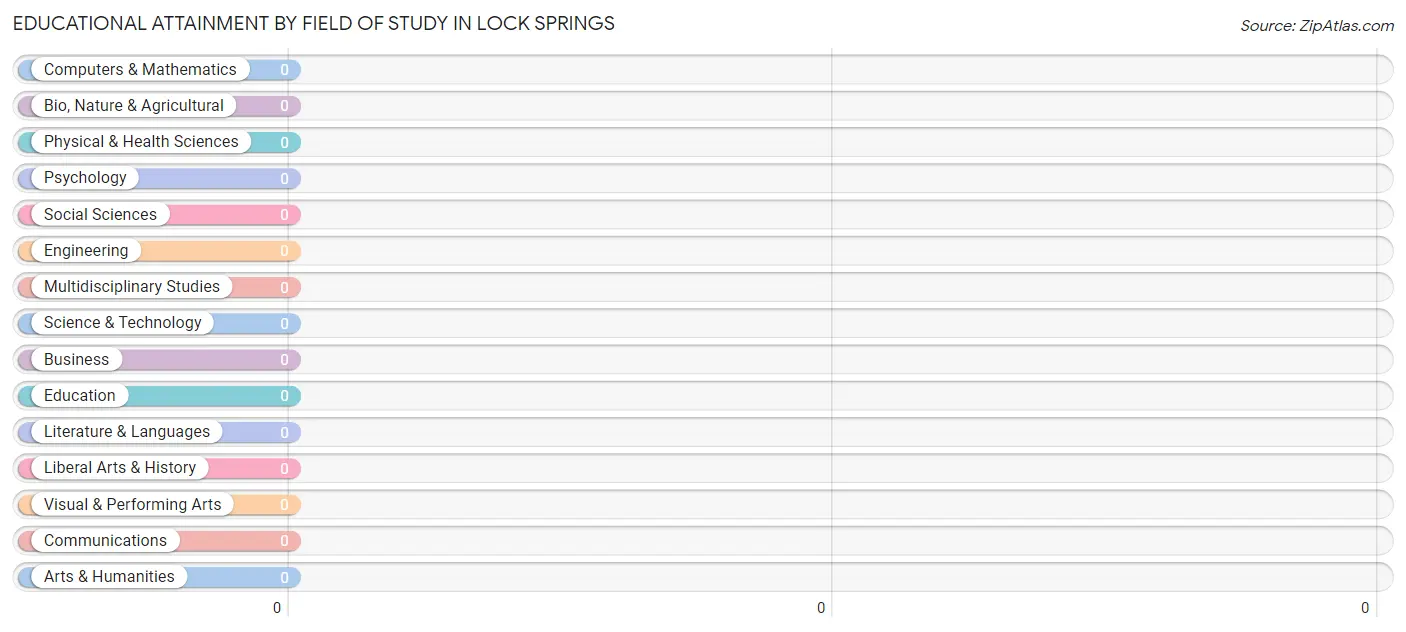
| Field of Study | # Graduates | % Graduates |
| Computers & Mathematics | 0 | 0.0% |
| Bio, Nature & Agricultural | 0 | 0.0% |
| Physical & Health Sciences | 0 | 0.0% |
| Psychology | 0 | 0.0% |
| Social Sciences | 0 | 0.0% |
| Engineering | 0 | 0.0% |
| Multidisciplinary Studies | 0 | 0.0% |
| Science & Technology | 0 | 0.0% |
| Business | 0 | 0.0% |
| Education | 0 | 0.0% |
| Literature & Languages | 0 | 0.0% |
| Liberal Arts & History | 0 | 0.0% |
| Visual & Performing Arts | 0 | 0.0% |
| Communications | 0 | 0.0% |
| Arts & Humanities | 0 | 0.0% |
| Total | 0 | 0.0% |
Transportation & Commute in Lock Springs
Vehicle Availability by Sex in Lock Springs
The most prevalent vehicle ownership categories in Lock Springs are males with 2 vehicles (10, accounting for 90.9%) and females with 2 vehicles (3, making up 250.0%).
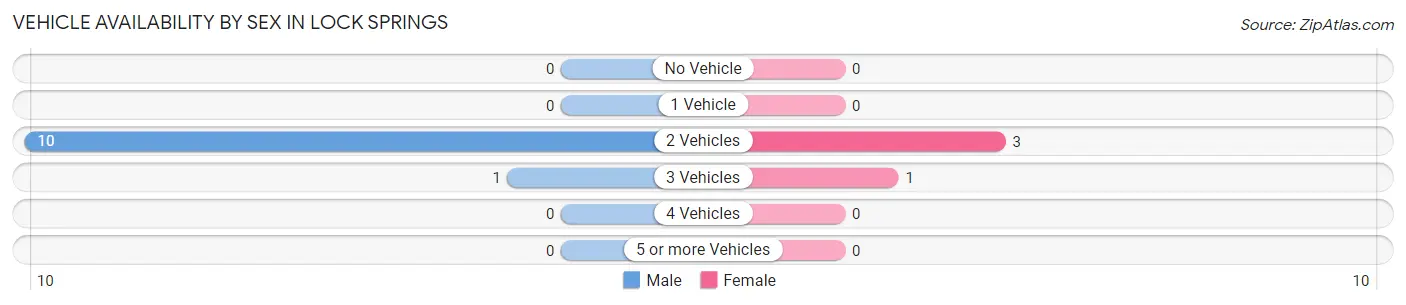
| Vehicles Available | Male | Female |
| No Vehicle | 0 (0.0%) | 0 (0.0%) |
| 1 Vehicle | 0 (0.0%) | 0 (0.0%) |
| 2 Vehicles | 10 (90.9%) | 3 (75.0%) |
| 3 Vehicles | 1 (9.1%) | 1 (25.0%) |
| 4 Vehicles | 0 (0.0%) | 0 (0.0%) |
| 5 or more Vehicles | 0 (0.0%) | 0 (0.0%) |
| Total | 11 (100.0%) | 4 (100.0%) |
Commute Time in Lock Springs
The most frequently occuring commute durations in Lock Springs are 25 to 29 minutes (3 commuters, 42.9%), 45 to 59 minutes (2 commuters, 28.6%), and 15 to 19 minutes (1 commuters, 14.3%).
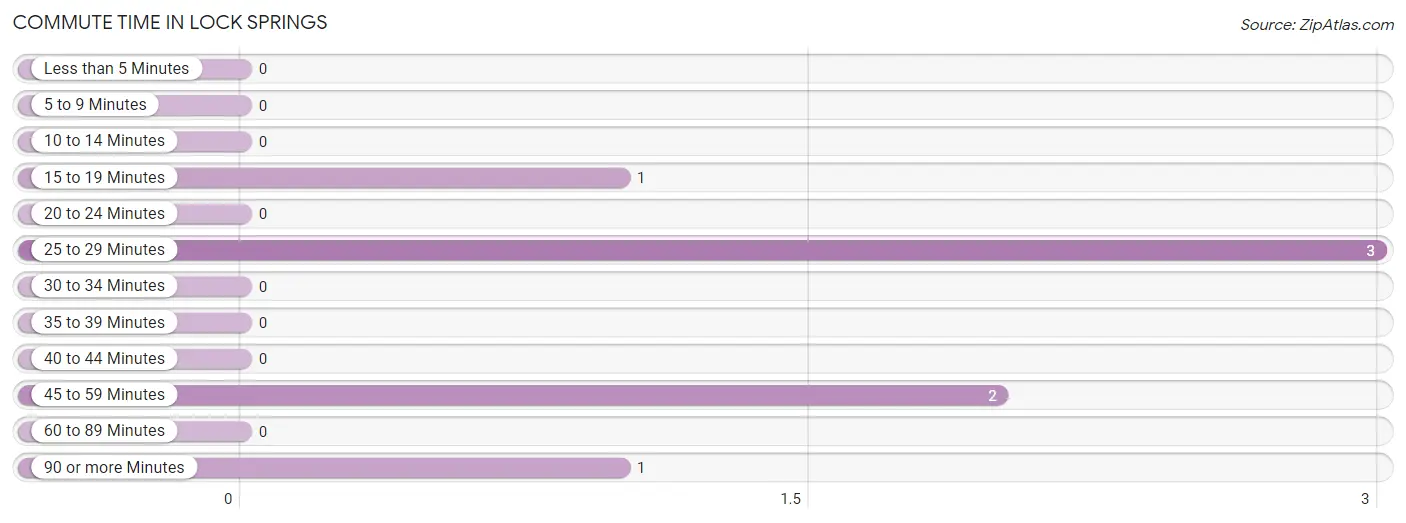
| Commute Time | # Commuters | % Commuters |
| Less than 5 Minutes | 0 | 0.0% |
| 5 to 9 Minutes | 0 | 0.0% |
| 10 to 14 Minutes | 0 | 0.0% |
| 15 to 19 Minutes | 1 | 14.3% |
| 20 to 24 Minutes | 0 | 0.0% |
| 25 to 29 Minutes | 3 | 42.9% |
| 30 to 34 Minutes | 0 | 0.0% |
| 35 to 39 Minutes | 0 | 0.0% |
| 40 to 44 Minutes | 0 | 0.0% |
| 45 to 59 Minutes | 2 | 28.6% |
| 60 to 89 Minutes | 0 | 0.0% |
| 90 or more Minutes | 1 | 14.3% |
Commute Time by Sex in Lock Springs
The most common commute times in Lock Springs are 45 to 59 minutes (2 commuters, 66.7%) for males and 25 to 29 minutes (3 commuters, 75.0%) for females.
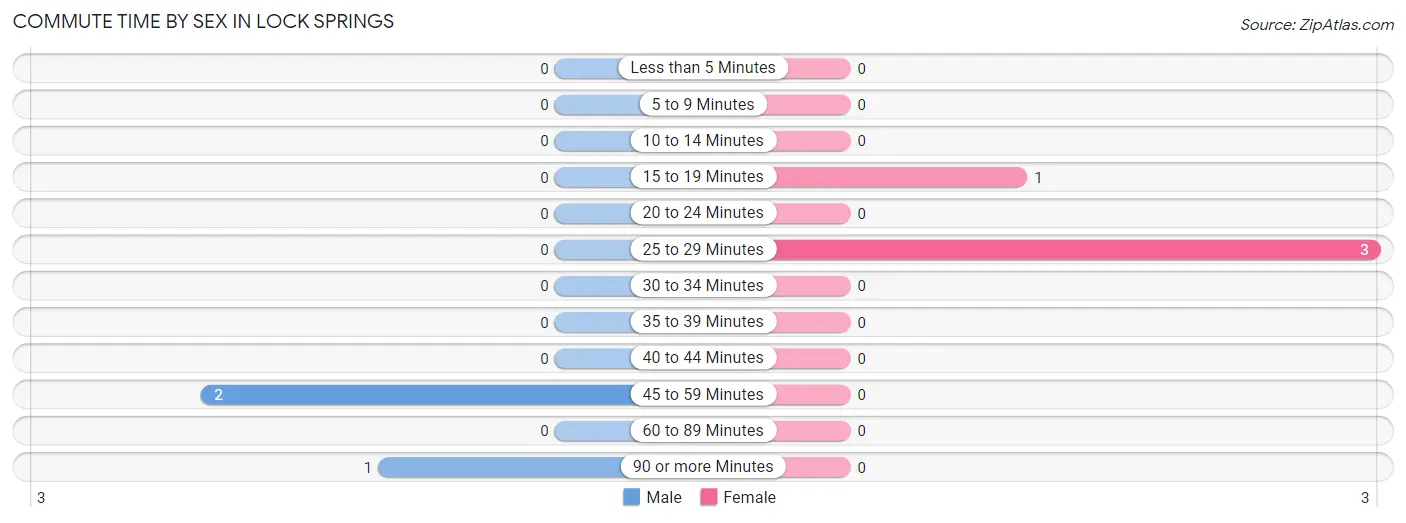
| Commute Time | Male | Female |
| Less than 5 Minutes | 0 (0.0%) | 0 (0.0%) |
| 5 to 9 Minutes | 0 (0.0%) | 0 (0.0%) |
| 10 to 14 Minutes | 0 (0.0%) | 0 (0.0%) |
| 15 to 19 Minutes | 0 (0.0%) | 1 (25.0%) |
| 20 to 24 Minutes | 0 (0.0%) | 0 (0.0%) |
| 25 to 29 Minutes | 0 (0.0%) | 3 (75.0%) |
| 30 to 34 Minutes | 0 (0.0%) | 0 (0.0%) |
| 35 to 39 Minutes | 0 (0.0%) | 0 (0.0%) |
| 40 to 44 Minutes | 0 (0.0%) | 0 (0.0%) |
| 45 to 59 Minutes | 2 (66.7%) | 0 (0.0%) |
| 60 to 89 Minutes | 0 (0.0%) | 0 (0.0%) |
| 90 or more Minutes | 1 (33.3%) | 0 (0.0%) |
Time of Departure to Work by Sex in Lock Springs
The most frequent times of departure to work in Lock Springs are 12:00 AM to 4:59 AM (1, 33.3%) for males and 12:00 AM to 4:59 AM (2, 50.0%) for females.
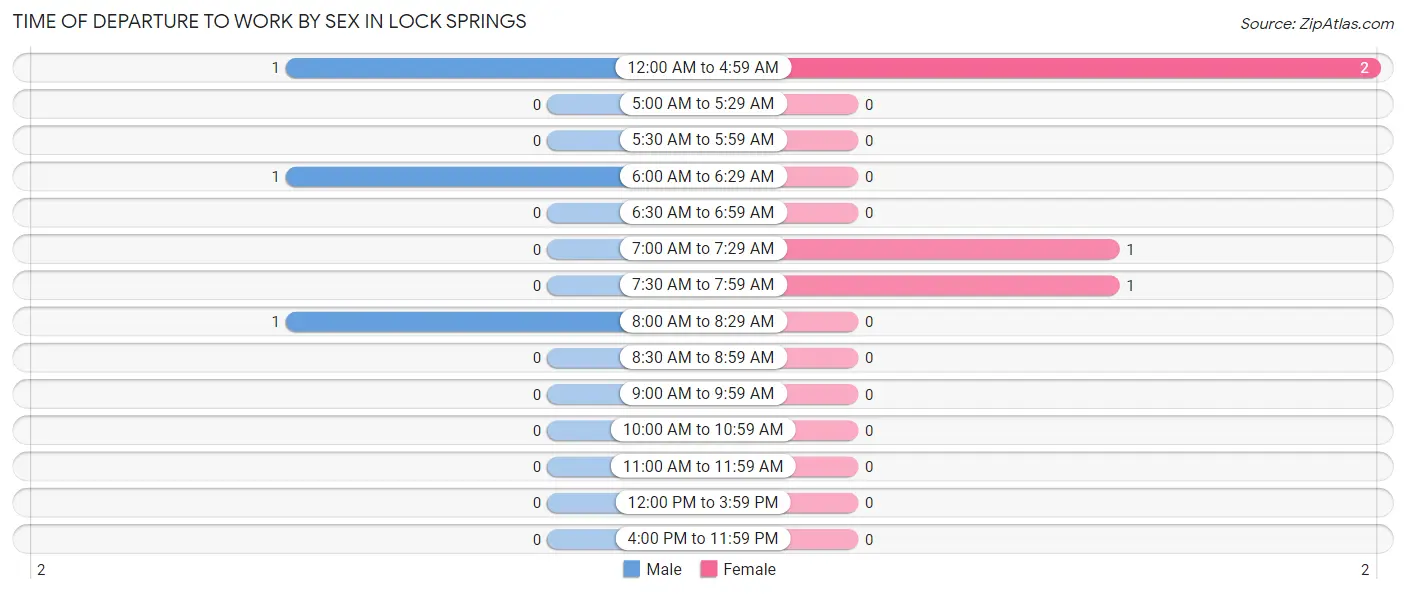
| Time of Departure | Male | Female |
| 12:00 AM to 4:59 AM | 1 (33.3%) | 2 (50.0%) |
| 5:00 AM to 5:29 AM | 0 (0.0%) | 0 (0.0%) |
| 5:30 AM to 5:59 AM | 0 (0.0%) | 0 (0.0%) |
| 6:00 AM to 6:29 AM | 1 (33.3%) | 0 (0.0%) |
| 6:30 AM to 6:59 AM | 0 (0.0%) | 0 (0.0%) |
| 7:00 AM to 7:29 AM | 0 (0.0%) | 1 (25.0%) |
| 7:30 AM to 7:59 AM | 0 (0.0%) | 1 (25.0%) |
| 8:00 AM to 8:29 AM | 1 (33.3%) | 0 (0.0%) |
| 8:30 AM to 8:59 AM | 0 (0.0%) | 0 (0.0%) |
| 9:00 AM to 9:59 AM | 0 (0.0%) | 0 (0.0%) |
| 10:00 AM to 10:59 AM | 0 (0.0%) | 0 (0.0%) |
| 11:00 AM to 11:59 AM | 0 (0.0%) | 0 (0.0%) |
| 12:00 PM to 3:59 PM | 0 (0.0%) | 0 (0.0%) |
| 4:00 PM to 11:59 PM | 0 (0.0%) | 0 (0.0%) |
| Total | 3 (100.0%) | 4 (100.0%) |
Housing Occupancy in Lock Springs
Occupancy by Ownership in Lock Springs
Of the total 13 dwellings in Lock Springs, owner-occupied units account for 9 (69.2%), while renter-occupied units make up 4 (30.8%).
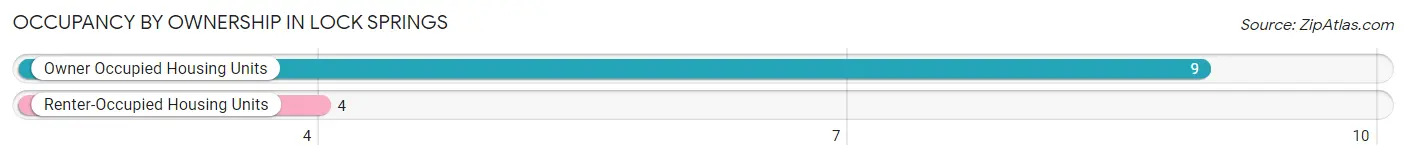
| Occupancy | # Housing Units | % Housing Units |
| Owner Occupied Housing Units | 9 | 69.2% |
| Renter-Occupied Housing Units | 4 | 30.8% |
| Total Occupied Housing Units | 13 | 100.0% |
Occupancy by Household Size in Lock Springs
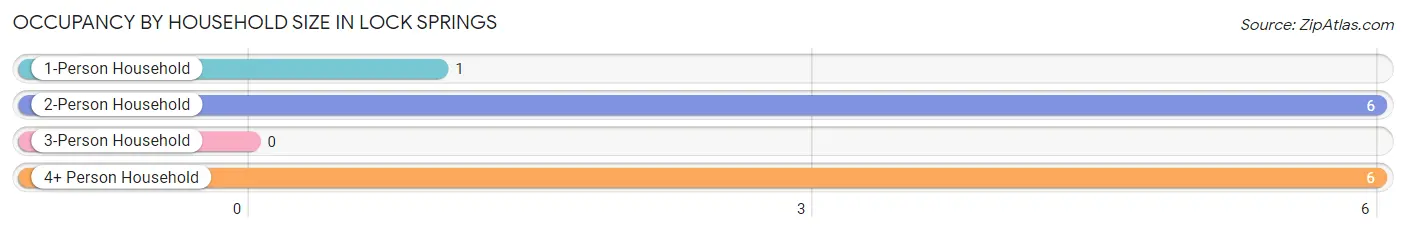
| Household Size | # Housing Units | % Housing Units |
| 1-Person Household | 1 | 7.7% |
| 2-Person Household | 6 | 46.2% |
| 3-Person Household | 0 | 0.0% |
| 4+ Person Household | 6 | 46.2% |
| Total Housing Units | 13 | 100.0% |
Occupancy by Ownership by Household Size in Lock Springs
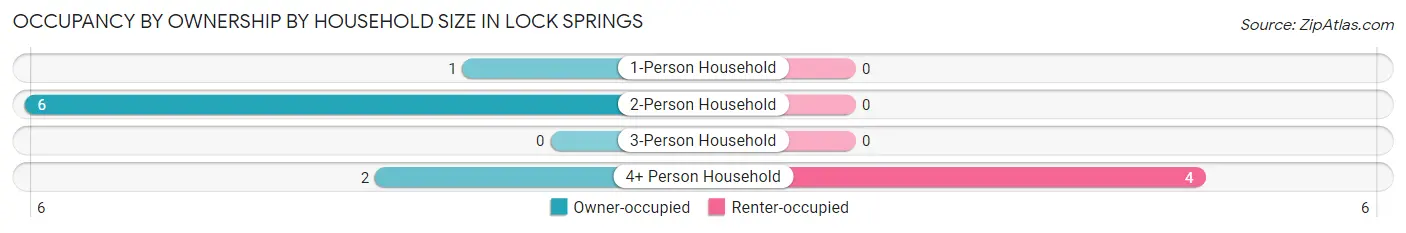
| Household Size | Owner-occupied | Renter-occupied |
| 1-Person Household | 1 (100.0%) | 0 (0.0%) |
| 2-Person Household | 6 (100.0%) | 0 (0.0%) |
| 3-Person Household | 0 (0.0%) | 0 (0.0%) |
| 4+ Person Household | 2 (33.3%) | 4 (66.7%) |
| Total Housing Units | 9 (69.2%) | 4 (30.8%) |
Occupancy by Educational Attainment in Lock Springs
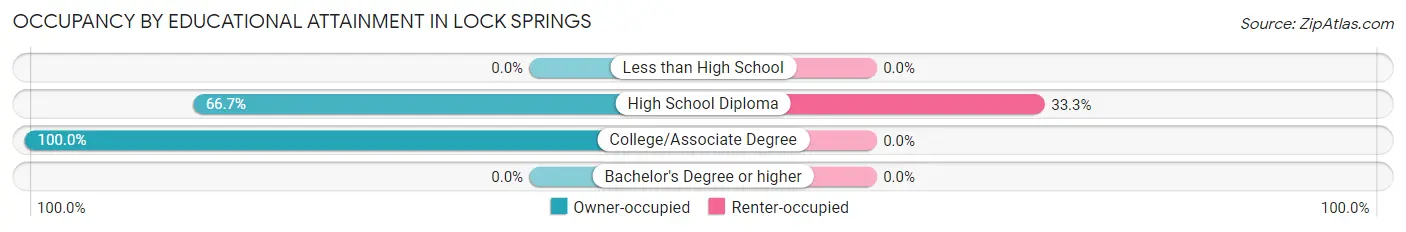
| Household Size | Owner-occupied | Renter-occupied |
| Less than High School | 0 (0.0%) | 0 (0.0%) |
| High School Diploma | 8 (66.7%) | 4 (33.3%) |
| College/Associate Degree | 1 (100.0%) | 0 (0.0%) |
| Bachelor's Degree or higher | 0 (0.0%) | 0 (0.0%) |
Occupancy by Age of Householder in Lock Springs
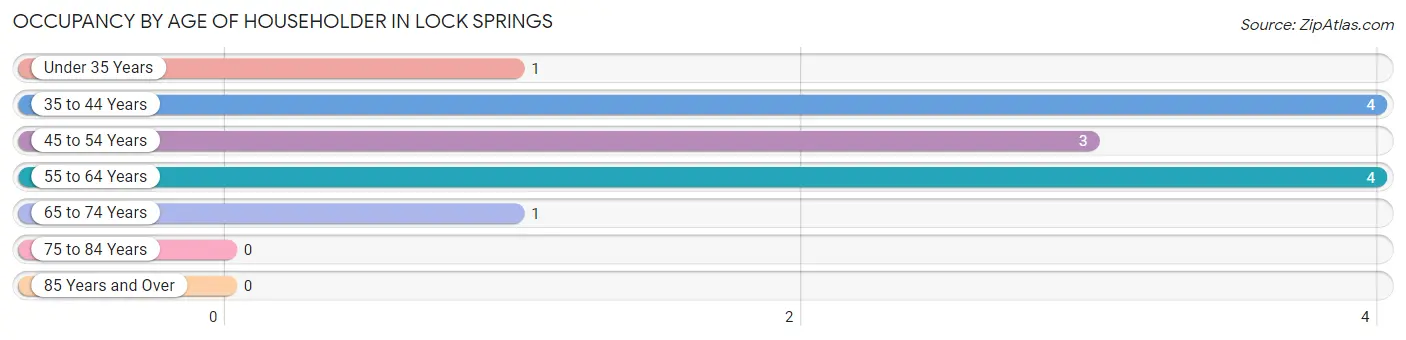
| Age Bracket | # Households | % Households |
| Under 35 Years | 1 | 7.7% |
| 35 to 44 Years | 4 | 30.8% |
| 45 to 54 Years | 3 | 23.1% |
| 55 to 64 Years | 4 | 30.8% |
| 65 to 74 Years | 1 | 7.7% |
| 75 to 84 Years | 0 | 0.0% |
| 85 Years and Over | 0 | 0.0% |
| Total | 13 | 100.0% |
Housing Finances in Lock Springs
Median Income by Occupancy in Lock Springs
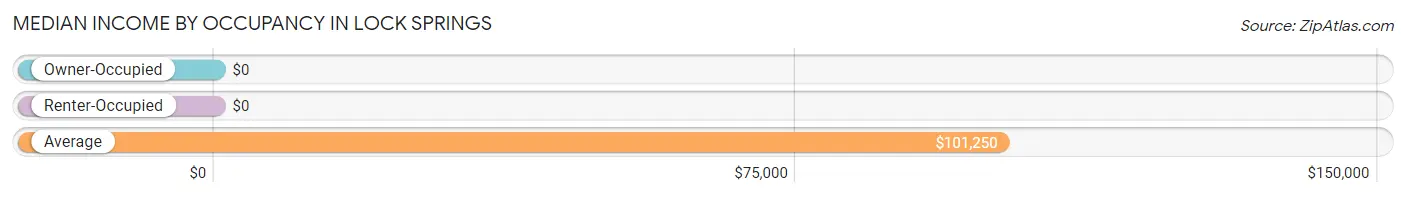
| Occupancy Type | # Households | Median Income |
| Owner-Occupied | 9 (69.2%) | $0 |
| Renter-Occupied | 4 (30.8%) | $0 |
| Average | 13 (100.0%) | $101,250 |
Occupancy by Householder Income Bracket in Lock Springs
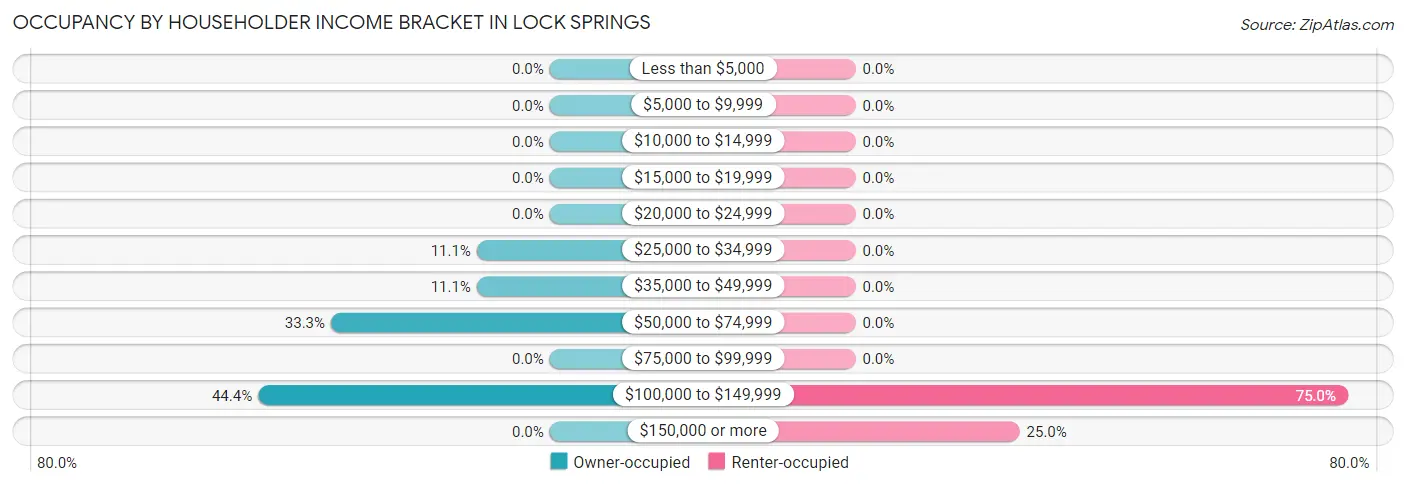
| Income Bracket | Owner-occupied | Renter-occupied |
| Less than $5,000 | 0 (0.0%) | 0 (0.0%) |
| $5,000 to $9,999 | 0 (0.0%) | 0 (0.0%) |
| $10,000 to $14,999 | 0 (0.0%) | 0 (0.0%) |
| $15,000 to $19,999 | 0 (0.0%) | 0 (0.0%) |
| $20,000 to $24,999 | 0 (0.0%) | 0 (0.0%) |
| $25,000 to $34,999 | 1 (11.1%) | 0 (0.0%) |
| $35,000 to $49,999 | 1 (11.1%) | 0 (0.0%) |
| $50,000 to $74,999 | 3 (33.3%) | 0 (0.0%) |
| $75,000 to $99,999 | 0 (0.0%) | 0 (0.0%) |
| $100,000 to $149,999 | 4 (44.4%) | 3 (75.0%) |
| $150,000 or more | 0 (0.0%) | 1 (25.0%) |
| Total | 9 (100.0%) | 4 (100.0%) |
Monthly Housing Cost Tiers in Lock Springs
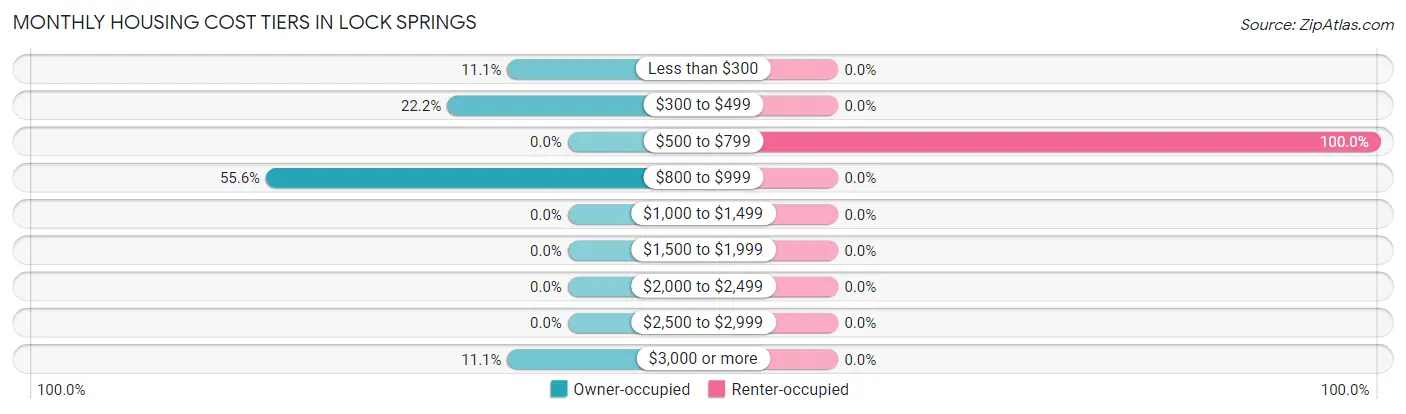
| Monthly Cost | Owner-occupied | Renter-occupied |
| Less than $300 | 1 (11.1%) | 0 (0.0%) |
| $300 to $499 | 2 (22.2%) | 0 (0.0%) |
| $500 to $799 | 0 (0.0%) | 4 (100.0%) |
| $800 to $999 | 5 (55.6%) | 0 (0.0%) |
| $1,000 to $1,499 | 0 (0.0%) | 0 (0.0%) |
| $1,500 to $1,999 | 0 (0.0%) | 0 (0.0%) |
| $2,000 to $2,499 | 0 (0.0%) | 0 (0.0%) |
| $2,500 to $2,999 | 0 (0.0%) | 0 (0.0%) |
| $3,000 or more | 1 (11.1%) | 0 (0.0%) |
| Total | 9 (100.0%) | 4 (100.0%) |
Physical Housing Characteristics in Lock Springs
Housing Structures in Lock Springs
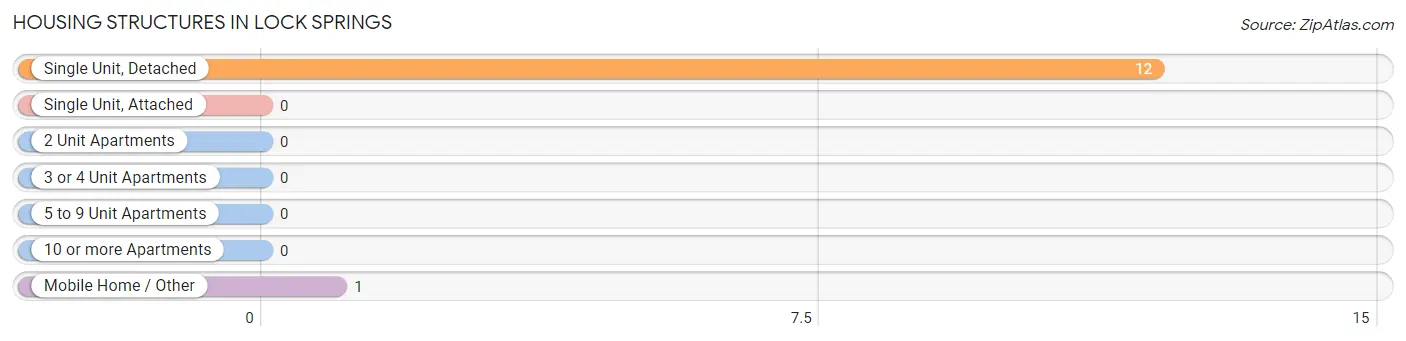
| Structure Type | # Housing Units | % Housing Units |
| Single Unit, Detached | 12 | 92.3% |
| Single Unit, Attached | 0 | 0.0% |
| 2 Unit Apartments | 0 | 0.0% |
| 3 or 4 Unit Apartments | 0 | 0.0% |
| 5 to 9 Unit Apartments | 0 | 0.0% |
| 10 or more Apartments | 0 | 0.0% |
| Mobile Home / Other | 1 | 7.7% |
| Total | 13 | 100.0% |
Housing Structures by Occupancy in Lock Springs
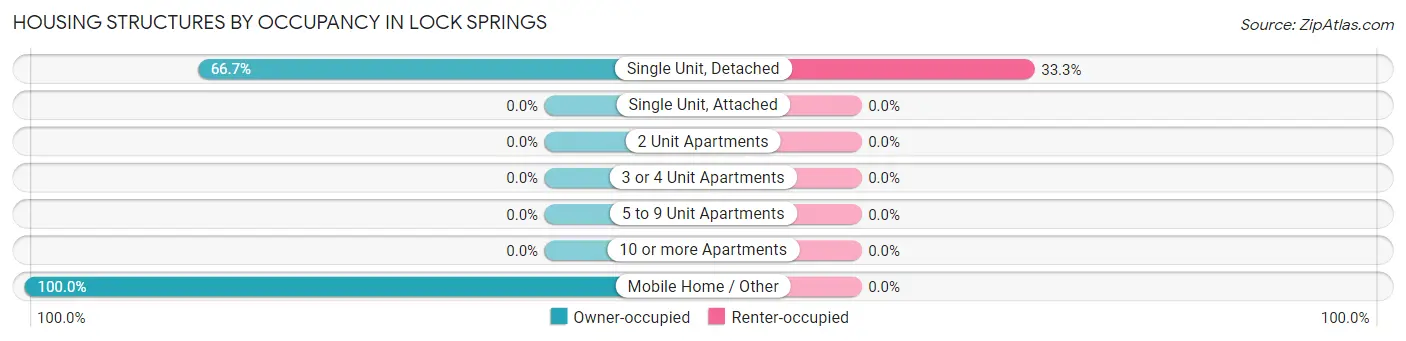
| Structure Type | Owner-occupied | Renter-occupied |
| Single Unit, Detached | 8 (66.7%) | 4 (33.3%) |
| Single Unit, Attached | 0 (0.0%) | 0 (0.0%) |
| 2 Unit Apartments | 0 (0.0%) | 0 (0.0%) |
| 3 or 4 Unit Apartments | 0 (0.0%) | 0 (0.0%) |
| 5 to 9 Unit Apartments | 0 (0.0%) | 0 (0.0%) |
| 10 or more Apartments | 0 (0.0%) | 0 (0.0%) |
| Mobile Home / Other | 1 (100.0%) | 0 (0.0%) |
| Total | 9 (69.2%) | 4 (30.8%) |
Housing Structures by Number of Rooms in Lock Springs
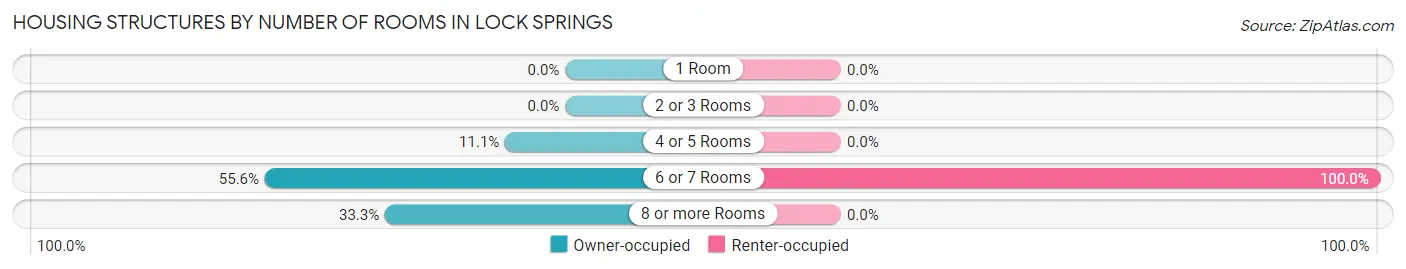
| Number of Rooms | Owner-occupied | Renter-occupied |
| 1 Room | 0 (0.0%) | 0 (0.0%) |
| 2 or 3 Rooms | 0 (0.0%) | 0 (0.0%) |
| 4 or 5 Rooms | 1 (11.1%) | 0 (0.0%) |
| 6 or 7 Rooms | 5 (55.6%) | 4 (100.0%) |
| 8 or more Rooms | 3 (33.3%) | 0 (0.0%) |
| Total | 9 (100.0%) | 4 (100.0%) |
Housing Structure by Heating Type in Lock Springs
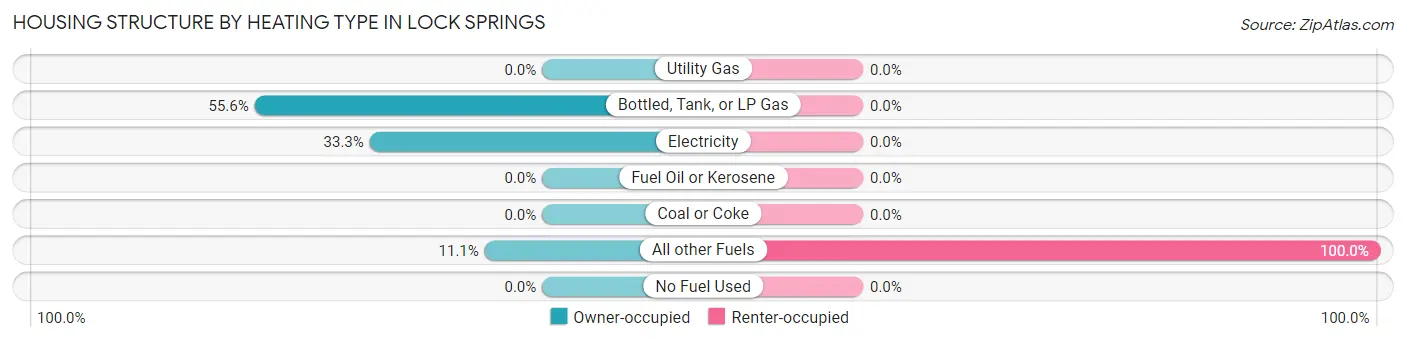
| Heating Type | Owner-occupied | Renter-occupied |
| Utility Gas | 0 (0.0%) | 0 (0.0%) |
| Bottled, Tank, or LP Gas | 5 (55.6%) | 0 (0.0%) |
| Electricity | 3 (33.3%) | 0 (0.0%) |
| Fuel Oil or Kerosene | 0 (0.0%) | 0 (0.0%) |
| Coal or Coke | 0 (0.0%) | 0 (0.0%) |
| All other Fuels | 1 (11.1%) | 4 (100.0%) |
| No Fuel Used | 0 (0.0%) | 0 (0.0%) |
| Total | 9 (100.0%) | 4 (100.0%) |
Household Vehicle Usage in Lock Springs
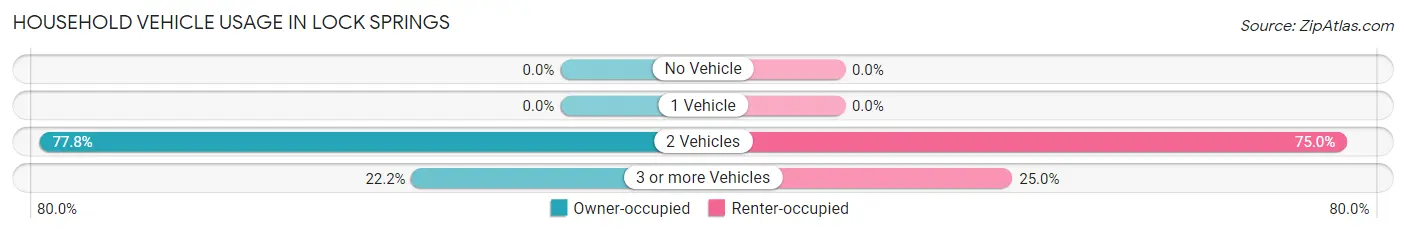
| Vehicles per Household | Owner-occupied | Renter-occupied |
| No Vehicle | 0 (0.0%) | 0 (0.0%) |
| 1 Vehicle | 0 (0.0%) | 0 (0.0%) |
| 2 Vehicles | 7 (77.8%) | 3 (75.0%) |
| 3 or more Vehicles | 2 (22.2%) | 1 (25.0%) |
| Total | 9 (100.0%) | 4 (100.0%) |
Real Estate & Mortgages in Lock Springs
Real Estate and Mortgage Overview in Lock Springs
| Characteristic | Without Mortgage | With Mortgage |
| Housing Units | 3 | 6 |
| Median Property Value | $55,000 | $158,300 |
| Median Household Income | - | - |
| Monthly Housing Costs | $325 | $1 |
| Real Estate Taxes | - | - |
Property Value by Mortgage Status in Lock Springs
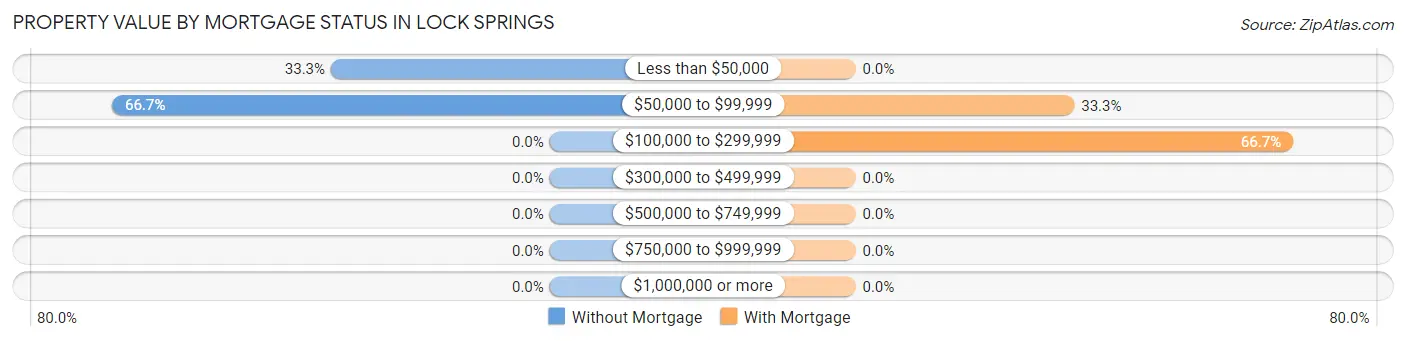
| Property Value | Without Mortgage | With Mortgage |
| Less than $50,000 | 1 (33.3%) | 0 (0.0%) |
| $50,000 to $99,999 | 2 (66.7%) | 2 (33.3%) |
| $100,000 to $299,999 | 0 (0.0%) | 4 (66.7%) |
| $300,000 to $499,999 | 0 (0.0%) | 0 (0.0%) |
| $500,000 to $749,999 | 0 (0.0%) | 0 (0.0%) |
| $750,000 to $999,999 | 0 (0.0%) | 0 (0.0%) |
| $1,000,000 or more | 0 (0.0%) | 0 (0.0%) |
| Total | 3 (100.0%) | 6 (100.0%) |
Household Income by Mortgage Status in Lock Springs
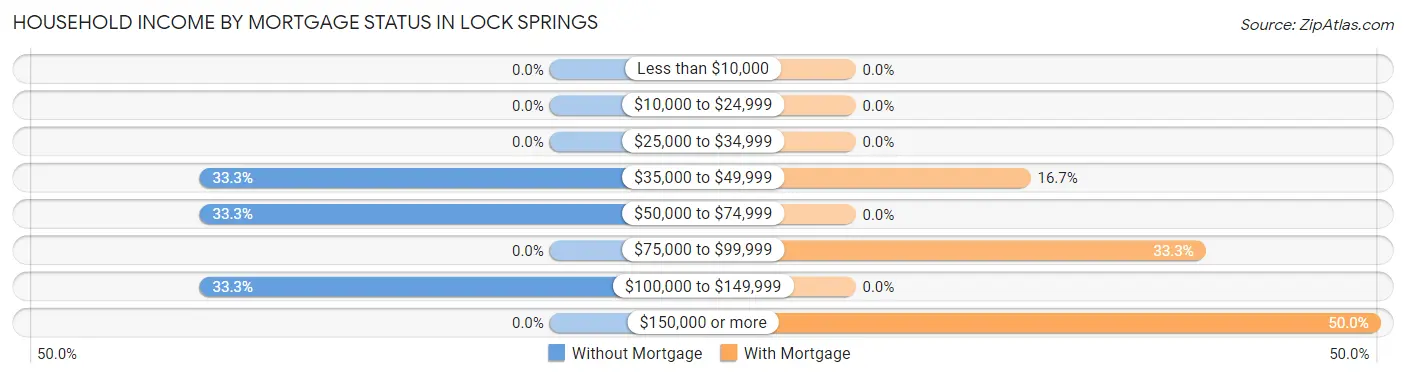
| Household Income | Without Mortgage | With Mortgage |
| Less than $10,000 | 0 (0.0%) | 0 (0.0%) |
| $10,000 to $24,999 | 0 (0.0%) | 0 (0.0%) |
| $25,000 to $34,999 | 0 (0.0%) | 0 (0.0%) |
| $35,000 to $49,999 | 1 (33.3%) | 1 (16.7%) |
| $50,000 to $74,999 | 1 (33.3%) | 0 (0.0%) |
| $75,000 to $99,999 | 0 (0.0%) | 2 (33.3%) |
| $100,000 to $149,999 | 1 (33.3%) | 0 (0.0%) |
| $150,000 or more | 0 (0.0%) | 3 (50.0%) |
| Total | 3 (100.0%) | 6 (100.0%) |
Property Value to Household Income Ratio in Lock Springs
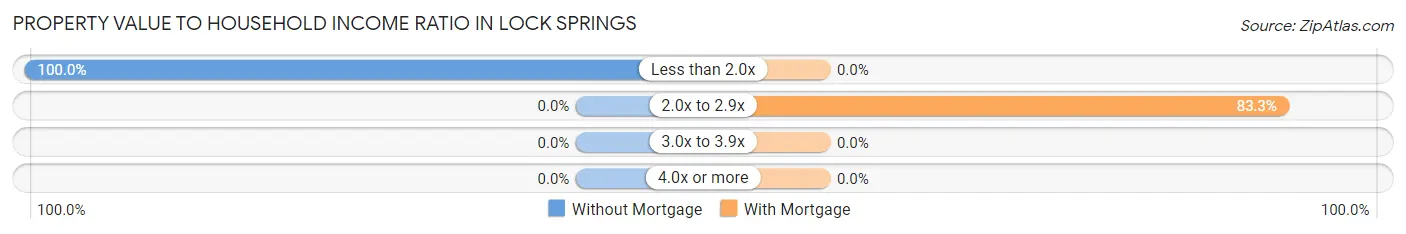
| Value-to-Income Ratio | Without Mortgage | With Mortgage |
| Less than 2.0x | 3 (100.0%) | 0 (0.0%) |
| 2.0x to 2.9x | 0 (0.0%) | 5 (83.3%) |
| 3.0x to 3.9x | 0 (0.0%) | 0 (0.0%) |
| 4.0x or more | 0 (0.0%) | 0 (0.0%) |
| Total | 3 (100.0%) | 6 (100.0%) |
Real Estate Taxes by Mortgage Status in Lock Springs
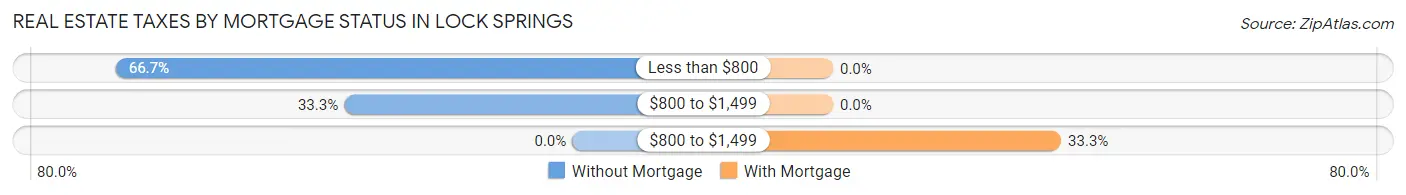
| Property Taxes | Without Mortgage | With Mortgage |
| Less than $800 | 2 (66.7%) | 0 (0.0%) |
| $800 to $1,499 | 1 (33.3%) | 0 (0.0%) |
| $800 to $1,499 | 0 (0.0%) | 2 (33.3%) |
| Total | 3 (100.0%) | 6 (100.0%) |
Health & Disability in Lock Springs
Health Insurance Coverage by Age in Lock Springs
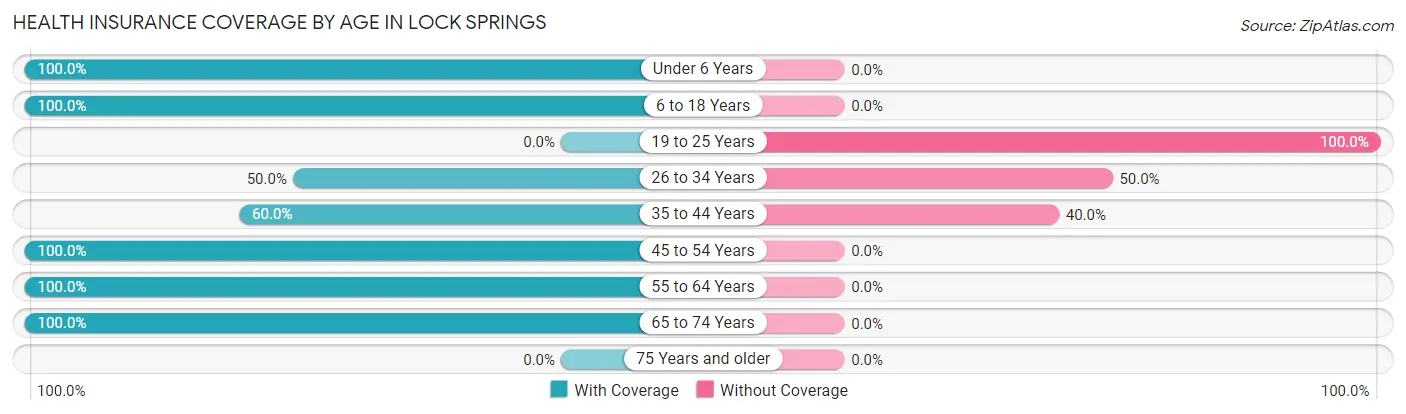
| Age Bracket | With Coverage | Without Coverage |
| Under 6 Years | 2 (100.0%) | 0 (0.0%) |
| 6 to 18 Years | 10 (100.0%) | 0 (0.0%) |
| 19 to 25 Years | 0 (0.0%) | 2 (100.0%) |
| 26 to 34 Years | 2 (50.0%) | 2 (50.0%) |
| 35 to 44 Years | 3 (60.0%) | 2 (40.0%) |
| 45 to 54 Years | 3 (100.0%) | 0 (0.0%) |
| 55 to 64 Years | 12 (100.0%) | 0 (0.0%) |
| 65 to 74 Years | 2 (100.0%) | 0 (0.0%) |
| 75 Years and older | 0 (0.0%) | 0 (0.0%) |
| Total | 34 (85.0%) | 6 (15.0%) |
Health Insurance Coverage by Citizenship Status in Lock Springs
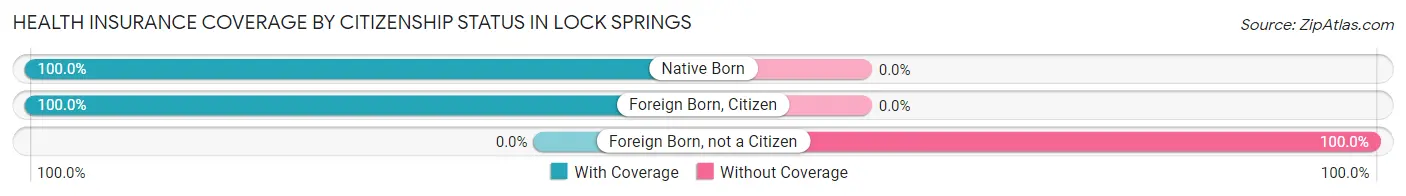
| Citizenship Status | With Coverage | Without Coverage |
| Native Born | 2 (100.0%) | 0 (0.0%) |
| Foreign Born, Citizen | 10 (100.0%) | 0 (0.0%) |
| Foreign Born, not a Citizen | 0 (0.0%) | 2 (100.0%) |
Health Insurance Coverage by Household Income in Lock Springs
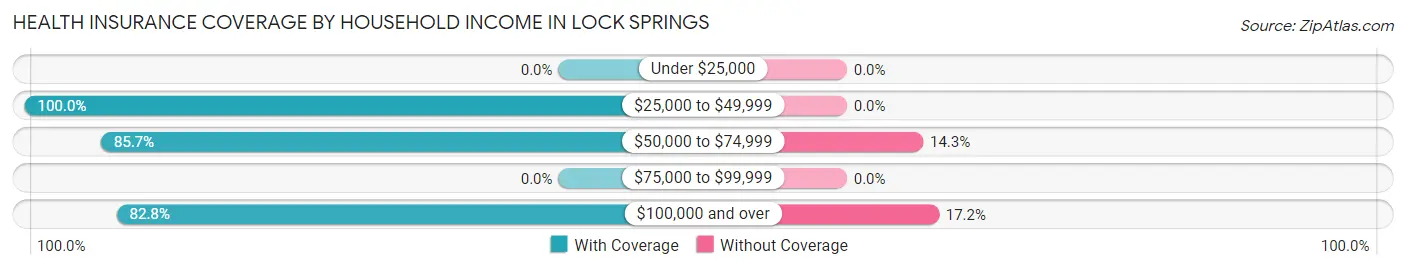
| Household Income | With Coverage | Without Coverage |
| Under $25,000 | 0 (0.0%) | 0 (0.0%) |
| $25,000 to $49,999 | 4 (100.0%) | 0 (0.0%) |
| $50,000 to $74,999 | 6 (85.7%) | 1 (14.3%) |
| $75,000 to $99,999 | 0 (0.0%) | 0 (0.0%) |
| $100,000 and over | 24 (82.8%) | 5 (17.2%) |
Public vs Private Health Insurance Coverage by Age in Lock Springs
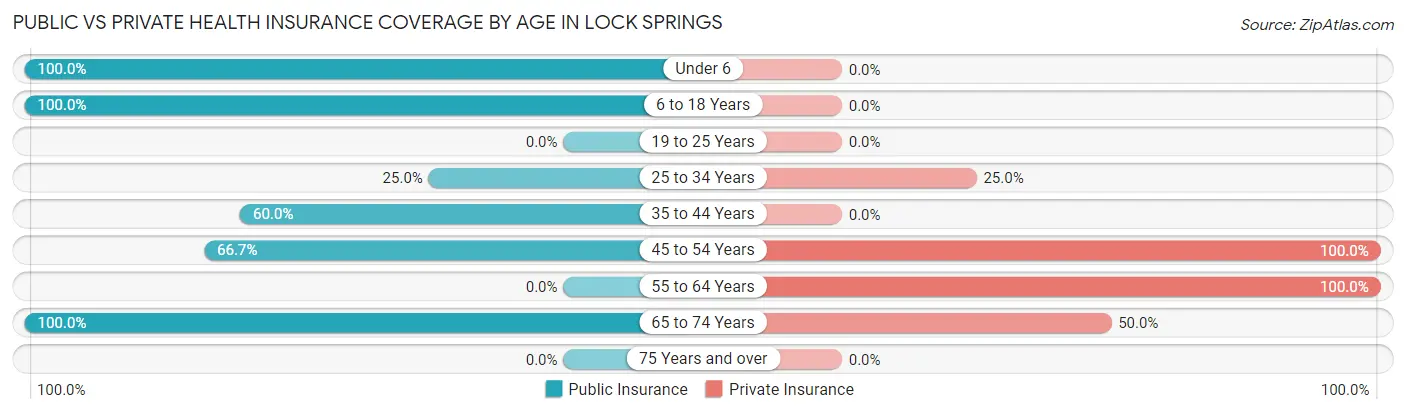
| Age Bracket | Public Insurance | Private Insurance |
| Under 6 | 2 (100.0%) | 0 (0.0%) |
| 6 to 18 Years | 10 (100.0%) | 0 (0.0%) |
| 19 to 25 Years | 0 (0.0%) | 0 (0.0%) |
| 25 to 34 Years | 1 (25.0%) | 1 (25.0%) |
| 35 to 44 Years | 3 (60.0%) | 0 (0.0%) |
| 45 to 54 Years | 2 (66.7%) | 3 (100.0%) |
| 55 to 64 Years | 0 (0.0%) | 12 (100.0%) |
| 65 to 74 Years | 2 (100.0%) | 1 (50.0%) |
| 75 Years and over | 0 (0.0%) | 0 (0.0%) |
| Total | 20 (50.0%) | 17 (42.5%) |
Disability Status by Sex by Age in Lock Springs
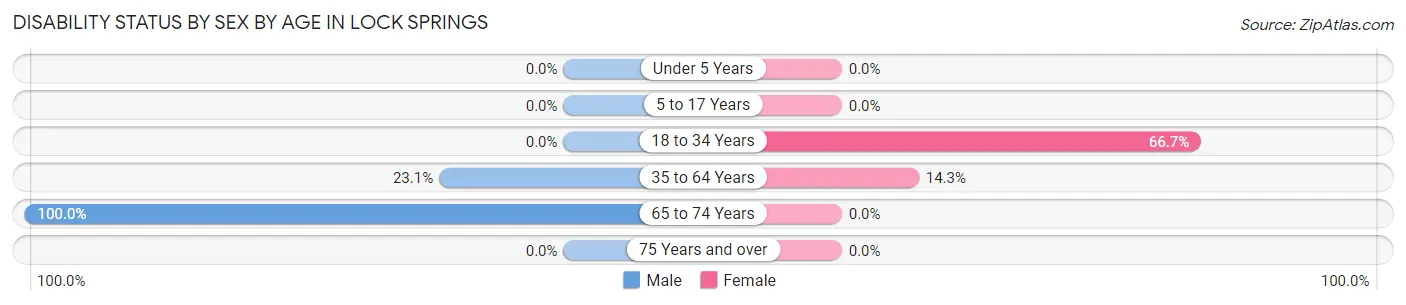
| Age Bracket | Male | Female |
| Under 5 Years | 0 (0.0%) | 0 (0.0%) |
| 5 to 17 Years | 0 (0.0%) | 0 (0.0%) |
| 18 to 34 Years | 0 (0.0%) | 2 (66.7%) |
| 35 to 64 Years | 3 (23.1%) | 1 (14.3%) |
| 65 to 74 Years | 1 (100.0%) | 0 (0.0%) |
| 75 Years and over | 0 (0.0%) | 0 (0.0%) |
Disability Class by Sex by Age in Lock Springs
Disability Class: Hearing Difficulty
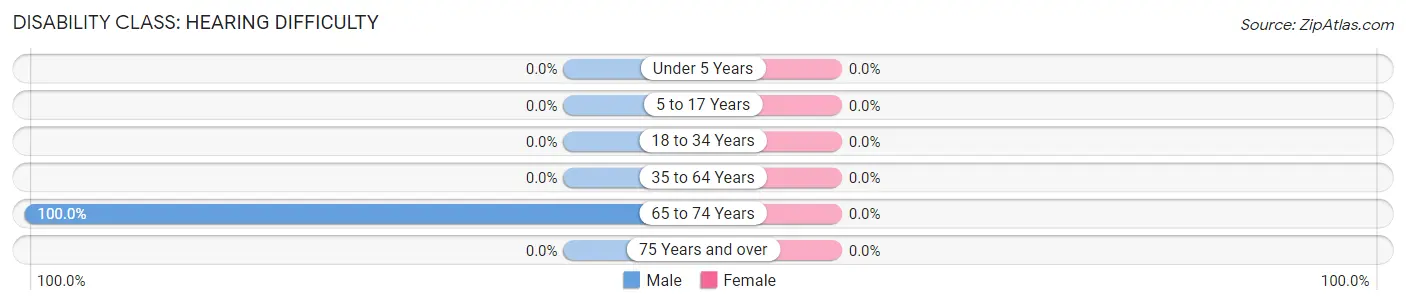
| Age Bracket | Male | Female |
| Under 5 Years | 0 (0.0%) | 0 (0.0%) |
| 5 to 17 Years | 0 (0.0%) | 0 (0.0%) |
| 18 to 34 Years | 0 (0.0%) | 0 (0.0%) |
| 35 to 64 Years | 0 (0.0%) | 0 (0.0%) |
| 65 to 74 Years | 1 (100.0%) | 0 (0.0%) |
| 75 Years and over | 0 (0.0%) | 0 (0.0%) |
Disability Class: Vision Difficulty
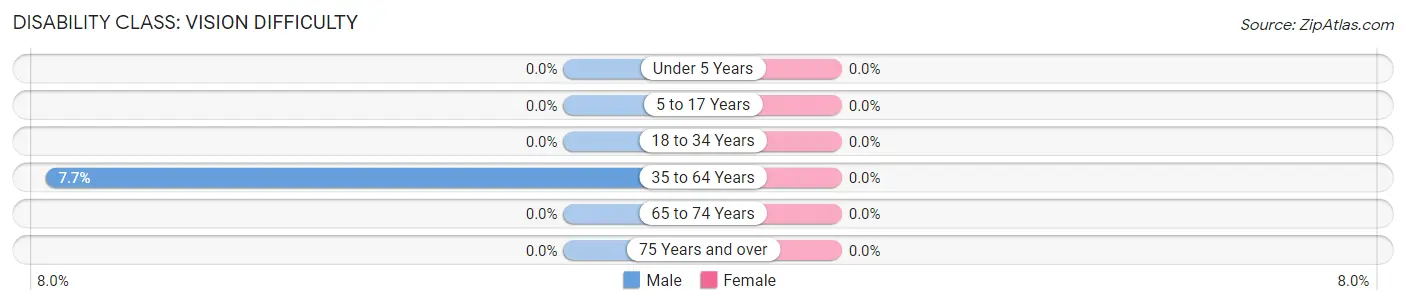
| Age Bracket | Male | Female |
| Under 5 Years | 0 (0.0%) | 0 (0.0%) |
| 5 to 17 Years | 0 (0.0%) | 0 (0.0%) |
| 18 to 34 Years | 0 (0.0%) | 0 (0.0%) |
| 35 to 64 Years | 1 (7.7%) | 0 (0.0%) |
| 65 to 74 Years | 0 (0.0%) | 0 (0.0%) |
| 75 Years and over | 0 (0.0%) | 0 (0.0%) |
Disability Class: Cognitive Difficulty
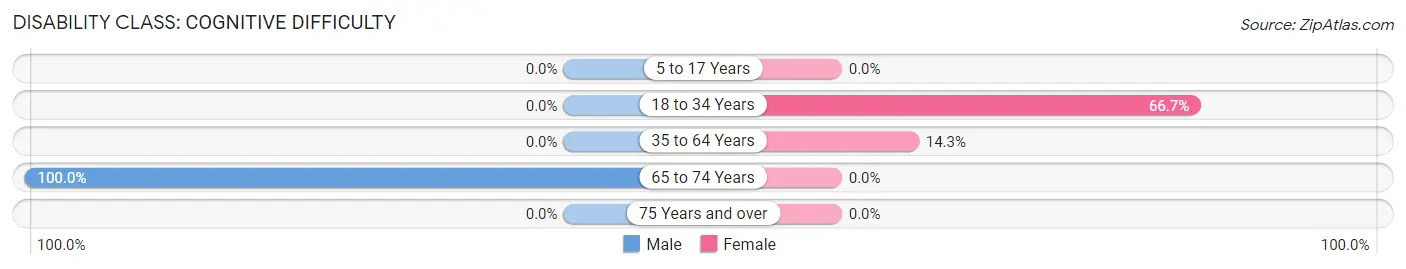
| Age Bracket | Male | Female |
| 5 to 17 Years | 0 (0.0%) | 0 (0.0%) |
| 18 to 34 Years | 0 (0.0%) | 2 (66.7%) |
| 35 to 64 Years | 0 (0.0%) | 1 (14.3%) |
| 65 to 74 Years | 1 (100.0%) | 0 (0.0%) |
| 75 Years and over | 0 (0.0%) | 0 (0.0%) |
Disability Class: Ambulatory Difficulty
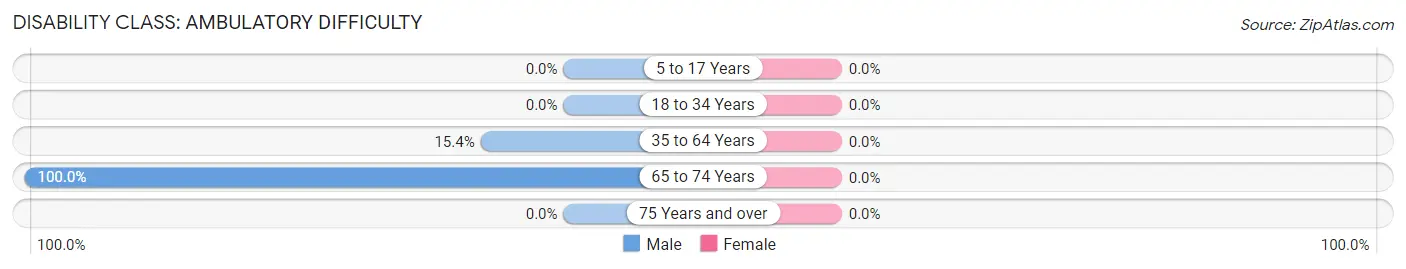
| Age Bracket | Male | Female |
| 5 to 17 Years | 0 (0.0%) | 0 (0.0%) |
| 18 to 34 Years | 0 (0.0%) | 0 (0.0%) |
| 35 to 64 Years | 2 (15.4%) | 0 (0.0%) |
| 65 to 74 Years | 1 (100.0%) | 0 (0.0%) |
| 75 Years and over | 0 (0.0%) | 0 (0.0%) |
Disability Class: Self-Care Difficulty
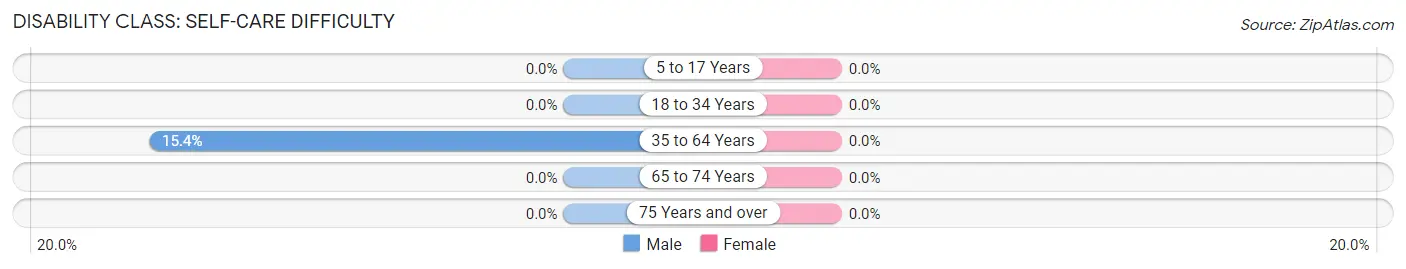
| Age Bracket | Male | Female |
| 5 to 17 Years | 0 (0.0%) | 0 (0.0%) |
| 18 to 34 Years | 0 (0.0%) | 0 (0.0%) |
| 35 to 64 Years | 2 (15.4%) | 0 (0.0%) |
| 65 to 74 Years | 0 (0.0%) | 0 (0.0%) |
| 75 Years and over | 0 (0.0%) | 0 (0.0%) |
Technology Access in Lock Springs
Computing Device Access in Lock Springs
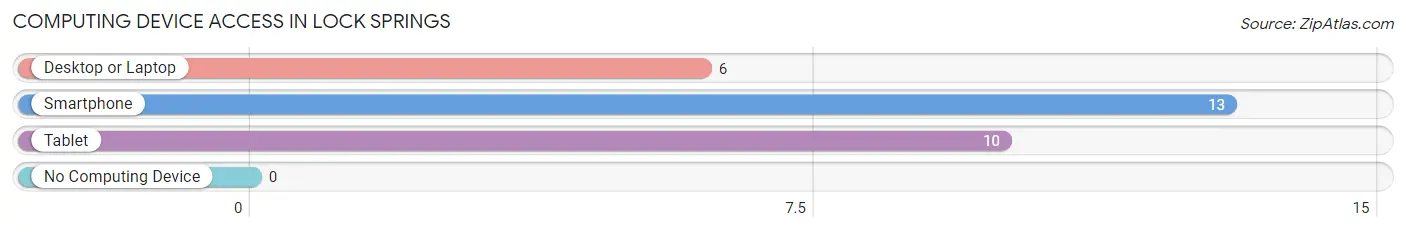
| Device Type | # Households | % Households |
| Desktop or Laptop | 6 | 46.2% |
| Smartphone | 13 | 100.0% |
| Tablet | 10 | 76.9% |
| No Computing Device | 0 | 0.0% |
| Total | 13 | 100.0% |
Internet Access in Lock Springs
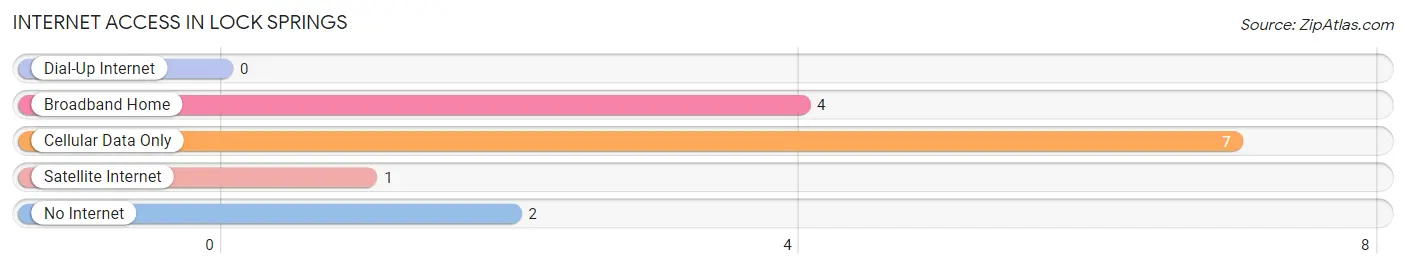
| Internet Type | # Households | % Households |
| Dial-Up Internet | 0 | 0.0% |
| Broadband Home | 4 | 30.8% |
| Cellular Data Only | 7 | 53.8% |
| Satellite Internet | 1 | 7.7% |
| No Internet | 2 | 15.4% |
| Total | 13 | 100.0% |
Lock Springs Summary
Springs, Missouri is a small town located in the Ozark Mountains of southwestern Missouri. It is situated in Taney County, approximately 20 miles south of Branson and about 30 miles north of Harrison, Arkansas. The town was founded in 1883 and was named after the nearby springs that provided water to the area. The population of Spring in 2000 was 1,845.
Geography
Springs is located in the Ozark Mountains of southwestern Missouri. It is situated in Taney County, approximately 20 miles south of Branson and about 30 miles north of Harrison, Arkansas. The town is located in the Mark Twain National Forest and is surrounded by rolling hills and forests. The town is situated on the White River, which is a tributary of the Arkansas River. The town is located at an elevation of 1,200 feet above sea level.
Economy
The economy of Springs is largely based on tourism and agriculture. The town is home to several tourist attractions, including the Shepherd of the Hills Fish Hatchery, the Shepherd of the Hills Outdoor Theater, and the Shepherd of the Hills Homestead. The town is also home to several wineries and vineyards, as well as a number of restaurants and shops. Agriculture is also an important part of the local economy, with the town being home to several farms and ranches.
Demographics
As of the 2000 census, the population of Springs was 1,845. The racial makeup of the town was 97.2% White, 0.3% African American, 0.2% Native American, 0.2% Asian, 0.1% Pacific Islander, 0.7% from other races, and 1.3% from two or more races. Hispanic or Latino of any race were 1.7% of the population.
The median income for a household in the town was $30,938, and the median income for a family was $36,250. Males had a median income of $27,500 versus $20,000 for females. The per capita income for the town was $15,945. About 11.2% of families and 14.2% of the population were below the poverty line, including 18.2% of those under age 18 and 8.3% of those age 65 or over.
History
Springs was founded in 1883 and was named after the nearby springs that provided water to the area. The town was originally settled by farmers and ranchers, and the economy was largely based on agriculture. In the early 1900s, the town began to attract tourists, and the economy shifted to focus on tourism. The town was also home to several wineries and vineyards, as well as a number of restaurants and shops. In the 1950s, the town began to attract more visitors, and the economy shifted again to focus on tourism. The town has continued to attract visitors and is now a popular tourist destination.
Common Questions
What is the Total Population of Lock Springs?
Total Population of Lock Springs is 40.
What is the Total Male Population of Lock Springs?
Total Male Population of Lock Springs is 24.
What is the Total Female Population of Lock Springs?
Total Female Population of Lock Springs is 16.
What is the Ratio of Males per 100 Females in Lock Springs?
There are 150.00 Males per 100 Females in Lock Springs.
What is the Ratio of Females per 100 Males in Lock Springs?
There are 66.67 Females per 100 Males in Lock Springs.
What is the Median Population Age in Lock Springs?
Median Population Age in Lock Springs is 35.5 Years.
What is the Average Family Size in Lock Springs
Average Family Size in Lock Springs is 3.0 People.
What is the Average Household Size in Lock Springs
Average Household Size in Lock Springs is 3.1 People.
What is Per Capita Income in Lock Springs?
Per Capita income in Lock Springs is $63,058.
What is the Median Family Income in Lock Springs?
Median Family Income in Lock Springs is $100,833.
What is the Median Household income in Lock Springs?
Median Household Income in Lock Springs is $101,250.
What is Inequality or Gini Index in Lock Springs?
Inequality or Gini Index in Lock Springs is 0.55.
How Large is the Labor Force in Lock Springs?
There are 15 People in the Labor Forcein in Lock Springs.
What is the Percentage of People in the Labor Force in Lock Springs?
51.7% of People are in the Labor Force in Lock Springs.