Laurie, MO
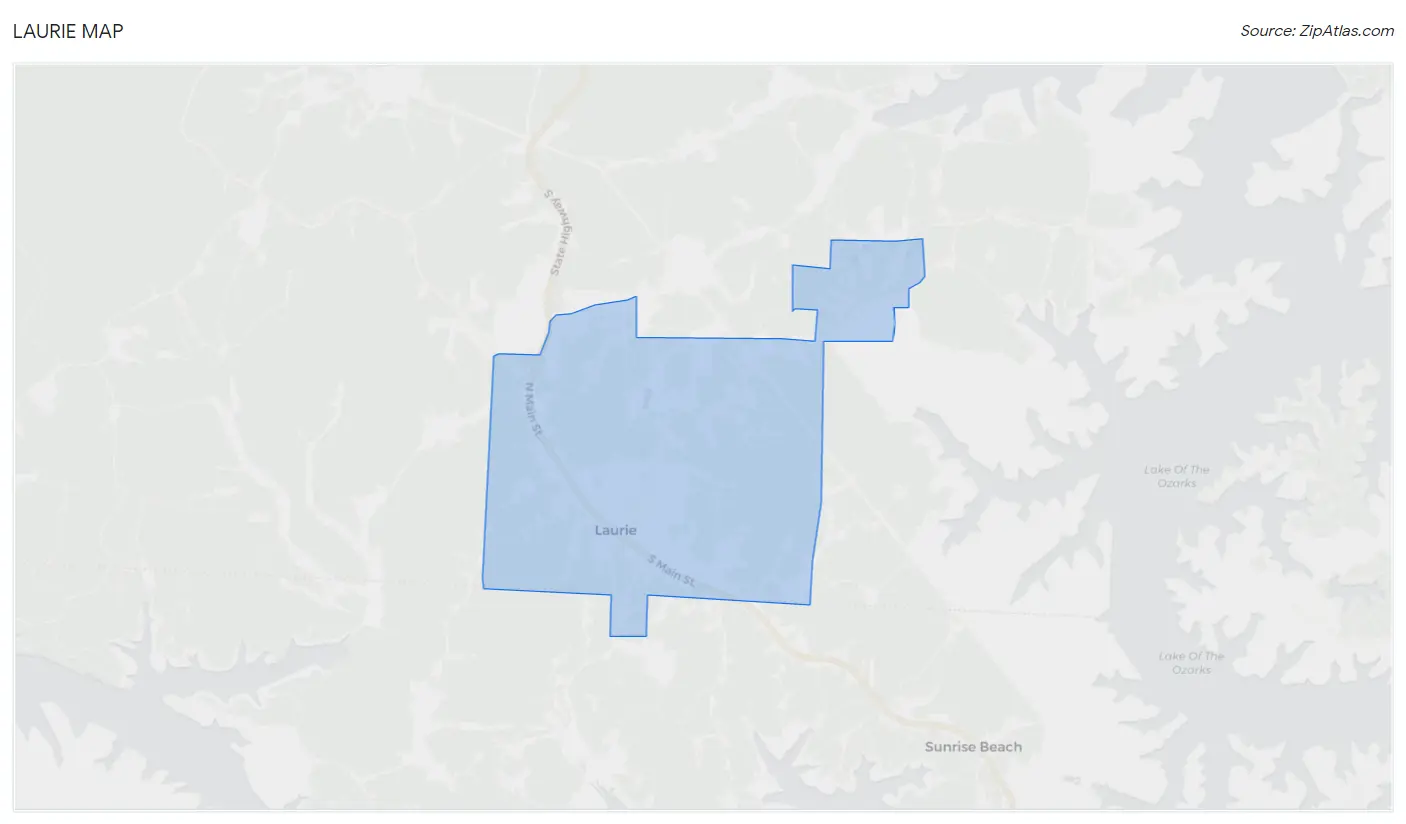
Laurie Map
Laurie Overview
991
TOTAL POPULATION
407
MALE POPULATION
584
FEMALE POPULATION
69.69
MALES / 100 FEMALES
143.49
FEMALES / 100 MALES
61.7
MEDIAN AGE
3.1
AVG FAMILY SIZE
2.0
AVG HOUSEHOLD SIZE
$28,479
PER CAPITA INCOME
$64,750
AVG FAMILY INCOME
$43,646
AVG HOUSEHOLD INCOME
0.39
INEQUALITY / GINI INDEX
347
LABOR FORCE [ PEOPLE ]
40.1%
PERCENT IN LABOR FORCE
9.5%
UNEMPLOYMENT RATE
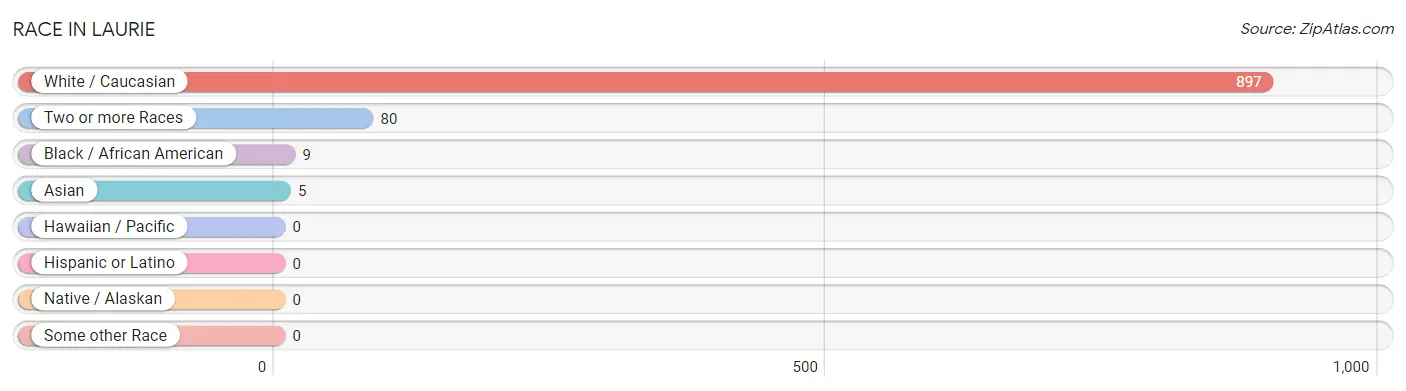
Race in Laurie
The most populous races in Laurie are White / Caucasian (897 | 90.5%), Two or more Races (80 | 8.1%), and Black / African American (9 | 0.9%).
| Race | # Population | % Population |
| Asian | 5 | 0.5% |
| Black / African American | 9 | 0.9% |
| Hawaiian / Pacific | 0 | 0.0% |
| Hispanic or Latino | 0 | 0.0% |
| Native / Alaskan | 0 | 0.0% |
| White / Caucasian | 897 | 90.5% |
| Two or more Races | 80 | 8.1% |
| Some other Race | 0 | 0.0% |
| Total | 991 | 100.0% |
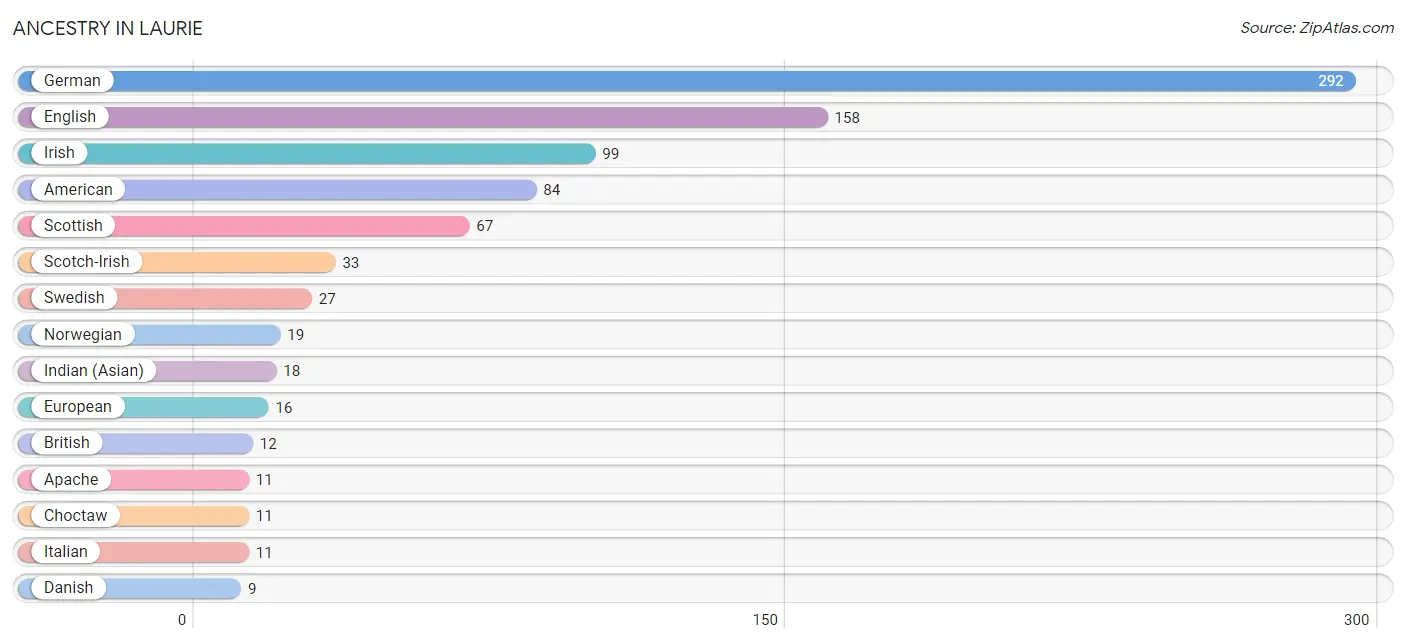
Ancestry in Laurie
The most populous ancestries reported in Laurie are German (292 | 29.5%), English (158 | 15.9%), Irish (99 | 10.0%), American (84 | 8.5%), and Scottish (67 | 6.8%), together accounting for 70.6% of all Laurie residents.
| Ancestry | # Population | % Population |
| American | 84 | 8.5% |
| Apache | 11 | 1.1% |
| Basque | 2 | 0.2% |
| British | 12 | 1.2% |
| Cherokee | 4 | 0.4% |
| Choctaw | 11 | 1.1% |
| Danish | 9 | 0.9% |
| Dutch | 6 | 0.6% |
| English | 158 | 15.9% |
| European | 16 | 1.6% |
| German | 292 | 29.5% |
| Greek | 6 | 0.6% |
| Hungarian | 2 | 0.2% |
| Indian (Asian) | 18 | 1.8% |
| Irish | 99 | 10.0% |
| Italian | 11 | 1.1% |
| Northern European | 3 | 0.3% |
| Norwegian | 19 | 1.9% |
| Pennsylvania German | 5 | 0.5% |
| Polish | 1 | 0.1% |
| Scotch-Irish | 33 | 3.3% |
| Scottish | 67 | 6.8% |
| Slovene | 3 | 0.3% |
| Swedish | 27 | 2.7% |
| Welsh | 8 | 0.8% | View All 25 Rows |
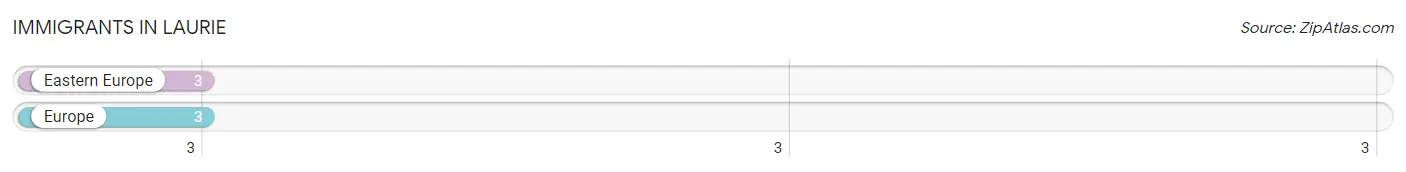
Immigrants in Laurie
The most numerous immigrant groups reported in Laurie came from Eastern Europe (3 | 0.3%), and Europe (3 | 0.3%), together accounting for 0.6% of all Laurie residents.
| Immigration Origin | # Population | % Population |
| Eastern Europe | 3 | 0.3% |
| Europe | 3 | 0.3% | View All 2 Rows |
Sex and Age in Laurie
Sex and Age in Laurie
The most populous age groups in Laurie are 40 to 44 Years (54 | 13.3%) for men and 70 to 74 Years (114 | 19.5%) for women.
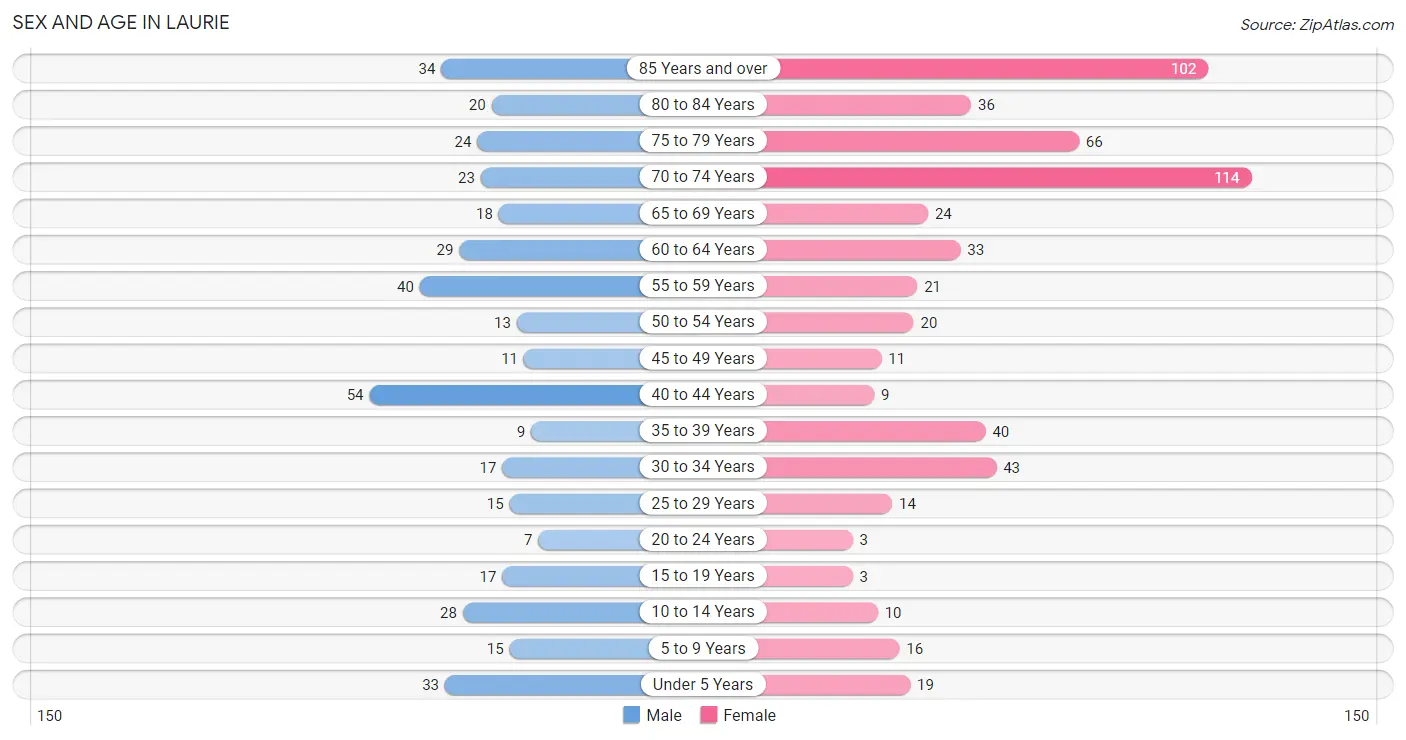
| Age Bracket | Male | Female |
| Under 5 Years | 33 (8.1%) | 19 (3.3%) |
| 5 to 9 Years | 15 (3.7%) | 16 (2.7%) |
| 10 to 14 Years | 28 (6.9%) | 10 (1.7%) |
| 15 to 19 Years | 17 (4.2%) | 3 (0.5%) |
| 20 to 24 Years | 7 (1.7%) | 3 (0.5%) |
| 25 to 29 Years | 15 (3.7%) | 14 (2.4%) |
| 30 to 34 Years | 17 (4.2%) | 43 (7.4%) |
| 35 to 39 Years | 9 (2.2%) | 40 (6.9%) |
| 40 to 44 Years | 54 (13.3%) | 9 (1.5%) |
| 45 to 49 Years | 11 (2.7%) | 11 (1.9%) |
| 50 to 54 Years | 13 (3.2%) | 20 (3.4%) |
| 55 to 59 Years | 40 (9.8%) | 21 (3.6%) |
| 60 to 64 Years | 29 (7.1%) | 33 (5.7%) |
| 65 to 69 Years | 18 (4.4%) | 24 (4.1%) |
| 70 to 74 Years | 23 (5.7%) | 114 (19.5%) |
| 75 to 79 Years | 24 (5.9%) | 66 (11.3%) |
| 80 to 84 Years | 20 (4.9%) | 36 (6.2%) |
| 85 Years and over | 34 (8.4%) | 102 (17.5%) |
| Total | 407 (100.0%) | 584 (100.0%) |
Families and Households in Laurie
Median Family Size in Laurie
The median family size in Laurie is 3.12 persons per family, with single female/mother families (29 | 14.8%) accounting for the largest median family size of 4.76 persons per family. On the other hand, married-couple families (158 | 80.6%) represent the smallest median family size with 2.77 persons per family.
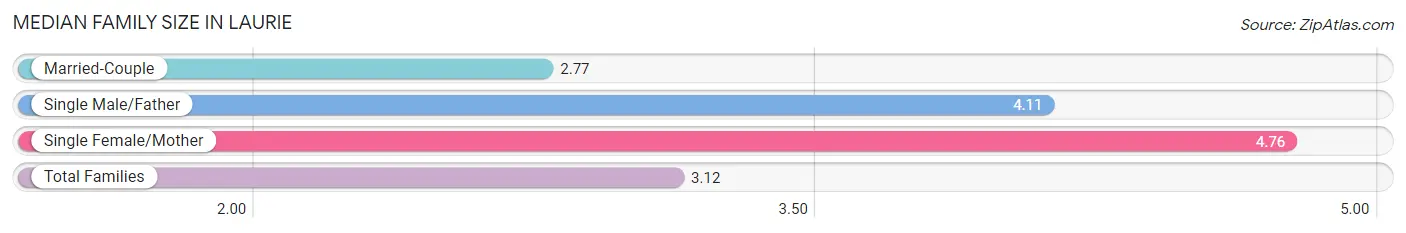
| Family Type | # Families | Family Size |
| Married-Couple | 158 (80.6%) | 2.77 |
| Single Male/Father | 9 (4.6%) | 4.11 |
| Single Female/Mother | 29 (14.8%) | 4.76 |
| Total Families | 196 (100.0%) | 3.12 |
Median Household Size in Laurie
The median household size in Laurie is 2.02 persons per household, with single male/father households (9 | 2.0%) accounting for the largest median household size of 6.44 persons per household. non-family households (259 | 56.9%) represent the smallest median household size with 1.03 persons per household.
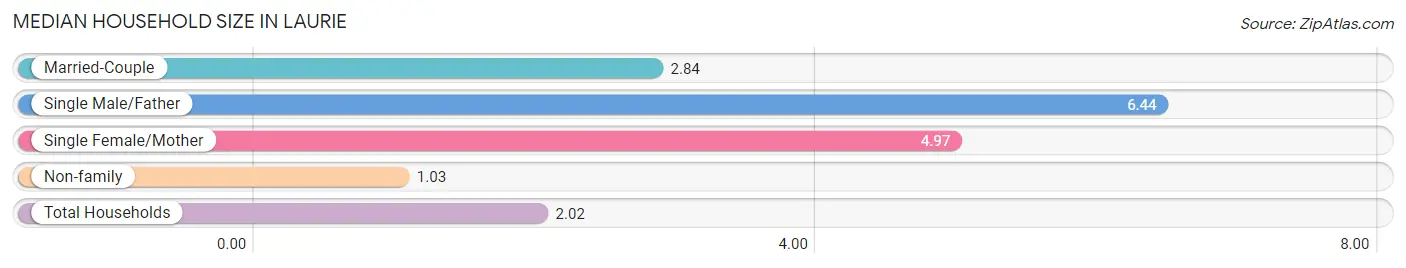
| Household Type | # Households | Household Size |
| Married-Couple | 158 (34.7%) | 2.84 |
| Single Male/Father | 9 (2.0%) | 6.44 |
| Single Female/Mother | 29 (6.4%) | 4.97 |
| Non-family | 259 (56.9%) | 1.03 |
| Total Households | 455 (100.0%) | 2.02 |
Household Size by Marriage Status in Laurie
Out of a total of 455 households in Laurie, 196 (43.1%) are family households, while 259 (56.9%) are nonfamily households. The most numerous type of family households are 2-person households, comprising 135, and the most common type of nonfamily households are 1-person households, comprising 244.
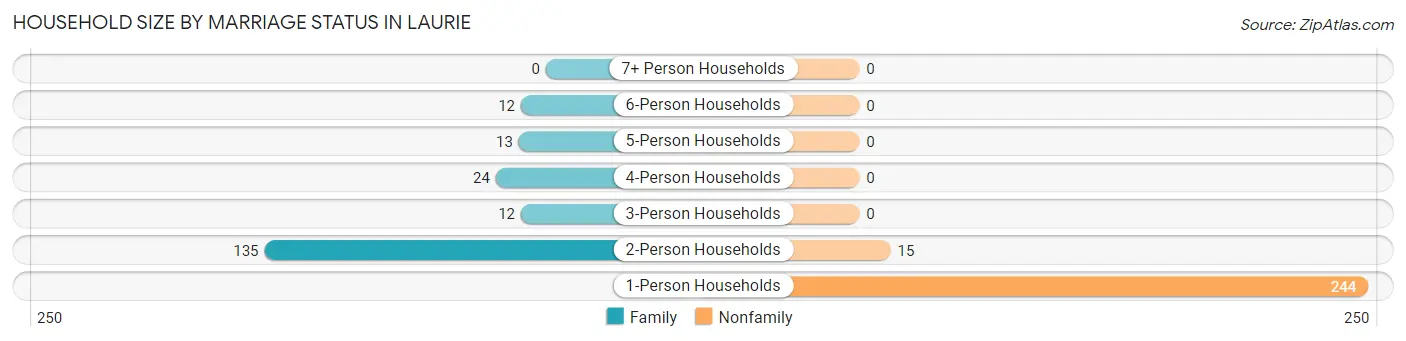
| Household Size | Family Households | Nonfamily Households |
| 1-Person Households | - | 244 (53.6%) |
| 2-Person Households | 135 (29.7%) | 15 (3.3%) |
| 3-Person Households | 12 (2.6%) | 0 (0.0%) |
| 4-Person Households | 24 (5.3%) | 0 (0.0%) |
| 5-Person Households | 13 (2.9%) | 0 (0.0%) |
| 6-Person Households | 12 (2.6%) | 0 (0.0%) |
| 7+ Person Households | 0 (0.0%) | 0 (0.0%) |
| Total | 196 (43.1%) | 259 (56.9%) |
Female Fertility in Laurie
Fertility by Age in Laurie
Average fertility rate in Laurie is 179.0 births per 1,000 women. Women in the age bracket of 35 to 50 years have the highest fertility rate with 233.0 births per 1,000 women. Women in the age bracket of 35 to 50 years acount for 63.6% of all women with births.
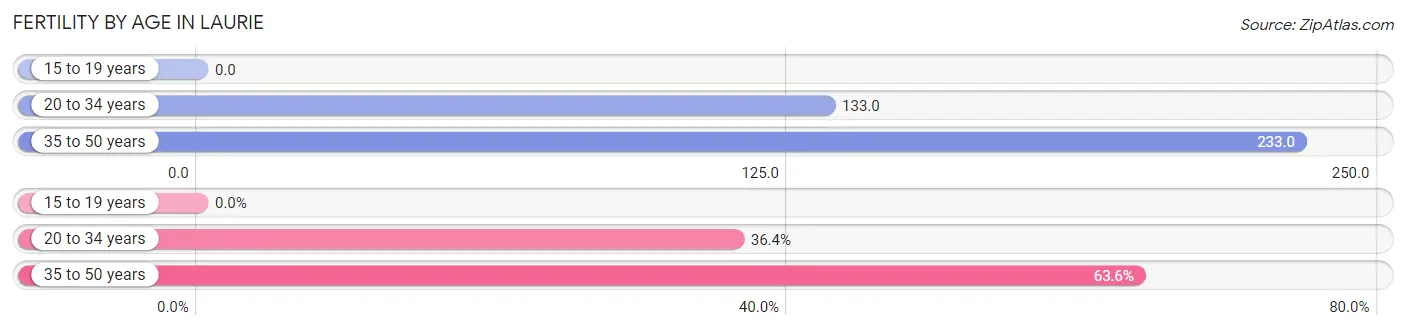
| Age Bracket | Women with Births | Births / 1,000 Women |
| 15 to 19 years | 0 (0.0%) | 0.0 |
| 20 to 34 years | 8 (36.4%) | 133.0 |
| 35 to 50 years | 14 (63.6%) | 233.0 |
| Total | 22 (100.0%) | 179.0 |
Fertility by Age by Marriage Status in Laurie
13.6% of women with births (22) in Laurie are married. The highest percentage of unmarried women with births falls into 35 to 50 years age bracket with 100.0% of them unmarried at the time of birth, while the lowest percentage of unmarried women with births belong to 20 to 34 years age bracket with 62.5% of them unmarried.
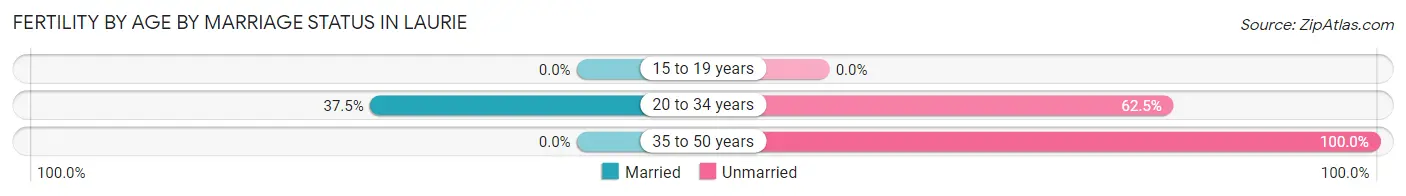
| Age Bracket | Married | Unmarried |
| 15 to 19 years | 0 (0.0%) | 0 (0.0%) |
| 20 to 34 years | 3 (37.5%) | 5 (62.5%) |
| 35 to 50 years | 0 (0.0%) | 14 (100.0%) |
| Total | 3 (13.6%) | 19 (86.4%) |
Fertility by Education in Laurie
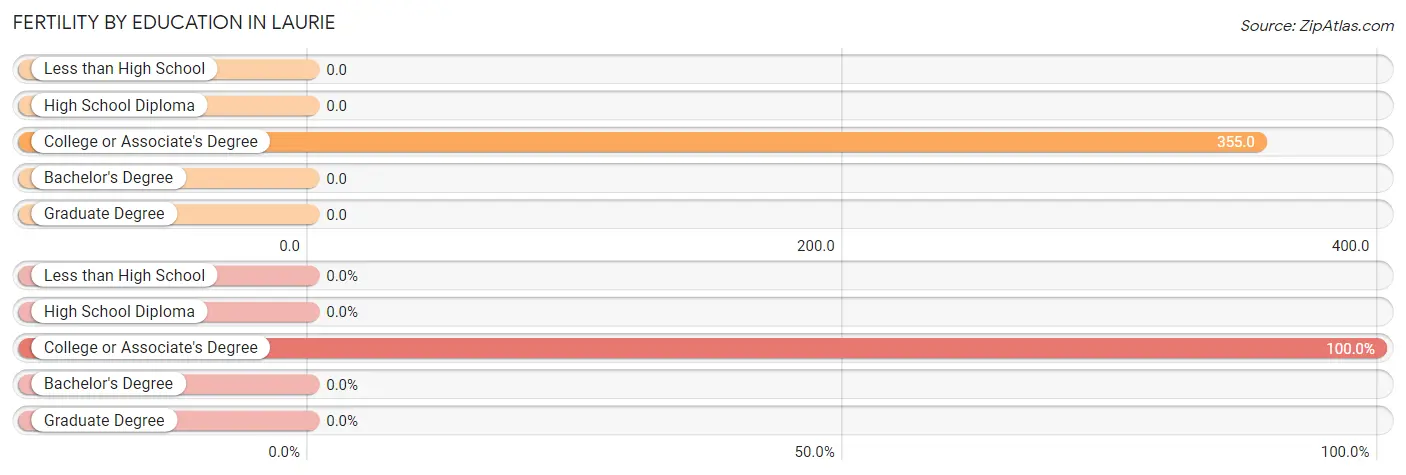
| Educational Attainment | Women with Births | Births / 1,000 Women |
| Less than High School | 0 (0.0%) | 0.0 |
| High School Diploma | 0 (0.0%) | 0.0 |
| College or Associate's Degree | 22 (100.0%) | 355.0 |
| Bachelor's Degree | 0 (0.0%) | 0.0 |
| Graduate Degree | 0 (0.0%) | 0.0 |
| Total | 22 (100.0%) | 179.0 |
Fertility by Education by Marriage Status in Laurie
86.4% of women with births in Laurie are unmarried. Women with the educational attainment of college or associate's degree are most likely to be married with 13.6% of them married at childbirth, while women with the educational attainment of college or associate's degree are least likely to be married with 86.4% of them unmarried at childbirth.
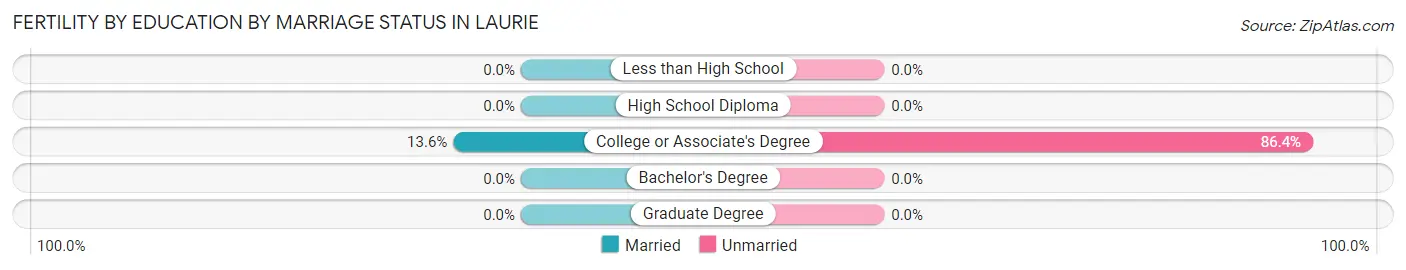
| Educational Attainment | Married | Unmarried |
| Less than High School | 0 (0.0%) | 0 (0.0%) |
| High School Diploma | 0 (0.0%) | 0 (0.0%) |
| College or Associate's Degree | 3 (13.6%) | 19 (86.4%) |
| Bachelor's Degree | 0 (0.0%) | 0 (0.0%) |
| Graduate Degree | 0 (0.0%) | 0 (0.0%) |
| Total | 3 (13.6%) | 19 (86.4%) |
Income in Laurie
Income Overview in Laurie
Per Capita Income in Laurie is $28,479, while median incomes of families and households are $64,750 and $43,646 respectively.
| Characteristic | Number | Measure |
| Per Capita Income | 991 | $28,479 |
| Median Family Income | 196 | $64,750 |
| Mean Family Income | 196 | $67,781 |
| Median Household Income | 455 | $43,646 |
| Mean Household Income | 455 | $59,767 |
| Income Deficit | 196 | $0 |
| Wage / Income Gap (%) | 991 | 0.00% |
| Wage / Income Gap ($) | 991 | 100.00¢ per $1 |
| Gini / Inequality Index | 991 | 0.39 |
Earnings by Sex in Laurie
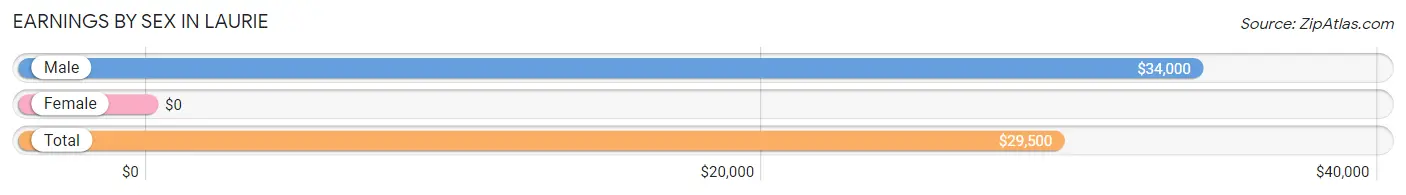
| Sex | Number | Average Earnings |
| Male | 162 (47.1%) | $34,000 |
| Female | 182 (52.9%) | $0 |
| Total | 344 (100.0%) | $29,500 |
Earnings by Sex by Income Bracket in Laurie
The most common earnings brackets in Laurie are $30,000 to $34,999 for men (24 | 14.8%) and $2,500 to $4,999 for women (62 | 34.1%).
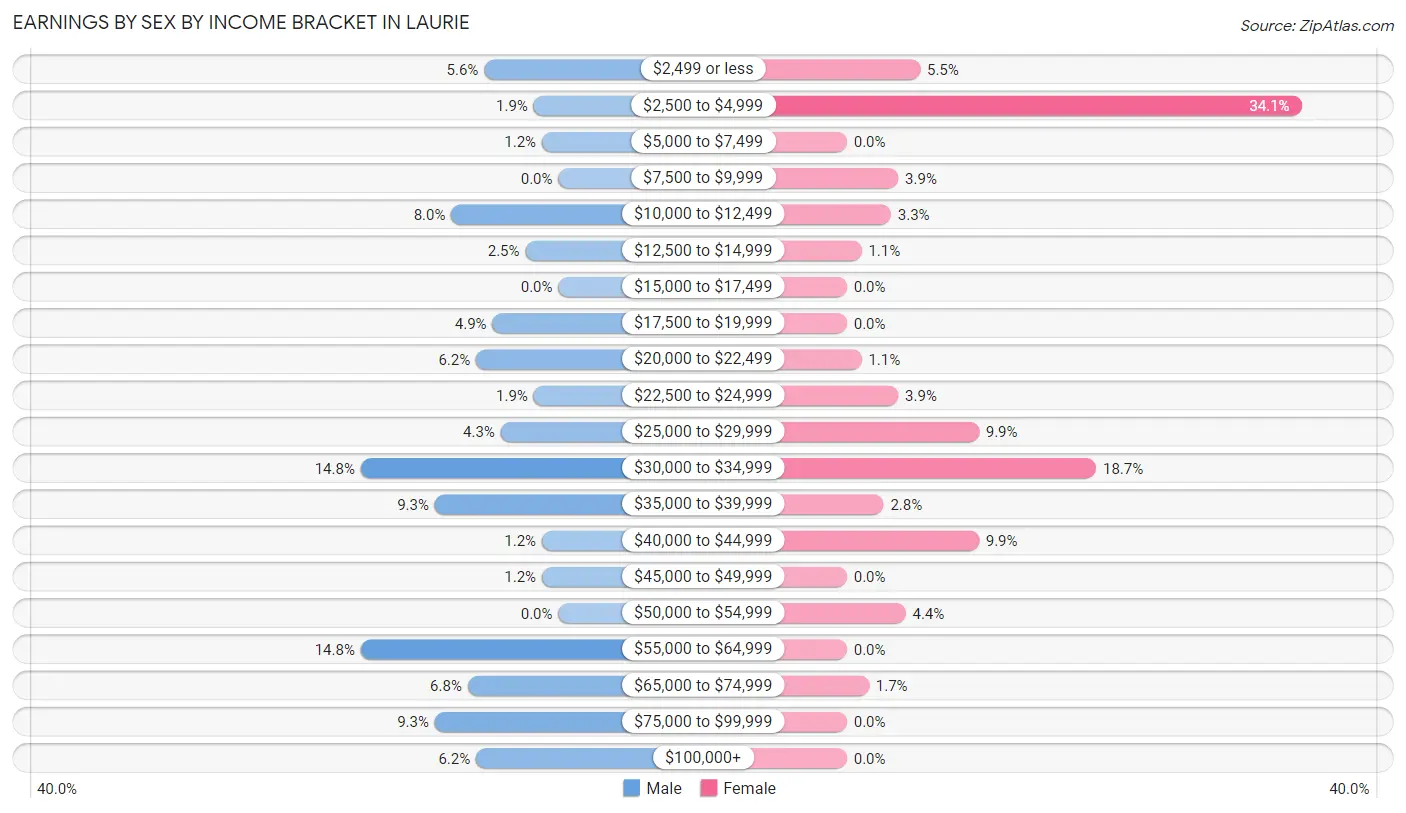
| Income | Male | Female |
| $2,499 or less | 9 (5.6%) | 10 (5.5%) |
| $2,500 to $4,999 | 3 (1.8%) | 62 (34.1%) |
| $5,000 to $7,499 | 2 (1.2%) | 0 (0.0%) |
| $7,500 to $9,999 | 0 (0.0%) | 7 (3.8%) |
| $10,000 to $12,499 | 13 (8.0%) | 6 (3.3%) |
| $12,500 to $14,999 | 4 (2.5%) | 2 (1.1%) |
| $15,000 to $17,499 | 0 (0.0%) | 0 (0.0%) |
| $17,500 to $19,999 | 8 (4.9%) | 0 (0.0%) |
| $20,000 to $22,499 | 10 (6.2%) | 2 (1.1%) |
| $22,500 to $24,999 | 3 (1.8%) | 7 (3.8%) |
| $25,000 to $29,999 | 7 (4.3%) | 18 (9.9%) |
| $30,000 to $34,999 | 24 (14.8%) | 34 (18.7%) |
| $35,000 to $39,999 | 15 (9.3%) | 5 (2.8%) |
| $40,000 to $44,999 | 2 (1.2%) | 18 (9.9%) |
| $45,000 to $49,999 | 2 (1.2%) | 0 (0.0%) |
| $50,000 to $54,999 | 0 (0.0%) | 8 (4.4%) |
| $55,000 to $64,999 | 24 (14.8%) | 0 (0.0%) |
| $65,000 to $74,999 | 11 (6.8%) | 3 (1.7%) |
| $75,000 to $99,999 | 15 (9.3%) | 0 (0.0%) |
| $100,000+ | 10 (6.2%) | 0 (0.0%) |
| Total | 162 (100.0%) | 182 (100.0%) |
Earnings by Sex by Educational Attainment in Laurie
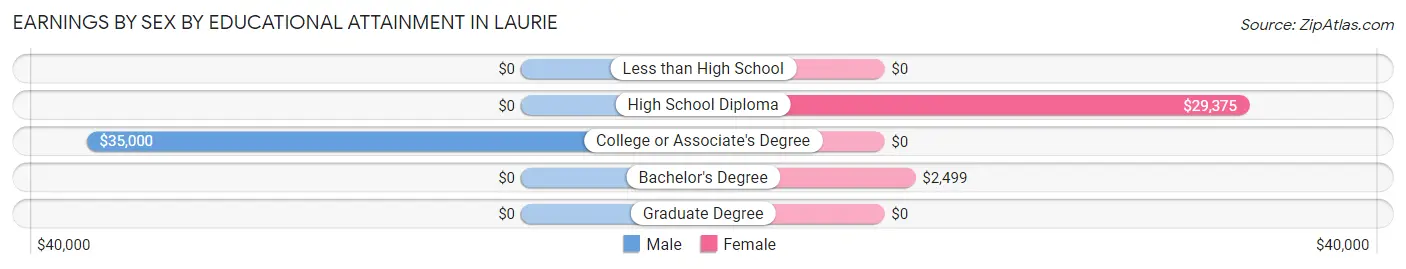
| Educational Attainment | Male Income | Female Income |
| Less than High School | - | - |
| High School Diploma | - | - |
| College or Associate's Degree | $35,000 | $0 |
| Bachelor's Degree | - | - |
| Graduate Degree | - | - |
| Total | $34,250 | $0 |
Family Income in Laurie
Family Income Brackets in Laurie
According to the Laurie family income data, there are 76 families falling into the $50,000 to $74,999 income range, which is the most common income bracket and makes up 38.8% of all families. Conversely, the $10,000 to $14,999 income bracket is the least frequent group with only 3 families (1.5%) belonging to this category.
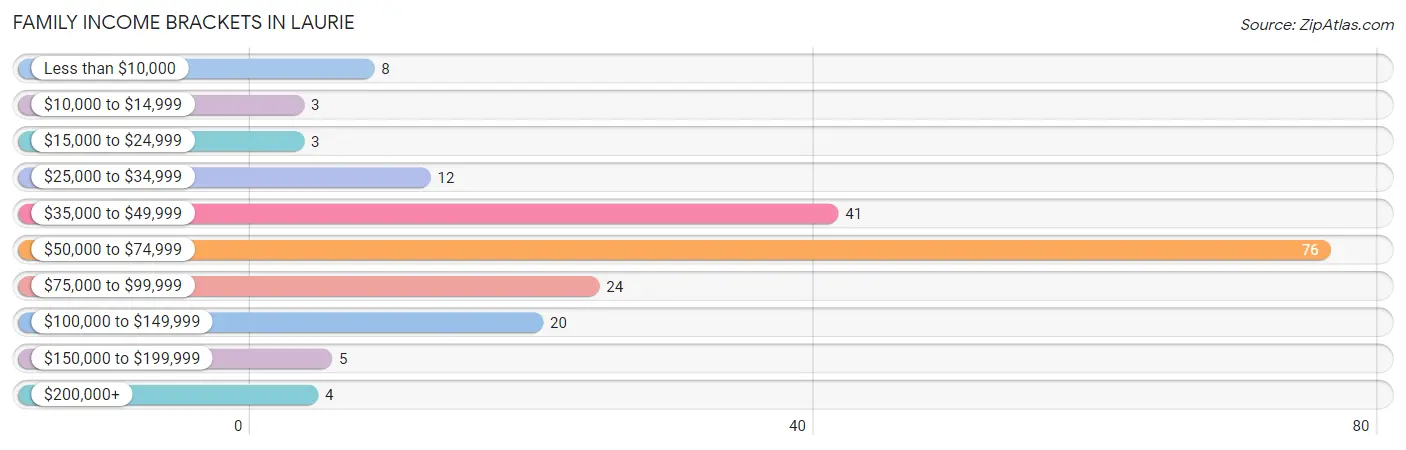
| Income Bracket | # Families | % Families |
| Less than $10,000 | 8 | 4.1% |
| $10,000 to $14,999 | 3 | 1.5% |
| $15,000 to $24,999 | 3 | 1.5% |
| $25,000 to $34,999 | 12 | 6.1% |
| $35,000 to $49,999 | 41 | 20.9% |
| $50,000 to $74,999 | 76 | 38.8% |
| $75,000 to $99,999 | 24 | 12.2% |
| $100,000 to $149,999 | 20 | 10.2% |
| $150,000 to $199,999 | 5 | 2.6% |
| $200,000+ | 4 | 2.0% |
Family Income by Famaliy Size in Laurie
5-person families (15 | 7.6%) account for the highest median family income in Laurie with $175,750 per family, while 5-person families (15 | 7.6%) have the highest median income of $35,150 per family member.
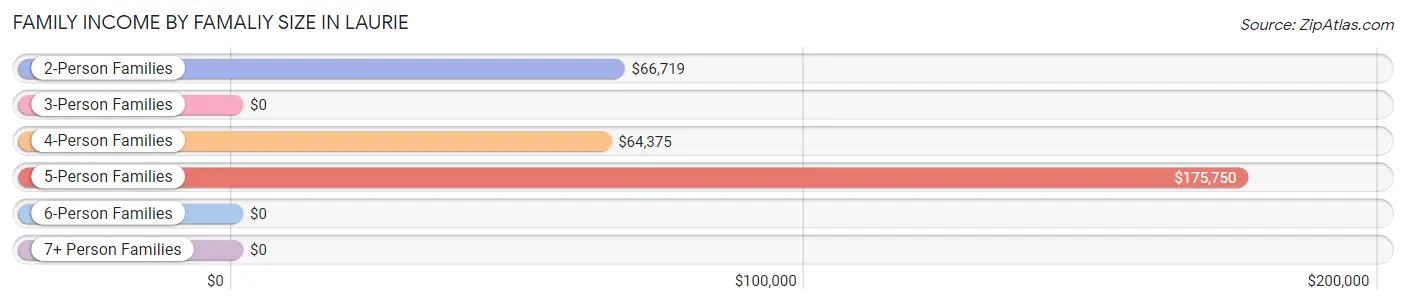
| Income Bracket | # Families | Median Income |
| 2-Person Families | 137 (69.9%) | $66,719 |
| 3-Person Families | 20 (10.2%) | $0 |
| 4-Person Families | 18 (9.2%) | $64,375 |
| 5-Person Families | 15 (7.6%) | $175,750 |
| 6-Person Families | 6 (3.1%) | $0 |
| 7+ Person Families | 0 (0.0%) | $0 |
| Total | 196 (100.0%) | $64,750 |
Family Income by Number of Earners in Laurie
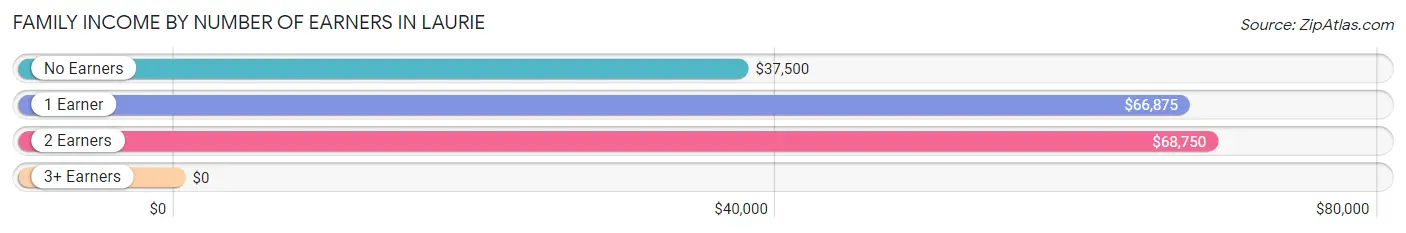
| Number of Earners | # Families | Median Income |
| No Earners | 52 (26.5%) | $37,500 |
| 1 Earner | 83 (42.3%) | $66,875 |
| 2 Earners | 56 (28.6%) | $68,750 |
| 3+ Earners | 5 (2.5%) | $0 |
| Total | 196 (100.0%) | $64,750 |
Household Income in Laurie
Household Income Brackets in Laurie
With 137 households falling in the category, the $50,000 to $74,999 income range is the most frequent in Laurie, accounting for 30.1% of all households. In contrast, only 9 households (2.0%) fall into the less than $10,000 income bracket, making it the least populous group.
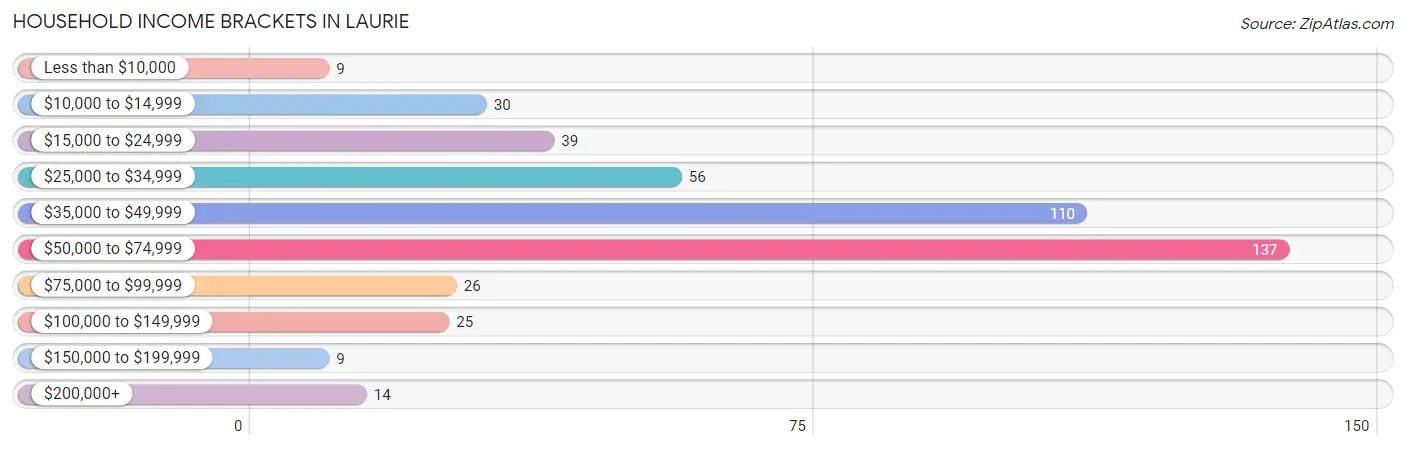
| Income Bracket | # Households | % Households |
| Less than $10,000 | 9 | 2.0% |
| $10,000 to $14,999 | 30 | 6.6% |
| $15,000 to $24,999 | 39 | 8.6% |
| $25,000 to $34,999 | 56 | 12.3% |
| $35,000 to $49,999 | 110 | 24.2% |
| $50,000 to $74,999 | 137 | 30.1% |
| $75,000 to $99,999 | 26 | 5.7% |
| $100,000 to $149,999 | 25 | 5.5% |
| $150,000 to $199,999 | 9 | 2.0% |
| $200,000+ | 14 | 3.1% |
Household Income by Householder Age in Laurie
The median household income in Laurie is $43,646, with the highest median household income of $61,500 found in the 25 to 44 years age bracket for the primary householder. A total of 90 households (19.8%) fall into this category. Meanwhile, the 15 to 24 years age bracket for the primary householder has the lowest median household income of $0, with 3 households (0.7%) in this group.
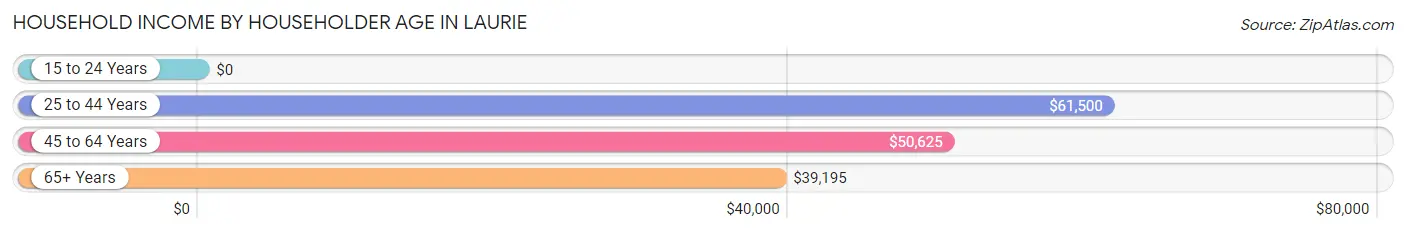
| Income Bracket | # Households | Median Income |
| 15 to 24 Years | 3 (0.7%) | $0 |
| 25 to 44 Years | 90 (19.8%) | $61,500 |
| 45 to 64 Years | 65 (14.3%) | $50,625 |
| 65+ Years | 297 (65.3%) | $39,195 |
| Total | 455 (100.0%) | $43,646 |
Poverty in Laurie
Income Below Poverty by Sex and Age in Laurie
With 7.0% poverty level for males and 13.5% for females among the residents of Laurie, 16 and 17 year old males and under 5 year old females are the most vulnerable to poverty, with 6 males (54.5%) and 8 females (42.1%) in their respective age groups living below the poverty level.
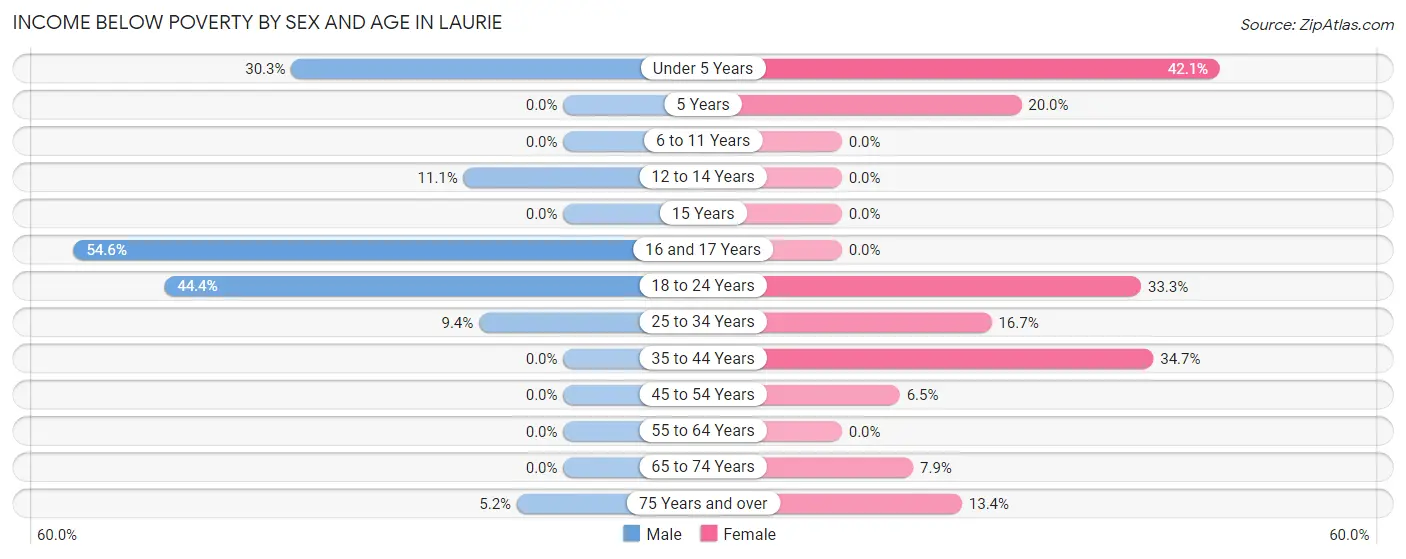
| Age Bracket | Male | Female |
| Under 5 Years | 10 (30.3%) | 8 (42.1%) |
| 5 Years | 0 (0.0%) | 2 (20.0%) |
| 6 to 11 Years | 0 (0.0%) | 0 (0.0%) |
| 12 to 14 Years | 1 (11.1%) | 0 (0.0%) |
| 15 Years | 0 (0.0%) | 0 (0.0%) |
| 16 and 17 Years | 6 (54.5%) | 0 (0.0%) |
| 18 to 24 Years | 4 (44.4%) | 1 (33.3%) |
| 25 to 34 Years | 3 (9.4%) | 8 (16.7%) |
| 35 to 44 Years | 0 (0.0%) | 17 (34.7%) |
| 45 to 54 Years | 0 (0.0%) | 2 (6.5%) |
| 55 to 64 Years | 0 (0.0%) | 0 (0.0%) |
| 65 to 74 Years | 0 (0.0%) | 10 (7.9%) |
| 75 Years and over | 3 (5.2%) | 23 (13.4%) |
| Total | 27 (7.0%) | 71 (13.5%) |
Income Above Poverty by Sex and Age in Laurie
According to the poverty statistics in Laurie, males aged 6 to 11 years and females aged 6 to 11 years are the age groups that are most secure financially, with 100.0% of males and 100.0% of females in these age groups living above the poverty line.
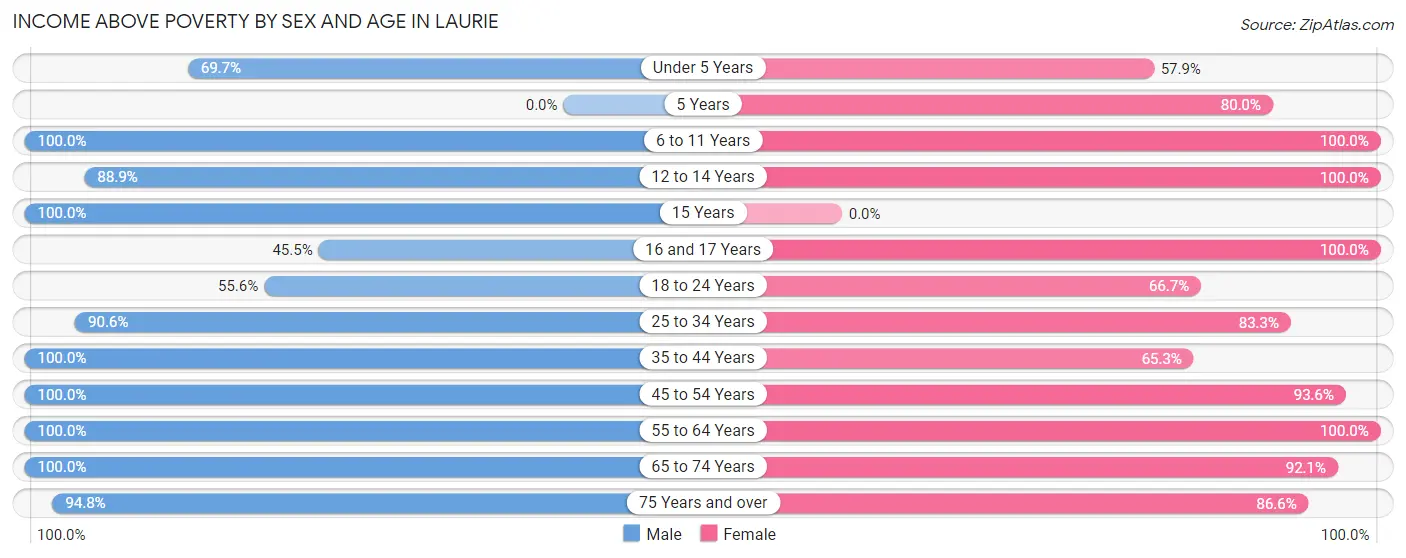
| Age Bracket | Male | Female |
| Under 5 Years | 23 (69.7%) | 11 (57.9%) |
| 5 Years | 0 (0.0%) | 8 (80.0%) |
| 6 to 11 Years | 34 (100.0%) | 6 (100.0%) |
| 12 to 14 Years | 8 (88.9%) | 6 (100.0%) |
| 15 Years | 4 (100.0%) | 0 (0.0%) |
| 16 and 17 Years | 5 (45.5%) | 3 (100.0%) |
| 18 to 24 Years | 5 (55.6%) | 2 (66.7%) |
| 25 to 34 Years | 29 (90.6%) | 40 (83.3%) |
| 35 to 44 Years | 63 (100.0%) | 32 (65.3%) |
| 45 to 54 Years | 24 (100.0%) | 29 (93.5%) |
| 55 to 64 Years | 69 (100.0%) | 54 (100.0%) |
| 65 to 74 Years | 41 (100.0%) | 116 (92.1%) |
| 75 Years and over | 55 (94.8%) | 149 (86.6%) |
| Total | 360 (93.0%) | 456 (86.5%) |
Income Below Poverty Among Married-Couple Families in Laurie
The poverty statistics for married-couple families in Laurie show that 3.8% or 6 of the total 158 families live below the poverty line. Families with 1 or 2 children have the highest poverty rate of 10.3%, comprising of 3 families. On the other hand, families with 3 or 4 children have the lowest poverty rate of 0.0%, which includes 0 families.
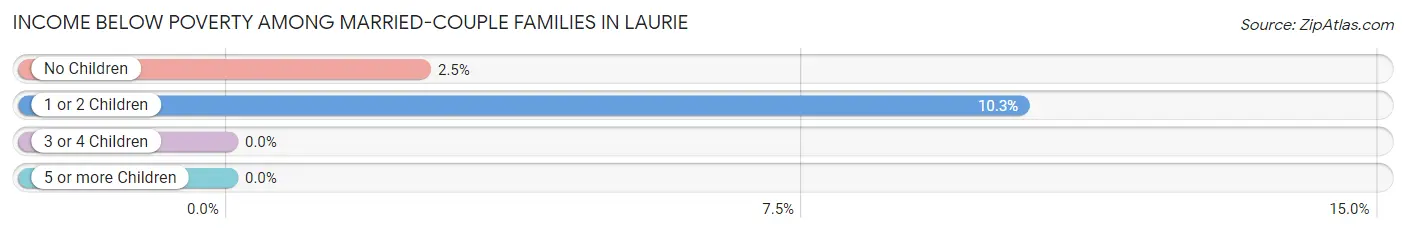
| Children | Above Poverty | Below Poverty |
| No Children | 116 (97.5%) | 3 (2.5%) |
| 1 or 2 Children | 26 (89.7%) | 3 (10.3%) |
| 3 or 4 Children | 10 (100.0%) | 0 (0.0%) |
| 5 or more Children | 0 (0.0%) | 0 (0.0%) |
| Total | 152 (96.2%) | 6 (3.8%) |
Income Below Poverty Among Single-Parent Households in Laurie
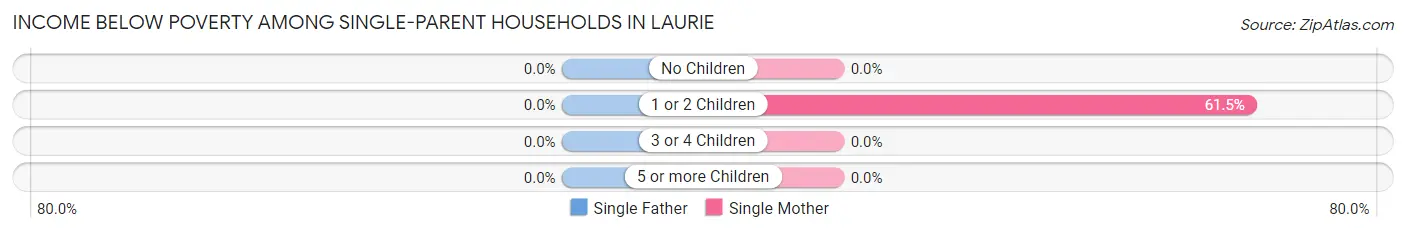
| Children | Single Father | Single Mother |
| No Children | 0 (0.0%) | 0 (0.0%) |
| 1 or 2 Children | 0 (0.0%) | 8 (61.5%) |
| 3 or 4 Children | 0 (0.0%) | 0 (0.0%) |
| 5 or more Children | 0 (0.0%) | 0 (0.0%) |
| Total | 0 (0.0%) | 8 (27.6%) |
Income Below Poverty Among Married-Couple vs Single-Parent Households in Laurie
The poverty data for Laurie shows that 6 of the married-couple family households (3.8%) and 8 of the single-parent households (21.0%) are living below the poverty level. Within the married-couple family households, those with 1 or 2 children have the highest poverty rate, with 3 households (10.3%) falling below the poverty line. Among the single-parent households, those with 1 or 2 children have the highest poverty rate, with 8 household (47.1%) living below poverty.
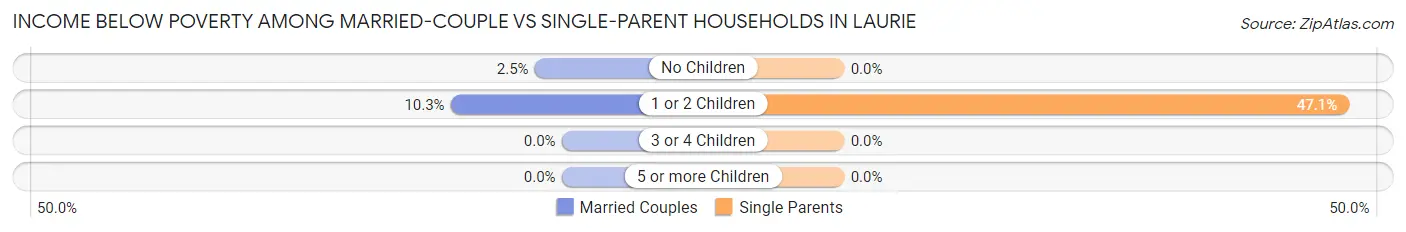
| Children | Married-Couple Families | Single-Parent Households |
| No Children | 3 (2.5%) | 0 (0.0%) |
| 1 or 2 Children | 3 (10.3%) | 8 (47.1%) |
| 3 or 4 Children | 0 (0.0%) | 0 (0.0%) |
| 5 or more Children | 0 (0.0%) | 0 (0.0%) |
| Total | 6 (3.8%) | 8 (21.0%) |
Employment Characteristics in Laurie
Employment by Class of Employer in Laurie
Among the 314 employed individuals in Laurie, private company employees (154 | 49.0%), not-for-profit organizations (83 | 26.4%), and local government employees (25 | 8.0%) make up the most common classes of employment.
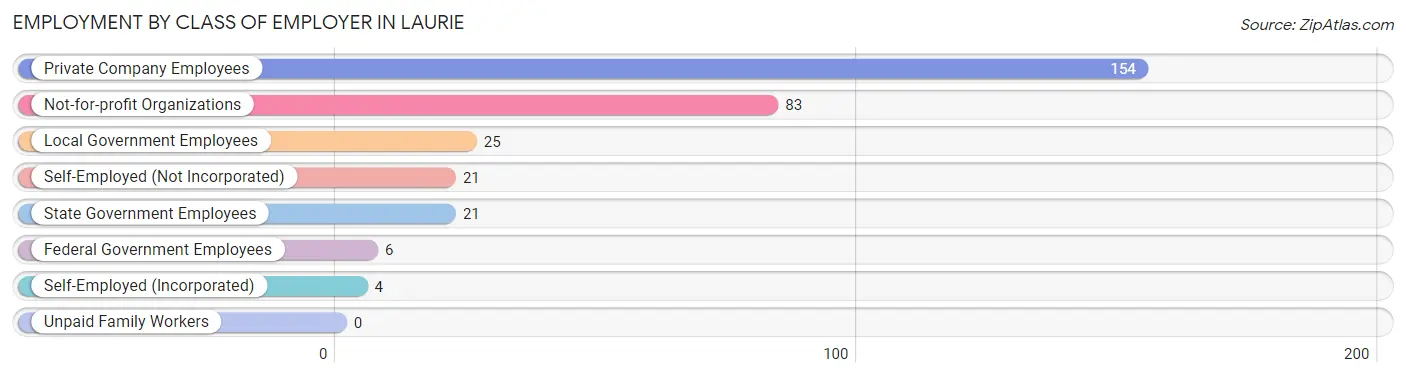
| Employer Class | # Employees | % Employees |
| Private Company Employees | 154 | 49.0% |
| Self-Employed (Incorporated) | 4 | 1.3% |
| Self-Employed (Not Incorporated) | 21 | 6.7% |
| Not-for-profit Organizations | 83 | 26.4% |
| Local Government Employees | 25 | 8.0% |
| State Government Employees | 21 | 6.7% |
| Federal Government Employees | 6 | 1.9% |
| Unpaid Family Workers | 0 | 0.0% |
| Total | 314 | 100.0% |
Employment Status by Age in Laurie
According to the labor force statistics for Laurie, out of the total population over 16 years of age (866), 40.1% or 347 individuals are in the labor force, with 9.5% or 33 of them unemployed. The age group with the highest labor force participation rate is 20 to 24 years, with 100.0% or 10 individuals in the labor force. Within the labor force, the 30 to 34 years age range has the highest percentage of unemployed individuals, with 26.1% or 12 of them being unemployed.
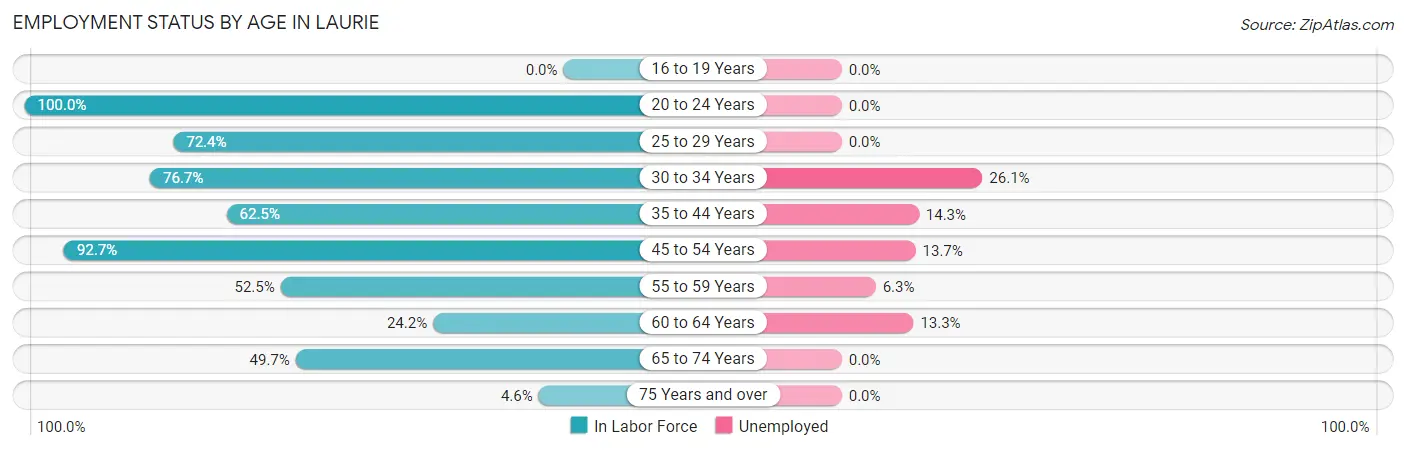
| Age Bracket | In Labor Force | Unemployed |
| 16 to 19 Years | 0 (0.0%) | 0 (0.0%) |
| 20 to 24 Years | 10 (100.0%) | 0 (0.0%) |
| 25 to 29 Years | 21 (72.4%) | 0 (0.0%) |
| 30 to 34 Years | 46 (76.7%) | 12 (26.1%) |
| 35 to 44 Years | 70 (62.5%) | 10 (14.3%) |
| 45 to 54 Years | 51 (92.7%) | 7 (13.7%) |
| 55 to 59 Years | 32 (52.5%) | 2 (6.3%) |
| 60 to 64 Years | 15 (24.2%) | 2 (13.3%) |
| 65 to 74 Years | 89 (49.7%) | 0 (0.0%) |
| 75 Years and over | 13 (4.6%) | 0 (0.0%) |
| Total | 347 (40.1%) | 33 (9.5%) |
Employment Status by Educational Attainment in Laurie
According to labor force statistics for Laurie, 62.0% of individuals (235) out of the total population between 25 and 64 years of age (379) are in the labor force, with 14.0% or 33 of them being unemployed. The group with the highest labor force participation rate are those with the educational attainment of bachelor's degree or higher, with 75.8% or 25 individuals in the labor force. Within the labor force, individuals with high school diploma education have the highest percentage of unemployment, with 22.3% or 23 of them being unemployed.
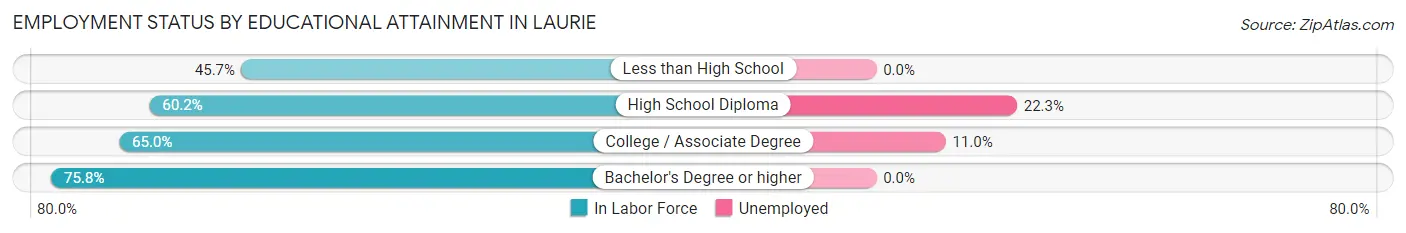
| Educational Attainment | In Labor Force | Unemployed |
| Less than High School | 16 (45.7%) | 0 (0.0%) |
| High School Diploma | 103 (60.2%) | 38 (22.3%) |
| College / Associate Degree | 91 (65.0%) | 15 (11.0%) |
| Bachelor's Degree or higher | 25 (75.8%) | 0 (0.0%) |
| Total | 235 (62.0%) | 53 (14.0%) |
Employment Occupations by Sex in Laurie
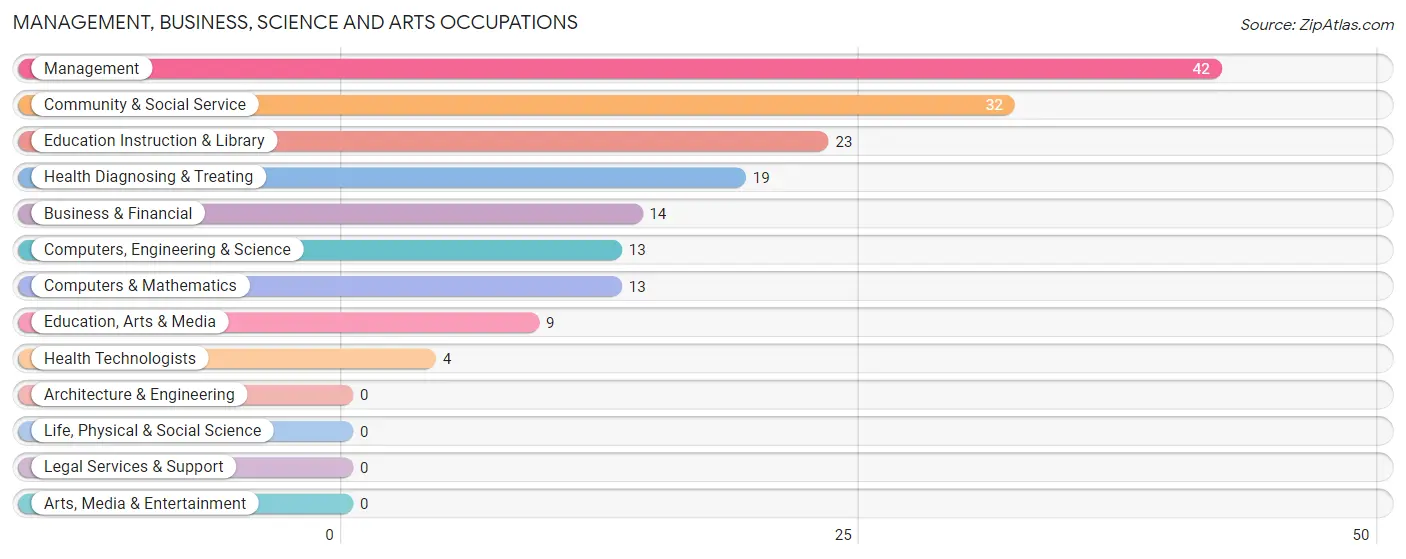
Management, Business, Science and Arts Occupations
The most common Management, Business, Science and Arts occupations in Laurie are Management (42 | 13.4%), Community & Social Service (32 | 10.2%), Education Instruction & Library (23 | 7.3%), Health Diagnosing & Treating (19 | 6.0%), and Business & Financial (14 | 4.5%).
Management, Business, Science and Arts Occupations by Sex
Within the Management, Business, Science and Arts occupations in Laurie, the most male-oriented occupations are Computers, Engineering & Science (100.0%), Computers & Mathematics (100.0%), and Business & Financial (78.6%), while the most female-oriented occupations are Health Technologists (100.0%), Management (78.6%), and Health Diagnosing & Treating (73.7%).
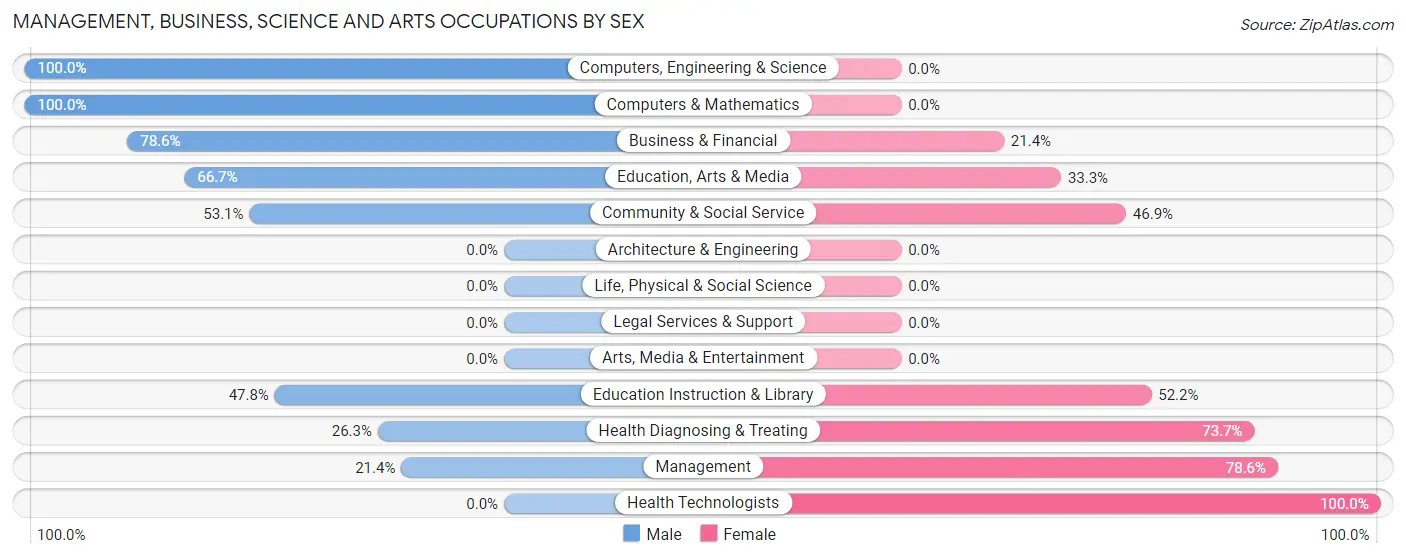
| Occupation | Male | Female |
| Management | 9 (21.4%) | 33 (78.6%) |
| Business & Financial | 11 (78.6%) | 3 (21.4%) |
| Computers, Engineering & Science | 13 (100.0%) | 0 (0.0%) |
| Computers & Mathematics | 13 (100.0%) | 0 (0.0%) |
| Architecture & Engineering | 0 (0.0%) | 0 (0.0%) |
| Life, Physical & Social Science | 0 (0.0%) | 0 (0.0%) |
| Community & Social Service | 17 (53.1%) | 15 (46.9%) |
| Education, Arts & Media | 6 (66.7%) | 3 (33.3%) |
| Legal Services & Support | 0 (0.0%) | 0 (0.0%) |
| Education Instruction & Library | 11 (47.8%) | 12 (52.2%) |
| Arts, Media & Entertainment | 0 (0.0%) | 0 (0.0%) |
| Health Diagnosing & Treating | 5 (26.3%) | 14 (73.7%) |
| Health Technologists | 0 (0.0%) | 4 (100.0%) |
| Total (Category) | 55 (45.8%) | 65 (54.2%) |
| Total (Overall) | 148 (47.1%) | 166 (52.9%) |
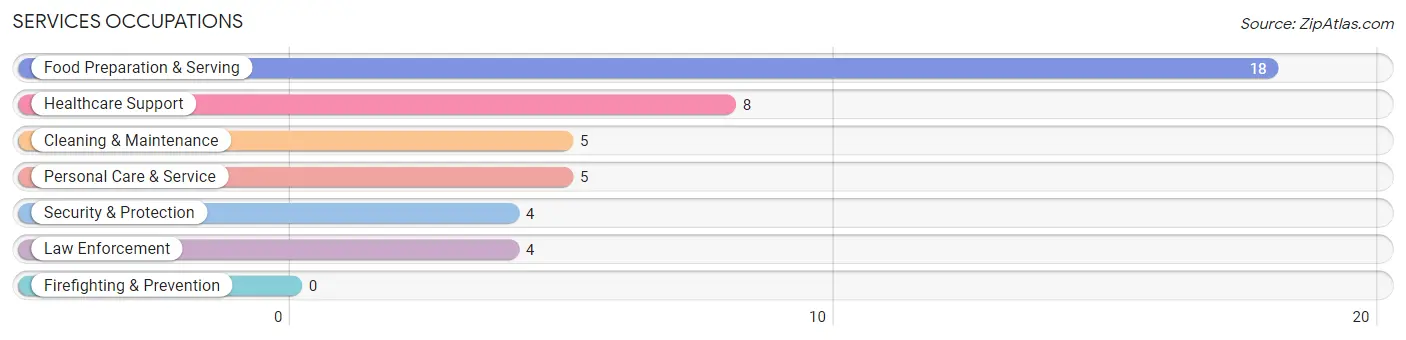
Services Occupations
The most common Services occupations in Laurie are Food Preparation & Serving (18 | 5.7%), Healthcare Support (8 | 2.5%), Cleaning & Maintenance (5 | 1.6%), Personal Care & Service (5 | 1.6%), and Security & Protection (4 | 1.3%).
Services Occupations by Sex
Within the Services occupations in Laurie, the most male-oriented occupations are Security & Protection (100.0%), Law Enforcement (100.0%), and Cleaning & Maintenance (100.0%), while the most female-oriented occupations are Healthcare Support (100.0%), Personal Care & Service (100.0%), and Food Preparation & Serving (55.6%).
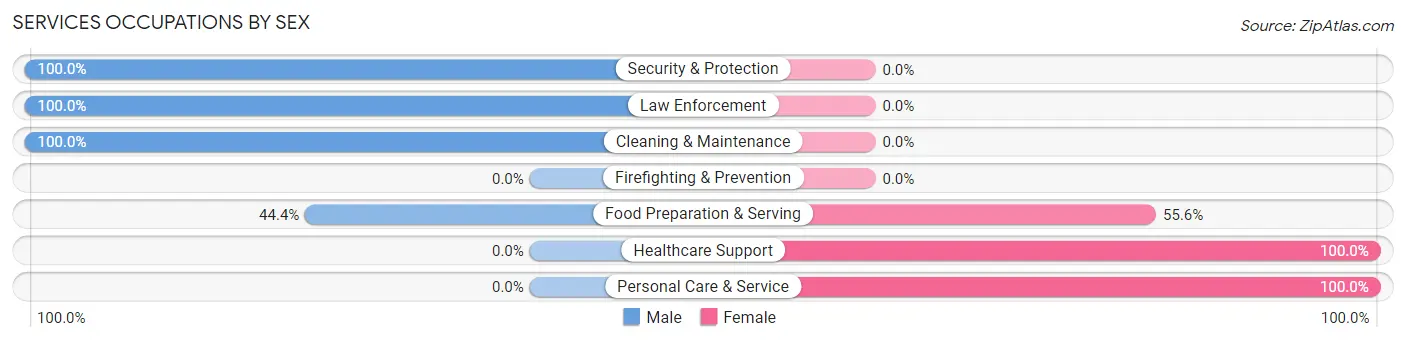
| Occupation | Male | Female |
| Healthcare Support | 0 (0.0%) | 8 (100.0%) |
| Security & Protection | 4 (100.0%) | 0 (0.0%) |
| Firefighting & Prevention | 0 (0.0%) | 0 (0.0%) |
| Law Enforcement | 4 (100.0%) | 0 (0.0%) |
| Food Preparation & Serving | 8 (44.4%) | 10 (55.6%) |
| Cleaning & Maintenance | 5 (100.0%) | 0 (0.0%) |
| Personal Care & Service | 0 (0.0%) | 5 (100.0%) |
| Total (Category) | 17 (42.5%) | 23 (57.5%) |
| Total (Overall) | 148 (47.1%) | 166 (52.9%) |
Sales and Office Occupations
The most common Sales and Office occupations in Laurie are Office & Administration (73 | 23.3%), and Sales & Related (30 | 9.6%).

Sales and Office Occupations by Sex
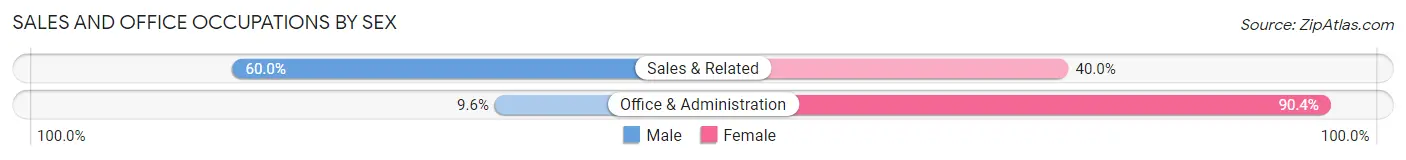
| Occupation | Male | Female |
| Sales & Related | 18 (60.0%) | 12 (40.0%) |
| Office & Administration | 7 (9.6%) | 66 (90.4%) |
| Total (Category) | 25 (24.3%) | 78 (75.7%) |
| Total (Overall) | 148 (47.1%) | 166 (52.9%) |
Natural Resources, Construction and Maintenance Occupations
The most common Natural Resources, Construction and Maintenance occupations in Laurie are Installation, Maintenance & Repair (16 | 5.1%), and Construction & Extraction (13 | 4.1%).
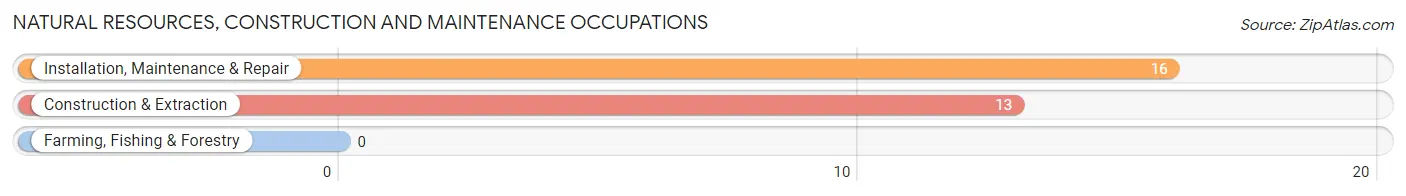
Natural Resources, Construction and Maintenance Occupations by Sex
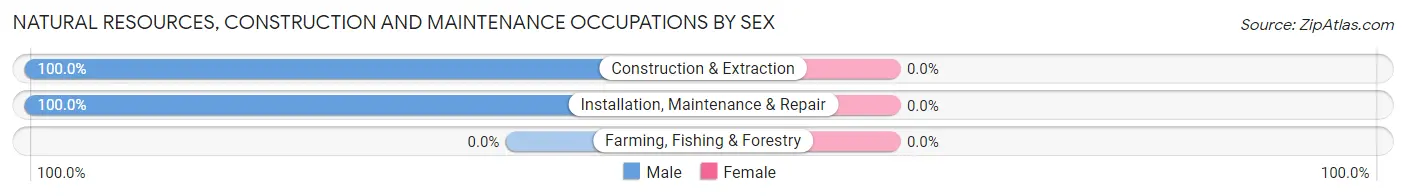
| Occupation | Male | Female |
| Farming, Fishing & Forestry | 0 (0.0%) | 0 (0.0%) |
| Construction & Extraction | 13 (100.0%) | 0 (0.0%) |
| Installation, Maintenance & Repair | 16 (100.0%) | 0 (0.0%) |
| Total (Category) | 29 (100.0%) | 0 (0.0%) |
| Total (Overall) | 148 (47.1%) | 166 (52.9%) |
Production, Transportation and Moving Occupations
The most common Production, Transportation and Moving occupations in Laurie are Production (14 | 4.5%), and Material Moving (8 | 2.5%).
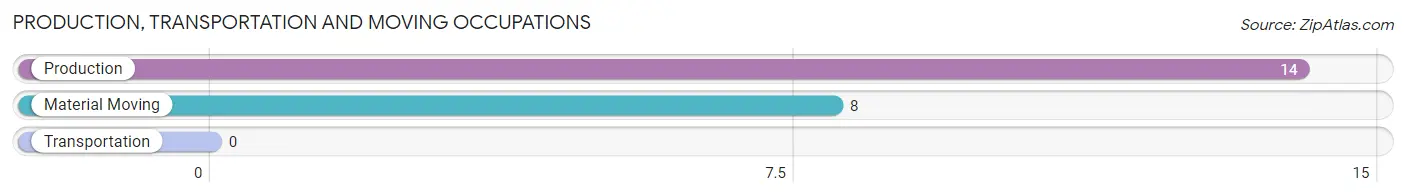
Production, Transportation and Moving Occupations by Sex
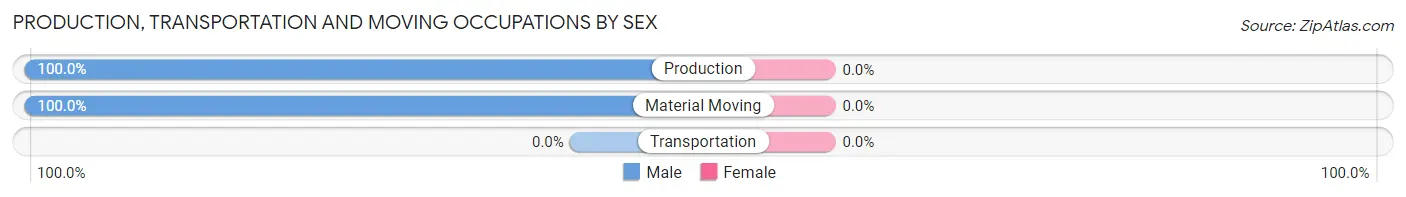
| Occupation | Male | Female |
| Production | 14 (100.0%) | 0 (0.0%) |
| Transportation | 0 (0.0%) | 0 (0.0%) |
| Material Moving | 8 (100.0%) | 0 (0.0%) |
| Total (Category) | 22 (100.0%) | 0 (0.0%) |
| Total (Overall) | 148 (47.1%) | 166 (52.9%) |
Employment Industries by Sex in Laurie
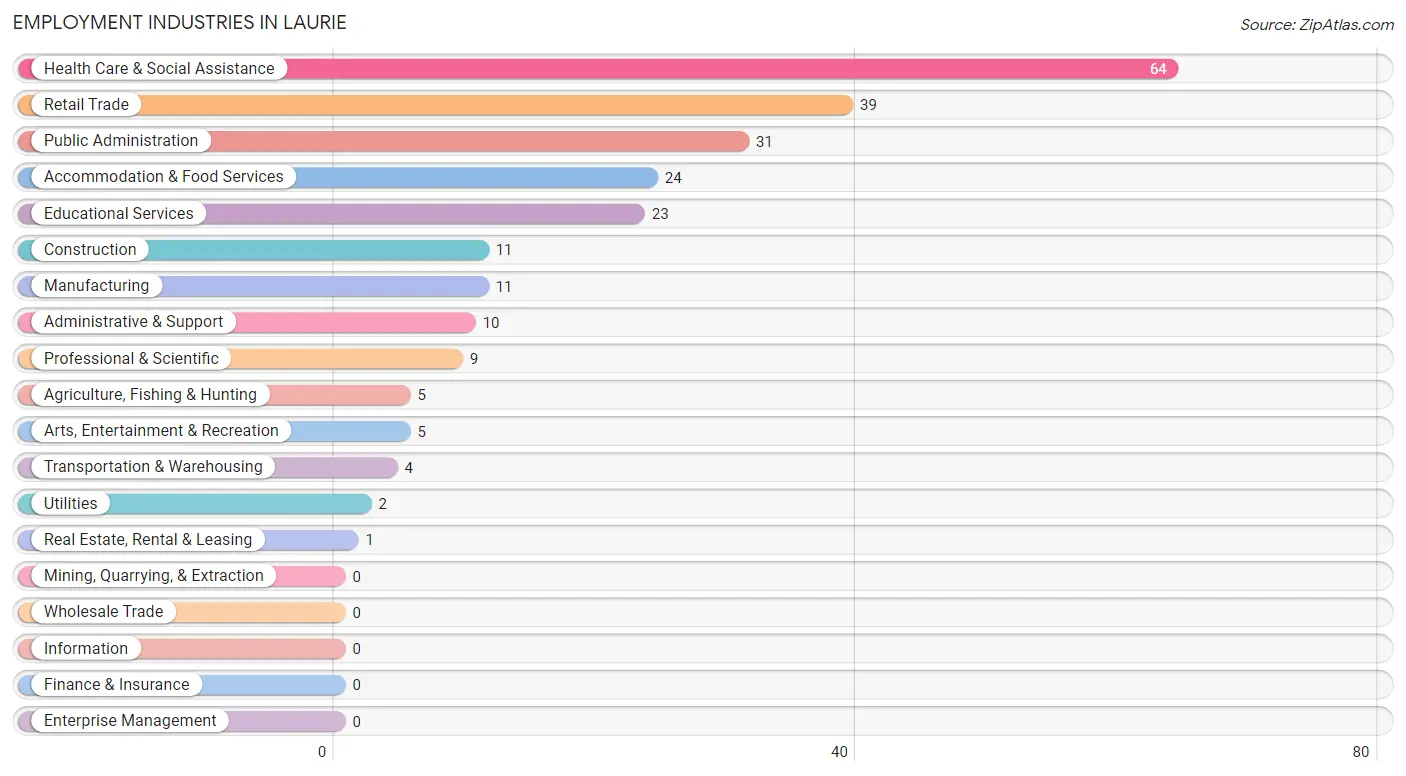
Employment Industries in Laurie
The major employment industries in Laurie include Health Care & Social Assistance (64 | 20.4%), Retail Trade (39 | 12.4%), Public Administration (31 | 9.9%), Accommodation & Food Services (24 | 7.6%), and Educational Services (23 | 7.3%).
Employment Industries by Sex in Laurie
The Laurie industries that see more men than women are Agriculture, Fishing & Hunting (100.0%), Construction (100.0%), and Manufacturing (100.0%), whereas the industries that tend to have a higher number of women are Health Care & Social Assistance (82.8%), Educational Services (52.2%), and Retail Trade (48.7%).
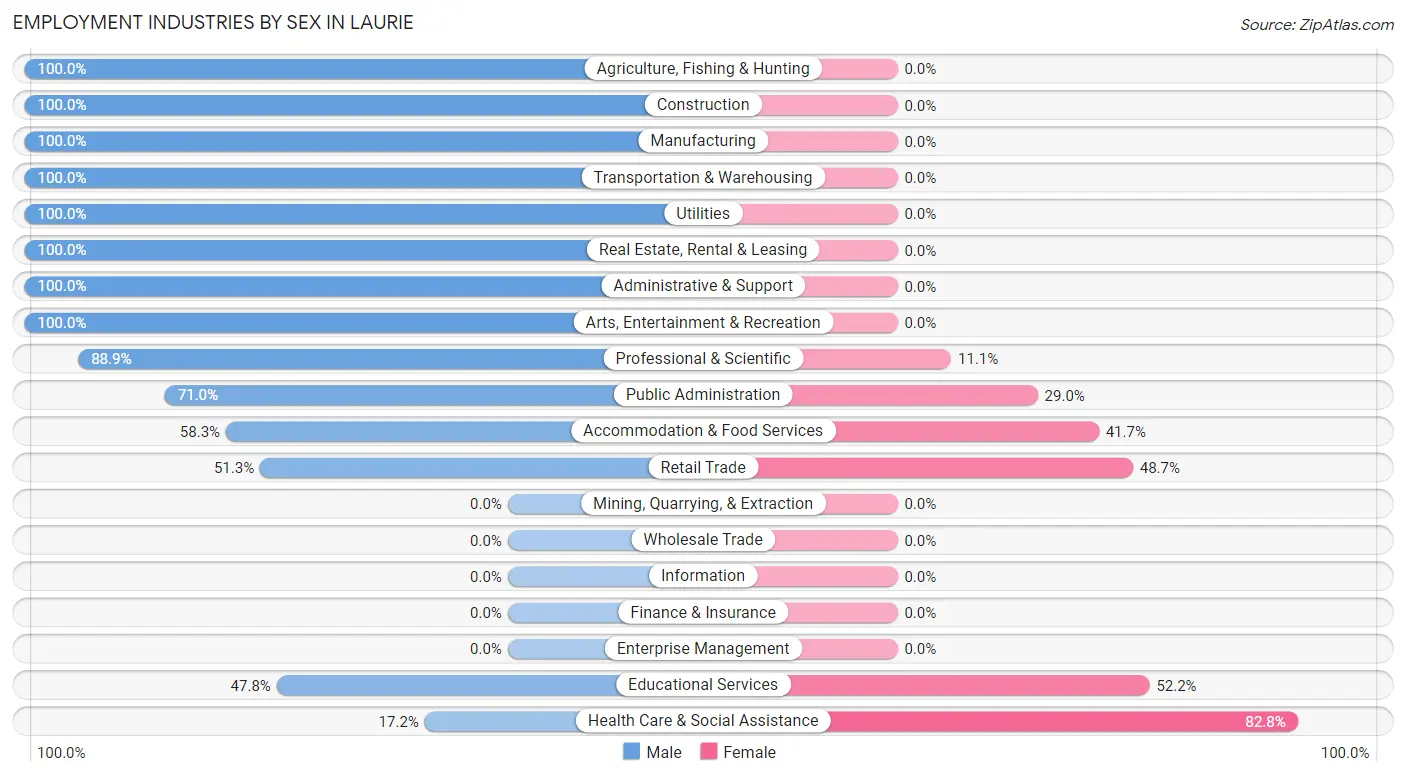
| Industry | Male | Female |
| Agriculture, Fishing & Hunting | 5 (100.0%) | 0 (0.0%) |
| Mining, Quarrying, & Extraction | 0 (0.0%) | 0 (0.0%) |
| Construction | 11 (100.0%) | 0 (0.0%) |
| Manufacturing | 11 (100.0%) | 0 (0.0%) |
| Wholesale Trade | 0 (0.0%) | 0 (0.0%) |
| Retail Trade | 20 (51.3%) | 19 (48.7%) |
| Transportation & Warehousing | 4 (100.0%) | 0 (0.0%) |
| Utilities | 2 (100.0%) | 0 (0.0%) |
| Information | 0 (0.0%) | 0 (0.0%) |
| Finance & Insurance | 0 (0.0%) | 0 (0.0%) |
| Real Estate, Rental & Leasing | 1 (100.0%) | 0 (0.0%) |
| Professional & Scientific | 8 (88.9%) | 1 (11.1%) |
| Enterprise Management | 0 (0.0%) | 0 (0.0%) |
| Administrative & Support | 10 (100.0%) | 0 (0.0%) |
| Educational Services | 11 (47.8%) | 12 (52.2%) |
| Health Care & Social Assistance | 11 (17.2%) | 53 (82.8%) |
| Arts, Entertainment & Recreation | 5 (100.0%) | 0 (0.0%) |
| Accommodation & Food Services | 14 (58.3%) | 10 (41.7%) |
| Public Administration | 22 (71.0%) | 9 (29.0%) |
| Total | 148 (47.1%) | 166 (52.9%) |
Education in Laurie
School Enrollment in Laurie
The most common levels of schooling among the 85 students in Laurie are elementary school (30 | 35.3%), high school (20 | 23.5%), and middle school (19 | 22.4%).
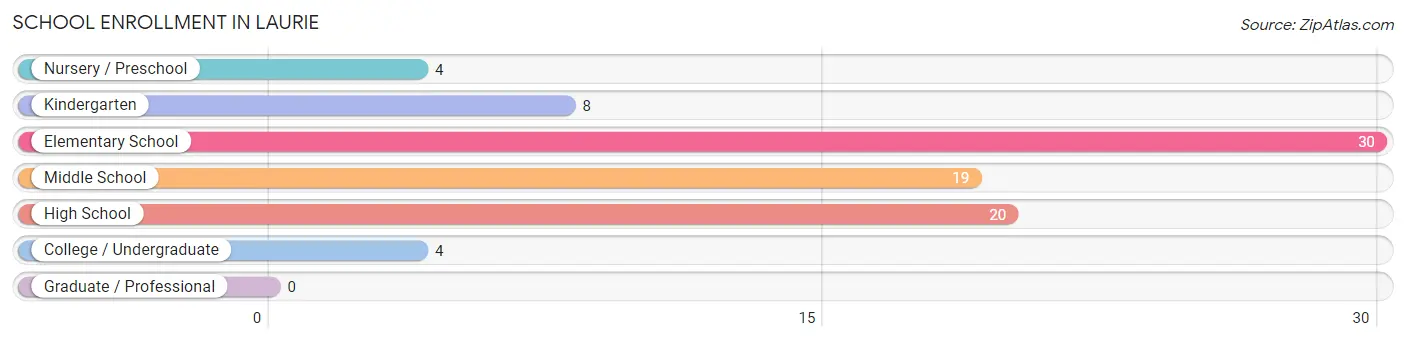
| School Level | # Students | % Students |
| Nursery / Preschool | 4 | 4.7% |
| Kindergarten | 8 | 9.4% |
| Elementary School | 30 | 35.3% |
| Middle School | 19 | 22.4% |
| High School | 20 | 23.5% |
| College / Undergraduate | 4 | 4.7% |
| Graduate / Professional | 0 | 0.0% |
| Total | 85 | 100.0% |
School Enrollment by Age by Funding Source in Laurie
Out of a total of 85 students who are enrolled in schools in Laurie, 15 (17.6%) attend a private institution, while the remaining 70 (82.4%) are enrolled in public schools. The age group of 3 to 4 year olds has the highest likelihood of being enrolled in private schools, with 4 (100.0% in the age bracket) enrolled. Conversely, the age group of 5 to 9 year old has the lowest likelihood of being enrolled in a private school, with 29 (100.0% in the age bracket) attending a public institution.
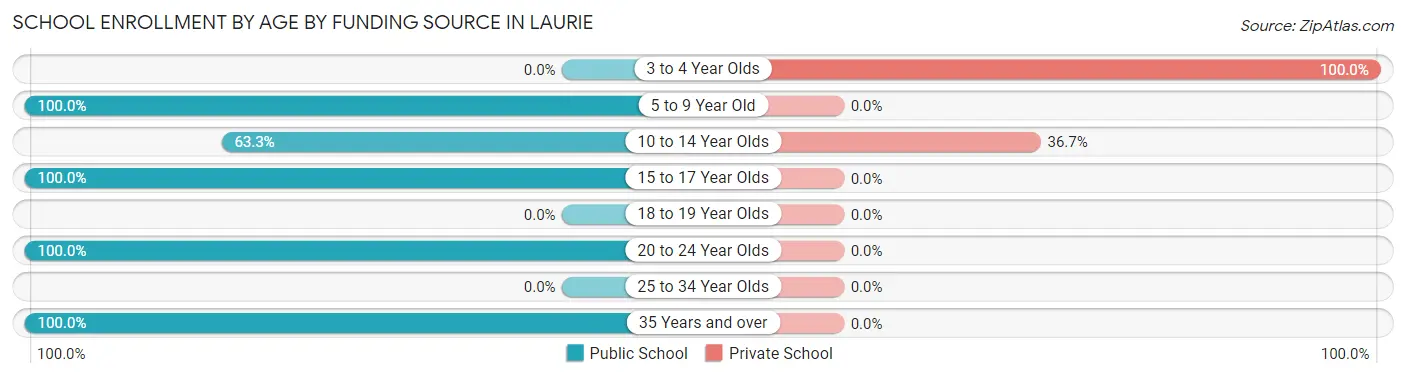
| Age Bracket | Public School | Private School |
| 3 to 4 Year Olds | 0 (0.0%) | 4 (100.0%) |
| 5 to 9 Year Old | 29 (100.0%) | 0 (0.0%) |
| 10 to 14 Year Olds | 19 (63.3%) | 11 (36.7%) |
| 15 to 17 Year Olds | 18 (100.0%) | 0 (0.0%) |
| 18 to 19 Year Olds | 0 (0.0%) | 0 (0.0%) |
| 20 to 24 Year Olds | 1 (100.0%) | 0 (0.0%) |
| 25 to 34 Year Olds | 0 (0.0%) | 0 (0.0%) |
| 35 Years and over | 3 (100.0%) | 0 (0.0%) |
| Total | 70 (82.4%) | 15 (17.6%) |
Educational Attainment by Field of Study in Laurie
Education (54 | 60.7%), psychology (8 | 9.0%), business (7 | 7.9%), liberal arts & history (5 | 5.6%), and arts & humanities (5 | 5.6%) are the most common fields of study among 89 individuals in Laurie who have obtained a bachelor's degree or higher.
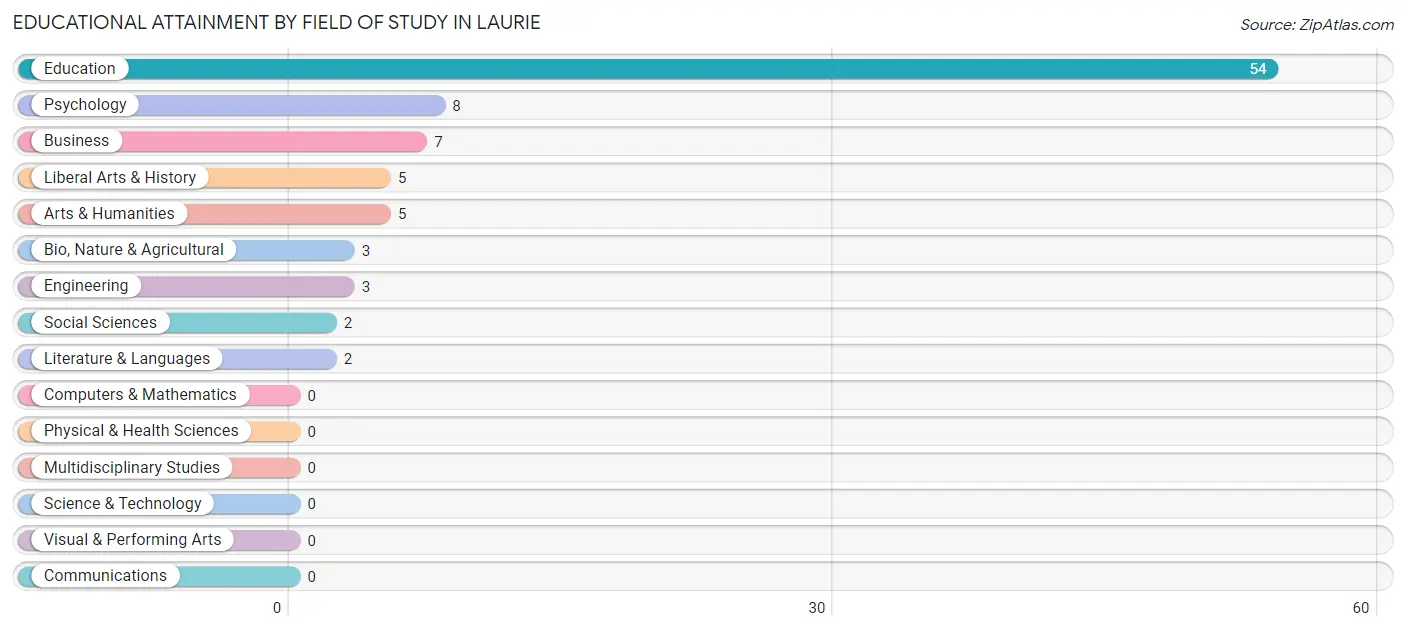
| Field of Study | # Graduates | % Graduates |
| Computers & Mathematics | 0 | 0.0% |
| Bio, Nature & Agricultural | 3 | 3.4% |
| Physical & Health Sciences | 0 | 0.0% |
| Psychology | 8 | 9.0% |
| Social Sciences | 2 | 2.2% |
| Engineering | 3 | 3.4% |
| Multidisciplinary Studies | 0 | 0.0% |
| Science & Technology | 0 | 0.0% |
| Business | 7 | 7.9% |
| Education | 54 | 60.7% |
| Literature & Languages | 2 | 2.2% |
| Liberal Arts & History | 5 | 5.6% |
| Visual & Performing Arts | 0 | 0.0% |
| Communications | 0 | 0.0% |
| Arts & Humanities | 5 | 5.6% |
| Total | 89 | 100.0% |
Transportation & Commute in Laurie
Vehicle Availability by Sex in Laurie
The most prevalent vehicle ownership categories in Laurie are males with 2 vehicles (61, accounting for 41.2%) and females with 2 vehicles (78, making up 36.7%).
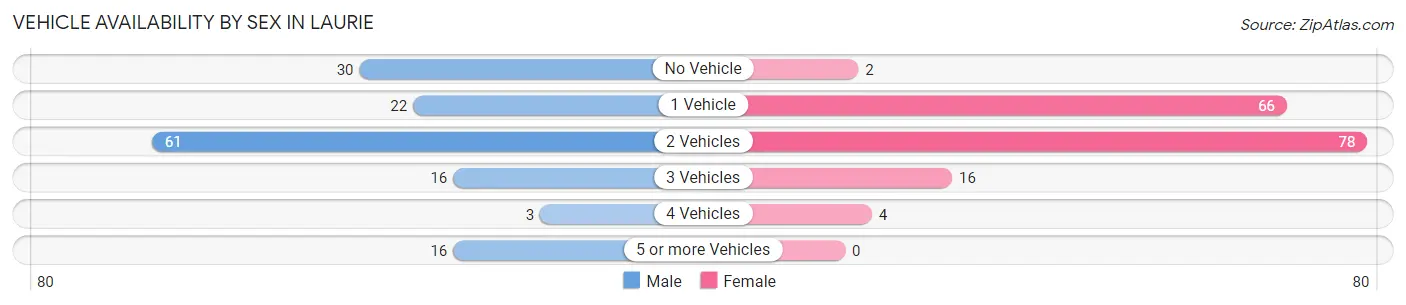
| Vehicles Available | Male | Female |
| No Vehicle | 30 (20.3%) | 2 (1.2%) |
| 1 Vehicle | 22 (14.9%) | 66 (39.8%) |
| 2 Vehicles | 61 (41.2%) | 78 (47.0%) |
| 3 Vehicles | 16 (10.8%) | 16 (9.6%) |
| 4 Vehicles | 3 (2.0%) | 4 (2.4%) |
| 5 or more Vehicles | 16 (10.8%) | 0 (0.0%) |
| Total | 148 (100.0%) | 166 (100.0%) |
Commute Time in Laurie
The most frequently occuring commute durations in Laurie are 10 to 14 minutes (73 commuters, 25.3%), 5 to 9 minutes (62 commuters, 21.4%), and 30 to 34 minutes (54 commuters, 18.7%).
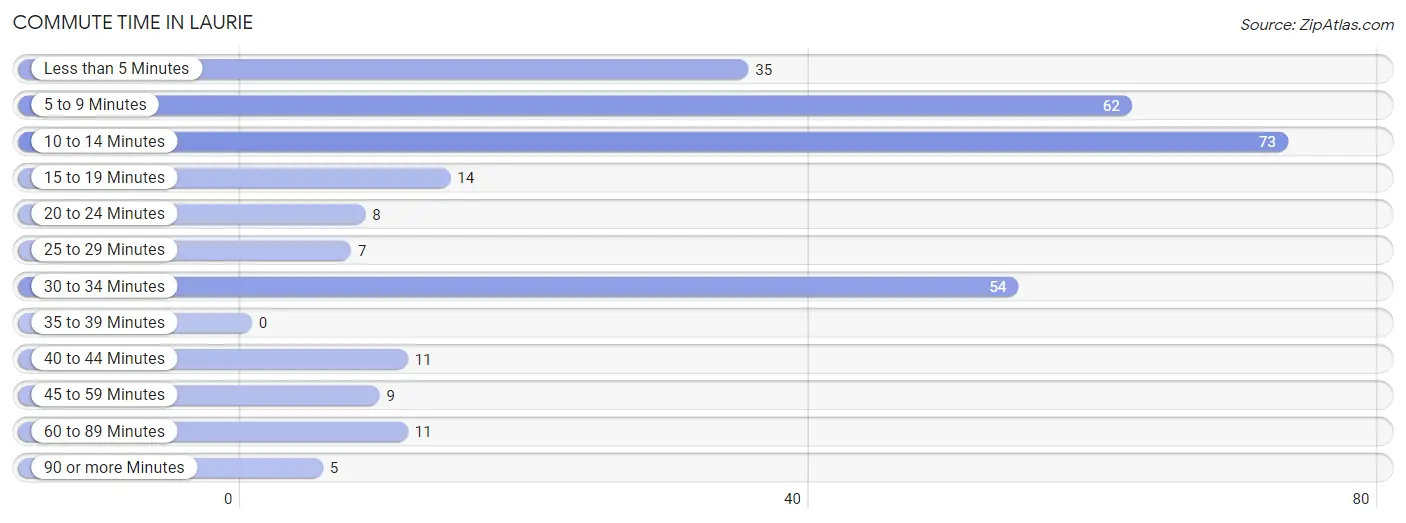
| Commute Time | # Commuters | % Commuters |
| Less than 5 Minutes | 35 | 12.1% |
| 5 to 9 Minutes | 62 | 21.4% |
| 10 to 14 Minutes | 73 | 25.3% |
| 15 to 19 Minutes | 14 | 4.8% |
| 20 to 24 Minutes | 8 | 2.8% |
| 25 to 29 Minutes | 7 | 2.4% |
| 30 to 34 Minutes | 54 | 18.7% |
| 35 to 39 Minutes | 0 | 0.0% |
| 40 to 44 Minutes | 11 | 3.8% |
| 45 to 59 Minutes | 9 | 3.1% |
| 60 to 89 Minutes | 11 | 3.8% |
| 90 or more Minutes | 5 | 1.7% |
Commute Time by Sex in Laurie
The most common commute times in Laurie are 5 to 9 minutes (36 commuters, 27.5%) for males and 10 to 14 minutes (71 commuters, 44.9%) for females.
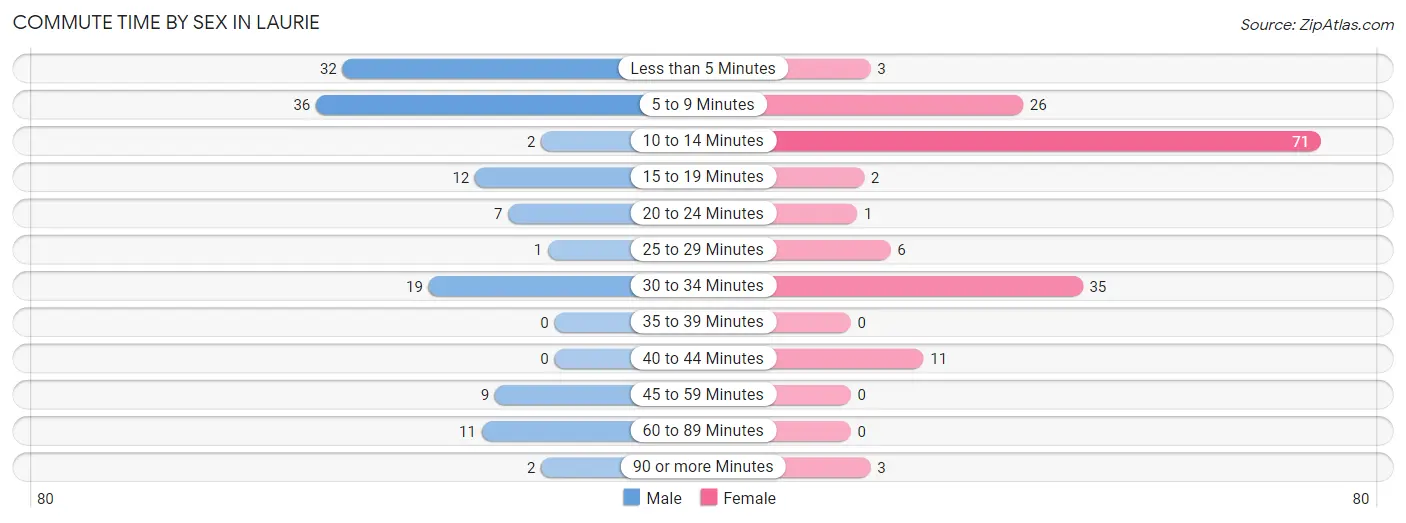
| Commute Time | Male | Female |
| Less than 5 Minutes | 32 (24.4%) | 3 (1.9%) |
| 5 to 9 Minutes | 36 (27.5%) | 26 (16.5%) |
| 10 to 14 Minutes | 2 (1.5%) | 71 (44.9%) |
| 15 to 19 Minutes | 12 (9.2%) | 2 (1.3%) |
| 20 to 24 Minutes | 7 (5.3%) | 1 (0.6%) |
| 25 to 29 Minutes | 1 (0.8%) | 6 (3.8%) |
| 30 to 34 Minutes | 19 (14.5%) | 35 (22.2%) |
| 35 to 39 Minutes | 0 (0.0%) | 0 (0.0%) |
| 40 to 44 Minutes | 0 (0.0%) | 11 (7.0%) |
| 45 to 59 Minutes | 9 (6.9%) | 0 (0.0%) |
| 60 to 89 Minutes | 11 (8.4%) | 0 (0.0%) |
| 90 or more Minutes | 2 (1.5%) | 3 (1.9%) |
Time of Departure to Work by Sex in Laurie
The most frequent times of departure to work in Laurie are 8:00 AM to 8:29 AM (31, 23.7%) for males and 7:00 AM to 7:29 AM (67, 42.4%) for females.
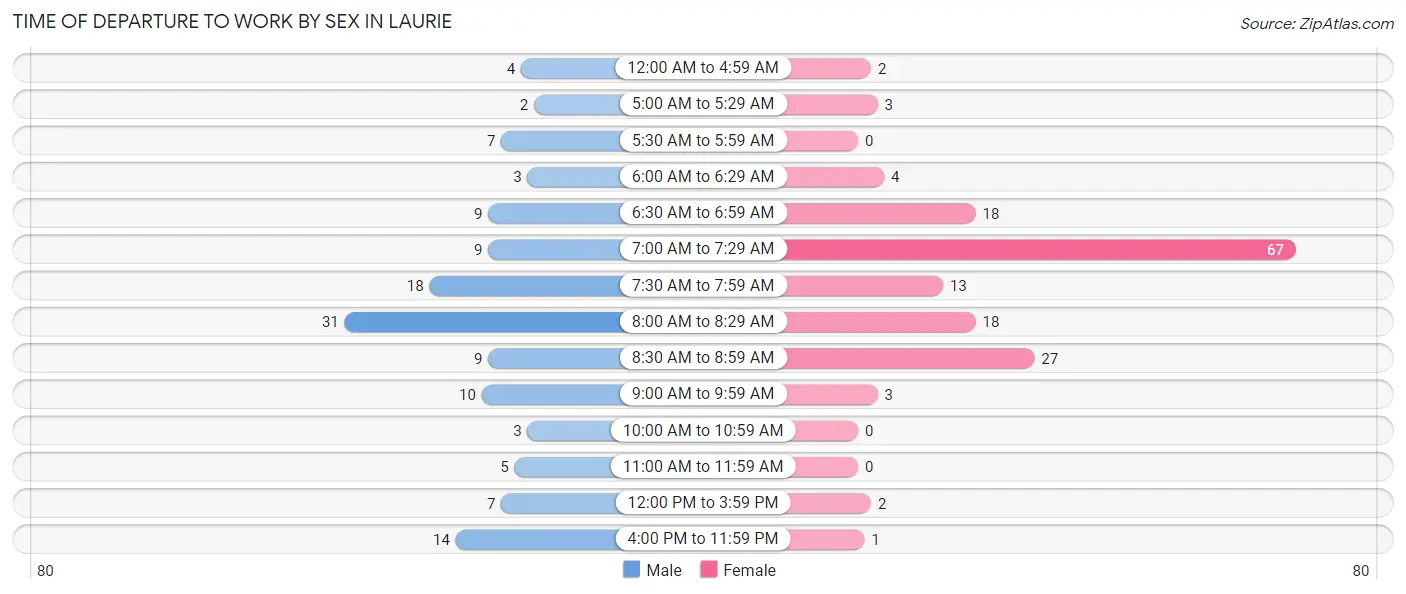
| Time of Departure | Male | Female |
| 12:00 AM to 4:59 AM | 4 (3.0%) | 2 (1.3%) |
| 5:00 AM to 5:29 AM | 2 (1.5%) | 3 (1.9%) |
| 5:30 AM to 5:59 AM | 7 (5.3%) | 0 (0.0%) |
| 6:00 AM to 6:29 AM | 3 (2.3%) | 4 (2.5%) |
| 6:30 AM to 6:59 AM | 9 (6.9%) | 18 (11.4%) |
| 7:00 AM to 7:29 AM | 9 (6.9%) | 67 (42.4%) |
| 7:30 AM to 7:59 AM | 18 (13.7%) | 13 (8.2%) |
| 8:00 AM to 8:29 AM | 31 (23.7%) | 18 (11.4%) |
| 8:30 AM to 8:59 AM | 9 (6.9%) | 27 (17.1%) |
| 9:00 AM to 9:59 AM | 10 (7.6%) | 3 (1.9%) |
| 10:00 AM to 10:59 AM | 3 (2.3%) | 0 (0.0%) |
| 11:00 AM to 11:59 AM | 5 (3.8%) | 0 (0.0%) |
| 12:00 PM to 3:59 PM | 7 (5.3%) | 2 (1.3%) |
| 4:00 PM to 11:59 PM | 14 (10.7%) | 1 (0.6%) |
| Total | 131 (100.0%) | 158 (100.0%) |
Housing Occupancy in Laurie
Occupancy by Ownership in Laurie
Of the total 455 dwellings in Laurie, owner-occupied units account for 327 (71.9%), while renter-occupied units make up 128 (28.1%).
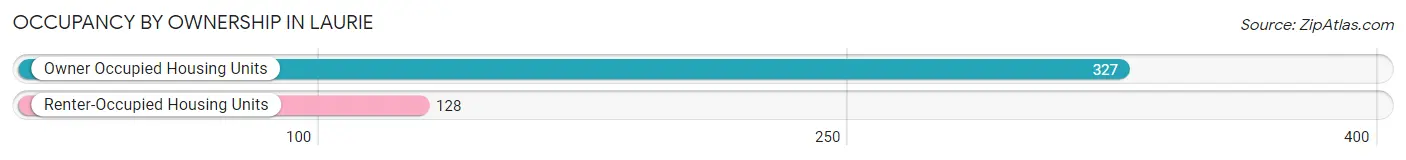
| Occupancy | # Housing Units | % Housing Units |
| Owner Occupied Housing Units | 327 | 71.9% |
| Renter-Occupied Housing Units | 128 | 28.1% |
| Total Occupied Housing Units | 455 | 100.0% |
Occupancy by Household Size in Laurie
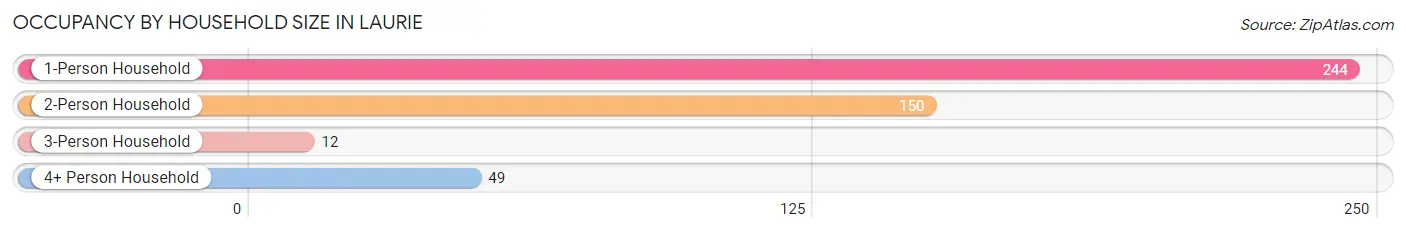
| Household Size | # Housing Units | % Housing Units |
| 1-Person Household | 244 | 53.6% |
| 2-Person Household | 150 | 33.0% |
| 3-Person Household | 12 | 2.6% |
| 4+ Person Household | 49 | 10.8% |
| Total Housing Units | 455 | 100.0% |
Occupancy by Ownership by Household Size in Laurie
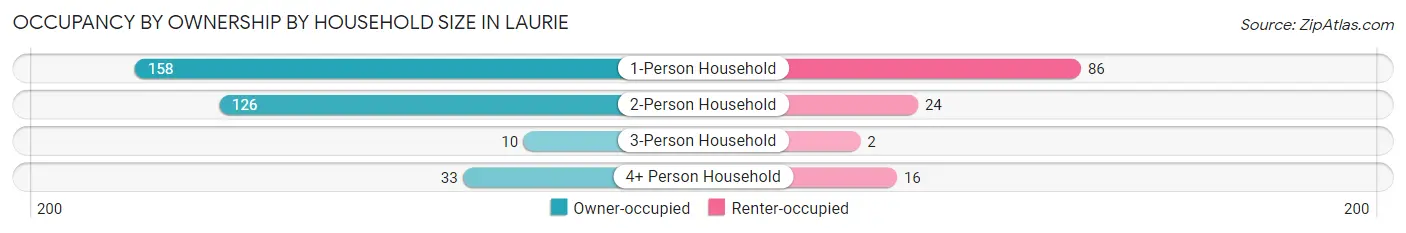
| Household Size | Owner-occupied | Renter-occupied |
| 1-Person Household | 158 (64.7%) | 86 (35.2%) |
| 2-Person Household | 126 (84.0%) | 24 (16.0%) |
| 3-Person Household | 10 (83.3%) | 2 (16.7%) |
| 4+ Person Household | 33 (67.3%) | 16 (32.7%) |
| Total Housing Units | 327 (71.9%) | 128 (28.1%) |
Occupancy by Educational Attainment in Laurie
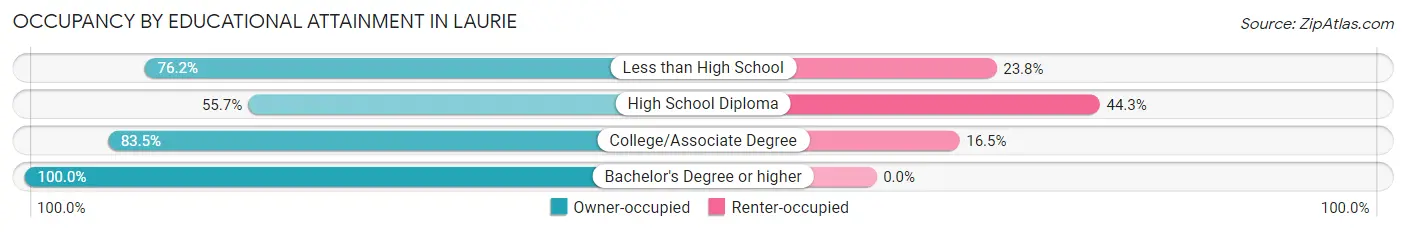
| Household Size | Owner-occupied | Renter-occupied |
| Less than High School | 16 (76.2%) | 5 (23.8%) |
| High School Diploma | 117 (55.7%) | 93 (44.3%) |
| College/Associate Degree | 152 (83.5%) | 30 (16.5%) |
| Bachelor's Degree or higher | 42 (100.0%) | 0 (0.0%) |
Occupancy by Age of Householder in Laurie
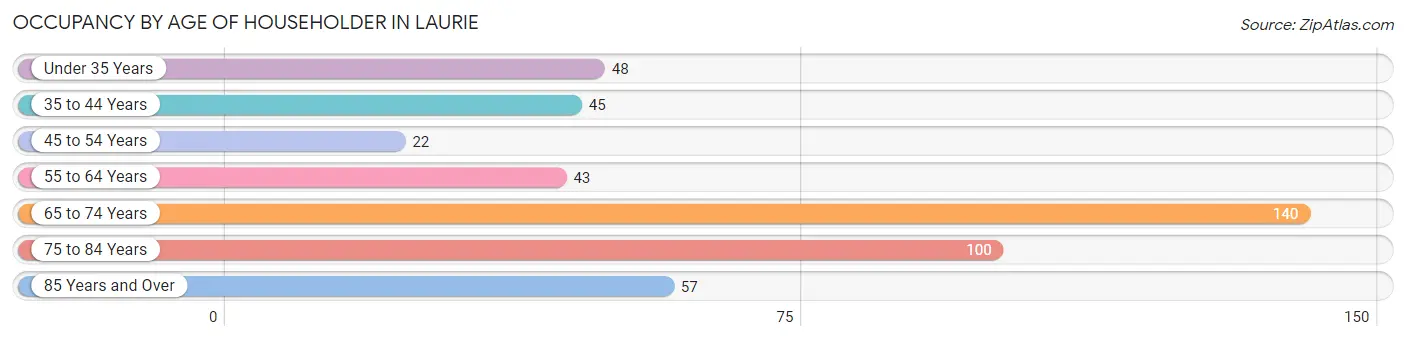
| Age Bracket | # Households | % Households |
| Under 35 Years | 48 | 10.5% |
| 35 to 44 Years | 45 | 9.9% |
| 45 to 54 Years | 22 | 4.8% |
| 55 to 64 Years | 43 | 9.5% |
| 65 to 74 Years | 140 | 30.8% |
| 75 to 84 Years | 100 | 22.0% |
| 85 Years and Over | 57 | 12.5% |
| Total | 455 | 100.0% |
Housing Finances in Laurie
Median Income by Occupancy in Laurie
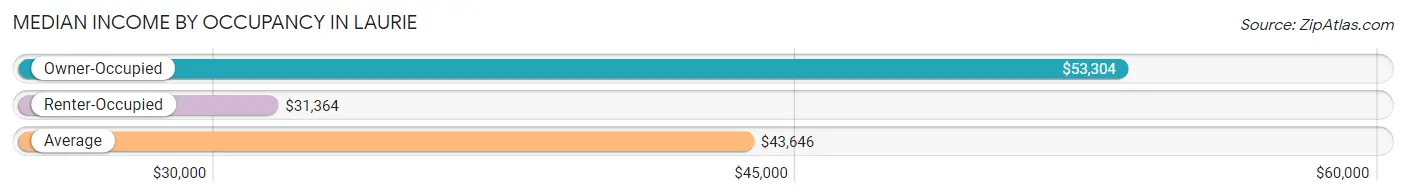
| Occupancy Type | # Households | Median Income |
| Owner-Occupied | 327 (71.9%) | $53,304 |
| Renter-Occupied | 128 (28.1%) | $31,364 |
| Average | 455 (100.0%) | $43,646 |
Occupancy by Householder Income Bracket in Laurie
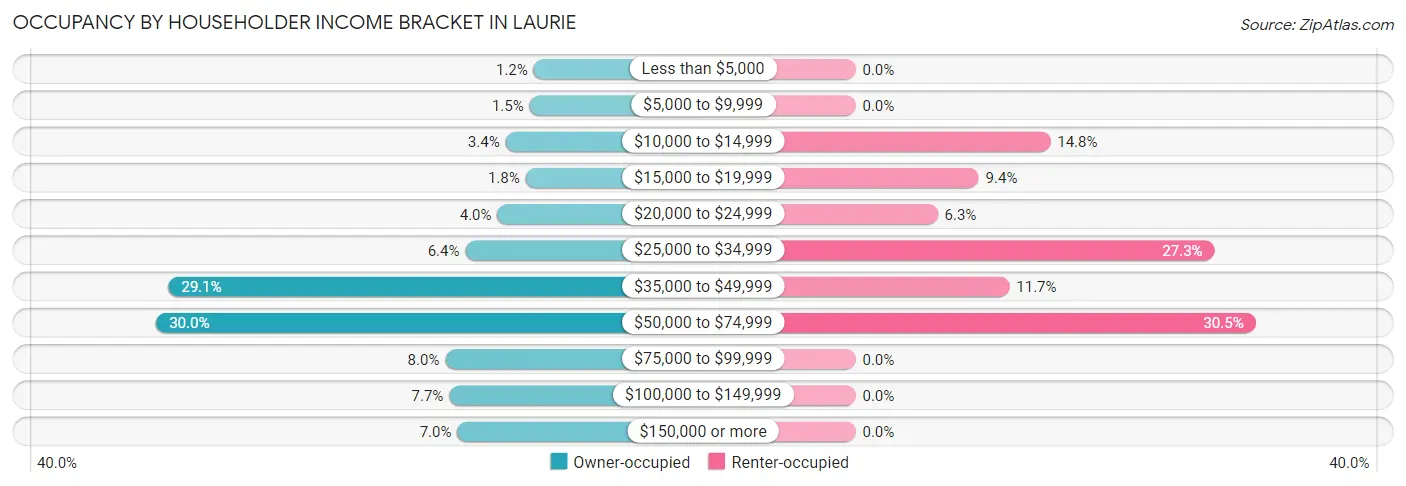
| Income Bracket | Owner-occupied | Renter-occupied |
| Less than $5,000 | 4 (1.2%) | 0 (0.0%) |
| $5,000 to $9,999 | 5 (1.5%) | 0 (0.0%) |
| $10,000 to $14,999 | 11 (3.4%) | 19 (14.8%) |
| $15,000 to $19,999 | 6 (1.8%) | 12 (9.4%) |
| $20,000 to $24,999 | 13 (4.0%) | 8 (6.2%) |
| $25,000 to $34,999 | 21 (6.4%) | 35 (27.3%) |
| $35,000 to $49,999 | 95 (29.0%) | 15 (11.7%) |
| $50,000 to $74,999 | 98 (30.0%) | 39 (30.5%) |
| $75,000 to $99,999 | 26 (8.0%) | 0 (0.0%) |
| $100,000 to $149,999 | 25 (7.6%) | 0 (0.0%) |
| $150,000 or more | 23 (7.0%) | 0 (0.0%) |
| Total | 327 (100.0%) | 128 (100.0%) |
Monthly Housing Cost Tiers in Laurie
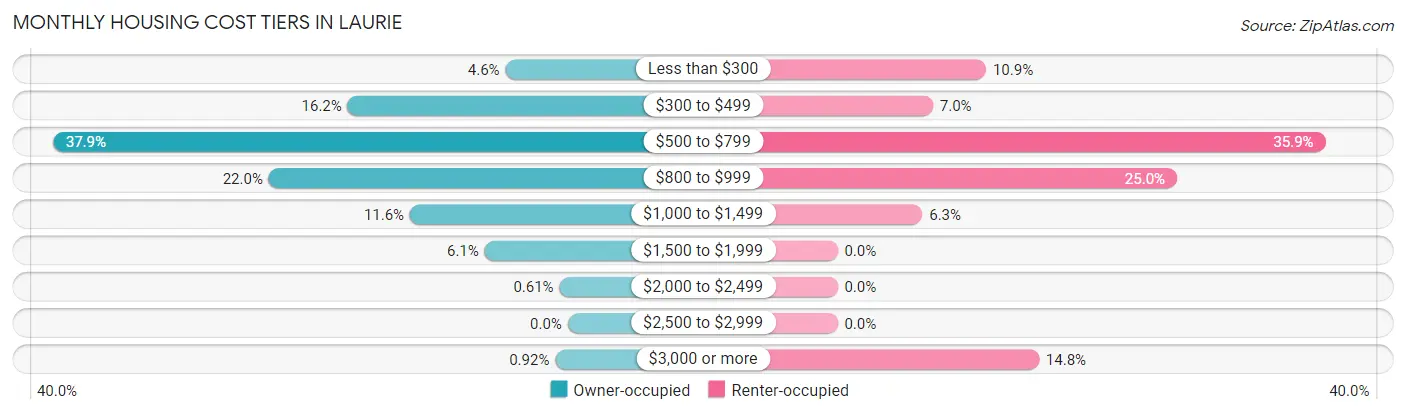
| Monthly Cost | Owner-occupied | Renter-occupied |
| Less than $300 | 15 (4.6%) | 14 (10.9%) |
| $300 to $499 | 53 (16.2%) | 9 (7.0%) |
| $500 to $799 | 124 (37.9%) | 46 (35.9%) |
| $800 to $999 | 72 (22.0%) | 32 (25.0%) |
| $1,000 to $1,499 | 38 (11.6%) | 8 (6.2%) |
| $1,500 to $1,999 | 20 (6.1%) | 0 (0.0%) |
| $2,000 to $2,499 | 2 (0.6%) | 0 (0.0%) |
| $2,500 to $2,999 | 0 (0.0%) | 0 (0.0%) |
| $3,000 or more | 3 (0.9%) | 19 (14.8%) |
| Total | 327 (100.0%) | 128 (100.0%) |
Physical Housing Characteristics in Laurie
Housing Structures in Laurie
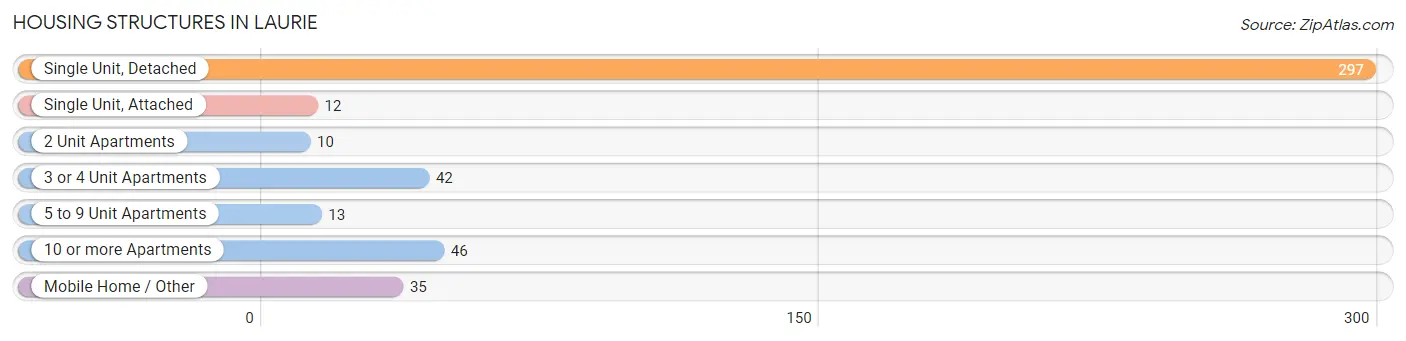
| Structure Type | # Housing Units | % Housing Units |
| Single Unit, Detached | 297 | 65.3% |
| Single Unit, Attached | 12 | 2.6% |
| 2 Unit Apartments | 10 | 2.2% |
| 3 or 4 Unit Apartments | 42 | 9.2% |
| 5 to 9 Unit Apartments | 13 | 2.9% |
| 10 or more Apartments | 46 | 10.1% |
| Mobile Home / Other | 35 | 7.7% |
| Total | 455 | 100.0% |
Housing Structures by Occupancy in Laurie
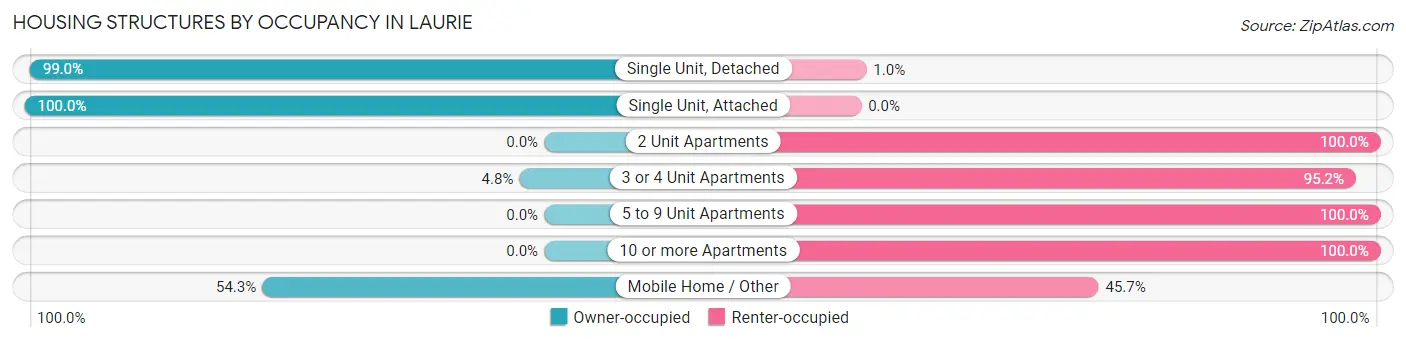
| Structure Type | Owner-occupied | Renter-occupied |
| Single Unit, Detached | 294 (99.0%) | 3 (1.0%) |
| Single Unit, Attached | 12 (100.0%) | 0 (0.0%) |
| 2 Unit Apartments | 0 (0.0%) | 10 (100.0%) |
| 3 or 4 Unit Apartments | 2 (4.8%) | 40 (95.2%) |
| 5 to 9 Unit Apartments | 0 (0.0%) | 13 (100.0%) |
| 10 or more Apartments | 0 (0.0%) | 46 (100.0%) |
| Mobile Home / Other | 19 (54.3%) | 16 (45.7%) |
| Total | 327 (71.9%) | 128 (28.1%) |
Housing Structures by Number of Rooms in Laurie
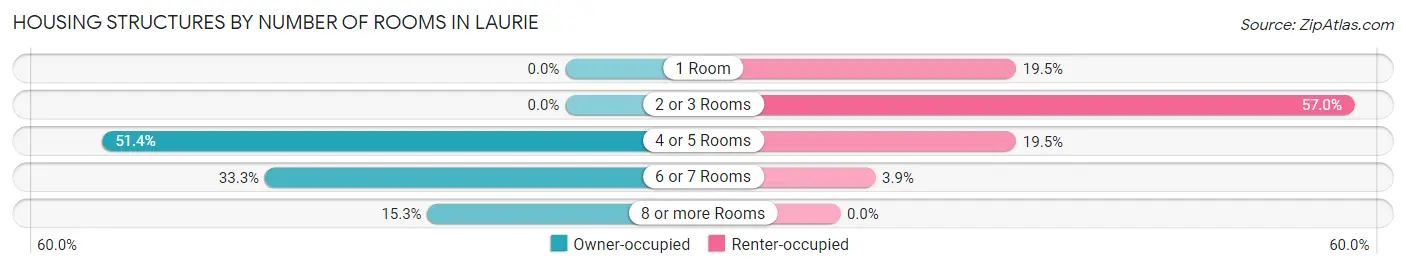
| Number of Rooms | Owner-occupied | Renter-occupied |
| 1 Room | 0 (0.0%) | 25 (19.5%) |
| 2 or 3 Rooms | 0 (0.0%) | 73 (57.0%) |
| 4 or 5 Rooms | 168 (51.4%) | 25 (19.5%) |
| 6 or 7 Rooms | 109 (33.3%) | 5 (3.9%) |
| 8 or more Rooms | 50 (15.3%) | 0 (0.0%) |
| Total | 327 (100.0%) | 128 (100.0%) |
Housing Structure by Heating Type in Laurie
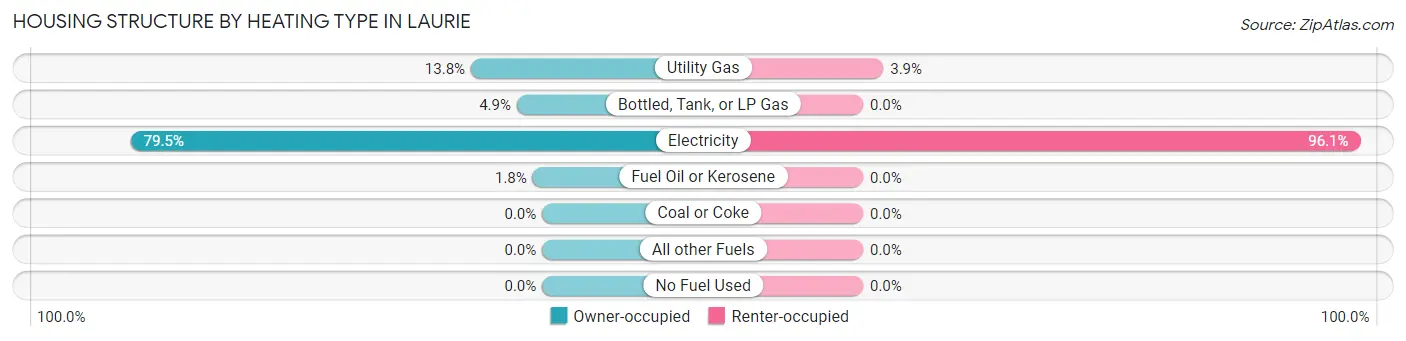
| Heating Type | Owner-occupied | Renter-occupied |
| Utility Gas | 45 (13.8%) | 5 (3.9%) |
| Bottled, Tank, or LP Gas | 16 (4.9%) | 0 (0.0%) |
| Electricity | 260 (79.5%) | 123 (96.1%) |
| Fuel Oil or Kerosene | 6 (1.8%) | 0 (0.0%) |
| Coal or Coke | 0 (0.0%) | 0 (0.0%) |
| All other Fuels | 0 (0.0%) | 0 (0.0%) |
| No Fuel Used | 0 (0.0%) | 0 (0.0%) |
| Total | 327 (100.0%) | 128 (100.0%) |
Household Vehicle Usage in Laurie
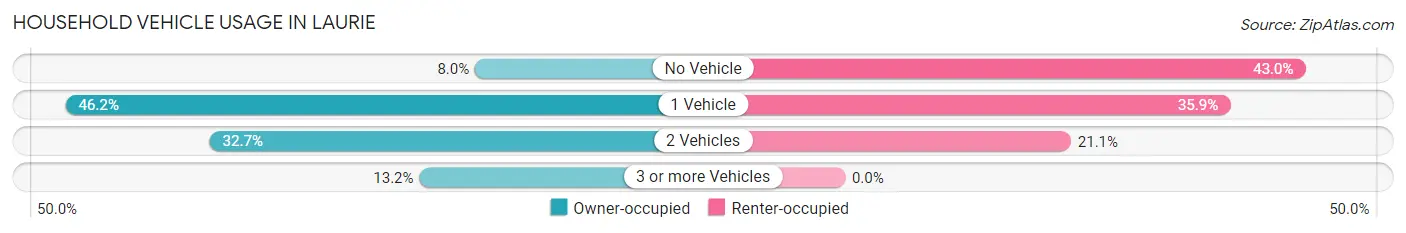
| Vehicles per Household | Owner-occupied | Renter-occupied |
| No Vehicle | 26 (8.0%) | 55 (43.0%) |
| 1 Vehicle | 151 (46.2%) | 46 (35.9%) |
| 2 Vehicles | 107 (32.7%) | 27 (21.1%) |
| 3 or more Vehicles | 43 (13.2%) | 0 (0.0%) |
| Total | 327 (100.0%) | 128 (100.0%) |
Real Estate & Mortgages in Laurie
Real Estate and Mortgage Overview in Laurie
| Characteristic | Without Mortgage | With Mortgage |
| Housing Units | 144 | 183 |
| Median Property Value | $187,500 | $150,900 |
| Median Household Income | $52,500 | $21 |
| Monthly Housing Costs | $508 | $3 |
| Real Estate Taxes | $1,314 | $1 |
Property Value by Mortgage Status in Laurie
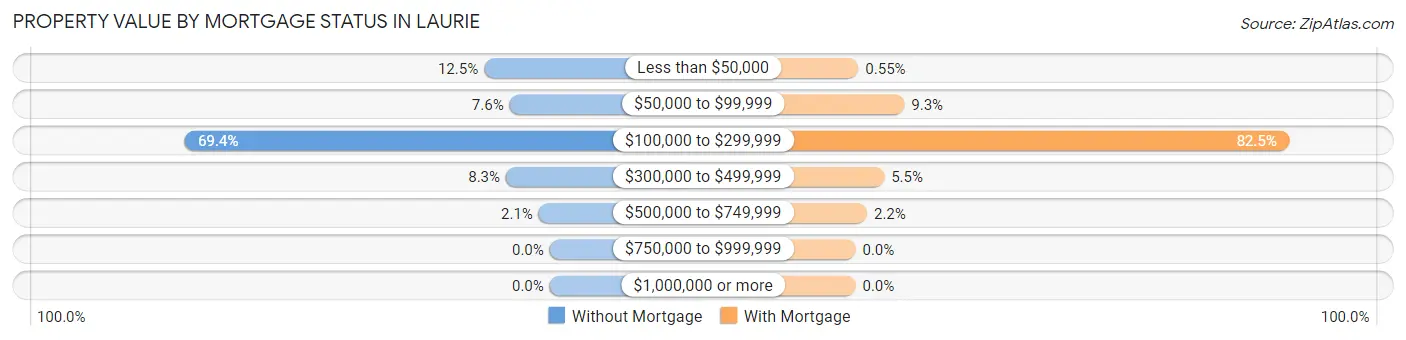
| Property Value | Without Mortgage | With Mortgage |
| Less than $50,000 | 18 (12.5%) | 1 (0.5%) |
| $50,000 to $99,999 | 11 (7.6%) | 17 (9.3%) |
| $100,000 to $299,999 | 100 (69.4%) | 151 (82.5%) |
| $300,000 to $499,999 | 12 (8.3%) | 10 (5.5%) |
| $500,000 to $749,999 | 3 (2.1%) | 4 (2.2%) |
| $750,000 to $999,999 | 0 (0.0%) | 0 (0.0%) |
| $1,000,000 or more | 0 (0.0%) | 0 (0.0%) |
| Total | 144 (100.0%) | 183 (100.0%) |
Household Income by Mortgage Status in Laurie
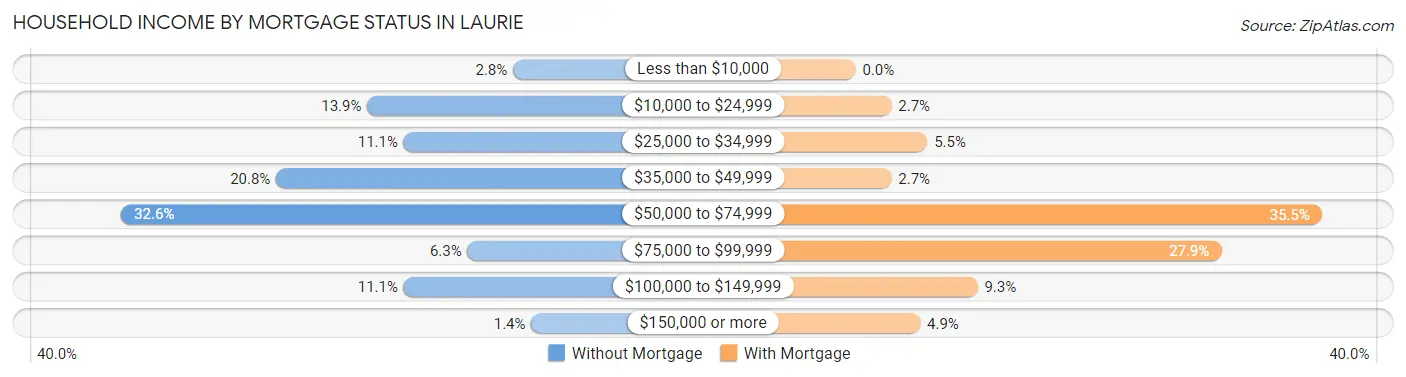
| Household Income | Without Mortgage | With Mortgage |
| Less than $10,000 | 4 (2.8%) | 0 (0.0%) |
| $10,000 to $24,999 | 20 (13.9%) | 5 (2.7%) |
| $25,000 to $34,999 | 16 (11.1%) | 10 (5.5%) |
| $35,000 to $49,999 | 30 (20.8%) | 5 (2.7%) |
| $50,000 to $74,999 | 47 (32.6%) | 65 (35.5%) |
| $75,000 to $99,999 | 9 (6.2%) | 51 (27.9%) |
| $100,000 to $149,999 | 16 (11.1%) | 17 (9.3%) |
| $150,000 or more | 2 (1.4%) | 9 (4.9%) |
| Total | 144 (100.0%) | 183 (100.0%) |
Property Value to Household Income Ratio in Laurie
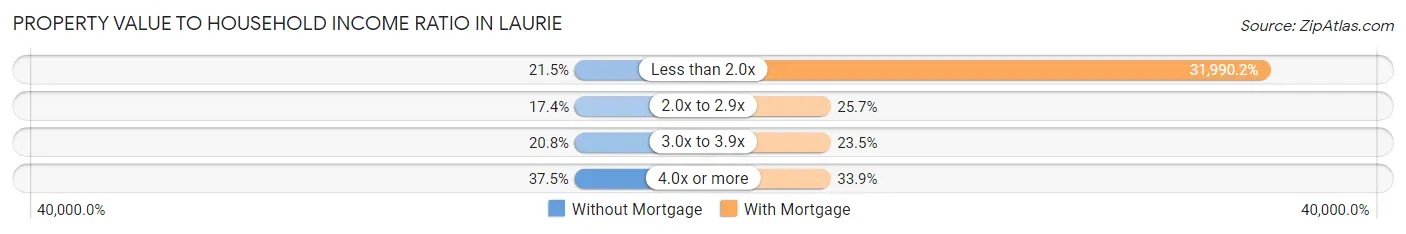
| Value-to-Income Ratio | Without Mortgage | With Mortgage |
| Less than 2.0x | 31 (21.5%) | 58,542 (31,990.2%) |
| 2.0x to 2.9x | 25 (17.4%) | 47 (25.7%) |
| 3.0x to 3.9x | 30 (20.8%) | 43 (23.5%) |
| 4.0x or more | 54 (37.5%) | 62 (33.9%) |
| Total | 144 (100.0%) | 183 (100.0%) |
Real Estate Taxes by Mortgage Status in Laurie
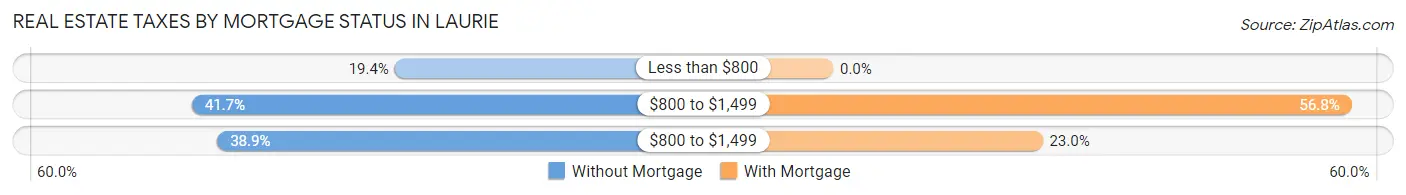
| Property Taxes | Without Mortgage | With Mortgage |
| Less than $800 | 28 (19.4%) | 0 (0.0%) |
| $800 to $1,499 | 60 (41.7%) | 104 (56.8%) |
| $800 to $1,499 | 56 (38.9%) | 42 (23.0%) |
| Total | 144 (100.0%) | 183 (100.0%) |
Health & Disability in Laurie
Health Insurance Coverage by Age in Laurie
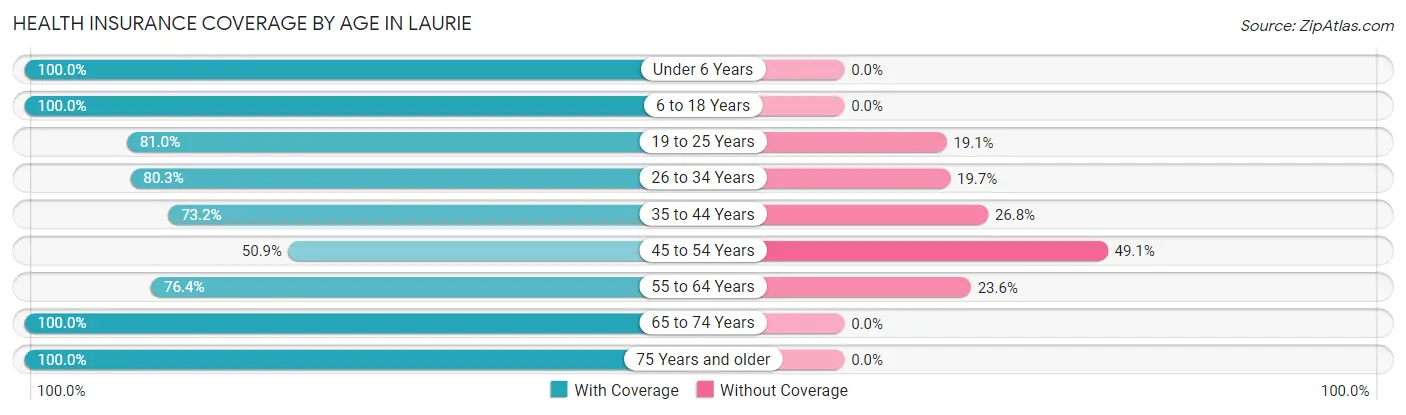
| Age Bracket | With Coverage | Without Coverage |
| Under 6 Years | 62 (100.0%) | 0 (0.0%) |
| 6 to 18 Years | 77 (100.0%) | 0 (0.0%) |
| 19 to 25 Years | 17 (80.9%) | 4 (19.1%) |
| 26 to 34 Years | 57 (80.3%) | 14 (19.7%) |
| 35 to 44 Years | 82 (73.2%) | 30 (26.8%) |
| 45 to 54 Years | 28 (50.9%) | 27 (49.1%) |
| 55 to 64 Years | 94 (76.4%) | 29 (23.6%) |
| 65 to 74 Years | 167 (100.0%) | 0 (0.0%) |
| 75 Years and older | 230 (100.0%) | 0 (0.0%) |
| Total | 814 (88.7%) | 104 (11.3%) |
Health Insurance Coverage by Citizenship Status in Laurie
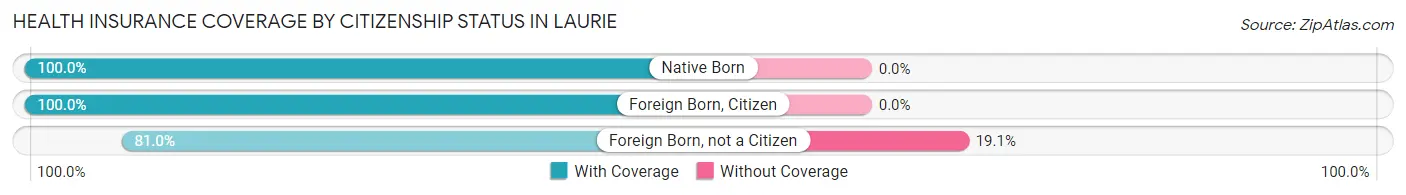
| Citizenship Status | With Coverage | Without Coverage |
| Native Born | 62 (100.0%) | 0 (0.0%) |
| Foreign Born, Citizen | 77 (100.0%) | 0 (0.0%) |
| Foreign Born, not a Citizen | 17 (80.9%) | 4 (19.1%) |
Health Insurance Coverage by Household Income in Laurie
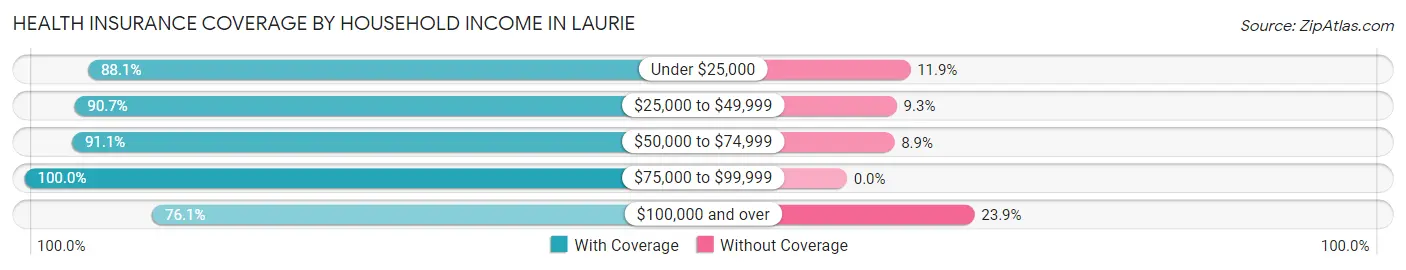
| Household Income | With Coverage | Without Coverage |
| Under $25,000 | 89 (88.1%) | 12 (11.9%) |
| $25,000 to $49,999 | 262 (90.7%) | 27 (9.3%) |
| $50,000 to $74,999 | 277 (91.1%) | 27 (8.9%) |
| $75,000 to $99,999 | 65 (100.0%) | 0 (0.0%) |
| $100,000 and over | 121 (76.1%) | 38 (23.9%) |
Public vs Private Health Insurance Coverage by Age in Laurie
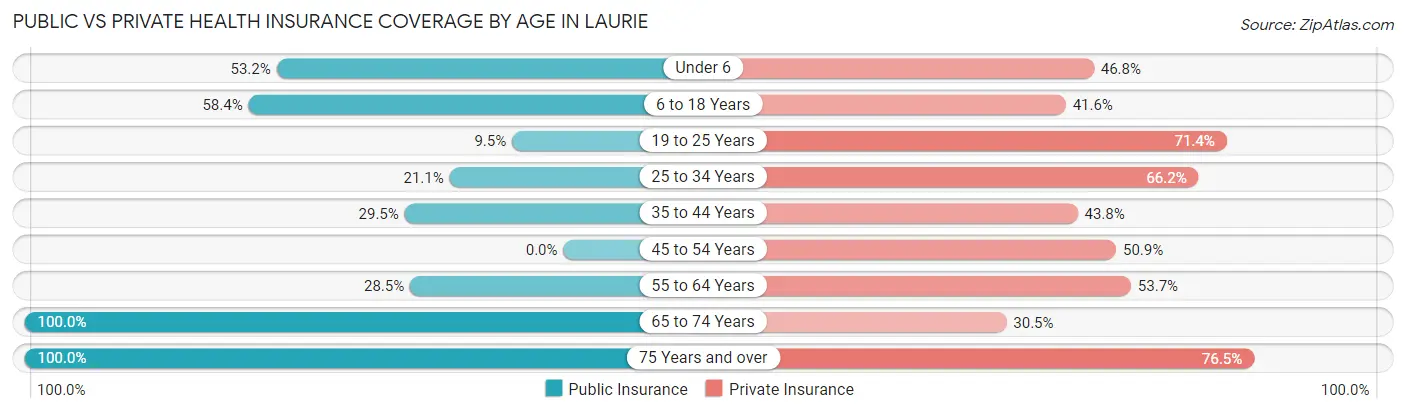
| Age Bracket | Public Insurance | Private Insurance |
| Under 6 | 33 (53.2%) | 29 (46.8%) |
| 6 to 18 Years | 45 (58.4%) | 32 (41.6%) |
| 19 to 25 Years | 2 (9.5%) | 15 (71.4%) |
| 25 to 34 Years | 15 (21.1%) | 47 (66.2%) |
| 35 to 44 Years | 33 (29.5%) | 49 (43.8%) |
| 45 to 54 Years | 0 (0.0%) | 28 (50.9%) |
| 55 to 64 Years | 35 (28.5%) | 66 (53.7%) |
| 65 to 74 Years | 167 (100.0%) | 51 (30.5%) |
| 75 Years and over | 230 (100.0%) | 176 (76.5%) |
| Total | 560 (61.0%) | 493 (53.7%) |
Disability Status by Sex by Age in Laurie
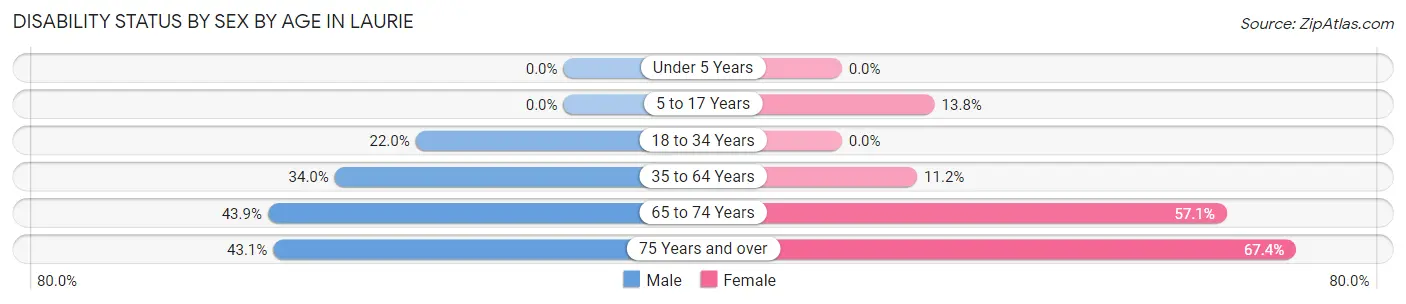
| Age Bracket | Male | Female |
| Under 5 Years | 0 (0.0%) | 0 (0.0%) |
| 5 to 17 Years | 0 (0.0%) | 4 (13.8%) |
| 18 to 34 Years | 9 (22.0%) | 0 (0.0%) |
| 35 to 64 Years | 53 (34.0%) | 15 (11.2%) |
| 65 to 74 Years | 18 (43.9%) | 72 (57.1%) |
| 75 Years and over | 25 (43.1%) | 116 (67.4%) |
Disability Class by Sex by Age in Laurie
Disability Class: Hearing Difficulty
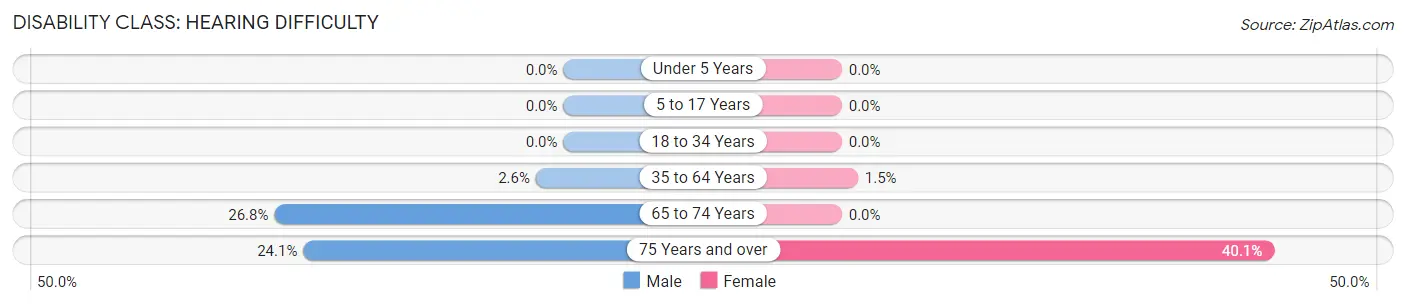
| Age Bracket | Male | Female |
| Under 5 Years | 0 (0.0%) | 0 (0.0%) |
| 5 to 17 Years | 0 (0.0%) | 0 (0.0%) |
| 18 to 34 Years | 0 (0.0%) | 0 (0.0%) |
| 35 to 64 Years | 4 (2.6%) | 2 (1.5%) |
| 65 to 74 Years | 11 (26.8%) | 0 (0.0%) |
| 75 Years and over | 14 (24.1%) | 69 (40.1%) |
Disability Class: Vision Difficulty
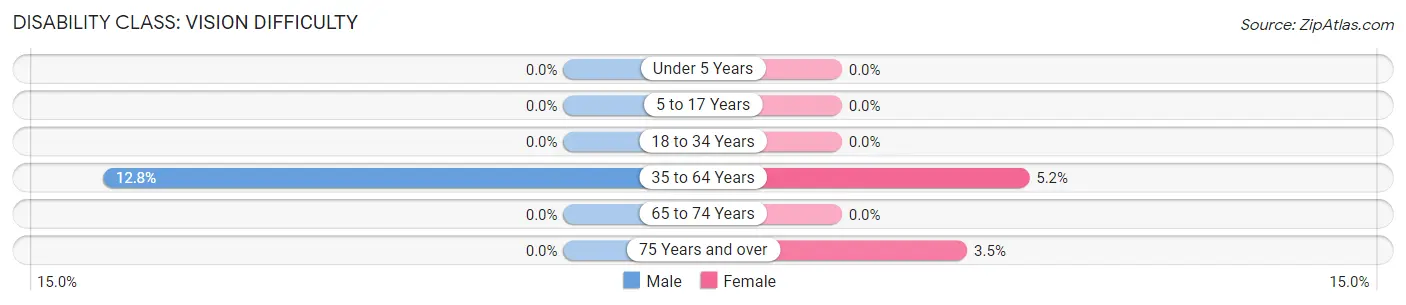
| Age Bracket | Male | Female |
| Under 5 Years | 0 (0.0%) | 0 (0.0%) |
| 5 to 17 Years | 0 (0.0%) | 0 (0.0%) |
| 18 to 34 Years | 0 (0.0%) | 0 (0.0%) |
| 35 to 64 Years | 20 (12.8%) | 7 (5.2%) |
| 65 to 74 Years | 0 (0.0%) | 0 (0.0%) |
| 75 Years and over | 0 (0.0%) | 6 (3.5%) |
Disability Class: Cognitive Difficulty
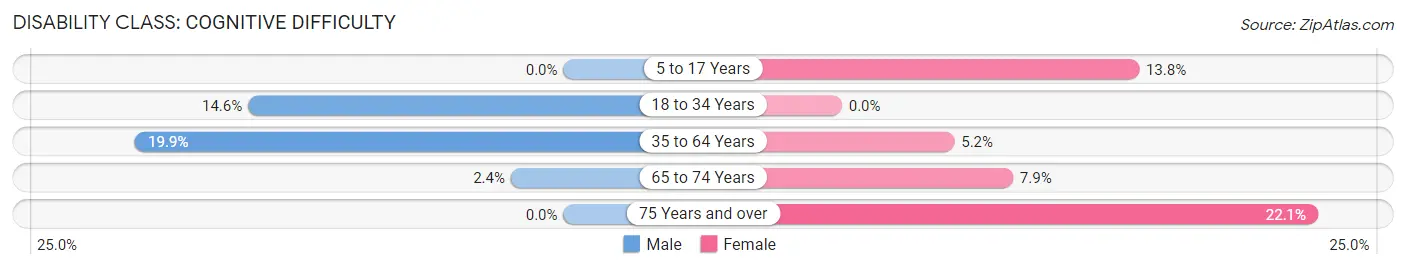
| Age Bracket | Male | Female |
| 5 to 17 Years | 0 (0.0%) | 4 (13.8%) |
| 18 to 34 Years | 6 (14.6%) | 0 (0.0%) |
| 35 to 64 Years | 31 (19.9%) | 7 (5.2%) |
| 65 to 74 Years | 1 (2.4%) | 10 (7.9%) |
| 75 Years and over | 0 (0.0%) | 38 (22.1%) |
Disability Class: Ambulatory Difficulty
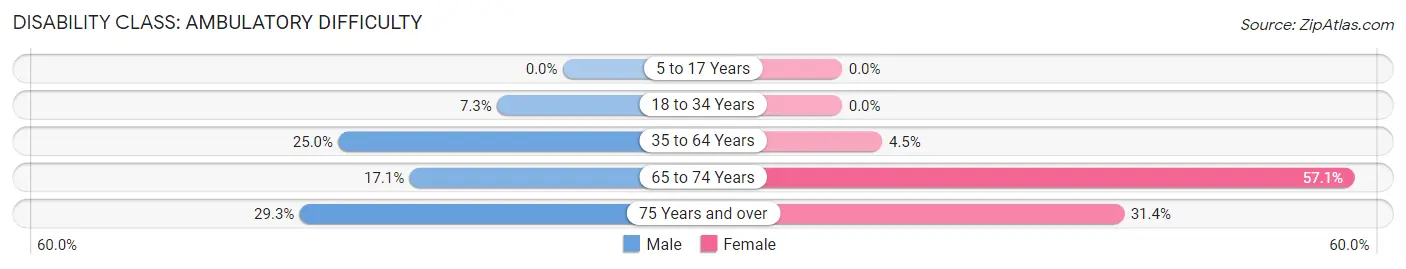
| Age Bracket | Male | Female |
| 5 to 17 Years | 0 (0.0%) | 0 (0.0%) |
| 18 to 34 Years | 3 (7.3%) | 0 (0.0%) |
| 35 to 64 Years | 39 (25.0%) | 6 (4.5%) |
| 65 to 74 Years | 7 (17.1%) | 72 (57.1%) |
| 75 Years and over | 17 (29.3%) | 54 (31.4%) |
Disability Class: Self-Care Difficulty
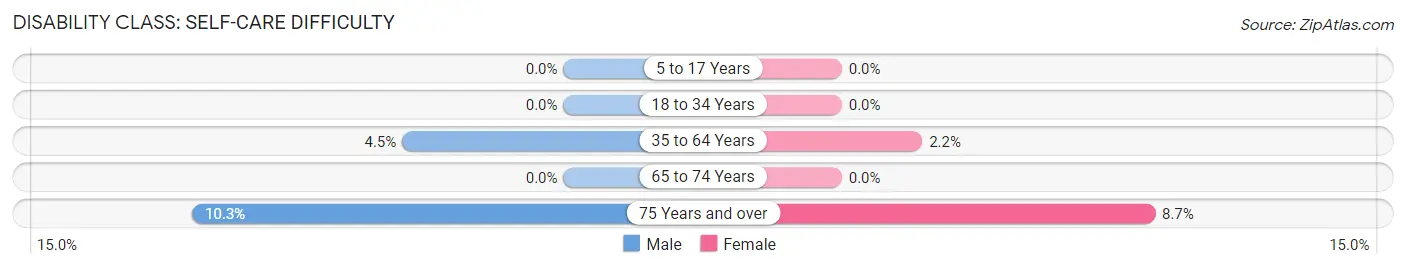
| Age Bracket | Male | Female |
| 5 to 17 Years | 0 (0.0%) | 0 (0.0%) |
| 18 to 34 Years | 0 (0.0%) | 0 (0.0%) |
| 35 to 64 Years | 7 (4.5%) | 3 (2.2%) |
| 65 to 74 Years | 0 (0.0%) | 0 (0.0%) |
| 75 Years and over | 6 (10.3%) | 15 (8.7%) |
Technology Access in Laurie
Computing Device Access in Laurie
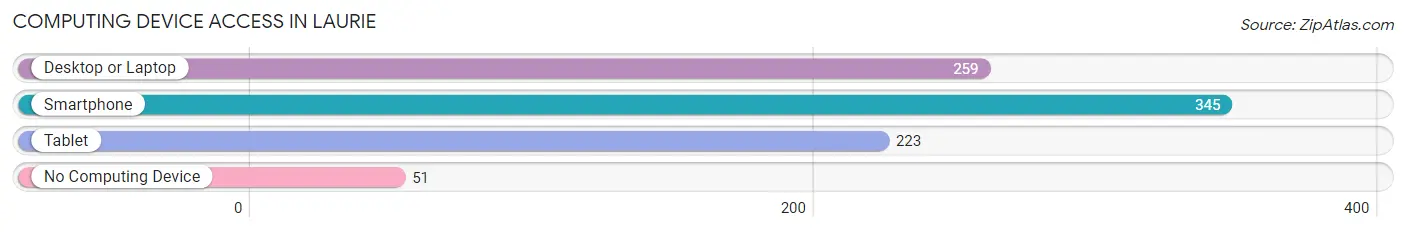
| Device Type | # Households | % Households |
| Desktop or Laptop | 259 | 56.9% |
| Smartphone | 345 | 75.8% |
| Tablet | 223 | 49.0% |
| No Computing Device | 51 | 11.2% |
| Total | 455 | 100.0% |
Internet Access in Laurie
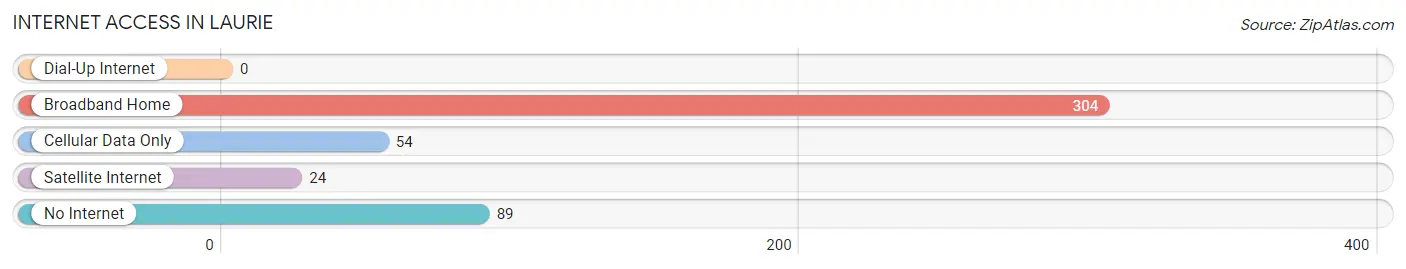
| Internet Type | # Households | % Households |
| Dial-Up Internet | 0 | 0.0% |
| Broadband Home | 304 | 66.8% |
| Cellular Data Only | 54 | 11.9% |
| Satellite Internet | 24 | 5.3% |
| No Internet | 89 | 19.6% |
| Total | 455 | 100.0% |
Laurie Summary
Laurie, Missouri is a small town located in the heart of the Ozarks in the southwestern part of the state. It is situated in Morgan County, approximately 30 miles south of the state capital, Jefferson City. The town was founded in 1883 and has a population of approximately 1,000 people.
Geography
Laurie is located in the Ozark Mountains, which are part of the larger Appalachian Mountains. The town is situated in a valley surrounded by rolling hills and forests. The climate is temperate, with hot summers and cold winters. The average annual temperature is around 60 degrees Fahrenheit. The town is located near the Lake of the Ozarks, which is a popular destination for fishing, boating, and other recreational activities.
Economy
Laurie’s economy is largely based on tourism and agriculture. The town is home to several small businesses, including restaurants, shops, and lodging. The town also has a few manufacturing plants, which produce items such as furniture and clothing. The town is also home to a number of farms, which produce a variety of crops, including corn, soybeans, and hay.
Demographics
As of the 2010 census, the population of Laurie was 1,000 people. The racial makeup of the town was 97.2% White, 0.7% African American, 0.3% Native American, 0.2% Asian, and 1.6% from other races. The median household income was $37,500, and the median age was 44.
Education
Laurie is served by the Morgan County R-II School District. The district operates two elementary schools, one middle school, and one high school. The town also has a public library and a community college.
Conclusion
Laurie, Missouri is a small town located in the Ozarks in the southwestern part of the state. It is situated in Morgan County, approximately 30 miles south of the state capital, Jefferson City. The town was founded in 1883 and has a population of approximately 1,000 people. The economy is largely based on tourism and agriculture, and the town is home to several small businesses, manufacturing plants, and farms. The population is predominantly White, with a median household income of $37,500 and a median age of 44. The town is served by the Morgan County R-II School District, which operates two elementary schools, one middle school, and one high school. The town also has a public library and a community college.
Common Questions
What is the Total Population of Laurie?
Total Population of Laurie is 991.
What is the Total Male Population of Laurie?
Total Male Population of Laurie is 407.
What is the Total Female Population of Laurie?
Total Female Population of Laurie is 584.
What is the Ratio of Males per 100 Females in Laurie?
There are 69.69 Males per 100 Females in Laurie.
What is the Ratio of Females per 100 Males in Laurie?
There are 143.49 Females per 100 Males in Laurie.
What is the Median Population Age in Laurie?
Median Population Age in Laurie is 61.7 Years.
What is the Average Family Size in Laurie
Average Family Size in Laurie is 3.1 People.
What is the Average Household Size in Laurie
Average Household Size in Laurie is 2.0 People.
What is Per Capita Income in Laurie?
Per Capita income in Laurie is $28,479.
What is the Median Family Income in Laurie?
Median Family Income in Laurie is $64,750.
What is the Median Household income in Laurie?
Median Household Income in Laurie is $43,646.
What is Inequality or Gini Index in Laurie?
Inequality or Gini Index in Laurie is 0.39.
How Large is the Labor Force in Laurie?
There are 347 People in the Labor Forcein in Laurie.
What is the Percentage of People in the Labor Force in Laurie?
40.1% of People are in the Labor Force in Laurie.
What is the Unemployment Rate in Laurie?
Unemployment Rate in Laurie is 9.5%.