La Tour, MO
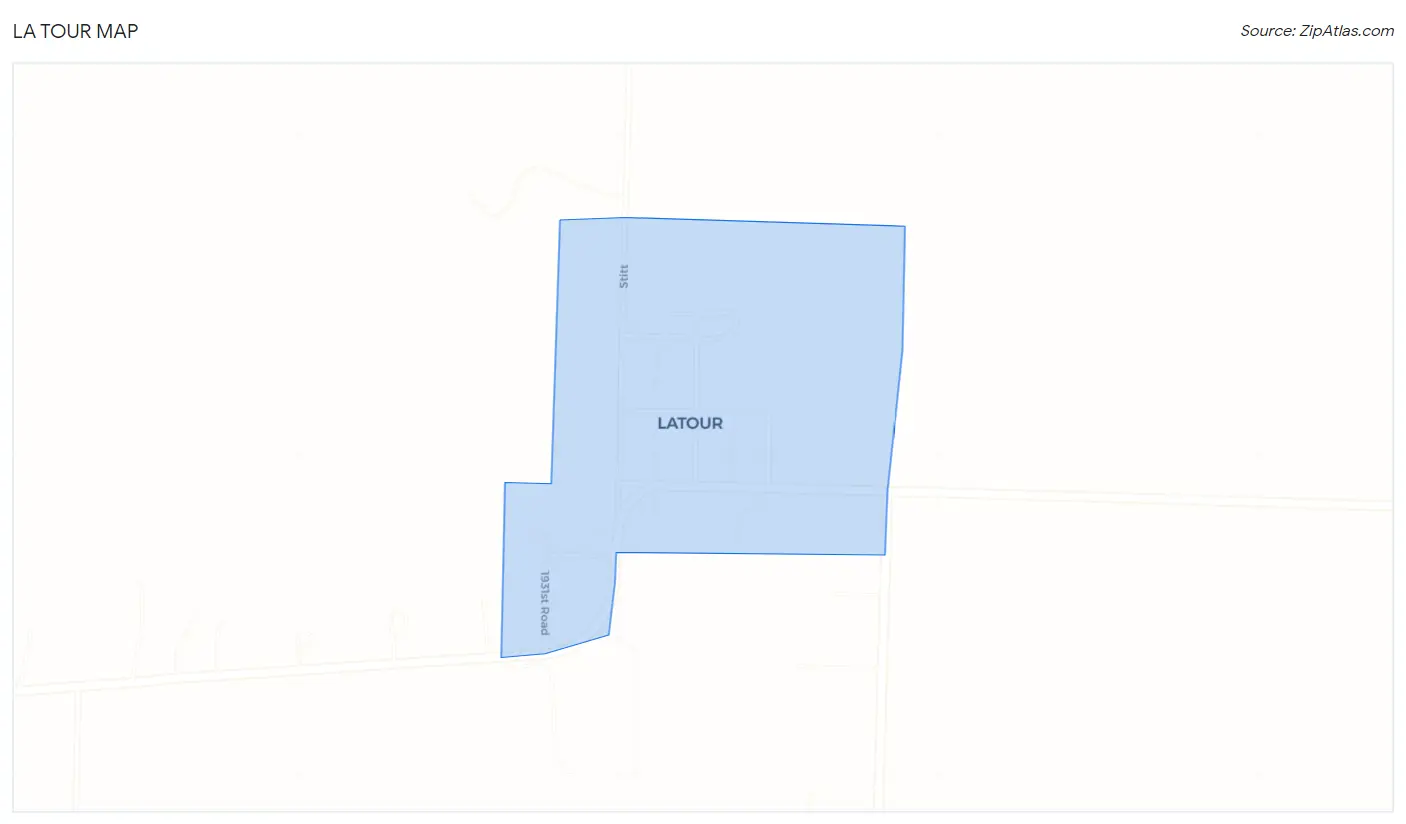
La Tour Map
La Tour Overview
241
TOTAL POPULATION
86
MALE POPULATION
155
FEMALE POPULATION
55.48
MALES / 100 FEMALES
180.23
FEMALES / 100 MALES
27.1
MEDIAN AGE
3.9
AVG FAMILY SIZE
4.4
AVG HOUSEHOLD SIZE
$15,335
PER CAPITA INCOME
$69,402
AVG FAMILY INCOME
$69,402
AVG HOUSEHOLD INCOME
39.8%
WAGE / INCOME GAP [ % ]
60.2¢/ $1
WAGE / INCOME GAP [ $ ]
0.28
INEQUALITY / GINI INDEX
86
LABOR FORCE [ PEOPLE ]
61.0%
PERCENT IN LABOR FORCE
Race in La Tour
The most populous races in La Tour are White / Caucasian (164 | 68.0%), Hispanic or Latino (68 | 28.2%), and Two or more Races (68 | 28.2%).
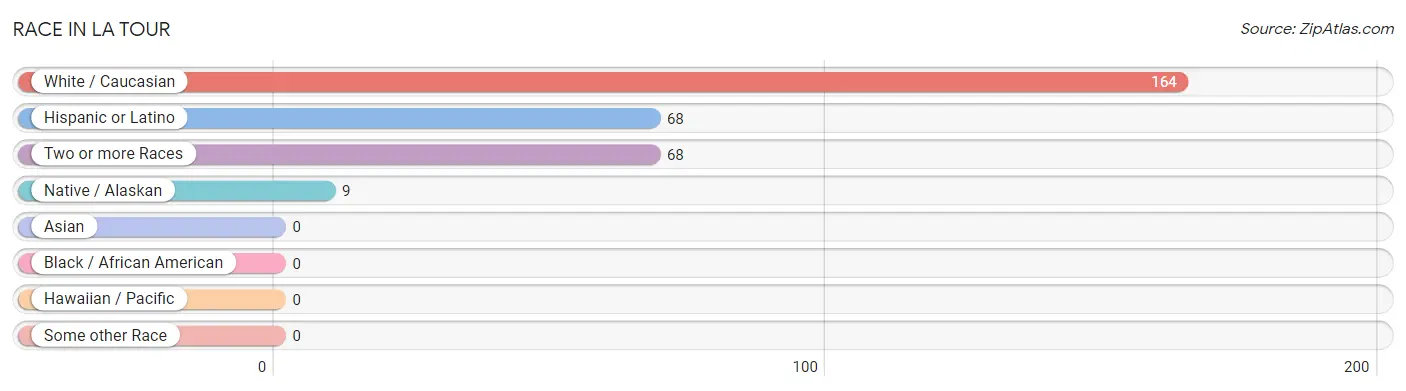
| Race | # Population | % Population |
| Asian | 0 | 0.0% |
| Black / African American | 0 | 0.0% |
| Hawaiian / Pacific | 0 | 0.0% |
| Hispanic or Latino | 68 | 28.2% |
| Native / Alaskan | 9 | 3.7% |
| White / Caucasian | 164 | 68.0% |
| Two or more Races | 68 | 28.2% |
| Some other Race | 0 | 0.0% |
| Total | 241 | 100.0% |
Ancestry in La Tour
The most populous ancestries reported in La Tour are Blackfeet (77 | 32.0%), Mexican (68 | 28.2%), German (33 | 13.7%), Scottish (23 | 9.5%), and American (17 | 7.0%), together accounting for 90.5% of all La Tour residents.
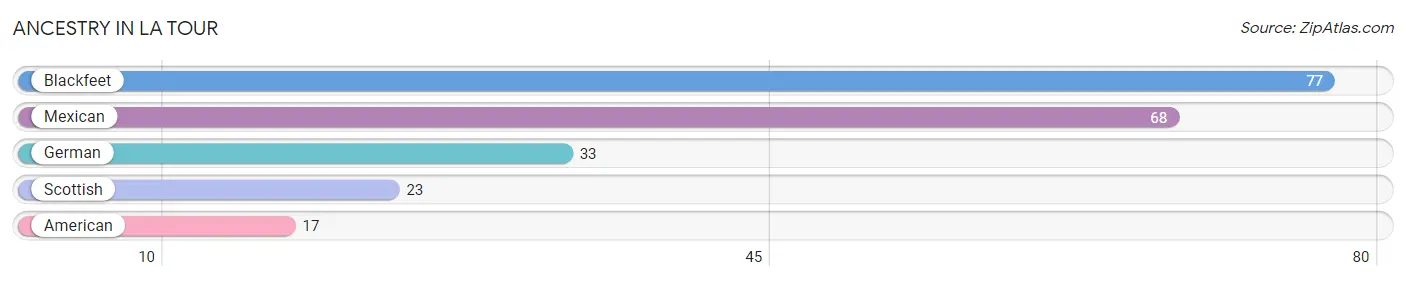
| Ancestry | # Population | % Population |
| American | 17 | 7.0% |
| Blackfeet | 77 | 32.0% |
| German | 33 | 13.7% |
| Mexican | 68 | 28.2% |
| Scottish | 23 | 9.5% | View All 5 Rows |
Immigrants in La Tour

| Immigration Origin | # Population | % Population | View All 0 Rows |
Sex and Age in La Tour
Sex and Age in La Tour
The most populous age groups in La Tour are 60 to 64 Years (17 | 19.8%) for men and 5 to 9 Years (68 | 43.9%) for women.
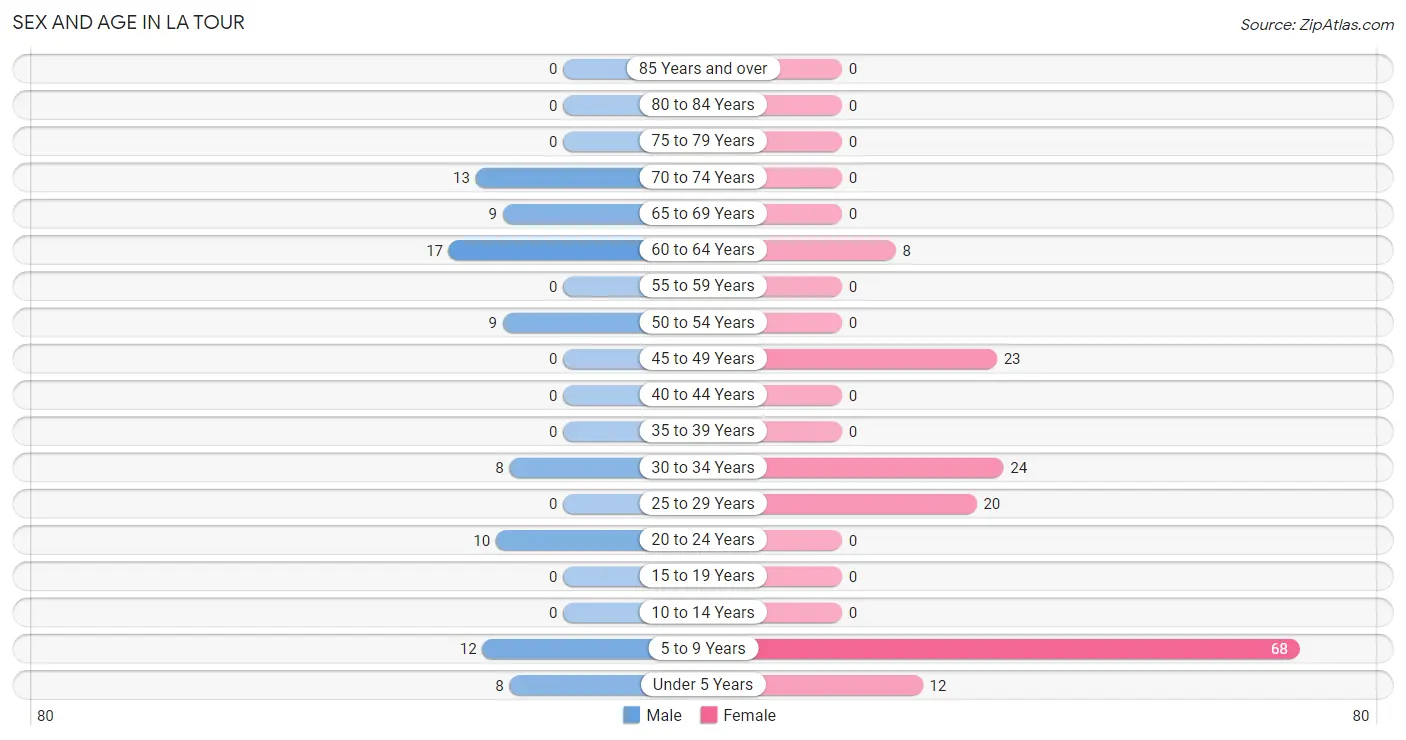
| Age Bracket | Male | Female |
| Under 5 Years | 8 (9.3%) | 12 (7.7%) |
| 5 to 9 Years | 12 (14.0%) | 68 (43.9%) |
| 10 to 14 Years | 0 (0.0%) | 0 (0.0%) |
| 15 to 19 Years | 0 (0.0%) | 0 (0.0%) |
| 20 to 24 Years | 10 (11.6%) | 0 (0.0%) |
| 25 to 29 Years | 0 (0.0%) | 20 (12.9%) |
| 30 to 34 Years | 8 (9.3%) | 24 (15.5%) |
| 35 to 39 Years | 0 (0.0%) | 0 (0.0%) |
| 40 to 44 Years | 0 (0.0%) | 0 (0.0%) |
| 45 to 49 Years | 0 (0.0%) | 23 (14.8%) |
| 50 to 54 Years | 9 (10.5%) | 0 (0.0%) |
| 55 to 59 Years | 0 (0.0%) | 0 (0.0%) |
| 60 to 64 Years | 17 (19.8%) | 8 (5.2%) |
| 65 to 69 Years | 9 (10.5%) | 0 (0.0%) |
| 70 to 74 Years | 13 (15.1%) | 0 (0.0%) |
| 75 to 79 Years | 0 (0.0%) | 0 (0.0%) |
| 80 to 84 Years | 0 (0.0%) | 0 (0.0%) |
| 85 Years and over | 0 (0.0%) | 0 (0.0%) |
| Total | 86 (100.0%) | 155 (100.0%) |
Families and Households in La Tour
Median Family Size in La Tour
The median family size in La Tour is 3.89 persons per family, with single male/father families (13 | 23.6%) accounting for the largest median family size of 4.92 persons per family. On the other hand, single female/mother families (10 | 18.2%) represent the smallest median family size with 1.80 persons per family.
| Family Type | # Families | Family Size |
| Married-Couple | 32 (58.2%) | 4.13 |
| Single Male/Father | 13 (23.6%) | 4.92 |
| Single Female/Mother | 10 (18.2%) | 1.80 |
| Total Families | 55 (100.0%) | 3.89 |
Median Household Size in La Tour
| Household Type | # Households | Household Size |
| Married-Couple | 32 (58.2%) | 4.66 |
| Single Male/Father | 13 (23.6%) | 4.92 |
| Single Female/Mother | 10 (18.2%) | 2.80 |
| Non-family | 0 (0.0%) | - |
| Total Households | 55 (100.0%) | 4.38 |
Household Size by Marriage Status in La Tour
| Household Size | Family Households | Nonfamily Households |
| 1-Person Households | - | 0 (0.0%) |
| 2-Person Households | 9 (16.4%) | 0 (0.0%) |
| 3-Person Households | 10 (18.2%) | 0 (0.0%) |
| 4-Person Households | 0 (0.0%) | 0 (0.0%) |
| 5-Person Households | 0 (0.0%) | 0 (0.0%) |
| 6-Person Households | 36 (65.4%) | 0 (0.0%) |
| 7+ Person Households | 0 (0.0%) | 0 (0.0%) |
| Total | 55 (100.0%) | 0 (0.0%) |
Female Fertility in La Tour
Fertility by Age in La Tour
| Age Bracket | Women with Births | Births / 1,000 Women |
| 15 to 19 years | 0 (0.0%) | 0.0 |
| 20 to 34 years | 0 (0.0%) | 0.0 |
| 35 to 50 years | 0 (0.0%) | 0.0 |
| Total | 0 (0.0%) | 0.0 |
Fertility by Age by Marriage Status in La Tour
| Age Bracket | Married | Unmarried |
| 15 to 19 years | 0 (0.0%) | 0 (0.0%) |
| 20 to 34 years | 0 (0.0%) | 0 (0.0%) |
| 35 to 50 years | 0 (0.0%) | 0 (0.0%) |
| Total | 0 (0.0%) | 0 (0.0%) |
Fertility by Education in La Tour
| Educational Attainment | Women with Births | Births / 1,000 Women |
| Less than High School | 0 (0.0%) | 0.0 |
| High School Diploma | 0 (0.0%) | 0.0 |
| College or Associate's Degree | 0 (0.0%) | 0.0 |
| Bachelor's Degree | 0 (0.0%) | 0.0 |
| Graduate Degree | 0 (0.0%) | 0.0 |
| Total | 0 (0.0%) | 0.0 |
Fertility by Education by Marriage Status in La Tour
| Educational Attainment | Married | Unmarried |
| Less than High School | 0 (0.0%) | 0 (0.0%) |
| High School Diploma | 0 (0.0%) | 0 (0.0%) |
| College or Associate's Degree | 0 (0.0%) | 0 (0.0%) |
| Bachelor's Degree | 0 (0.0%) | 0 (0.0%) |
| Graduate Degree | 0 (0.0%) | 0 (0.0%) |
| Total | 0 (0.0%) | 0 (0.0%) |
Income in La Tour
Income Overview in La Tour
Per Capita Income in La Tour is $15,335, while median incomes of families and households are $69,402 and $69,402 respectively.
| Characteristic | Number | Measure |
| Per Capita Income | 241 | $15,335 |
| Median Family Income | 55 | $69,402 |
| Mean Family Income | 55 | $86,027 |
| Median Household Income | 55 | $69,402 |
| Mean Household Income | 55 | $86,027 |
| Income Deficit | 55 | $0 |
| Wage / Income Gap (%) | 241 | 39.78% |
| Wage / Income Gap ($) | 241 | 60.22¢ per $1 |
| Gini / Inequality Index | 241 | 0.28 |
Earnings by Sex in La Tour
Average Earnings in La Tour are $31,797, $51,111 for men and $30,781 for women, a difference of 39.8%.
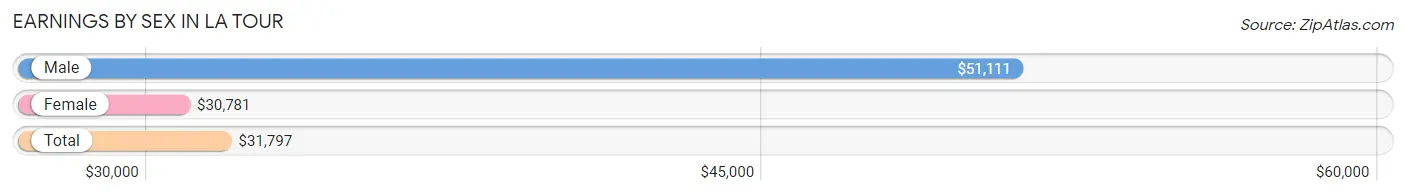
| Sex | Number | Average Earnings |
| Male | 26 (30.2%) | $51,111 |
| Female | 60 (69.8%) | $30,781 |
| Total | 86 (100.0%) | $31,797 |
Earnings by Sex by Income Bracket in La Tour
The most common earnings brackets in La Tour are $50,000 to $54,999 for men (17 | 65.4%) and $30,000 to $34,999 for women (32 | 53.3%).
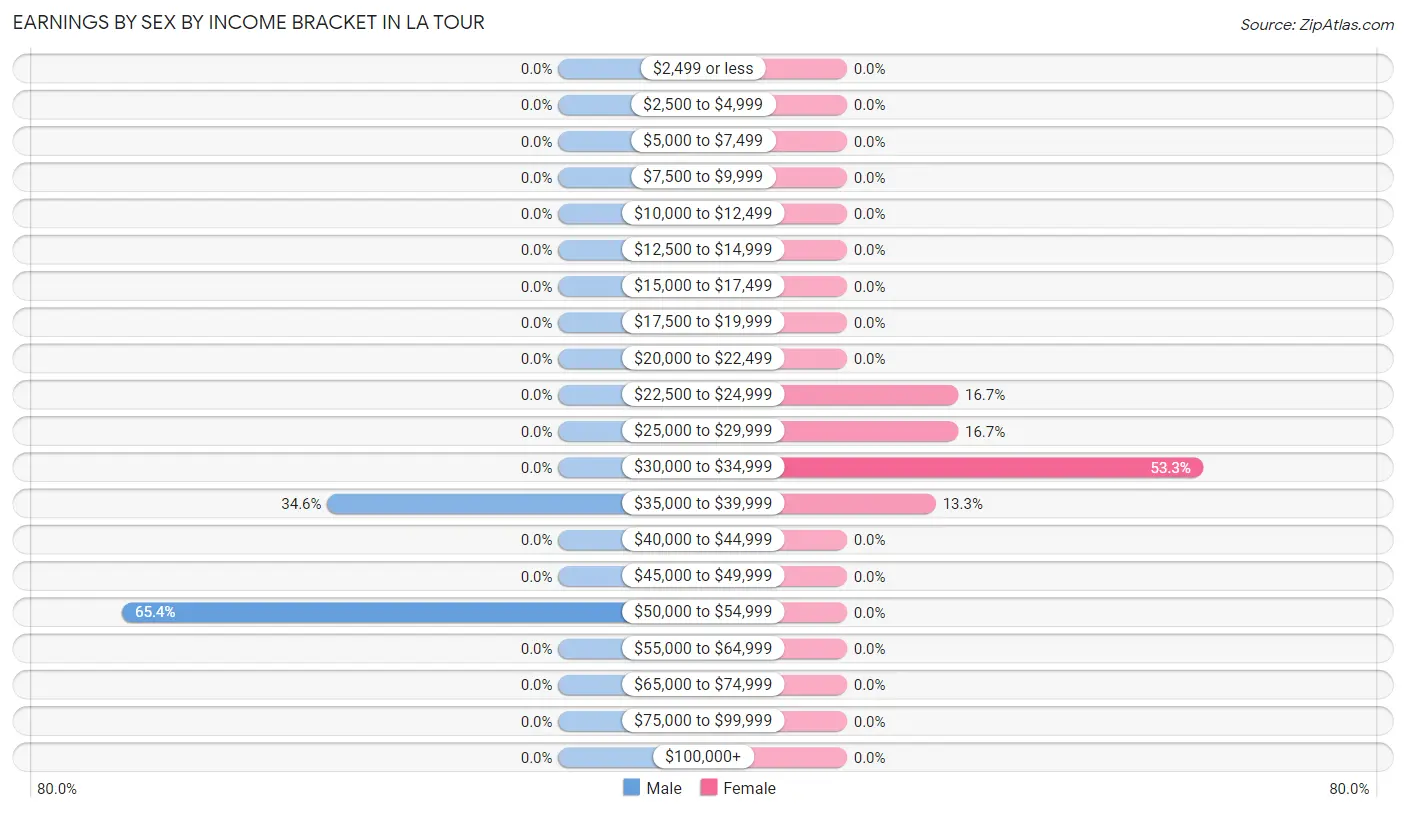
| Income | Male | Female |
| $2,499 or less | 0 (0.0%) | 0 (0.0%) |
| $2,500 to $4,999 | 0 (0.0%) | 0 (0.0%) |
| $5,000 to $7,499 | 0 (0.0%) | 0 (0.0%) |
| $7,500 to $9,999 | 0 (0.0%) | 0 (0.0%) |
| $10,000 to $12,499 | 0 (0.0%) | 0 (0.0%) |
| $12,500 to $14,999 | 0 (0.0%) | 0 (0.0%) |
| $15,000 to $17,499 | 0 (0.0%) | 0 (0.0%) |
| $17,500 to $19,999 | 0 (0.0%) | 0 (0.0%) |
| $20,000 to $22,499 | 0 (0.0%) | 0 (0.0%) |
| $22,500 to $24,999 | 0 (0.0%) | 10 (16.7%) |
| $25,000 to $29,999 | 0 (0.0%) | 10 (16.7%) |
| $30,000 to $34,999 | 0 (0.0%) | 32 (53.3%) |
| $35,000 to $39,999 | 9 (34.6%) | 8 (13.3%) |
| $40,000 to $44,999 | 0 (0.0%) | 0 (0.0%) |
| $45,000 to $49,999 | 0 (0.0%) | 0 (0.0%) |
| $50,000 to $54,999 | 17 (65.4%) | 0 (0.0%) |
| $55,000 to $64,999 | 0 (0.0%) | 0 (0.0%) |
| $65,000 to $74,999 | 0 (0.0%) | 0 (0.0%) |
| $75,000 to $99,999 | 0 (0.0%) | 0 (0.0%) |
| $100,000+ | 0 (0.0%) | 0 (0.0%) |
| Total | 26 (100.0%) | 60 (100.0%) |
Earnings by Sex by Educational Attainment in La Tour
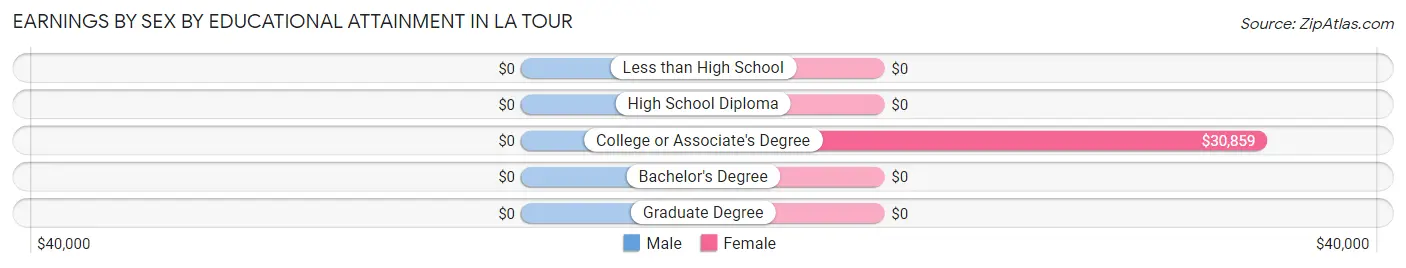
| Educational Attainment | Male Income | Female Income |
| Less than High School | - | - |
| High School Diploma | - | - |
| College or Associate's Degree | - | - |
| Bachelor's Degree | - | - |
| Graduate Degree | - | - |
| Total | $51,111 | $30,781 |
Family Income in La Tour
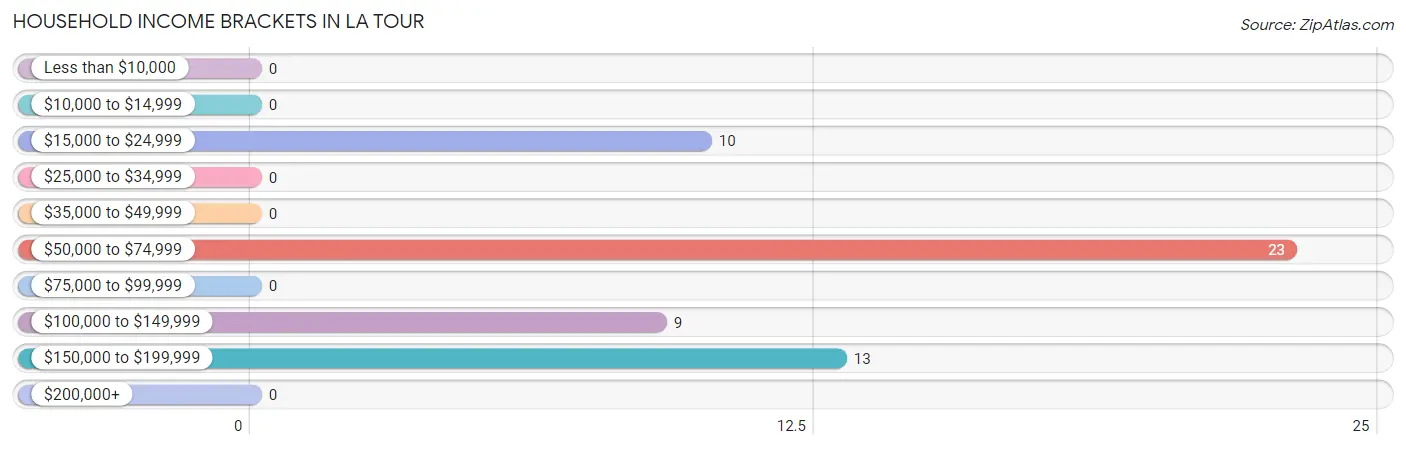
Family Income Brackets in La Tour
According to the La Tour family income data, there are 23 families falling into the $50,000 to $74,999 income range, which is the most common income bracket and makes up 41.8% of all families.
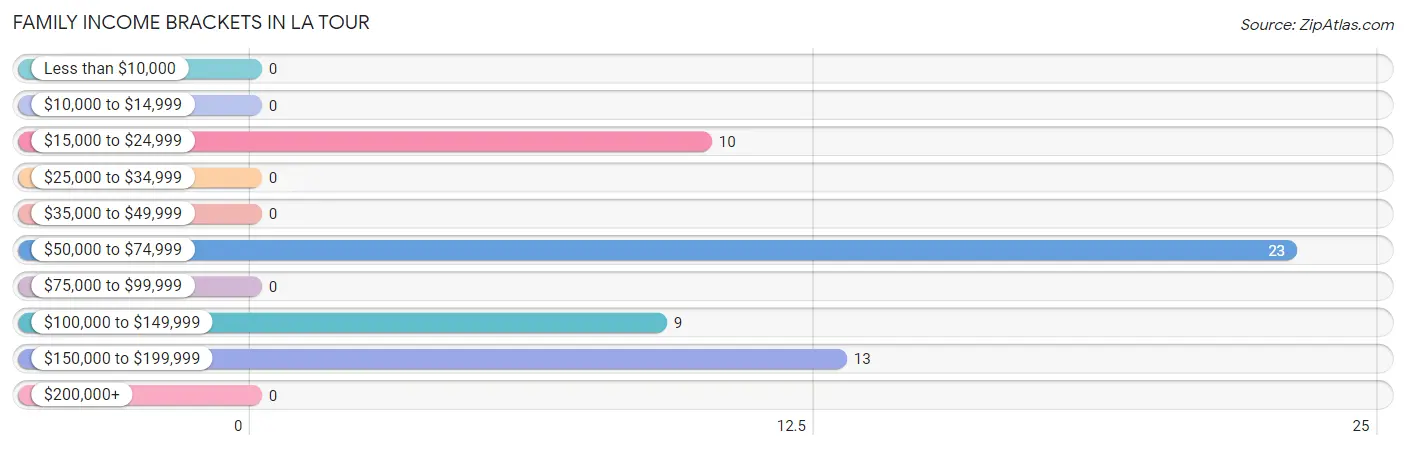
| Income Bracket | # Families | % Families |
| Less than $10,000 | 0 | 0.0% |
| $10,000 to $14,999 | 0 | 0.0% |
| $15,000 to $24,999 | 10 | 18.2% |
| $25,000 to $34,999 | 0 | 0.0% |
| $35,000 to $49,999 | 0 | 0.0% |
| $50,000 to $74,999 | 23 | 41.8% |
| $75,000 to $99,999 | 0 | 0.0% |
| $100,000 to $149,999 | 9 | 16.4% |
| $150,000 to $199,999 | 13 | 23.6% |
| $200,000+ | 0 | 0.0% |
Family Income by Famaliy Size in La Tour
| Income Bracket | # Families | Median Income |
| 2-Person Families | 19 (34.5%) | $0 |
| 3-Person Families | 0 (0.0%) | $0 |
| 4-Person Families | 0 (0.0%) | $0 |
| 5-Person Families | 23 (41.8%) | $0 |
| 6-Person Families | 13 (23.6%) | $0 |
| 7+ Person Families | 0 (0.0%) | $0 |
| Total | 55 (100.0%) | $69,402 |
Family Income by Number of Earners in La Tour
| Number of Earners | # Families | Median Income |
| No Earners | 0 (0.0%) | $0 |
| 1 Earner | 10 (18.2%) | $0 |
| 2 Earners | 32 (58.2%) | $0 |
| 3+ Earners | 13 (23.6%) | $0 |
| Total | 55 (100.0%) | $69,402 |
Household Income in La Tour
Household Income Brackets in La Tour
With 23 households falling in the category, the $50,000 to $74,999 income range is the most frequent in La Tour, accounting for 41.8% of all households.
| Income Bracket | # Households | % Households |
| Less than $10,000 | 0 | 0.0% |
| $10,000 to $14,999 | 0 | 0.0% |
| $15,000 to $24,999 | 10 | 18.2% |
| $25,000 to $34,999 | 0 | 0.0% |
| $35,000 to $49,999 | 0 | 0.0% |
| $50,000 to $74,999 | 23 | 41.8% |
| $75,000 to $99,999 | 0 | 0.0% |
| $100,000 to $149,999 | 9 | 16.4% |
| $150,000 to $199,999 | 13 | 23.6% |
| $200,000+ | 0 | 0.0% |
Household Income by Householder Age in La Tour
| Income Bracket | # Households | Median Income |
| 15 to 24 Years | 0 (0.0%) | $0 |
| 25 to 44 Years | 10 (18.2%) | $0 |
| 45 to 64 Years | 23 (41.8%) | $0 |
| 65+ Years | 22 (40.0%) | $0 |
| Total | 55 (100.0%) | $69,402 |
Poverty in La Tour
Income Below Poverty by Sex and Age in La Tour
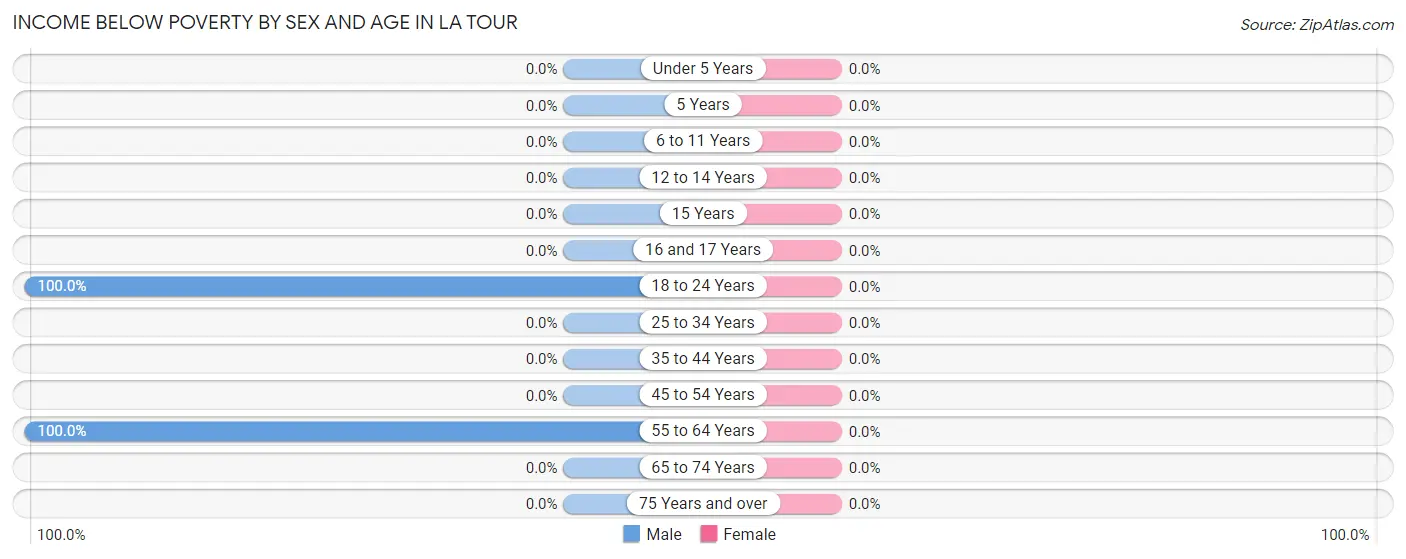
| Age Bracket | Male | Female |
| Under 5 Years | 0 (0.0%) | 0 (0.0%) |
| 5 Years | 0 (0.0%) | 0 (0.0%) |
| 6 to 11 Years | 0 (0.0%) | 0 (0.0%) |
| 12 to 14 Years | 0 (0.0%) | 0 (0.0%) |
| 15 Years | 0 (0.0%) | 0 (0.0%) |
| 16 and 17 Years | 0 (0.0%) | 0 (0.0%) |
| 18 to 24 Years | 10 (100.0%) | 0 (0.0%) |
| 25 to 34 Years | 0 (0.0%) | 0 (0.0%) |
| 35 to 44 Years | 0 (0.0%) | 0 (0.0%) |
| 45 to 54 Years | 0 (0.0%) | 0 (0.0%) |
| 55 to 64 Years | 17 (100.0%) | 0 (0.0%) |
| 65 to 74 Years | 0 (0.0%) | 0 (0.0%) |
| 75 Years and over | 0 (0.0%) | 0 (0.0%) |
| Total | 27 (31.4%) | 0 (0.0%) |
Income Above Poverty by Sex and Age in La Tour
According to the poverty statistics in La Tour, males aged under 5 years and females aged under 5 years are the age groups that are most secure financially, with 100.0% of males and 100.0% of females in these age groups living above the poverty line.
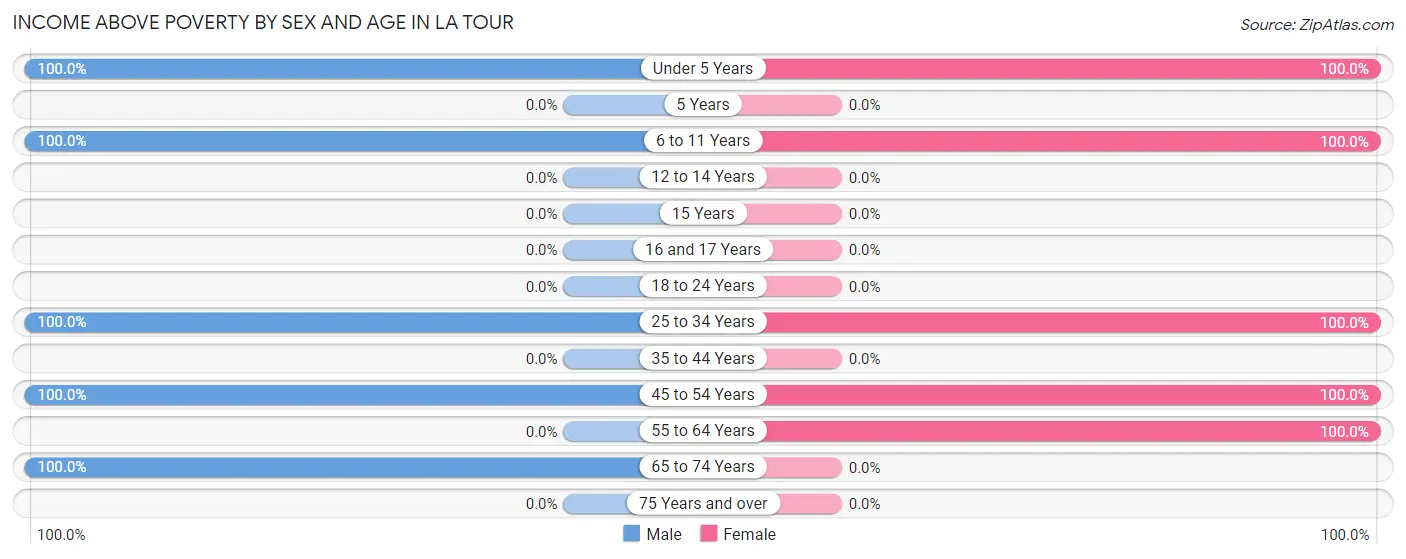
| Age Bracket | Male | Female |
| Under 5 Years | 8 (100.0%) | 12 (100.0%) |
| 5 Years | 0 (0.0%) | 0 (0.0%) |
| 6 to 11 Years | 12 (100.0%) | 68 (100.0%) |
| 12 to 14 Years | 0 (0.0%) | 0 (0.0%) |
| 15 Years | 0 (0.0%) | 0 (0.0%) |
| 16 and 17 Years | 0 (0.0%) | 0 (0.0%) |
| 18 to 24 Years | 0 (0.0%) | 0 (0.0%) |
| 25 to 34 Years | 8 (100.0%) | 44 (100.0%) |
| 35 to 44 Years | 0 (0.0%) | 0 (0.0%) |
| 45 to 54 Years | 9 (100.0%) | 23 (100.0%) |
| 55 to 64 Years | 0 (0.0%) | 8 (100.0%) |
| 65 to 74 Years | 22 (100.0%) | 0 (0.0%) |
| 75 Years and over | 0 (0.0%) | 0 (0.0%) |
| Total | 59 (68.6%) | 155 (100.0%) |
Income Below Poverty Among Married-Couple Families in La Tour
| Children | Above Poverty | Below Poverty |
| No Children | 9 (100.0%) | 0 (0.0%) |
| 1 or 2 Children | 23 (100.0%) | 0 (0.0%) |
| 3 or 4 Children | 0 (0.0%) | 0 (0.0%) |
| 5 or more Children | 0 (0.0%) | 0 (0.0%) |
| Total | 32 (100.0%) | 0 (0.0%) |
Income Below Poverty Among Single-Parent Households in La Tour
| Children | Single Father | Single Mother |
| No Children | 0 (0.0%) | 0 (0.0%) |
| 1 or 2 Children | 0 (0.0%) | 0 (0.0%) |
| 3 or 4 Children | 0 (0.0%) | 0 (0.0%) |
| 5 or more Children | 0 (0.0%) | 0 (0.0%) |
| Total | 0 (0.0%) | 0 (0.0%) |
Income Below Poverty Among Married-Couple vs Single-Parent Households in La Tour
| Children | Married-Couple Families | Single-Parent Households |
| No Children | 0 (0.0%) | 0 (0.0%) |
| 1 or 2 Children | 0 (0.0%) | 0 (0.0%) |
| 3 or 4 Children | 0 (0.0%) | 0 (0.0%) |
| 5 or more Children | 0 (0.0%) | 0 (0.0%) |
| Total | 0 (0.0%) | 0 (0.0%) |
Employment Characteristics in La Tour
Employment by Class of Employer in La Tour
Among the 86 employed individuals in La Tour, private company employees (76 | 88.4%), and state government employees (10 | 11.6%) make up the most common classes of employment.
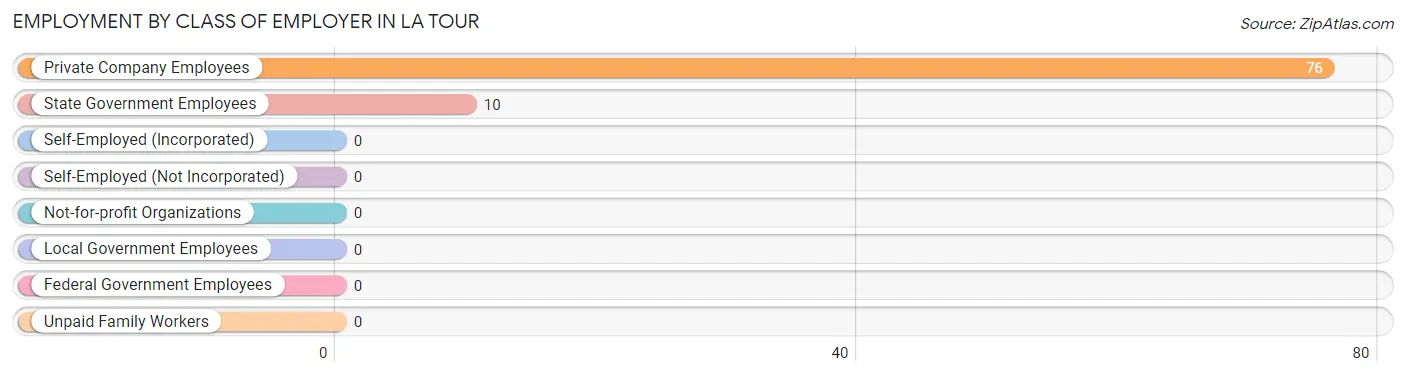
| Employer Class | # Employees | % Employees |
| Private Company Employees | 76 | 88.4% |
| Self-Employed (Incorporated) | 0 | 0.0% |
| Self-Employed (Not Incorporated) | 0 | 0.0% |
| Not-for-profit Organizations | 0 | 0.0% |
| Local Government Employees | 0 | 0.0% |
| State Government Employees | 10 | 11.6% |
| Federal Government Employees | 0 | 0.0% |
| Unpaid Family Workers | 0 | 0.0% |
| Total | 86 | 100.0% |
Employment Status by Age in La Tour
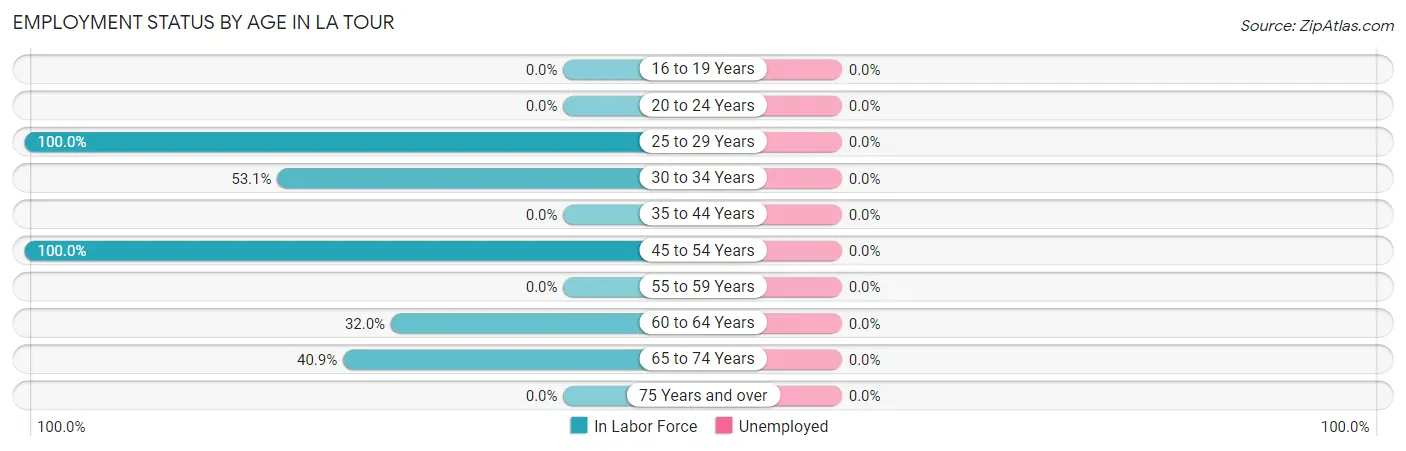
| Age Bracket | In Labor Force | Unemployed |
| 16 to 19 Years | 0 (0.0%) | 0 (0.0%) |
| 20 to 24 Years | 0 (0.0%) | 0 (0.0%) |
| 25 to 29 Years | 20 (100.0%) | 0 (0.0%) |
| 30 to 34 Years | 17 (53.1%) | 0 (0.0%) |
| 35 to 44 Years | 0 (0.0%) | 0 (0.0%) |
| 45 to 54 Years | 32 (100.0%) | 0 (0.0%) |
| 55 to 59 Years | 0 (0.0%) | 0 (0.0%) |
| 60 to 64 Years | 8 (32.0%) | 0 (0.0%) |
| 65 to 74 Years | 9 (40.9%) | 0 (0.0%) |
| 75 Years and over | 0 (0.0%) | 0 (0.0%) |
| Total | 86 (61.0%) | 0 (0.0%) |
Employment Status by Educational Attainment in La Tour
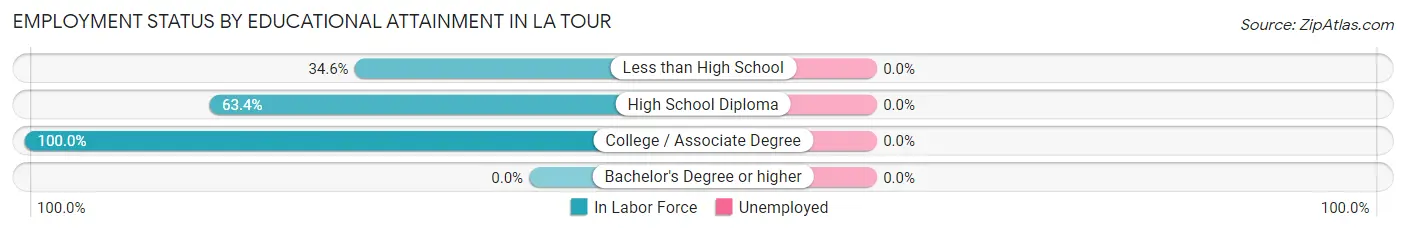
| Educational Attainment | In Labor Force | Unemployed |
| Less than High School | 9 (34.6%) | 0 (0.0%) |
| High School Diploma | 26 (63.4%) | 0 (0.0%) |
| College / Associate Degree | 42 (100.0%) | 0 (0.0%) |
| Bachelor's Degree or higher | 0 (0.0%) | 0 (0.0%) |
| Total | 77 (70.6%) | 0 (0.0%) |
Employment Occupations by Sex in La Tour
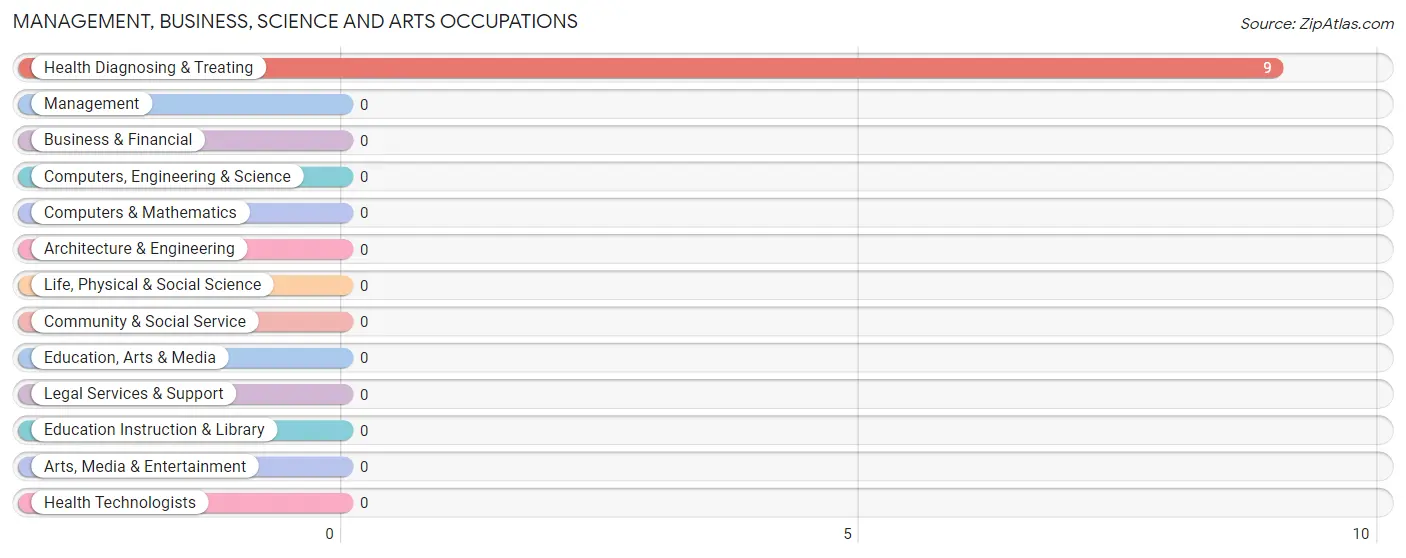
Management, Business, Science and Arts Occupations
The most common Management, Business, Science and Arts occupations in La Tour are , and Health Diagnosing & Treating (9 | 10.5%).
Management, Business, Science and Arts Occupations by Sex
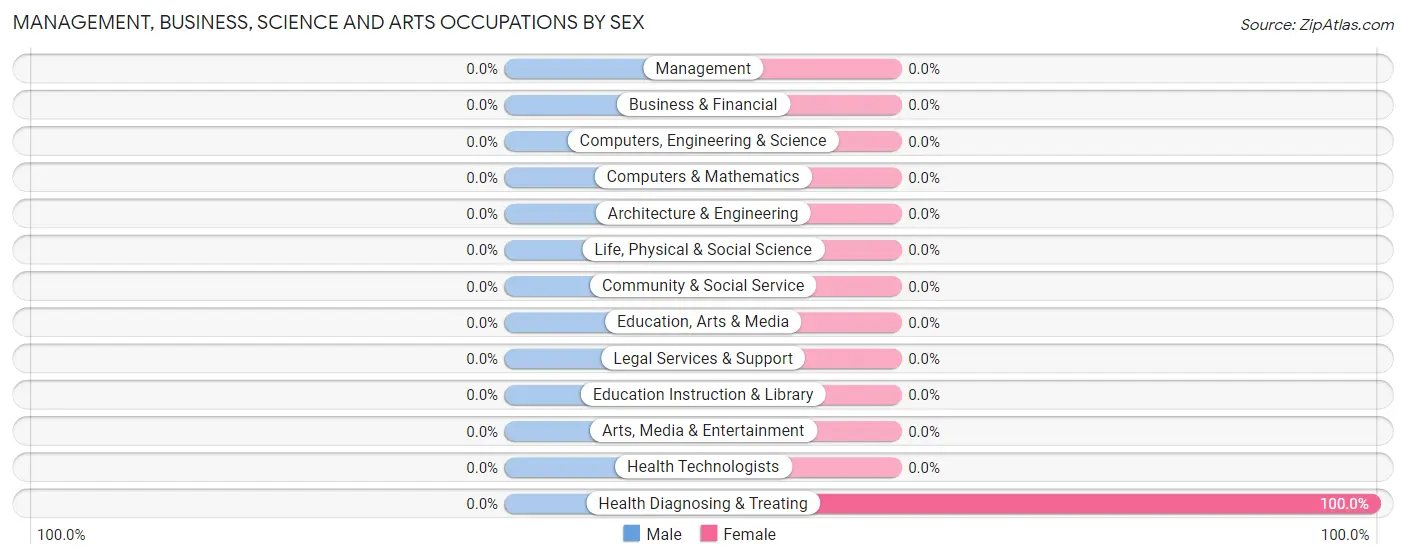
| Occupation | Male | Female |
| Management | 0 (0.0%) | 0 (0.0%) |
| Business & Financial | 0 (0.0%) | 0 (0.0%) |
| Computers, Engineering & Science | 0 (0.0%) | 0 (0.0%) |
| Computers & Mathematics | 0 (0.0%) | 0 (0.0%) |
| Architecture & Engineering | 0 (0.0%) | 0 (0.0%) |
| Life, Physical & Social Science | 0 (0.0%) | 0 (0.0%) |
| Community & Social Service | 0 (0.0%) | 0 (0.0%) |
| Education, Arts & Media | 0 (0.0%) | 0 (0.0%) |
| Legal Services & Support | 0 (0.0%) | 0 (0.0%) |
| Education Instruction & Library | 0 (0.0%) | 0 (0.0%) |
| Arts, Media & Entertainment | 0 (0.0%) | 0 (0.0%) |
| Health Diagnosing & Treating | 0 (0.0%) | 9 (100.0%) |
| Health Technologists | 0 (0.0%) | 0 (0.0%) |
| Total (Category) | 0 (0.0%) | 9 (100.0%) |
| Total (Overall) | 26 (30.2%) | 60 (69.8%) |
Services Occupations
The most common Services occupations in La Tour are , and Healthcare Support (10 | 11.6%).
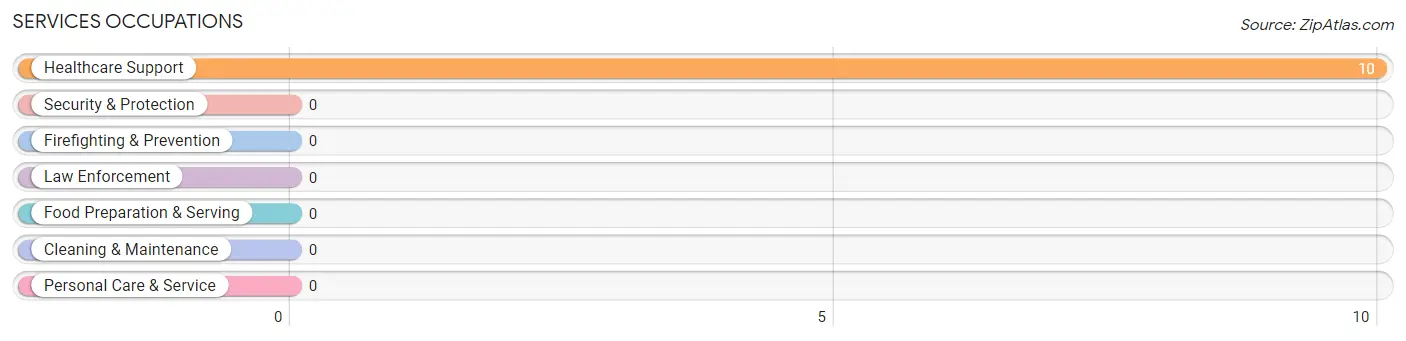
Services Occupations by Sex
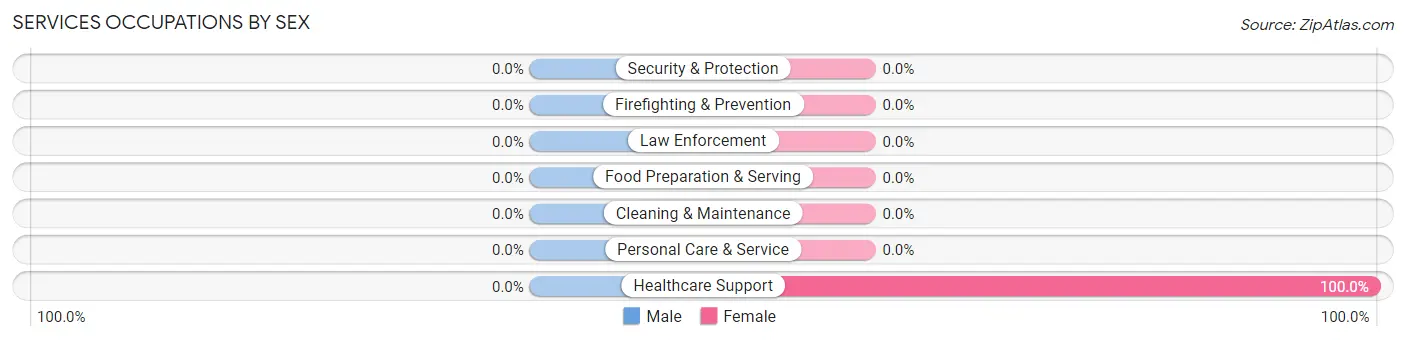
| Occupation | Male | Female |
| Healthcare Support | 0 (0.0%) | 10 (100.0%) |
| Security & Protection | 0 (0.0%) | 0 (0.0%) |
| Firefighting & Prevention | 0 (0.0%) | 0 (0.0%) |
| Law Enforcement | 0 (0.0%) | 0 (0.0%) |
| Food Preparation & Serving | 0 (0.0%) | 0 (0.0%) |
| Cleaning & Maintenance | 0 (0.0%) | 0 (0.0%) |
| Personal Care & Service | 0 (0.0%) | 0 (0.0%) |
| Total (Category) | 0 (0.0%) | 10 (100.0%) |
| Total (Overall) | 26 (30.2%) | 60 (69.8%) |
Sales and Office Occupations
The most common Sales and Office occupations in La Tour are , and Office & Administration (41 | 47.7%).
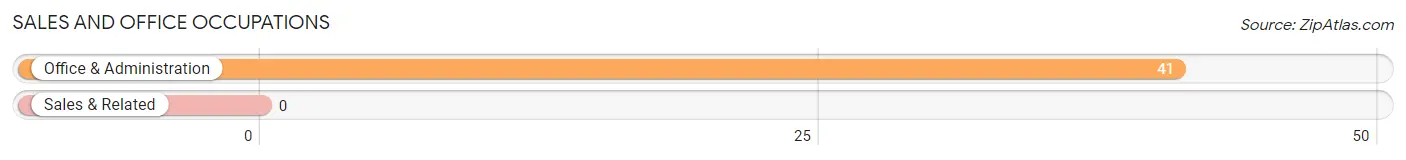
Sales and Office Occupations by Sex
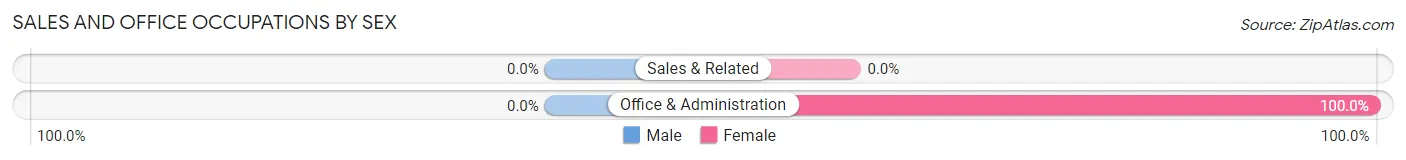
| Occupation | Male | Female |
| Sales & Related | 0 (0.0%) | 0 (0.0%) |
| Office & Administration | 0 (0.0%) | 41 (100.0%) |
| Total (Category) | 0 (0.0%) | 41 (100.0%) |
| Total (Overall) | 26 (30.2%) | 60 (69.8%) |
Natural Resources, Construction and Maintenance Occupations
The most common Natural Resources, Construction and Maintenance occupations in La Tour are , and Construction & Extraction (8 | 9.3%).
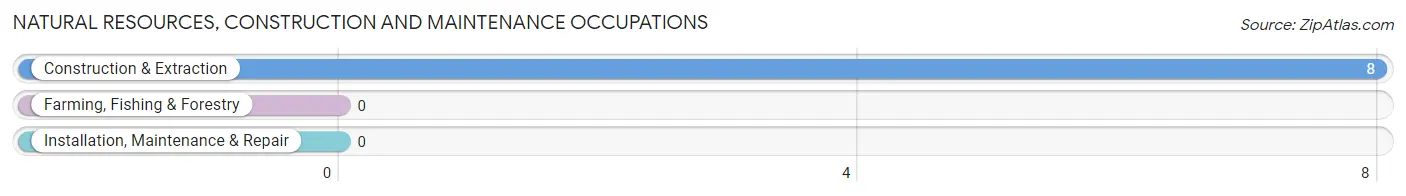
Natural Resources, Construction and Maintenance Occupations by Sex
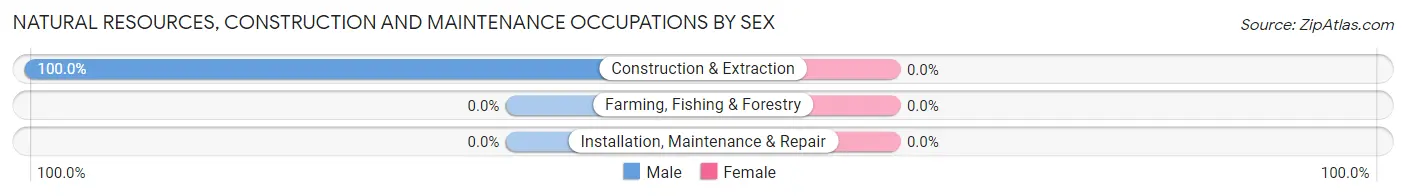
| Occupation | Male | Female |
| Farming, Fishing & Forestry | 0 (0.0%) | 0 (0.0%) |
| Construction & Extraction | 8 (100.0%) | 0 (0.0%) |
| Installation, Maintenance & Repair | 0 (0.0%) | 0 (0.0%) |
| Total (Category) | 8 (100.0%) | 0 (0.0%) |
| Total (Overall) | 26 (30.2%) | 60 (69.8%) |
Production, Transportation and Moving Occupations
The most common Production, Transportation and Moving occupations in La Tour are Production (9 | 10.5%), and Transportation (9 | 10.5%).
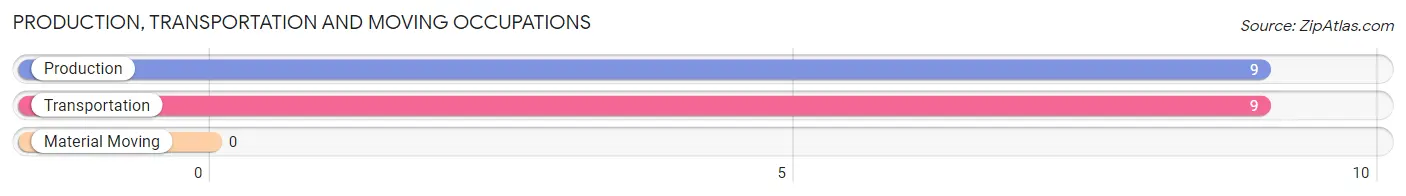
Production, Transportation and Moving Occupations by Sex
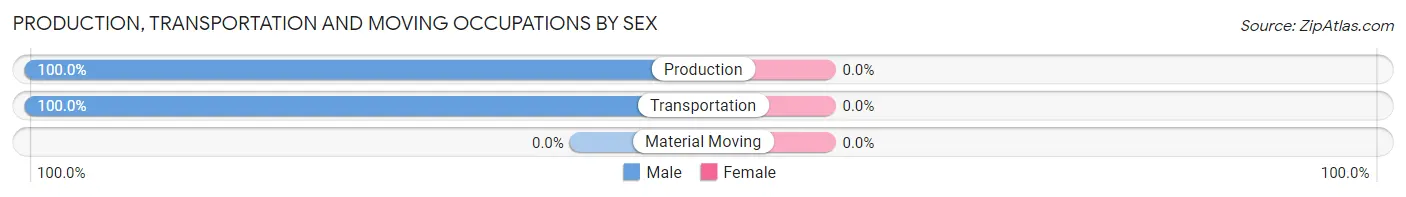
| Occupation | Male | Female |
| Production | 9 (100.0%) | 0 (0.0%) |
| Transportation | 9 (100.0%) | 0 (0.0%) |
| Material Moving | 0 (0.0%) | 0 (0.0%) |
| Total (Category) | 18 (100.0%) | 0 (0.0%) |
| Total (Overall) | 26 (30.2%) | 60 (69.8%) |
Employment Industries by Sex in La Tour
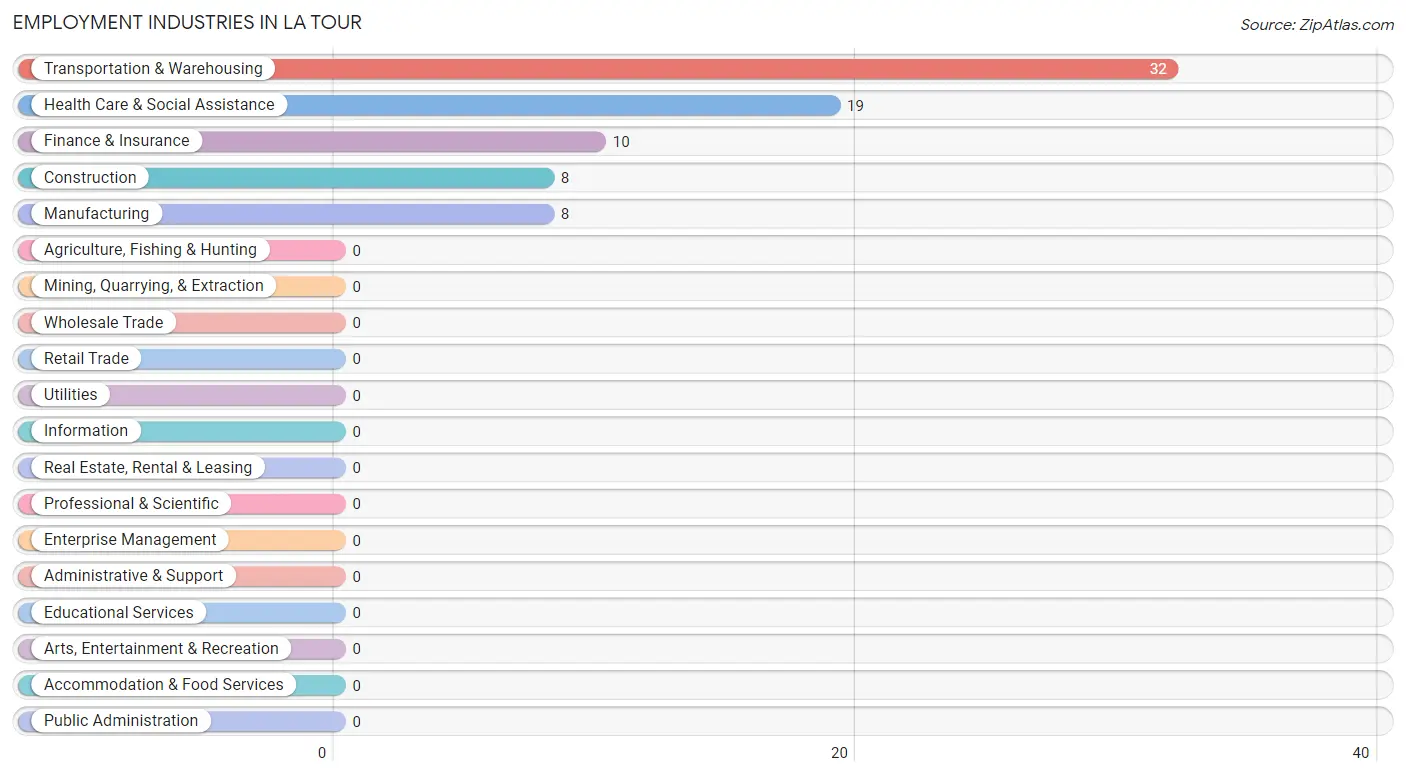
Employment Industries in La Tour
The major employment industries in La Tour include Transportation & Warehousing (32 | 37.2%), Health Care & Social Assistance (19 | 22.1%), Finance & Insurance (10 | 11.6%), Construction (8 | 9.3%), and Manufacturing (8 | 9.3%).
Employment Industries by Sex in La Tour
The La Tour industries that see more men than women are Construction (100.0%), and Transportation & Warehousing (28.1%), whereas the industries that tend to have a higher number of women are Manufacturing (100.0%), Finance & Insurance (100.0%), and Health Care & Social Assistance (100.0%).
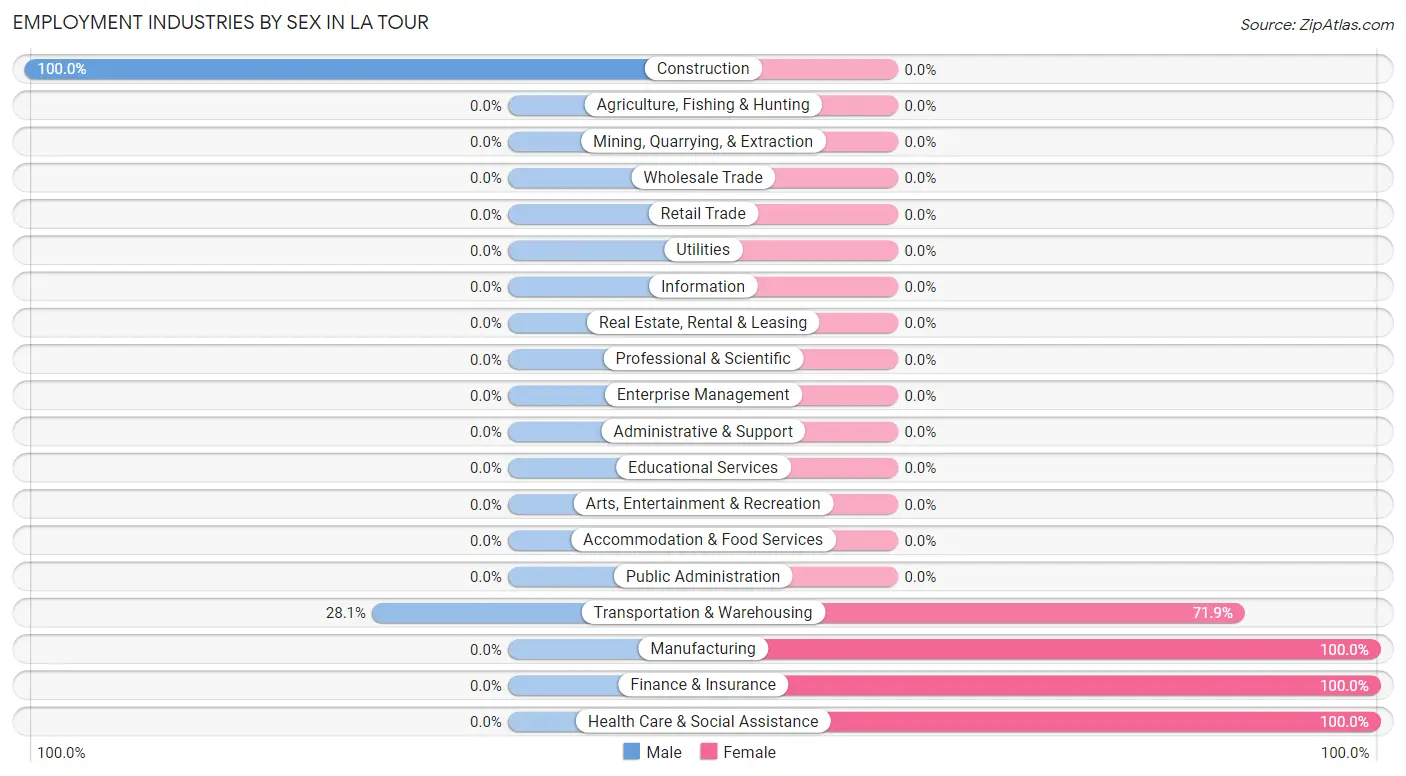
| Industry | Male | Female |
| Agriculture, Fishing & Hunting | 0 (0.0%) | 0 (0.0%) |
| Mining, Quarrying, & Extraction | 0 (0.0%) | 0 (0.0%) |
| Construction | 8 (100.0%) | 0 (0.0%) |
| Manufacturing | 0 (0.0%) | 8 (100.0%) |
| Wholesale Trade | 0 (0.0%) | 0 (0.0%) |
| Retail Trade | 0 (0.0%) | 0 (0.0%) |
| Transportation & Warehousing | 9 (28.1%) | 23 (71.9%) |
| Utilities | 0 (0.0%) | 0 (0.0%) |
| Information | 0 (0.0%) | 0 (0.0%) |
| Finance & Insurance | 0 (0.0%) | 10 (100.0%) |
| Real Estate, Rental & Leasing | 0 (0.0%) | 0 (0.0%) |
| Professional & Scientific | 0 (0.0%) | 0 (0.0%) |
| Enterprise Management | 0 (0.0%) | 0 (0.0%) |
| Administrative & Support | 0 (0.0%) | 0 (0.0%) |
| Educational Services | 0 (0.0%) | 0 (0.0%) |
| Health Care & Social Assistance | 0 (0.0%) | 19 (100.0%) |
| Arts, Entertainment & Recreation | 0 (0.0%) | 0 (0.0%) |
| Accommodation & Food Services | 0 (0.0%) | 0 (0.0%) |
| Public Administration | 0 (0.0%) | 0 (0.0%) |
| Total | 26 (30.2%) | 60 (69.8%) |
Education in La Tour
School Enrollment in La Tour
The most common levels of schooling among the 101 students in La Tour are elementary school (80 | 79.2%), nursery / preschool (12 | 11.9%), and college / undergraduate (9 | 8.9%).
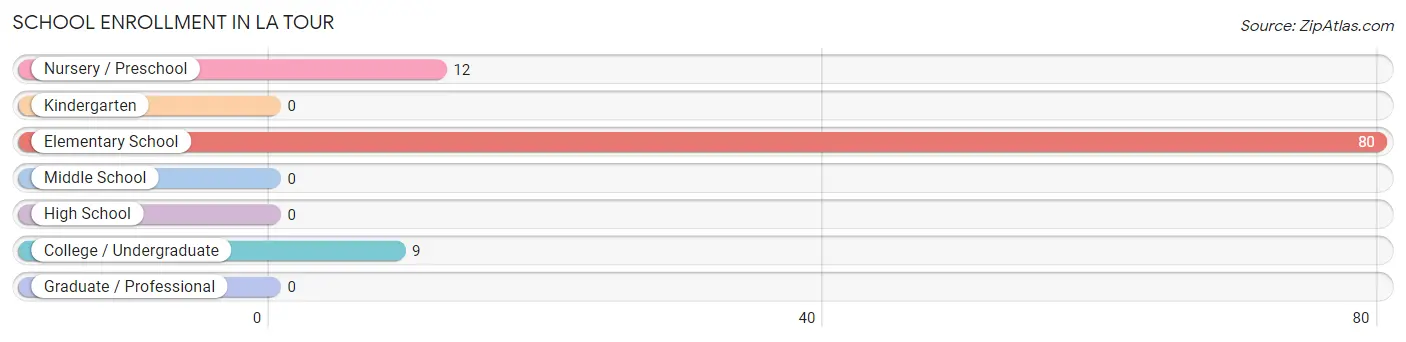
| School Level | # Students | % Students |
| Nursery / Preschool | 12 | 11.9% |
| Kindergarten | 0 | 0.0% |
| Elementary School | 80 | 79.2% |
| Middle School | 0 | 0.0% |
| High School | 0 | 0.0% |
| College / Undergraduate | 9 | 8.9% |
| Graduate / Professional | 0 | 0.0% |
| Total | 101 | 100.0% |
School Enrollment by Age by Funding Source in La Tour
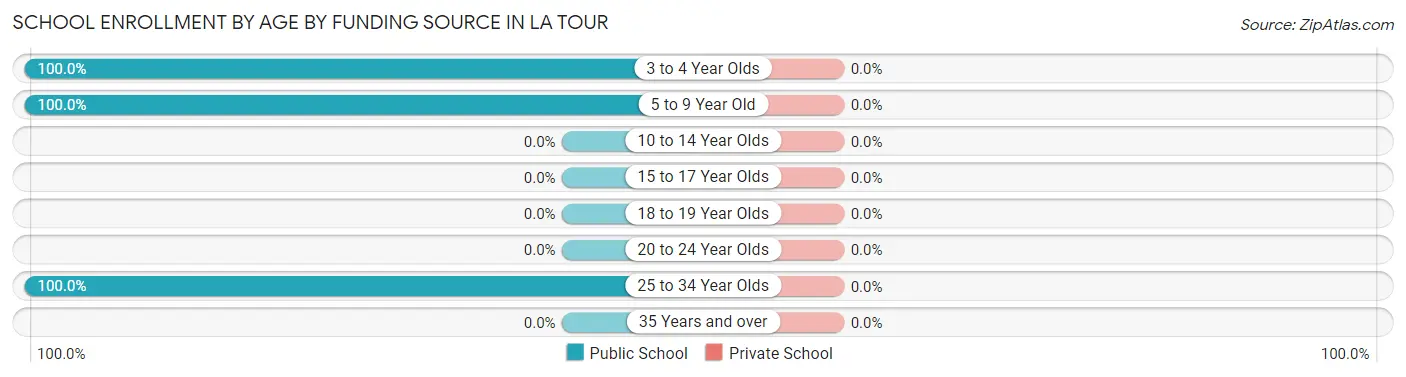
| Age Bracket | Public School | Private School |
| 3 to 4 Year Olds | 12 (100.0%) | 0 (0.0%) |
| 5 to 9 Year Old | 80 (100.0%) | 0 (0.0%) |
| 10 to 14 Year Olds | 0 (0.0%) | 0 (0.0%) |
| 15 to 17 Year Olds | 0 (0.0%) | 0 (0.0%) |
| 18 to 19 Year Olds | 0 (0.0%) | 0 (0.0%) |
| 20 to 24 Year Olds | 0 (0.0%) | 0 (0.0%) |
| 25 to 34 Year Olds | 9 (100.0%) | 0 (0.0%) |
| 35 Years and over | 0 (0.0%) | 0 (0.0%) |
| Total | 101 (100.0%) | 0 (0.0%) |
Educational Attainment by Field of Study in La Tour
| Field of Study | # Graduates | % Graduates |
| Computers & Mathematics | 0 | 0.0% |
| Bio, Nature & Agricultural | 0 | 0.0% |
| Physical & Health Sciences | 0 | 0.0% |
| Psychology | 0 | 0.0% |
| Social Sciences | 0 | 0.0% |
| Engineering | 0 | 0.0% |
| Multidisciplinary Studies | 0 | 0.0% |
| Science & Technology | 0 | 0.0% |
| Business | 0 | 0.0% |
| Education | 0 | 0.0% |
| Literature & Languages | 0 | 0.0% |
| Liberal Arts & History | 0 | 0.0% |
| Visual & Performing Arts | 0 | 0.0% |
| Communications | 0 | 0.0% |
| Arts & Humanities | 0 | 0.0% |
| Total | 0 | 0.0% |
Transportation & Commute in La Tour
Vehicle Availability by Sex in La Tour
The most prevalent vehicle ownership categories in La Tour are males with 2 vehicles (9, accounting for 34.6%) and females with 2 vehicles (18, making up 15.0%).
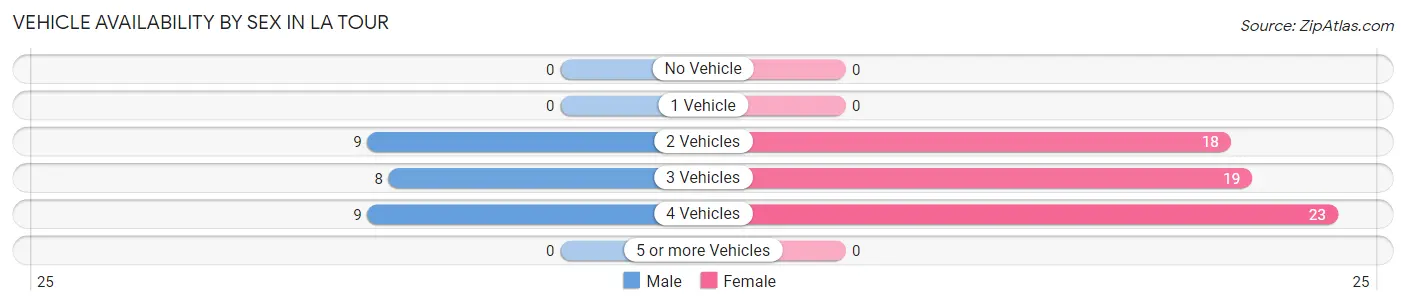
| Vehicles Available | Male | Female |
| No Vehicle | 0 (0.0%) | 0 (0.0%) |
| 1 Vehicle | 0 (0.0%) | 0 (0.0%) |
| 2 Vehicles | 9 (34.6%) | 18 (30.0%) |
| 3 Vehicles | 8 (30.8%) | 19 (31.7%) |
| 4 Vehicles | 9 (34.6%) | 23 (38.3%) |
| 5 or more Vehicles | 0 (0.0%) | 0 (0.0%) |
| Total | 26 (100.0%) | 60 (100.0%) |
Commute Time in La Tour
The most frequently occuring commute durations in La Tour are 60 to 89 minutes (41 commuters, 47.7%), 45 to 59 minutes (18 commuters, 20.9%), and 15 to 19 minutes (17 commuters, 19.8%).
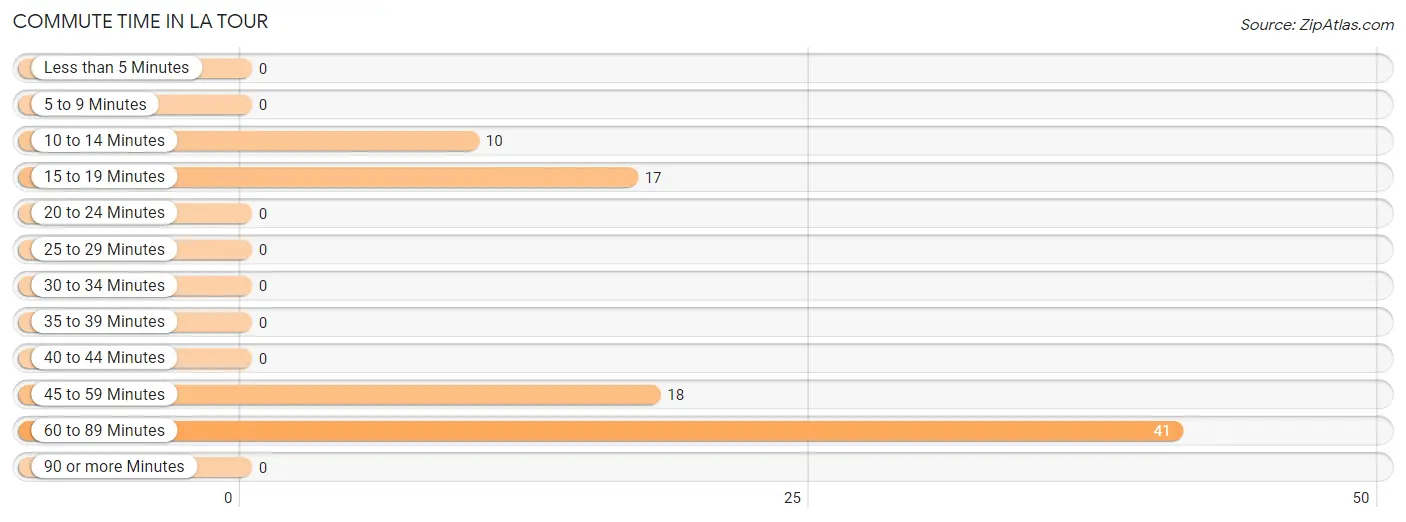
| Commute Time | # Commuters | % Commuters |
| Less than 5 Minutes | 0 | 0.0% |
| 5 to 9 Minutes | 0 | 0.0% |
| 10 to 14 Minutes | 10 | 11.6% |
| 15 to 19 Minutes | 17 | 19.8% |
| 20 to 24 Minutes | 0 | 0.0% |
| 25 to 29 Minutes | 0 | 0.0% |
| 30 to 34 Minutes | 0 | 0.0% |
| 35 to 39 Minutes | 0 | 0.0% |
| 40 to 44 Minutes | 0 | 0.0% |
| 45 to 59 Minutes | 18 | 20.9% |
| 60 to 89 Minutes | 41 | 47.7% |
| 90 or more Minutes | 0 | 0.0% |
Commute Time by Sex in La Tour
The most common commute times in La Tour are 60 to 89 minutes (18 commuters, 69.2%) for males and 60 to 89 minutes (23 commuters, 38.3%) for females.
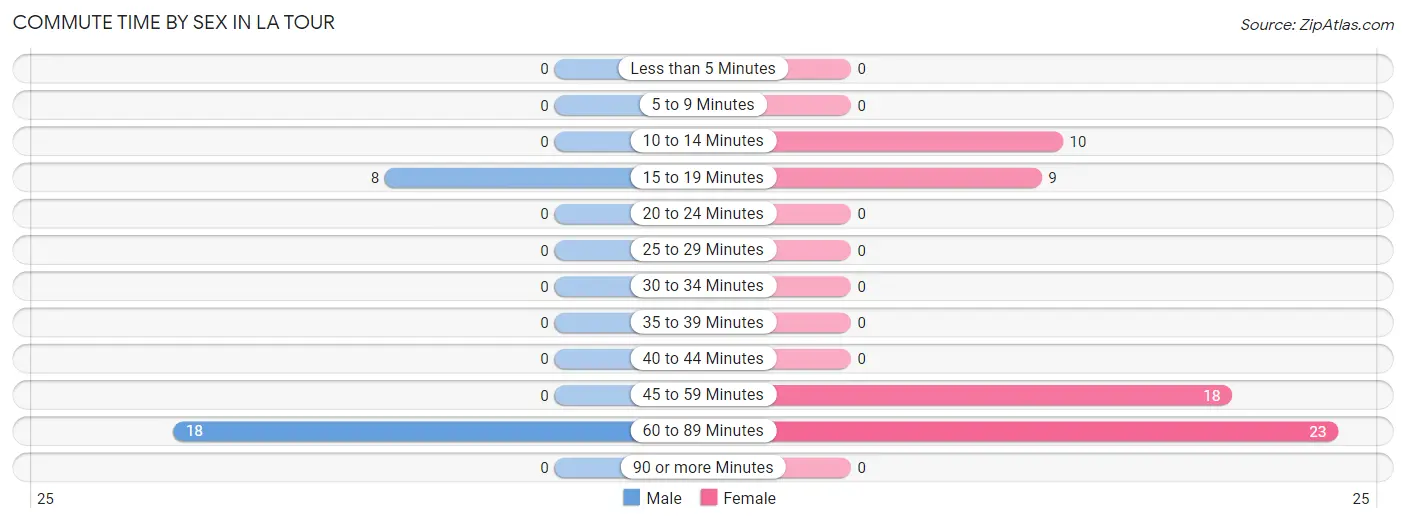
| Commute Time | Male | Female |
| Less than 5 Minutes | 0 (0.0%) | 0 (0.0%) |
| 5 to 9 Minutes | 0 (0.0%) | 0 (0.0%) |
| 10 to 14 Minutes | 0 (0.0%) | 10 (16.7%) |
| 15 to 19 Minutes | 8 (30.8%) | 9 (15.0%) |
| 20 to 24 Minutes | 0 (0.0%) | 0 (0.0%) |
| 25 to 29 Minutes | 0 (0.0%) | 0 (0.0%) |
| 30 to 34 Minutes | 0 (0.0%) | 0 (0.0%) |
| 35 to 39 Minutes | 0 (0.0%) | 0 (0.0%) |
| 40 to 44 Minutes | 0 (0.0%) | 0 (0.0%) |
| 45 to 59 Minutes | 0 (0.0%) | 18 (30.0%) |
| 60 to 89 Minutes | 18 (69.2%) | 23 (38.3%) |
| 90 or more Minutes | 0 (0.0%) | 0 (0.0%) |
Time of Departure to Work by Sex in La Tour
The most frequent times of departure to work in La Tour are 12:00 AM to 4:59 AM (9, 34.6%) for males and 6:00 AM to 6:29 AM (23, 38.3%) for females.
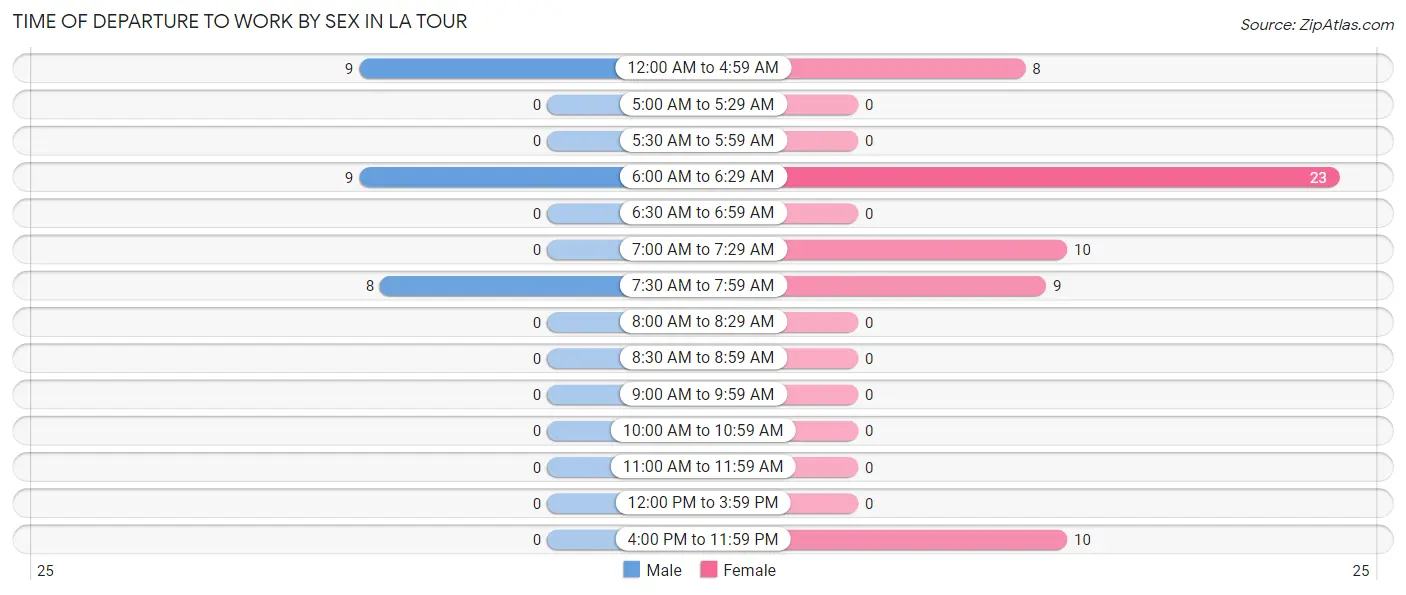
| Time of Departure | Male | Female |
| 12:00 AM to 4:59 AM | 9 (34.6%) | 8 (13.3%) |
| 5:00 AM to 5:29 AM | 0 (0.0%) | 0 (0.0%) |
| 5:30 AM to 5:59 AM | 0 (0.0%) | 0 (0.0%) |
| 6:00 AM to 6:29 AM | 9 (34.6%) | 23 (38.3%) |
| 6:30 AM to 6:59 AM | 0 (0.0%) | 0 (0.0%) |
| 7:00 AM to 7:29 AM | 0 (0.0%) | 10 (16.7%) |
| 7:30 AM to 7:59 AM | 8 (30.8%) | 9 (15.0%) |
| 8:00 AM to 8:29 AM | 0 (0.0%) | 0 (0.0%) |
| 8:30 AM to 8:59 AM | 0 (0.0%) | 0 (0.0%) |
| 9:00 AM to 9:59 AM | 0 (0.0%) | 0 (0.0%) |
| 10:00 AM to 10:59 AM | 0 (0.0%) | 0 (0.0%) |
| 11:00 AM to 11:59 AM | 0 (0.0%) | 0 (0.0%) |
| 12:00 PM to 3:59 PM | 0 (0.0%) | 0 (0.0%) |
| 4:00 PM to 11:59 PM | 0 (0.0%) | 10 (16.7%) |
| Total | 26 (100.0%) | 60 (100.0%) |
Housing Occupancy in La Tour
Occupancy by Ownership in La Tour
Of the total 55 dwellings in La Tour, owner-occupied units account for 22 (40.0%), while renter-occupied units make up 33 (60.0%).
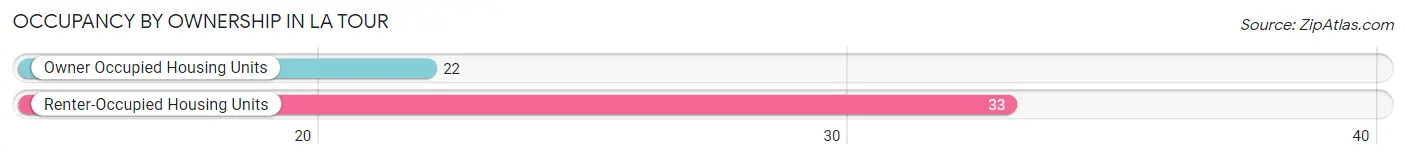
| Occupancy | # Housing Units | % Housing Units |
| Owner Occupied Housing Units | 22 | 40.0% |
| Renter-Occupied Housing Units | 33 | 60.0% |
| Total Occupied Housing Units | 55 | 100.0% |
Occupancy by Household Size in La Tour
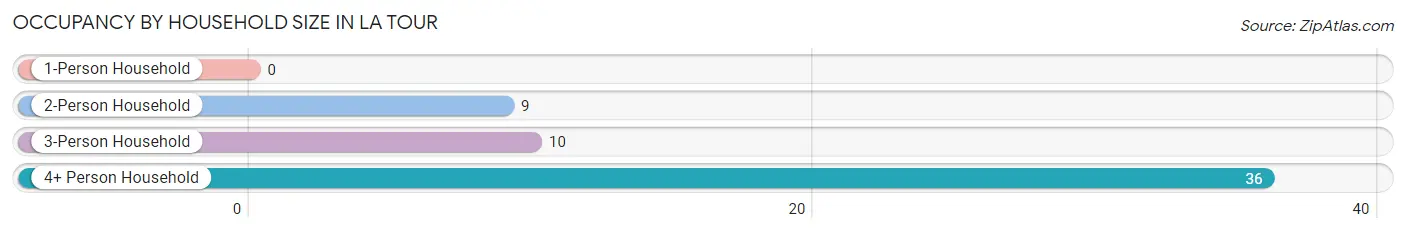
| Household Size | # Housing Units | % Housing Units |
| 1-Person Household | 0 | 0.0% |
| 2-Person Household | 9 | 16.4% |
| 3-Person Household | 10 | 18.2% |
| 4+ Person Household | 36 | 65.4% |
| Total Housing Units | 55 | 100.0% |
Occupancy by Ownership by Household Size in La Tour
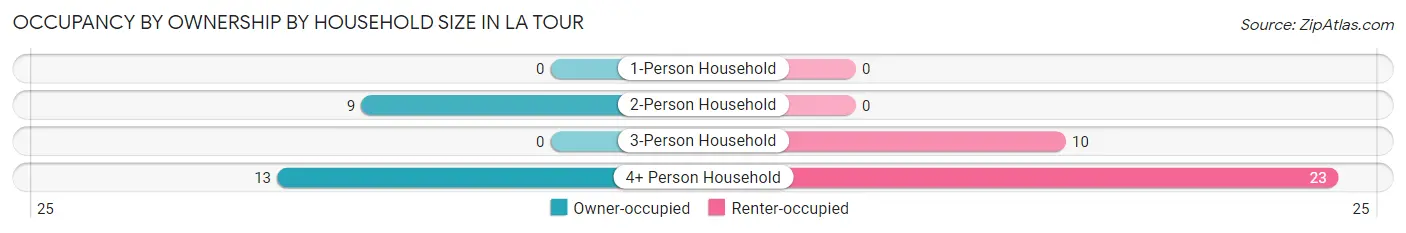
| Household Size | Owner-occupied | Renter-occupied |
| 1-Person Household | 0 (0.0%) | 0 (0.0%) |
| 2-Person Household | 9 (100.0%) | 0 (0.0%) |
| 3-Person Household | 0 (0.0%) | 10 (100.0%) |
| 4+ Person Household | 13 (36.1%) | 23 (63.9%) |
| Total Housing Units | 22 (40.0%) | 33 (60.0%) |
Occupancy by Educational Attainment in La Tour
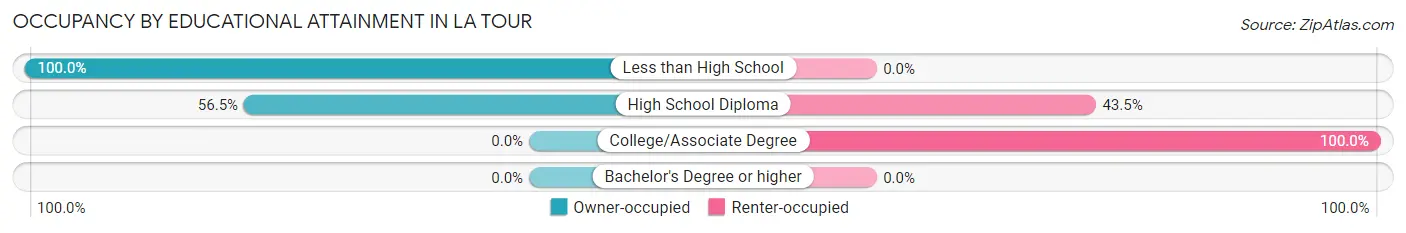
| Household Size | Owner-occupied | Renter-occupied |
| Less than High School | 9 (100.0%) | 0 (0.0%) |
| High School Diploma | 13 (56.5%) | 10 (43.5%) |
| College/Associate Degree | 0 (0.0%) | 23 (100.0%) |
| Bachelor's Degree or higher | 0 (0.0%) | 0 (0.0%) |
Occupancy by Age of Householder in La Tour
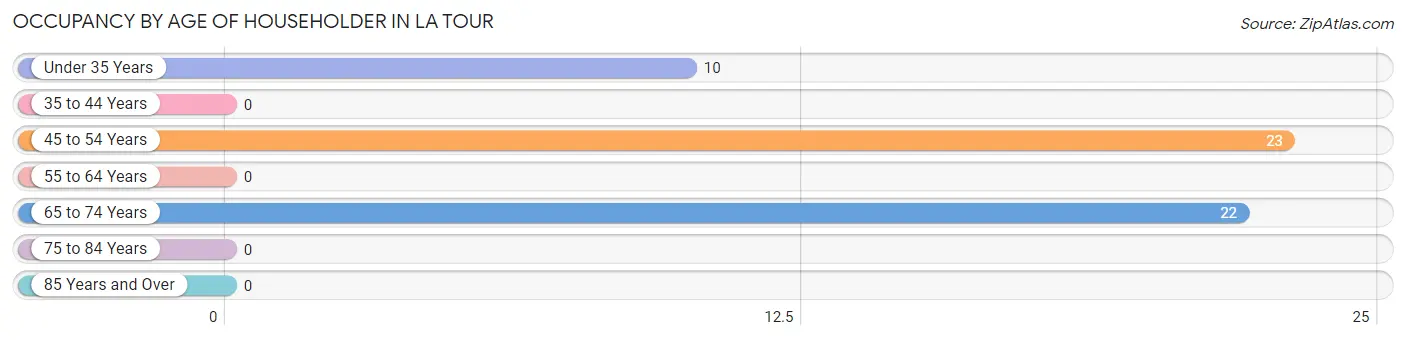
| Age Bracket | # Households | % Households |
| Under 35 Years | 10 | 18.2% |
| 35 to 44 Years | 0 | 0.0% |
| 45 to 54 Years | 23 | 41.8% |
| 55 to 64 Years | 0 | 0.0% |
| 65 to 74 Years | 22 | 40.0% |
| 75 to 84 Years | 0 | 0.0% |
| 85 Years and Over | 0 | 0.0% |
| Total | 55 | 100.0% |
Housing Finances in La Tour
Median Income by Occupancy in La Tour
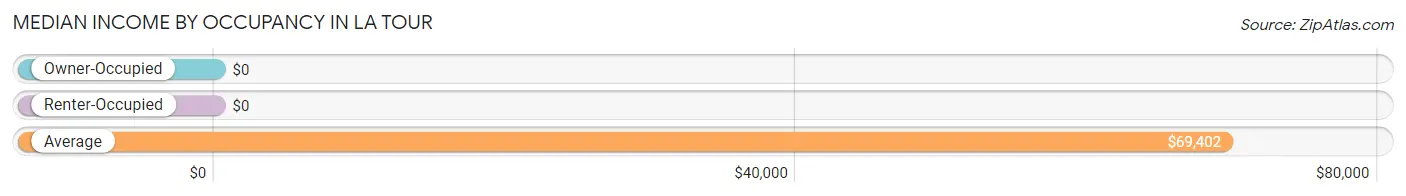
| Occupancy Type | # Households | Median Income |
| Owner-Occupied | 22 (40.0%) | $0 |
| Renter-Occupied | 33 (60.0%) | $0 |
| Average | 55 (100.0%) | $69,402 |
Occupancy by Householder Income Bracket in La Tour
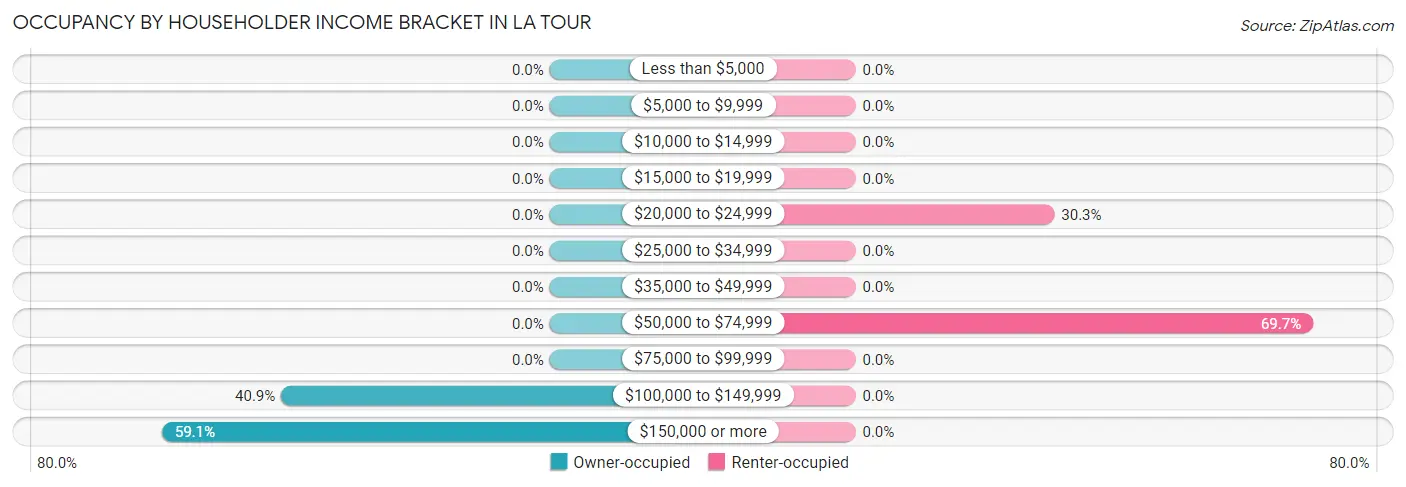
| Income Bracket | Owner-occupied | Renter-occupied |
| Less than $5,000 | 0 (0.0%) | 0 (0.0%) |
| $5,000 to $9,999 | 0 (0.0%) | 0 (0.0%) |
| $10,000 to $14,999 | 0 (0.0%) | 0 (0.0%) |
| $15,000 to $19,999 | 0 (0.0%) | 0 (0.0%) |
| $20,000 to $24,999 | 0 (0.0%) | 10 (30.3%) |
| $25,000 to $34,999 | 0 (0.0%) | 0 (0.0%) |
| $35,000 to $49,999 | 0 (0.0%) | 0 (0.0%) |
| $50,000 to $74,999 | 0 (0.0%) | 23 (69.7%) |
| $75,000 to $99,999 | 0 (0.0%) | 0 (0.0%) |
| $100,000 to $149,999 | 9 (40.9%) | 0 (0.0%) |
| $150,000 or more | 13 (59.1%) | 0 (0.0%) |
| Total | 22 (100.0%) | 33 (100.0%) |
Monthly Housing Cost Tiers in La Tour
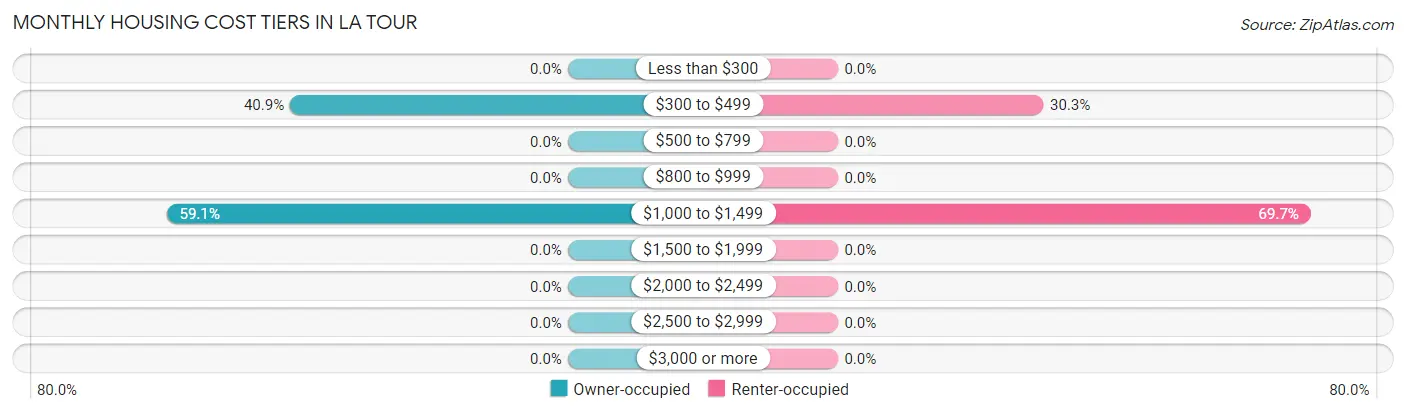
| Monthly Cost | Owner-occupied | Renter-occupied |
| Less than $300 | 0 (0.0%) | 0 (0.0%) |
| $300 to $499 | 9 (40.9%) | 10 (30.3%) |
| $500 to $799 | 0 (0.0%) | 0 (0.0%) |
| $800 to $999 | 0 (0.0%) | 0 (0.0%) |
| $1,000 to $1,499 | 13 (59.1%) | 23 (69.7%) |
| $1,500 to $1,999 | 0 (0.0%) | 0 (0.0%) |
| $2,000 to $2,499 | 0 (0.0%) | 0 (0.0%) |
| $2,500 to $2,999 | 0 (0.0%) | 0 (0.0%) |
| $3,000 or more | 0 (0.0%) | 0 (0.0%) |
| Total | 22 (100.0%) | 33 (100.0%) |
Physical Housing Characteristics in La Tour
Housing Structures in La Tour
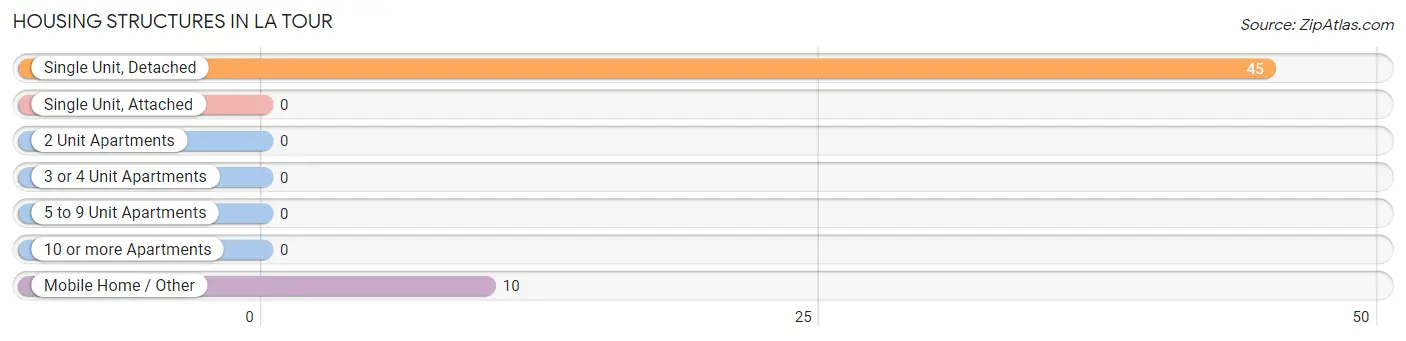
| Structure Type | # Housing Units | % Housing Units |
| Single Unit, Detached | 45 | 81.8% |
| Single Unit, Attached | 0 | 0.0% |
| 2 Unit Apartments | 0 | 0.0% |
| 3 or 4 Unit Apartments | 0 | 0.0% |
| 5 to 9 Unit Apartments | 0 | 0.0% |
| 10 or more Apartments | 0 | 0.0% |
| Mobile Home / Other | 10 | 18.2% |
| Total | 55 | 100.0% |
Housing Structures by Occupancy in La Tour
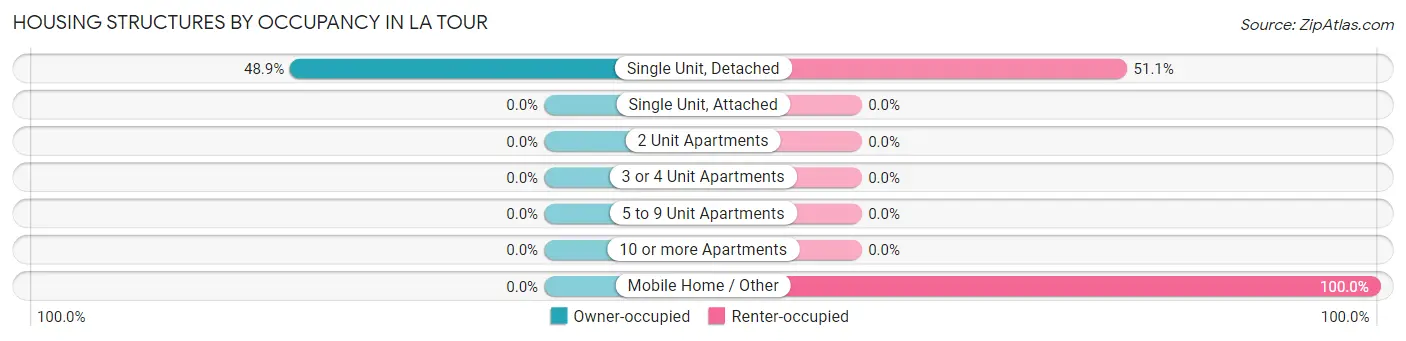
| Structure Type | Owner-occupied | Renter-occupied |
| Single Unit, Detached | 22 (48.9%) | 23 (51.1%) |
| Single Unit, Attached | 0 (0.0%) | 0 (0.0%) |
| 2 Unit Apartments | 0 (0.0%) | 0 (0.0%) |
| 3 or 4 Unit Apartments | 0 (0.0%) | 0 (0.0%) |
| 5 to 9 Unit Apartments | 0 (0.0%) | 0 (0.0%) |
| 10 or more Apartments | 0 (0.0%) | 0 (0.0%) |
| Mobile Home / Other | 0 (0.0%) | 10 (100.0%) |
| Total | 22 (40.0%) | 33 (60.0%) |
Housing Structures by Number of Rooms in La Tour
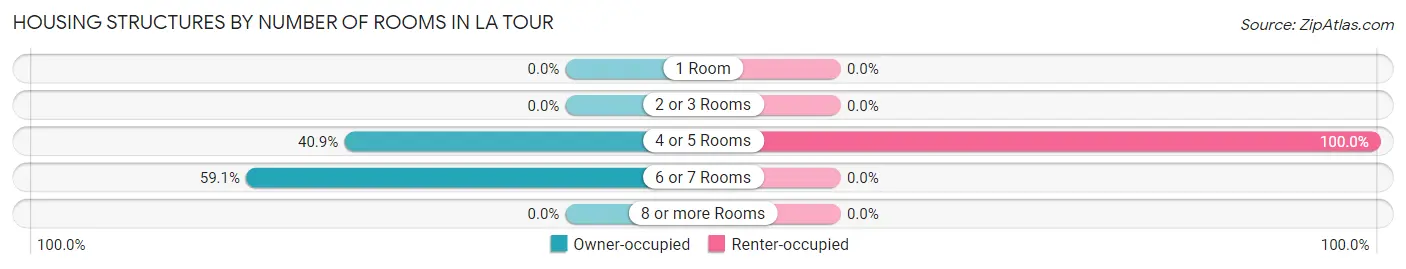
| Number of Rooms | Owner-occupied | Renter-occupied |
| 1 Room | 0 (0.0%) | 0 (0.0%) |
| 2 or 3 Rooms | 0 (0.0%) | 0 (0.0%) |
| 4 or 5 Rooms | 9 (40.9%) | 33 (100.0%) |
| 6 or 7 Rooms | 13 (59.1%) | 0 (0.0%) |
| 8 or more Rooms | 0 (0.0%) | 0 (0.0%) |
| Total | 22 (100.0%) | 33 (100.0%) |
Housing Structure by Heating Type in La Tour
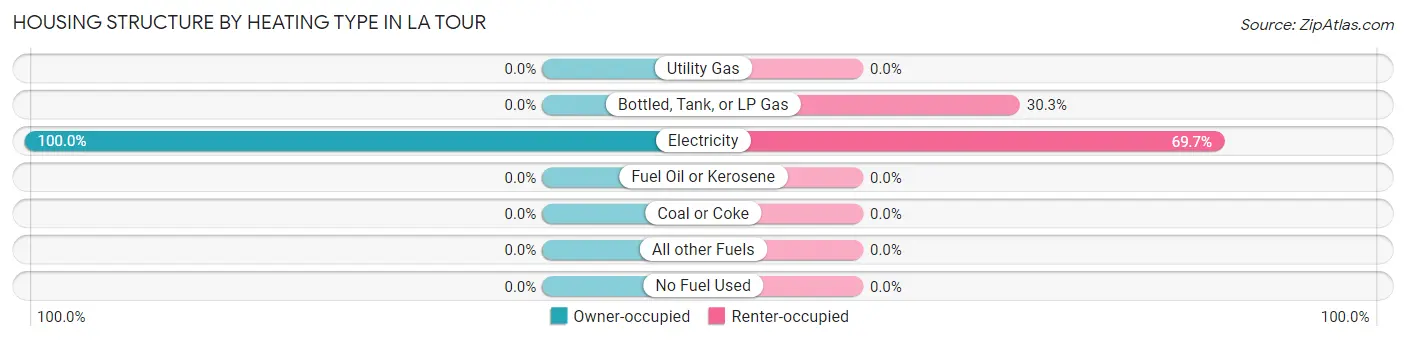
| Heating Type | Owner-occupied | Renter-occupied |
| Utility Gas | 0 (0.0%) | 0 (0.0%) |
| Bottled, Tank, or LP Gas | 0 (0.0%) | 10 (30.3%) |
| Electricity | 22 (100.0%) | 23 (69.7%) |
| Fuel Oil or Kerosene | 0 (0.0%) | 0 (0.0%) |
| Coal or Coke | 0 (0.0%) | 0 (0.0%) |
| All other Fuels | 0 (0.0%) | 0 (0.0%) |
| No Fuel Used | 0 (0.0%) | 0 (0.0%) |
| Total | 22 (100.0%) | 33 (100.0%) |
Household Vehicle Usage in La Tour
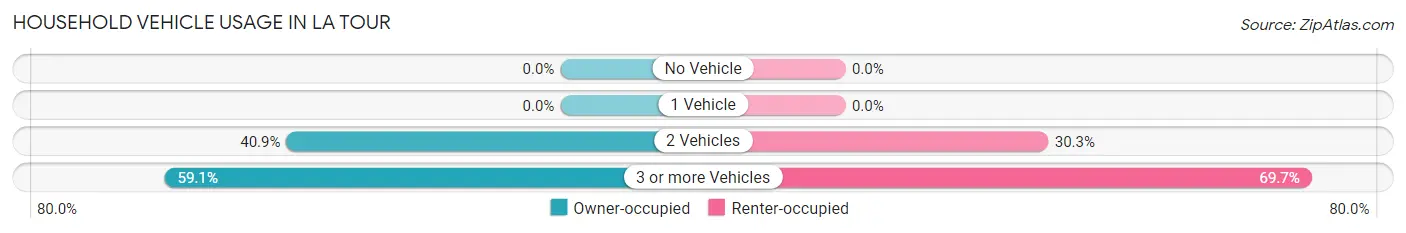
| Vehicles per Household | Owner-occupied | Renter-occupied |
| No Vehicle | 0 (0.0%) | 0 (0.0%) |
| 1 Vehicle | 0 (0.0%) | 0 (0.0%) |
| 2 Vehicles | 9 (40.9%) | 10 (30.3%) |
| 3 or more Vehicles | 13 (59.1%) | 23 (69.7%) |
| Total | 22 (100.0%) | 33 (100.0%) |
Real Estate & Mortgages in La Tour
Real Estate and Mortgage Overview in La Tour
| Characteristic | Without Mortgage | With Mortgage |
| Housing Units | 9 | 13 |
| Median Property Value | - | - |
| Median Household Income | - | - |
| Monthly Housing Costs | - | - |
| Real Estate Taxes | - | - |
Property Value by Mortgage Status in La Tour
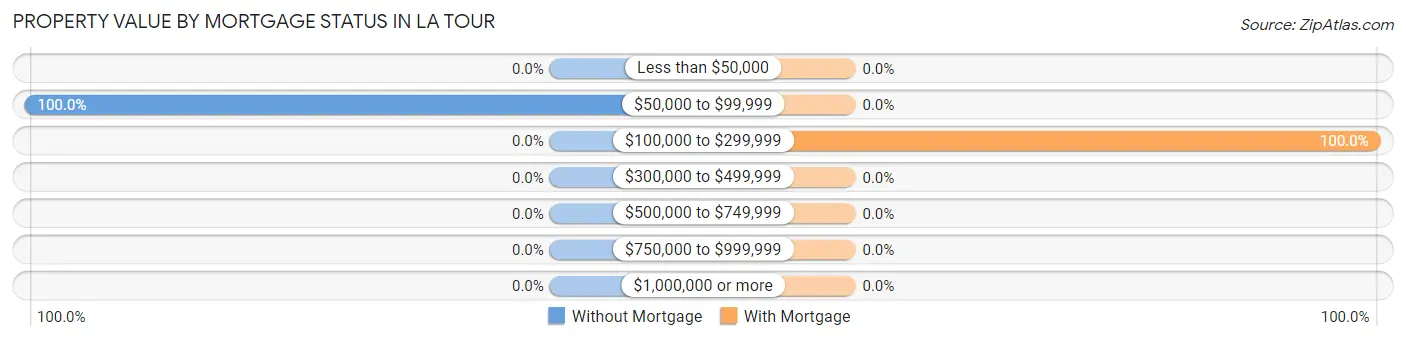
| Property Value | Without Mortgage | With Mortgage |
| Less than $50,000 | 0 (0.0%) | 0 (0.0%) |
| $50,000 to $99,999 | 9 (100.0%) | 0 (0.0%) |
| $100,000 to $299,999 | 0 (0.0%) | 13 (100.0%) |
| $300,000 to $499,999 | 0 (0.0%) | 0 (0.0%) |
| $500,000 to $749,999 | 0 (0.0%) | 0 (0.0%) |
| $750,000 to $999,999 | 0 (0.0%) | 0 (0.0%) |
| $1,000,000 or more | 0 (0.0%) | 0 (0.0%) |
| Total | 9 (100.0%) | 13 (100.0%) |
Household Income by Mortgage Status in La Tour
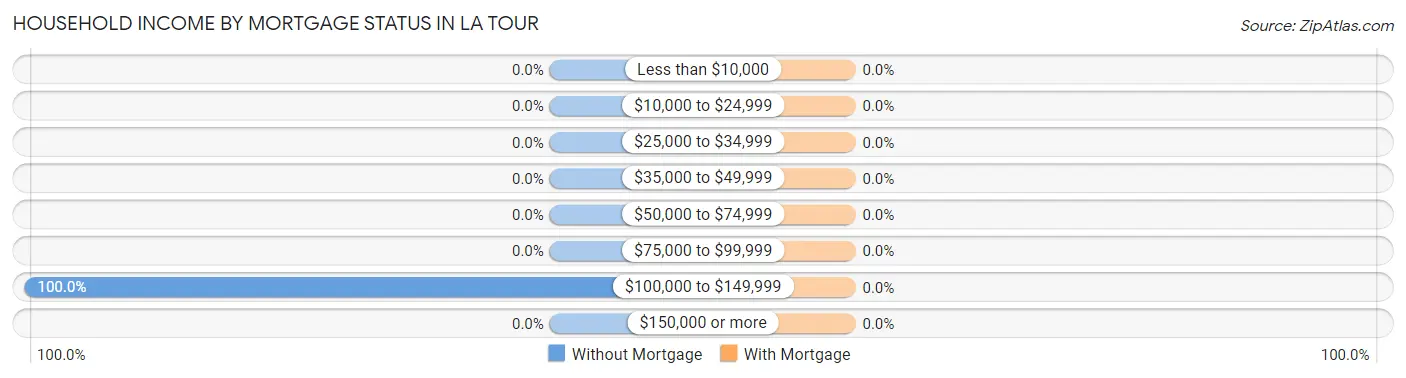
| Household Income | Without Mortgage | With Mortgage |
| Less than $10,000 | 0 (0.0%) | 0 (0.0%) |
| $10,000 to $24,999 | 0 (0.0%) | 0 (0.0%) |
| $25,000 to $34,999 | 0 (0.0%) | 0 (0.0%) |
| $35,000 to $49,999 | 0 (0.0%) | 0 (0.0%) |
| $50,000 to $74,999 | 0 (0.0%) | 0 (0.0%) |
| $75,000 to $99,999 | 0 (0.0%) | 0 (0.0%) |
| $100,000 to $149,999 | 9 (100.0%) | 0 (0.0%) |
| $150,000 or more | 0 (0.0%) | 0 (0.0%) |
| Total | 9 (100.0%) | 13 (100.0%) |
Property Value to Household Income Ratio in La Tour
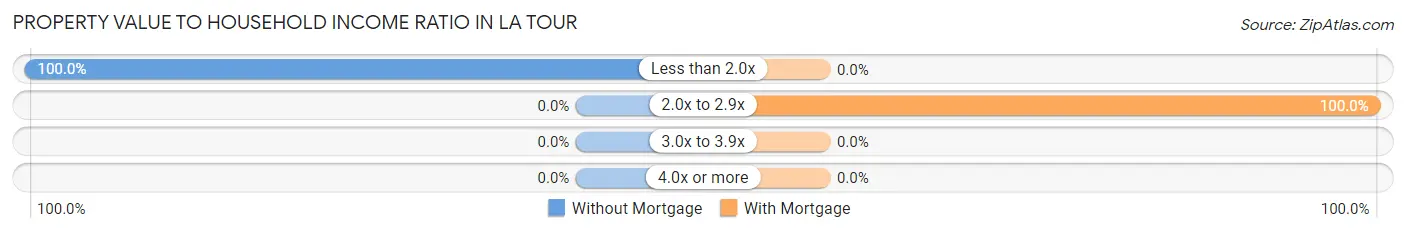
| Value-to-Income Ratio | Without Mortgage | With Mortgage |
| Less than 2.0x | 9 (100.0%) | 0 (0.0%) |
| 2.0x to 2.9x | 0 (0.0%) | 13 (100.0%) |
| 3.0x to 3.9x | 0 (0.0%) | 0 (0.0%) |
| 4.0x or more | 0 (0.0%) | 0 (0.0%) |
| Total | 9 (100.0%) | 13 (100.0%) |
Real Estate Taxes by Mortgage Status in La Tour
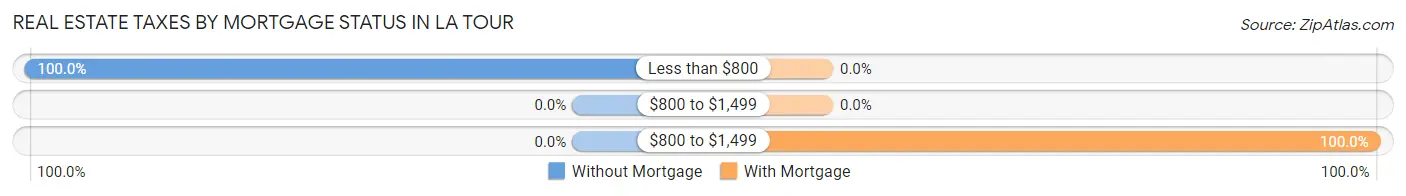
| Property Taxes | Without Mortgage | With Mortgage |
| Less than $800 | 9 (100.0%) | 0 (0.0%) |
| $800 to $1,499 | 0 (0.0%) | 0 (0.0%) |
| $800 to $1,499 | 0 (0.0%) | 13 (100.0%) |
| Total | 9 (100.0%) | 13 (100.0%) |
Health & Disability in La Tour
Health Insurance Coverage by Age in La Tour
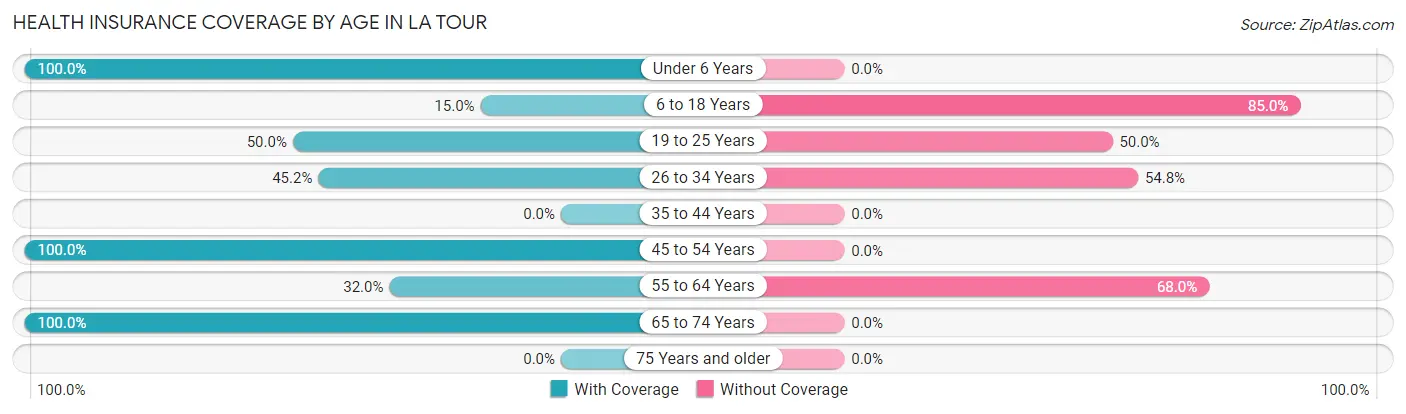
| Age Bracket | With Coverage | Without Coverage |
| Under 6 Years | 20 (100.0%) | 0 (0.0%) |
| 6 to 18 Years | 12 (15.0%) | 68 (85.0%) |
| 19 to 25 Years | 10 (50.0%) | 10 (50.0%) |
| 26 to 34 Years | 19 (45.2%) | 23 (54.8%) |
| 35 to 44 Years | 0 (0.0%) | 0 (0.0%) |
| 45 to 54 Years | 32 (100.0%) | 0 (0.0%) |
| 55 to 64 Years | 8 (32.0%) | 17 (68.0%) |
| 65 to 74 Years | 22 (100.0%) | 0 (0.0%) |
| 75 Years and older | 0 (0.0%) | 0 (0.0%) |
| Total | 123 (51.0%) | 118 (49.0%) |
Health Insurance Coverage by Citizenship Status in La Tour
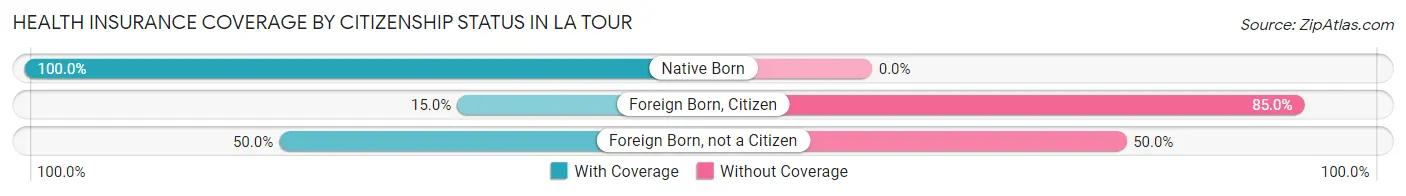
| Citizenship Status | With Coverage | Without Coverage |
| Native Born | 20 (100.0%) | 0 (0.0%) |
| Foreign Born, Citizen | 12 (15.0%) | 68 (85.0%) |
| Foreign Born, not a Citizen | 10 (50.0%) | 10 (50.0%) |
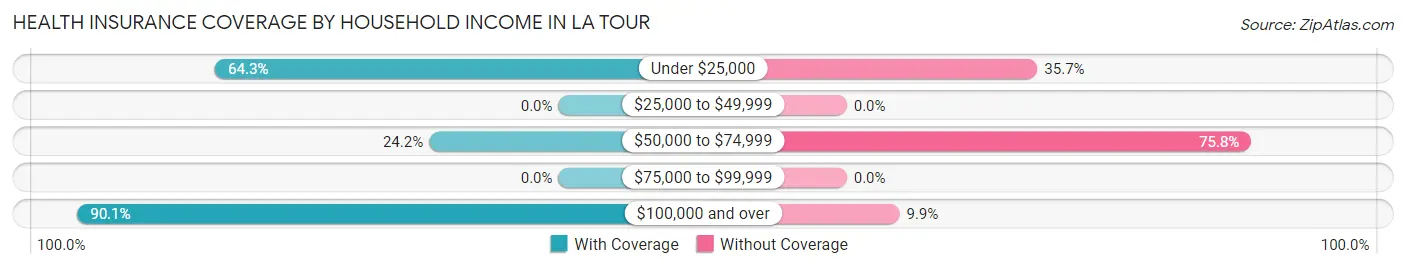
Health Insurance Coverage by Household Income in La Tour
| Household Income | With Coverage | Without Coverage |
| Under $25,000 | 18 (64.3%) | 10 (35.7%) |
| $25,000 to $49,999 | 0 (0.0%) | 0 (0.0%) |
| $50,000 to $74,999 | 32 (24.2%) | 100 (75.8%) |
| $75,000 to $99,999 | 0 (0.0%) | 0 (0.0%) |
| $100,000 and over | 73 (90.1%) | 8 (9.9%) |
Public vs Private Health Insurance Coverage by Age in La Tour
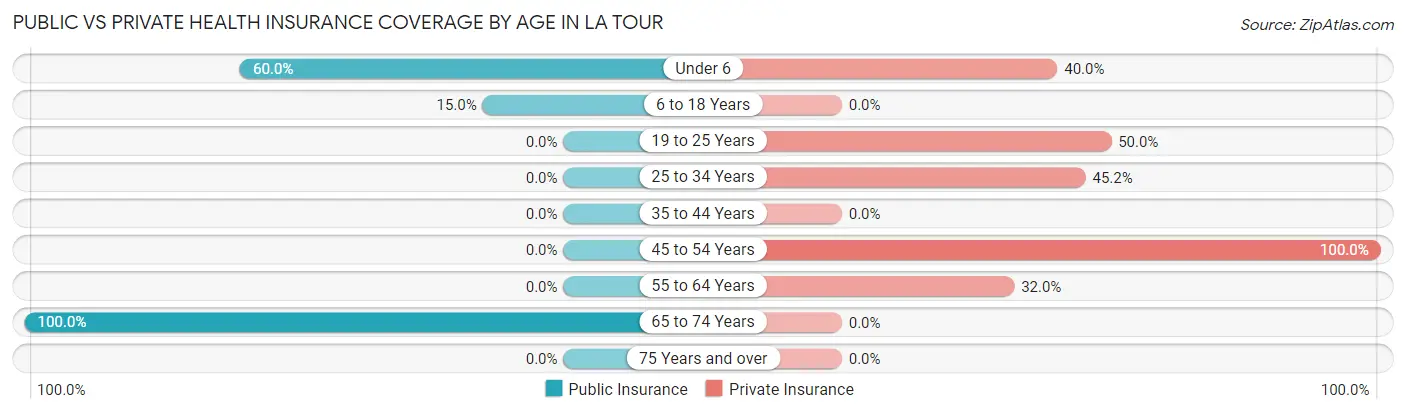
| Age Bracket | Public Insurance | Private Insurance |
| Under 6 | 12 (60.0%) | 8 (40.0%) |
| 6 to 18 Years | 12 (15.0%) | 0 (0.0%) |
| 19 to 25 Years | 0 (0.0%) | 10 (50.0%) |
| 25 to 34 Years | 0 (0.0%) | 19 (45.2%) |
| 35 to 44 Years | 0 (0.0%) | 0 (0.0%) |
| 45 to 54 Years | 0 (0.0%) | 32 (100.0%) |
| 55 to 64 Years | 0 (0.0%) | 8 (32.0%) |
| 65 to 74 Years | 22 (100.0%) | 0 (0.0%) |
| 75 Years and over | 0 (0.0%) | 0 (0.0%) |
| Total | 46 (19.1%) | 77 (32.0%) |
Disability Status by Sex by Age in La Tour
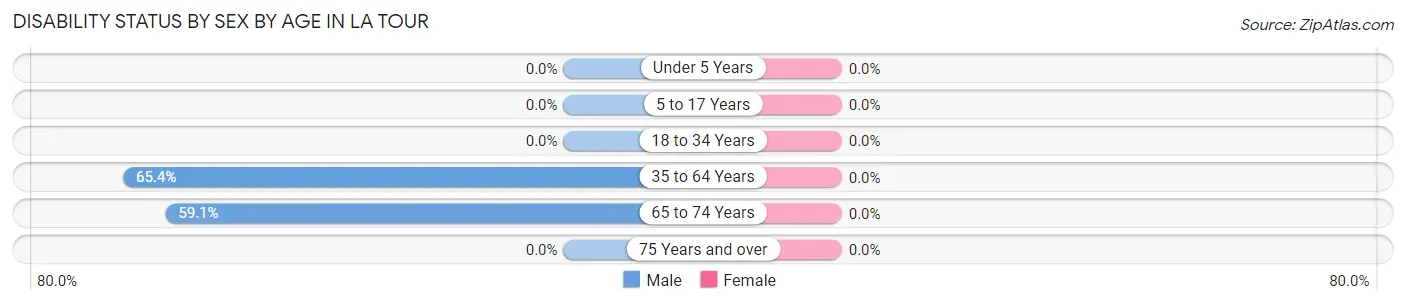
| Age Bracket | Male | Female |
| Under 5 Years | 0 (0.0%) | 0 (0.0%) |
| 5 to 17 Years | 0 (0.0%) | 0 (0.0%) |
| 18 to 34 Years | 0 (0.0%) | 0 (0.0%) |
| 35 to 64 Years | 17 (65.4%) | 0 (0.0%) |
| 65 to 74 Years | 13 (59.1%) | 0 (0.0%) |
| 75 Years and over | 0 (0.0%) | 0 (0.0%) |
Disability Class by Sex by Age in La Tour
Disability Class: Hearing Difficulty
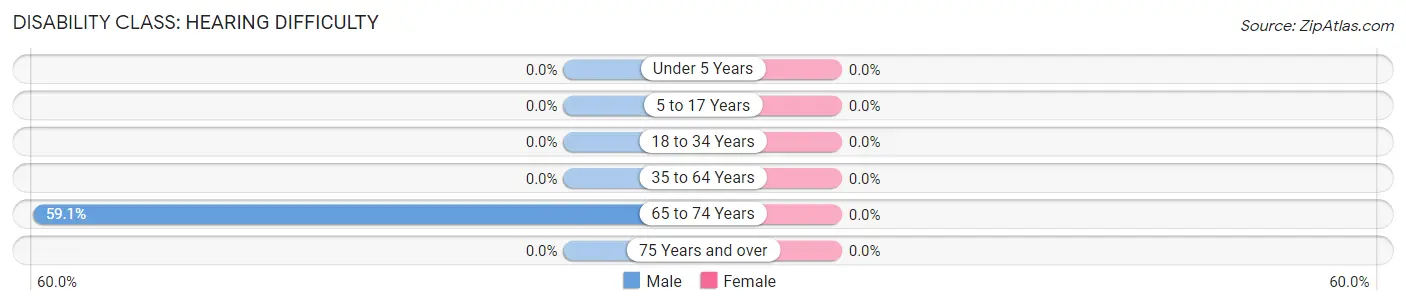
| Age Bracket | Male | Female |
| Under 5 Years | 0 (0.0%) | 0 (0.0%) |
| 5 to 17 Years | 0 (0.0%) | 0 (0.0%) |
| 18 to 34 Years | 0 (0.0%) | 0 (0.0%) |
| 35 to 64 Years | 0 (0.0%) | 0 (0.0%) |
| 65 to 74 Years | 13 (59.1%) | 0 (0.0%) |
| 75 Years and over | 0 (0.0%) | 0 (0.0%) |
Disability Class: Vision Difficulty
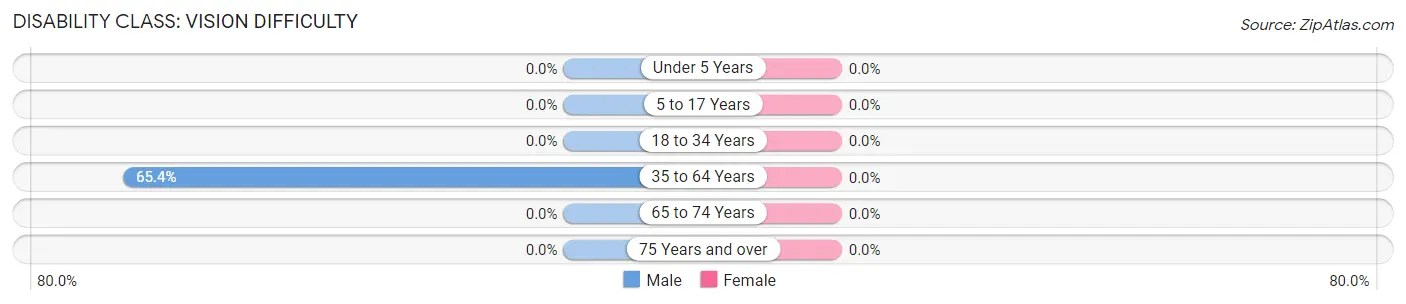
| Age Bracket | Male | Female |
| Under 5 Years | 0 (0.0%) | 0 (0.0%) |
| 5 to 17 Years | 0 (0.0%) | 0 (0.0%) |
| 18 to 34 Years | 0 (0.0%) | 0 (0.0%) |
| 35 to 64 Years | 17 (65.4%) | 0 (0.0%) |
| 65 to 74 Years | 0 (0.0%) | 0 (0.0%) |
| 75 Years and over | 0 (0.0%) | 0 (0.0%) |
Disability Class: Cognitive Difficulty
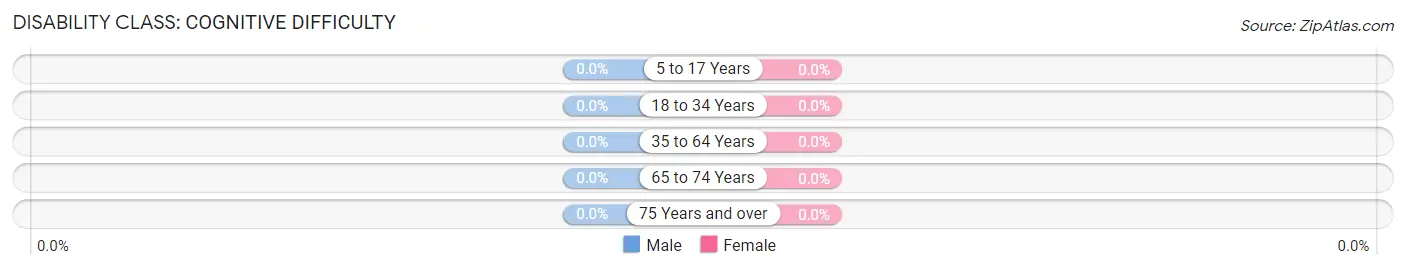
| Age Bracket | Male | Female |
| 5 to 17 Years | 0 (0.0%) | 0 (0.0%) |
| 18 to 34 Years | 0 (0.0%) | 0 (0.0%) |
| 35 to 64 Years | 0 (0.0%) | 0 (0.0%) |
| 65 to 74 Years | 0 (0.0%) | 0 (0.0%) |
| 75 Years and over | 0 (0.0%) | 0 (0.0%) |
Disability Class: Ambulatory Difficulty

| Age Bracket | Male | Female |
| 5 to 17 Years | 0 (0.0%) | 0 (0.0%) |
| 18 to 34 Years | 0 (0.0%) | 0 (0.0%) |
| 35 to 64 Years | 0 (0.0%) | 0 (0.0%) |
| 65 to 74 Years | 13 (59.1%) | 0 (0.0%) |
| 75 Years and over | 0 (0.0%) | 0 (0.0%) |
Disability Class: Self-Care Difficulty
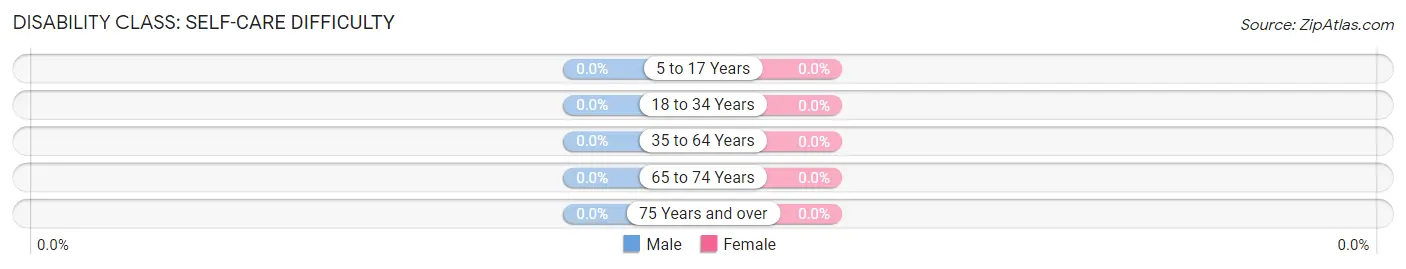
| Age Bracket | Male | Female |
| 5 to 17 Years | 0 (0.0%) | 0 (0.0%) |
| 18 to 34 Years | 0 (0.0%) | 0 (0.0%) |
| 35 to 64 Years | 0 (0.0%) | 0 (0.0%) |
| 65 to 74 Years | 0 (0.0%) | 0 (0.0%) |
| 75 Years and over | 0 (0.0%) | 0 (0.0%) |
Technology Access in La Tour
Computing Device Access in La Tour
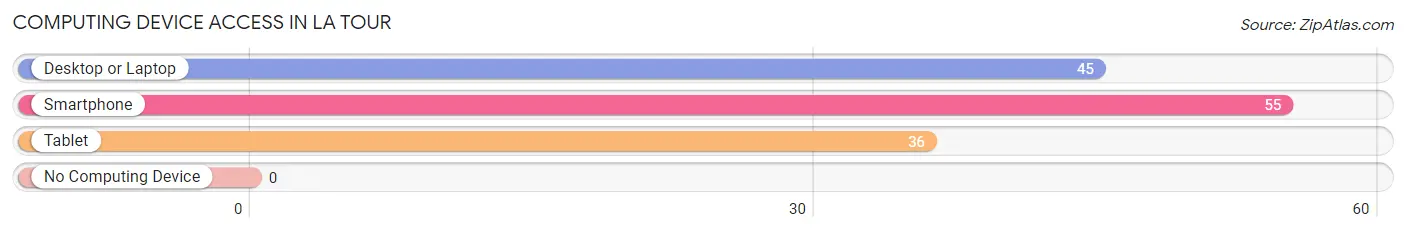
| Device Type | # Households | % Households |
| Desktop or Laptop | 45 | 81.8% |
| Smartphone | 55 | 100.0% |
| Tablet | 36 | 65.4% |
| No Computing Device | 0 | 0.0% |
| Total | 55 | 100.0% |
Internet Access in La Tour
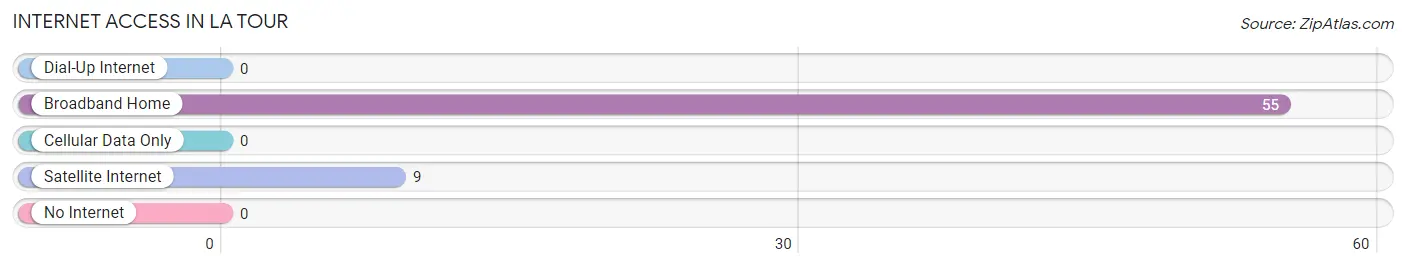
| Internet Type | # Households | % Households |
| Dial-Up Internet | 0 | 0.0% |
| Broadband Home | 55 | 100.0% |
| Cellular Data Only | 0 | 0.0% |
| Satellite Internet | 9 | 16.4% |
| No Internet | 0 | 0.0% |
| Total | 55 | 100.0% |
La Tour Summary
Tour, Missouri is a small town located in the southeastern corner of the state, near the Mississippi River. It is part of the St. Louis metropolitan area and is home to a population of just over 1,000 people. The town was founded in 1837 and has a rich history that is intertwined with the history of the state of Missouri.
Geography
La Tour is located in the southeastern corner of Missouri, near the Mississippi River. It is part of the St. Louis metropolitan area and is bordered by the towns of Arnold, Festus, and Crystal City. The town is situated on a bluff overlooking the Mississippi River and is surrounded by rolling hills and farmland. The town is located in Jefferson County and is part of the St. Louis-St. Charles-Farmington Metropolitan Statistical Area.
Economy
The economy of La Tour is largely based on agriculture and tourism. The town is home to several small businesses, including a grocery store, a hardware store, and a few restaurants. The town also has a few small manufacturing companies that produce a variety of products, including furniture and clothing. The town is also home to a few wineries and vineyards, which attract tourists from all over the region.
Demographics
As of the 2010 census, La Tour had a population of 1,072 people. The racial makeup of the town was 97.2% White, 0.7% African American, 0.3% Native American, 0.2% Asian, 0.1% Pacific Islander, 0.3% from other races, and 1.3% from two or more races. Hispanic or Latino of any race were 1.3% of the population.
The median income for a household in La Tour was $41,250, and the median income for a family was $45,000. Males had a median income of $31,250 versus $25,000 for females. The per capita income for the town was $18,945. About 8.2% of families and 10.2% of the population were below the poverty line, including 14.3% of those under age 18 and 8.3% of those age 65 or over.
History
La Tour was founded in 1837 by a group of French settlers who were looking for a place to settle and start a new life. The town was named after the French explorer La Salle, who explored the area in the late 1600s. The town quickly grew and became a popular destination for settlers from all over the country.
In the late 1800s, La Tour was a thriving river port town, with a bustling economy based on shipping and trade. The town was also home to a number of factories, including a cotton mill, a flour mill, and a sawmill. The town was also home to a number of churches, schools, and other businesses.
In the early 1900s, the town began to decline as the river trade began to decline. The town was hit hard by the Great Depression and many of the businesses and factories closed. The town slowly began to recover in the 1950s and 1960s, as the economy began to improve. Today, La Tour is a small, quiet town with a population of just over 1,000 people.
Common Questions
What is the Total Population of La Tour?
Total Population of La Tour is 241.
What is the Total Male Population of La Tour?
Total Male Population of La Tour is 86.
What is the Total Female Population of La Tour?
Total Female Population of La Tour is 155.
What is the Ratio of Males per 100 Females in La Tour?
There are 55.48 Males per 100 Females in La Tour.
What is the Ratio of Females per 100 Males in La Tour?
There are 180.23 Females per 100 Males in La Tour.
What is the Median Population Age in La Tour?
Median Population Age in La Tour is 27.1 Years.
What is the Average Family Size in La Tour
Average Family Size in La Tour is 3.9 People.
What is the Average Household Size in La Tour
Average Household Size in La Tour is 4.4 People.
What is Per Capita Income in La Tour?
Per Capita income in La Tour is $15,335.
What is the Median Family Income in La Tour?
Median Family Income in La Tour is $69,402.
What is the Median Household income in La Tour?
Median Household Income in La Tour is $69,402.
What is Income or Wage Gap in La Tour?
Income or Wage Gap in La Tour is 39.8%.
Women in La Tour earn 60.2 cents for every dollar earned by a man.
What is Inequality or Gini Index in La Tour?
Inequality or Gini Index in La Tour is 0.28.
How Large is the Labor Force in La Tour?
There are 86 People in the Labor Forcein in La Tour.
What is the Percentage of People in the Labor Force in La Tour?
61.0% of People are in the Labor Force in La Tour.