Pettis County, MO
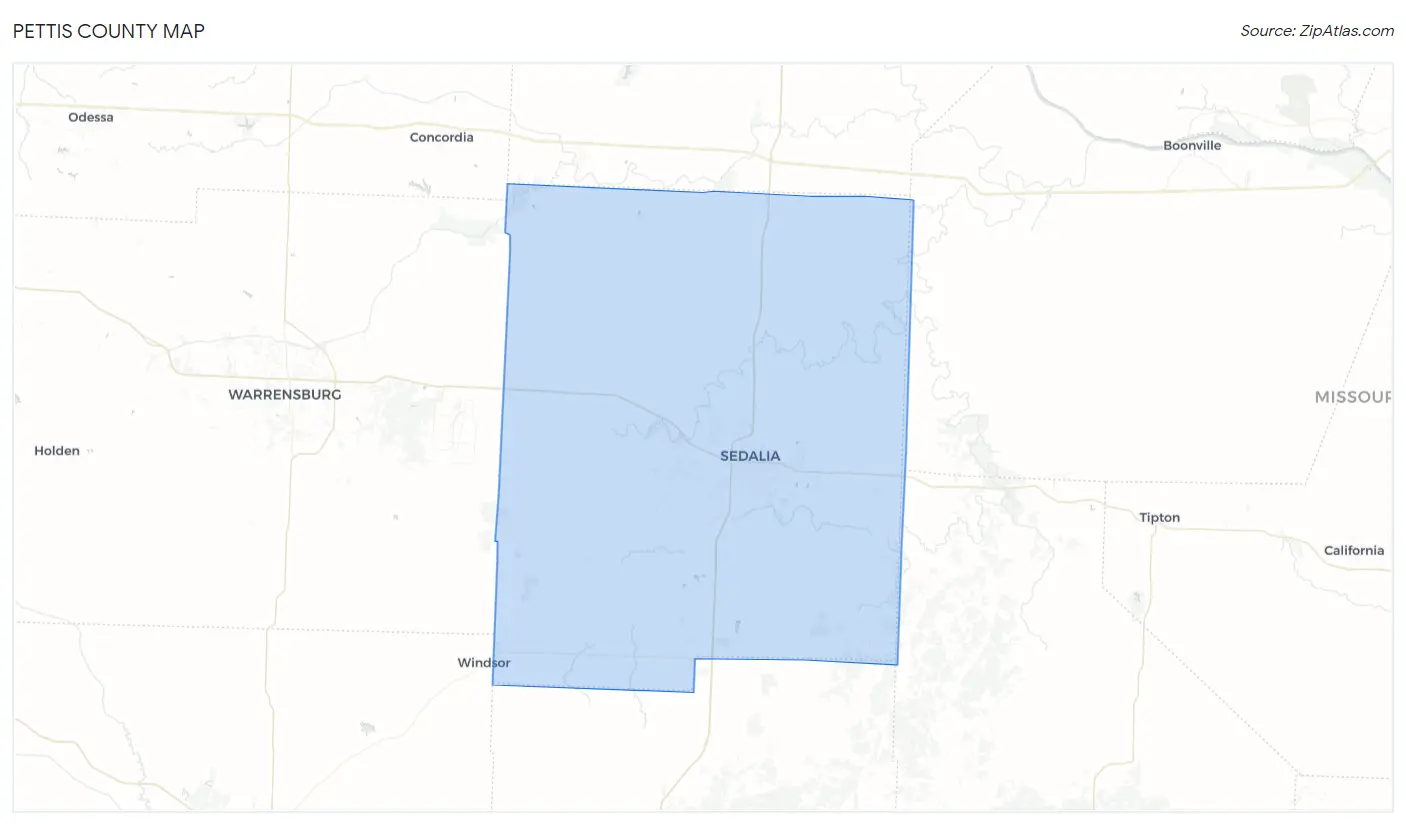
Pettis County Map
Pettis County Overview
43,059
TOTAL POPULATION
21,606
MALE POPULATION
21,453
FEMALE POPULATION
100.71
MALES / 100 FEMALES
99.29
FEMALES / 100 MALES
38.0
MEDIAN AGE
3.0
AVG FAMILY SIZE
2.5
AVG HOUSEHOLD SIZE
$30,991
PER CAPITA INCOME
$68,393
AVG FAMILY INCOME
$57,581
AVG HOUSEHOLD INCOME
27.5%
WAGE / INCOME GAP [ % ]
72.5¢/ $1
WAGE / INCOME GAP [ $ ]
$10,700
FAMILY INCOME DEFICIT
0.45
INEQUALITY / GINI INDEX
21,178
LABOR FORCE [ PEOPLE ]
63.1%
PERCENT IN LABOR FORCE
3.9%
UNEMPLOYMENT RATE
Pettis County Area Codes
Race in Pettis County
The most populous races in Pettis County are White / Caucasian (37,711 | 87.6%), Hispanic or Latino (3,943 | 9.2%), and Two or more Races (2,169 | 5.0%).
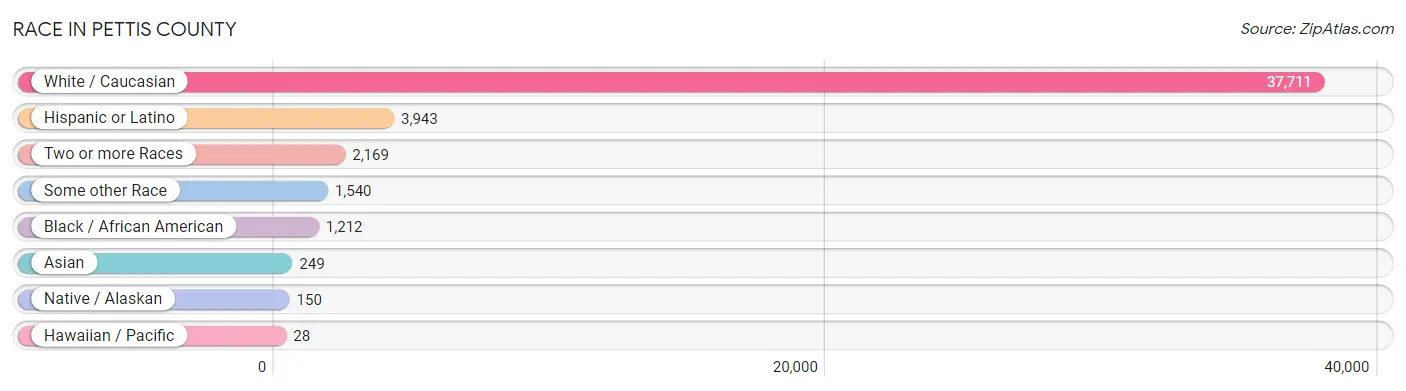
| Race | # Population | % Population |
| Asian | 249 | 0.6% |
| Black / African American | 1,212 | 2.8% |
| Hawaiian / Pacific | 28 | 0.1% |
| Hispanic or Latino | 3,943 | 9.2% |
| Native / Alaskan | 150 | 0.4% |
| White / Caucasian | 37,711 | 87.6% |
| Two or more Races | 2,169 | 5.0% |
| Some other Race | 1,540 | 3.6% |
| Total | 43,059 | 100.0% |
Ancestry in Pettis County
The most populous ancestries reported in Pettis County are German (9,447 | 21.9%), Irish (4,172 | 9.7%), American (3,339 | 7.7%), Mexican (3,294 | 7.6%), and English (3,220 | 7.5%), together accounting for 54.5% of all Pettis County residents.
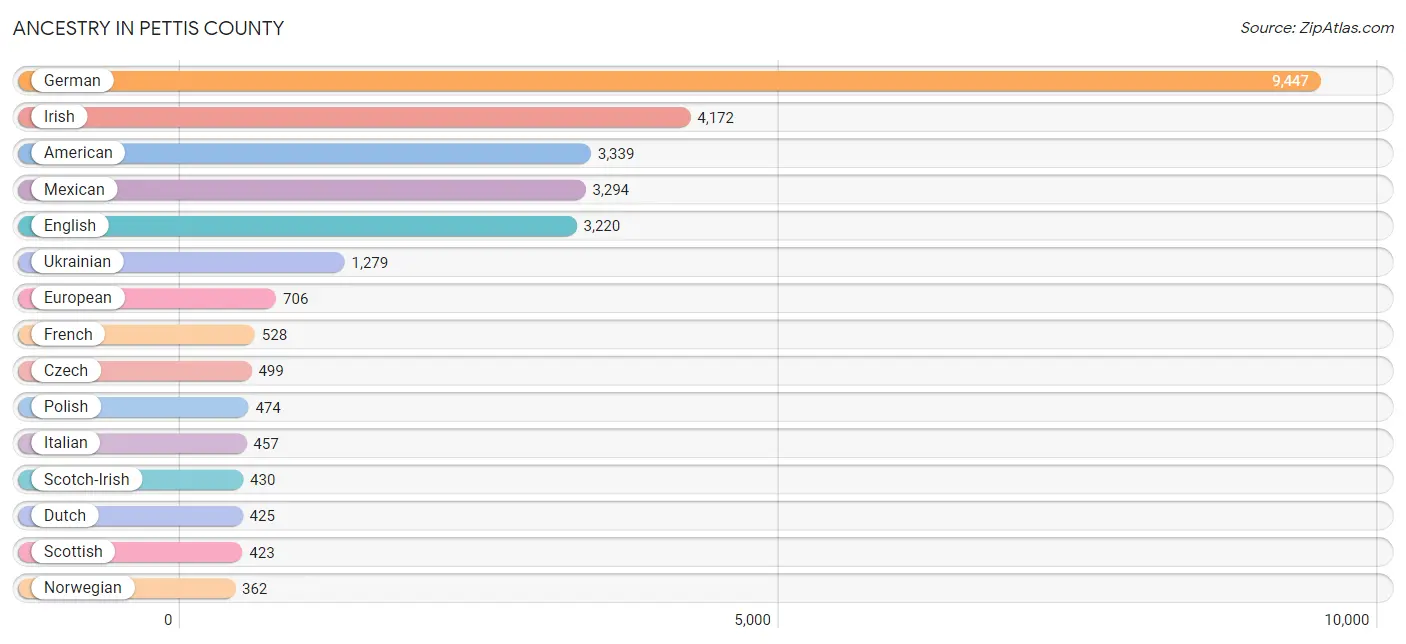
| Ancestry | # Population | % Population |
| African | 18 | 0.0% |
| American | 3,339 | 7.7% |
| Austrian | 66 | 0.2% |
| Belgian | 79 | 0.2% |
| Bhutanese | 23 | 0.1% |
| Blackfeet | 64 | 0.2% |
| Brazilian | 5 | 0.0% |
| British | 69 | 0.2% |
| Cajun | 15 | 0.0% |
| Canadian | 25 | 0.1% |
| Celtic | 13 | 0.0% |
| Central American | 312 | 0.7% |
| Central American Indian | 9 | 0.0% |
| Cherokee | 152 | 0.4% |
| Choctaw | 6 | 0.0% |
| Colombian | 8 | 0.0% |
| Comanche | 4 | 0.0% |
| Cree | 7 | 0.0% |
| Croatian | 22 | 0.1% |
| Czech | 499 | 1.2% |
| Czechoslovakian | 32 | 0.1% |
| Danish | 15 | 0.0% |
| Dutch | 425 | 1.0% |
| Eastern European | 16 | 0.0% |
| Ecuadorian | 18 | 0.0% |
| English | 3,220 | 7.5% |
| Ethiopian | 7 | 0.0% |
| European | 706 | 1.6% |
| French | 528 | 1.2% |
| French American Indian | 5 | 0.0% |
| French Canadian | 31 | 0.1% |
| German | 9,447 | 21.9% |
| German Russian | 6 | 0.0% |
| Greek | 36 | 0.1% |
| Guatemalan | 116 | 0.3% |
| Haitian | 89 | 0.2% |
| Honduran | 92 | 0.2% |
| Hungarian | 35 | 0.1% |
| Indian (Asian) | 52 | 0.1% |
| Irish | 4,172 | 9.7% |
| Iroquois | 4 | 0.0% |
| Israeli | 17 | 0.0% |
| Italian | 457 | 1.1% |
| Jamaican | 48 | 0.1% |
| Japanese | 6 | 0.0% |
| Korean | 273 | 0.6% |
| Laotian | 8 | 0.0% |
| Lithuanian | 9 | 0.0% |
| Marshallese | 49 | 0.1% |
| Mexican | 3,294 | 7.6% |
| Native Hawaiian | 44 | 0.1% |
| Nigerian | 7 | 0.0% |
| Northern European | 44 | 0.1% |
| Norwegian | 362 | 0.8% |
| Osage | 22 | 0.1% |
| Pakistani | 12 | 0.0% |
| Panamanian | 102 | 0.2% |
| Polish | 474 | 1.1% |
| Portuguese | 11 | 0.0% |
| Potawatomi | 1 | 0.0% |
| Puerto Rican | 72 | 0.2% |
| Romanian | 176 | 0.4% |
| Russian | 347 | 0.8% |
| Salvadoran | 2 | 0.0% |
| Scandinavian | 29 | 0.1% |
| Scotch-Irish | 430 | 1.0% |
| Scottish | 423 | 1.0% |
| Sioux | 1 | 0.0% |
| Slavic | 74 | 0.2% |
| Slovak | 14 | 0.0% |
| Somali | 9 | 0.0% |
| South American | 38 | 0.1% |
| Soviet Union | 9 | 0.0% |
| Spaniard | 66 | 0.2% |
| Spanish | 2 | 0.0% |
| Sri Lankan | 65 | 0.2% |
| Subsaharan African | 41 | 0.1% |
| Swedish | 252 | 0.6% |
| Swiss | 264 | 0.6% |
| Thai | 49 | 0.1% |
| Trinidadian and Tobagonian | 45 | 0.1% |
| Ukrainian | 1,279 | 3.0% |
| Venezuelan | 12 | 0.0% |
| Welsh | 145 | 0.3% |
| West Indian | 4 | 0.0% |
| Yugoslavian | 31 | 0.1% | View All 86 Rows |
Immigrants in Pettis County
The most numerous immigrant groups reported in Pettis County came from Latin America (1,596 | 3.7%), Central America (1,407 | 3.3%), Mexico (1,287 | 3.0%), Europe (1,188 | 2.8%), and Eastern Europe (1,112 | 2.6%), together accounting for 15.3% of all Pettis County residents.
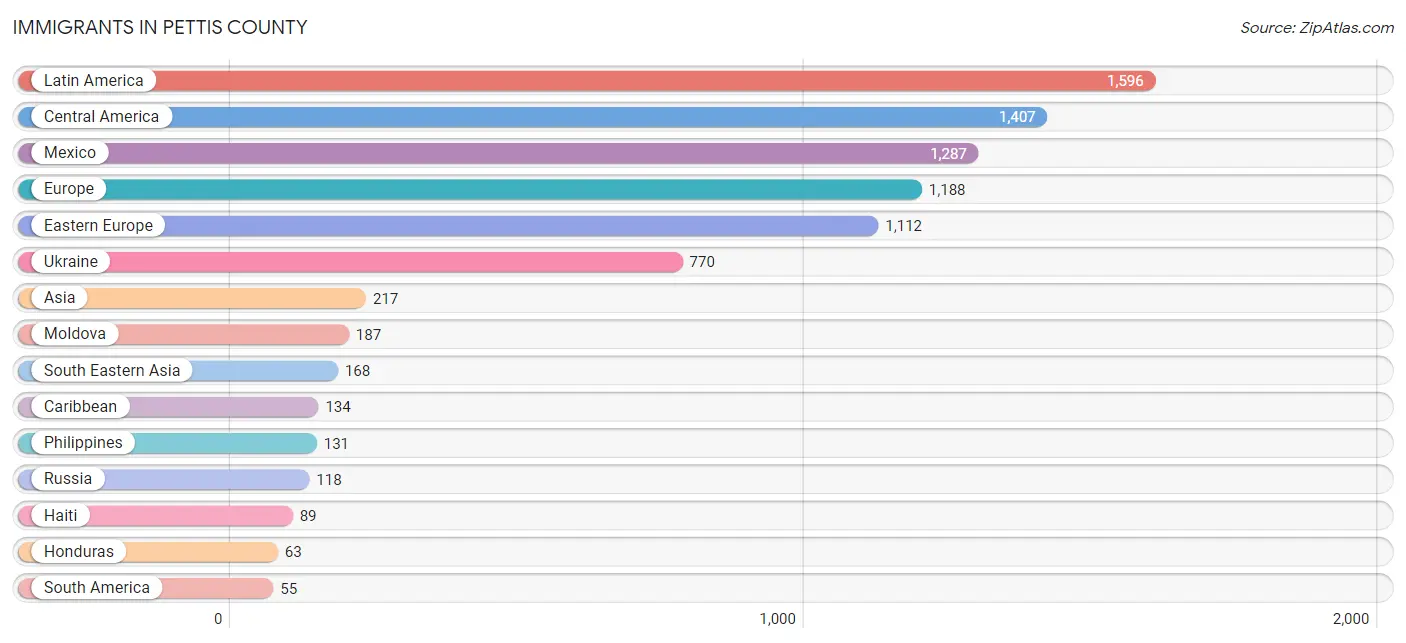
| Immigration Origin | # Population | % Population |
| Africa | 9 | 0.0% |
| Armenia | 8 | 0.0% |
| Asia | 217 | 0.5% |
| Brazil | 5 | 0.0% |
| Cambodia | 6 | 0.0% |
| Caribbean | 134 | 0.3% |
| Central America | 1,407 | 3.3% |
| Eastern Africa | 9 | 0.0% |
| Eastern Europe | 1,112 | 2.6% |
| Ecuador | 13 | 0.0% |
| El Salvador | 2 | 0.0% |
| England | 26 | 0.1% |
| Europe | 1,188 | 2.8% |
| France | 2 | 0.0% |
| Germany | 33 | 0.1% |
| Guatemala | 31 | 0.1% |
| Haiti | 89 | 0.2% |
| Honduras | 63 | 0.2% |
| India | 24 | 0.1% |
| Indonesia | 8 | 0.0% |
| Latin America | 1,596 | 3.7% |
| Latvia | 7 | 0.0% |
| Mexico | 1,287 | 3.0% |
| Micronesia | 27 | 0.1% |
| Moldova | 187 | 0.4% |
| Northern Europe | 26 | 0.1% |
| Oceania | 27 | 0.1% |
| Panama | 24 | 0.1% |
| Philippines | 131 | 0.3% |
| Poland | 7 | 0.0% |
| Russia | 118 | 0.3% |
| Somalia | 9 | 0.0% |
| South America | 55 | 0.1% |
| South Central Asia | 41 | 0.1% |
| South Eastern Asia | 168 | 0.4% |
| Sri Lanka | 9 | 0.0% |
| Switzerland | 9 | 0.0% |
| Thailand | 6 | 0.0% |
| Trinidad and Tobago | 45 | 0.1% |
| Ukraine | 770 | 1.8% |
| Venezuela | 37 | 0.1% |
| Vietnam | 17 | 0.0% |
| Western Asia | 8 | 0.0% |
| Western Europe | 44 | 0.1% | View All 44 Rows |
Sex and Age in Pettis County
Sex and Age in Pettis County
The most populous age groups in Pettis County are 5 to 9 Years (1,668 | 7.7%) for men and 60 to 64 Years (1,749 | 8.2%) for women.
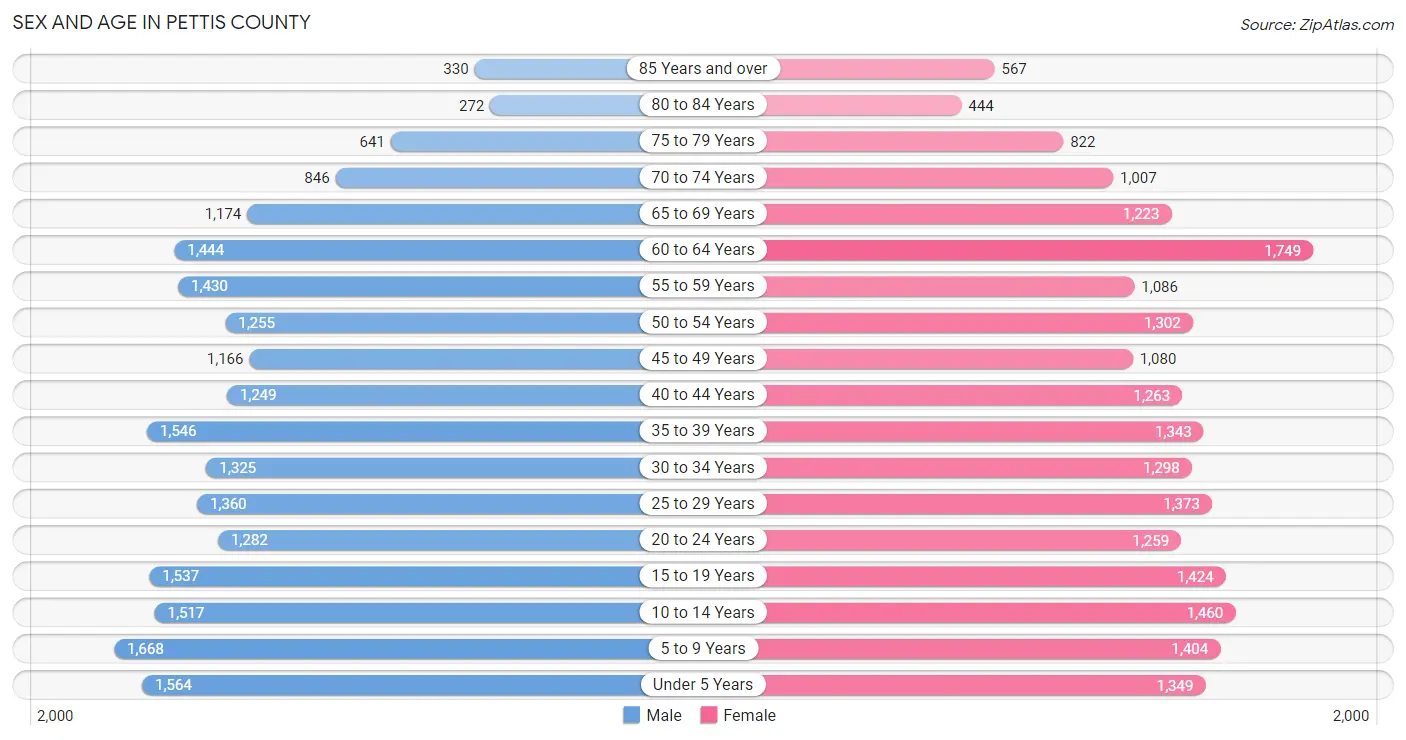
| Age Bracket | Male | Female |
| Under 5 Years | 1,564 (7.2%) | 1,349 (6.3%) |
| 5 to 9 Years | 1,668 (7.7%) | 1,404 (6.5%) |
| 10 to 14 Years | 1,517 (7.0%) | 1,460 (6.8%) |
| 15 to 19 Years | 1,537 (7.1%) | 1,424 (6.6%) |
| 20 to 24 Years | 1,282 (5.9%) | 1,259 (5.9%) |
| 25 to 29 Years | 1,360 (6.3%) | 1,373 (6.4%) |
| 30 to 34 Years | 1,325 (6.1%) | 1,298 (6.0%) |
| 35 to 39 Years | 1,546 (7.2%) | 1,343 (6.3%) |
| 40 to 44 Years | 1,249 (5.8%) | 1,263 (5.9%) |
| 45 to 49 Years | 1,166 (5.4%) | 1,080 (5.0%) |
| 50 to 54 Years | 1,255 (5.8%) | 1,302 (6.1%) |
| 55 to 59 Years | 1,430 (6.6%) | 1,086 (5.1%) |
| 60 to 64 Years | 1,444 (6.7%) | 1,749 (8.2%) |
| 65 to 69 Years | 1,174 (5.4%) | 1,223 (5.7%) |
| 70 to 74 Years | 846 (3.9%) | 1,007 (4.7%) |
| 75 to 79 Years | 641 (3.0%) | 822 (3.8%) |
| 80 to 84 Years | 272 (1.3%) | 444 (2.1%) |
| 85 Years and over | 330 (1.5%) | 567 (2.6%) |
| Total | 21,606 (100.0%) | 21,453 (100.0%) |
Families and Households in Pettis County
Median Family Size in Pettis County
The median family size in Pettis County is 3.05 persons per family, with married-couple families (8,511 | 75.6%) accounting for the largest median family size of 3.12 persons per family. On the other hand, single male/father families (775 | 6.9%) represent the smallest median family size with 2.62 persons per family.
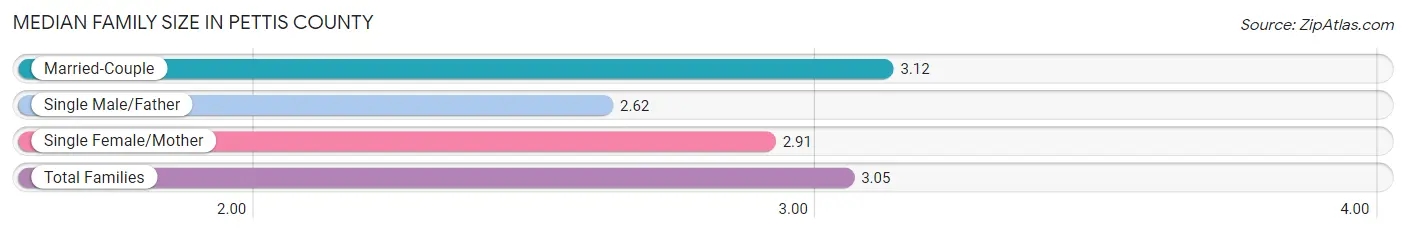
| Family Type | # Families | Family Size |
| Married-Couple | 8,511 (75.6%) | 3.12 |
| Single Male/Father | 775 (6.9%) | 2.62 |
| Single Female/Mother | 1,977 (17.5%) | 2.91 |
| Total Families | 11,263 (100.0%) | 3.05 |
Median Household Size in Pettis County
The median household size in Pettis County is 2.52 persons per household, with single female/mother households (1,977 | 11.8%) accounting for the largest median household size of 3.22 persons per household. non-family households (5,433 | 32.5%) represent the smallest median household size with 1.21 persons per household.
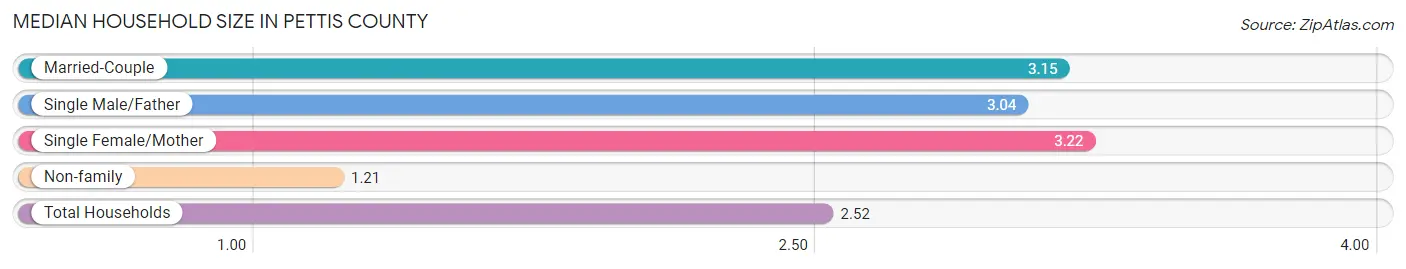
| Household Type | # Households | Household Size |
| Married-Couple | 8,511 (51.0%) | 3.15 |
| Single Male/Father | 775 (4.6%) | 3.04 |
| Single Female/Mother | 1,977 (11.8%) | 3.22 |
| Non-family | 5,433 (32.5%) | 1.21 |
| Total Households | 16,696 (100.0%) | 2.52 |
Household Size by Marriage Status in Pettis County
Out of a total of 16,696 households in Pettis County, 11,263 (67.5%) are family households, while 5,433 (32.5%) are nonfamily households. The most numerous type of family households are 2-person households, comprising 5,177, and the most common type of nonfamily households are 1-person households, comprising 4,482.
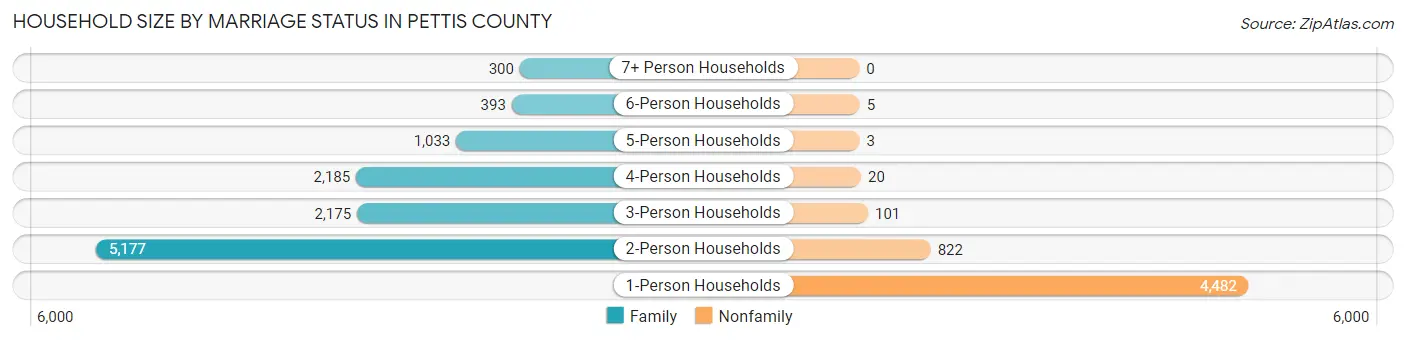
| Household Size | Family Households | Nonfamily Households |
| 1-Person Households | - | 4,482 (26.8%) |
| 2-Person Households | 5,177 (31.0%) | 822 (4.9%) |
| 3-Person Households | 2,175 (13.0%) | 101 (0.6%) |
| 4-Person Households | 2,185 (13.1%) | 20 (0.1%) |
| 5-Person Households | 1,033 (6.2%) | 3 (0.0%) |
| 6-Person Households | 393 (2.4%) | 5 (0.0%) |
| 7+ Person Households | 300 (1.8%) | 0 (0.0%) |
| Total | 11,263 (67.5%) | 5,433 (32.5%) |
Female Fertility in Pettis County
Fertility by Age in Pettis County
Average fertility rate in Pettis County is 76.0 births per 1,000 women. Women in the age bracket of 20 to 34 years have the highest fertility rate with 148.0 births per 1,000 women. Women in the age bracket of 20 to 34 years acount for 82.5% of all women with births.
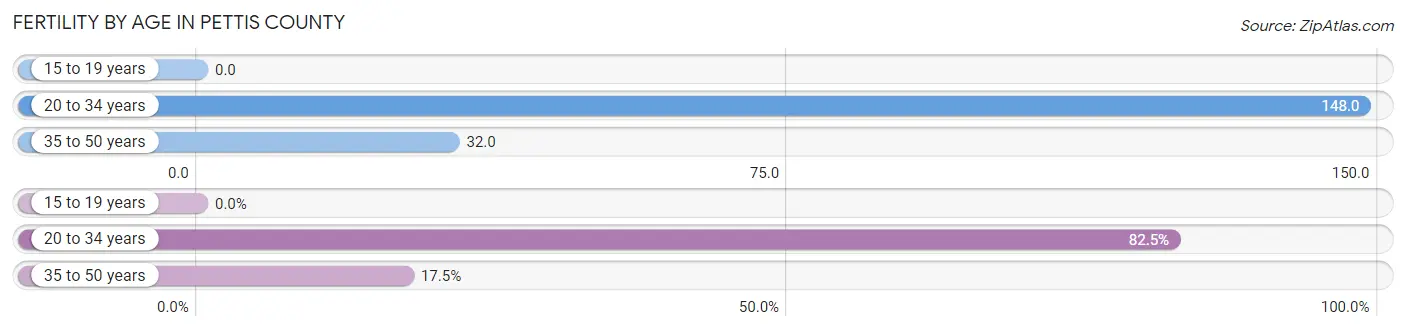
| Age Bracket | Women with Births | Births / 1,000 Women |
| 15 to 19 years | 0 (0.0%) | 0.0 |
| 20 to 34 years | 581 (82.5%) | 148.0 |
| 35 to 50 years | 123 (17.5%) | 32.0 |
| Total | 704 (100.0%) | 76.0 |
Fertility by Age by Marriage Status in Pettis County
75.3% of women with births (704) in Pettis County are married. The highest percentage of unmarried women with births falls into 20 to 34 years age bracket with 28.4% of them unmarried at the time of birth, while the lowest percentage of unmarried women with births belong to 35 to 50 years age bracket with 7.3% of them unmarried.
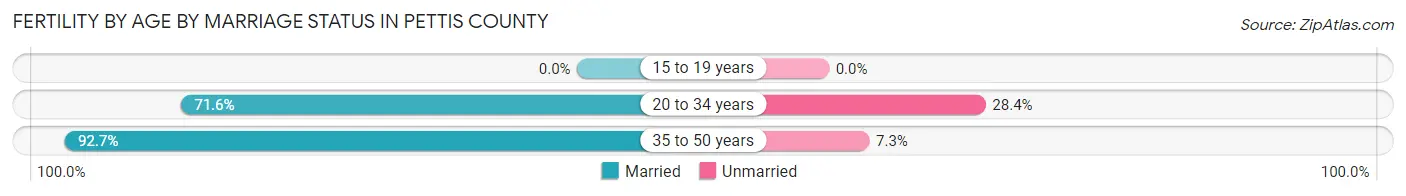
| Age Bracket | Married | Unmarried |
| 15 to 19 years | 0 (0.0%) | 0 (0.0%) |
| 20 to 34 years | 416 (71.6%) | 165 (28.4%) |
| 35 to 50 years | 114 (92.7%) | 9 (7.3%) |
| Total | 530 (75.3%) | 174 (24.7%) |
Fertility by Education in Pettis County
Average fertility rate in Pettis County is 76.0 births per 1,000 women. Women with the education attainment of graduate degree have the highest fertility rate of 124.0 births per 1,000 women, while women with the education attainment of high school diploma have the lowest fertility at 53.0 births per 1,000 women. Women with the education attainment of college or associate's degree represent 35.8% of all women with births.
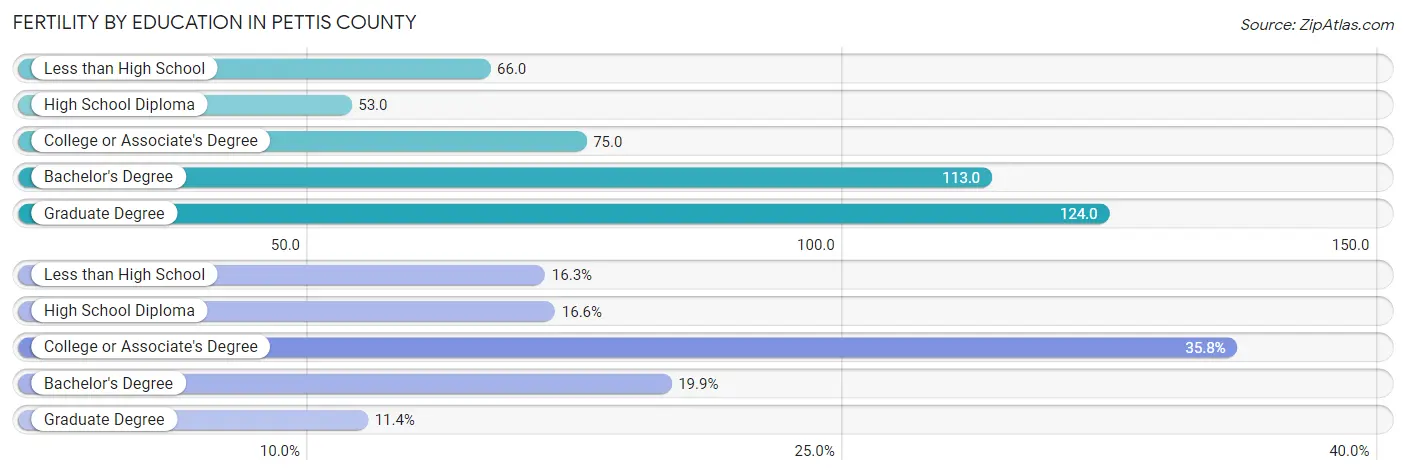
| Educational Attainment | Women with Births | Births / 1,000 Women |
| Less than High School | 115 (16.3%) | 66.0 |
| High School Diploma | 117 (16.6%) | 53.0 |
| College or Associate's Degree | 252 (35.8%) | 75.0 |
| Bachelor's Degree | 140 (19.9%) | 113.0 |
| Graduate Degree | 80 (11.4%) | 124.0 |
| Total | 704 (100.0%) | 76.0 |
Fertility by Education by Marriage Status in Pettis County
24.7% of women with births in Pettis County are unmarried. Women with the educational attainment of graduate degree are most likely to be married with 100.0% of them married at childbirth, while women with the educational attainment of high school diploma are least likely to be married with 79.5% of them unmarried at childbirth.
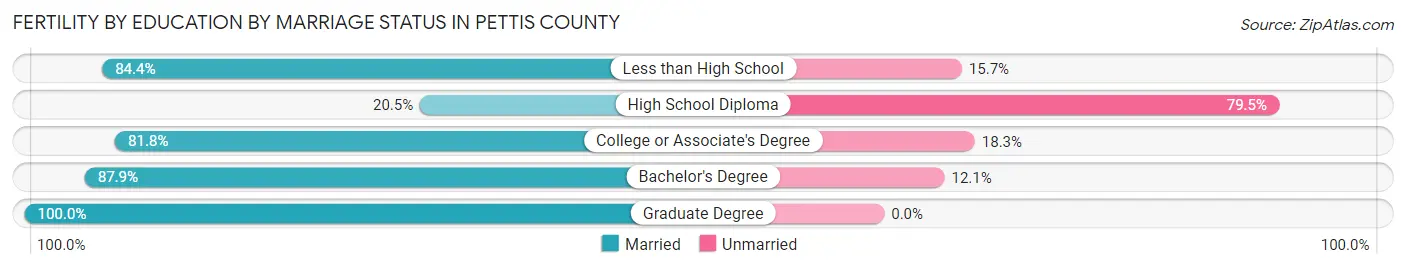
| Educational Attainment | Married | Unmarried |
| Less than High School | 97 (84.4%) | 18 (15.7%) |
| High School Diploma | 24 (20.5%) | 93 (79.5%) |
| College or Associate's Degree | 206 (81.8%) | 46 (18.2%) |
| Bachelor's Degree | 123 (87.9%) | 17 (12.1%) |
| Graduate Degree | 80 (100.0%) | 0 (0.0%) |
| Total | 530 (75.3%) | 174 (24.7%) |
Income in Pettis County
Income Overview in Pettis County
Per Capita Income in Pettis County is $30,991, while median incomes of families and households are $68,393 and $57,581 respectively.
| Characteristic | Number | Measure |
| Per Capita Income | 43,059 | $30,991 |
| Median Family Income | 11,263 | $68,393 |
| Mean Family Income | 11,263 | $89,179 |
| Median Household Income | 16,696 | $57,581 |
| Mean Household Income | 16,696 | $79,159 |
| Income Deficit | 11,263 | $10,700 |
| Wage / Income Gap (%) | 43,059 | 27.49% |
| Wage / Income Gap ($) | 43,059 | 72.51¢ per $1 |
| Gini / Inequality Index | 43,059 | 0.45 |
Earnings by Sex in Pettis County
Average Earnings in Pettis County are $34,158, $39,069 for men and $28,329 for women, a difference of 27.5%.
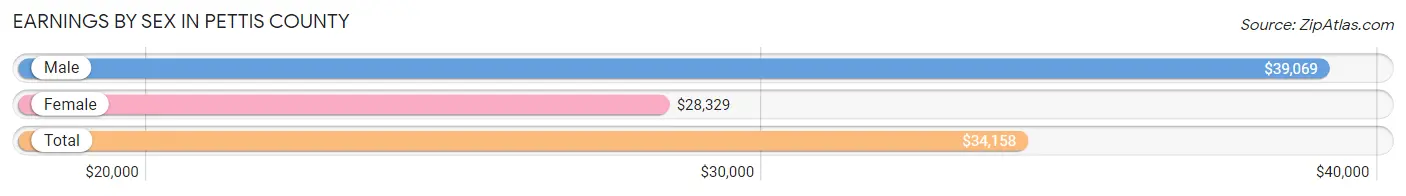
| Sex | Number | Average Earnings |
| Male | 11,886 (53.6%) | $39,069 |
| Female | 10,281 (46.4%) | $28,329 |
| Total | 22,167 (100.0%) | $34,158 |
Earnings by Sex by Income Bracket in Pettis County
The most common earnings brackets in Pettis County are $100,000+ for men (1,290 | 10.8%) and $30,000 to $34,999 for women (834 | 8.1%).
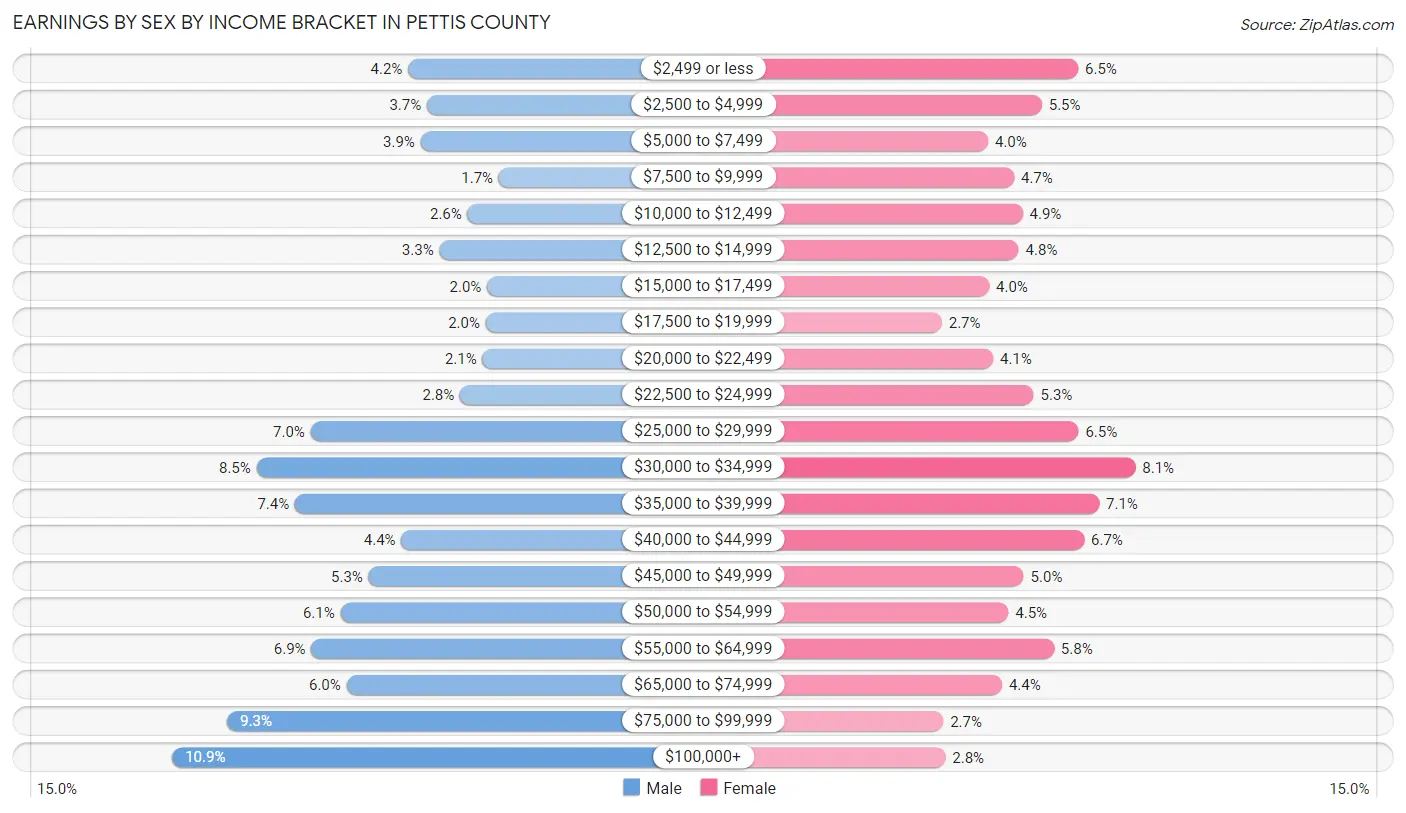
| Income | Male | Female |
| $2,499 or less | 501 (4.2%) | 668 (6.5%) |
| $2,500 to $4,999 | 438 (3.7%) | 563 (5.5%) |
| $5,000 to $7,499 | 460 (3.9%) | 408 (4.0%) |
| $7,500 to $9,999 | 198 (1.7%) | 483 (4.7%) |
| $10,000 to $12,499 | 303 (2.5%) | 508 (4.9%) |
| $12,500 to $14,999 | 397 (3.3%) | 497 (4.8%) |
| $15,000 to $17,499 | 238 (2.0%) | 411 (4.0%) |
| $17,500 to $19,999 | 242 (2.0%) | 274 (2.7%) |
| $20,000 to $22,499 | 253 (2.1%) | 423 (4.1%) |
| $22,500 to $24,999 | 328 (2.8%) | 540 (5.2%) |
| $25,000 to $29,999 | 827 (7.0%) | 669 (6.5%) |
| $30,000 to $34,999 | 1,008 (8.5%) | 834 (8.1%) |
| $35,000 to $39,999 | 880 (7.4%) | 729 (7.1%) |
| $40,000 to $44,999 | 524 (4.4%) | 686 (6.7%) |
| $45,000 to $49,999 | 634 (5.3%) | 511 (5.0%) |
| $50,000 to $54,999 | 727 (6.1%) | 467 (4.5%) |
| $55,000 to $64,999 | 825 (6.9%) | 598 (5.8%) |
| $65,000 to $74,999 | 707 (5.9%) | 448 (4.4%) |
| $75,000 to $99,999 | 1,106 (9.3%) | 279 (2.7%) |
| $100,000+ | 1,290 (10.8%) | 285 (2.8%) |
| Total | 11,886 (100.0%) | 10,281 (100.0%) |
Earnings by Sex by Educational Attainment in Pettis County
Average earnings in Pettis County are $45,558 for men and $33,206 for women, a difference of 27.1%. Men with an educational attainment of bachelor's degree enjoy the highest average annual earnings of $58,313, while those with less than high school education earn the least with $29,842. Women with an educational attainment of graduate degree earn the most with the average annual earnings of $50,369, while those with high school diploma education have the smallest earnings of $23,899.
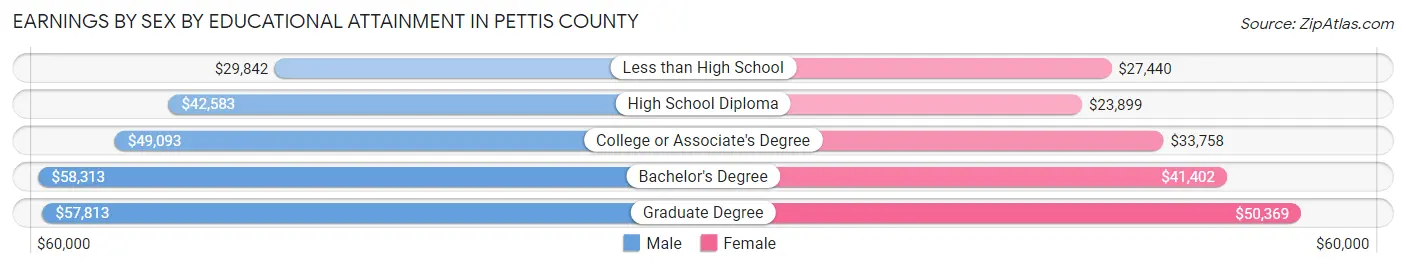
| Educational Attainment | Male Income | Female Income |
| Less than High School | $29,842 | $27,440 |
| High School Diploma | $42,583 | $23,899 |
| College or Associate's Degree | $49,093 | $33,758 |
| Bachelor's Degree | $58,313 | $41,402 |
| Graduate Degree | $57,813 | $50,369 |
| Total | $45,558 | $33,206 |
Family Income in Pettis County
Family Income Brackets in Pettis County
According to the Pettis County family income data, there are 2,681 families falling into the $50,000 to $74,999 income range, which is the most common income bracket and makes up 23.8% of all families. Conversely, the $10,000 to $14,999 income bracket is the least frequent group with only 203 families (1.8%) belonging to this category.
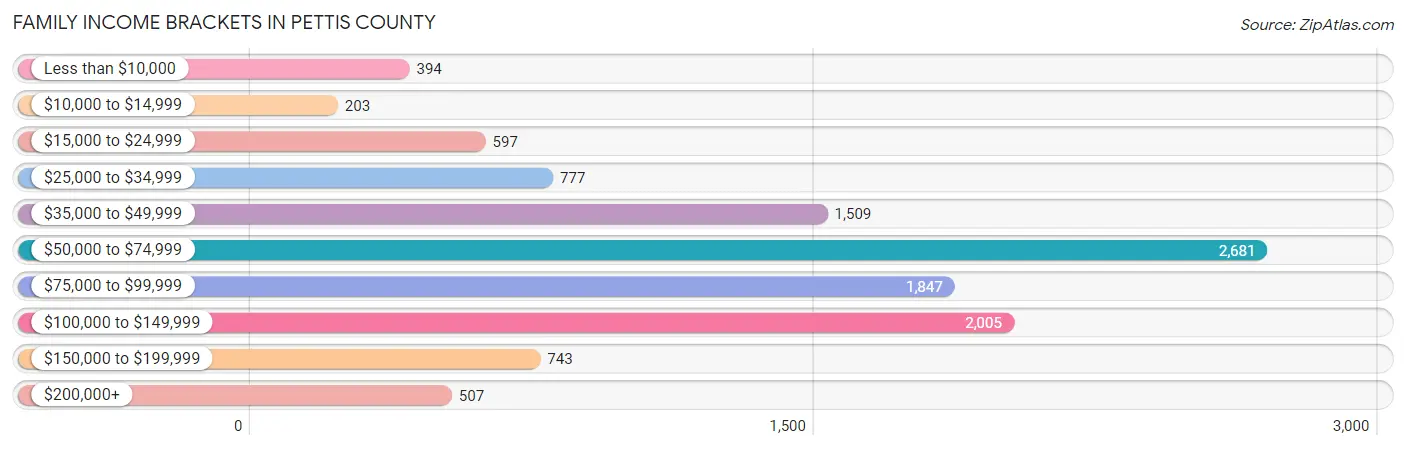
| Income Bracket | # Families | % Families |
| Less than $10,000 | 394 | 3.5% |
| $10,000 to $14,999 | 203 | 1.8% |
| $15,000 to $24,999 | 597 | 5.3% |
| $25,000 to $34,999 | 777 | 6.9% |
| $35,000 to $49,999 | 1,509 | 13.4% |
| $50,000 to $74,999 | 2,681 | 23.8% |
| $75,000 to $99,999 | 1,847 | 16.4% |
| $100,000 to $149,999 | 2,005 | 17.8% |
| $150,000 to $199,999 | 743 | 6.6% |
| $200,000+ | 507 | 4.5% |
Family Income by Famaliy Size in Pettis County
5-person families (834 | 7.4%) account for the highest median family income in Pettis County with $95,962 per family, while 2-person families (5,571 | 49.5%) have the highest median income of $31,138 per family member.
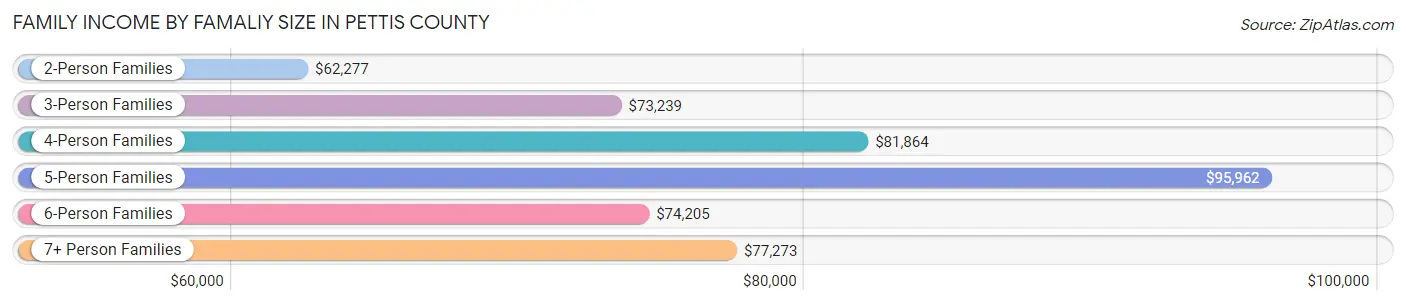
| Income Bracket | # Families | Median Income |
| 2-Person Families | 5,571 (49.5%) | $62,277 |
| 3-Person Families | 2,260 (20.1%) | $73,239 |
| 4-Person Families | 1,961 (17.4%) | $81,864 |
| 5-Person Families | 834 (7.4%) | $95,962 |
| 6-Person Families | 377 (3.4%) | $74,205 |
| 7+ Person Families | 260 (2.3%) | $77,273 |
| Total | 11,263 (100.0%) | $68,393 |
Family Income by Number of Earners in Pettis County
The median family income in Pettis County is $68,393, with families comprising 3+ earners (1,206) having the highest median family income of $117,000, while families with no earners (1,704) have the lowest median family income of $40,746, accounting for 10.7% and 15.1% of families, respectively.
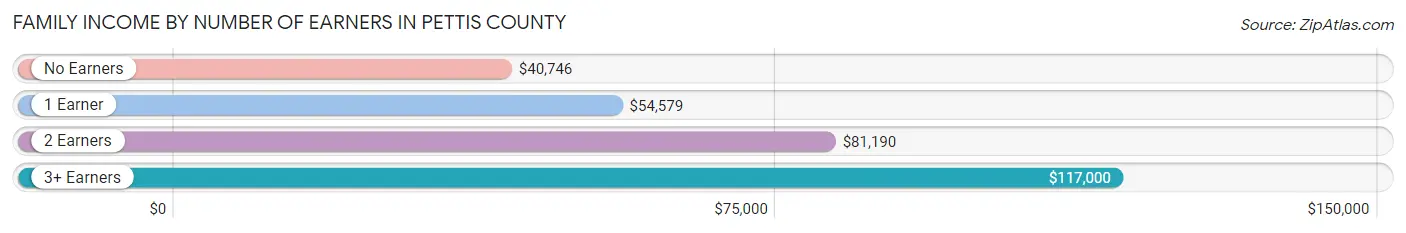
| Number of Earners | # Families | Median Income |
| No Earners | 1,704 (15.1%) | $40,746 |
| 1 Earner | 3,843 (34.1%) | $54,579 |
| 2 Earners | 4,510 (40.0%) | $81,190 |
| 3+ Earners | 1,206 (10.7%) | $117,000 |
| Total | 11,263 (100.0%) | $68,393 |
Household Income in Pettis County
Household Income Brackets in Pettis County
With 3,473 households falling in the category, the $50,000 to $74,999 income range is the most frequent in Pettis County, accounting for 20.8% of all households. In contrast, only 651 households (3.9%) fall into the $200,000+ income bracket, making it the least populous group.
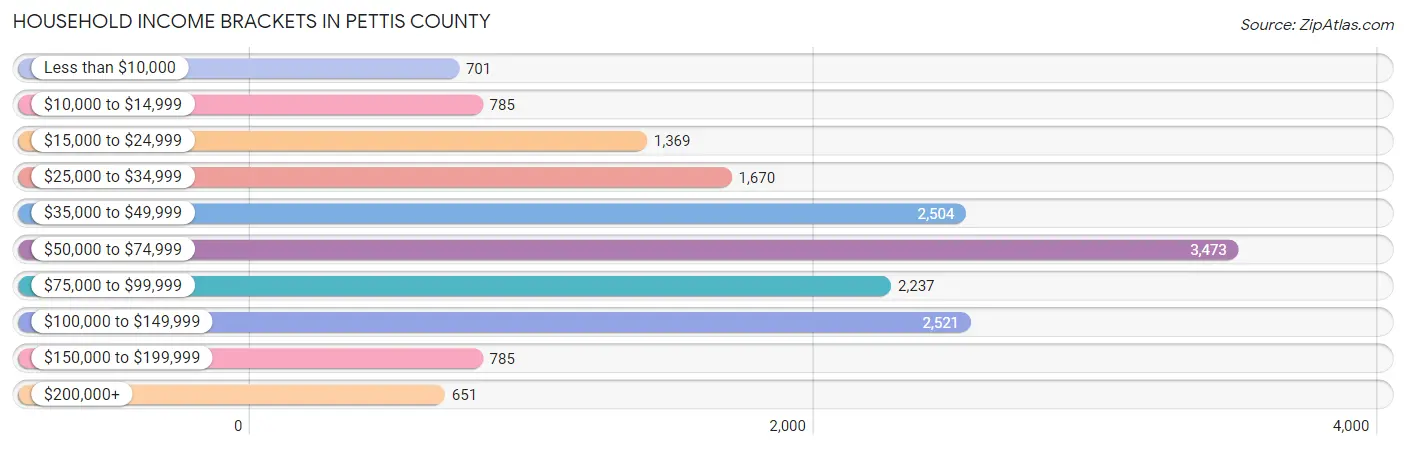
| Income Bracket | # Households | % Households |
| Less than $10,000 | 701 | 4.2% |
| $10,000 to $14,999 | 785 | 4.7% |
| $15,000 to $24,999 | 1,369 | 8.2% |
| $25,000 to $34,999 | 1,670 | 10.0% |
| $35,000 to $49,999 | 2,504 | 15.0% |
| $50,000 to $74,999 | 3,473 | 20.8% |
| $75,000 to $99,999 | 2,237 | 13.4% |
| $100,000 to $149,999 | 2,521 | 15.1% |
| $150,000 to $199,999 | 785 | 4.7% |
| $200,000+ | 651 | 3.9% |
Household Income by Householder Age in Pettis County
The median household income in Pettis County is $57,581, with the highest median household income of $67,644 found in the 25 to 44 years age bracket for the primary householder. A total of 5,428 households (32.5%) fall into this category. Meanwhile, the 15 to 24 years age bracket for the primary householder has the lowest median household income of $42,122, with 908 households (5.4%) in this group.
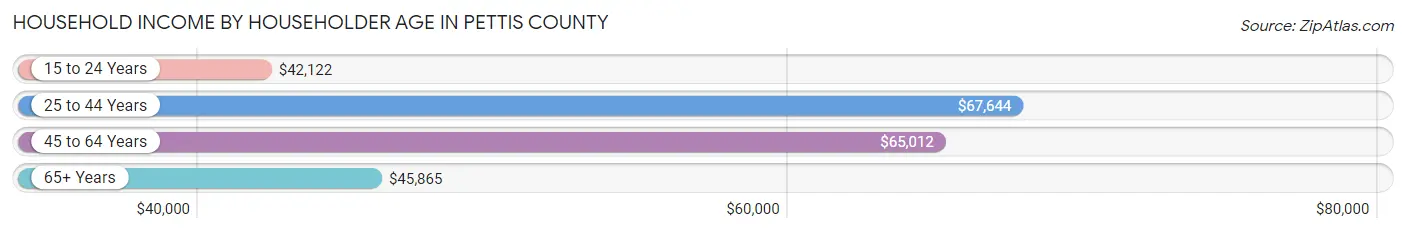
| Income Bracket | # Households | Median Income |
| 15 to 24 Years | 908 (5.4%) | $42,122 |
| 25 to 44 Years | 5,428 (32.5%) | $67,644 |
| 45 to 64 Years | 5,773 (34.6%) | $65,012 |
| 65+ Years | 4,587 (27.5%) | $45,865 |
| Total | 16,696 (100.0%) | $57,581 |
Poverty in Pettis County
Income Below Poverty by Sex and Age in Pettis County
With 12.9% poverty level for males and 16.7% for females among the residents of Pettis County, 12 to 14 year old males and 5 year old females are the most vulnerable to poverty, with 184 males (22.1%) and 81 females (42.0%) in their respective age groups living below the poverty level.
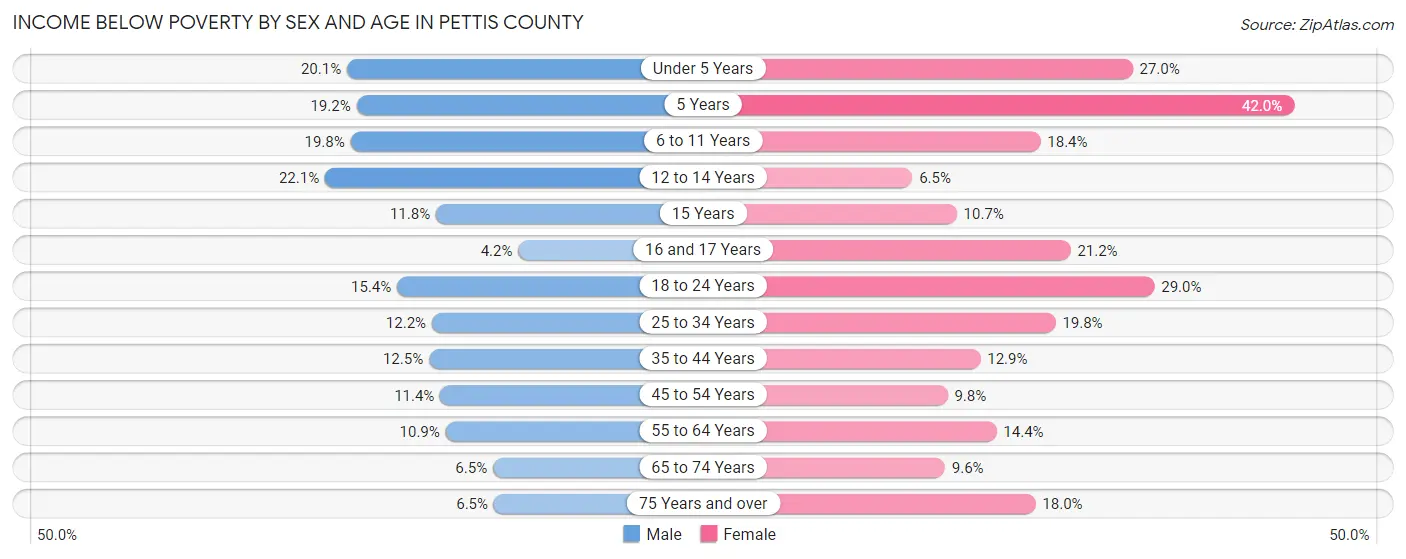
| Age Bracket | Male | Female |
| Under 5 Years | 314 (20.1%) | 355 (27.0%) |
| 5 Years | 77 (19.2%) | 81 (42.0%) |
| 6 to 11 Years | 377 (19.8%) | 329 (18.4%) |
| 12 to 14 Years | 184 (22.1%) | 56 (6.5%) |
| 15 Years | 39 (11.8%) | 21 (10.7%) |
| 16 and 17 Years | 25 (4.2%) | 129 (21.2%) |
| 18 to 24 Years | 279 (15.4%) | 533 (29.0%) |
| 25 to 34 Years | 324 (12.2%) | 528 (19.8%) |
| 35 to 44 Years | 344 (12.5%) | 334 (12.9%) |
| 45 to 54 Years | 275 (11.4%) | 232 (9.8%) |
| 55 to 64 Years | 313 (10.9%) | 397 (14.3%) |
| 65 to 74 Years | 132 (6.5%) | 208 (9.6%) |
| 75 Years and over | 77 (6.5%) | 311 (18.0%) |
| Total | 2,760 (12.9%) | 3,514 (16.7%) |
Income Above Poverty by Sex and Age in Pettis County
According to the poverty statistics in Pettis County, males aged 16 and 17 years and females aged 12 to 14 years are the age groups that are most secure financially, with 95.8% of males and 93.5% of females in these age groups living above the poverty line.
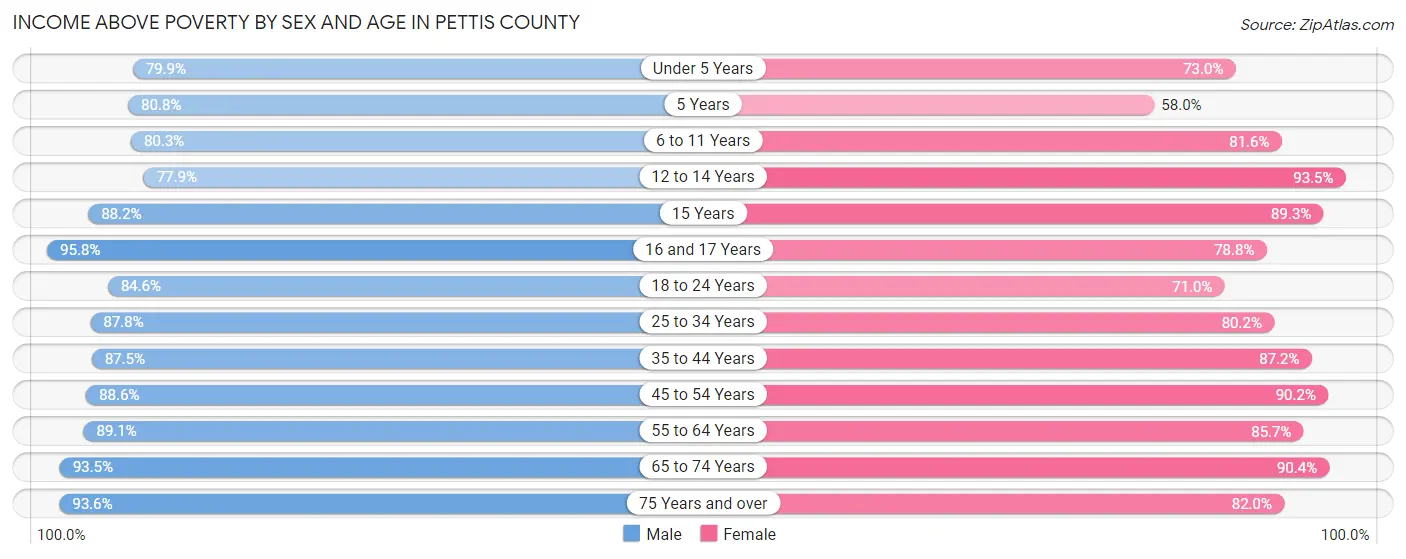
| Age Bracket | Male | Female |
| Under 5 Years | 1,250 (79.9%) | 961 (73.0%) |
| 5 Years | 324 (80.8%) | 112 (58.0%) |
| 6 to 11 Years | 1,532 (80.2%) | 1,456 (81.6%) |
| 12 to 14 Years | 648 (77.9%) | 800 (93.5%) |
| 15 Years | 291 (88.2%) | 176 (89.3%) |
| 16 and 17 Years | 573 (95.8%) | 479 (78.8%) |
| 18 to 24 Years | 1,529 (84.6%) | 1,305 (71.0%) |
| 25 to 34 Years | 2,332 (87.8%) | 2,135 (80.2%) |
| 35 to 44 Years | 2,414 (87.5%) | 2,266 (87.2%) |
| 45 to 54 Years | 2,132 (88.6%) | 2,133 (90.2%) |
| 55 to 64 Years | 2,550 (89.1%) | 2,370 (85.7%) |
| 65 to 74 Years | 1,888 (93.5%) | 1,967 (90.4%) |
| 75 Years and over | 1,117 (93.5%) | 1,420 (82.0%) |
| Total | 18,580 (87.1%) | 17,580 (83.3%) |
Income Below Poverty Among Married-Couple Families in Pettis County
The poverty statistics for married-couple families in Pettis County show that 6.3% or 538 of the total 8,511 families live below the poverty line. Families with 5 or more children have the highest poverty rate of 25.6%, comprising of 40 families. On the other hand, families with no children have the lowest poverty rate of 3.3%, which includes 158 families.
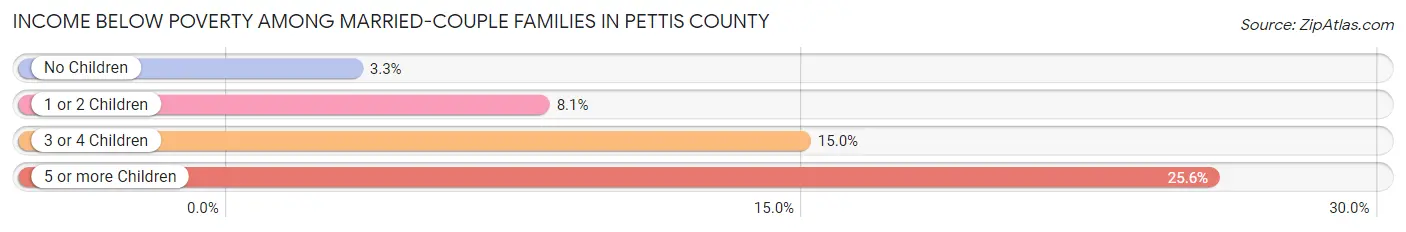
| Children | Above Poverty | Below Poverty |
| No Children | 4,693 (96.7%) | 158 (3.3%) |
| 1 or 2 Children | 2,482 (91.9%) | 220 (8.1%) |
| 3 or 4 Children | 682 (85.0%) | 120 (15.0%) |
| 5 or more Children | 116 (74.4%) | 40 (25.6%) |
| Total | 7,973 (93.7%) | 538 (6.3%) |
Income Below Poverty Among Single-Parent Households in Pettis County
According to the poverty data in Pettis County, 8.0% or 62 single-father households and 24.2% or 479 single-mother households are living below the poverty line. Among single-father households, those with no children have the highest poverty rate, with 40 households (13.3%) experiencing poverty. Likewise, among single-mother households, those with 5 or more children have the highest poverty rate, with 6 households (100.0%) falling below the poverty line.
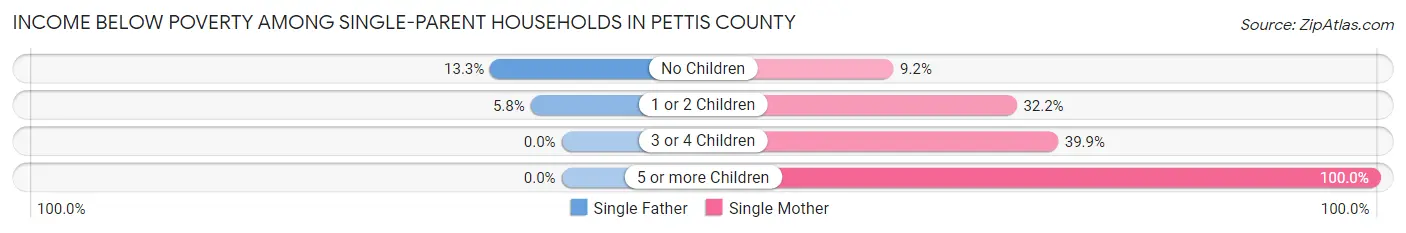
| Children | Single Father | Single Mother |
| No Children | 40 (13.3%) | 70 (9.2%) |
| 1 or 2 Children | 22 (5.8%) | 336 (32.2%) |
| 3 or 4 Children | 0 (0.0%) | 67 (39.9%) |
| 5 or more Children | 0 (0.0%) | 6 (100.0%) |
| Total | 62 (8.0%) | 479 (24.2%) |
Income Below Poverty Among Married-Couple vs Single-Parent Households in Pettis County
The poverty data for Pettis County shows that 538 of the married-couple family households (6.3%) and 541 of the single-parent households (19.7%) are living below the poverty level. Within the married-couple family households, those with 5 or more children have the highest poverty rate, with 40 households (25.6%) falling below the poverty line. Among the single-parent households, those with 5 or more children have the highest poverty rate, with 6 household (100.0%) living below poverty.
| Children | Married-Couple Families | Single-Parent Households |
| No Children | 158 (3.3%) | 110 (10.4%) |
| 1 or 2 Children | 220 (8.1%) | 358 (25.1%) |
| 3 or 4 Children | 120 (15.0%) | 67 (25.8%) |
| 5 or more Children | 40 (25.6%) | 6 (100.0%) |
| Total | 538 (6.3%) | 541 (19.7%) |
Employment Characteristics in Pettis County
Employment by Class of Employer in Pettis County
Among the 19,837 employed individuals in Pettis County, private company employees (13,329 | 67.2%), self-employed (not incorporated) (2,045 | 10.3%), and not-for-profit organizations (1,518 | 7.6%) make up the most common classes of employment.
| Employer Class | # Employees | % Employees |
| Private Company Employees | 13,329 | 67.2% |
| Self-Employed (Incorporated) | 653 | 3.3% |
| Self-Employed (Not Incorporated) | 2,045 | 10.3% |
| Not-for-profit Organizations | 1,518 | 7.6% |
| Local Government Employees | 1,091 | 5.5% |
| State Government Employees | 627 | 3.2% |
| Federal Government Employees | 552 | 2.8% |
| Unpaid Family Workers | 22 | 0.1% |
| Total | 19,837 | 100.0% |
Employment Status by Age in Pettis County
According to the labor force statistics for Pettis County, out of the total population over 16 years of age (33,562), 63.1% or 21,178 individuals are in the labor force, with 3.9% or 826 of them unemployed. The age group with the highest labor force participation rate is 25 to 29 years, with 86.5% or 2,364 individuals in the labor force. Within the labor force, the 20 to 24 years age range has the highest percentage of unemployed individuals, with 9.7% or 196 of them being unemployed.
| Age Bracket | In Labor Force | Unemployed |
| 16 to 19 Years | 1,359 (56.0%) | 99 (7.3%) |
| 20 to 24 Years | 2,020 (79.5%) | 196 (9.7%) |
| 25 to 29 Years | 2,364 (86.5%) | 71 (3.0%) |
| 30 to 34 Years | 2,258 (86.1%) | 154 (6.8%) |
| 35 to 44 Years | 4,650 (86.1%) | 65 (1.4%) |
| 45 to 54 Years | 3,794 (79.0%) | 129 (3.4%) |
| 55 to 59 Years | 1,718 (68.3%) | 62 (3.6%) |
| 60 to 64 Years | 1,644 (51.5%) | 16 (1.0%) |
| 65 to 74 Years | 1,198 (28.2%) | 17 (1.4%) |
| 75 Years and over | 169 (5.5%) | 10 (6.0%) |
| Total | 21,178 (63.1%) | 826 (3.9%) |
Employment Status by Educational Attainment in Pettis County
According to labor force statistics for Pettis County, 77.3% of individuals (16,441) out of the total population between 25 and 64 years of age (21,269) are in the labor force, with 3.0% or 493 of them being unemployed. The group with the highest labor force participation rate are those with the educational attainment of bachelor's degree or higher, with 88.4% or 3,559 individuals in the labor force. Within the labor force, individuals with high school diploma education have the highest percentage of unemployment, with 5.0% or 256 of them being unemployed.
| Educational Attainment | In Labor Force | Unemployed |
| Less than High School | 1,708 (63.4%) | 81 (3.0%) |
| High School Diploma | 5,126 (71.9%) | 356 (5.0%) |
| College / Associate Degree | 6,032 (81.3%) | 200 (2.7%) |
| Bachelor's Degree or higher | 3,559 (88.4%) | 32 (0.8%) |
| Total | 16,441 (77.3%) | 638 (3.0%) |
Employment Occupations by Sex in Pettis County
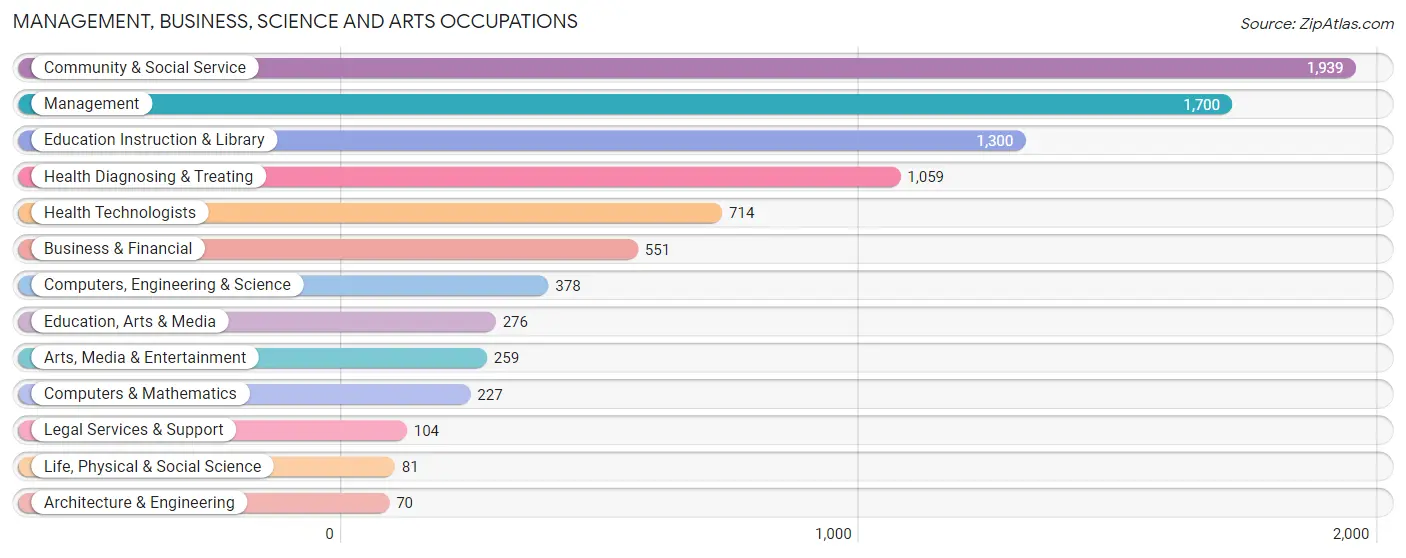
Management, Business, Science and Arts Occupations
The most common Management, Business, Science and Arts occupations in Pettis County are Community & Social Service (1,939 | 9.6%), Management (1,700 | 8.4%), Education Instruction & Library (1,300 | 6.5%), Health Diagnosing & Treating (1,059 | 5.2%), and Health Technologists (714 | 3.5%).
Management, Business, Science and Arts Occupations by Sex
Within the Management, Business, Science and Arts occupations in Pettis County, the most male-oriented occupations are Architecture & Engineering (100.0%), Legal Services & Support (94.2%), and Management (67.1%), while the most female-oriented occupations are Health Diagnosing & Treating (86.2%), Health Technologists (83.8%), and Education Instruction & Library (79.4%).
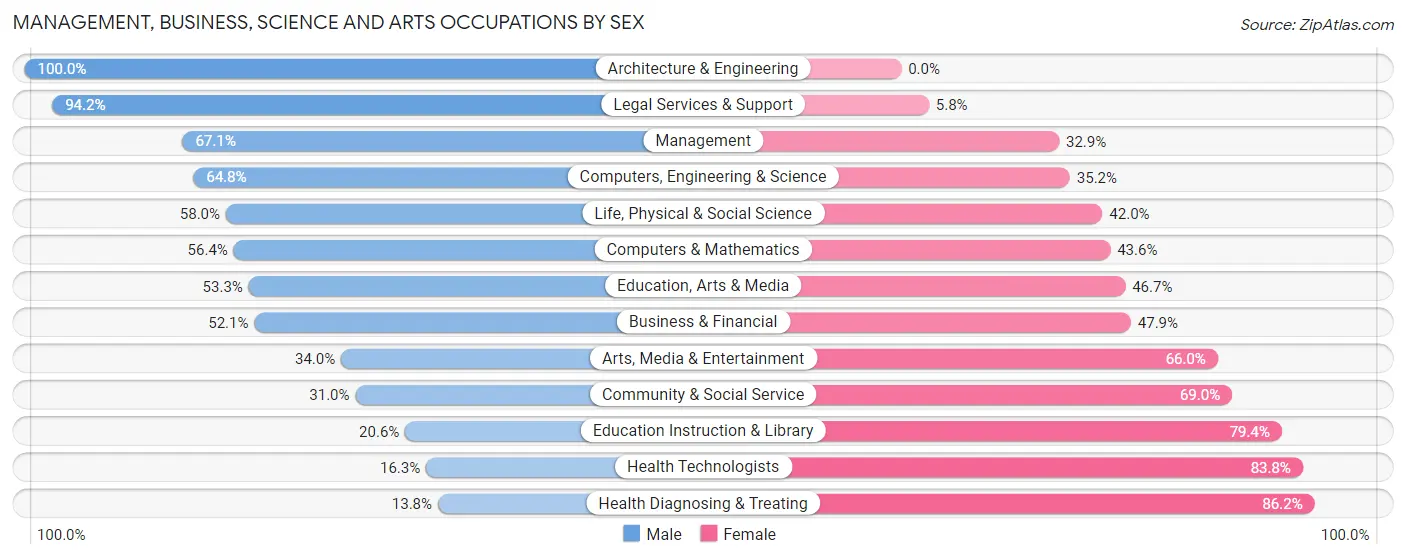
| Occupation | Male | Female |
| Management | 1,140 (67.1%) | 560 (32.9%) |
| Business & Financial | 287 (52.1%) | 264 (47.9%) |
| Computers, Engineering & Science | 245 (64.8%) | 133 (35.2%) |
| Computers & Mathematics | 128 (56.4%) | 99 (43.6%) |
| Architecture & Engineering | 70 (100.0%) | 0 (0.0%) |
| Life, Physical & Social Science | 47 (58.0%) | 34 (42.0%) |
| Community & Social Service | 601 (31.0%) | 1,338 (69.0%) |
| Education, Arts & Media | 147 (53.3%) | 129 (46.7%) |
| Legal Services & Support | 98 (94.2%) | 6 (5.8%) |
| Education Instruction & Library | 268 (20.6%) | 1,032 (79.4%) |
| Arts, Media & Entertainment | 88 (34.0%) | 171 (66.0%) |
| Health Diagnosing & Treating | 146 (13.8%) | 913 (86.2%) |
| Health Technologists | 116 (16.3%) | 598 (83.8%) |
| Total (Category) | 2,419 (43.0%) | 3,208 (57.0%) |
| Total (Overall) | 11,014 (54.6%) | 9,153 (45.4%) |
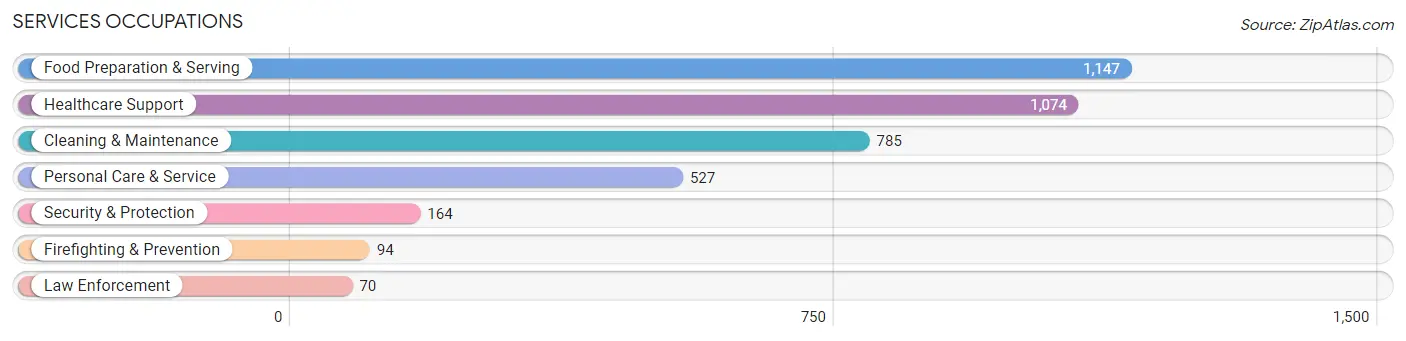
Services Occupations
The most common Services occupations in Pettis County are Food Preparation & Serving (1,147 | 5.7%), Healthcare Support (1,074 | 5.3%), Cleaning & Maintenance (785 | 3.9%), Personal Care & Service (527 | 2.6%), and Security & Protection (164 | 0.8%).
Services Occupations by Sex
Within the Services occupations in Pettis County, the most male-oriented occupations are Cleaning & Maintenance (76.8%), Law Enforcement (60.0%), and Security & Protection (56.1%), while the most female-oriented occupations are Healthcare Support (88.3%), Personal Care & Service (86.5%), and Food Preparation & Serving (53.6%).
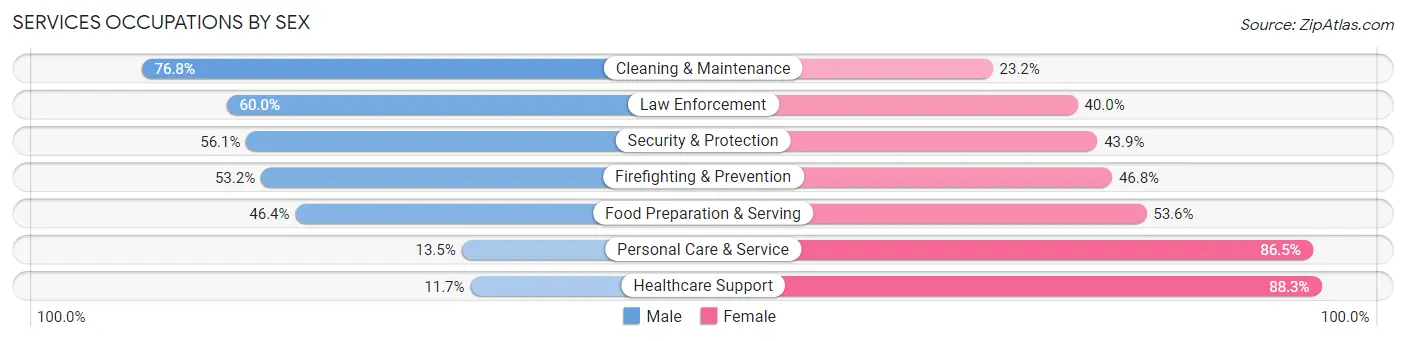
| Occupation | Male | Female |
| Healthcare Support | 126 (11.7%) | 948 (88.3%) |
| Security & Protection | 92 (56.1%) | 72 (43.9%) |
| Firefighting & Prevention | 50 (53.2%) | 44 (46.8%) |
| Law Enforcement | 42 (60.0%) | 28 (40.0%) |
| Food Preparation & Serving | 532 (46.4%) | 615 (53.6%) |
| Cleaning & Maintenance | 603 (76.8%) | 182 (23.2%) |
| Personal Care & Service | 71 (13.5%) | 456 (86.5%) |
| Total (Category) | 1,424 (38.5%) | 2,273 (61.5%) |
| Total (Overall) | 11,014 (54.6%) | 9,153 (45.4%) |
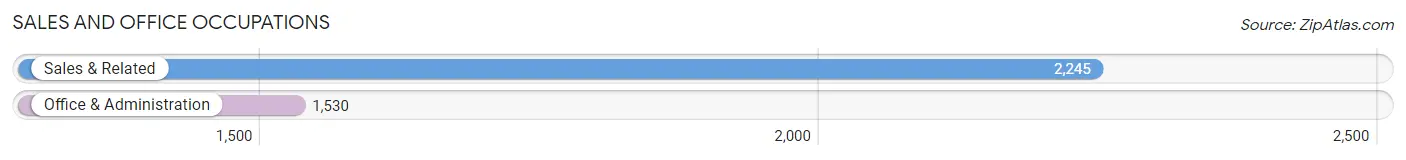
Sales and Office Occupations
The most common Sales and Office occupations in Pettis County are Sales & Related (2,245 | 11.1%), and Office & Administration (1,530 | 7.6%).
Sales and Office Occupations by Sex
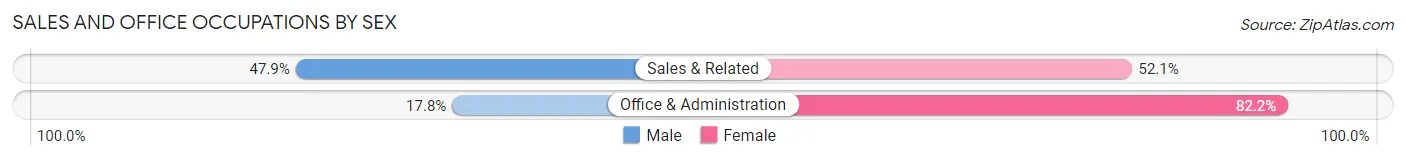
| Occupation | Male | Female |
| Sales & Related | 1,075 (47.9%) | 1,170 (52.1%) |
| Office & Administration | 272 (17.8%) | 1,258 (82.2%) |
| Total (Category) | 1,347 (35.7%) | 2,428 (64.3%) |
| Total (Overall) | 11,014 (54.6%) | 9,153 (45.4%) |
Natural Resources, Construction and Maintenance Occupations
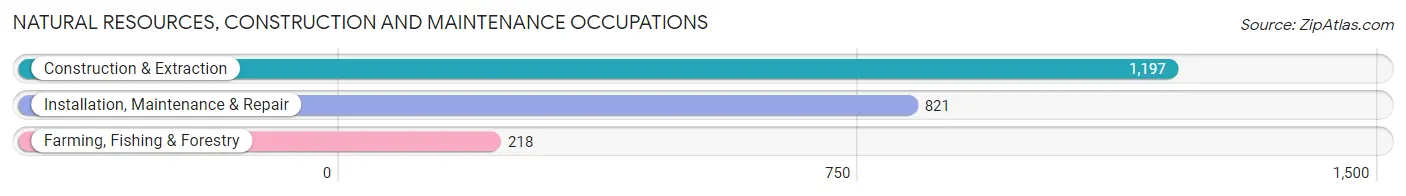
The most common Natural Resources, Construction and Maintenance occupations in Pettis County are Construction & Extraction (1,197 | 5.9%), Installation, Maintenance & Repair (821 | 4.1%), and Farming, Fishing & Forestry (218 | 1.1%).
Natural Resources, Construction and Maintenance Occupations by Sex
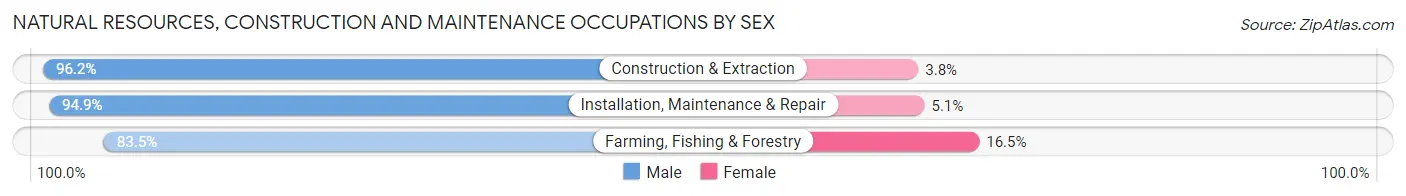
| Occupation | Male | Female |
| Farming, Fishing & Forestry | 182 (83.5%) | 36 (16.5%) |
| Construction & Extraction | 1,151 (96.2%) | 46 (3.8%) |
| Installation, Maintenance & Repair | 779 (94.9%) | 42 (5.1%) |
| Total (Category) | 2,112 (94.5%) | 124 (5.6%) |
| Total (Overall) | 11,014 (54.6%) | 9,153 (45.4%) |
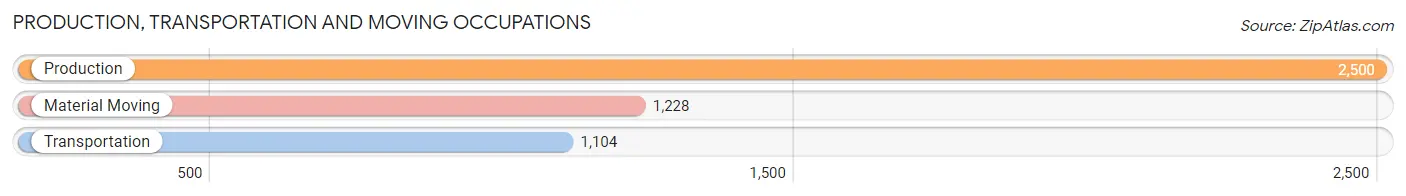
Production, Transportation and Moving Occupations
The most common Production, Transportation and Moving occupations in Pettis County are Production (2,500 | 12.4%), Material Moving (1,228 | 6.1%), and Transportation (1,104 | 5.5%).
Production, Transportation and Moving Occupations by Sex
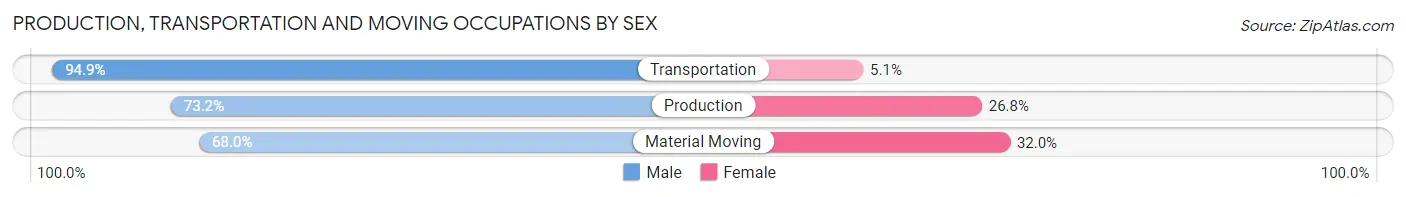
| Occupation | Male | Female |
| Production | 1,829 (73.2%) | 671 (26.8%) |
| Transportation | 1,048 (94.9%) | 56 (5.1%) |
| Material Moving | 835 (68.0%) | 393 (32.0%) |
| Total (Category) | 3,712 (76.8%) | 1,120 (23.2%) |
| Total (Overall) | 11,014 (54.6%) | 9,153 (45.4%) |
Employment Industries by Sex in Pettis County
Employment Industries in Pettis County
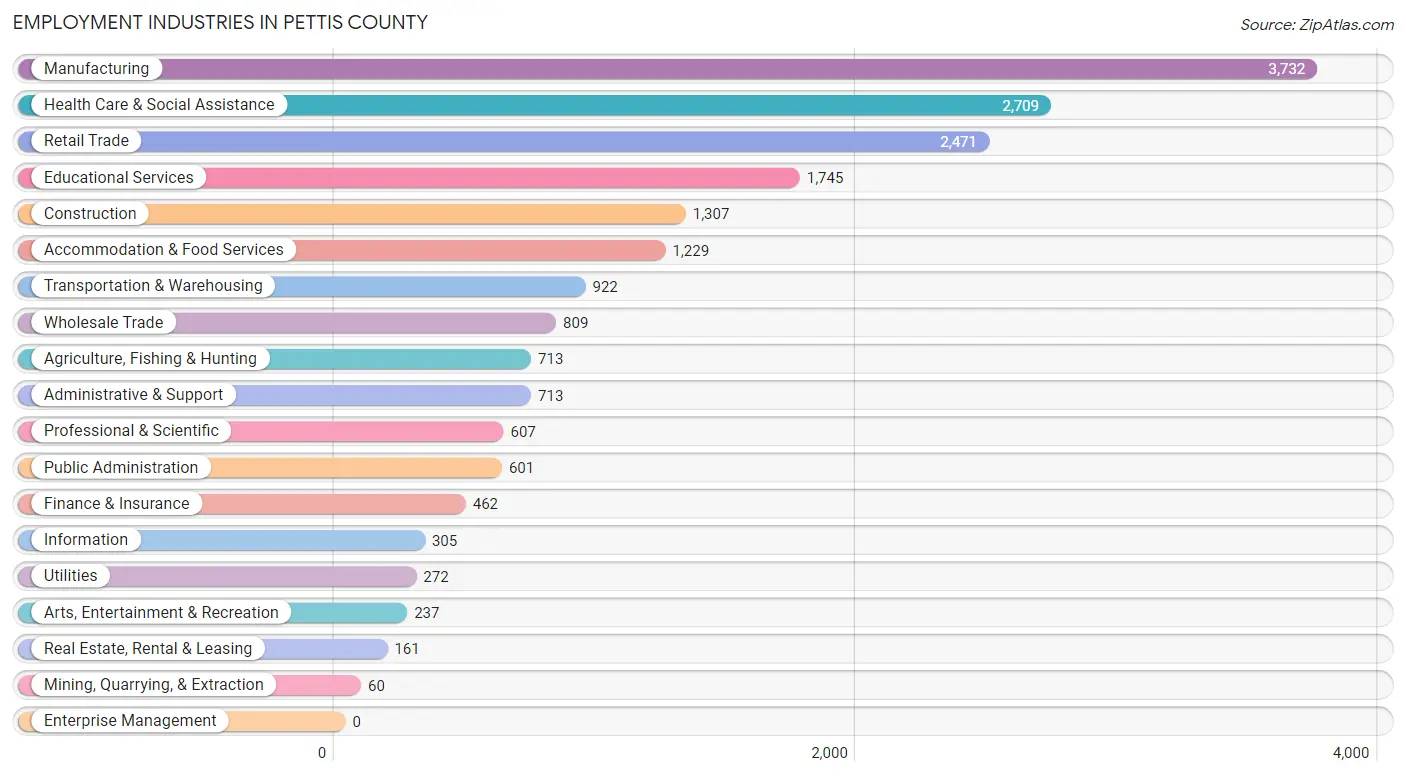
The major employment industries in Pettis County include Manufacturing (3,732 | 18.5%), Health Care & Social Assistance (2,709 | 13.4%), Retail Trade (2,471 | 12.2%), Educational Services (1,745 | 8.6%), and Construction (1,307 | 6.5%).
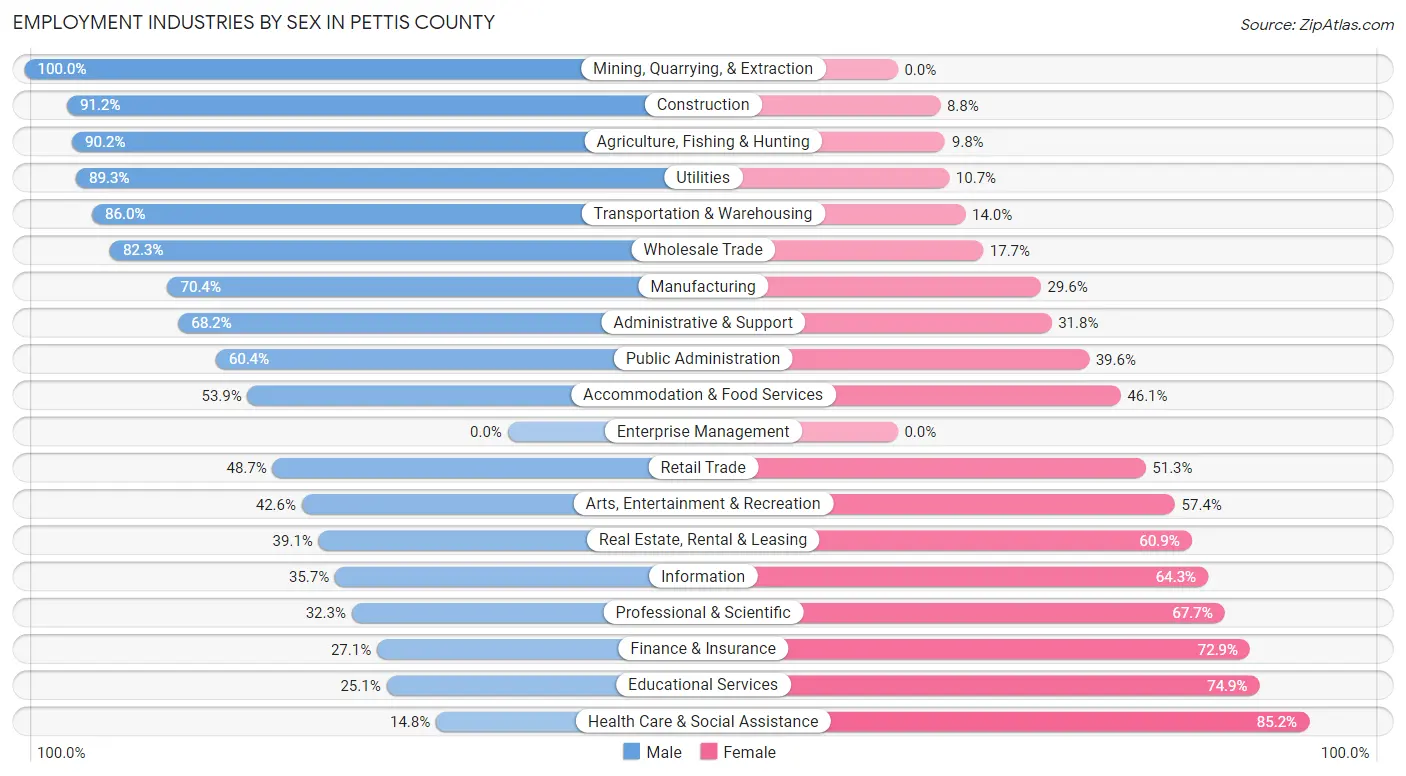
Employment Industries by Sex in Pettis County
The Pettis County industries that see more men than women are Mining, Quarrying, & Extraction (100.0%), Construction (91.2%), and Agriculture, Fishing & Hunting (90.2%), whereas the industries that tend to have a higher number of women are Health Care & Social Assistance (85.2%), Educational Services (74.9%), and Finance & Insurance (72.9%).
| Industry | Male | Female |
| Agriculture, Fishing & Hunting | 643 (90.2%) | 70 (9.8%) |
| Mining, Quarrying, & Extraction | 60 (100.0%) | 0 (0.0%) |
| Construction | 1,192 (91.2%) | 115 (8.8%) |
| Manufacturing | 2,627 (70.4%) | 1,105 (29.6%) |
| Wholesale Trade | 666 (82.3%) | 143 (17.7%) |
| Retail Trade | 1,203 (48.7%) | 1,268 (51.3%) |
| Transportation & Warehousing | 793 (86.0%) | 129 (14.0%) |
| Utilities | 243 (89.3%) | 29 (10.7%) |
| Information | 109 (35.7%) | 196 (64.3%) |
| Finance & Insurance | 125 (27.1%) | 337 (72.9%) |
| Real Estate, Rental & Leasing | 63 (39.1%) | 98 (60.9%) |
| Professional & Scientific | 196 (32.3%) | 411 (67.7%) |
| Enterprise Management | 0 (0.0%) | 0 (0.0%) |
| Administrative & Support | 486 (68.2%) | 227 (31.8%) |
| Educational Services | 438 (25.1%) | 1,307 (74.9%) |
| Health Care & Social Assistance | 402 (14.8%) | 2,307 (85.2%) |
| Arts, Entertainment & Recreation | 101 (42.6%) | 136 (57.4%) |
| Accommodation & Food Services | 662 (53.9%) | 567 (46.1%) |
| Public Administration | 363 (60.4%) | 238 (39.6%) |
| Total | 11,014 (54.6%) | 9,153 (45.4%) |
Education in Pettis County
School Enrollment in Pettis County
The most common levels of schooling among the 9,982 students in Pettis County are elementary school (2,420 | 24.2%), middle school (2,360 | 23.6%), and high school (2,208 | 22.1%).
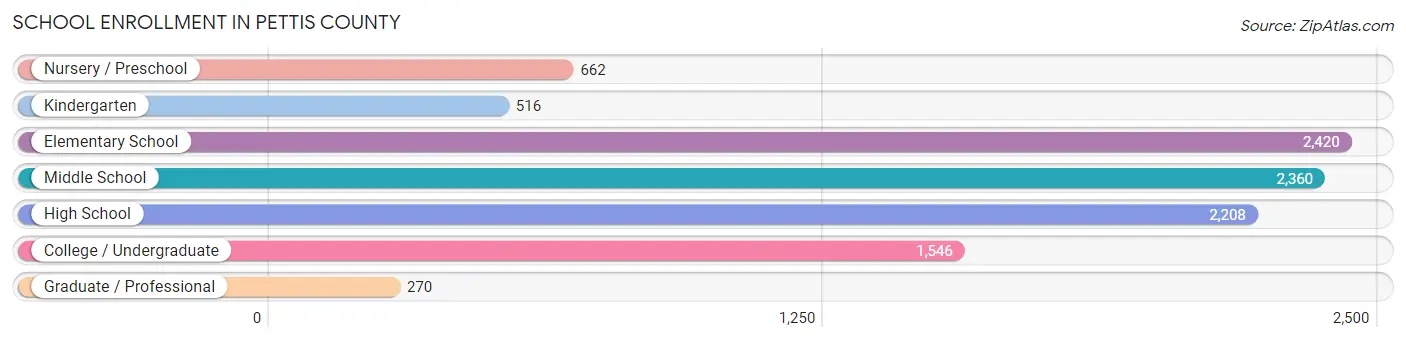
| School Level | # Students | % Students |
| Nursery / Preschool | 662 | 6.6% |
| Kindergarten | 516 | 5.2% |
| Elementary School | 2,420 | 24.2% |
| Middle School | 2,360 | 23.6% |
| High School | 2,208 | 22.1% |
| College / Undergraduate | 1,546 | 15.5% |
| Graduate / Professional | 270 | 2.7% |
| Total | 9,982 | 100.0% |
School Enrollment by Age by Funding Source in Pettis County
Out of a total of 9,982 students who are enrolled in schools in Pettis County, 1,477 (14.8%) attend a private institution, while the remaining 8,505 (85.2%) are enrolled in public schools. The age group of 3 to 4 year olds has the highest likelihood of being enrolled in private schools, with 120 (26.9% in the age bracket) enrolled. Conversely, the age group of 18 to 19 year olds has the lowest likelihood of being enrolled in a private school, with 905 (95.5% in the age bracket) attending a public institution.
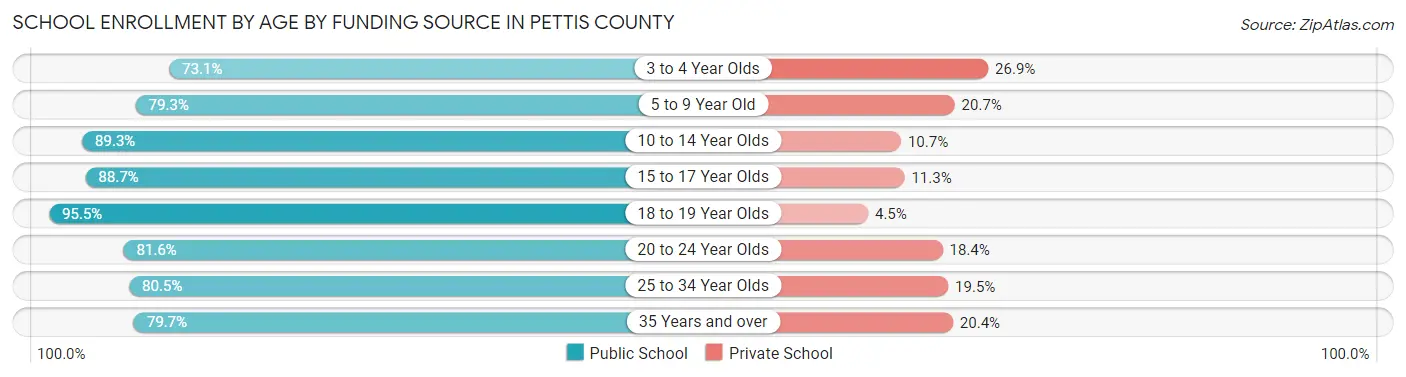
| Age Bracket | Public School | Private School |
| 3 to 4 Year Olds | 326 (73.1%) | 120 (26.9%) |
| 5 to 9 Year Old | 2,176 (79.3%) | 567 (20.7%) |
| 10 to 14 Year Olds | 2,551 (89.3%) | 305 (10.7%) |
| 15 to 17 Year Olds | 1,456 (88.7%) | 186 (11.3%) |
| 18 to 19 Year Olds | 905 (95.5%) | 43 (4.5%) |
| 20 to 24 Year Olds | 443 (81.6%) | 100 (18.4%) |
| 25 to 34 Year Olds | 327 (80.5%) | 79 (19.5%) |
| 35 Years and over | 317 (79.6%) | 81 (20.3%) |
| Total | 8,505 (85.2%) | 1,477 (14.8%) |
Educational Attainment by Field of Study in Pettis County
Education (1,503 | 26.0%), business (902 | 15.6%), science & technology (697 | 12.0%), bio, nature & agricultural (579 | 10.0%), and arts & humanities (463 | 8.0%) are the most common fields of study among 5,784 individuals in Pettis County who have obtained a bachelor's degree or higher.
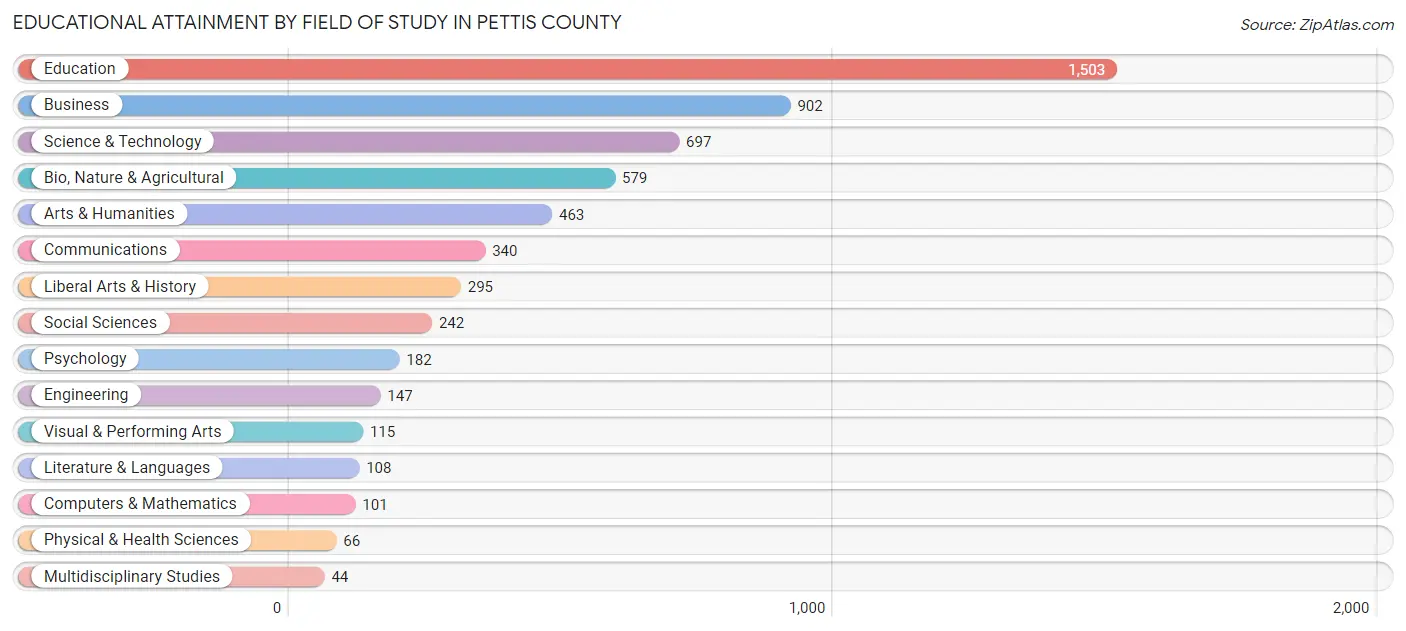
| Field of Study | # Graduates | % Graduates |
| Computers & Mathematics | 101 | 1.8% |
| Bio, Nature & Agricultural | 579 | 10.0% |
| Physical & Health Sciences | 66 | 1.1% |
| Psychology | 182 | 3.2% |
| Social Sciences | 242 | 4.2% |
| Engineering | 147 | 2.5% |
| Multidisciplinary Studies | 44 | 0.8% |
| Science & Technology | 697 | 12.0% |
| Business | 902 | 15.6% |
| Education | 1,503 | 26.0% |
| Literature & Languages | 108 | 1.9% |
| Liberal Arts & History | 295 | 5.1% |
| Visual & Performing Arts | 115 | 2.0% |
| Communications | 340 | 5.9% |
| Arts & Humanities | 463 | 8.0% |
| Total | 5,784 | 100.0% |
Transportation & Commute in Pettis County
Vehicle Availability by Sex in Pettis County
The most prevalent vehicle ownership categories in Pettis County are males with 2 vehicles (4,293, accounting for 40.1%) and females with 2 vehicles (3,752, making up 47.3%).
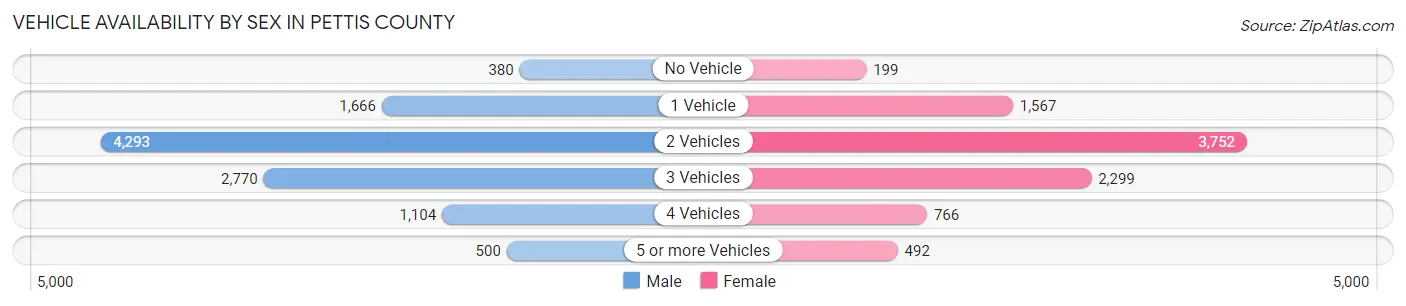
| Vehicles Available | Male | Female |
| No Vehicle | 380 (3.5%) | 199 (2.2%) |
| 1 Vehicle | 1,666 (15.5%) | 1,567 (17.3%) |
| 2 Vehicles | 4,293 (40.1%) | 3,752 (41.3%) |
| 3 Vehicles | 2,770 (25.9%) | 2,299 (25.3%) |
| 4 Vehicles | 1,104 (10.3%) | 766 (8.4%) |
| 5 or more Vehicles | 500 (4.7%) | 492 (5.4%) |
| Total | 10,713 (100.0%) | 9,075 (100.0%) |
Commute Time in Pettis County
The most frequently occuring commute durations in Pettis County are 15 to 19 minutes (3,971 commuters, 21.4%), 5 to 9 minutes (3,746 commuters, 20.2%), and 10 to 14 minutes (3,644 commuters, 19.6%).
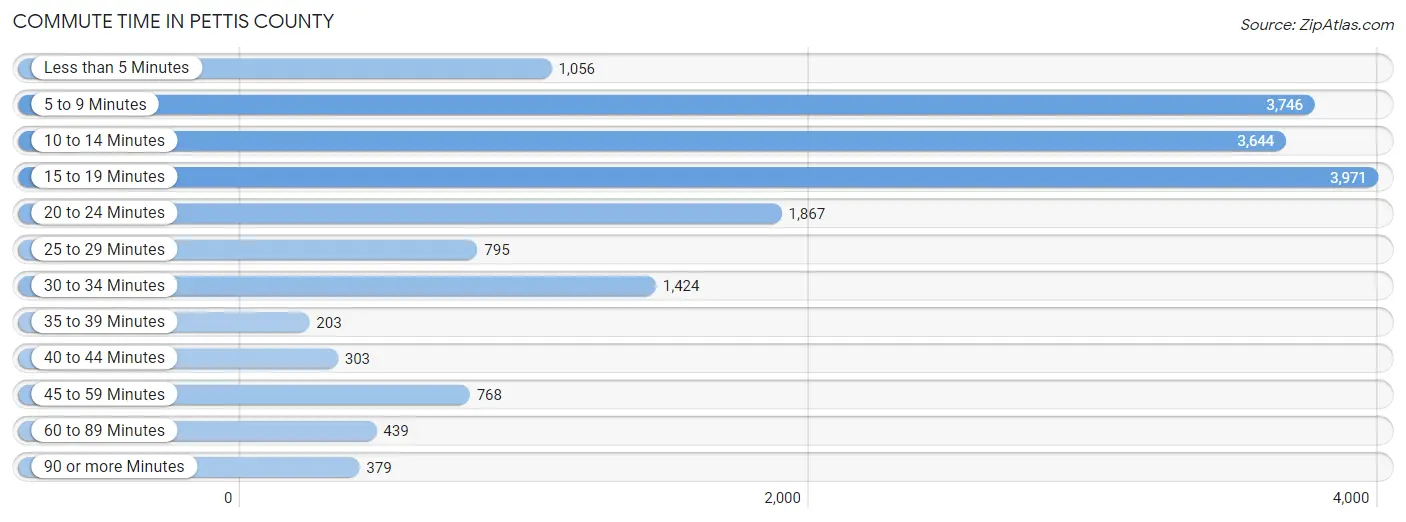
| Commute Time | # Commuters | % Commuters |
| Less than 5 Minutes | 1,056 | 5.7% |
| 5 to 9 Minutes | 3,746 | 20.2% |
| 10 to 14 Minutes | 3,644 | 19.6% |
| 15 to 19 Minutes | 3,971 | 21.4% |
| 20 to 24 Minutes | 1,867 | 10.0% |
| 25 to 29 Minutes | 795 | 4.3% |
| 30 to 34 Minutes | 1,424 | 7.7% |
| 35 to 39 Minutes | 203 | 1.1% |
| 40 to 44 Minutes | 303 | 1.6% |
| 45 to 59 Minutes | 768 | 4.1% |
| 60 to 89 Minutes | 439 | 2.4% |
| 90 or more Minutes | 379 | 2.0% |
Commute Time by Sex in Pettis County
The most common commute times in Pettis County are 15 to 19 minutes (2,302 commuters, 22.2%) for males and 10 to 14 minutes (1,855 commuters, 22.5%) for females.
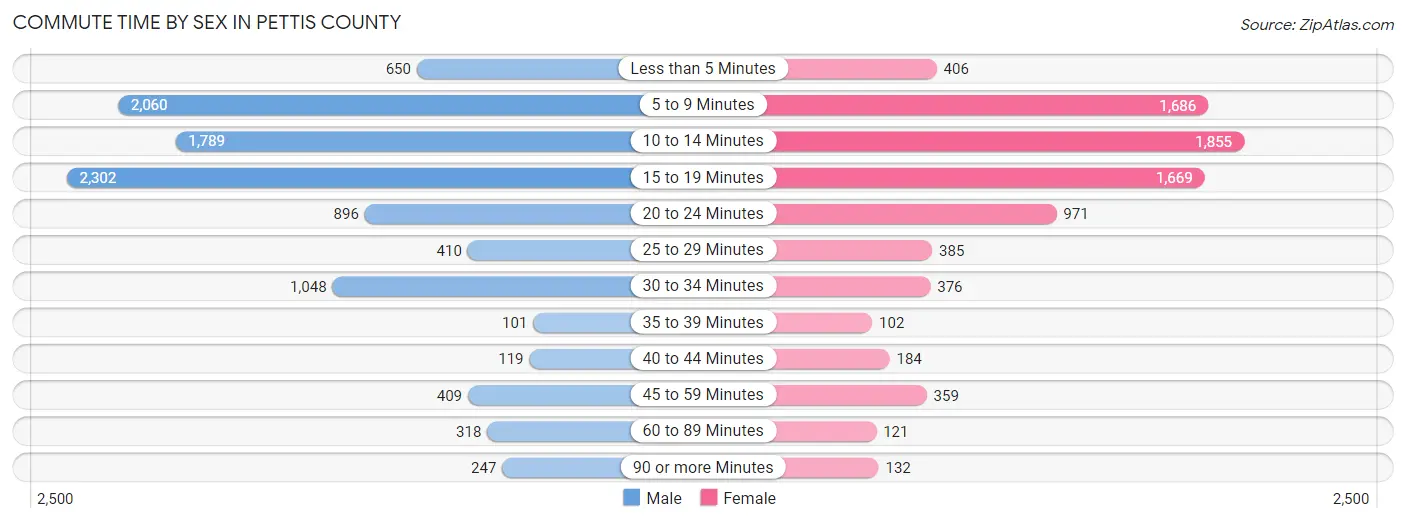
| Commute Time | Male | Female |
| Less than 5 Minutes | 650 (6.3%) | 406 (4.9%) |
| 5 to 9 Minutes | 2,060 (19.9%) | 1,686 (20.4%) |
| 10 to 14 Minutes | 1,789 (17.3%) | 1,855 (22.5%) |
| 15 to 19 Minutes | 2,302 (22.2%) | 1,669 (20.2%) |
| 20 to 24 Minutes | 896 (8.7%) | 971 (11.8%) |
| 25 to 29 Minutes | 410 (4.0%) | 385 (4.7%) |
| 30 to 34 Minutes | 1,048 (10.1%) | 376 (4.6%) |
| 35 to 39 Minutes | 101 (1.0%) | 102 (1.2%) |
| 40 to 44 Minutes | 119 (1.1%) | 184 (2.2%) |
| 45 to 59 Minutes | 409 (4.0%) | 359 (4.3%) |
| 60 to 89 Minutes | 318 (3.1%) | 121 (1.5%) |
| 90 or more Minutes | 247 (2.4%) | 132 (1.6%) |
Time of Departure to Work by Sex in Pettis County
The most frequent times of departure to work in Pettis County are 7:00 AM to 7:29 AM (1,397, 13.5%) for males and 7:00 AM to 7:29 AM (1,266, 15.3%) for females.
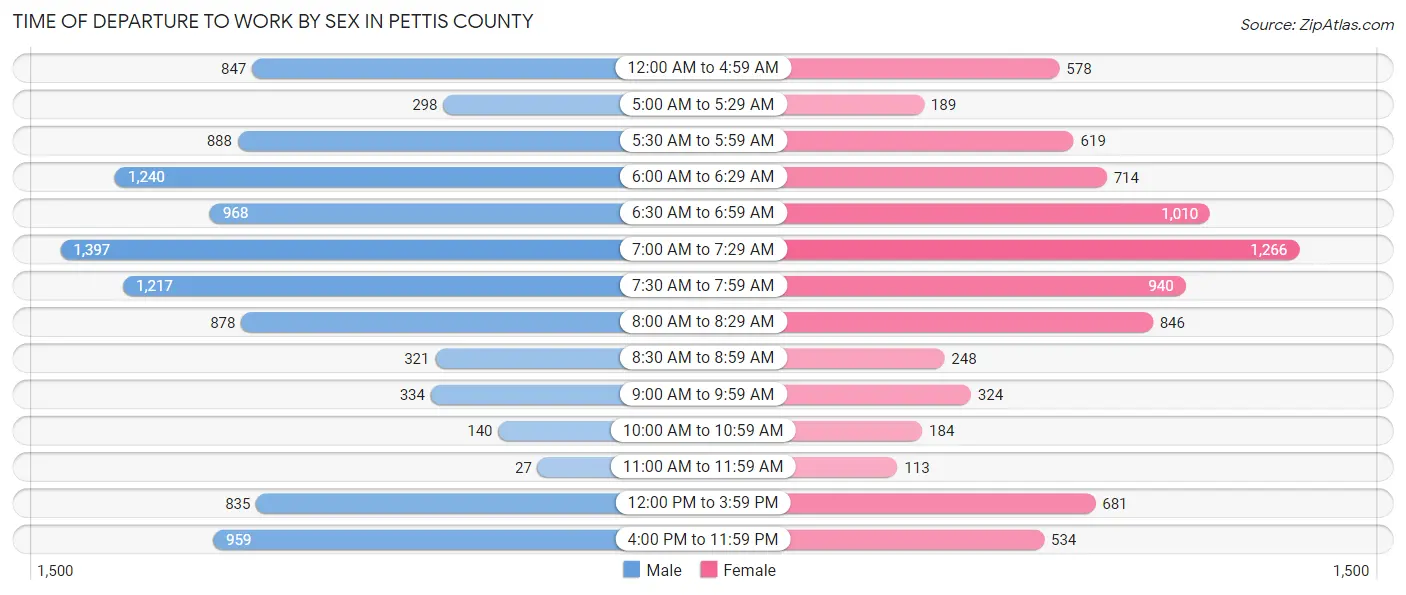
| Time of Departure | Male | Female |
| 12:00 AM to 4:59 AM | 847 (8.2%) | 578 (7.0%) |
| 5:00 AM to 5:29 AM | 298 (2.9%) | 189 (2.3%) |
| 5:30 AM to 5:59 AM | 888 (8.6%) | 619 (7.5%) |
| 6:00 AM to 6:29 AM | 1,240 (12.0%) | 714 (8.7%) |
| 6:30 AM to 6:59 AM | 968 (9.3%) | 1,010 (12.2%) |
| 7:00 AM to 7:29 AM | 1,397 (13.5%) | 1,266 (15.3%) |
| 7:30 AM to 7:59 AM | 1,217 (11.8%) | 940 (11.4%) |
| 8:00 AM to 8:29 AM | 878 (8.5%) | 846 (10.3%) |
| 8:30 AM to 8:59 AM | 321 (3.1%) | 248 (3.0%) |
| 9:00 AM to 9:59 AM | 334 (3.2%) | 324 (3.9%) |
| 10:00 AM to 10:59 AM | 140 (1.3%) | 184 (2.2%) |
| 11:00 AM to 11:59 AM | 27 (0.3%) | 113 (1.4%) |
| 12:00 PM to 3:59 PM | 835 (8.1%) | 681 (8.3%) |
| 4:00 PM to 11:59 PM | 959 (9.3%) | 534 (6.5%) |
| Total | 10,349 (100.0%) | 8,246 (100.0%) |
Housing Occupancy in Pettis County
Occupancy by Ownership in Pettis County
Of the total 16,696 dwellings in Pettis County, owner-occupied units account for 11,684 (70.0%), while renter-occupied units make up 5,012 (30.0%).
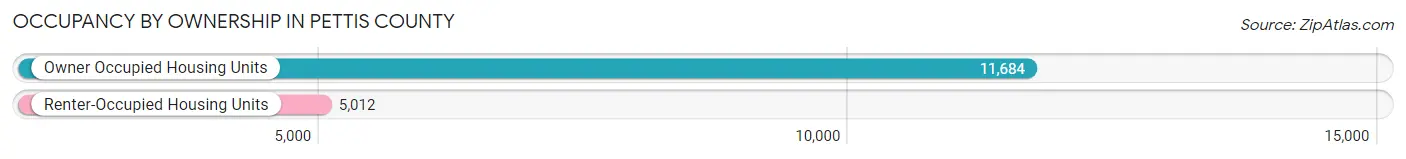
| Occupancy | # Housing Units | % Housing Units |
| Owner Occupied Housing Units | 11,684 | 70.0% |
| Renter-Occupied Housing Units | 5,012 | 30.0% |
| Total Occupied Housing Units | 16,696 | 100.0% |
Occupancy by Household Size in Pettis County
| Household Size | # Housing Units | % Housing Units |
| 1-Person Household | 4,482 | 26.8% |
| 2-Person Household | 5,999 | 35.9% |
| 3-Person Household | 2,276 | 13.6% |
| 4+ Person Household | 3,939 | 23.6% |
| Total Housing Units | 16,696 | 100.0% |
Occupancy by Ownership by Household Size in Pettis County
| Household Size | Owner-occupied | Renter-occupied |
| 1-Person Household | 2,574 (57.4%) | 1,908 (42.6%) |
| 2-Person Household | 4,525 (75.4%) | 1,474 (24.6%) |
| 3-Person Household | 1,726 (75.8%) | 550 (24.2%) |
| 4+ Person Household | 2,859 (72.6%) | 1,080 (27.4%) |
| Total Housing Units | 11,684 (70.0%) | 5,012 (30.0%) |
Occupancy by Educational Attainment in Pettis County
| Household Size | Owner-occupied | Renter-occupied |
| Less than High School | 961 (59.5%) | 654 (40.5%) |
| High School Diploma | 3,648 (67.3%) | 1,774 (32.7%) |
| College/Associate Degree | 4,289 (66.7%) | 2,136 (33.3%) |
| Bachelor's Degree or higher | 2,786 (86.2%) | 448 (13.9%) |
Occupancy by Age of Householder in Pettis County
| Age Bracket | # Households | % Households |
| Under 35 Years | 3,451 | 20.7% |
| 35 to 44 Years | 2,885 | 17.3% |
| 45 to 54 Years | 2,483 | 14.9% |
| 55 to 64 Years | 3,290 | 19.7% |
| 65 to 74 Years | 2,583 | 15.5% |
| 75 to 84 Years | 1,411 | 8.5% |
| 85 Years and Over | 593 | 3.5% |
| Total | 16,696 | 100.0% |
Housing Finances in Pettis County
Median Income by Occupancy in Pettis County
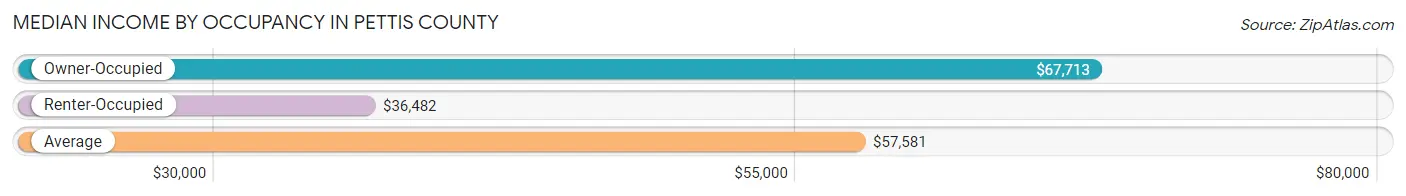
| Occupancy Type | # Households | Median Income |
| Owner-Occupied | 11,684 (70.0%) | $67,713 |
| Renter-Occupied | 5,012 (30.0%) | $36,482 |
| Average | 16,696 (100.0%) | $57,581 |
Occupancy by Householder Income Bracket in Pettis County
| Income Bracket | Owner-occupied | Renter-occupied |
| Less than $5,000 | 208 (1.8%) | 140 (2.8%) |
| $5,000 to $9,999 | 83 (0.7%) | 268 (5.3%) |
| $10,000 to $14,999 | 289 (2.5%) | 495 (9.9%) |
| $15,000 to $19,999 | 235 (2.0%) | 407 (8.1%) |
| $20,000 to $24,999 | 366 (3.1%) | 364 (7.3%) |
| $25,000 to $34,999 | 920 (7.9%) | 749 (14.9%) |
| $35,000 to $49,999 | 1,739 (14.9%) | 767 (15.3%) |
| $50,000 to $74,999 | 2,627 (22.5%) | 845 (16.9%) |
| $75,000 to $99,999 | 1,778 (15.2%) | 464 (9.3%) |
| $100,000 to $149,999 | 2,119 (18.1%) | 398 (7.9%) |
| $150,000 or more | 1,320 (11.3%) | 115 (2.3%) |
| Total | 11,684 (100.0%) | 5,012 (100.0%) |
Monthly Housing Cost Tiers in Pettis County
| Monthly Cost | Owner-occupied | Renter-occupied |
| Less than $300 | 1,184 (10.1%) | 193 (3.8%) |
| $300 to $499 | 2,585 (22.1%) | 516 (10.3%) |
| $500 to $799 | 2,516 (21.5%) | 1,379 (27.5%) |
| $800 to $999 | 1,417 (12.1%) | 1,411 (28.1%) |
| $1,000 to $1,499 | 2,451 (21.0%) | 1,064 (21.2%) |
| $1,500 to $1,999 | 1,181 (10.1%) | 139 (2.8%) |
| $2,000 to $2,499 | 219 (1.9%) | 41 (0.8%) |
| $2,500 to $2,999 | 58 (0.5%) | 23 (0.5%) |
| $3,000 or more | 73 (0.6%) | 21 (0.4%) |
| Total | 11,684 (100.0%) | 5,012 (100.0%) |
Physical Housing Characteristics in Pettis County
Housing Structures in Pettis County
| Structure Type | # Housing Units | % Housing Units |
| Single Unit, Detached | 13,392 | 80.2% |
| Single Unit, Attached | 345 | 2.1% |
| 2 Unit Apartments | 354 | 2.1% |
| 3 or 4 Unit Apartments | 499 | 3.0% |
| 5 to 9 Unit Apartments | 373 | 2.2% |
| 10 or more Apartments | 937 | 5.6% |
| Mobile Home / Other | 796 | 4.8% |
| Total | 16,696 | 100.0% |
Housing Structures by Occupancy in Pettis County
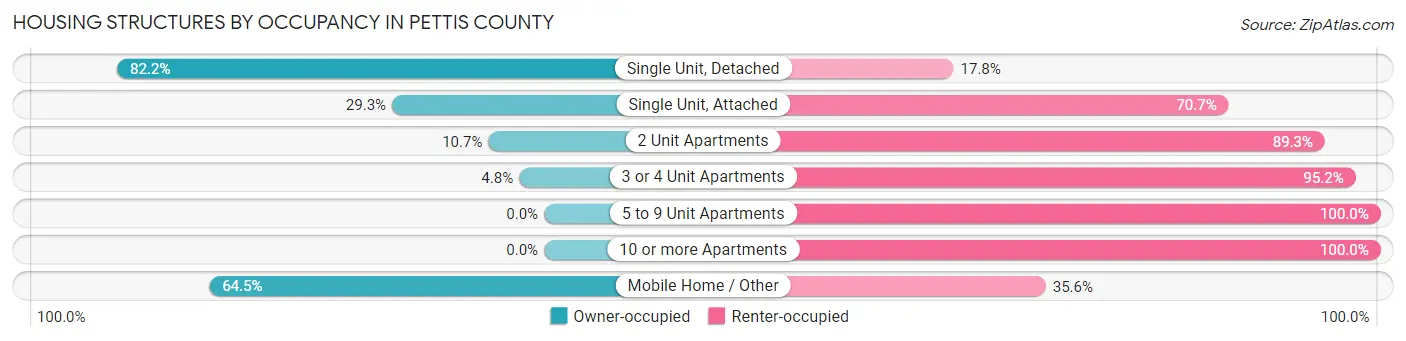
| Structure Type | Owner-occupied | Renter-occupied |
| Single Unit, Detached | 11,008 (82.2%) | 2,384 (17.8%) |
| Single Unit, Attached | 101 (29.3%) | 244 (70.7%) |
| 2 Unit Apartments | 38 (10.7%) | 316 (89.3%) |
| 3 or 4 Unit Apartments | 24 (4.8%) | 475 (95.2%) |
| 5 to 9 Unit Apartments | 0 (0.0%) | 373 (100.0%) |
| 10 or more Apartments | 0 (0.0%) | 937 (100.0%) |
| Mobile Home / Other | 513 (64.4%) | 283 (35.5%) |
| Total | 11,684 (70.0%) | 5,012 (30.0%) |
Housing Structures by Number of Rooms in Pettis County
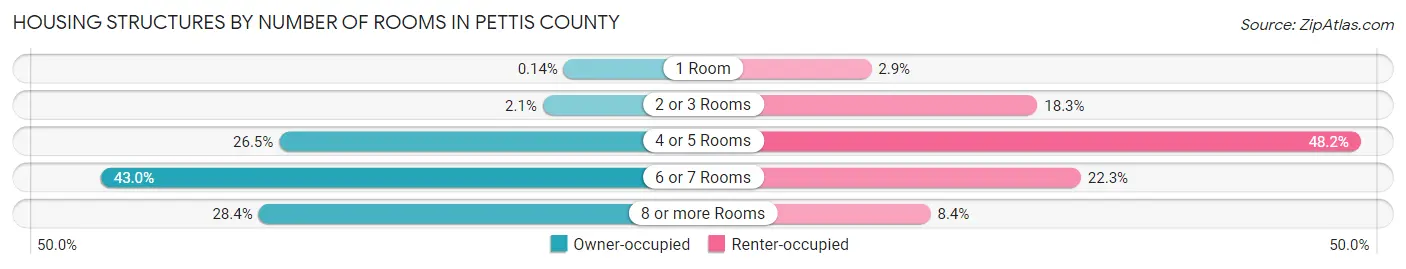
| Number of Rooms | Owner-occupied | Renter-occupied |
| 1 Room | 16 (0.1%) | 146 (2.9%) |
| 2 or 3 Rooms | 243 (2.1%) | 915 (18.3%) |
| 4 or 5 Rooms | 3,092 (26.5%) | 2,414 (48.2%) |
| 6 or 7 Rooms | 5,018 (42.9%) | 1,117 (22.3%) |
| 8 or more Rooms | 3,315 (28.4%) | 420 (8.4%) |
| Total | 11,684 (100.0%) | 5,012 (100.0%) |
Housing Structure by Heating Type in Pettis County
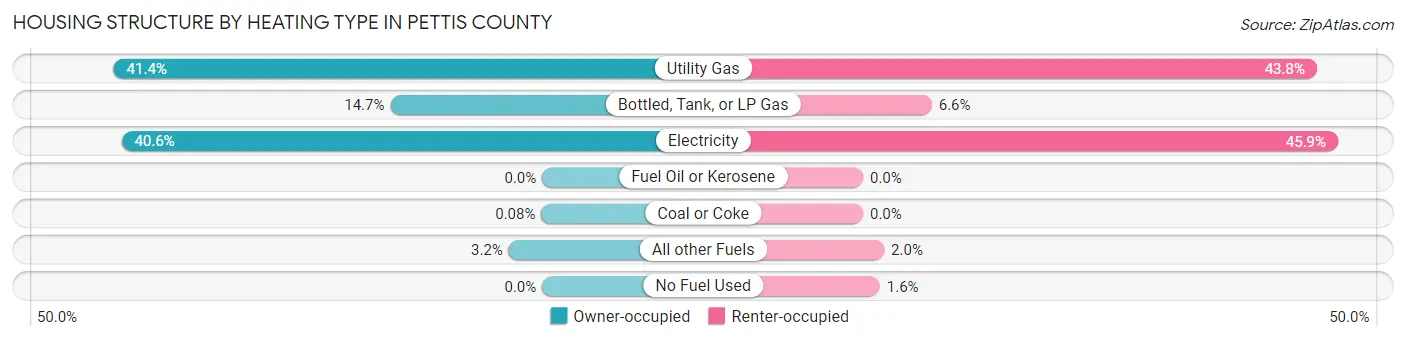
| Heating Type | Owner-occupied | Renter-occupied |
| Utility Gas | 4,836 (41.4%) | 2,197 (43.8%) |
| Bottled, Tank, or LP Gas | 1,714 (14.7%) | 333 (6.6%) |
| Electricity | 4,748 (40.6%) | 2,299 (45.9%) |
| Fuel Oil or Kerosene | 0 (0.0%) | 0 (0.0%) |
| Coal or Coke | 9 (0.1%) | 0 (0.0%) |
| All other Fuels | 377 (3.2%) | 102 (2.0%) |
| No Fuel Used | 0 (0.0%) | 81 (1.6%) |
| Total | 11,684 (100.0%) | 5,012 (100.0%) |
Household Vehicle Usage in Pettis County
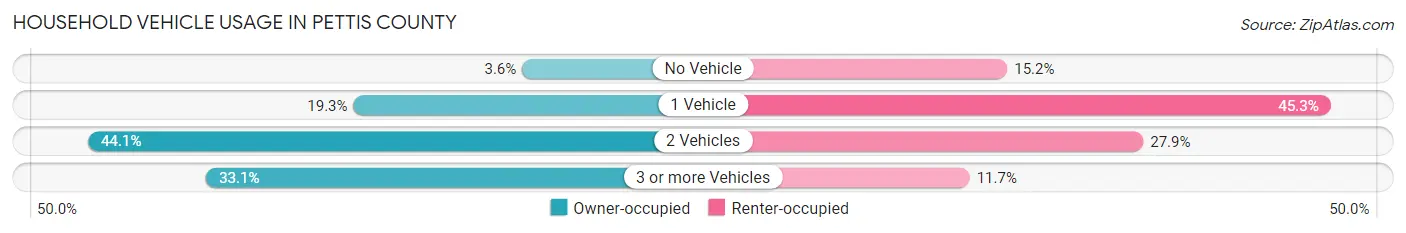
| Vehicles per Household | Owner-occupied | Renter-occupied |
| No Vehicle | 416 (3.6%) | 760 (15.2%) |
| 1 Vehicle | 2,256 (19.3%) | 2,272 (45.3%) |
| 2 Vehicles | 5,150 (44.1%) | 1,396 (27.9%) |
| 3 or more Vehicles | 3,862 (33.1%) | 584 (11.7%) |
| Total | 11,684 (100.0%) | 5,012 (100.0%) |
Real Estate & Mortgages in Pettis County
Real Estate and Mortgage Overview in Pettis County
| Characteristic | Without Mortgage | With Mortgage |
| Housing Units | 5,503 | 6,181 |
| Median Property Value | $149,300 | $150,300 |
| Median Household Income | $54,482 | $820 |
| Monthly Housing Costs | $419 | $73 |
| Real Estate Taxes | $1,157 | $322 |
Property Value by Mortgage Status in Pettis County
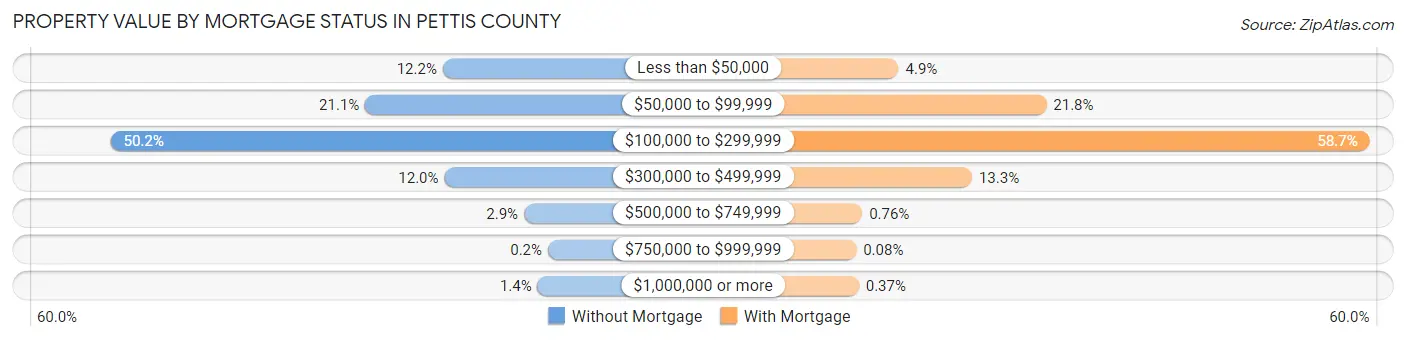
| Property Value | Without Mortgage | With Mortgage |
| Less than $50,000 | 672 (12.2%) | 304 (4.9%) |
| $50,000 to $99,999 | 1,160 (21.1%) | 1,348 (21.8%) |
| $100,000 to $299,999 | 2,761 (50.2%) | 3,631 (58.7%) |
| $300,000 to $499,999 | 662 (12.0%) | 823 (13.3%) |
| $500,000 to $749,999 | 161 (2.9%) | 47 (0.8%) |
| $750,000 to $999,999 | 11 (0.2%) | 5 (0.1%) |
| $1,000,000 or more | 76 (1.4%) | 23 (0.4%) |
| Total | 5,503 (100.0%) | 6,181 (100.0%) |
Household Income by Mortgage Status in Pettis County
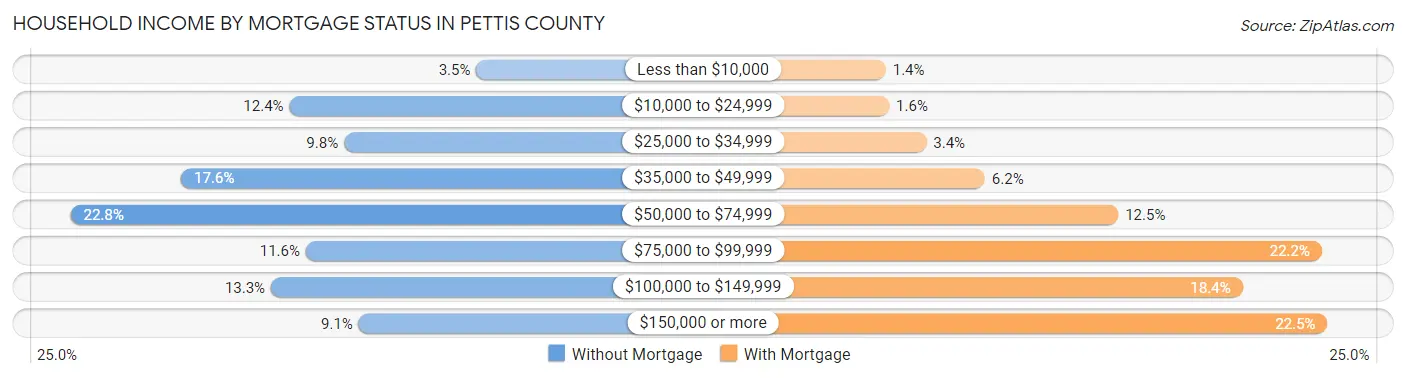
| Household Income | Without Mortgage | With Mortgage |
| Less than $10,000 | 192 (3.5%) | 89 (1.4%) |
| $10,000 to $24,999 | 682 (12.4%) | 99 (1.6%) |
| $25,000 to $34,999 | 539 (9.8%) | 208 (3.4%) |
| $35,000 to $49,999 | 966 (17.5%) | 381 (6.2%) |
| $50,000 to $74,999 | 1,255 (22.8%) | 773 (12.5%) |
| $75,000 to $99,999 | 639 (11.6%) | 1,372 (22.2%) |
| $100,000 to $149,999 | 730 (13.3%) | 1,139 (18.4%) |
| $150,000 or more | 500 (9.1%) | 1,389 (22.5%) |
| Total | 5,503 (100.0%) | 6,181 (100.0%) |
Property Value to Household Income Ratio in Pettis County
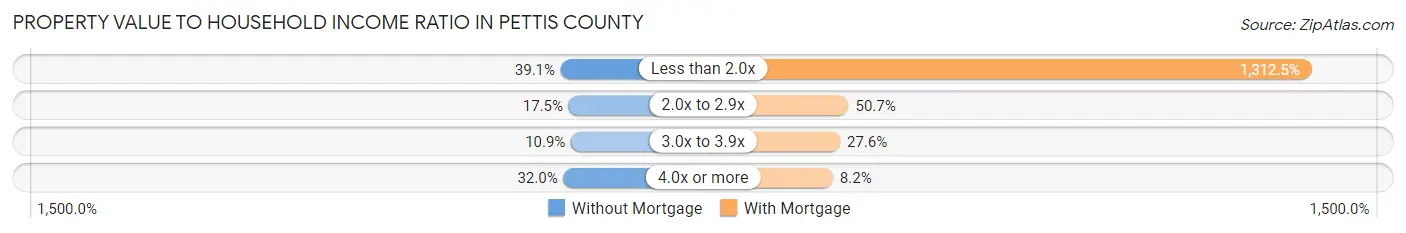
| Value-to-Income Ratio | Without Mortgage | With Mortgage |
| Less than 2.0x | 2,151 (39.1%) | 81,123 (1,312.5%) |
| 2.0x to 2.9x | 962 (17.5%) | 3,135 (50.7%) |
| 3.0x to 3.9x | 602 (10.9%) | 1,705 (27.6%) |
| 4.0x or more | 1,761 (32.0%) | 504 (8.2%) |
| Total | 5,503 (100.0%) | 6,181 (100.0%) |
Real Estate Taxes by Mortgage Status in Pettis County
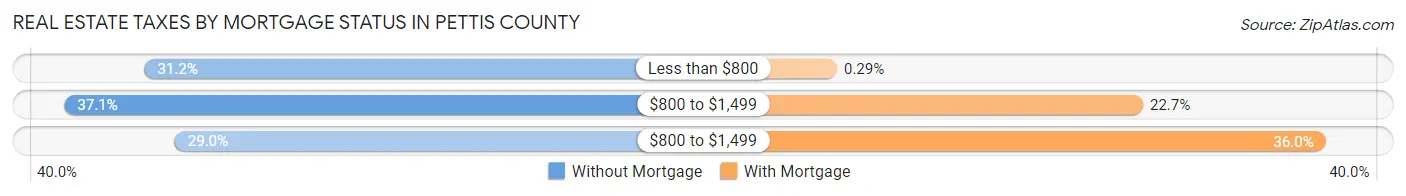
| Property Taxes | Without Mortgage | With Mortgage |
| Less than $800 | 1,719 (31.2%) | 18 (0.3%) |
| $800 to $1,499 | 2,041 (37.1%) | 1,400 (22.7%) |
| $800 to $1,499 | 1,597 (29.0%) | 2,224 (36.0%) |
| Total | 5,503 (100.0%) | 6,181 (100.0%) |
Health & Disability in Pettis County
Health Insurance Coverage by Age in Pettis County
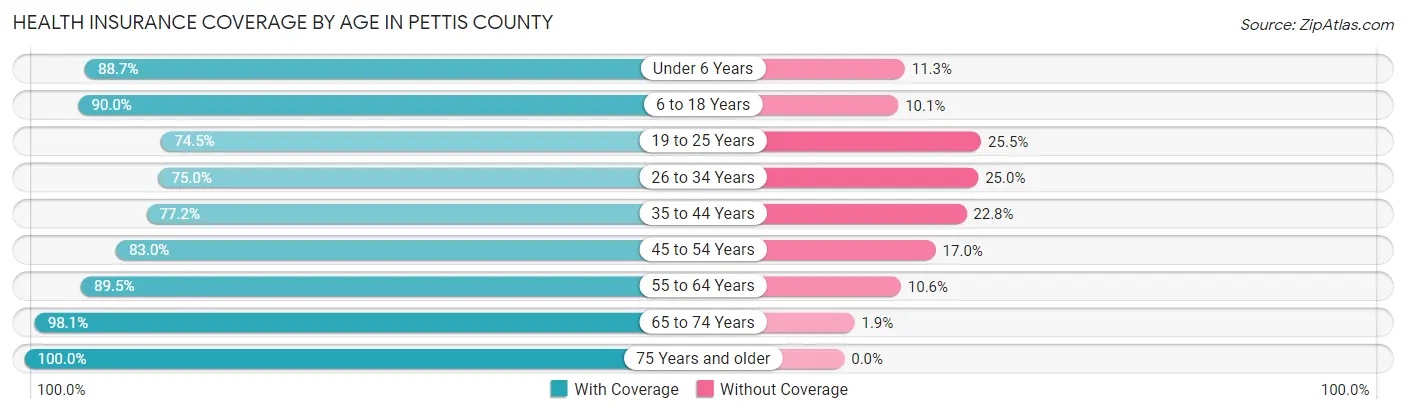
| Age Bracket | With Coverage | Without Coverage |
| Under 6 Years | 3,111 (88.7%) | 396 (11.3%) |
| 6 to 18 Years | 6,993 (89.9%) | 781 (10.1%) |
| 19 to 25 Years | 2,676 (74.5%) | 917 (25.5%) |
| 26 to 34 Years | 3,568 (75.0%) | 1,188 (25.0%) |
| 35 to 44 Years | 4,062 (77.2%) | 1,197 (22.8%) |
| 45 to 54 Years | 3,949 (83.0%) | 811 (17.0%) |
| 55 to 64 Years | 5,036 (89.4%) | 594 (10.5%) |
| 65 to 74 Years | 4,115 (98.1%) | 80 (1.9%) |
| 75 Years and older | 2,925 (100.0%) | 0 (0.0%) |
| Total | 36,435 (85.9%) | 5,964 (14.1%) |
Health Insurance Coverage by Citizenship Status in Pettis County
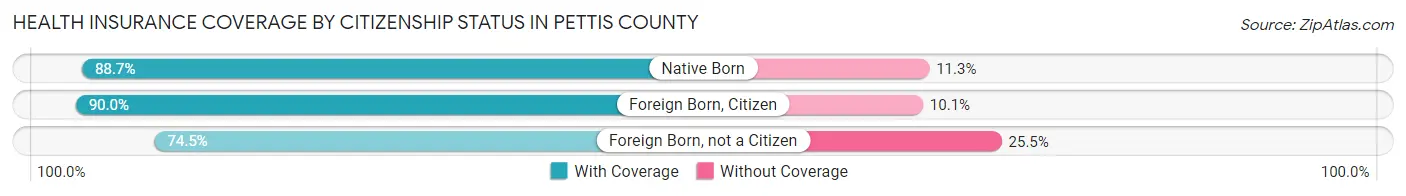
| Citizenship Status | With Coverage | Without Coverage |
| Native Born | 3,111 (88.7%) | 396 (11.3%) |
| Foreign Born, Citizen | 6,993 (89.9%) | 781 (10.1%) |
| Foreign Born, not a Citizen | 2,676 (74.5%) | 917 (25.5%) |
Health Insurance Coverage by Household Income in Pettis County
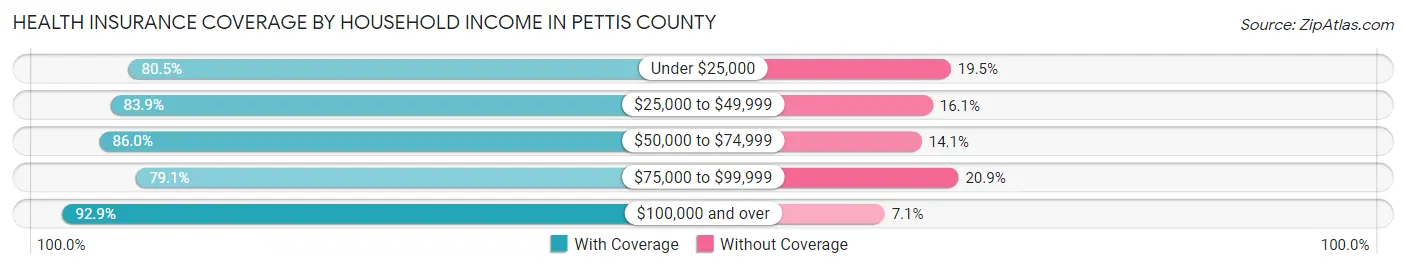
| Household Income | With Coverage | Without Coverage |
| Under $25,000 | 3,856 (80.5%) | 934 (19.5%) |
| $25,000 to $49,999 | 7,539 (83.9%) | 1,448 (16.1%) |
| $50,000 to $74,999 | 7,843 (86.0%) | 1,282 (14.1%) |
| $75,000 to $99,999 | 5,341 (79.1%) | 1,413 (20.9%) |
| $100,000 and over | 11,414 (92.9%) | 873 (7.1%) |
Public vs Private Health Insurance Coverage by Age in Pettis County
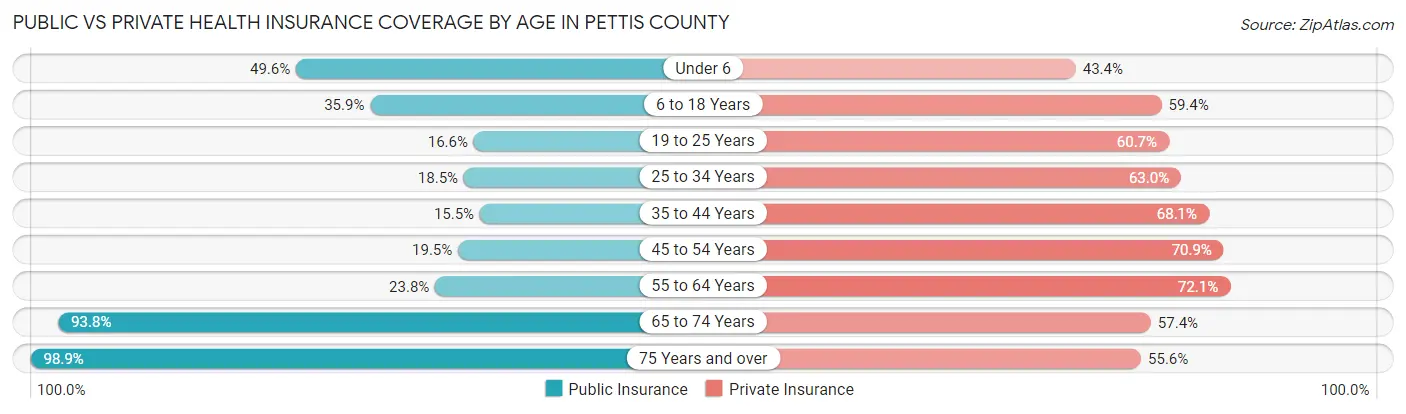
| Age Bracket | Public Insurance | Private Insurance |
| Under 6 | 1,740 (49.6%) | 1,523 (43.4%) |
| 6 to 18 Years | 2,787 (35.8%) | 4,614 (59.4%) |
| 19 to 25 Years | 597 (16.6%) | 2,181 (60.7%) |
| 25 to 34 Years | 878 (18.5%) | 2,994 (62.9%) |
| 35 to 44 Years | 814 (15.5%) | 3,583 (68.1%) |
| 45 to 54 Years | 930 (19.5%) | 3,374 (70.9%) |
| 55 to 64 Years | 1,340 (23.8%) | 4,057 (72.1%) |
| 65 to 74 Years | 3,935 (93.8%) | 2,407 (57.4%) |
| 75 Years and over | 2,893 (98.9%) | 1,625 (55.6%) |
| Total | 15,914 (37.5%) | 26,358 (62.2%) |
Disability Status by Sex by Age in Pettis County
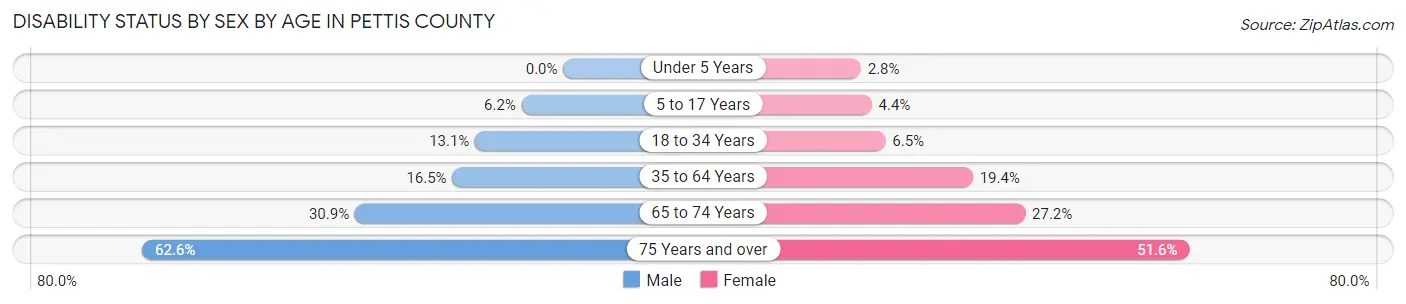
| Age Bracket | Male | Female |
| Under 5 Years | 0 (0.0%) | 38 (2.8%) |
| 5 to 17 Years | 254 (6.2%) | 162 (4.4%) |
| 18 to 34 Years | 580 (13.1%) | 293 (6.5%) |
| 35 to 64 Years | 1,314 (16.5%) | 1,491 (19.4%) |
| 65 to 74 Years | 625 (30.9%) | 592 (27.2%) |
| 75 Years and over | 747 (62.6%) | 893 (51.6%) |
Disability Class by Sex by Age in Pettis County
Disability Class: Hearing Difficulty
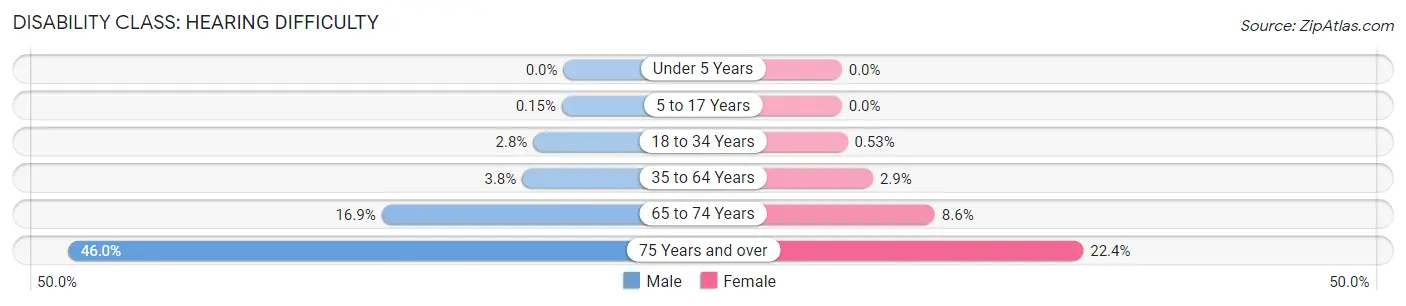
| Age Bracket | Male | Female |
| Under 5 Years | 0 (0.0%) | 0 (0.0%) |
| 5 to 17 Years | 6 (0.2%) | 0 (0.0%) |
| 18 to 34 Years | 124 (2.8%) | 24 (0.5%) |
| 35 to 64 Years | 306 (3.8%) | 222 (2.9%) |
| 65 to 74 Years | 341 (16.9%) | 188 (8.6%) |
| 75 Years and over | 549 (46.0%) | 388 (22.4%) |
Disability Class: Vision Difficulty
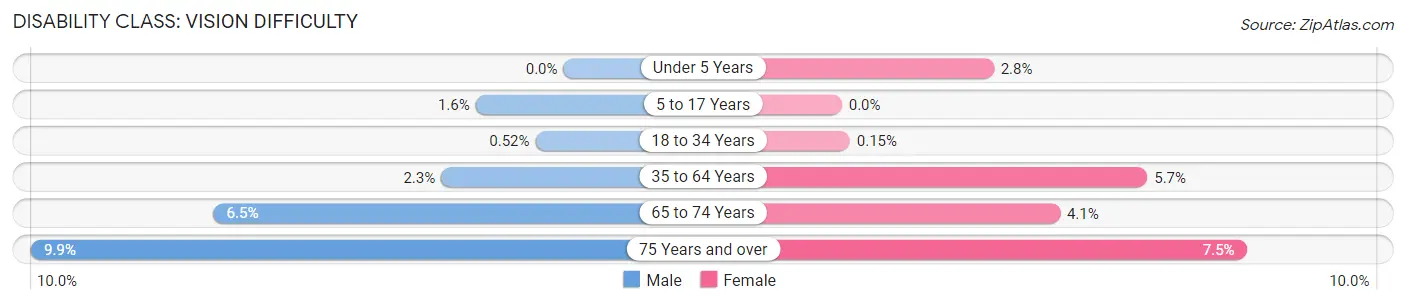
| Age Bracket | Male | Female |
| Under 5 Years | 0 (0.0%) | 38 (2.8%) |
| 5 to 17 Years | 67 (1.6%) | 0 (0.0%) |
| 18 to 34 Years | 23 (0.5%) | 7 (0.2%) |
| 35 to 64 Years | 181 (2.3%) | 435 (5.7%) |
| 65 to 74 Years | 131 (6.5%) | 88 (4.1%) |
| 75 Years and over | 118 (9.9%) | 130 (7.5%) |
Disability Class: Cognitive Difficulty
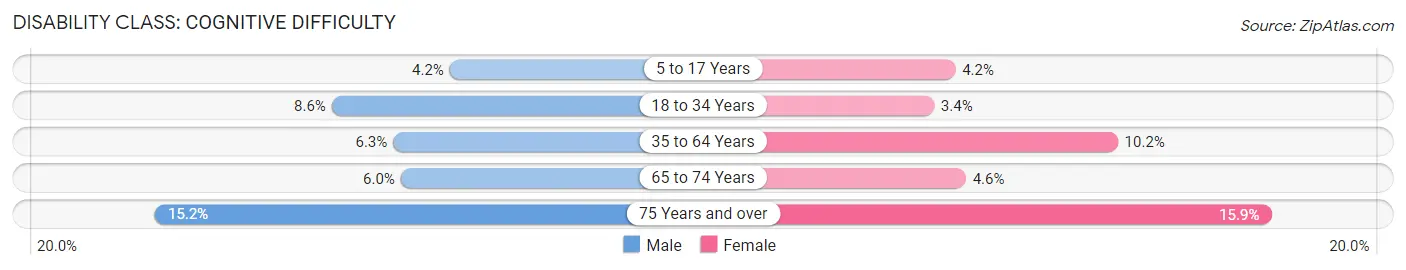
| Age Bracket | Male | Female |
| 5 to 17 Years | 173 (4.2%) | 154 (4.2%) |
| 18 to 34 Years | 381 (8.6%) | 155 (3.4%) |
| 35 to 64 Years | 504 (6.3%) | 785 (10.2%) |
| 65 to 74 Years | 122 (6.0%) | 100 (4.6%) |
| 75 Years and over | 181 (15.2%) | 276 (15.9%) |
Disability Class: Ambulatory Difficulty
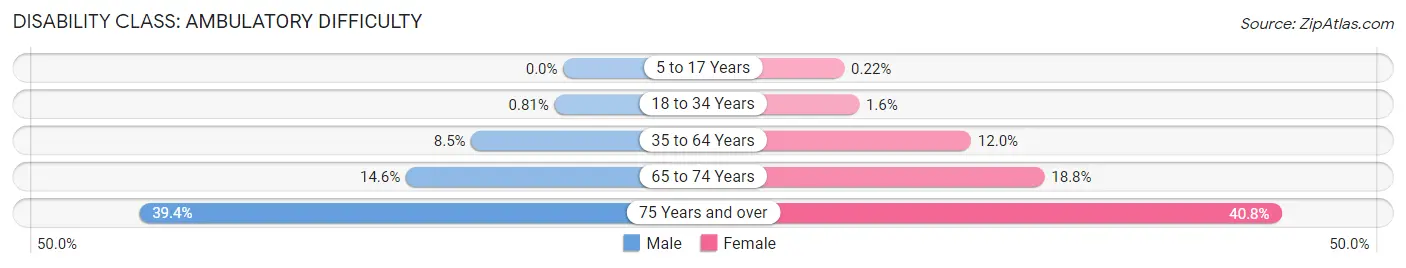
| Age Bracket | Male | Female |
| 5 to 17 Years | 0 (0.0%) | 8 (0.2%) |
| 18 to 34 Years | 36 (0.8%) | 72 (1.6%) |
| 35 to 64 Years | 681 (8.5%) | 919 (12.0%) |
| 65 to 74 Years | 295 (14.6%) | 409 (18.8%) |
| 75 Years and over | 470 (39.4%) | 706 (40.8%) |
Disability Class: Self-Care Difficulty
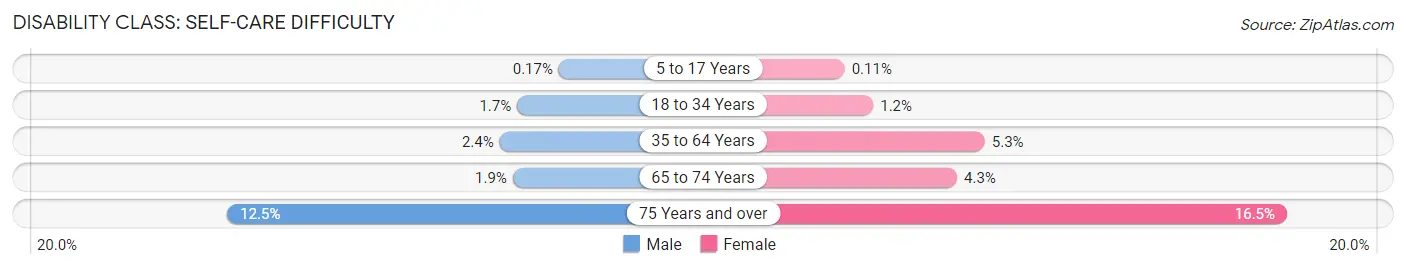
| Age Bracket | Male | Female |
| 5 to 17 Years | 7 (0.2%) | 4 (0.1%) |
| 18 to 34 Years | 76 (1.7%) | 53 (1.2%) |
| 35 to 64 Years | 189 (2.4%) | 407 (5.3%) |
| 65 to 74 Years | 38 (1.9%) | 93 (4.3%) |
| 75 Years and over | 149 (12.5%) | 286 (16.5%) |
Technology Access in Pettis County
Computing Device Access in Pettis County
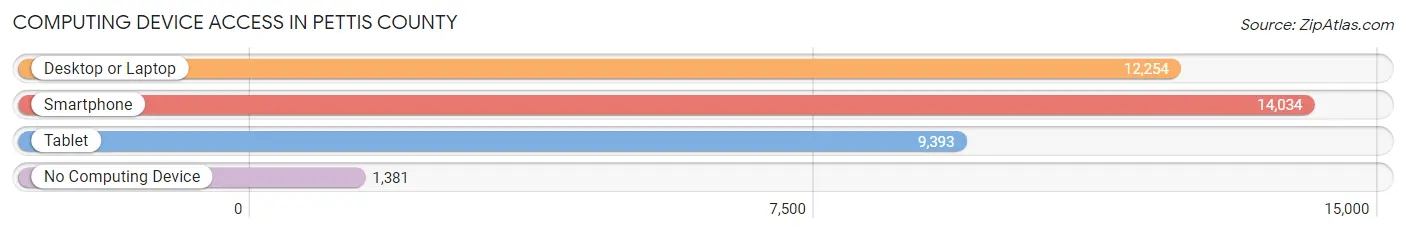
| Device Type | # Households | % Households |
| Desktop or Laptop | 12,254 | 73.4% |
| Smartphone | 14,034 | 84.1% |
| Tablet | 9,393 | 56.3% |
| No Computing Device | 1,381 | 8.3% |
| Total | 16,696 | 100.0% |
Internet Access in Pettis County
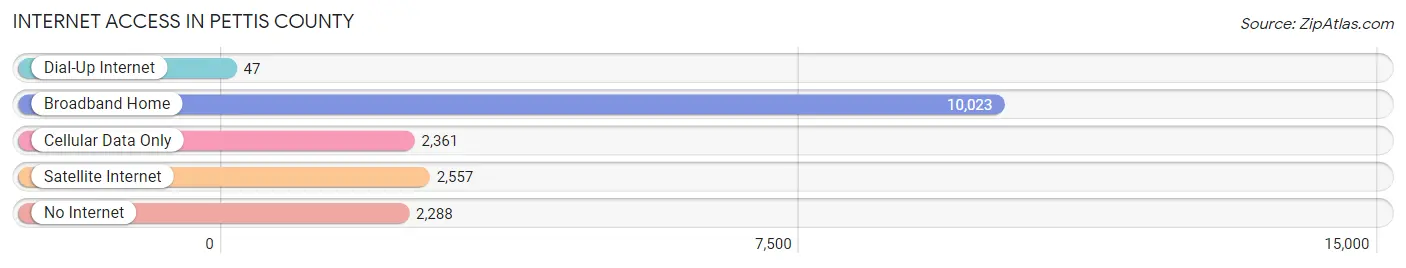
| Internet Type | # Households | % Households |
| Dial-Up Internet | 47 | 0.3% |
| Broadband Home | 10,023 | 60.0% |
| Cellular Data Only | 2,361 | 14.1% |
| Satellite Internet | 2,557 | 15.3% |
| No Internet | 2,288 | 13.7% |
| Total | 16,696 | 100.0% |
Pettis County Summary
Pettis County is located in the west-central part of the state of Missouri, and is part of the Sedalia Metropolitan Statistical Area. The county was established in 1833 and named after General Alexander Pettis, a veteran of the War of 1812. As of the 2010 census, the population of Pettis County was 42,201.
Geography
Pettis County is located in the west-central part of Missouri, and is bordered by Benton County to the north, Johnson County to the east, Saline County to the south, and Henry County to the west. The county covers an area of 545 square miles, and is mostly flat with some rolling hills. The county is drained by the Blackwater River, which flows through the center of the county. The county is also home to several small lakes, including Lake Lafayette and Lake Wappapello.
The county is located in the Ozark Plateau region of Missouri, and is mostly covered in forest and grassland. The county is home to several state parks, including Knob Noster State Park, which is located in the northern part of the county.
Demographics
As of the 2010 census, the population of Pettis County was 42,201, with a population density of 77.3 people per square mile. The racial makeup of the county was 90.2% White, 6.2% African American, 0.5% Native American, 0.6% Asian, 0.1% Pacific Islander, 0.7% from other races, and 1.9% from two or more races. Hispanic or Latino of any race were 2.3% of the population.
The median income for a household in the county was $41,945, and the median income for a family was $50,945. The per capita income for the county was $20,945. About 11.2% of families and 14.2% of the population were below the poverty line, including 19.2% of those under age 18 and 8.7% of those age 65 or over.
Economy
Pettis County is home to several major employers, including the State of Missouri, the University of Central Missouri, and the Sedalia School District. The county is also home to several manufacturing companies, including the John Deere plant in Sedalia, which produces agricultural equipment.
The county is also home to several agricultural operations, including cattle, poultry, and hog farms. The county is also home to several wineries, including the Stone Hill Winery in Hermann.
The county is served by several major highways, including Interstate 70, U.S. Route 50, and U.S. Route 65. The county is also served by the Sedalia-Whiteman Airport, which is located in the northern part of the county.
Conclusion
Pettis County is a rural county located in the west-central part of Missouri. The county is home to a diverse population, with a median income of $41,945. The county is home to several major employers, including the State of Missouri, the University of Central Missouri, and the Sedalia School District. The county is also home to several agricultural operations, including cattle, poultry, and hog farms. The county is served by several major highways, including Interstate 70, U.S. Route 50, and U.S. Route 65.
Common Questions
What is the Total Population of Pettis County?
Total Population of Pettis County is 43,059.
What is the Total Male Population of Pettis County?
Total Male Population of Pettis County is 21,606.
What is the Total Female Population of Pettis County?
Total Female Population of Pettis County is 21,453.
What is the Ratio of Males per 100 Females in Pettis County?
There are 100.71 Males per 100 Females in Pettis County.
What is the Ratio of Females per 100 Males in Pettis County?
There are 99.29 Females per 100 Males in Pettis County.
What is the Median Population Age in Pettis County?
Median Population Age in Pettis County is 38.0 Years.
What is the Average Family Size in Pettis County
Average Family Size in Pettis County is 3.0 People.
What is the Average Household Size in Pettis County
Average Household Size in Pettis County is 2.5 People.
What is Per Capita Income in Pettis County?
Per Capita income in Pettis County is $30,991.
What is the Median Family Income in Pettis County?
Median Family Income in Pettis County is $68,393.
What is the Median Household income in Pettis County?
Median Household Income in Pettis County is $57,581.
What is Income or Wage Gap in Pettis County?
Income or Wage Gap in Pettis County is 27.5%.
Women in Pettis County earn 72.5 cents for every dollar earned by a man.
What is Family Income Deficit in Pettis County?
Family Income Deficit in Pettis County is $10,700.
Families that are below poverty line in Pettis County earn $10,700 less on average than the poverty threshold level.
What is Inequality or Gini Index in Pettis County?
Inequality or Gini Index in Pettis County is 0.45.
How Large is the Labor Force in Pettis County?
There are 21,178 People in the Labor Forcein in Pettis County.
What is the Percentage of People in the Labor Force in Pettis County?
63.1% of People are in the Labor Force in Pettis County.
What is the Unemployment Rate in Pettis County?
Unemployment Rate in Pettis County is 3.9%.