Lawrence County, MO
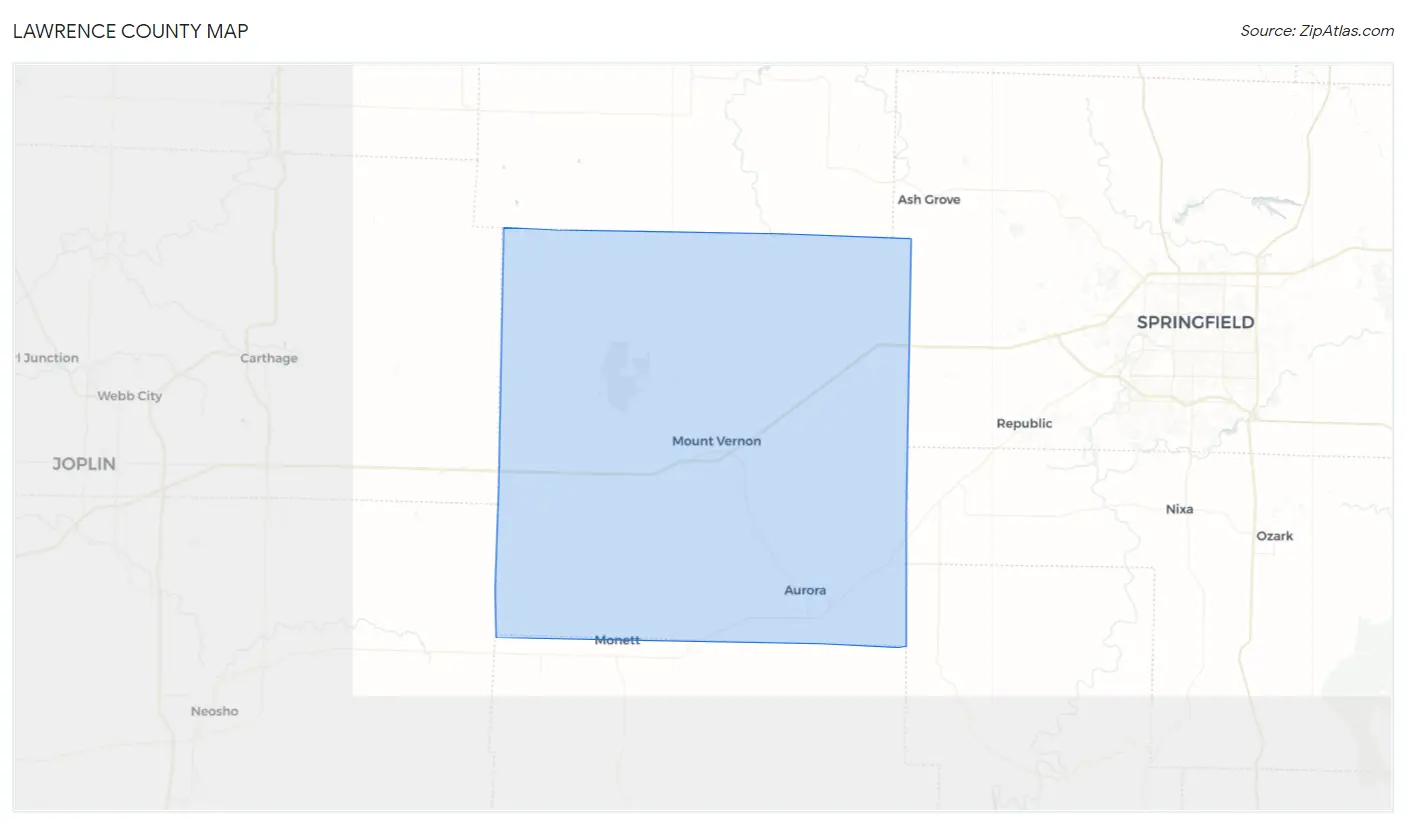
Lawrence County Map
Lawrence County Overview
38,231
TOTAL POPULATION
19,195
MALE POPULATION
19,036
FEMALE POPULATION
100.84
MALES / 100 FEMALES
99.17
FEMALES / 100 MALES
38.7
MEDIAN AGE
3.2
AVG FAMILY SIZE
2.6
AVG HOUSEHOLD SIZE
$26,407
PER CAPITA INCOME
$69,410
AVG FAMILY INCOME
$52,225
AVG HOUSEHOLD INCOME
33.2%
WAGE / INCOME GAP [ % ]
66.8¢/ $1
WAGE / INCOME GAP [ $ ]
$9,910
FAMILY INCOME DEFICIT
0.42
INEQUALITY / GINI INDEX
17,709
LABOR FORCE [ PEOPLE ]
59.5%
PERCENT IN LABOR FORCE
5.2%
UNEMPLOYMENT RATE
Lawrence County Area Codes
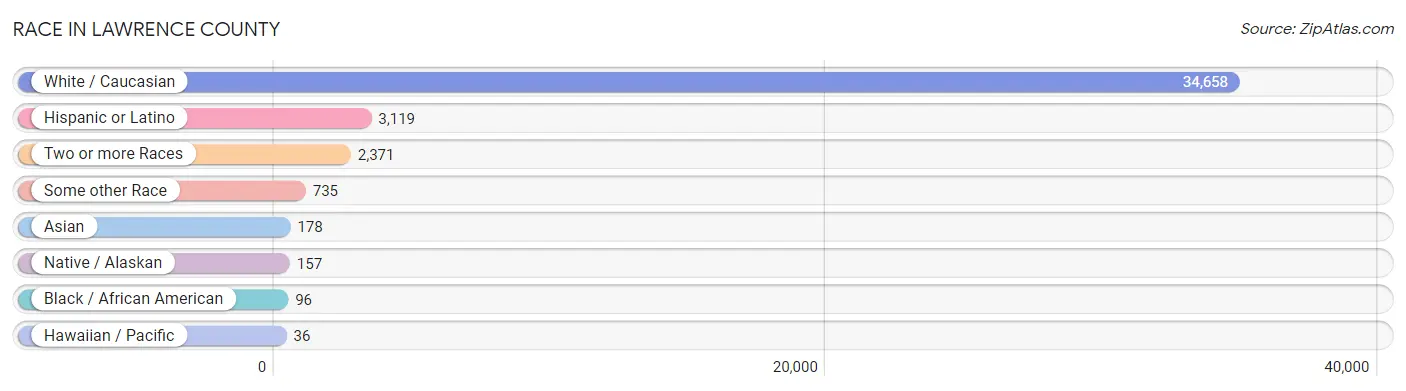
Race in Lawrence County
The most populous races in Lawrence County are White / Caucasian (34,658 | 90.6%), Hispanic or Latino (3,119 | 8.2%), and Two or more Races (2,371 | 6.2%).
| Race | # Population | % Population |
| Asian | 178 | 0.5% |
| Black / African American | 96 | 0.3% |
| Hawaiian / Pacific | 36 | 0.1% |
| Hispanic or Latino | 3,119 | 8.2% |
| Native / Alaskan | 157 | 0.4% |
| White / Caucasian | 34,658 | 90.6% |
| Two or more Races | 2,371 | 6.2% |
| Some other Race | 735 | 1.9% |
| Total | 38,231 | 100.0% |
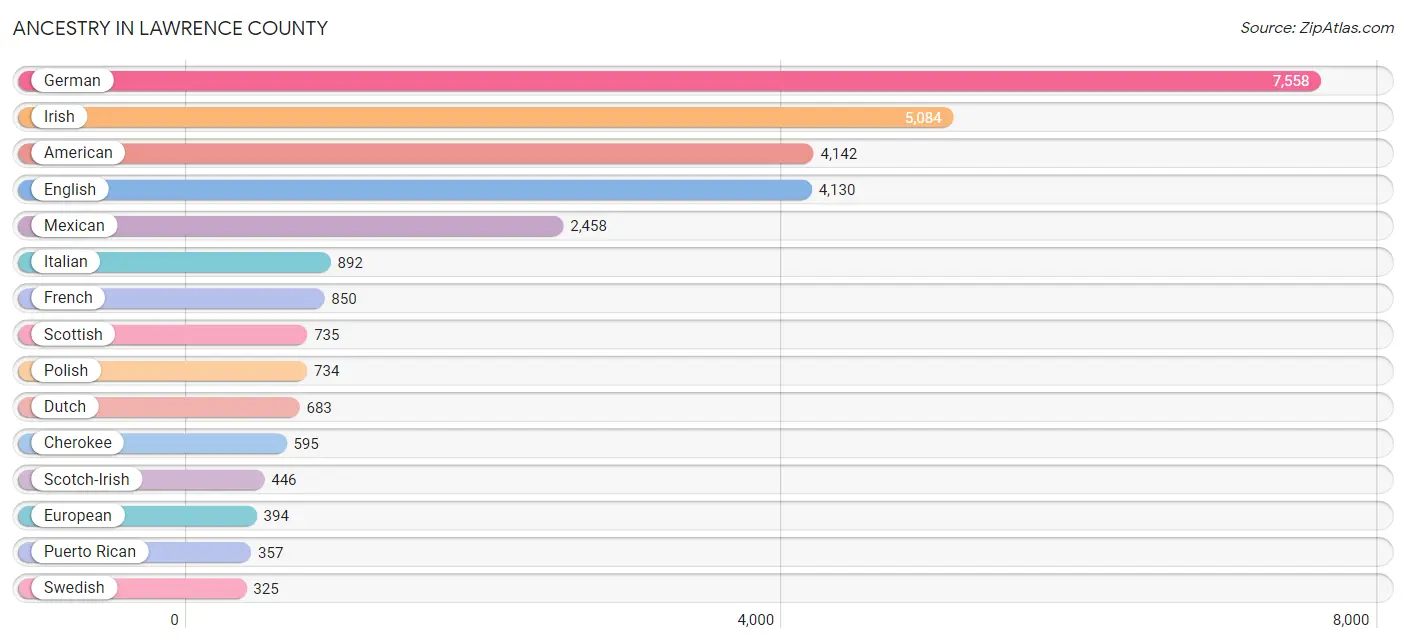
Ancestry in Lawrence County
The most populous ancestries reported in Lawrence County are German (7,558 | 19.8%), Irish (5,084 | 13.3%), American (4,142 | 10.8%), English (4,130 | 10.8%), and Mexican (2,458 | 6.4%), together accounting for 61.1% of all Lawrence County residents.
| Ancestry | # Population | % Population |
| African | 100 | 0.3% |
| American | 4,142 | 10.8% |
| Arab | 47 | 0.1% |
| Australian | 30 | 0.1% |
| Austrian | 10 | 0.0% |
| Belgian | 1 | 0.0% |
| Blackfeet | 88 | 0.2% |
| British | 193 | 0.5% |
| Canadian | 23 | 0.1% |
| Celtic | 6 | 0.0% |
| Central American | 160 | 0.4% |
| Cherokee | 595 | 1.6% |
| Cheyenne | 4 | 0.0% |
| Chickasaw | 30 | 0.1% |
| Choctaw | 13 | 0.0% |
| Comanche | 1 | 0.0% |
| Creek | 35 | 0.1% |
| Czech | 79 | 0.2% |
| Czechoslovakian | 37 | 0.1% |
| Danish | 195 | 0.5% |
| Delaware | 2 | 0.0% |
| Dominican | 5 | 0.0% |
| Dutch | 683 | 1.8% |
| Eastern European | 68 | 0.2% |
| English | 4,130 | 10.8% |
| European | 394 | 1.0% |
| Finnish | 18 | 0.1% |
| French | 850 | 2.2% |
| French American Indian | 2 | 0.0% |
| French Canadian | 28 | 0.1% |
| German | 7,558 | 19.8% |
| Greek | 107 | 0.3% |
| Guatemalan | 85 | 0.2% |
| Honduran | 33 | 0.1% |
| Hopi | 27 | 0.1% |
| Hungarian | 29 | 0.1% |
| Indonesian | 46 | 0.1% |
| Irish | 5,084 | 13.3% |
| Italian | 892 | 2.3% |
| Korean | 199 | 0.5% |
| Laotian | 14 | 0.0% |
| Menominee | 4 | 0.0% |
| Mexican | 2,458 | 6.4% |
| Native Hawaiian | 94 | 0.3% |
| Navajo | 11 | 0.0% |
| Northern European | 5 | 0.0% |
| Norwegian | 195 | 0.5% |
| Osage | 2 | 0.0% |
| Pennsylvania German | 25 | 0.1% |
| Polish | 734 | 1.9% |
| Portuguese | 14 | 0.0% |
| Pueblo | 27 | 0.1% |
| Puerto Rican | 357 | 0.9% |
| Romanian | 14 | 0.0% |
| Russian | 51 | 0.1% |
| Salvadoran | 42 | 0.1% |
| Samoan | 7 | 0.0% |
| Scandinavian | 34 | 0.1% |
| Scotch-Irish | 446 | 1.2% |
| Scottish | 735 | 1.9% |
| Sioux | 1 | 0.0% |
| Slovene | 16 | 0.0% |
| Spaniard | 22 | 0.1% |
| Spanish | 8 | 0.0% |
| Sri Lankan | 5 | 0.0% |
| Subsaharan African | 100 | 0.3% |
| Swedish | 325 | 0.9% |
| Swiss | 107 | 0.3% |
| Thai | 45 | 0.1% |
| Trinidadian and Tobagonian | 1 | 0.0% |
| Welsh | 108 | 0.3% | View All 71 Rows |
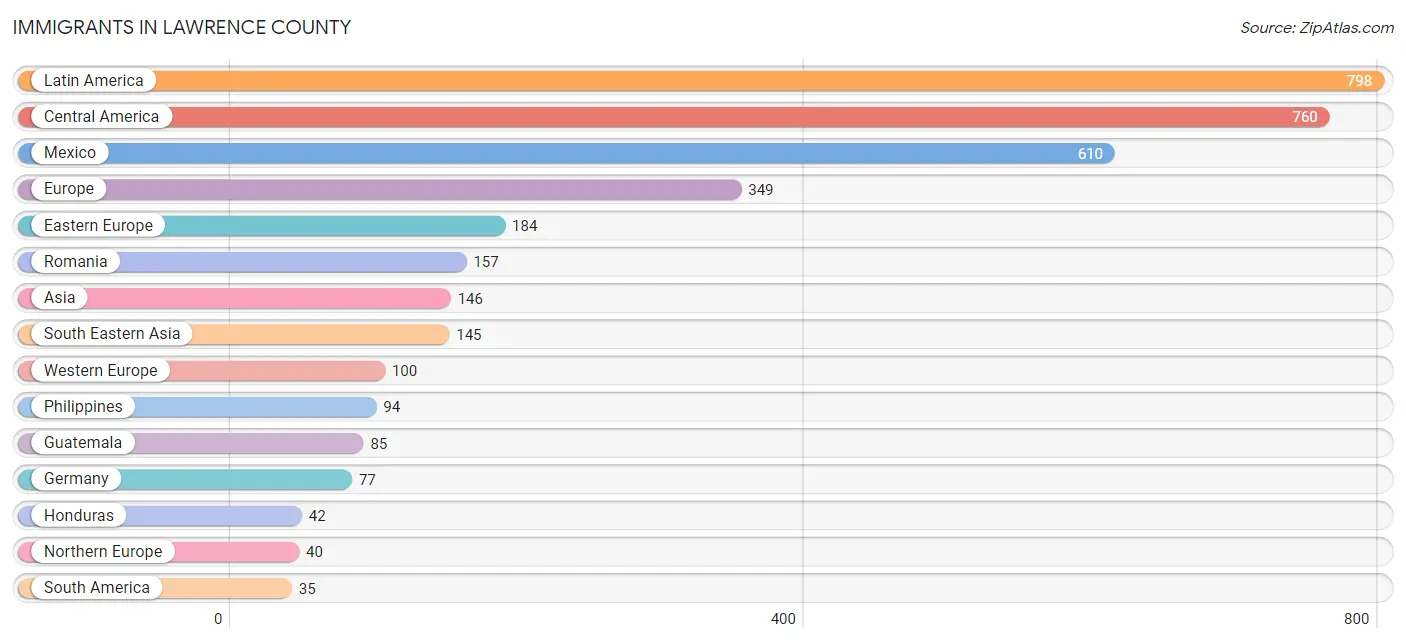
Immigrants in Lawrence County
The most numerous immigrant groups reported in Lawrence County came from Latin America (798 | 2.1%), Central America (760 | 2.0%), Mexico (610 | 1.6%), Europe (349 | 0.9%), and Eastern Europe (184 | 0.5%), together accounting for 7.1% of all Lawrence County residents.
| Immigration Origin | # Population | % Population |
| Asia | 146 | 0.4% |
| Australia | 7 | 0.0% |
| Canada | 1 | 0.0% |
| Caribbean | 3 | 0.0% |
| Central America | 760 | 2.0% |
| Colombia | 19 | 0.1% |
| Eastern Europe | 184 | 0.5% |
| El Salvador | 23 | 0.1% |
| England | 12 | 0.0% |
| Europe | 349 | 0.9% |
| Germany | 77 | 0.2% |
| Greece | 3 | 0.0% |
| Guatemala | 85 | 0.2% |
| Honduras | 42 | 0.1% |
| Latin America | 798 | 2.1% |
| Mexico | 610 | 1.6% |
| Netherlands | 23 | 0.1% |
| Northern Europe | 40 | 0.1% |
| Oceania | 7 | 0.0% |
| Philippines | 94 | 0.3% |
| Poland | 10 | 0.0% |
| Romania | 157 | 0.4% |
| Russia | 17 | 0.0% |
| Scotland | 13 | 0.0% |
| South America | 35 | 0.1% |
| South Eastern Asia | 145 | 0.4% |
| Southern Europe | 25 | 0.1% |
| Spain | 22 | 0.1% |
| Sweden | 15 | 0.0% |
| Trinidad and Tobago | 3 | 0.0% |
| Vietnam | 5 | 0.0% |
| Western Asia | 1 | 0.0% |
| Western Europe | 100 | 0.3% | View All 33 Rows |
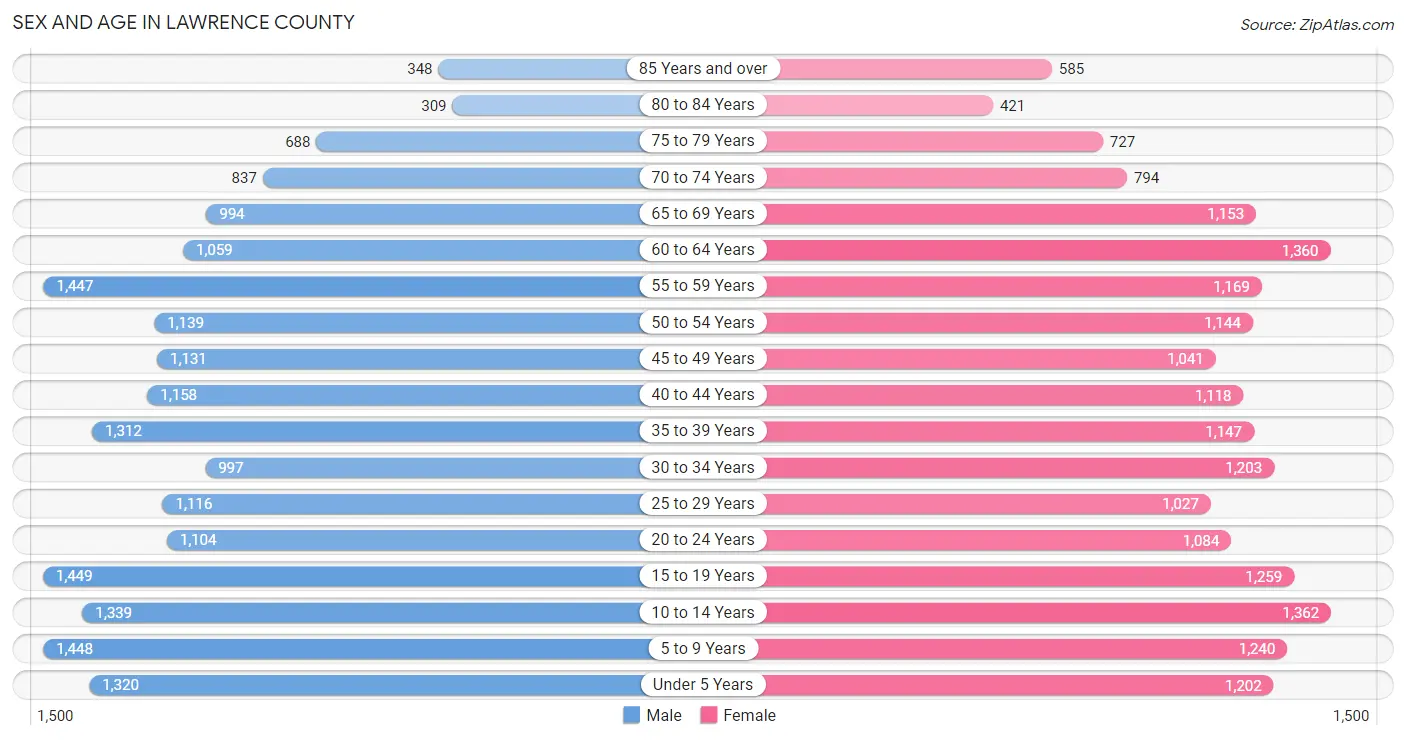
Sex and Age in Lawrence County
Sex and Age in Lawrence County
The most populous age groups in Lawrence County are 15 to 19 Years (1,449 | 7.5%) for men and 10 to 14 Years (1,362 | 7.1%) for women.
| Age Bracket | Male | Female |
| Under 5 Years | 1,320 (6.9%) | 1,202 (6.3%) |
| 5 to 9 Years | 1,448 (7.5%) | 1,240 (6.5%) |
| 10 to 14 Years | 1,339 (7.0%) | 1,362 (7.1%) |
| 15 to 19 Years | 1,449 (7.5%) | 1,259 (6.6%) |
| 20 to 24 Years | 1,104 (5.8%) | 1,084 (5.7%) |
| 25 to 29 Years | 1,116 (5.8%) | 1,027 (5.4%) |
| 30 to 34 Years | 997 (5.2%) | 1,203 (6.3%) |
| 35 to 39 Years | 1,312 (6.8%) | 1,147 (6.0%) |
| 40 to 44 Years | 1,158 (6.0%) | 1,118 (5.9%) |
| 45 to 49 Years | 1,131 (5.9%) | 1,041 (5.5%) |
| 50 to 54 Years | 1,139 (5.9%) | 1,144 (6.0%) |
| 55 to 59 Years | 1,447 (7.5%) | 1,169 (6.1%) |
| 60 to 64 Years | 1,059 (5.5%) | 1,360 (7.1%) |
| 65 to 69 Years | 994 (5.2%) | 1,153 (6.1%) |
| 70 to 74 Years | 837 (4.4%) | 794 (4.2%) |
| 75 to 79 Years | 688 (3.6%) | 727 (3.8%) |
| 80 to 84 Years | 309 (1.6%) | 421 (2.2%) |
| 85 Years and over | 348 (1.8%) | 585 (3.1%) |
| Total | 19,195 (100.0%) | 19,036 (100.0%) |
Families and Households in Lawrence County
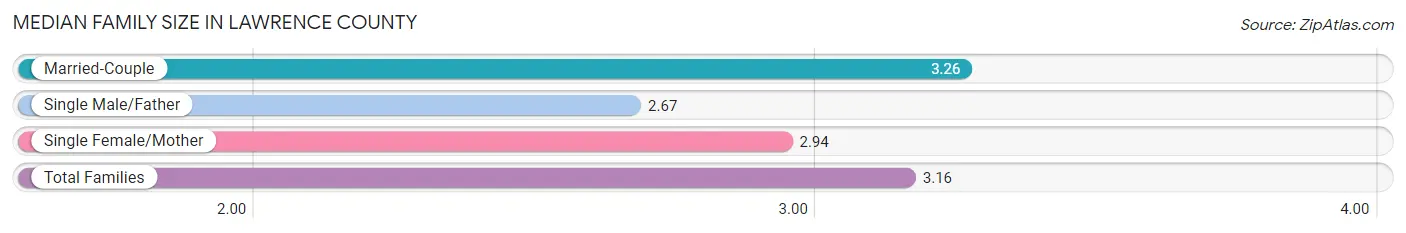
Median Family Size in Lawrence County
The median family size in Lawrence County is 3.16 persons per family, with married-couple families (7,367 | 75.0%) accounting for the largest median family size of 3.26 persons per family. On the other hand, single male/father families (813 | 8.3%) represent the smallest median family size with 2.67 persons per family.
| Family Type | # Families | Family Size |
| Married-Couple | 7,367 (75.0%) | 3.26 |
| Single Male/Father | 813 (8.3%) | 2.67 |
| Single Female/Mother | 1,646 (16.8%) | 2.94 |
| Total Families | 9,826 (100.0%) | 3.16 |
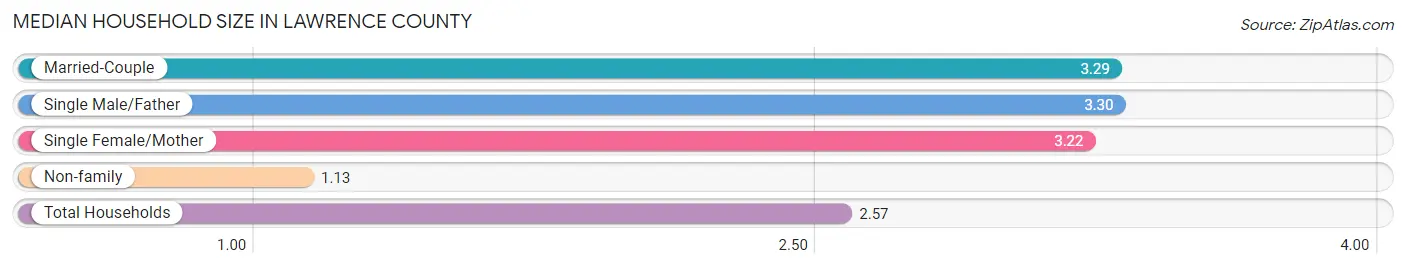
Median Household Size in Lawrence County
The median household size in Lawrence County is 2.57 persons per household, with single male/father households (813 | 5.6%) accounting for the largest median household size of 3.3 persons per household. non-family households (4,803 | 32.8%) represent the smallest median household size with 1.13 persons per household.
| Household Type | # Households | Household Size |
| Married-Couple | 7,367 (50.4%) | 3.29 |
| Single Male/Father | 813 (5.6%) | 3.30 |
| Single Female/Mother | 1,646 (11.3%) | 3.22 |
| Non-family | 4,803 (32.8%) | 1.13 |
| Total Households | 14,629 (100.0%) | 2.57 |
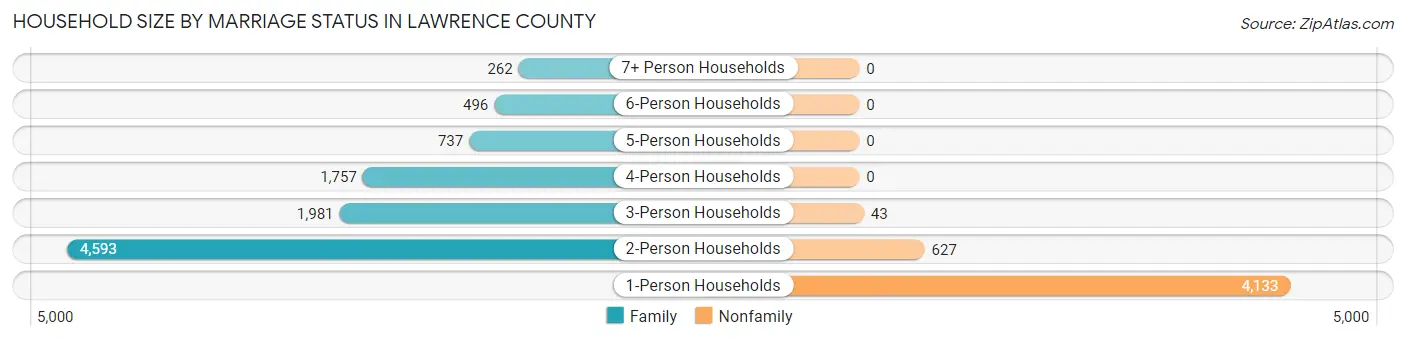
Household Size by Marriage Status in Lawrence County
Out of a total of 14,629 households in Lawrence County, 9,826 (67.2%) are family households, while 4,803 (32.8%) are nonfamily households. The most numerous type of family households are 2-person households, comprising 4,593, and the most common type of nonfamily households are 1-person households, comprising 4,133.
| Household Size | Family Households | Nonfamily Households |
| 1-Person Households | - | 4,133 (28.2%) |
| 2-Person Households | 4,593 (31.4%) | 627 (4.3%) |
| 3-Person Households | 1,981 (13.5%) | 43 (0.3%) |
| 4-Person Households | 1,757 (12.0%) | 0 (0.0%) |
| 5-Person Households | 737 (5.0%) | 0 (0.0%) |
| 6-Person Households | 496 (3.4%) | 0 (0.0%) |
| 7+ Person Households | 262 (1.8%) | 0 (0.0%) |
| Total | 9,826 (67.2%) | 4,803 (32.8%) |
Female Fertility in Lawrence County
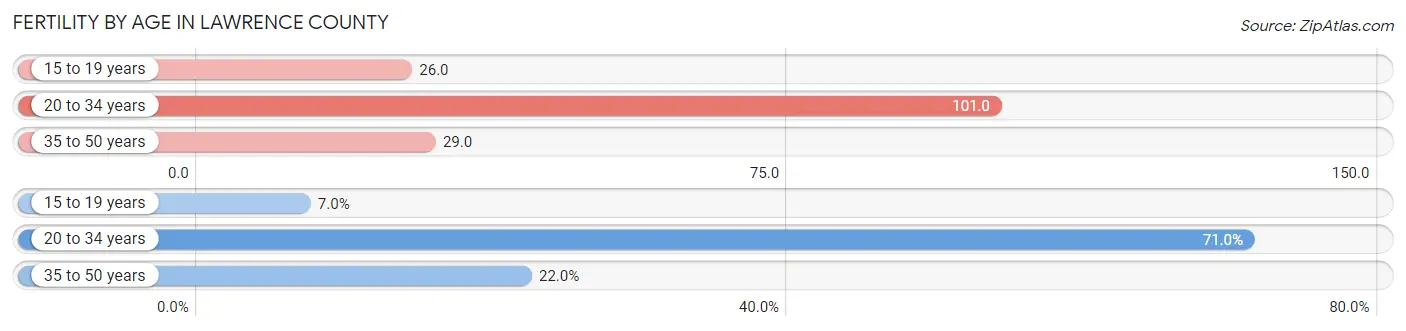
Fertility by Age in Lawrence County
Average fertility rate in Lawrence County is 58.0 births per 1,000 women. Women in the age bracket of 20 to 34 years have the highest fertility rate with 101.0 births per 1,000 women. Women in the age bracket of 20 to 34 years acount for 71.0% of all women with births.
| Age Bracket | Women with Births | Births / 1,000 Women |
| 15 to 19 years | 33 (7.0%) | 26.0 |
| 20 to 34 years | 336 (71.0%) | 101.0 |
| 35 to 50 years | 104 (22.0%) | 29.0 |
| Total | 473 (100.0%) | 58.0 |
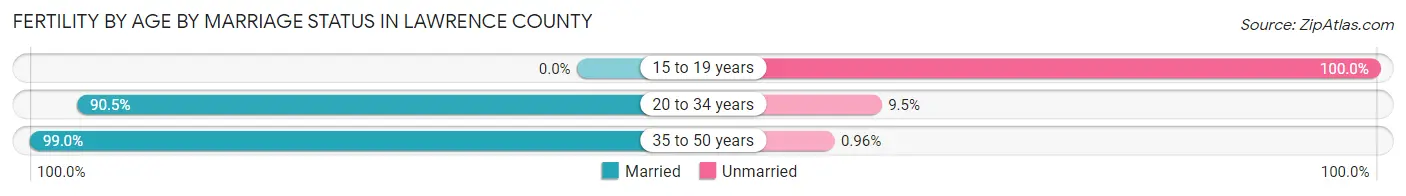
Fertility by Age by Marriage Status in Lawrence County
86.0% of women with births (473) in Lawrence County are married. The highest percentage of unmarried women with births falls into 15 to 19 years age bracket with 100.0% of them unmarried at the time of birth, while the lowest percentage of unmarried women with births belong to 35 to 50 years age bracket with 1.0% of them unmarried.
| Age Bracket | Married | Unmarried |
| 15 to 19 years | 0 (0.0%) | 33 (100.0%) |
| 20 to 34 years | 304 (90.5%) | 32 (9.5%) |
| 35 to 50 years | 103 (99.0%) | 1 (1.0%) |
| Total | 407 (86.1%) | 66 (14.0%) |
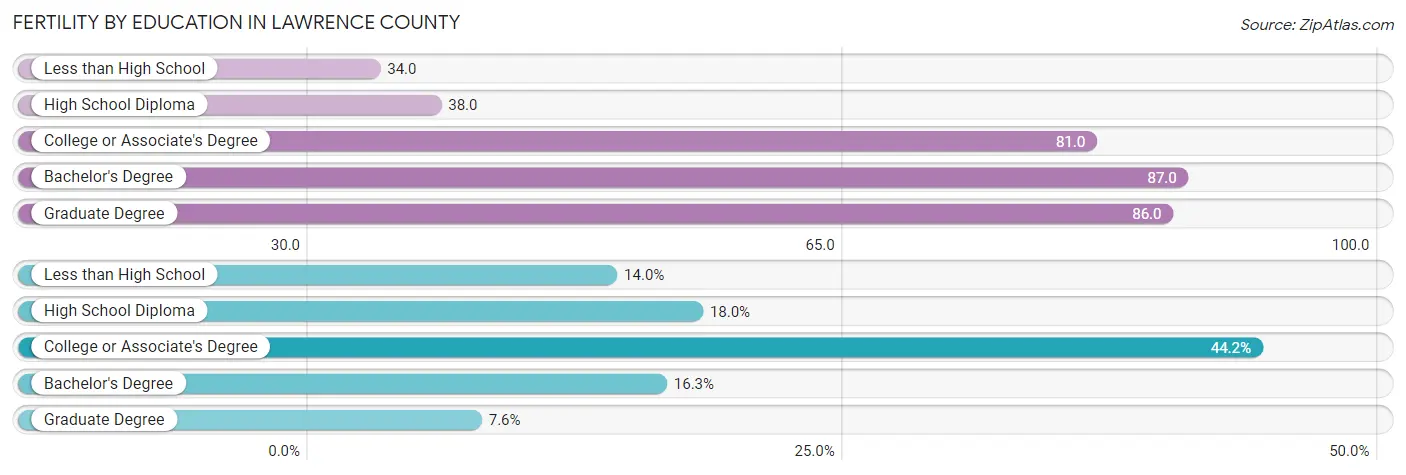
Fertility by Education in Lawrence County
Average fertility rate in Lawrence County is 58.0 births per 1,000 women. Women with the education attainment of bachelor's degree have the highest fertility rate of 87.0 births per 1,000 women, while women with the education attainment of less than high school have the lowest fertility at 34.0 births per 1,000 women. Women with the education attainment of college or associate's degree represent 44.2% of all women with births.
| Educational Attainment | Women with Births | Births / 1,000 Women |
| Less than High School | 66 (14.0%) | 34.0 |
| High School Diploma | 85 (18.0%) | 38.0 |
| College or Associate's Degree | 209 (44.2%) | 81.0 |
| Bachelor's Degree | 77 (16.3%) | 87.0 |
| Graduate Degree | 36 (7.6%) | 86.0 |
| Total | 473 (100.0%) | 58.0 |
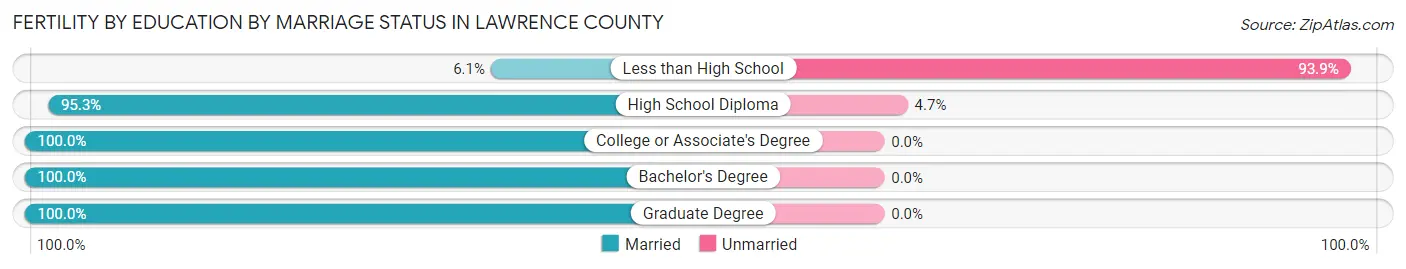
Fertility by Education by Marriage Status in Lawrence County
14.0% of women with births in Lawrence County are unmarried. Women with the educational attainment of college or associate's degree are most likely to be married with 100.0% of them married at childbirth, while women with the educational attainment of less than high school are least likely to be married with 93.9% of them unmarried at childbirth.
| Educational Attainment | Married | Unmarried |
| Less than High School | 4 (6.1%) | 62 (93.9%) |
| High School Diploma | 81 (95.3%) | 4 (4.7%) |
| College or Associate's Degree | 209 (100.0%) | 0 (0.0%) |
| Bachelor's Degree | 77 (100.0%) | 0 (0.0%) |
| Graduate Degree | 36 (100.0%) | 0 (0.0%) |
| Total | 407 (86.1%) | 66 (14.0%) |
Income in Lawrence County
Income Overview in Lawrence County
Per Capita Income in Lawrence County is $26,407, while median incomes of families and households are $69,410 and $52,225 respectively.
| Characteristic | Number | Measure |
| Per Capita Income | 38,231 | $26,407 |
| Median Family Income | 9,826 | $69,410 |
| Mean Family Income | 9,826 | $78,808 |
| Median Household Income | 14,629 | $52,225 |
| Mean Household Income | 14,629 | $67,510 |
| Income Deficit | 9,826 | $9,910 |
| Wage / Income Gap (%) | 38,231 | 33.21% |
| Wage / Income Gap ($) | 38,231 | 66.79¢ per $1 |
| Gini / Inequality Index | 38,231 | 0.42 |
Earnings by Sex in Lawrence County
Average Earnings in Lawrence County are $33,122, $39,572 for men and $26,430 for women, a difference of 33.2%.
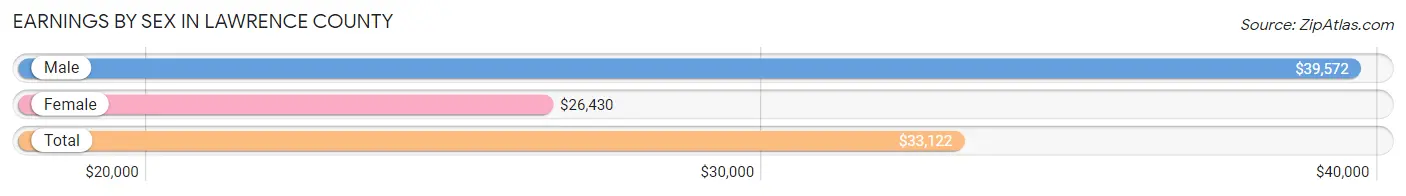
| Sex | Number | Average Earnings |
| Male | 10,044 (53.7%) | $39,572 |
| Female | 8,667 (46.3%) | $26,430 |
| Total | 18,711 (100.0%) | $33,122 |
Earnings by Sex by Income Bracket in Lawrence County
The most common earnings brackets in Lawrence County are $55,000 to $64,999 for men (1,035 | 10.3%) and $30,000 to $34,999 for women (768 | 8.9%).
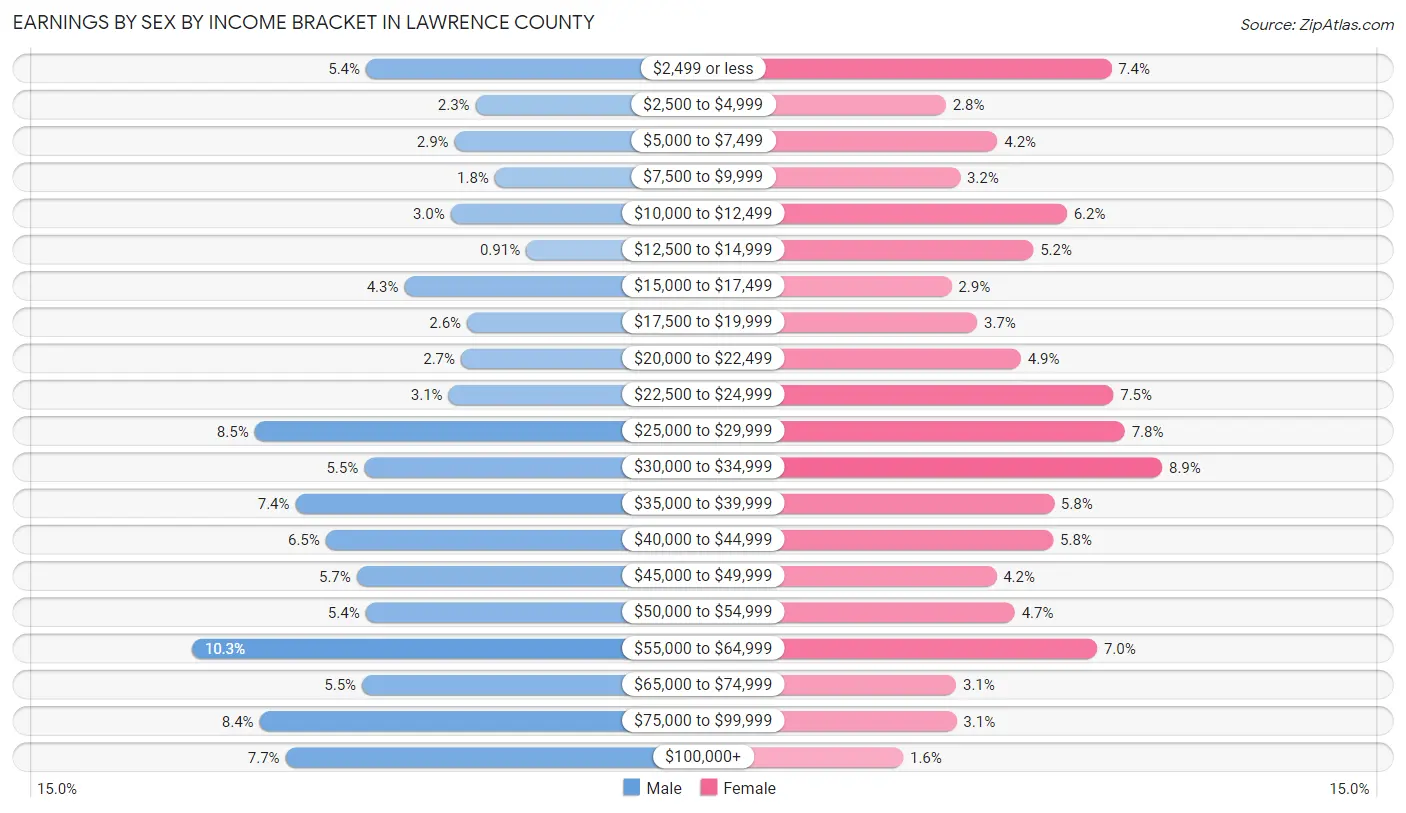
| Income | Male | Female |
| $2,499 or less | 543 (5.4%) | 644 (7.4%) |
| $2,500 to $4,999 | 234 (2.3%) | 241 (2.8%) |
| $5,000 to $7,499 | 293 (2.9%) | 367 (4.2%) |
| $7,500 to $9,999 | 180 (1.8%) | 276 (3.2%) |
| $10,000 to $12,499 | 304 (3.0%) | 536 (6.2%) |
| $12,500 to $14,999 | 91 (0.9%) | 454 (5.2%) |
| $15,000 to $17,499 | 435 (4.3%) | 255 (2.9%) |
| $17,500 to $19,999 | 258 (2.6%) | 317 (3.7%) |
| $20,000 to $22,499 | 275 (2.7%) | 424 (4.9%) |
| $22,500 to $24,999 | 310 (3.1%) | 649 (7.5%) |
| $25,000 to $29,999 | 858 (8.5%) | 677 (7.8%) |
| $30,000 to $34,999 | 548 (5.5%) | 768 (8.9%) |
| $35,000 to $39,999 | 742 (7.4%) | 504 (5.8%) |
| $40,000 to $44,999 | 657 (6.5%) | 503 (5.8%) |
| $45,000 to $49,999 | 569 (5.7%) | 364 (4.2%) |
| $50,000 to $54,999 | 544 (5.4%) | 409 (4.7%) |
| $55,000 to $64,999 | 1,035 (10.3%) | 609 (7.0%) |
| $65,000 to $74,999 | 554 (5.5%) | 266 (3.1%) |
| $75,000 to $99,999 | 844 (8.4%) | 267 (3.1%) |
| $100,000+ | 770 (7.7%) | 137 (1.6%) |
| Total | 10,044 (100.0%) | 8,667 (100.0%) |
Earnings by Sex by Educational Attainment in Lawrence County
Average earnings in Lawrence County are $45,333 for men and $30,327 for women, a difference of 33.1%. Men with an educational attainment of bachelor's degree enjoy the highest average annual earnings of $65,172, while those with less than high school education earn the least with $33,820. Women with an educational attainment of graduate degree earn the most with the average annual earnings of $51,230, while those with less than high school education have the smallest earnings of $19,818.
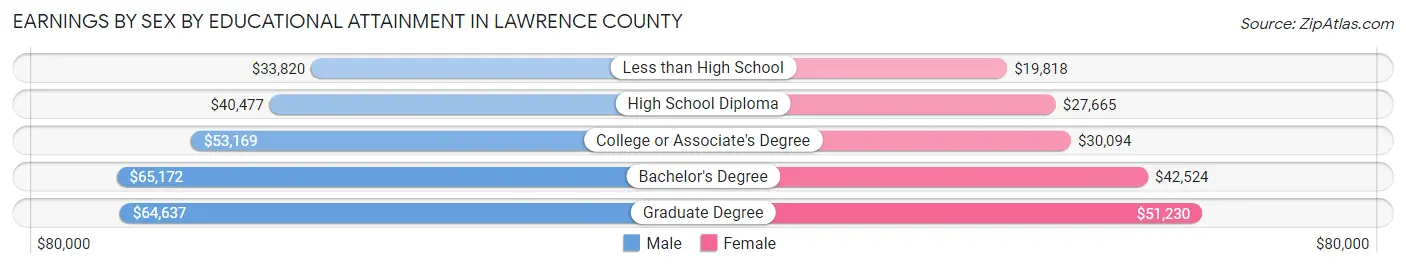
| Educational Attainment | Male Income | Female Income |
| Less than High School | $33,820 | $19,818 |
| High School Diploma | $40,477 | $27,665 |
| College or Associate's Degree | $53,169 | $30,094 |
| Bachelor's Degree | $65,172 | $42,524 |
| Graduate Degree | $64,637 | $51,230 |
| Total | $45,333 | $30,327 |
Family Income in Lawrence County
Family Income Brackets in Lawrence County
According to the Lawrence County family income data, there are 1,916 families falling into the $100,000 to $149,999 income range, which is the most common income bracket and makes up 19.5% of all families. Conversely, the $10,000 to $14,999 income bracket is the least frequent group with only 295 families (3.0%) belonging to this category.
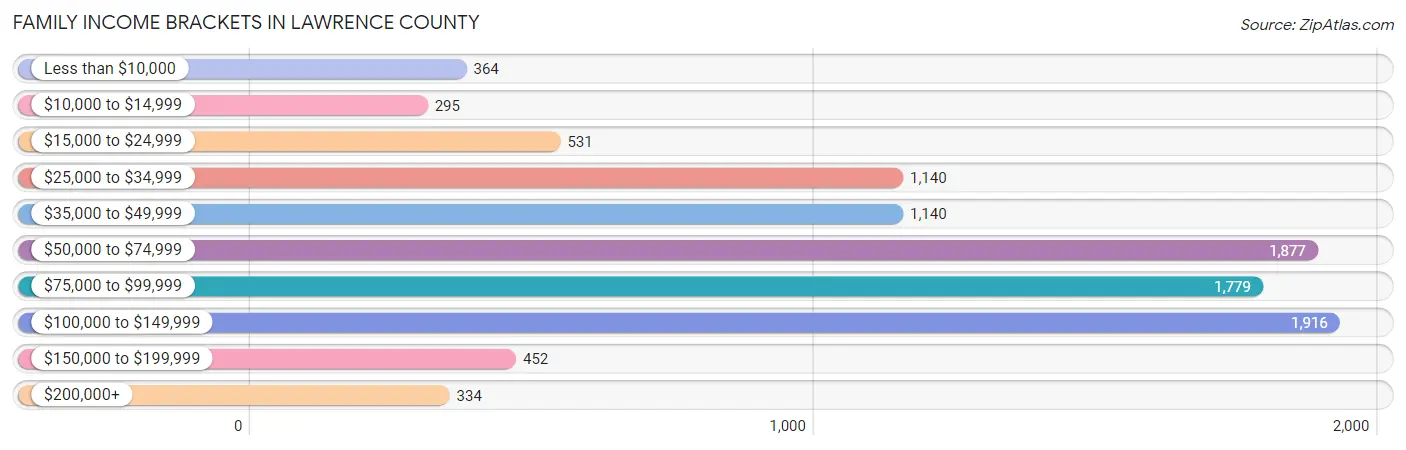
| Income Bracket | # Families | % Families |
| Less than $10,000 | 364 | 3.7% |
| $10,000 to $14,999 | 295 | 3.0% |
| $15,000 to $24,999 | 531 | 5.4% |
| $25,000 to $34,999 | 1,140 | 11.6% |
| $35,000 to $49,999 | 1,140 | 11.6% |
| $50,000 to $74,999 | 1,877 | 19.1% |
| $75,000 to $99,999 | 1,779 | 18.1% |
| $100,000 to $149,999 | 1,916 | 19.5% |
| $150,000 to $199,999 | 452 | 4.6% |
| $200,000+ | 334 | 3.4% |
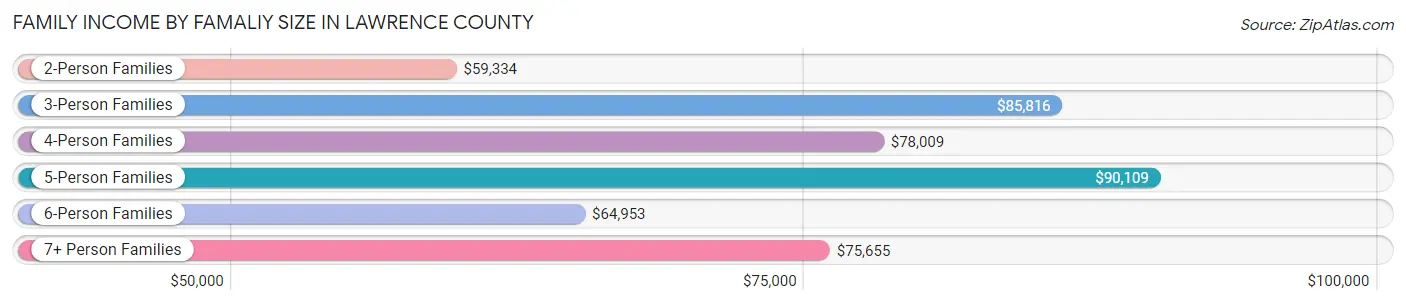
Family Income by Famaliy Size in Lawrence County
5-person families (692 | 7.0%) account for the highest median family income in Lawrence County with $90,109 per family, while 2-person families (4,887 | 49.7%) have the highest median income of $29,667 per family member.
| Income Bracket | # Families | Median Income |
| 2-Person Families | 4,887 (49.7%) | $59,334 |
| 3-Person Families | 2,020 (20.6%) | $85,816 |
| 4-Person Families | 1,579 (16.1%) | $78,009 |
| 5-Person Families | 692 (7.0%) | $90,109 |
| 6-Person Families | 453 (4.6%) | $64,953 |
| 7+ Person Families | 195 (2.0%) | $75,655 |
| Total | 9,826 (100.0%) | $69,410 |
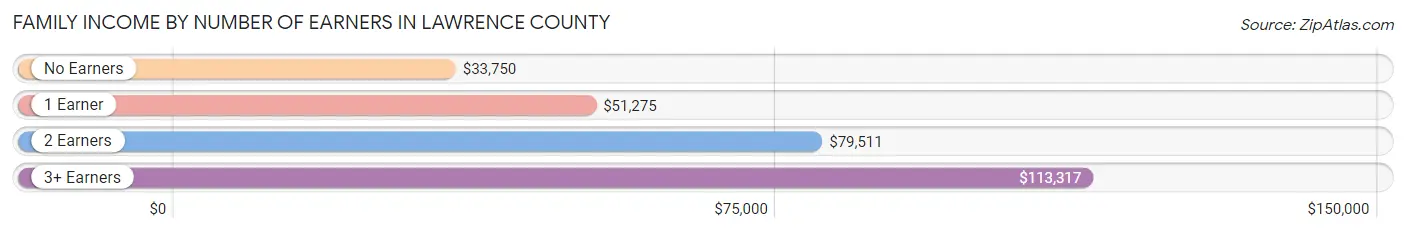
Family Income by Number of Earners in Lawrence County
The median family income in Lawrence County is $69,410, with families comprising 3+ earners (1,035) having the highest median family income of $113,317, while families with no earners (1,763) have the lowest median family income of $33,750, accounting for 10.5% and 17.9% of families, respectively.
| Number of Earners | # Families | Median Income |
| No Earners | 1,763 (17.9%) | $33,750 |
| 1 Earner | 3,064 (31.2%) | $51,275 |
| 2 Earners | 3,964 (40.3%) | $79,511 |
| 3+ Earners | 1,035 (10.5%) | $113,317 |
| Total | 9,826 (100.0%) | $69,410 |
Household Income in Lawrence County
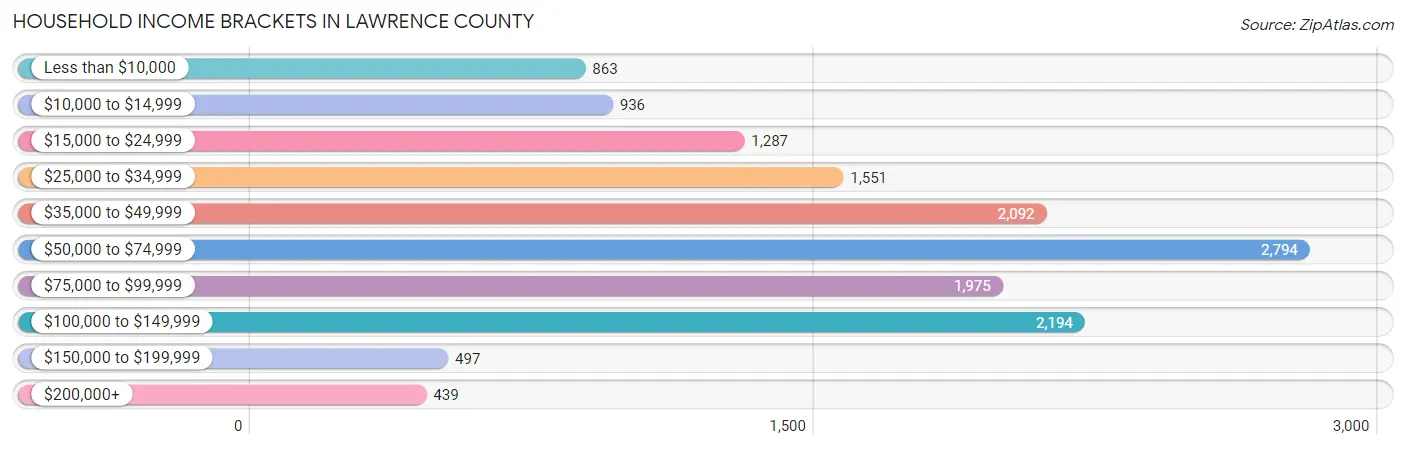
Household Income Brackets in Lawrence County
With 2,794 households falling in the category, the $50,000 to $74,999 income range is the most frequent in Lawrence County, accounting for 19.1% of all households. In contrast, only 439 households (3.0%) fall into the $200,000+ income bracket, making it the least populous group.
| Income Bracket | # Households | % Households |
| Less than $10,000 | 863 | 5.9% |
| $10,000 to $14,999 | 936 | 6.4% |
| $15,000 to $24,999 | 1,287 | 8.8% |
| $25,000 to $34,999 | 1,551 | 10.6% |
| $35,000 to $49,999 | 2,092 | 14.3% |
| $50,000 to $74,999 | 2,794 | 19.1% |
| $75,000 to $99,999 | 1,975 | 13.5% |
| $100,000 to $149,999 | 2,194 | 15.0% |
| $150,000 to $199,999 | 497 | 3.4% |
| $200,000+ | 439 | 3.0% |
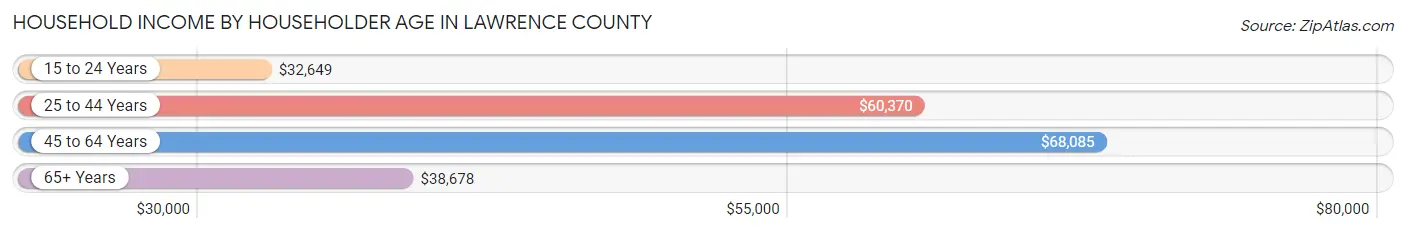
Household Income by Householder Age in Lawrence County
The median household income in Lawrence County is $52,225, with the highest median household income of $68,085 found in the 45 to 64 years age bracket for the primary householder. A total of 5,226 households (35.7%) fall into this category. Meanwhile, the 15 to 24 years age bracket for the primary householder has the lowest median household income of $32,649, with 733 households (5.0%) in this group.
| Income Bracket | # Households | Median Income |
| 15 to 24 Years | 733 (5.0%) | $32,649 |
| 25 to 44 Years | 4,301 (29.4%) | $60,370 |
| 45 to 64 Years | 5,226 (35.7%) | $68,085 |
| 65+ Years | 4,369 (29.9%) | $38,678 |
| Total | 14,629 (100.0%) | $52,225 |
Poverty in Lawrence County
Income Below Poverty by Sex and Age in Lawrence County
With 11.6% poverty level for males and 17.7% for females among the residents of Lawrence County, 12 to 14 year old males and 15 year old females are the most vulnerable to poverty, with 211 males (24.9%) and 115 females (45.8%) in their respective age groups living below the poverty level.
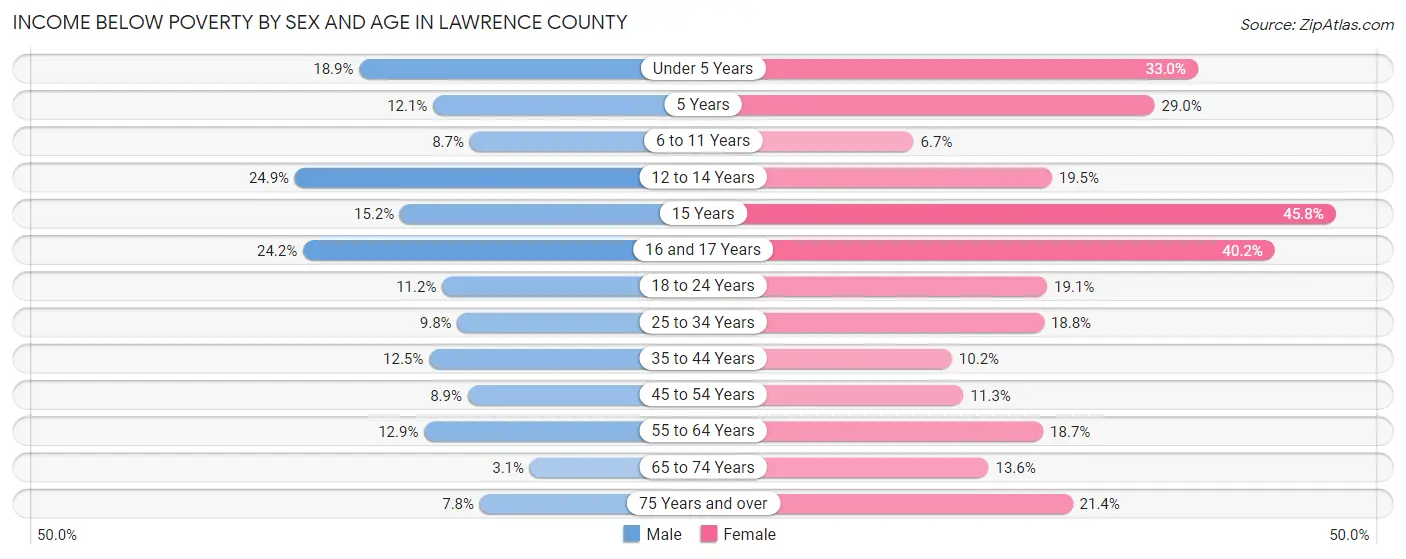
| Age Bracket | Male | Female |
| Under 5 Years | 239 (18.9%) | 375 (33.0%) |
| 5 Years | 18 (12.1%) | 72 (29.0%) |
| 6 to 11 Years | 154 (8.7%) | 94 (6.7%) |
| 12 to 14 Years | 211 (24.9%) | 162 (19.5%) |
| 15 Years | 45 (15.1%) | 115 (45.8%) |
| 16 and 17 Years | 136 (24.2%) | 237 (40.2%) |
| 18 to 24 Years | 187 (11.2%) | 284 (19.1%) |
| 25 to 34 Years | 204 (9.8%) | 418 (18.8%) |
| 35 to 44 Years | 305 (12.5%) | 231 (10.2%) |
| 45 to 54 Years | 201 (8.9%) | 245 (11.3%) |
| 55 to 64 Years | 323 (12.9%) | 472 (18.7%) |
| 65 to 74 Years | 55 (3.1%) | 261 (13.6%) |
| 75 Years and over | 87 (7.7%) | 355 (21.4%) |
| Total | 2,165 (11.6%) | 3,321 (17.7%) |
Income Above Poverty by Sex and Age in Lawrence County
According to the poverty statistics in Lawrence County, males aged 65 to 74 years and females aged 6 to 11 years are the age groups that are most secure financially, with 96.9% of males and 93.3% of females in these age groups living above the poverty line.
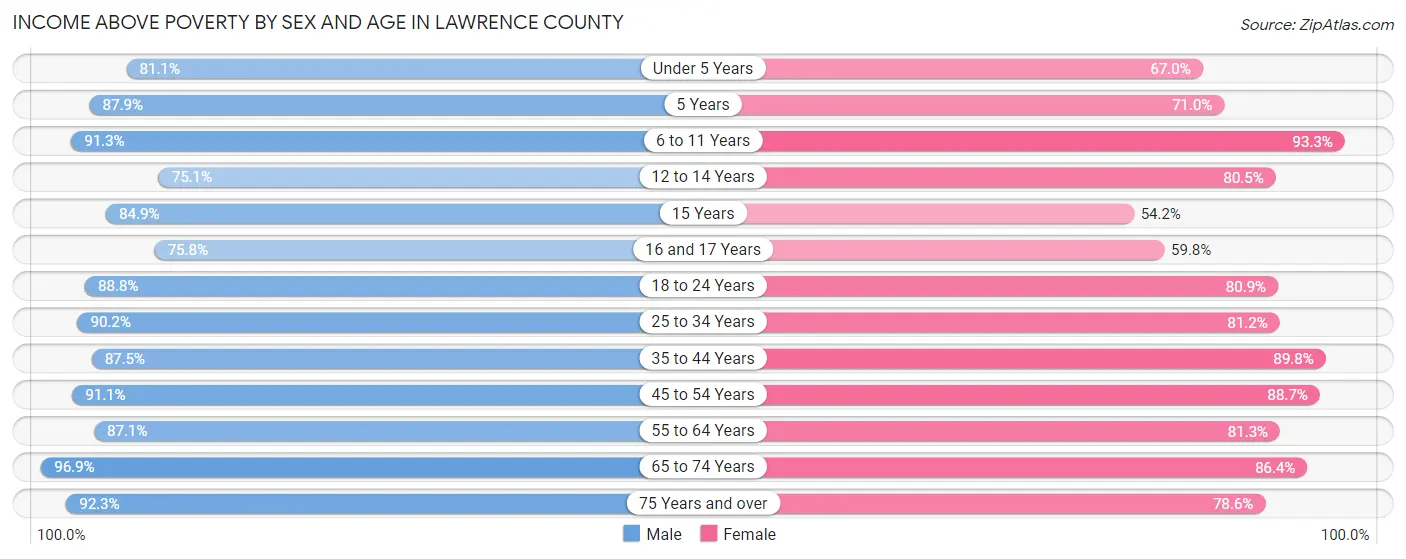
| Age Bracket | Male | Female |
| Under 5 Years | 1,023 (81.1%) | 760 (67.0%) |
| 5 Years | 131 (87.9%) | 176 (71.0%) |
| 6 to 11 Years | 1,621 (91.3%) | 1,315 (93.3%) |
| 12 to 14 Years | 636 (75.1%) | 669 (80.5%) |
| 15 Years | 252 (84.9%) | 136 (54.2%) |
| 16 and 17 Years | 427 (75.8%) | 353 (59.8%) |
| 18 to 24 Years | 1,477 (88.8%) | 1,206 (80.9%) |
| 25 to 34 Years | 1,871 (90.2%) | 1,810 (81.2%) |
| 35 to 44 Years | 2,142 (87.5%) | 2,029 (89.8%) |
| 45 to 54 Years | 2,066 (91.1%) | 1,921 (88.7%) |
| 55 to 64 Years | 2,178 (87.1%) | 2,053 (81.3%) |
| 65 to 74 Years | 1,713 (96.9%) | 1,656 (86.4%) |
| 75 Years and over | 1,035 (92.2%) | 1,302 (78.6%) |
| Total | 16,572 (88.4%) | 15,386 (82.3%) |
Income Below Poverty Among Married-Couple Families in Lawrence County
The poverty statistics for married-couple families in Lawrence County show that 6.1% or 452 of the total 7,367 families live below the poverty line. Families with 5 or more children have the highest poverty rate of 36.4%, comprising of 16 families. On the other hand, families with no children have the lowest poverty rate of 4.1%, which includes 174 families.
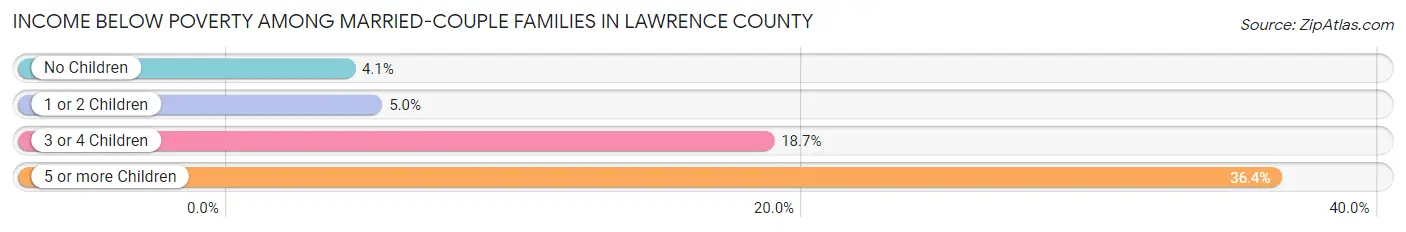
| Children | Above Poverty | Below Poverty |
| No Children | 4,098 (95.9%) | 174 (4.1%) |
| 1 or 2 Children | 2,140 (95.0%) | 113 (5.0%) |
| 3 or 4 Children | 649 (81.3%) | 149 (18.7%) |
| 5 or more Children | 28 (63.6%) | 16 (36.4%) |
| Total | 6,915 (93.9%) | 452 (6.1%) |
Income Below Poverty Among Single-Parent Households in Lawrence County
According to the poverty data in Lawrence County, 17.6% or 143 single-father households and 28.4% or 467 single-mother households are living below the poverty line. Among single-father households, those with 3 or 4 children have the highest poverty rate, with 19 households (28.8%) experiencing poverty. Likewise, among single-mother households, those with 5 or more children have the highest poverty rate, with 2 households (100.0%) falling below the poverty line.
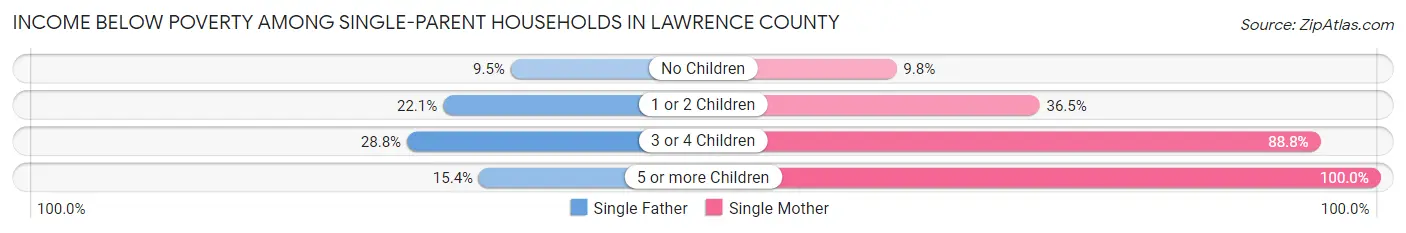
| Children | Single Father | Single Mother |
| No Children | 30 (9.5%) | 72 (9.8%) |
| 1 or 2 Children | 92 (22.1%) | 290 (36.5%) |
| 3 or 4 Children | 19 (28.8%) | 103 (88.8%) |
| 5 or more Children | 2 (15.4%) | 2 (100.0%) |
| Total | 143 (17.6%) | 467 (28.4%) |
Income Below Poverty Among Married-Couple vs Single-Parent Households in Lawrence County
The poverty data for Lawrence County shows that 452 of the married-couple family households (6.1%) and 610 of the single-parent households (24.8%) are living below the poverty level. Within the married-couple family households, those with 5 or more children have the highest poverty rate, with 16 households (36.4%) falling below the poverty line. Among the single-parent households, those with 3 or 4 children have the highest poverty rate, with 122 household (67.0%) living below poverty.
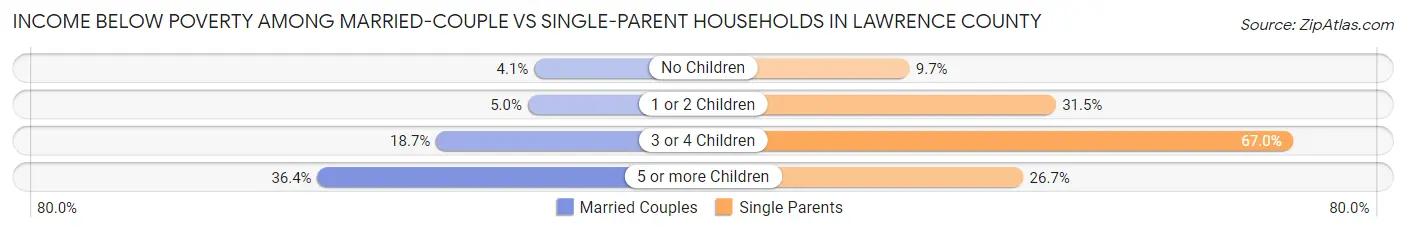
| Children | Married-Couple Families | Single-Parent Households |
| No Children | 174 (4.1%) | 102 (9.7%) |
| 1 or 2 Children | 113 (5.0%) | 382 (31.5%) |
| 3 or 4 Children | 149 (18.7%) | 122 (67.0%) |
| 5 or more Children | 16 (36.4%) | 4 (26.7%) |
| Total | 452 (6.1%) | 610 (24.8%) |
Employment Characteristics in Lawrence County
Employment by Class of Employer in Lawrence County
Among the 16,375 employed individuals in Lawrence County, private company employees (11,523 | 70.4%), local government employees (1,321 | 8.1%), and not-for-profit organizations (1,164 | 7.1%) make up the most common classes of employment.
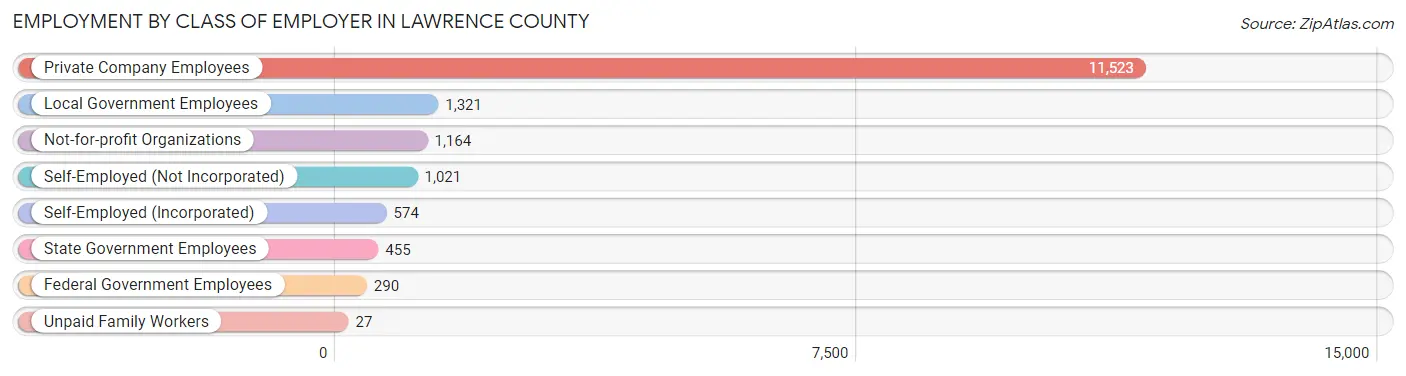
| Employer Class | # Employees | % Employees |
| Private Company Employees | 11,523 | 70.4% |
| Self-Employed (Incorporated) | 574 | 3.5% |
| Self-Employed (Not Incorporated) | 1,021 | 6.2% |
| Not-for-profit Organizations | 1,164 | 7.1% |
| Local Government Employees | 1,321 | 8.1% |
| State Government Employees | 455 | 2.8% |
| Federal Government Employees | 290 | 1.8% |
| Unpaid Family Workers | 27 | 0.2% |
| Total | 16,375 | 100.0% |
Employment Status by Age in Lawrence County
According to the labor force statistics for Lawrence County, out of the total population over 16 years of age (29,763), 59.5% or 17,709 individuals are in the labor force, with 5.2% or 921 of them unemployed. The age group with the highest labor force participation rate is 20 to 24 years, with 86.4% or 1,890 individuals in the labor force. Within the labor force, the 16 to 19 years age range has the highest percentage of unemployed individuals, with 17.8% or 211 of them being unemployed.
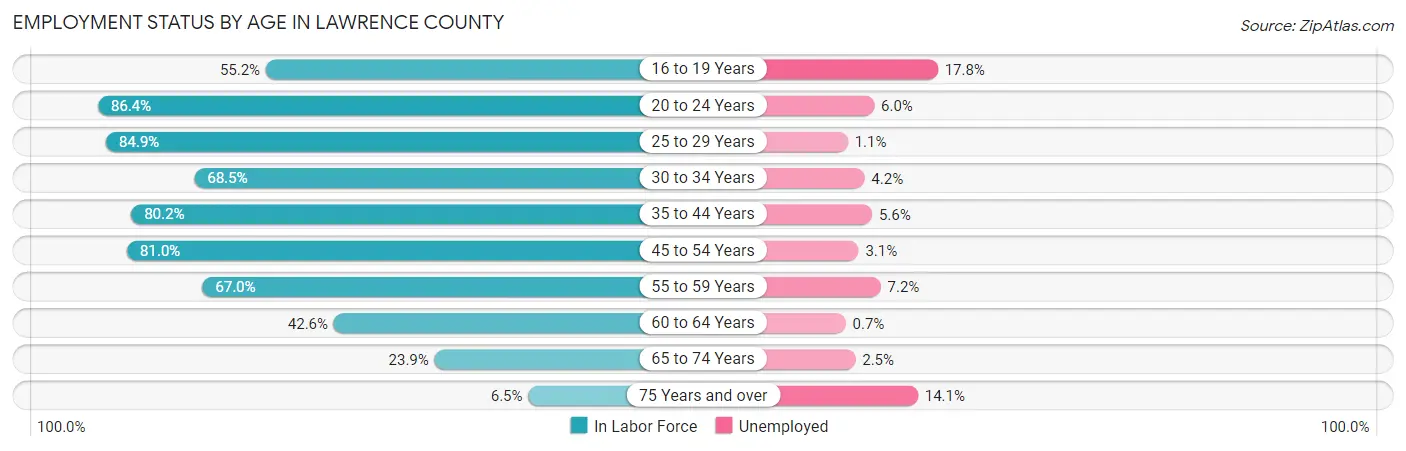
| Age Bracket | In Labor Force | Unemployed |
| 16 to 19 Years | 1,187 (55.2%) | 211 (17.8%) |
| 20 to 24 Years | 1,890 (86.4%) | 113 (6.0%) |
| 25 to 29 Years | 1,819 (84.9%) | 20 (1.1%) |
| 30 to 34 Years | 1,507 (68.5%) | 63 (4.2%) |
| 35 to 44 Years | 3,797 (80.2%) | 213 (5.6%) |
| 45 to 54 Years | 3,609 (81.0%) | 112 (3.1%) |
| 55 to 59 Years | 1,753 (67.0%) | 126 (7.2%) |
| 60 to 64 Years | 1,030 (42.6%) | 7 (0.7%) |
| 65 to 74 Years | 903 (23.9%) | 23 (2.5%) |
| 75 Years and over | 200 (6.5%) | 28 (14.1%) |
| Total | 17,709 (59.5%) | 921 (5.2%) |
Employment Status by Educational Attainment in Lawrence County
According to labor force statistics for Lawrence County, 72.8% of individuals (13,518) out of the total population between 25 and 64 years of age (18,568) are in the labor force, with 4.0% or 541 of them being unemployed. The group with the highest labor force participation rate are those with the educational attainment of bachelor's degree or higher, with 78.4% or 2,349 individuals in the labor force. Within the labor force, individuals with less than high school education have the highest percentage of unemployment, with 10.8% or 154 of them being unemployed.
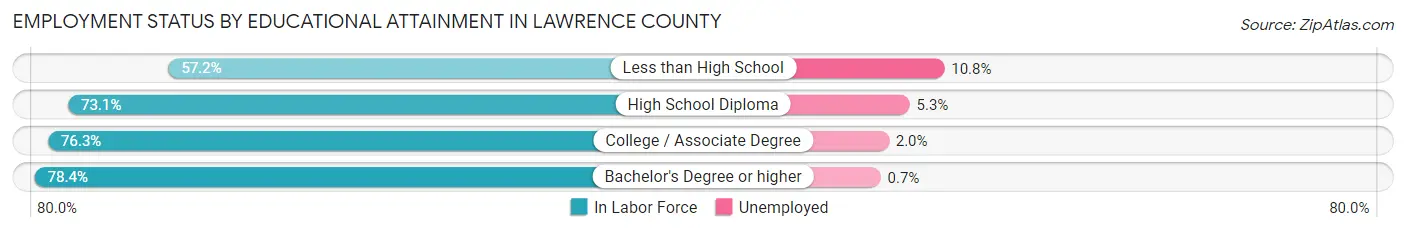
| Educational Attainment | In Labor Force | Unemployed |
| Less than High School | 1,429 (57.2%) | 270 (10.8%) |
| High School Diploma | 5,404 (73.1%) | 392 (5.3%) |
| College / Associate Degree | 4,335 (76.3%) | 114 (2.0%) |
| Bachelor's Degree or higher | 2,349 (78.4%) | 21 (0.7%) |
| Total | 13,518 (72.8%) | 743 (4.0%) |
Employment Occupations by Sex in Lawrence County
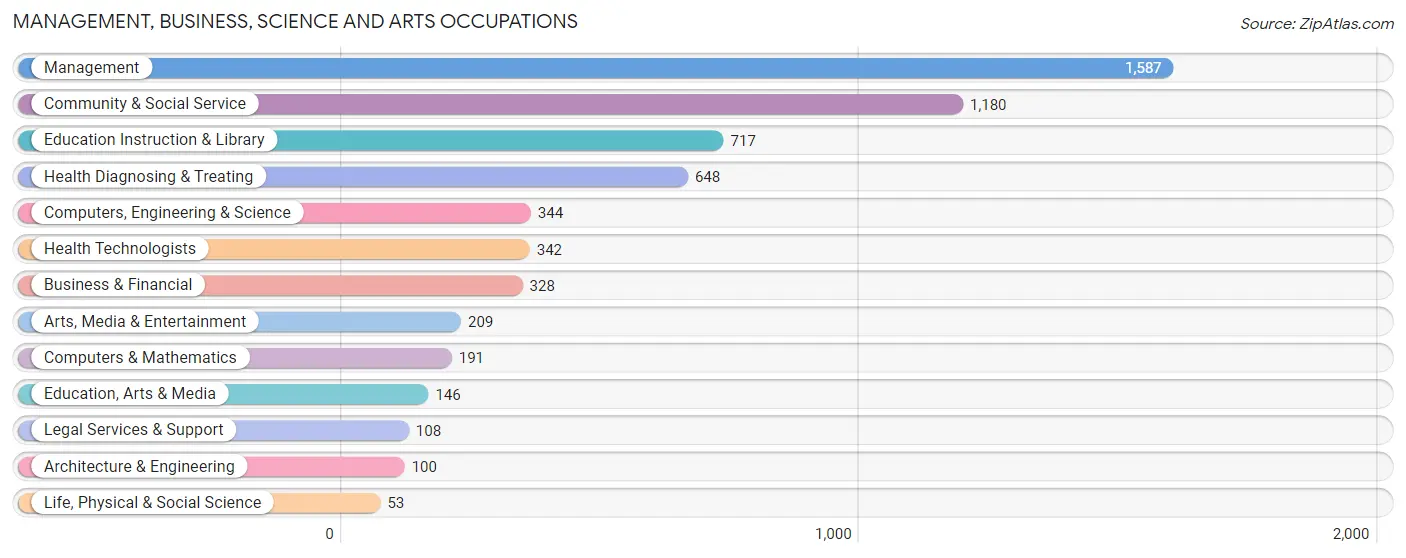
Management, Business, Science and Arts Occupations
The most common Management, Business, Science and Arts occupations in Lawrence County are Management (1,587 | 9.5%), Community & Social Service (1,180 | 7.1%), Education Instruction & Library (717 | 4.3%), Health Diagnosing & Treating (648 | 3.9%), and Computers, Engineering & Science (344 | 2.1%).
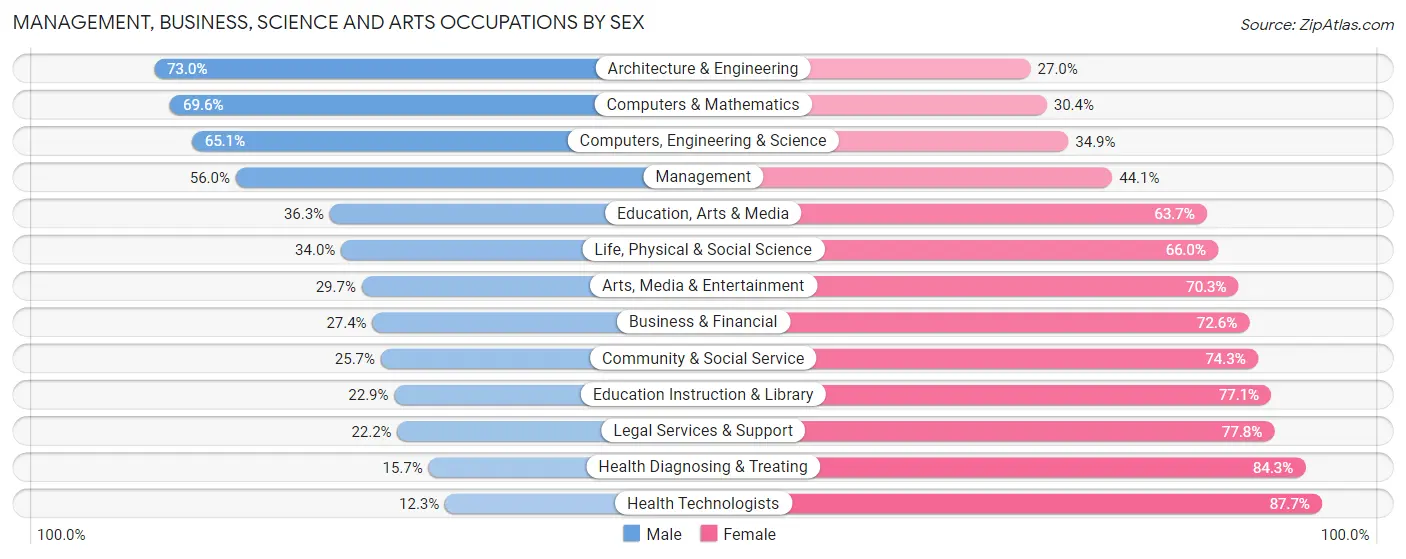
Management, Business, Science and Arts Occupations by Sex
Within the Management, Business, Science and Arts occupations in Lawrence County, the most male-oriented occupations are Architecture & Engineering (73.0%), Computers & Mathematics (69.6%), and Computers, Engineering & Science (65.1%), while the most female-oriented occupations are Health Technologists (87.7%), Health Diagnosing & Treating (84.3%), and Legal Services & Support (77.8%).
| Occupation | Male | Female |
| Management | 888 (55.9%) | 699 (44.1%) |
| Business & Financial | 90 (27.4%) | 238 (72.6%) |
| Computers, Engineering & Science | 224 (65.1%) | 120 (34.9%) |
| Computers & Mathematics | 133 (69.6%) | 58 (30.4%) |
| Architecture & Engineering | 73 (73.0%) | 27 (27.0%) |
| Life, Physical & Social Science | 18 (34.0%) | 35 (66.0%) |
| Community & Social Service | 303 (25.7%) | 877 (74.3%) |
| Education, Arts & Media | 53 (36.3%) | 93 (63.7%) |
| Legal Services & Support | 24 (22.2%) | 84 (77.8%) |
| Education Instruction & Library | 164 (22.9%) | 553 (77.1%) |
| Arts, Media & Entertainment | 62 (29.7%) | 147 (70.3%) |
| Health Diagnosing & Treating | 102 (15.7%) | 546 (84.3%) |
| Health Technologists | 42 (12.3%) | 300 (87.7%) |
| Total (Category) | 1,607 (39.3%) | 2,480 (60.7%) |
| Total (Overall) | 8,811 (52.7%) | 7,897 (47.3%) |
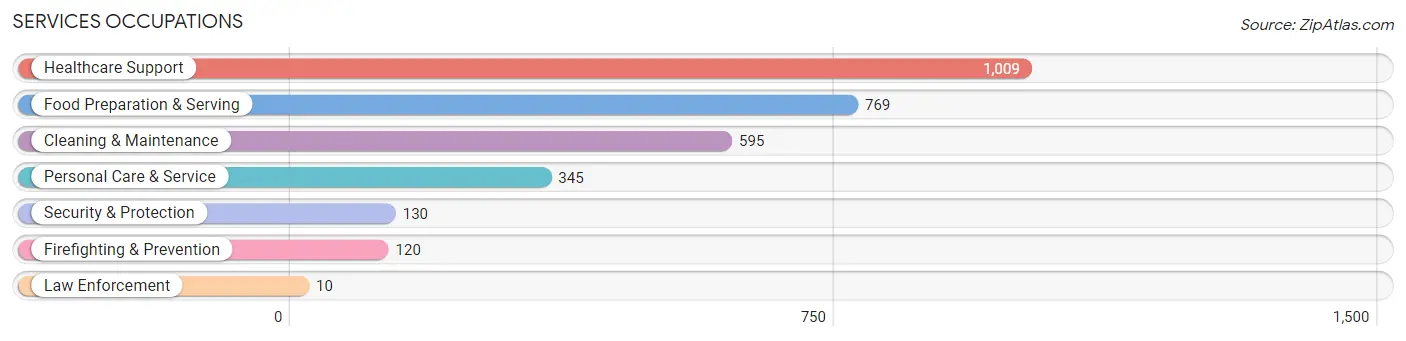
Services Occupations
The most common Services occupations in Lawrence County are Healthcare Support (1,009 | 6.0%), Food Preparation & Serving (769 | 4.6%), Cleaning & Maintenance (595 | 3.6%), Personal Care & Service (345 | 2.1%), and Security & Protection (130 | 0.8%).
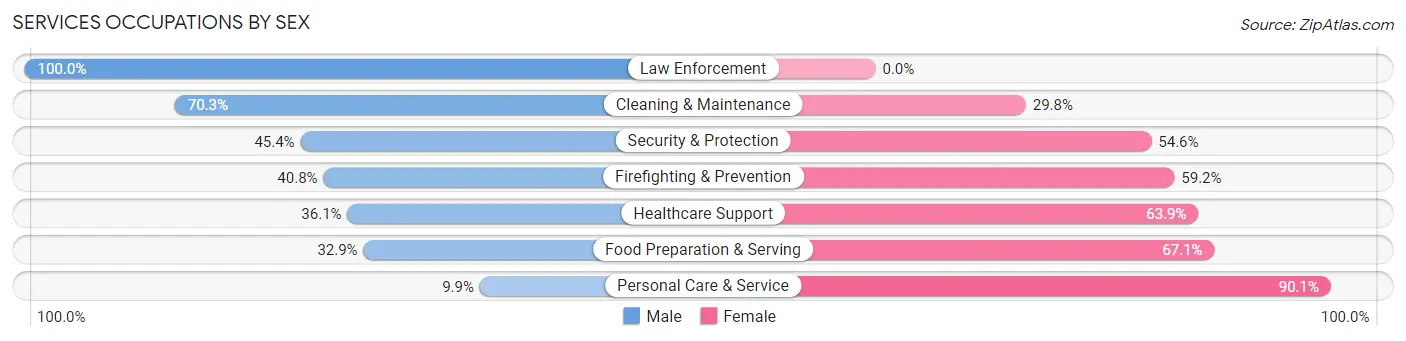
Services Occupations by Sex
Within the Services occupations in Lawrence County, the most male-oriented occupations are Law Enforcement (100.0%), Cleaning & Maintenance (70.3%), and Security & Protection (45.4%), while the most female-oriented occupations are Personal Care & Service (90.1%), Food Preparation & Serving (67.1%), and Healthcare Support (63.9%).
| Occupation | Male | Female |
| Healthcare Support | 364 (36.1%) | 645 (63.9%) |
| Security & Protection | 59 (45.4%) | 71 (54.6%) |
| Firefighting & Prevention | 49 (40.8%) | 71 (59.2%) |
| Law Enforcement | 10 (100.0%) | 0 (0.0%) |
| Food Preparation & Serving | 253 (32.9%) | 516 (67.1%) |
| Cleaning & Maintenance | 418 (70.3%) | 177 (29.7%) |
| Personal Care & Service | 34 (9.9%) | 311 (90.1%) |
| Total (Category) | 1,128 (39.6%) | 1,720 (60.4%) |
| Total (Overall) | 8,811 (52.7%) | 7,897 (47.3%) |
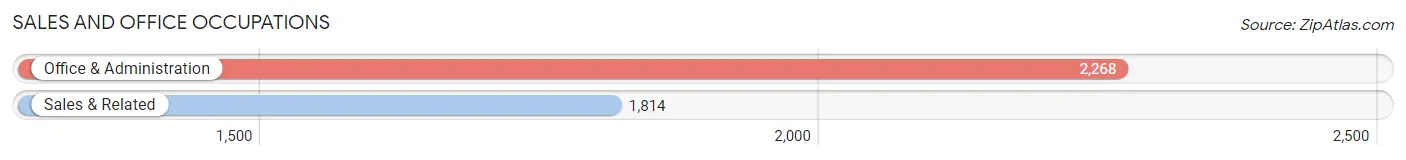
Sales and Office Occupations
The most common Sales and Office occupations in Lawrence County are Office & Administration (2,268 | 13.6%), and Sales & Related (1,814 | 10.9%).
Sales and Office Occupations by Sex
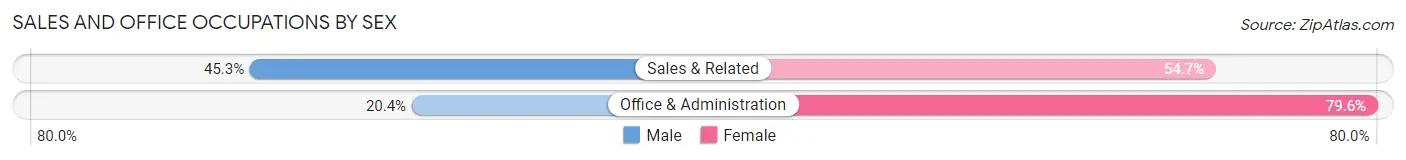
| Occupation | Male | Female |
| Sales & Related | 822 (45.3%) | 992 (54.7%) |
| Office & Administration | 463 (20.4%) | 1,805 (79.6%) |
| Total (Category) | 1,285 (31.5%) | 2,797 (68.5%) |
| Total (Overall) | 8,811 (52.7%) | 7,897 (47.3%) |
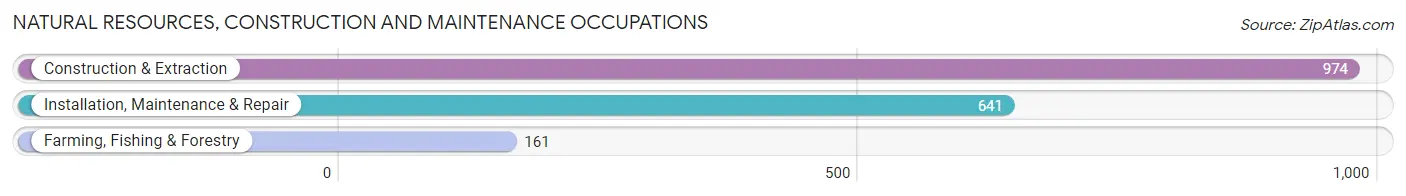
Natural Resources, Construction and Maintenance Occupations
The most common Natural Resources, Construction and Maintenance occupations in Lawrence County are Construction & Extraction (974 | 5.8%), Installation, Maintenance & Repair (641 | 3.8%), and Farming, Fishing & Forestry (161 | 1.0%).
Natural Resources, Construction and Maintenance Occupations by Sex
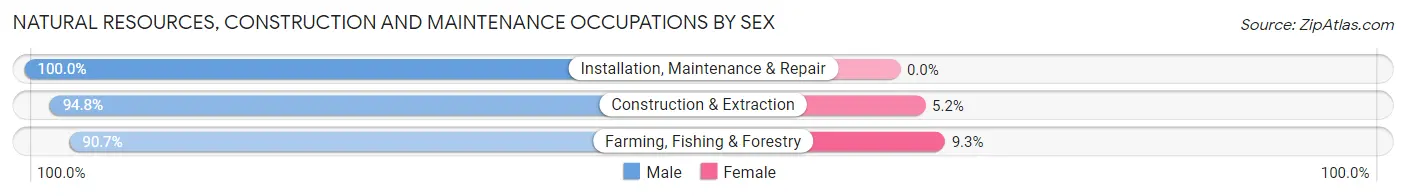
| Occupation | Male | Female |
| Farming, Fishing & Forestry | 146 (90.7%) | 15 (9.3%) |
| Construction & Extraction | 923 (94.8%) | 51 (5.2%) |
| Installation, Maintenance & Repair | 641 (100.0%) | 0 (0.0%) |
| Total (Category) | 1,710 (96.3%) | 66 (3.7%) |
| Total (Overall) | 8,811 (52.7%) | 7,897 (47.3%) |
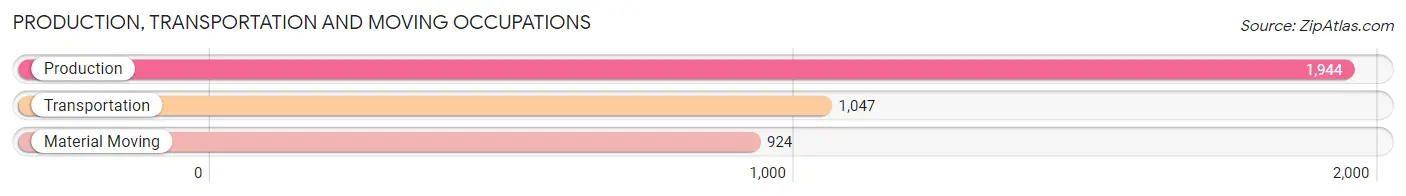
Production, Transportation and Moving Occupations
The most common Production, Transportation and Moving occupations in Lawrence County are Production (1,944 | 11.6%), Transportation (1,047 | 6.3%), and Material Moving (924 | 5.5%).
Production, Transportation and Moving Occupations by Sex
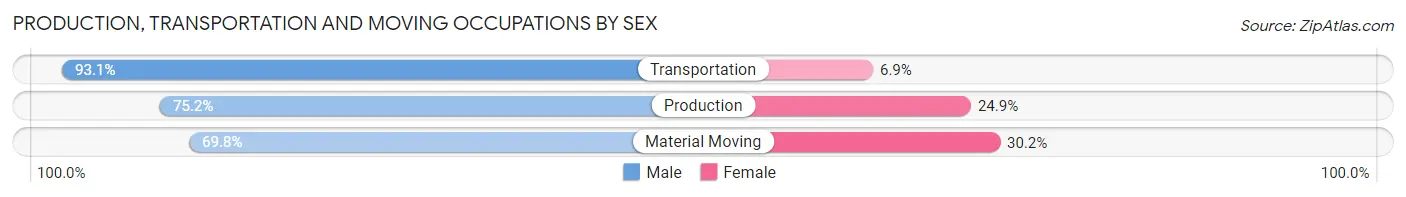
| Occupation | Male | Female |
| Production | 1,461 (75.1%) | 483 (24.8%) |
| Transportation | 975 (93.1%) | 72 (6.9%) |
| Material Moving | 645 (69.8%) | 279 (30.2%) |
| Total (Category) | 3,081 (78.7%) | 834 (21.3%) |
| Total (Overall) | 8,811 (52.7%) | 7,897 (47.3%) |
Employment Industries by Sex in Lawrence County
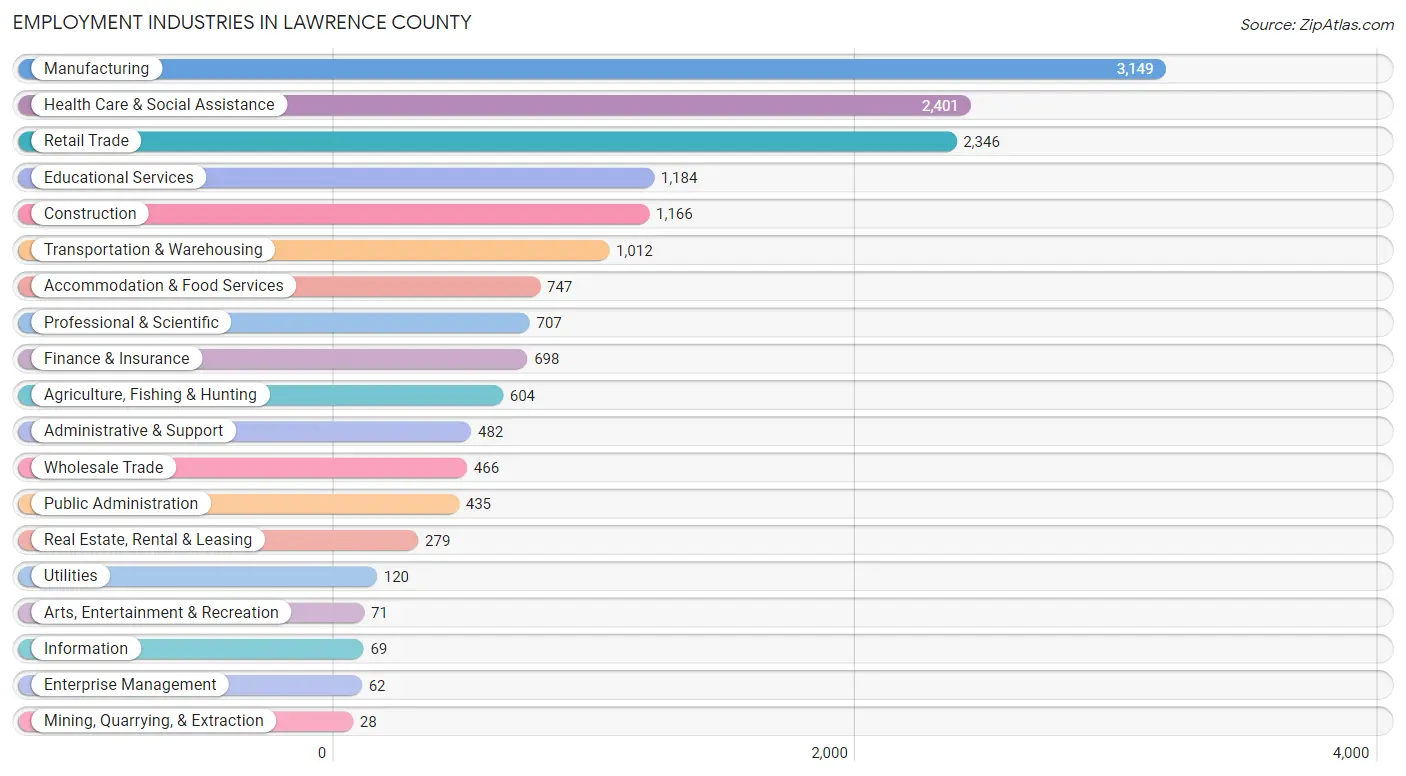
Employment Industries in Lawrence County
The major employment industries in Lawrence County include Manufacturing (3,149 | 18.9%), Health Care & Social Assistance (2,401 | 14.4%), Retail Trade (2,346 | 14.0%), Educational Services (1,184 | 7.1%), and Construction (1,166 | 7.0%).
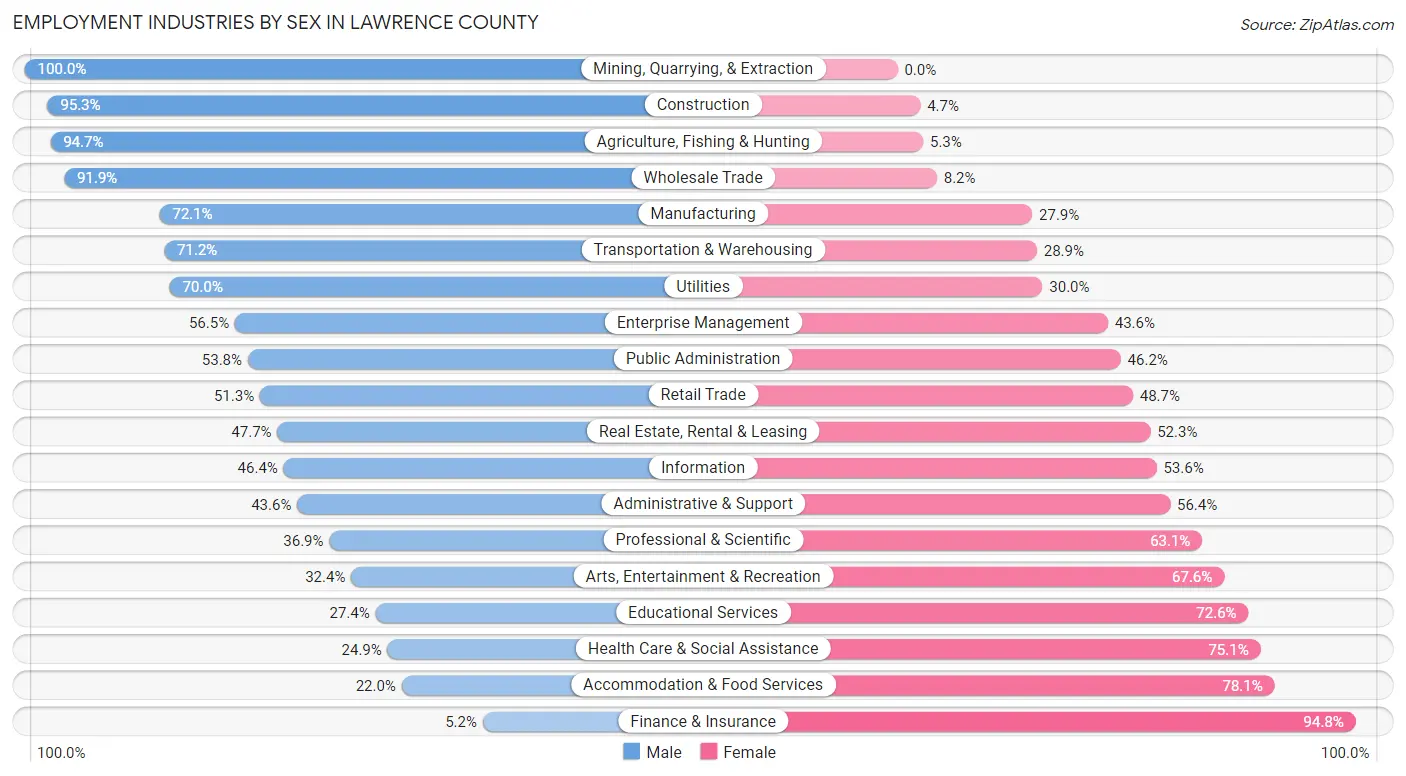
Employment Industries by Sex in Lawrence County
The Lawrence County industries that see more men than women are Mining, Quarrying, & Extraction (100.0%), Construction (95.3%), and Agriculture, Fishing & Hunting (94.7%), whereas the industries that tend to have a higher number of women are Finance & Insurance (94.8%), Accommodation & Food Services (78.0%), and Health Care & Social Assistance (75.1%).
| Industry | Male | Female |
| Agriculture, Fishing & Hunting | 572 (94.7%) | 32 (5.3%) |
| Mining, Quarrying, & Extraction | 28 (100.0%) | 0 (0.0%) |
| Construction | 1,111 (95.3%) | 55 (4.7%) |
| Manufacturing | 2,271 (72.1%) | 878 (27.9%) |
| Wholesale Trade | 428 (91.8%) | 38 (8.2%) |
| Retail Trade | 1,203 (51.3%) | 1,143 (48.7%) |
| Transportation & Warehousing | 720 (71.2%) | 292 (28.8%) |
| Utilities | 84 (70.0%) | 36 (30.0%) |
| Information | 32 (46.4%) | 37 (53.6%) |
| Finance & Insurance | 36 (5.2%) | 662 (94.8%) |
| Real Estate, Rental & Leasing | 133 (47.7%) | 146 (52.3%) |
| Professional & Scientific | 261 (36.9%) | 446 (63.1%) |
| Enterprise Management | 35 (56.5%) | 27 (43.5%) |
| Administrative & Support | 210 (43.6%) | 272 (56.4%) |
| Educational Services | 324 (27.4%) | 860 (72.6%) |
| Health Care & Social Assistance | 597 (24.9%) | 1,804 (75.1%) |
| Arts, Entertainment & Recreation | 23 (32.4%) | 48 (67.6%) |
| Accommodation & Food Services | 164 (22.0%) | 583 (78.0%) |
| Public Administration | 234 (53.8%) | 201 (46.2%) |
| Total | 8,811 (52.7%) | 7,897 (47.3%) |
Education in Lawrence County
School Enrollment in Lawrence County
The most common levels of schooling among the 8,220 students in Lawrence County are elementary school (2,350 | 28.6%), middle school (2,114 | 25.7%), and high school (1,865 | 22.7%).
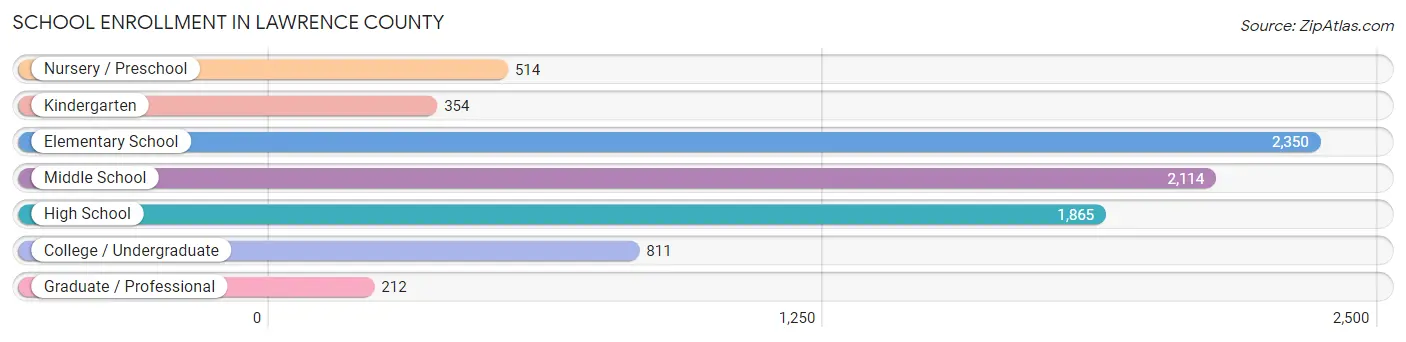
| School Level | # Students | % Students |
| Nursery / Preschool | 514 | 6.2% |
| Kindergarten | 354 | 4.3% |
| Elementary School | 2,350 | 28.6% |
| Middle School | 2,114 | 25.7% |
| High School | 1,865 | 22.7% |
| College / Undergraduate | 811 | 9.9% |
| Graduate / Professional | 212 | 2.6% |
| Total | 8,220 | 100.0% |
School Enrollment by Age by Funding Source in Lawrence County
Out of a total of 8,220 students who are enrolled in schools in Lawrence County, 1,044 (12.7%) attend a private institution, while the remaining 7,176 (87.3%) are enrolled in public schools. The age group of 35 years and over has the highest likelihood of being enrolled in private schools, with 133 (42.2% in the age bracket) enrolled. Conversely, the age group of 15 to 17 year olds has the lowest likelihood of being enrolled in a private school, with 1,374 (94.6% in the age bracket) attending a public institution.
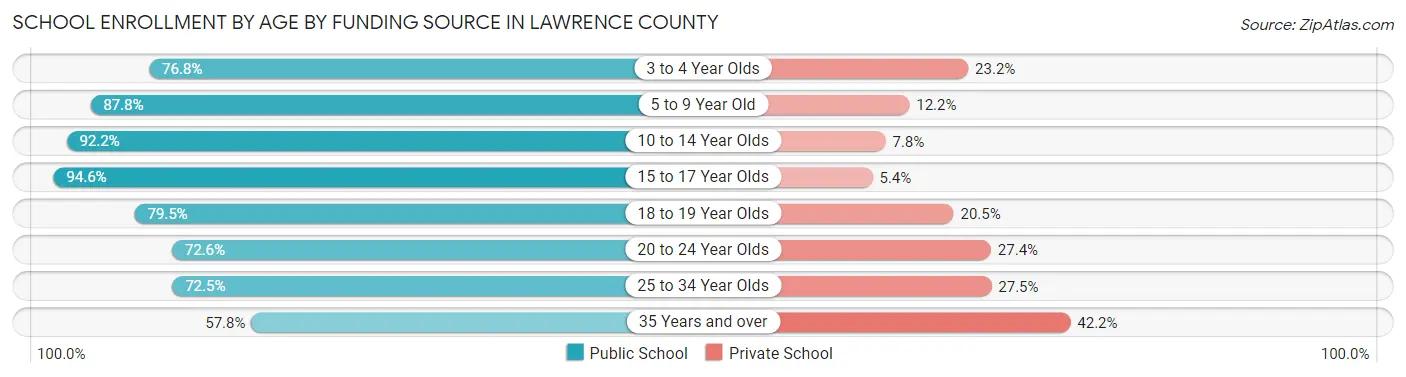
| Age Bracket | Public School | Private School |
| 3 to 4 Year Olds | 308 (76.8%) | 93 (23.2%) |
| 5 to 9 Year Old | 2,283 (87.8%) | 318 (12.2%) |
| 10 to 14 Year Olds | 2,316 (92.2%) | 196 (7.8%) |
| 15 to 17 Year Olds | 1,374 (94.6%) | 78 (5.4%) |
| 18 to 19 Year Olds | 408 (79.5%) | 105 (20.5%) |
| 20 to 24 Year Olds | 172 (72.6%) | 65 (27.4%) |
| 25 to 34 Year Olds | 137 (72.5%) | 52 (27.5%) |
| 35 Years and over | 182 (57.8%) | 133 (42.2%) |
| Total | 7,176 (87.3%) | 1,044 (12.7%) |
Educational Attainment by Field of Study in Lawrence County
Education (1,054 | 24.9%), business (814 | 19.3%), bio, nature & agricultural (433 | 10.2%), science & technology (416 | 9.9%), and arts & humanities (311 | 7.4%) are the most common fields of study among 4,225 individuals in Lawrence County who have obtained a bachelor's degree or higher.
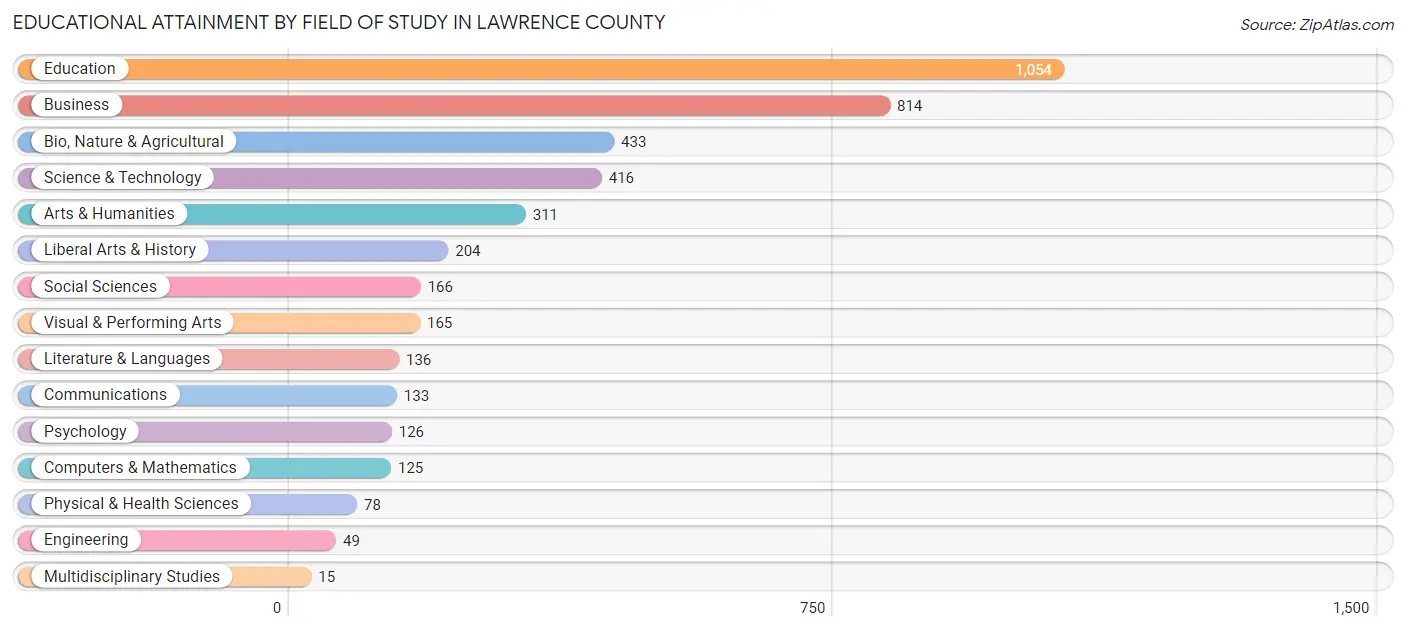
| Field of Study | # Graduates | % Graduates |
| Computers & Mathematics | 125 | 3.0% |
| Bio, Nature & Agricultural | 433 | 10.2% |
| Physical & Health Sciences | 78 | 1.8% |
| Psychology | 126 | 3.0% |
| Social Sciences | 166 | 3.9% |
| Engineering | 49 | 1.2% |
| Multidisciplinary Studies | 15 | 0.4% |
| Science & Technology | 416 | 9.9% |
| Business | 814 | 19.3% |
| Education | 1,054 | 24.9% |
| Literature & Languages | 136 | 3.2% |
| Liberal Arts & History | 204 | 4.8% |
| Visual & Performing Arts | 165 | 3.9% |
| Communications | 133 | 3.2% |
| Arts & Humanities | 311 | 7.4% |
| Total | 4,225 | 100.0% |
Transportation & Commute in Lawrence County
Vehicle Availability by Sex in Lawrence County
The most prevalent vehicle ownership categories in Lawrence County are males with 2 vehicles (2,976, accounting for 34.1%) and females with 2 vehicles (2,717, making up 38.9%).
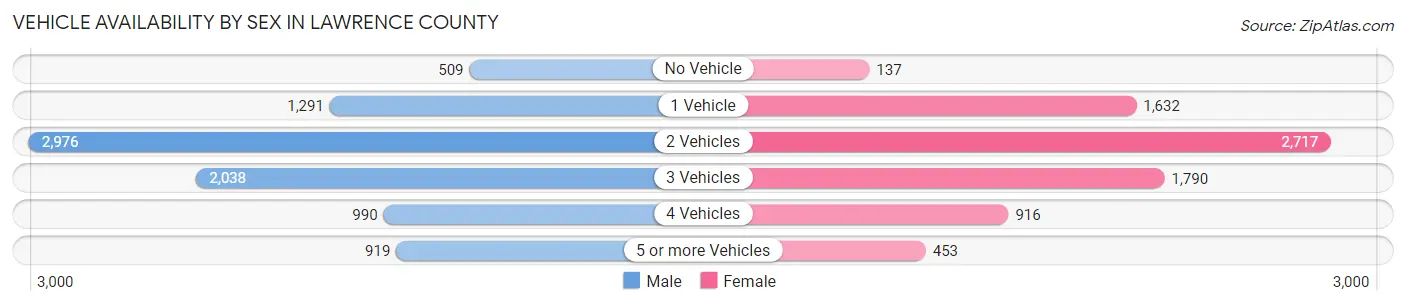
| Vehicles Available | Male | Female |
| No Vehicle | 509 (5.8%) | 137 (1.8%) |
| 1 Vehicle | 1,291 (14.8%) | 1,632 (21.3%) |
| 2 Vehicles | 2,976 (34.1%) | 2,717 (35.5%) |
| 3 Vehicles | 2,038 (23.4%) | 1,790 (23.4%) |
| 4 Vehicles | 990 (11.4%) | 916 (12.0%) |
| 5 or more Vehicles | 919 (10.5%) | 453 (5.9%) |
| Total | 8,723 (100.0%) | 7,645 (100.0%) |
Commute Time in Lawrence County
The most frequently occuring commute durations in Lawrence County are 5 to 9 minutes (2,768 commuters, 18.5%), 10 to 14 minutes (2,220 commuters, 14.9%), and 30 to 34 minutes (1,528 commuters, 10.2%).
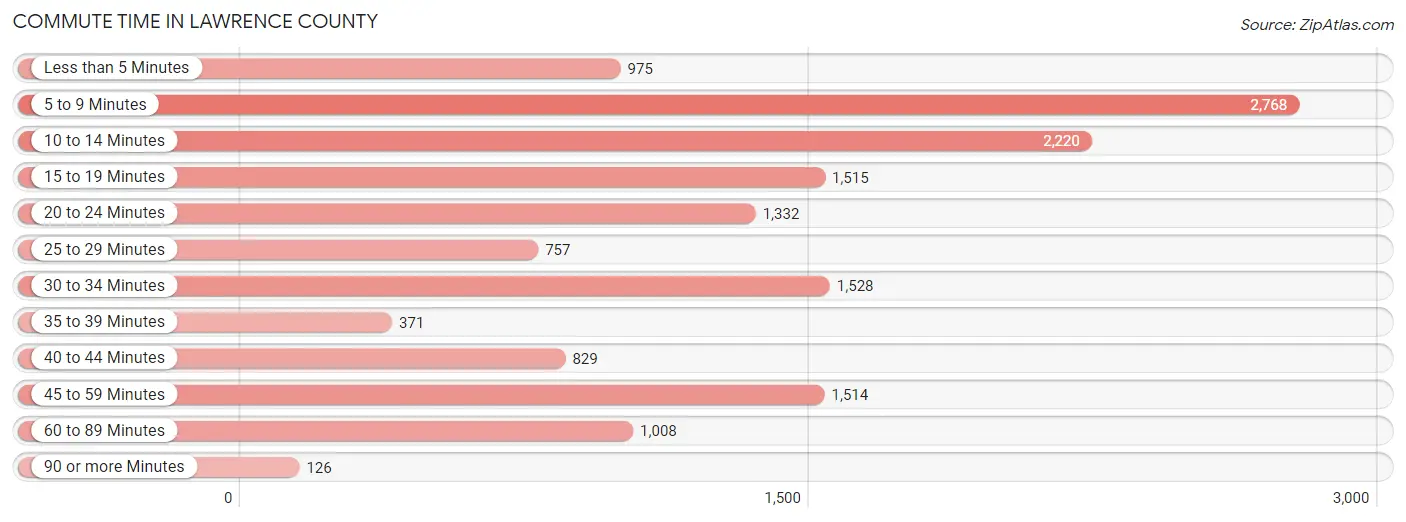
| Commute Time | # Commuters | % Commuters |
| Less than 5 Minutes | 975 | 6.5% |
| 5 to 9 Minutes | 2,768 | 18.5% |
| 10 to 14 Minutes | 2,220 | 14.9% |
| 15 to 19 Minutes | 1,515 | 10.1% |
| 20 to 24 Minutes | 1,332 | 8.9% |
| 25 to 29 Minutes | 757 | 5.1% |
| 30 to 34 Minutes | 1,528 | 10.2% |
| 35 to 39 Minutes | 371 | 2.5% |
| 40 to 44 Minutes | 829 | 5.6% |
| 45 to 59 Minutes | 1,514 | 10.1% |
| 60 to 89 Minutes | 1,008 | 6.8% |
| 90 or more Minutes | 126 | 0.8% |
Commute Time by Sex in Lawrence County
The most common commute times in Lawrence County are 10 to 14 minutes (1,138 commuters, 14.1%) for males and 5 to 9 minutes (1,665 commuters, 24.3%) for females.
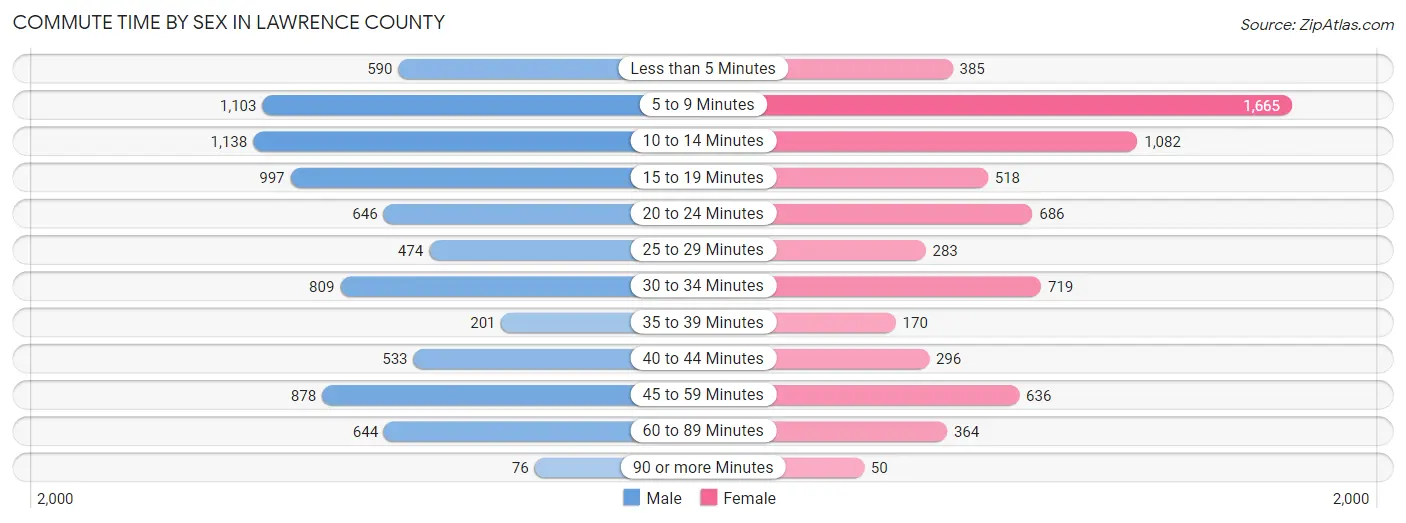
| Commute Time | Male | Female |
| Less than 5 Minutes | 590 (7.3%) | 385 (5.6%) |
| 5 to 9 Minutes | 1,103 (13.6%) | 1,665 (24.3%) |
| 10 to 14 Minutes | 1,138 (14.1%) | 1,082 (15.8%) |
| 15 to 19 Minutes | 997 (12.3%) | 518 (7.6%) |
| 20 to 24 Minutes | 646 (8.0%) | 686 (10.0%) |
| 25 to 29 Minutes | 474 (5.9%) | 283 (4.1%) |
| 30 to 34 Minutes | 809 (10.0%) | 719 (10.5%) |
| 35 to 39 Minutes | 201 (2.5%) | 170 (2.5%) |
| 40 to 44 Minutes | 533 (6.6%) | 296 (4.3%) |
| 45 to 59 Minutes | 878 (10.8%) | 636 (9.3%) |
| 60 to 89 Minutes | 644 (8.0%) | 364 (5.3%) |
| 90 or more Minutes | 76 (0.9%) | 50 (0.7%) |
Time of Departure to Work by Sex in Lawrence County
The most frequent times of departure to work in Lawrence County are 7:00 AM to 7:29 AM (1,190, 14.7%) for males and 7:00 AM to 7:29 AM (1,397, 20.4%) for females.
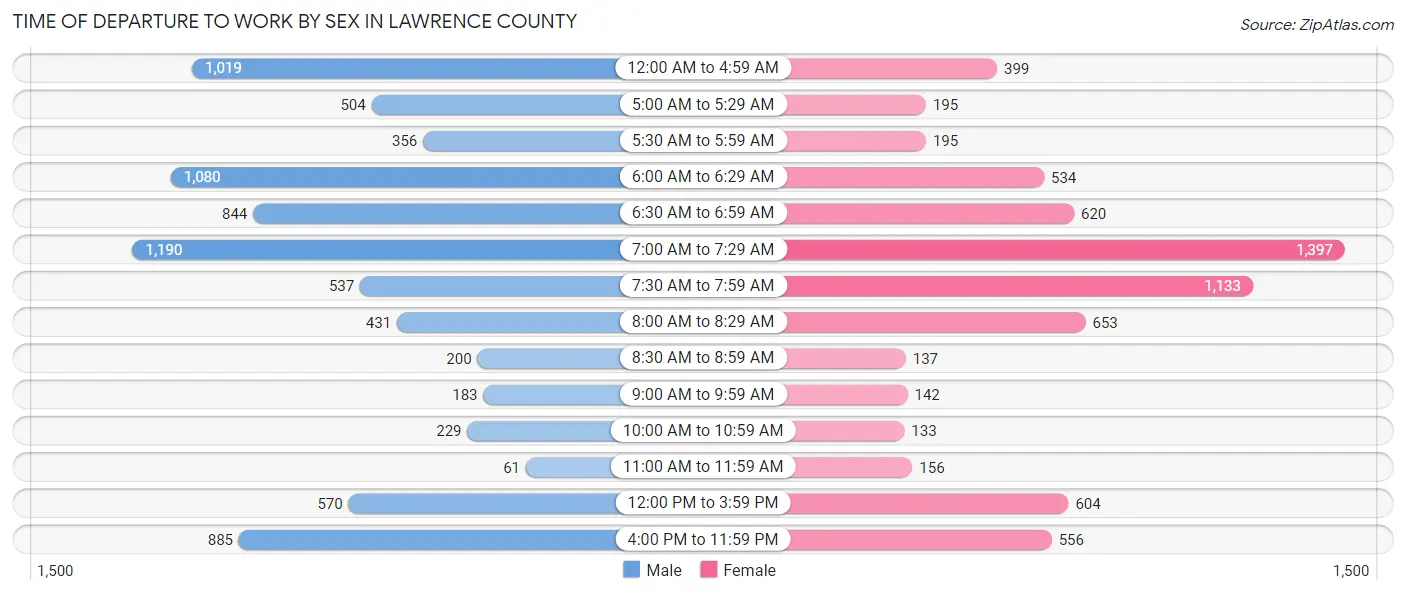
| Time of Departure | Male | Female |
| 12:00 AM to 4:59 AM | 1,019 (12.6%) | 399 (5.8%) |
| 5:00 AM to 5:29 AM | 504 (6.2%) | 195 (2.9%) |
| 5:30 AM to 5:59 AM | 356 (4.4%) | 195 (2.9%) |
| 6:00 AM to 6:29 AM | 1,080 (13.4%) | 534 (7.8%) |
| 6:30 AM to 6:59 AM | 844 (10.4%) | 620 (9.0%) |
| 7:00 AM to 7:29 AM | 1,190 (14.7%) | 1,397 (20.4%) |
| 7:30 AM to 7:59 AM | 537 (6.6%) | 1,133 (16.5%) |
| 8:00 AM to 8:29 AM | 431 (5.3%) | 653 (9.5%) |
| 8:30 AM to 8:59 AM | 200 (2.5%) | 137 (2.0%) |
| 9:00 AM to 9:59 AM | 183 (2.3%) | 142 (2.1%) |
| 10:00 AM to 10:59 AM | 229 (2.8%) | 133 (1.9%) |
| 11:00 AM to 11:59 AM | 61 (0.7%) | 156 (2.3%) |
| 12:00 PM to 3:59 PM | 570 (7.0%) | 604 (8.8%) |
| 4:00 PM to 11:59 PM | 885 (10.9%) | 556 (8.1%) |
| Total | 8,089 (100.0%) | 6,854 (100.0%) |
Housing Occupancy in Lawrence County
Occupancy by Ownership in Lawrence County
Of the total 14,629 dwellings in Lawrence County, owner-occupied units account for 10,358 (70.8%), while renter-occupied units make up 4,271 (29.2%).
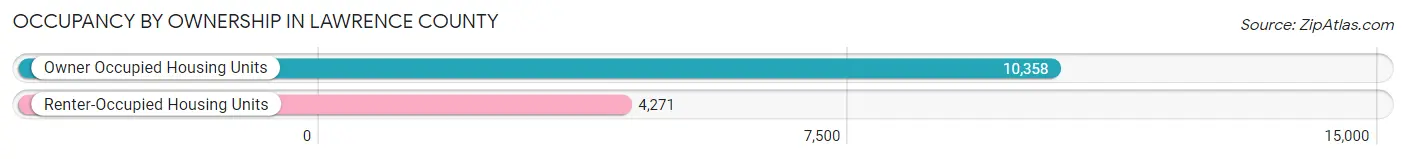
| Occupancy | # Housing Units | % Housing Units |
| Owner Occupied Housing Units | 10,358 | 70.8% |
| Renter-Occupied Housing Units | 4,271 | 29.2% |
| Total Occupied Housing Units | 14,629 | 100.0% |
Occupancy by Household Size in Lawrence County
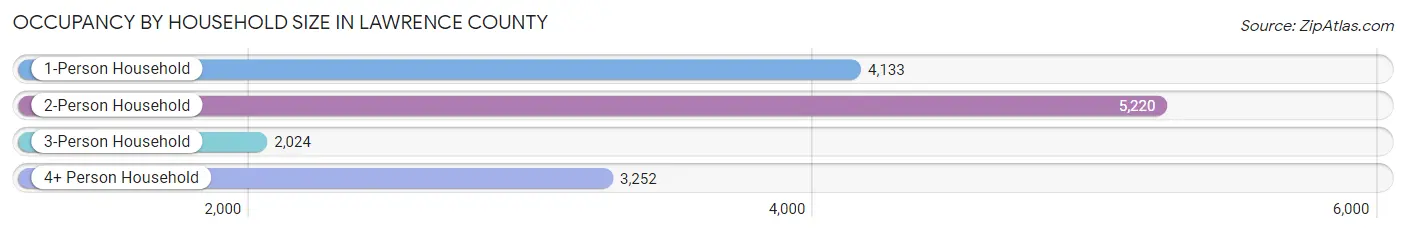
| Household Size | # Housing Units | % Housing Units |
| 1-Person Household | 4,133 | 28.2% |
| 2-Person Household | 5,220 | 35.7% |
| 3-Person Household | 2,024 | 13.8% |
| 4+ Person Household | 3,252 | 22.2% |
| Total Housing Units | 14,629 | 100.0% |
Occupancy by Ownership by Household Size in Lawrence County
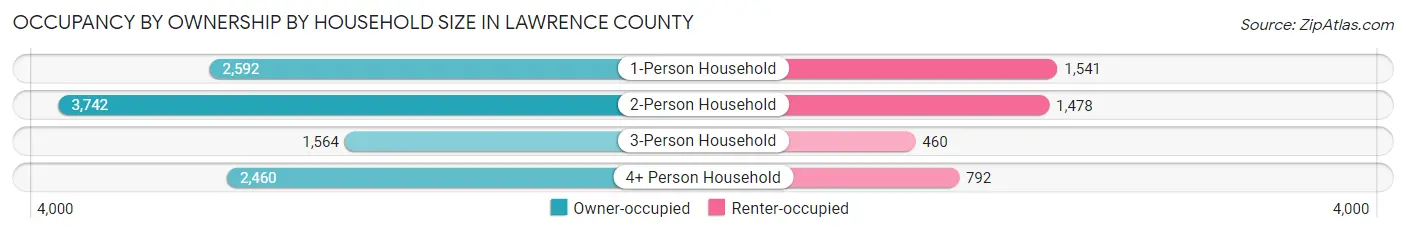
| Household Size | Owner-occupied | Renter-occupied |
| 1-Person Household | 2,592 (62.7%) | 1,541 (37.3%) |
| 2-Person Household | 3,742 (71.7%) | 1,478 (28.3%) |
| 3-Person Household | 1,564 (77.3%) | 460 (22.7%) |
| 4+ Person Household | 2,460 (75.6%) | 792 (24.3%) |
| Total Housing Units | 10,358 (70.8%) | 4,271 (29.2%) |
Occupancy by Educational Attainment in Lawrence County
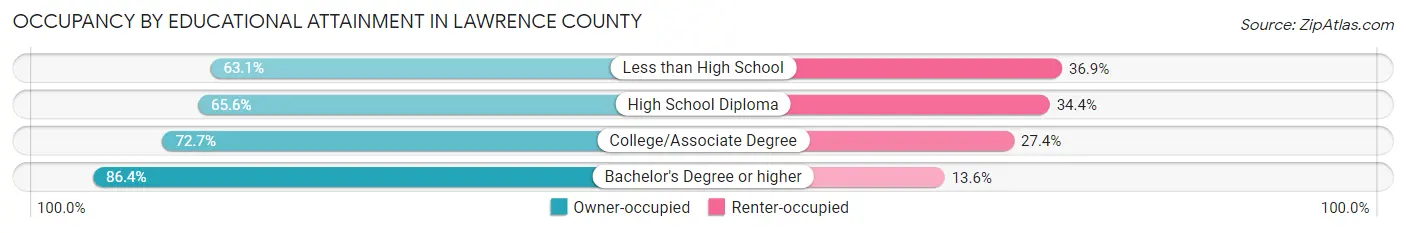
| Household Size | Owner-occupied | Renter-occupied |
| Less than High School | 1,127 (63.1%) | 658 (36.9%) |
| High School Diploma | 3,751 (65.6%) | 1,968 (34.4%) |
| College/Associate Degree | 3,573 (72.7%) | 1,345 (27.4%) |
| Bachelor's Degree or higher | 1,907 (86.4%) | 300 (13.6%) |
Occupancy by Age of Householder in Lawrence County
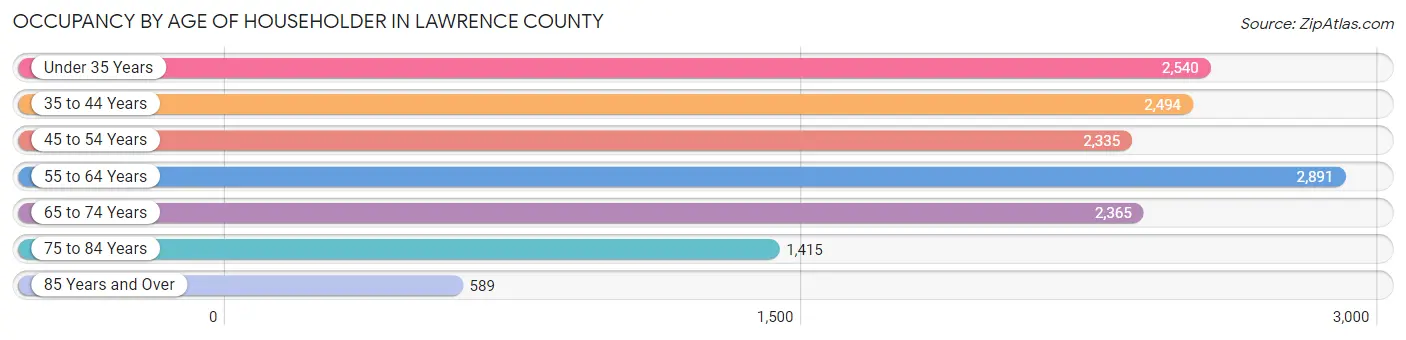
| Age Bracket | # Households | % Households |
| Under 35 Years | 2,540 | 17.4% |
| 35 to 44 Years | 2,494 | 17.1% |
| 45 to 54 Years | 2,335 | 16.0% |
| 55 to 64 Years | 2,891 | 19.8% |
| 65 to 74 Years | 2,365 | 16.2% |
| 75 to 84 Years | 1,415 | 9.7% |
| 85 Years and Over | 589 | 4.0% |
| Total | 14,629 | 100.0% |
Housing Finances in Lawrence County
Median Income by Occupancy in Lawrence County
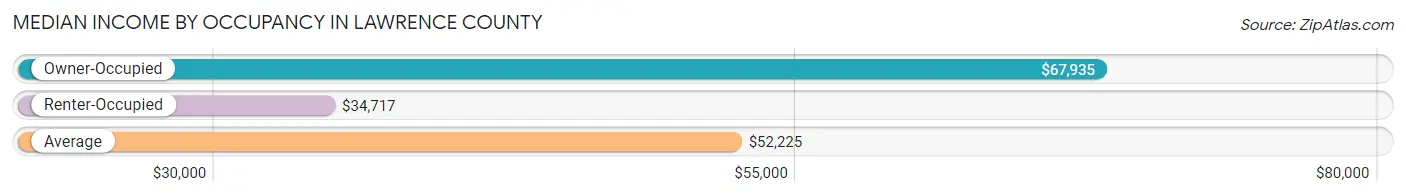
| Occupancy Type | # Households | Median Income |
| Owner-Occupied | 10,358 (70.8%) | $67,935 |
| Renter-Occupied | 4,271 (29.2%) | $34,717 |
| Average | 14,629 (100.0%) | $52,225 |
Occupancy by Householder Income Bracket in Lawrence County
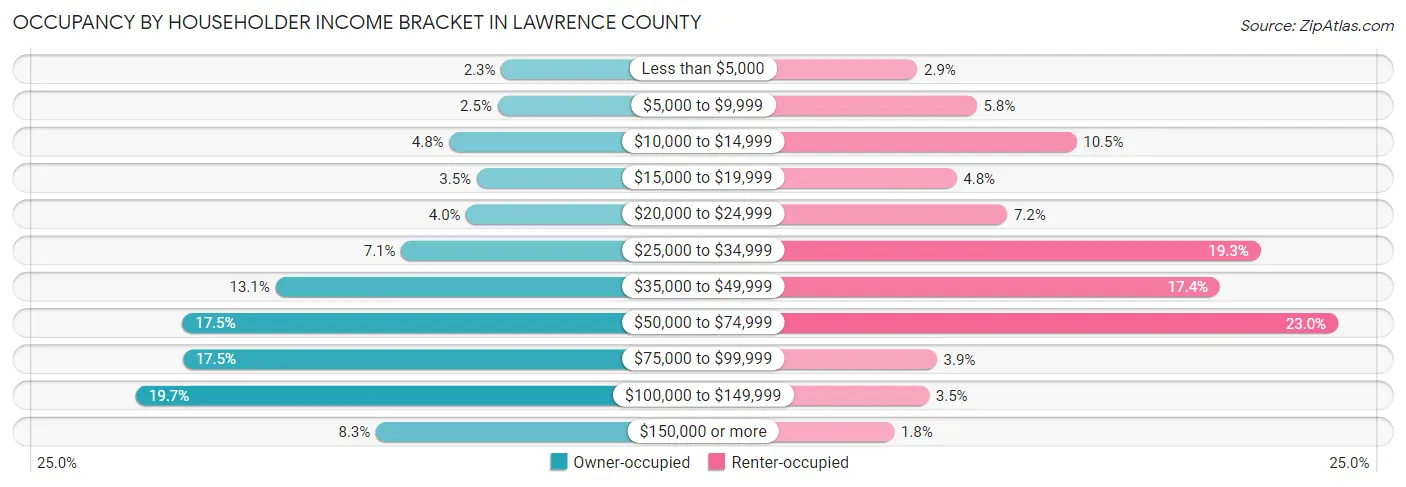
| Income Bracket | Owner-occupied | Renter-occupied |
| Less than $5,000 | 238 (2.3%) | 125 (2.9%) |
| $5,000 to $9,999 | 256 (2.5%) | 246 (5.8%) |
| $10,000 to $14,999 | 494 (4.8%) | 449 (10.5%) |
| $15,000 to $19,999 | 358 (3.5%) | 205 (4.8%) |
| $20,000 to $24,999 | 410 (4.0%) | 308 (7.2%) |
| $25,000 to $34,999 | 731 (7.1%) | 824 (19.3%) |
| $35,000 to $49,999 | 1,352 (13.1%) | 741 (17.3%) |
| $50,000 to $74,999 | 1,812 (17.5%) | 981 (23.0%) |
| $75,000 to $99,999 | 1,810 (17.5%) | 165 (3.9%) |
| $100,000 to $149,999 | 2,041 (19.7%) | 149 (3.5%) |
| $150,000 or more | 856 (8.3%) | 78 (1.8%) |
| Total | 10,358 (100.0%) | 4,271 (100.0%) |
Monthly Housing Cost Tiers in Lawrence County
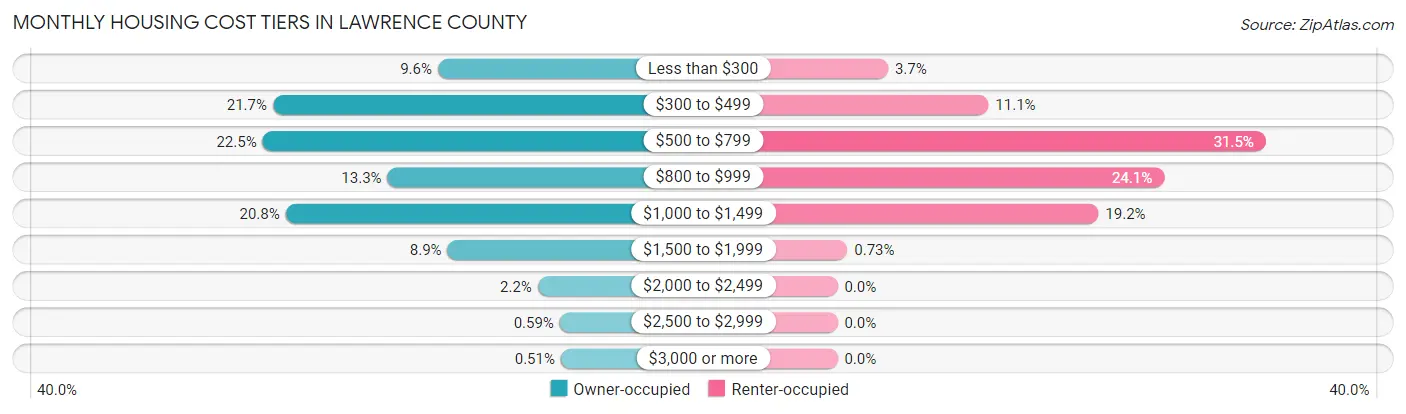
| Monthly Cost | Owner-occupied | Renter-occupied |
| Less than $300 | 991 (9.6%) | 159 (3.7%) |
| $300 to $499 | 2,250 (21.7%) | 475 (11.1%) |
| $500 to $799 | 2,328 (22.5%) | 1,347 (31.5%) |
| $800 to $999 | 1,376 (13.3%) | 1,027 (24.0%) |
| $1,000 to $1,499 | 2,152 (20.8%) | 821 (19.2%) |
| $1,500 to $1,999 | 918 (8.9%) | 31 (0.7%) |
| $2,000 to $2,499 | 229 (2.2%) | 0 (0.0%) |
| $2,500 to $2,999 | 61 (0.6%) | 0 (0.0%) |
| $3,000 or more | 53 (0.5%) | 0 (0.0%) |
| Total | 10,358 (100.0%) | 4,271 (100.0%) |
Physical Housing Characteristics in Lawrence County
Housing Structures in Lawrence County
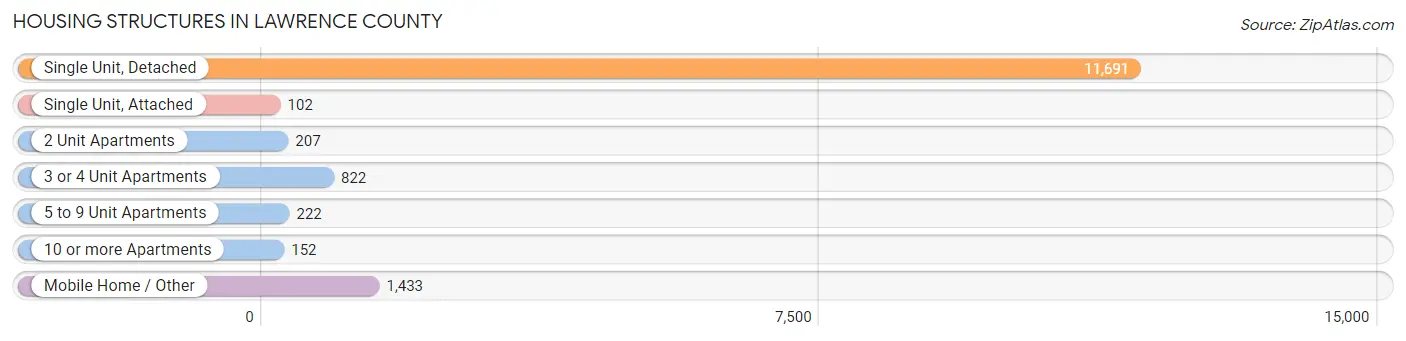
| Structure Type | # Housing Units | % Housing Units |
| Single Unit, Detached | 11,691 | 79.9% |
| Single Unit, Attached | 102 | 0.7% |
| 2 Unit Apartments | 207 | 1.4% |
| 3 or 4 Unit Apartments | 822 | 5.6% |
| 5 to 9 Unit Apartments | 222 | 1.5% |
| 10 or more Apartments | 152 | 1.0% |
| Mobile Home / Other | 1,433 | 9.8% |
| Total | 14,629 | 100.0% |
Housing Structures by Occupancy in Lawrence County
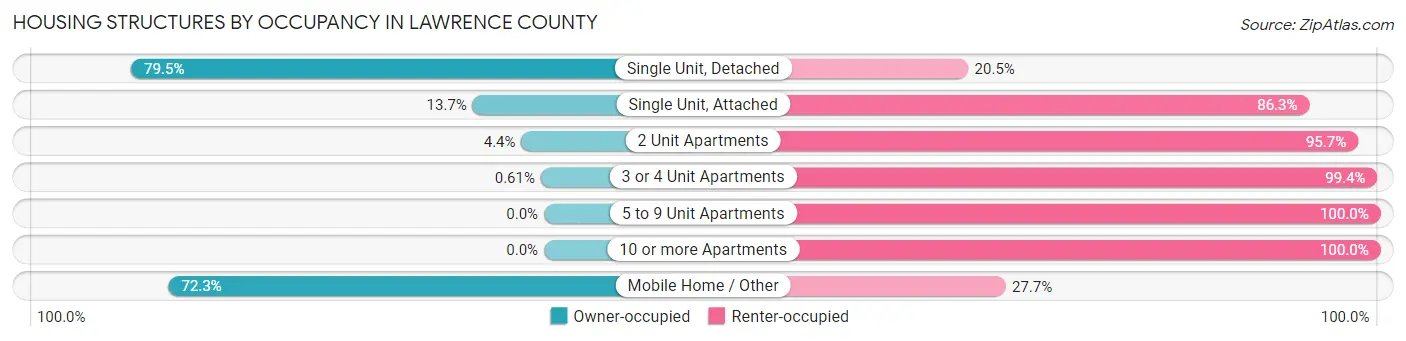
| Structure Type | Owner-occupied | Renter-occupied |
| Single Unit, Detached | 9,294 (79.5%) | 2,397 (20.5%) |
| Single Unit, Attached | 14 (13.7%) | 88 (86.3%) |
| 2 Unit Apartments | 9 (4.3%) | 198 (95.7%) |
| 3 or 4 Unit Apartments | 5 (0.6%) | 817 (99.4%) |
| 5 to 9 Unit Apartments | 0 (0.0%) | 222 (100.0%) |
| 10 or more Apartments | 0 (0.0%) | 152 (100.0%) |
| Mobile Home / Other | 1,036 (72.3%) | 397 (27.7%) |
| Total | 10,358 (70.8%) | 4,271 (29.2%) |
Housing Structures by Number of Rooms in Lawrence County

| Number of Rooms | Owner-occupied | Renter-occupied |
| 1 Room | 22 (0.2%) | 107 (2.5%) |
| 2 or 3 Rooms | 180 (1.7%) | 477 (11.2%) |
| 4 or 5 Rooms | 3,076 (29.7%) | 2,563 (60.0%) |
| 6 or 7 Rooms | 4,482 (43.3%) | 822 (19.3%) |
| 8 or more Rooms | 2,598 (25.1%) | 302 (7.1%) |
| Total | 10,358 (100.0%) | 4,271 (100.0%) |
Housing Structure by Heating Type in Lawrence County
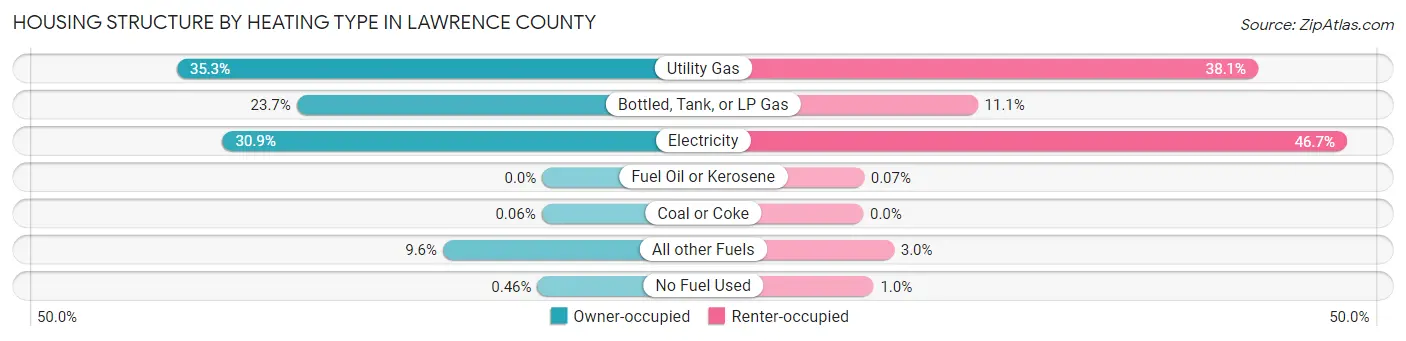
| Heating Type | Owner-occupied | Renter-occupied |
| Utility Gas | 3,655 (35.3%) | 1,629 (38.1%) |
| Bottled, Tank, or LP Gas | 2,457 (23.7%) | 473 (11.1%) |
| Electricity | 3,199 (30.9%) | 1,996 (46.7%) |
| Fuel Oil or Kerosene | 0 (0.0%) | 3 (0.1%) |
| Coal or Coke | 6 (0.1%) | 0 (0.0%) |
| All other Fuels | 993 (9.6%) | 127 (3.0%) |
| No Fuel Used | 48 (0.5%) | 43 (1.0%) |
| Total | 10,358 (100.0%) | 4,271 (100.0%) |
Household Vehicle Usage in Lawrence County
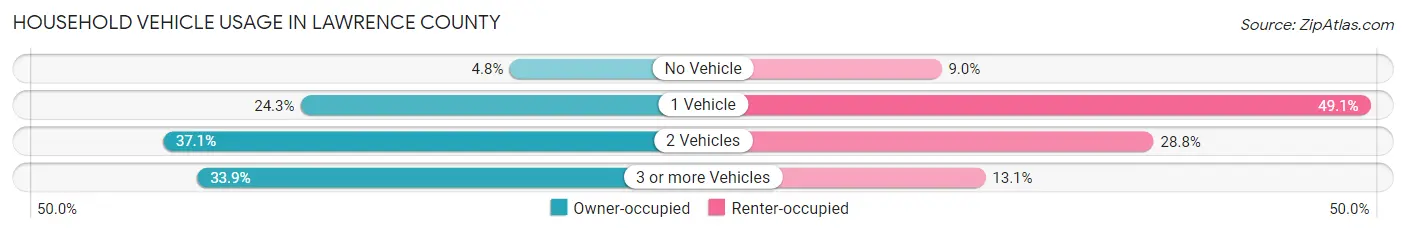
| Vehicles per Household | Owner-occupied | Renter-occupied |
| No Vehicle | 493 (4.8%) | 385 (9.0%) |
| 1 Vehicle | 2,513 (24.3%) | 2,095 (49.0%) |
| 2 Vehicles | 3,843 (37.1%) | 1,231 (28.8%) |
| 3 or more Vehicles | 3,509 (33.9%) | 560 (13.1%) |
| Total | 10,358 (100.0%) | 4,271 (100.0%) |
Real Estate & Mortgages in Lawrence County
Real Estate and Mortgage Overview in Lawrence County
| Characteristic | Without Mortgage | With Mortgage |
| Housing Units | 4,541 | 5,817 |
| Median Property Value | $141,600 | $147,800 |
| Median Household Income | $49,888 | $594 |
| Monthly Housing Costs | $421 | $18 |
| Real Estate Taxes | $892 | $306 |
Property Value by Mortgage Status in Lawrence County
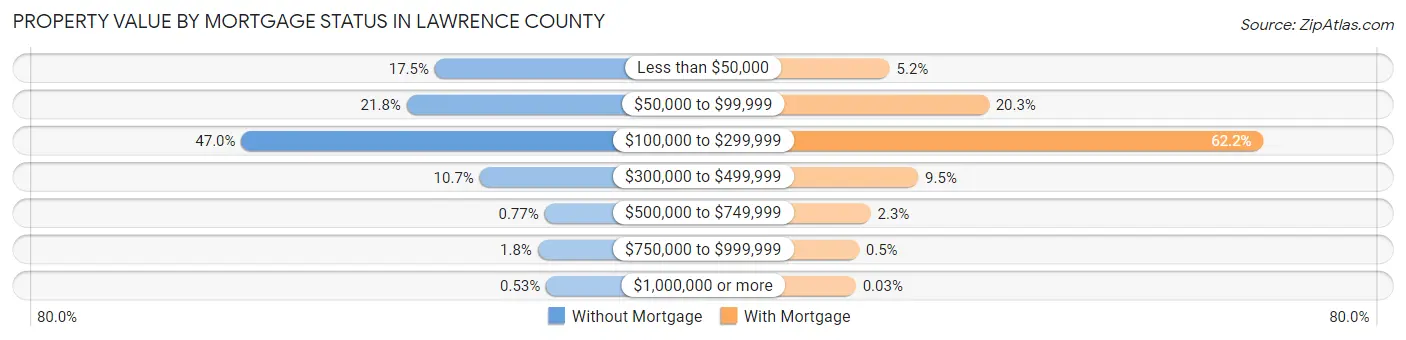
| Property Value | Without Mortgage | With Mortgage |
| Less than $50,000 | 794 (17.5%) | 302 (5.2%) |
| $50,000 to $99,999 | 989 (21.8%) | 1,180 (20.3%) |
| $100,000 to $299,999 | 2,133 (47.0%) | 3,615 (62.2%) |
| $300,000 to $499,999 | 484 (10.7%) | 555 (9.5%) |
| $500,000 to $749,999 | 35 (0.8%) | 134 (2.3%) |
| $750,000 to $999,999 | 82 (1.8%) | 29 (0.5%) |
| $1,000,000 or more | 24 (0.5%) | 2 (0.0%) |
| Total | 4,541 (100.0%) | 5,817 (100.0%) |
Household Income by Mortgage Status in Lawrence County
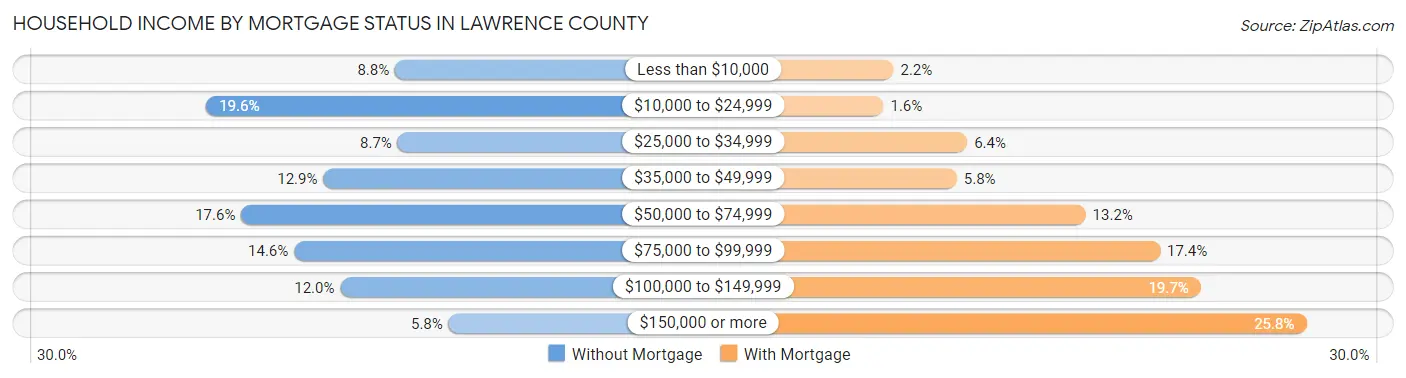
| Household Income | Without Mortgage | With Mortgage |
| Less than $10,000 | 401 (8.8%) | 126 (2.2%) |
| $10,000 to $24,999 | 891 (19.6%) | 93 (1.6%) |
| $25,000 to $34,999 | 394 (8.7%) | 371 (6.4%) |
| $35,000 to $49,999 | 587 (12.9%) | 337 (5.8%) |
| $50,000 to $74,999 | 800 (17.6%) | 765 (13.2%) |
| $75,000 to $99,999 | 663 (14.6%) | 1,012 (17.4%) |
| $100,000 to $149,999 | 543 (12.0%) | 1,147 (19.7%) |
| $150,000 or more | 262 (5.8%) | 1,498 (25.8%) |
| Total | 4,541 (100.0%) | 5,817 (100.0%) |
Property Value to Household Income Ratio in Lawrence County
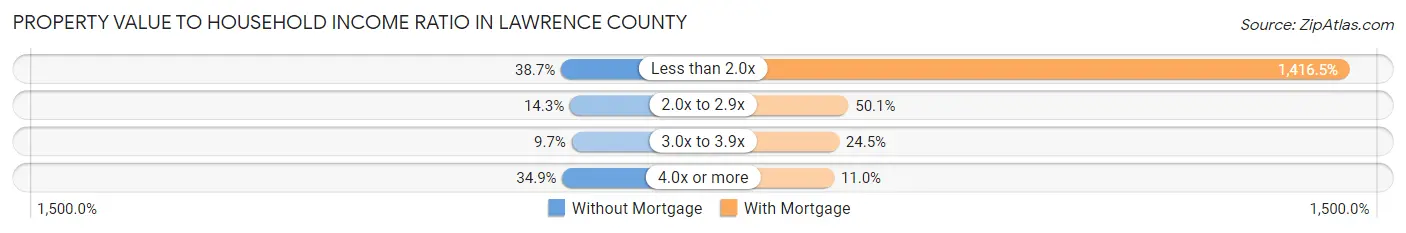
| Value-to-Income Ratio | Without Mortgage | With Mortgage |
| Less than 2.0x | 1,756 (38.7%) | 82,399 (1,416.5%) |
| 2.0x to 2.9x | 648 (14.3%) | 2,915 (50.1%) |
| 3.0x to 3.9x | 440 (9.7%) | 1,422 (24.4%) |
| 4.0x or more | 1,584 (34.9%) | 639 (11.0%) |
| Total | 4,541 (100.0%) | 5,817 (100.0%) |
Real Estate Taxes by Mortgage Status in Lawrence County
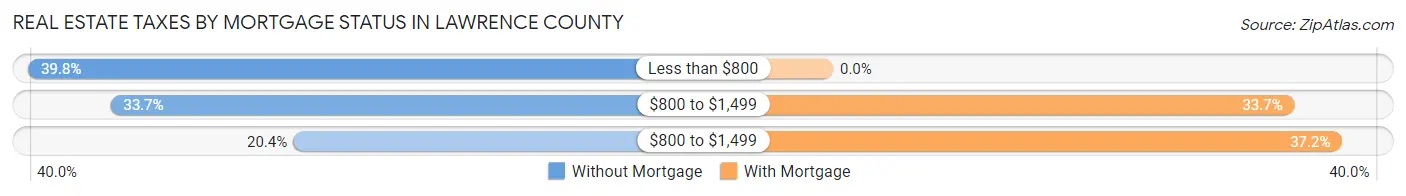
| Property Taxes | Without Mortgage | With Mortgage |
| Less than $800 | 1,805 (39.8%) | 0 (0.0%) |
| $800 to $1,499 | 1,532 (33.7%) | 1,961 (33.7%) |
| $800 to $1,499 | 926 (20.4%) | 2,164 (37.2%) |
| Total | 4,541 (100.0%) | 5,817 (100.0%) |
Health & Disability in Lawrence County
Health Insurance Coverage by Age in Lawrence County
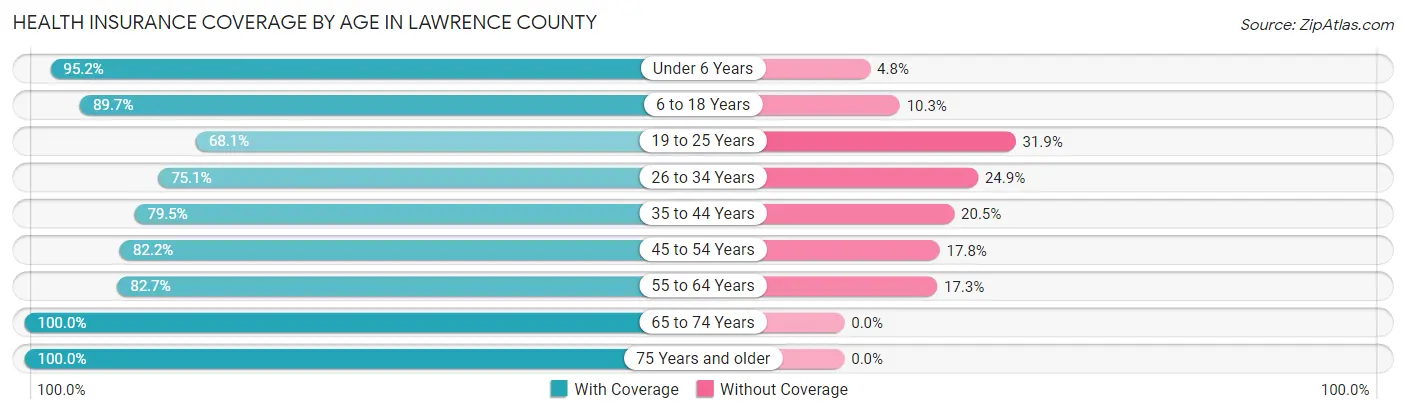
| Age Bracket | With Coverage | Without Coverage |
| Under 6 Years | 2,782 (95.2%) | 141 (4.8%) |
| 6 to 18 Years | 6,352 (89.7%) | 732 (10.3%) |
| 19 to 25 Years | 2,037 (68.1%) | 956 (31.9%) |
| 26 to 34 Years | 3,041 (75.1%) | 1,010 (24.9%) |
| 35 to 44 Years | 3,711 (79.5%) | 956 (20.5%) |
| 45 to 54 Years | 3,620 (82.2%) | 783 (17.8%) |
| 55 to 64 Years | 4,157 (82.7%) | 869 (17.3%) |
| 65 to 74 Years | 3,685 (100.0%) | 0 (0.0%) |
| 75 Years and older | 2,779 (100.0%) | 0 (0.0%) |
| Total | 32,164 (85.5%) | 5,447 (14.5%) |
Health Insurance Coverage by Citizenship Status in Lawrence County
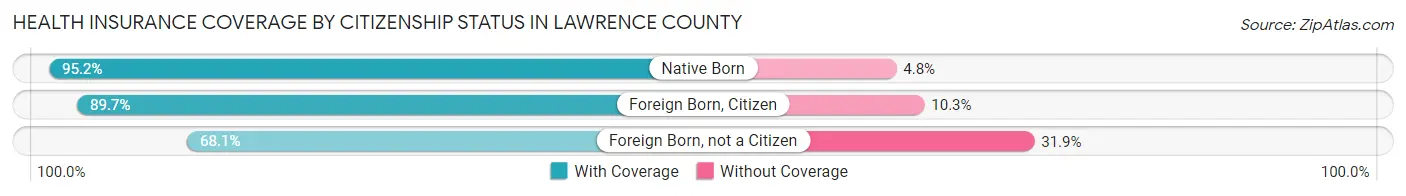
| Citizenship Status | With Coverage | Without Coverage |
| Native Born | 2,782 (95.2%) | 141 (4.8%) |
| Foreign Born, Citizen | 6,352 (89.7%) | 732 (10.3%) |
| Foreign Born, not a Citizen | 2,037 (68.1%) | 956 (31.9%) |
Health Insurance Coverage by Household Income in Lawrence County
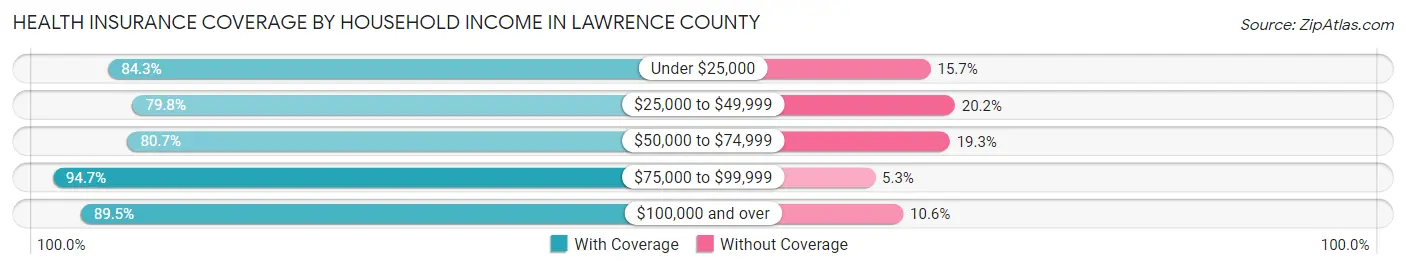
| Household Income | With Coverage | Without Coverage |
| Under $25,000 | 4,083 (84.3%) | 760 (15.7%) |
| $25,000 to $49,999 | 6,790 (79.8%) | 1,723 (20.2%) |
| $50,000 to $74,999 | 6,386 (80.7%) | 1,525 (19.3%) |
| $75,000 to $99,999 | 5,270 (94.7%) | 295 (5.3%) |
| $100,000 and over | 9,611 (89.4%) | 1,133 (10.5%) |
Public vs Private Health Insurance Coverage by Age in Lawrence County
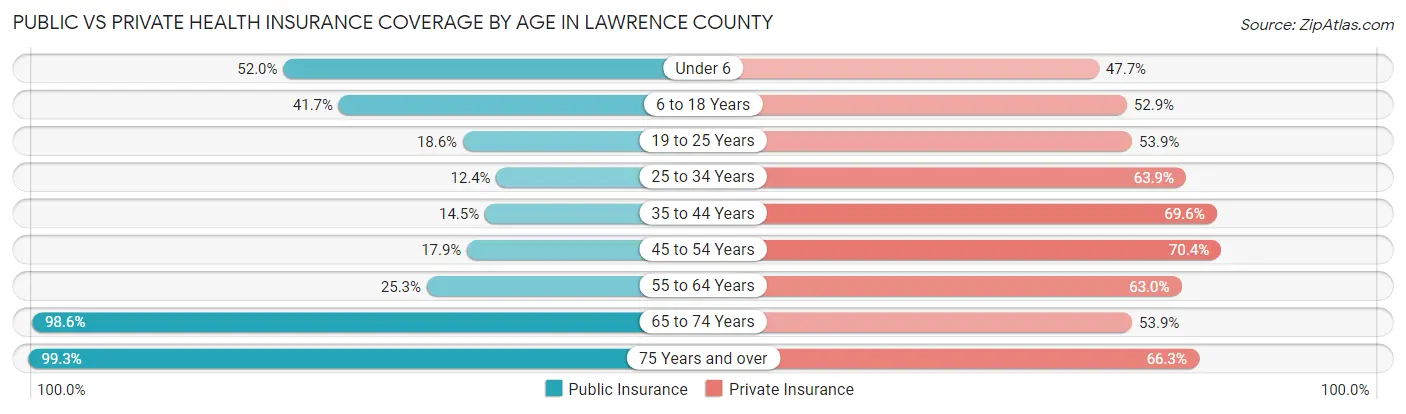
| Age Bracket | Public Insurance | Private Insurance |
| Under 6 | 1,519 (52.0%) | 1,395 (47.7%) |
| 6 to 18 Years | 2,952 (41.7%) | 3,749 (52.9%) |
| 19 to 25 Years | 558 (18.6%) | 1,613 (53.9%) |
| 25 to 34 Years | 503 (12.4%) | 2,587 (63.9%) |
| 35 to 44 Years | 678 (14.5%) | 3,246 (69.6%) |
| 45 to 54 Years | 786 (17.8%) | 3,100 (70.4%) |
| 55 to 64 Years | 1,273 (25.3%) | 3,167 (63.0%) |
| 65 to 74 Years | 3,634 (98.6%) | 1,986 (53.9%) |
| 75 Years and over | 2,759 (99.3%) | 1,841 (66.2%) |
| Total | 14,662 (39.0%) | 22,684 (60.3%) |
Disability Status by Sex by Age in Lawrence County
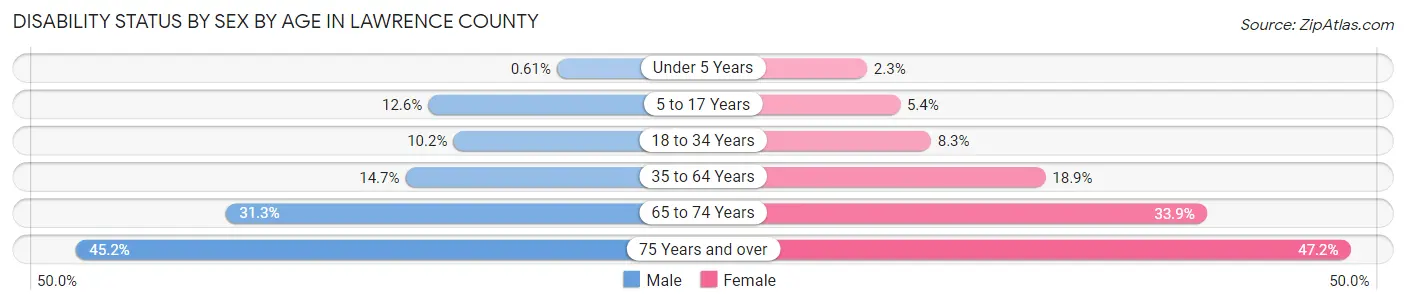
| Age Bracket | Male | Female |
| Under 5 Years | 8 (0.6%) | 28 (2.3%) |
| 5 to 17 Years | 456 (12.6%) | 186 (5.4%) |
| 18 to 34 Years | 382 (10.2%) | 307 (8.3%) |
| 35 to 64 Years | 1,048 (14.7%) | 1,313 (18.9%) |
| 65 to 74 Years | 553 (31.3%) | 649 (33.9%) |
| 75 Years and over | 507 (45.2%) | 782 (47.2%) |
Disability Class by Sex by Age in Lawrence County
Disability Class: Hearing Difficulty
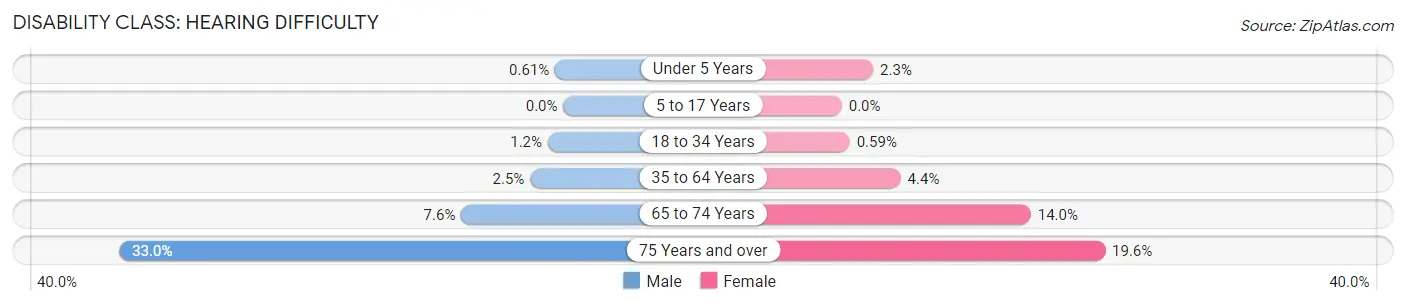
| Age Bracket | Male | Female |
| Under 5 Years | 8 (0.6%) | 28 (2.3%) |
| 5 to 17 Years | 0 (0.0%) | 0 (0.0%) |
| 18 to 34 Years | 43 (1.1%) | 22 (0.6%) |
| 35 to 64 Years | 176 (2.5%) | 304 (4.4%) |
| 65 to 74 Years | 134 (7.6%) | 269 (14.0%) |
| 75 Years and over | 370 (33.0%) | 324 (19.6%) |
Disability Class: Vision Difficulty
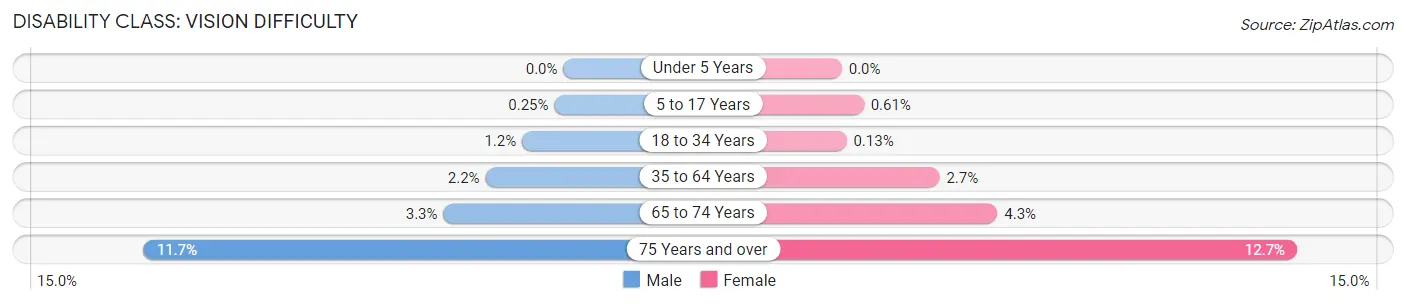
| Age Bracket | Male | Female |
| Under 5 Years | 0 (0.0%) | 0 (0.0%) |
| 5 to 17 Years | 9 (0.3%) | 21 (0.6%) |
| 18 to 34 Years | 43 (1.1%) | 5 (0.1%) |
| 35 to 64 Years | 155 (2.2%) | 189 (2.7%) |
| 65 to 74 Years | 59 (3.3%) | 83 (4.3%) |
| 75 Years and over | 131 (11.7%) | 210 (12.7%) |
Disability Class: Cognitive Difficulty
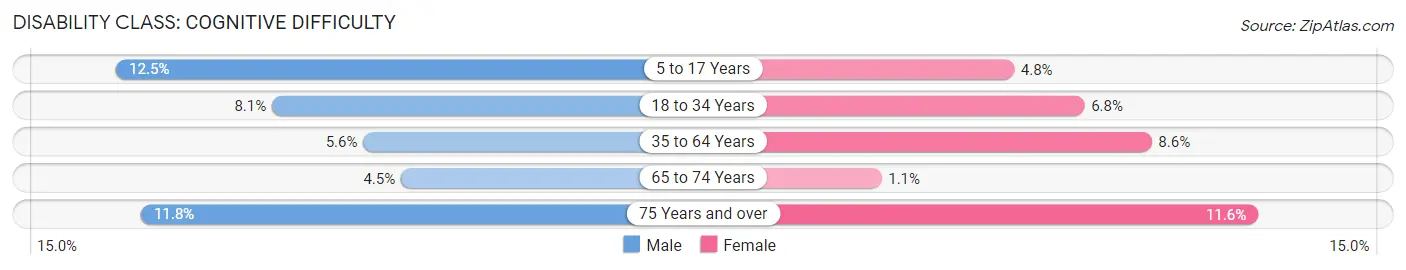
| Age Bracket | Male | Female |
| 5 to 17 Years | 452 (12.4%) | 165 (4.8%) |
| 18 to 34 Years | 303 (8.1%) | 251 (6.8%) |
| 35 to 64 Years | 398 (5.6%) | 599 (8.6%) |
| 65 to 74 Years | 80 (4.5%) | 21 (1.1%) |
| 75 Years and over | 132 (11.8%) | 192 (11.6%) |
Disability Class: Ambulatory Difficulty
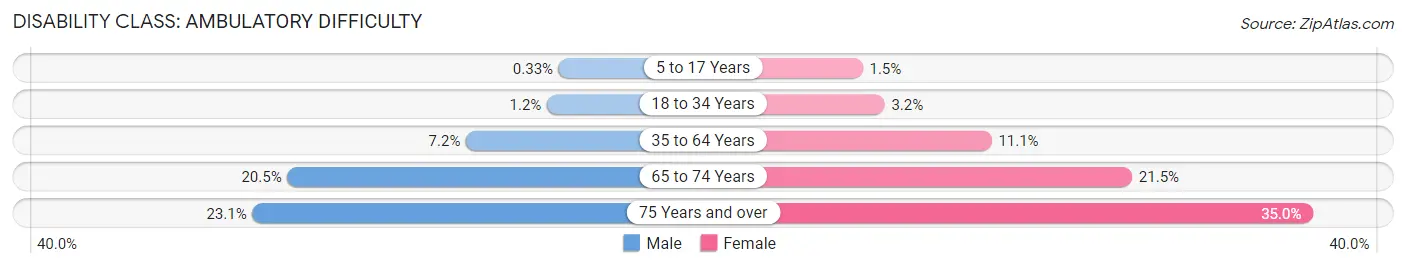
| Age Bracket | Male | Female |
| 5 to 17 Years | 12 (0.3%) | 53 (1.5%) |
| 18 to 34 Years | 45 (1.2%) | 118 (3.2%) |
| 35 to 64 Years | 515 (7.2%) | 772 (11.1%) |
| 65 to 74 Years | 362 (20.5%) | 413 (21.5%) |
| 75 Years and over | 259 (23.1%) | 580 (35.0%) |
Disability Class: Self-Care Difficulty
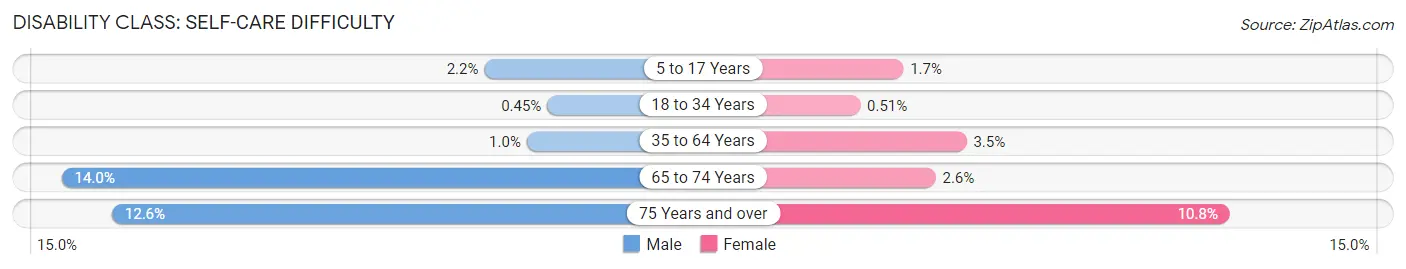
| Age Bracket | Male | Female |
| 5 to 17 Years | 80 (2.2%) | 59 (1.7%) |
| 18 to 34 Years | 17 (0.4%) | 19 (0.5%) |
| 35 to 64 Years | 73 (1.0%) | 241 (3.5%) |
| 65 to 74 Years | 247 (14.0%) | 50 (2.6%) |
| 75 Years and over | 141 (12.6%) | 179 (10.8%) |
Technology Access in Lawrence County
Computing Device Access in Lawrence County
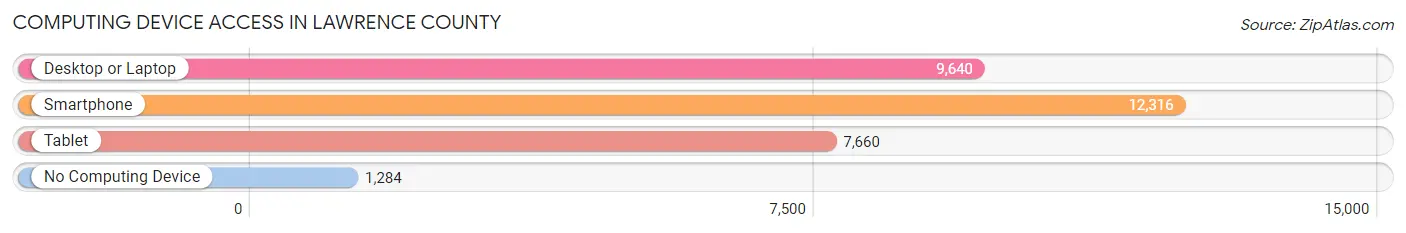
| Device Type | # Households | % Households |
| Desktop or Laptop | 9,640 | 65.9% |
| Smartphone | 12,316 | 84.2% |
| Tablet | 7,660 | 52.4% |
| No Computing Device | 1,284 | 8.8% |
| Total | 14,629 | 100.0% |
Internet Access in Lawrence County
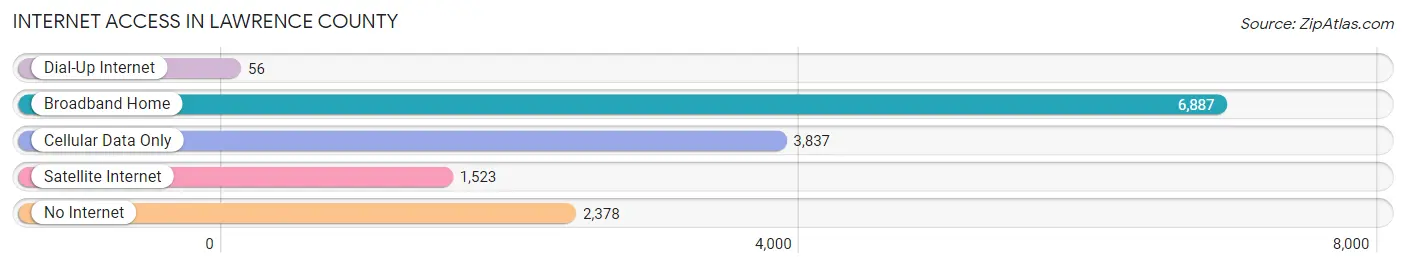
| Internet Type | # Households | % Households |
| Dial-Up Internet | 56 | 0.4% |
| Broadband Home | 6,887 | 47.1% |
| Cellular Data Only | 3,837 | 26.2% |
| Satellite Internet | 1,523 | 10.4% |
| No Internet | 2,378 | 16.3% |
| Total | 14,629 | 100.0% |
Lawrence County Summary
Lawrence County, Missouri is located in the southwestern corner of the state, bordered by Arkansas to the south and the Missouri River to the west. It is part of the Ozark Plateau region and is known for its rolling hills, forests, and rivers. The county seat is Mount Vernon, and the largest city is Aurora. As of the 2010 census, the population was 38,634.
History
Lawrence County was established in 1845 and named after James Lawrence, a naval hero of the War of 1812. The county was originally part of Greene County, but was split off due to its large size. The county was largely rural until the late 19th century, when the railroad arrived and brought with it an influx of settlers. The county was also home to several Native American tribes, including the Osage, Shawnee, and Delaware.
Geography
Lawrence County is located in the southwestern corner of Missouri, bordered by Arkansas to the south and the Missouri River to the west. It is part of the Ozark Plateau region and is known for its rolling hills, forests, and rivers. The county has a total area of 576 square miles, of which 574 square miles is land and 2 square miles is water. The highest point in the county is Pilot Knob, which has an elevation of 1,072 feet.
The county is divided into two distinct regions: the Ozark Plateau in the north and the White River Valley in the south. The Ozark Plateau is characterized by rolling hills and forests, while the White River Valley is characterized by flat plains and agricultural land.
Economy
Lawrence County has a diverse economy, with a mix of agriculture, manufacturing, and services. The county is home to several large employers, including Tyson Foods, Walmart, and Ozark Mountain Poultry. Agriculture is the largest industry in the county, with corn, soybeans, and hay being the main crops. Manufacturing is also important, with companies such as Aurora Plastics and Aurora Bearing Company located in the county.
The county also has a thriving tourism industry, with attractions such as the Ozark National Scenic Riverways, the Mark Twain National Forest, and the Big Spring State Park.
Demographics
As of the 2010 census, the population of Lawrence County was 38,634. The population is predominantly white (94.2%), with small percentages of African American (2.7%), Hispanic (1.3%), and Asian (0.7%) residents. The median household income is $41,945, and the median age is 41.
The county is home to several small towns and cities, including Mount Vernon (the county seat), Aurora (the largest city), and Miller. The county also has several unincorporated communities, such as Freistatt, Marionville, and Verona.
Conclusion
Lawrence County, Missouri is a rural county located in the southwestern corner of the state. It is part of the Ozark Plateau region and is known for its rolling hills, forests, and rivers. The county has a diverse economy, with a mix of agriculture, manufacturing, and services. As of the 2010 census, the population of Lawrence County was 38,634. The county is home to several small towns and cities, as well as several unincorporated communities.
Common Questions
What is the Total Population of Lawrence County?
Total Population of Lawrence County is 38,231.
What is the Total Male Population of Lawrence County?
Total Male Population of Lawrence County is 19,195.
What is the Total Female Population of Lawrence County?
Total Female Population of Lawrence County is 19,036.
What is the Ratio of Males per 100 Females in Lawrence County?
There are 100.84 Males per 100 Females in Lawrence County.
What is the Ratio of Females per 100 Males in Lawrence County?
There are 99.17 Females per 100 Males in Lawrence County.
What is the Median Population Age in Lawrence County?
Median Population Age in Lawrence County is 38.7 Years.
What is the Average Family Size in Lawrence County
Average Family Size in Lawrence County is 3.2 People.
What is the Average Household Size in Lawrence County
Average Household Size in Lawrence County is 2.6 People.
What is Per Capita Income in Lawrence County?
Per Capita income in Lawrence County is $26,407.
What is the Median Family Income in Lawrence County?
Median Family Income in Lawrence County is $69,410.
What is the Median Household income in Lawrence County?
Median Household Income in Lawrence County is $52,225.
What is Income or Wage Gap in Lawrence County?
Income or Wage Gap in Lawrence County is 33.2%.
Women in Lawrence County earn 66.8 cents for every dollar earned by a man.
What is Family Income Deficit in Lawrence County?
Family Income Deficit in Lawrence County is $9,910.
Families that are below poverty line in Lawrence County earn $9,910 less on average than the poverty threshold level.
What is Inequality or Gini Index in Lawrence County?
Inequality or Gini Index in Lawrence County is 0.42.
How Large is the Labor Force in Lawrence County?
There are 17,709 People in the Labor Forcein in Lawrence County.
What is the Percentage of People in the Labor Force in Lawrence County?
59.5% of People are in the Labor Force in Lawrence County.
What is the Unemployment Rate in Lawrence County?
Unemployment Rate in Lawrence County is 5.2%.