Camden County, MO
Camden County Overview
43,227
TOTAL POPULATION
21,504
MALE POPULATION
21,723
FEMALE POPULATION
98.99
MALES / 100 FEMALES
101.02
FEMALES / 100 MALES
52.6
MEDIAN AGE
3.1
AVG FAMILY SIZE
2.6
AVG HOUSEHOLD SIZE
$35,927
PER CAPITA INCOME
$76,903
AVG FAMILY INCOME
$59,834
AVG HOUSEHOLD INCOME
20.5%
WAGE / INCOME GAP [ % ]
79.5¢/ $1
WAGE / INCOME GAP [ $ ]
$11,100
FAMILY INCOME DEFICIT
0.47
INEQUALITY / GINI INDEX
19,045
LABOR FORCE [ PEOPLE ]
51.9%
PERCENT IN LABOR FORCE
5.2%
UNEMPLOYMENT RATE
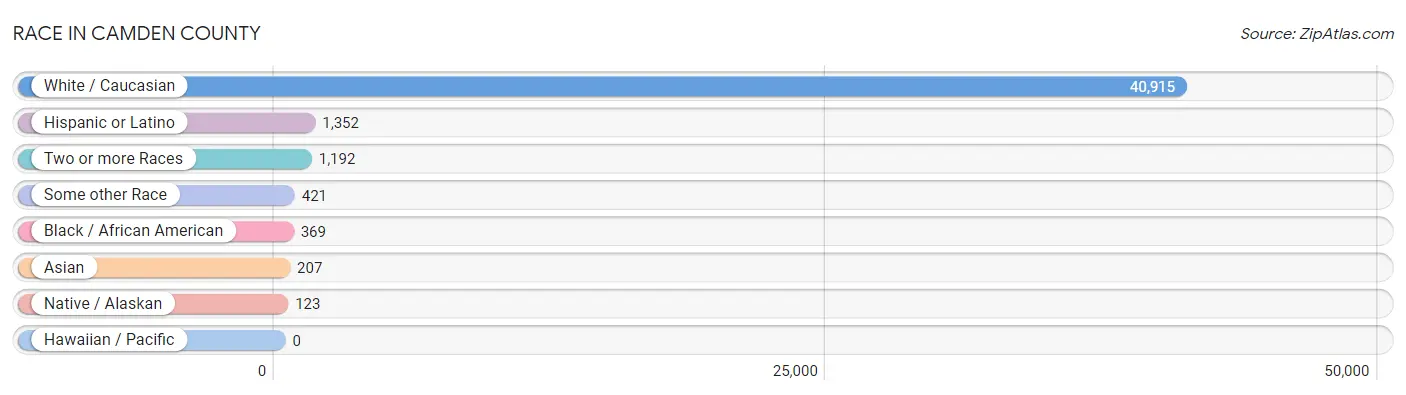
Race in Camden County
The most populous races in Camden County are White / Caucasian (40,915 | 94.7%), Hispanic or Latino (1,352 | 3.1%), and Two or more Races (1,192 | 2.8%).
| Race | # Population | % Population |
| Asian | 207 | 0.5% |
| Black / African American | 369 | 0.9% |
| Hawaiian / Pacific | 0 | 0.0% |
| Hispanic or Latino | 1,352 | 3.1% |
| Native / Alaskan | 123 | 0.3% |
| White / Caucasian | 40,915 | 94.7% |
| Two or more Races | 1,192 | 2.8% |
| Some other Race | 421 | 1.0% |
| Total | 43,227 | 100.0% |
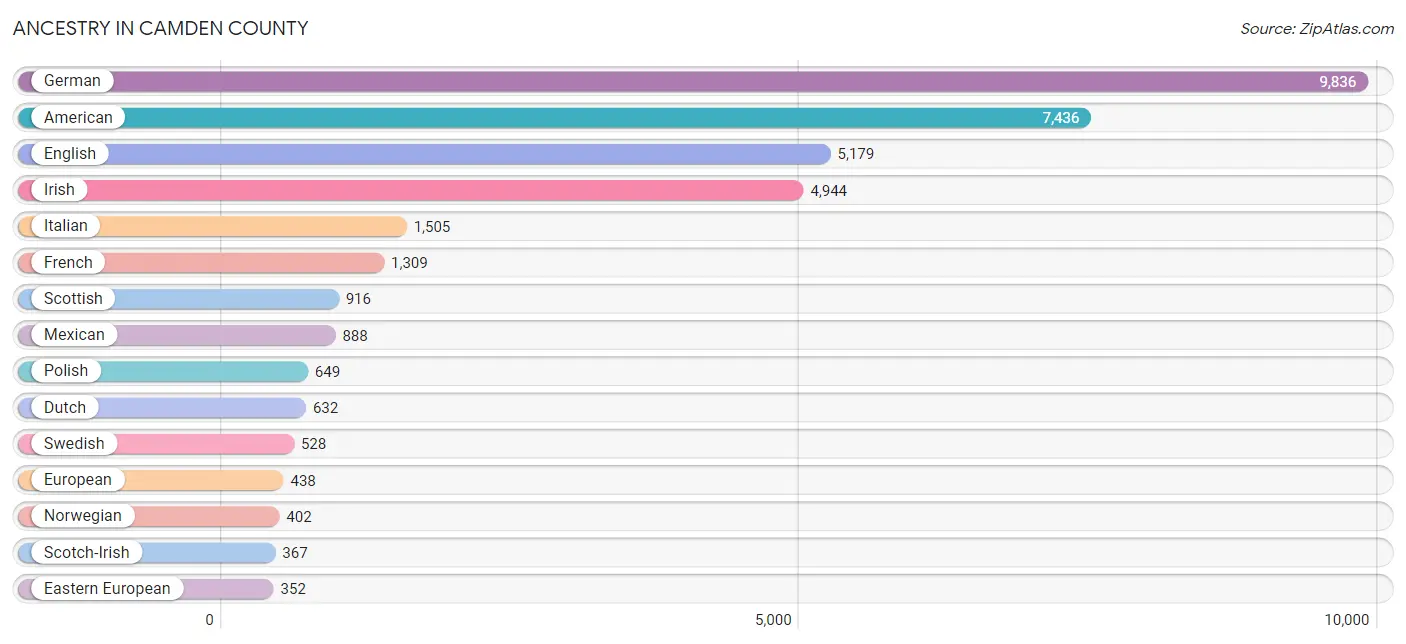
Ancestry in Camden County
The most populous ancestries reported in Camden County are German (9,836 | 22.8%), American (7,436 | 17.2%), English (5,179 | 12.0%), Irish (4,944 | 11.4%), and Italian (1,505 | 3.5%), together accounting for 66.8% of all Camden County residents.
| Ancestry | # Population | % Population |
| American | 7,436 | 17.2% |
| Apache | 9 | 0.0% |
| Arab | 43 | 0.1% |
| Argentinean | 20 | 0.1% |
| Austrian | 38 | 0.1% |
| Belgian | 7 | 0.0% |
| Bhutanese | 32 | 0.1% |
| Blackfeet | 22 | 0.1% |
| British | 62 | 0.1% |
| Burmese | 72 | 0.2% |
| Canadian | 33 | 0.1% |
| Central American | 218 | 0.5% |
| Cherokee | 230 | 0.5% |
| Cheyenne | 20 | 0.1% |
| Chippewa | 20 | 0.1% |
| Choctaw | 2 | 0.0% |
| Colombian | 8 | 0.0% |
| Croatian | 77 | 0.2% |
| Cuban | 12 | 0.0% |
| Czech | 299 | 0.7% |
| Czechoslovakian | 12 | 0.0% |
| Danish | 318 | 0.7% |
| Dutch | 632 | 1.5% |
| Eastern European | 352 | 0.8% |
| Ecuadorian | 16 | 0.0% |
| English | 5,179 | 12.0% |
| European | 438 | 1.0% |
| Filipino | 17 | 0.0% |
| Finnish | 18 | 0.0% |
| French | 1,309 | 3.0% |
| French Canadian | 107 | 0.3% |
| German | 9,836 | 22.8% |
| German Russian | 8 | 0.0% |
| Greek | 16 | 0.0% |
| Guamanian / Chamorro | 2 | 0.0% |
| Guatemalan | 24 | 0.1% |
| Honduran | 187 | 0.4% |
| Hungarian | 14 | 0.0% |
| Indian (Asian) | 45 | 0.1% |
| Irish | 4,944 | 11.4% |
| Italian | 1,505 | 3.5% |
| Jamaican | 10 | 0.0% |
| Japanese | 5 | 0.0% |
| Korean | 198 | 0.5% |
| Laotian | 27 | 0.1% |
| Lebanese | 7 | 0.0% |
| Lithuanian | 89 | 0.2% |
| Mexican | 888 | 2.1% |
| Navajo | 6 | 0.0% |
| New Zealander | 39 | 0.1% |
| Northern European | 18 | 0.0% |
| Norwegian | 402 | 0.9% |
| Panamanian | 7 | 0.0% |
| Pennsylvania German | 13 | 0.0% |
| Polish | 649 | 1.5% |
| Portuguese | 165 | 0.4% |
| Puerto Rican | 84 | 0.2% |
| Romanian | 35 | 0.1% |
| Russian | 52 | 0.1% |
| Scandinavian | 202 | 0.5% |
| Scotch-Irish | 367 | 0.9% |
| Scottish | 916 | 2.1% |
| Serbian | 17 | 0.0% |
| Sioux | 9 | 0.0% |
| Slavic | 14 | 0.0% |
| Slovene | 8 | 0.0% |
| South American | 44 | 0.1% |
| Spaniard | 36 | 0.1% |
| Spanish | 27 | 0.1% |
| Swedish | 528 | 1.2% |
| Swiss | 213 | 0.5% |
| Syrian | 36 | 0.1% |
| Thai | 2 | 0.0% |
| Ukrainian | 31 | 0.1% |
| Welsh | 322 | 0.7% | View All 75 Rows |
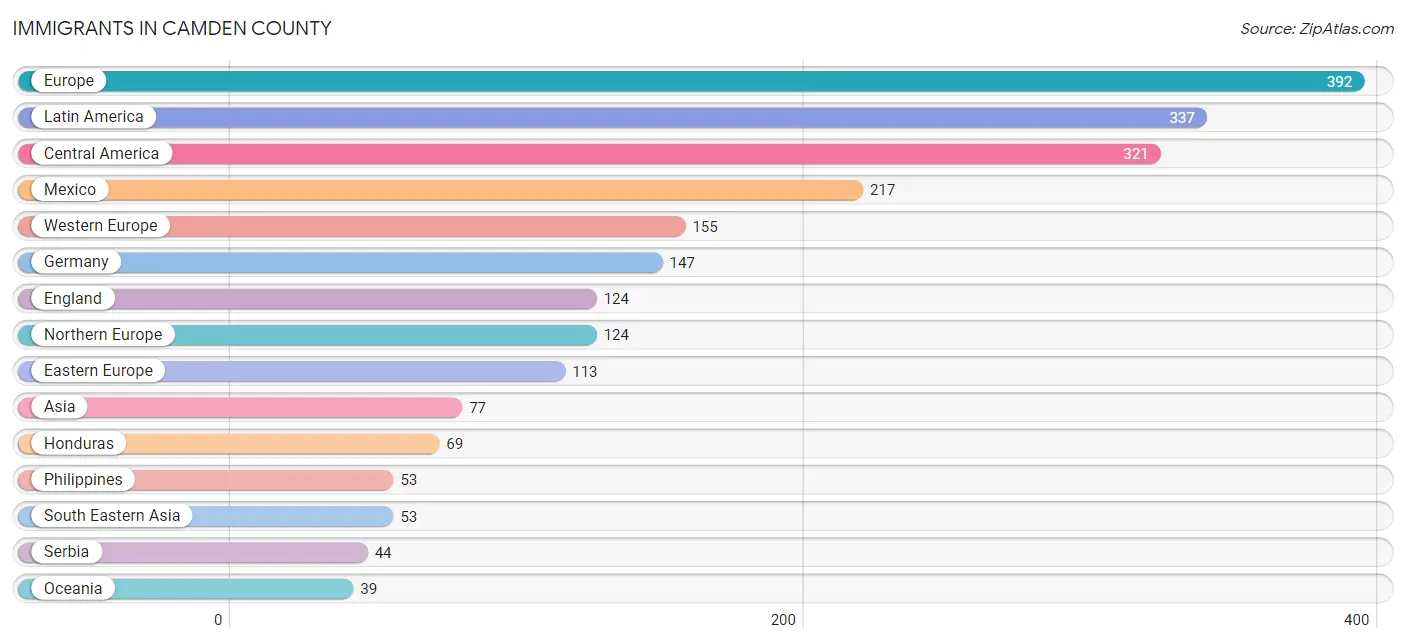
Immigrants in Camden County
The most numerous immigrant groups reported in Camden County came from Europe (392 | 0.9%), Latin America (337 | 0.8%), Central America (321 | 0.7%), Mexico (217 | 0.5%), and Western Europe (155 | 0.4%), together accounting for 3.3% of all Camden County residents.
| Immigration Origin | # Population | % Population |
| Africa | 7 | 0.0% |
| Asia | 77 | 0.2% |
| Canada | 37 | 0.1% |
| Caribbean | 8 | 0.0% |
| Central America | 321 | 0.7% |
| China | 22 | 0.1% |
| Colombia | 8 | 0.0% |
| Czechoslovakia | 24 | 0.1% |
| Eastern Asia | 22 | 0.1% |
| Eastern Europe | 113 | 0.3% |
| England | 124 | 0.3% |
| Europe | 392 | 0.9% |
| France | 8 | 0.0% |
| Germany | 147 | 0.3% |
| Guatemala | 28 | 0.1% |
| Honduras | 69 | 0.2% |
| Hong Kong | 4 | 0.0% |
| India | 2 | 0.0% |
| Jamaica | 8 | 0.0% |
| Latin America | 337 | 0.8% |
| Mexico | 217 | 0.5% |
| Northern Europe | 124 | 0.3% |
| Oceania | 39 | 0.1% |
| Panama | 7 | 0.0% |
| Philippines | 53 | 0.1% |
| Romania | 12 | 0.0% |
| Russia | 14 | 0.0% |
| Serbia | 44 | 0.1% |
| South Africa | 7 | 0.0% |
| South America | 8 | 0.0% |
| South Central Asia | 2 | 0.0% |
| South Eastern Asia | 53 | 0.1% |
| Ukraine | 16 | 0.0% |
| Western Europe | 155 | 0.4% | View All 34 Rows |
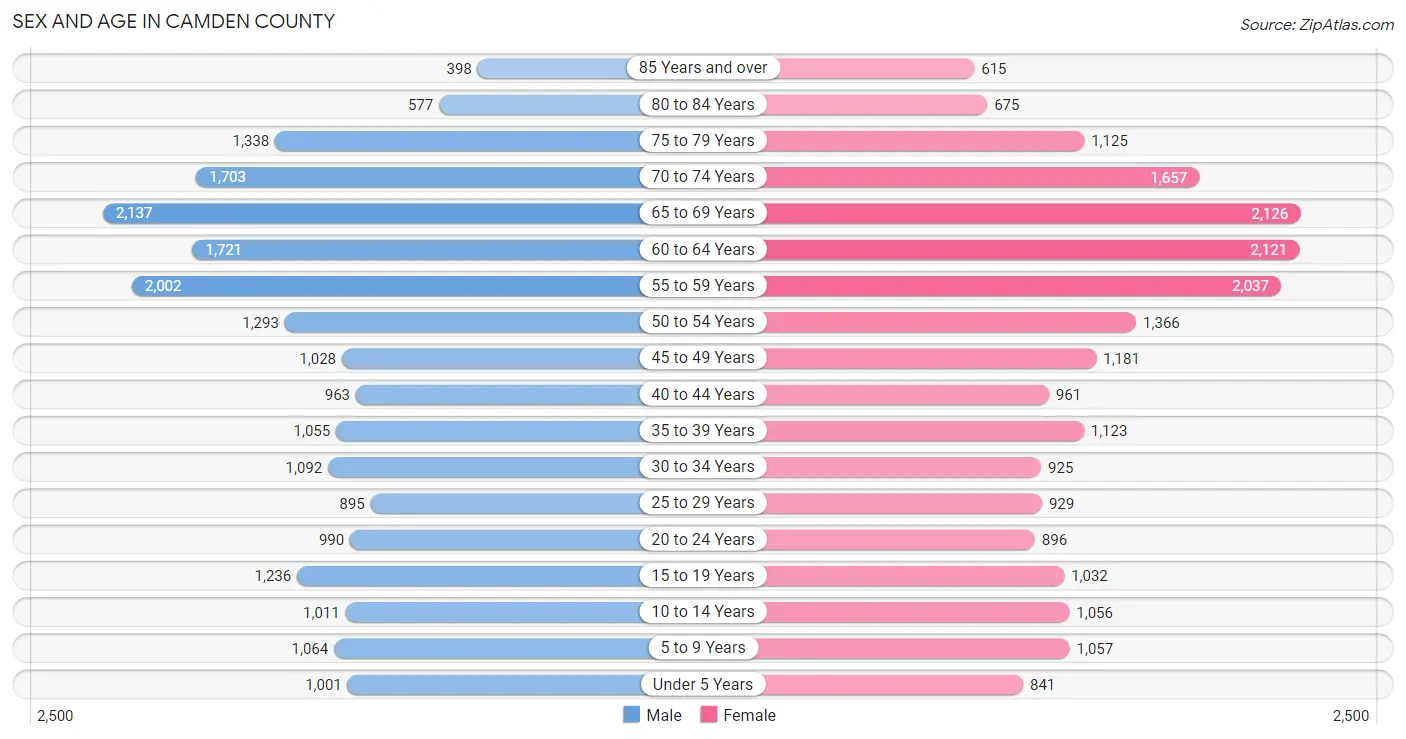
Sex and Age in Camden County
Sex and Age in Camden County
The most populous age groups in Camden County are 65 to 69 Years (2,137 | 9.9%) for men and 65 to 69 Years (2,126 | 9.8%) for women.
| Age Bracket | Male | Female |
| Under 5 Years | 1,001 (4.6%) | 841 (3.9%) |
| 5 to 9 Years | 1,064 (5.0%) | 1,057 (4.9%) |
| 10 to 14 Years | 1,011 (4.7%) | 1,056 (4.9%) |
| 15 to 19 Years | 1,236 (5.8%) | 1,032 (4.8%) |
| 20 to 24 Years | 990 (4.6%) | 896 (4.1%) |
| 25 to 29 Years | 895 (4.2%) | 929 (4.3%) |
| 30 to 34 Years | 1,092 (5.1%) | 925 (4.3%) |
| 35 to 39 Years | 1,055 (4.9%) | 1,123 (5.2%) |
| 40 to 44 Years | 963 (4.5%) | 961 (4.4%) |
| 45 to 49 Years | 1,028 (4.8%) | 1,181 (5.4%) |
| 50 to 54 Years | 1,293 (6.0%) | 1,366 (6.3%) |
| 55 to 59 Years | 2,002 (9.3%) | 2,037 (9.4%) |
| 60 to 64 Years | 1,721 (8.0%) | 2,121 (9.8%) |
| 65 to 69 Years | 2,137 (9.9%) | 2,126 (9.8%) |
| 70 to 74 Years | 1,703 (7.9%) | 1,657 (7.6%) |
| 75 to 79 Years | 1,338 (6.2%) | 1,125 (5.2%) |
| 80 to 84 Years | 577 (2.7%) | 675 (3.1%) |
| 85 Years and over | 398 (1.8%) | 615 (2.8%) |
| Total | 21,504 (100.0%) | 21,723 (100.0%) |
Families and Households in Camden County
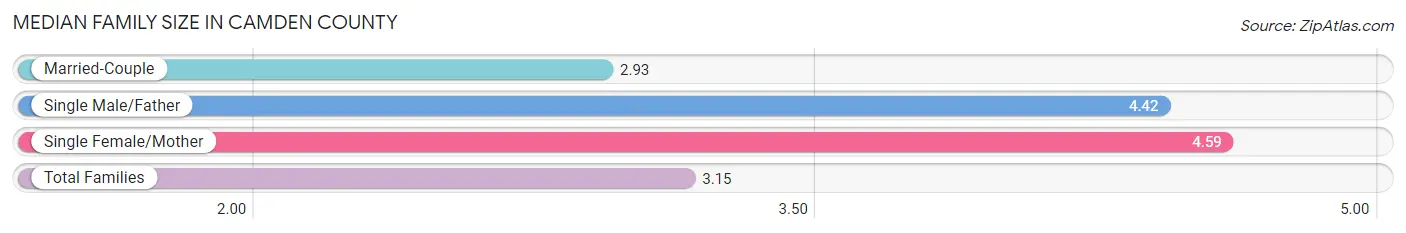
Median Family Size in Camden County
The median family size in Camden County is 3.15 persons per family, with single female/mother families (1,104 | 10.1%) accounting for the largest median family size of 4.59 persons per family. On the other hand, married-couple families (9,469 | 86.4%) represent the smallest median family size with 2.93 persons per family.
| Family Type | # Families | Family Size |
| Married-Couple | 9,469 (86.4%) | 2.93 |
| Single Male/Father | 381 (3.5%) | 4.42 |
| Single Female/Mother | 1,104 (10.1%) | 4.59 |
| Total Families | 10,954 (100.0%) | 3.15 |
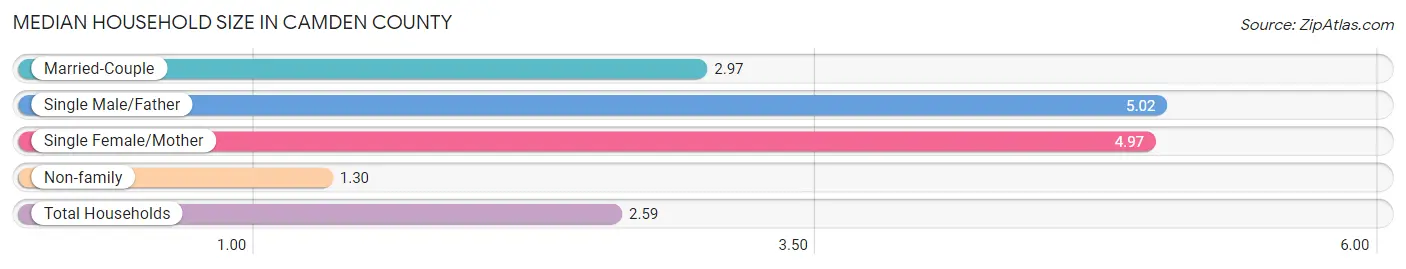
Median Household Size in Camden County
The median household size in Camden County is 2.59 persons per household, with single male/father households (381 | 2.3%) accounting for the largest median household size of 5.02 persons per household. non-family households (5,540 | 33.6%) represent the smallest median household size with 1.30 persons per household.
| Household Type | # Households | Household Size |
| Married-Couple | 9,469 (57.4%) | 2.97 |
| Single Male/Father | 381 (2.3%) | 5.02 |
| Single Female/Mother | 1,104 (6.7%) | 4.97 |
| Non-family | 5,540 (33.6%) | 1.30 |
| Total Households | 16,494 (100.0%) | 2.59 |
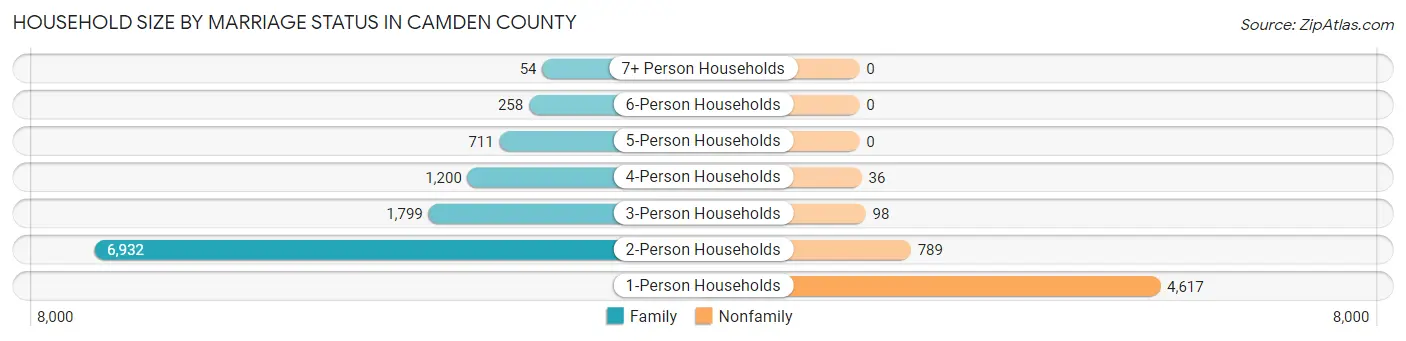
Household Size by Marriage Status in Camden County
Out of a total of 16,494 households in Camden County, 10,954 (66.4%) are family households, while 5,540 (33.6%) are nonfamily households. The most numerous type of family households are 2-person households, comprising 6,932, and the most common type of nonfamily households are 1-person households, comprising 4,617.
| Household Size | Family Households | Nonfamily Households |
| 1-Person Households | - | 4,617 (28.0%) |
| 2-Person Households | 6,932 (42.0%) | 789 (4.8%) |
| 3-Person Households | 1,799 (10.9%) | 98 (0.6%) |
| 4-Person Households | 1,200 (7.3%) | 36 (0.2%) |
| 5-Person Households | 711 (4.3%) | 0 (0.0%) |
| 6-Person Households | 258 (1.6%) | 0 (0.0%) |
| 7+ Person Households | 54 (0.3%) | 0 (0.0%) |
| Total | 10,954 (66.4%) | 5,540 (33.6%) |
Female Fertility in Camden County
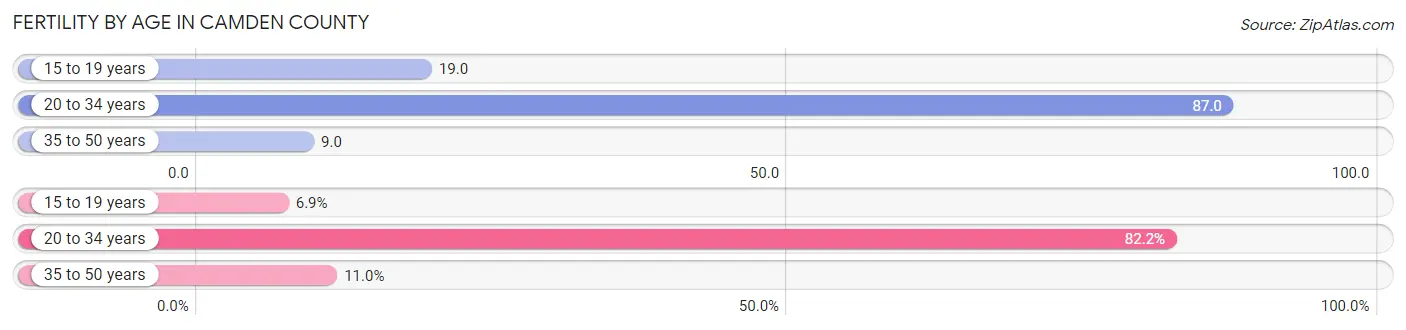
Fertility by Age in Camden County
Average fertility rate in Camden County is 40.0 births per 1,000 women. Women in the age bracket of 20 to 34 years have the highest fertility rate with 87.0 births per 1,000 women. Women in the age bracket of 20 to 34 years acount for 82.2% of all women with births.
| Age Bracket | Women with Births | Births / 1,000 Women |
| 15 to 19 years | 20 (6.9%) | 19.0 |
| 20 to 34 years | 240 (82.2%) | 87.0 |
| 35 to 50 years | 32 (11.0%) | 9.0 |
| Total | 292 (100.0%) | 40.0 |
Fertility by Age by Marriage Status in Camden County
68.8% of women with births (292) in Camden County are married. The highest percentage of unmarried women with births falls into 15 to 19 years age bracket with 75.0% of them unmarried at the time of birth, while the lowest percentage of unmarried women with births belong to 35 to 50 years age bracket with 0.0% of them unmarried.
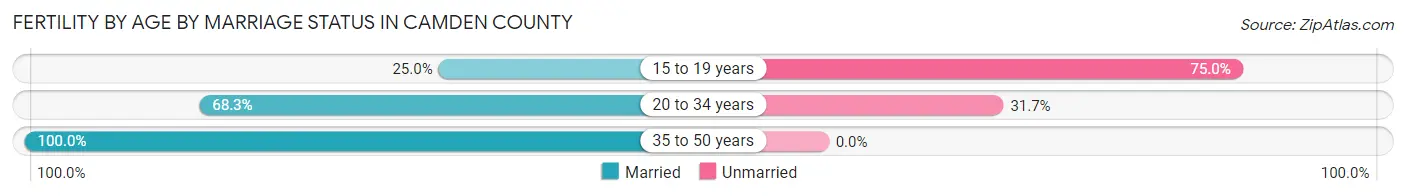
| Age Bracket | Married | Unmarried |
| 15 to 19 years | 5 (25.0%) | 15 (75.0%) |
| 20 to 34 years | 164 (68.3%) | 76 (31.7%) |
| 35 to 50 years | 32 (100.0%) | 0 (0.0%) |
| Total | 201 (68.8%) | 91 (31.2%) |
Fertility by Education in Camden County
Average fertility rate in Camden County is 40.0 births per 1,000 women. Women with the education attainment of high school diploma have the highest fertility rate of 62.0 births per 1,000 women, while women with the education attainment of bachelor's degree have the lowest fertility at 8.0 births per 1,000 women. Women with the education attainment of high school diploma represent 44.5% of all women with births.
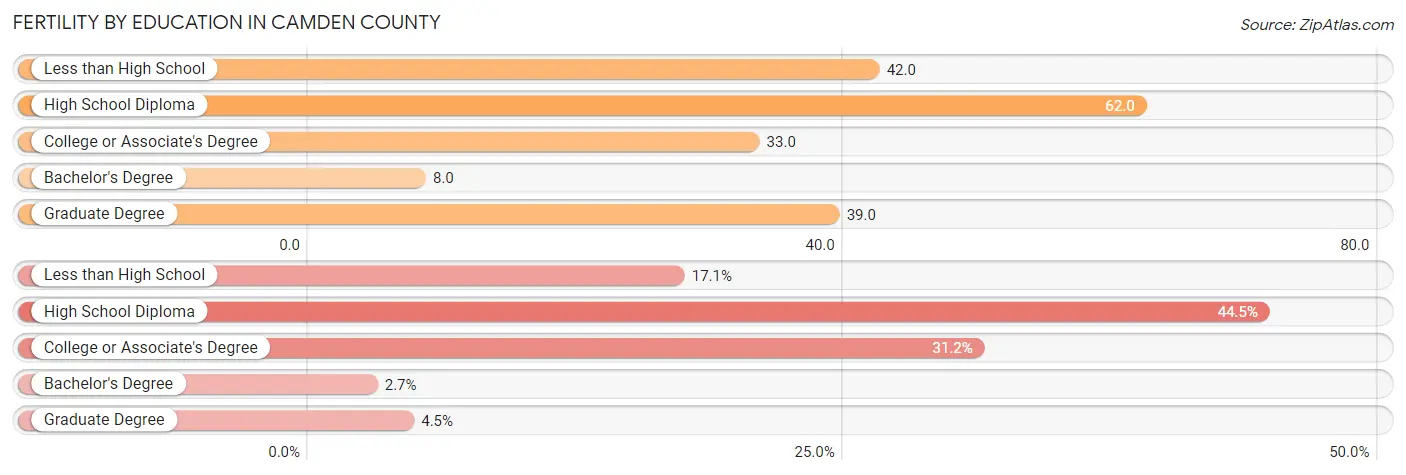
| Educational Attainment | Women with Births | Births / 1,000 Women |
| Less than High School | 50 (17.1%) | 42.0 |
| High School Diploma | 130 (44.5%) | 62.0 |
| College or Associate's Degree | 91 (31.2%) | 33.0 |
| Bachelor's Degree | 8 (2.7%) | 8.0 |
| Graduate Degree | 13 (4.4%) | 39.0 |
| Total | 292 (100.0%) | 40.0 |
Fertility by Education by Marriage Status in Camden County
31.2% of women with births in Camden County are unmarried. Women with the educational attainment of bachelor's degree are most likely to be married with 100.0% of them married at childbirth, while women with the educational attainment of less than high school are least likely to be married with 56.0% of them unmarried at childbirth.
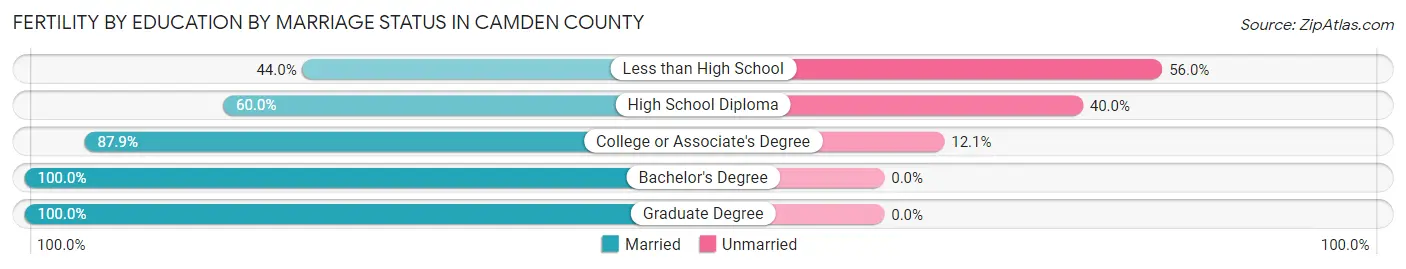
| Educational Attainment | Married | Unmarried |
| Less than High School | 22 (44.0%) | 28 (56.0%) |
| High School Diploma | 78 (60.0%) | 52 (40.0%) |
| College or Associate's Degree | 80 (87.9%) | 11 (12.1%) |
| Bachelor's Degree | 8 (100.0%) | 0 (0.0%) |
| Graduate Degree | 13 (100.0%) | 0 (0.0%) |
| Total | 201 (68.8%) | 91 (31.2%) |
Income in Camden County
Income Overview in Camden County
Per Capita Income in Camden County is $35,927, while median incomes of families and households are $76,903 and $59,834 respectively.
| Characteristic | Number | Measure |
| Per Capita Income | 43,227 | $35,927 |
| Median Family Income | 10,954 | $76,903 |
| Mean Family Income | 10,954 | $101,696 |
| Median Household Income | 16,494 | $59,834 |
| Mean Household Income | 16,494 | $86,262 |
| Income Deficit | 10,954 | $11,100 |
| Wage / Income Gap (%) | 43,227 | 20.51% |
| Wage / Income Gap ($) | 43,227 | 79.49¢ per $1 |
| Gini / Inequality Index | 43,227 | 0.47 |
Earnings by Sex in Camden County
Average Earnings in Camden County are $31,594, $34,409 for men and $27,352 for women, a difference of 20.5%.
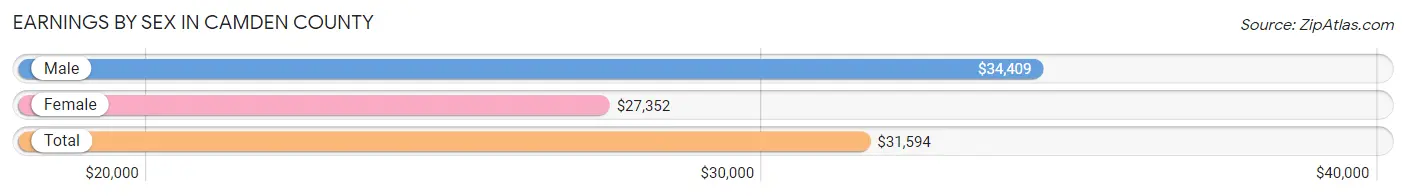
| Sex | Number | Average Earnings |
| Male | 10,846 (52.4%) | $34,409 |
| Female | 9,841 (47.6%) | $27,352 |
| Total | 20,687 (100.0%) | $31,594 |
Earnings by Sex by Income Bracket in Camden County
The most common earnings brackets in Camden County are $100,000+ for men (1,439 | 13.3%) and $30,000 to $34,999 for women (704 | 7.1%).
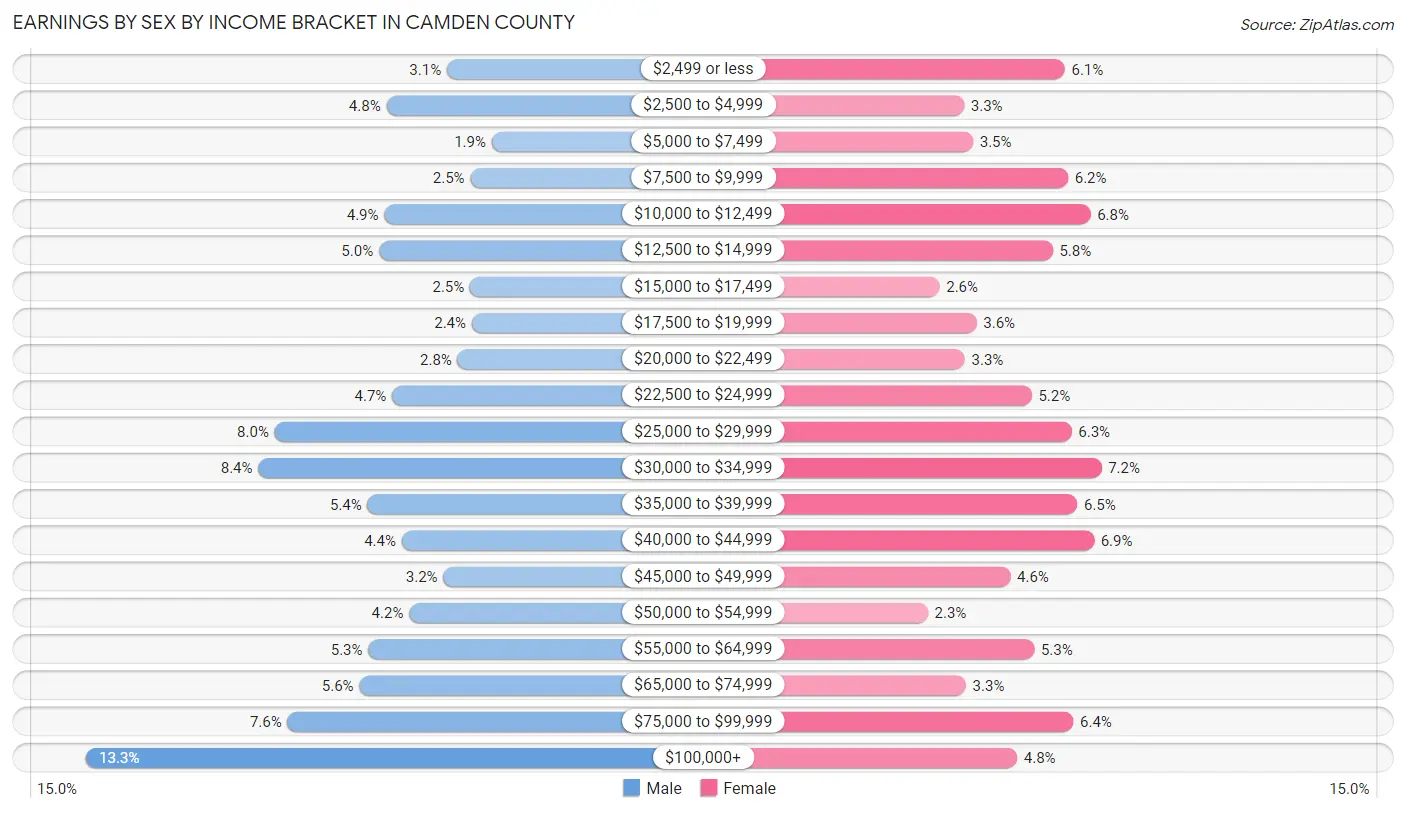
| Income | Male | Female |
| $2,499 or less | 339 (3.1%) | 602 (6.1%) |
| $2,500 to $4,999 | 524 (4.8%) | 324 (3.3%) |
| $5,000 to $7,499 | 203 (1.9%) | 348 (3.5%) |
| $7,500 to $9,999 | 268 (2.5%) | 611 (6.2%) |
| $10,000 to $12,499 | 530 (4.9%) | 673 (6.8%) |
| $12,500 to $14,999 | 547 (5.0%) | 569 (5.8%) |
| $15,000 to $17,499 | 269 (2.5%) | 256 (2.6%) |
| $17,500 to $19,999 | 264 (2.4%) | 358 (3.6%) |
| $20,000 to $22,499 | 307 (2.8%) | 326 (3.3%) |
| $22,500 to $24,999 | 506 (4.7%) | 511 (5.2%) |
| $25,000 to $29,999 | 864 (8.0%) | 621 (6.3%) |
| $30,000 to $34,999 | 914 (8.4%) | 704 (7.1%) |
| $35,000 to $39,999 | 581 (5.4%) | 637 (6.5%) |
| $40,000 to $44,999 | 477 (4.4%) | 683 (6.9%) |
| $45,000 to $49,999 | 350 (3.2%) | 452 (4.6%) |
| $50,000 to $54,999 | 454 (4.2%) | 223 (2.3%) |
| $55,000 to $64,999 | 579 (5.3%) | 518 (5.3%) |
| $65,000 to $74,999 | 606 (5.6%) | 329 (3.3%) |
| $75,000 to $99,999 | 825 (7.6%) | 626 (6.4%) |
| $100,000+ | 1,439 (13.3%) | 470 (4.8%) |
| Total | 10,846 (100.0%) | 9,841 (100.0%) |
Earnings by Sex by Educational Attainment in Camden County
Average earnings in Camden County are $39,171 for men and $31,860 for women, a difference of 18.7%. Men with an educational attainment of graduate degree enjoy the highest average annual earnings of $73,059, while those with less than high school education earn the least with $27,347. Women with an educational attainment of graduate degree earn the most with the average annual earnings of $49,091, while those with less than high school education have the smallest earnings of $24,570.
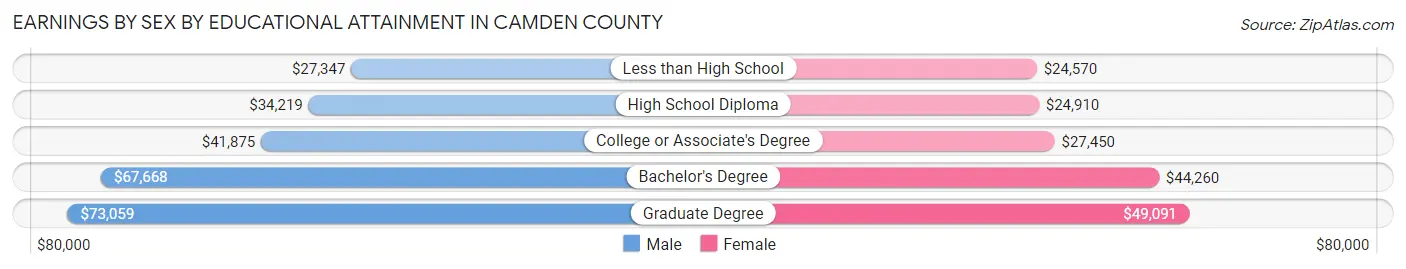
| Educational Attainment | Male Income | Female Income |
| Less than High School | $27,347 | $24,570 |
| High School Diploma | $34,219 | $24,910 |
| College or Associate's Degree | $41,875 | $27,450 |
| Bachelor's Degree | $67,668 | $44,260 |
| Graduate Degree | $73,059 | $49,091 |
| Total | $39,171 | $31,860 |
Family Income in Camden County
Family Income Brackets in Camden County
According to the Camden County family income data, there are 2,059 families falling into the $50,000 to $74,999 income range, which is the most common income bracket and makes up 18.8% of all families. Conversely, the $10,000 to $14,999 income bracket is the least frequent group with only 296 families (2.7%) belonging to this category.
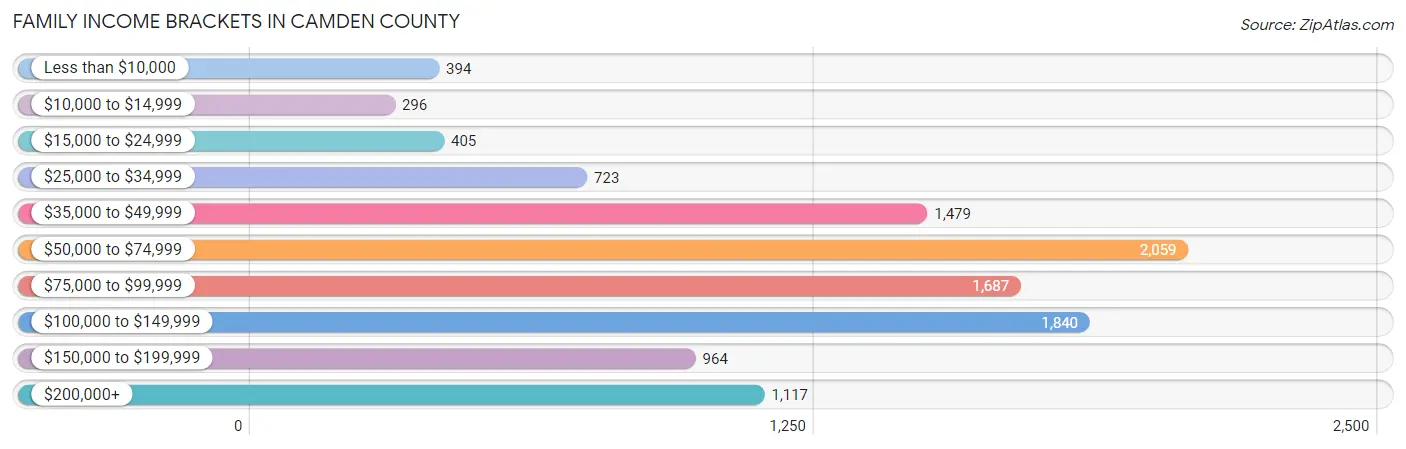
| Income Bracket | # Families | % Families |
| Less than $10,000 | 394 | 3.6% |
| $10,000 to $14,999 | 296 | 2.7% |
| $15,000 to $24,999 | 405 | 3.7% |
| $25,000 to $34,999 | 723 | 6.6% |
| $35,000 to $49,999 | 1,479 | 13.5% |
| $50,000 to $74,999 | 2,059 | 18.8% |
| $75,000 to $99,999 | 1,687 | 15.4% |
| $100,000 to $149,999 | 1,840 | 16.8% |
| $150,000 to $199,999 | 964 | 8.8% |
| $200,000+ | 1,117 | 10.2% |
Family Income by Famaliy Size in Camden County
7+ person families (31 | 0.3%) account for the highest median family income in Camden County with $129,028 per family, while 2-person families (7,170 | 65.5%) have the highest median income of $33,450 per family member.
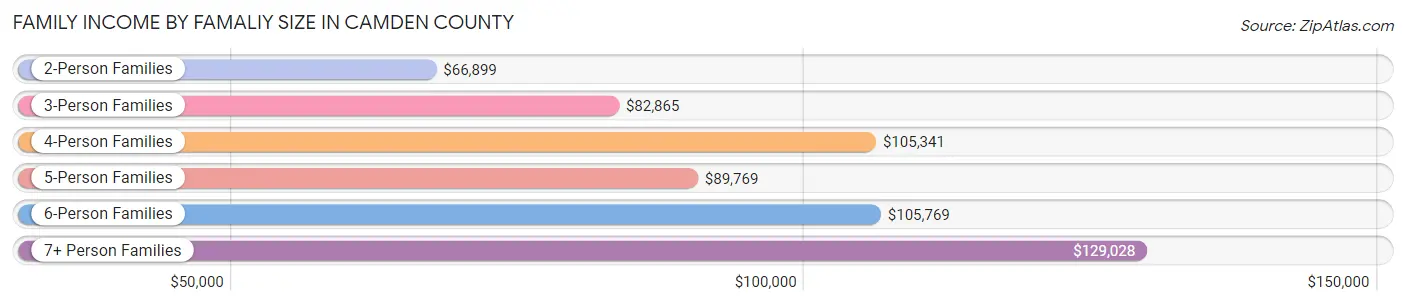
| Income Bracket | # Families | Median Income |
| 2-Person Families | 7,170 (65.5%) | $66,899 |
| 3-Person Families | 1,670 (15.2%) | $82,865 |
| 4-Person Families | 1,185 (10.8%) | $105,341 |
| 5-Person Families | 772 (7.0%) | $89,769 |
| 6-Person Families | 126 (1.1%) | $105,769 |
| 7+ Person Families | 31 (0.3%) | $129,028 |
| Total | 10,954 (100.0%) | $76,903 |
Family Income by Number of Earners in Camden County
The median family income in Camden County is $76,903, with families comprising 3+ earners (1,006) having the highest median family income of $127,813, while families with no earners (3,429) have the lowest median family income of $53,726, accounting for 9.2% and 31.3% of families, respectively.
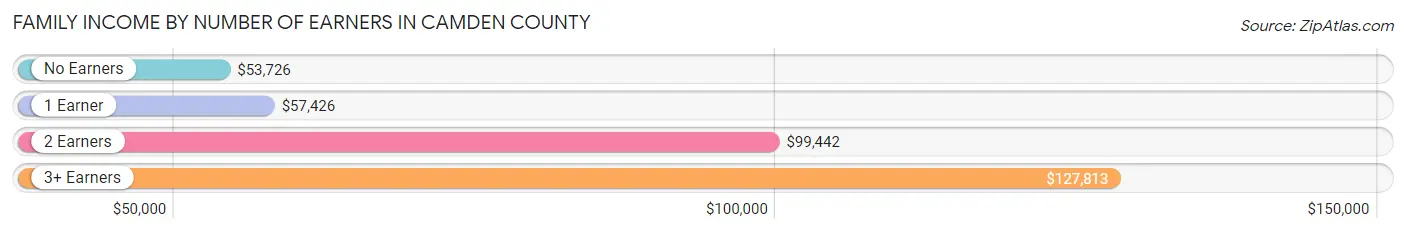
| Number of Earners | # Families | Median Income |
| No Earners | 3,429 (31.3%) | $53,726 |
| 1 Earner | 2,826 (25.8%) | $57,426 |
| 2 Earners | 3,693 (33.7%) | $99,442 |
| 3+ Earners | 1,006 (9.2%) | $127,813 |
| Total | 10,954 (100.0%) | $76,903 |
Household Income in Camden County
Household Income Brackets in Camden County
With 2,903 households falling in the category, the $50,000 to $74,999 income range is the most frequent in Camden County, accounting for 17.6% of all households. In contrast, only 858 households (5.2%) fall into the $10,000 to $14,999 income bracket, making it the least populous group.
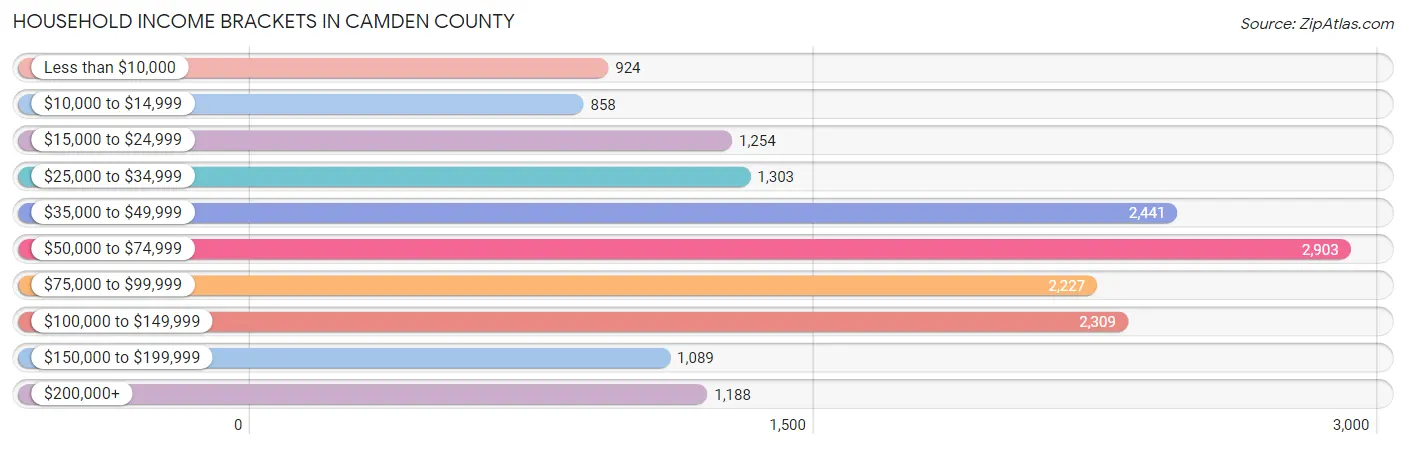
| Income Bracket | # Households | % Households |
| Less than $10,000 | 924 | 5.6% |
| $10,000 to $14,999 | 858 | 5.2% |
| $15,000 to $24,999 | 1,254 | 7.6% |
| $25,000 to $34,999 | 1,303 | 7.9% |
| $35,000 to $49,999 | 2,441 | 14.8% |
| $50,000 to $74,999 | 2,903 | 17.6% |
| $75,000 to $99,999 | 2,227 | 13.5% |
| $100,000 to $149,999 | 2,309 | 14.0% |
| $150,000 to $199,999 | 1,089 | 6.6% |
| $200,000+ | 1,188 | 7.2% |
Household Income by Householder Age in Camden County
The median household income in Camden County is $59,834, with the highest median household income of $78,378 found in the 45 to 64 years age bracket for the primary householder. A total of 6,298 households (38.2%) fall into this category. Meanwhile, the 65+ years age bracket for the primary householder has the lowest median household income of $49,975, with 7,009 households (42.5%) in this group.
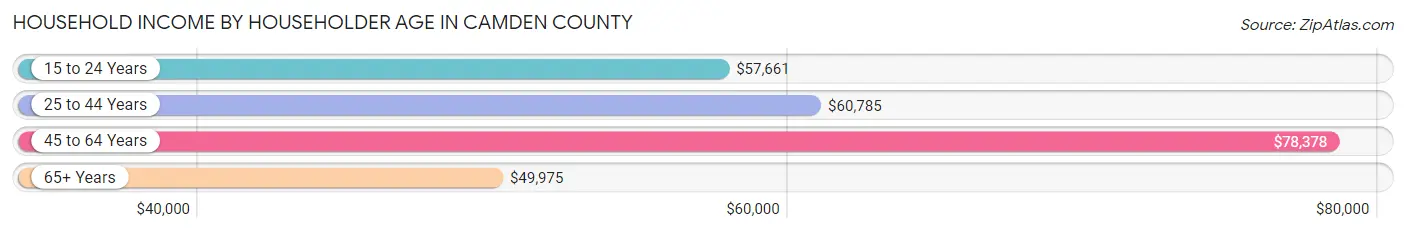
| Income Bracket | # Households | Median Income |
| 15 to 24 Years | 232 (1.4%) | $57,661 |
| 25 to 44 Years | 2,955 (17.9%) | $60,785 |
| 45 to 64 Years | 6,298 (38.2%) | $78,378 |
| 65+ Years | 7,009 (42.5%) | $49,975 |
| Total | 16,494 (100.0%) | $59,834 |
Poverty in Camden County
Income Below Poverty by Sex and Age in Camden County
With 13.1% poverty level for males and 13.8% for females among the residents of Camden County, 5 year old males and 5 year old females are the most vulnerable to poverty, with 196 males (55.8%) and 85 females (35.9%) in their respective age groups living below the poverty level.
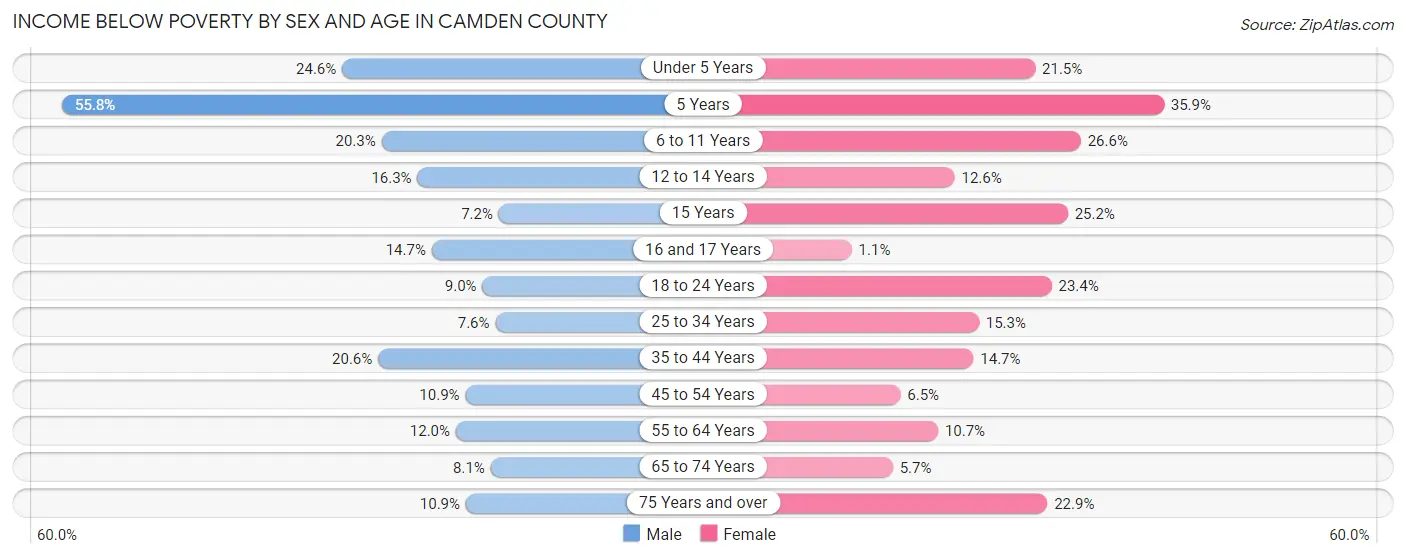
| Age Bracket | Male | Female |
| Under 5 Years | 237 (24.6%) | 172 (21.5%) |
| 5 Years | 196 (55.8%) | 85 (35.9%) |
| 6 to 11 Years | 213 (20.3%) | 302 (26.6%) |
| 12 to 14 Years | 92 (16.3%) | 80 (12.6%) |
| 15 Years | 10 (7.2%) | 80 (25.2%) |
| 16 and 17 Years | 83 (14.7%) | 4 (1.1%) |
| 18 to 24 Years | 127 (9.0%) | 285 (23.4%) |
| 25 to 34 Years | 149 (7.6%) | 282 (15.3%) |
| 35 to 44 Years | 412 (20.6%) | 302 (14.6%) |
| 45 to 54 Years | 253 (10.9%) | 166 (6.5%) |
| 55 to 64 Years | 443 (12.0%) | 443 (10.7%) |
| 65 to 74 Years | 310 (8.1%) | 214 (5.7%) |
| 75 Years and over | 245 (10.9%) | 541 (22.9%) |
| Total | 2,770 (13.1%) | 2,956 (13.8%) |
Income Above Poverty by Sex and Age in Camden County
According to the poverty statistics in Camden County, males aged 15 years and females aged 16 and 17 years are the age groups that are most secure financially, with 92.8% of males and 98.9% of females in these age groups living above the poverty line.
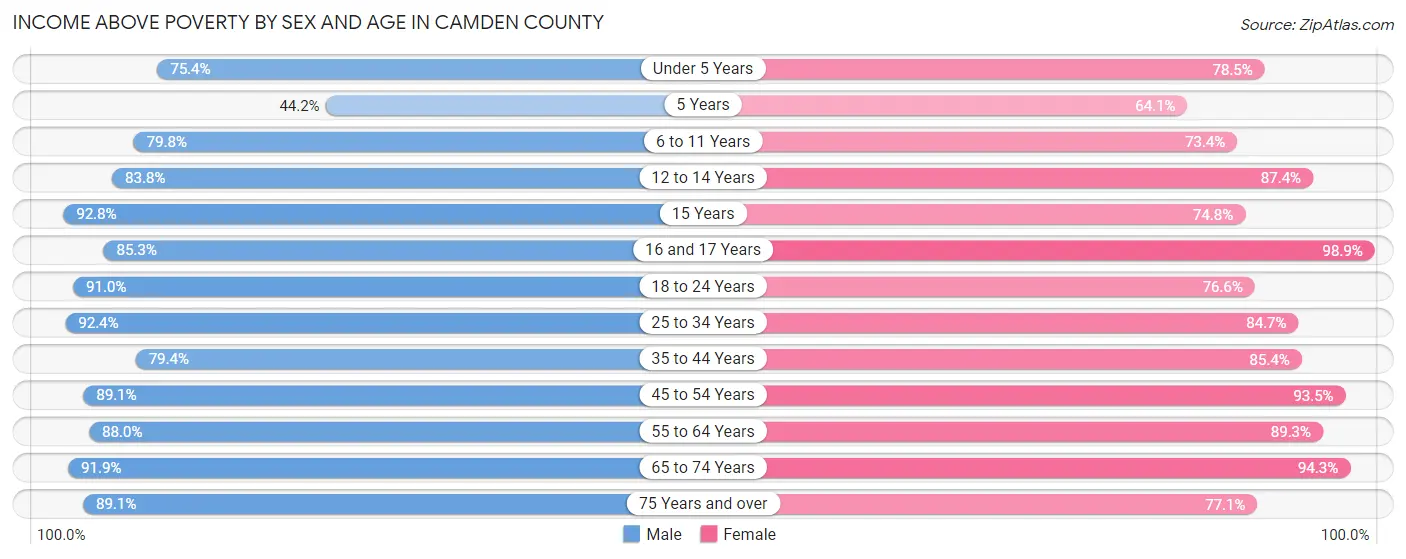
| Age Bracket | Male | Female |
| Under 5 Years | 725 (75.4%) | 627 (78.5%) |
| 5 Years | 155 (44.2%) | 152 (64.1%) |
| 6 to 11 Years | 839 (79.7%) | 833 (73.4%) |
| 12 to 14 Years | 474 (83.8%) | 557 (87.4%) |
| 15 Years | 129 (92.8%) | 238 (74.8%) |
| 16 and 17 Years | 483 (85.3%) | 358 (98.9%) |
| 18 to 24 Years | 1,282 (91.0%) | 935 (76.6%) |
| 25 to 34 Years | 1,818 (92.4%) | 1,566 (84.7%) |
| 35 to 44 Years | 1,585 (79.4%) | 1,759 (85.4%) |
| 45 to 54 Years | 2,066 (89.1%) | 2,381 (93.5%) |
| 55 to 64 Years | 3,257 (88.0%) | 3,694 (89.3%) |
| 65 to 74 Years | 3,522 (91.9%) | 3,560 (94.3%) |
| 75 Years and over | 2,011 (89.1%) | 1,823 (77.1%) |
| Total | 18,346 (86.9%) | 18,483 (86.2%) |
Income Below Poverty Among Married-Couple Families in Camden County
The poverty statistics for married-couple families in Camden County show that 6.7% or 634 of the total 9,469 families live below the poverty line. Families with 3 or 4 children have the highest poverty rate of 18.6%, comprising of 102 families. On the other hand, families with no children have the lowest poverty rate of 5.9%, which includes 415 families.

| Children | Above Poverty | Below Poverty |
| No Children | 6,672 (94.1%) | 415 (5.9%) |
| 1 or 2 Children | 1,717 (93.6%) | 117 (6.4%) |
| 3 or 4 Children | 446 (81.4%) | 102 (18.6%) |
| 5 or more Children | 0 (0.0%) | 0 (0.0%) |
| Total | 8,835 (93.3%) | 634 (6.7%) |
Income Below Poverty Among Single-Parent Households in Camden County
According to the poverty data in Camden County, 16.8% or 64 single-father households and 24.9% or 275 single-mother households are living below the poverty line. Among single-father households, those with 3 or 4 children have the highest poverty rate, with 43 households (100.0%) experiencing poverty. Likewise, among single-mother households, those with 3 or 4 children have the highest poverty rate, with 56 households (82.4%) falling below the poverty line.
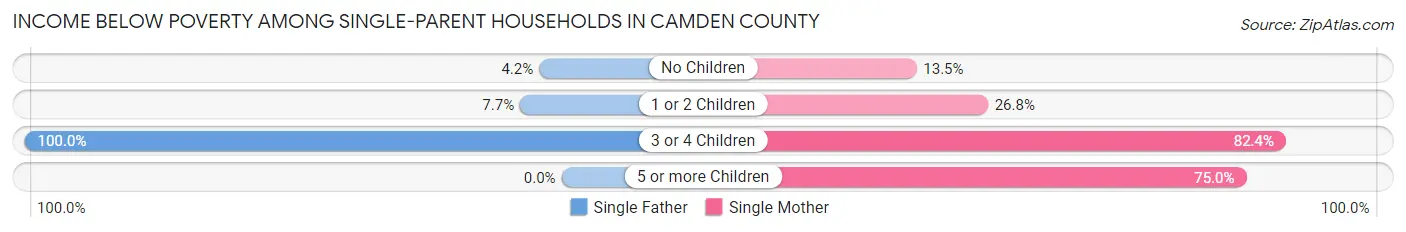
| Children | Single Father | Single Mother |
| No Children | 6 (4.2%) | 62 (13.5%) |
| 1 or 2 Children | 15 (7.7%) | 154 (26.8%) |
| 3 or 4 Children | 43 (100.0%) | 56 (82.4%) |
| 5 or more Children | 0 (0.0%) | 3 (75.0%) |
| Total | 64 (16.8%) | 275 (24.9%) |
Income Below Poverty Among Married-Couple vs Single-Parent Households in Camden County
The poverty data for Camden County shows that 634 of the married-couple family households (6.7%) and 339 of the single-parent households (22.8%) are living below the poverty level. Within the married-couple family households, those with 3 or 4 children have the highest poverty rate, with 102 households (18.6%) falling below the poverty line. Among the single-parent households, those with 3 or 4 children have the highest poverty rate, with 99 household (89.2%) living below poverty.
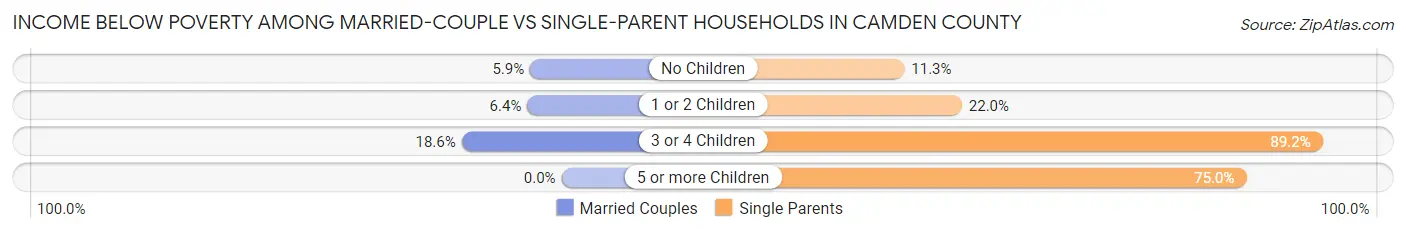
| Children | Married-Couple Families | Single-Parent Households |
| No Children | 415 (5.9%) | 68 (11.3%) |
| 1 or 2 Children | 117 (6.4%) | 169 (22.0%) |
| 3 or 4 Children | 102 (18.6%) | 99 (89.2%) |
| 5 or more Children | 0 (0.0%) | 3 (75.0%) |
| Total | 634 (6.7%) | 339 (22.8%) |
Employment Characteristics in Camden County
Employment by Class of Employer in Camden County
Among the 17,783 employed individuals in Camden County, private company employees (12,044 | 67.7%), not-for-profit organizations (1,738 | 9.8%), and self-employed (not incorporated) (1,208 | 6.8%) make up the most common classes of employment.
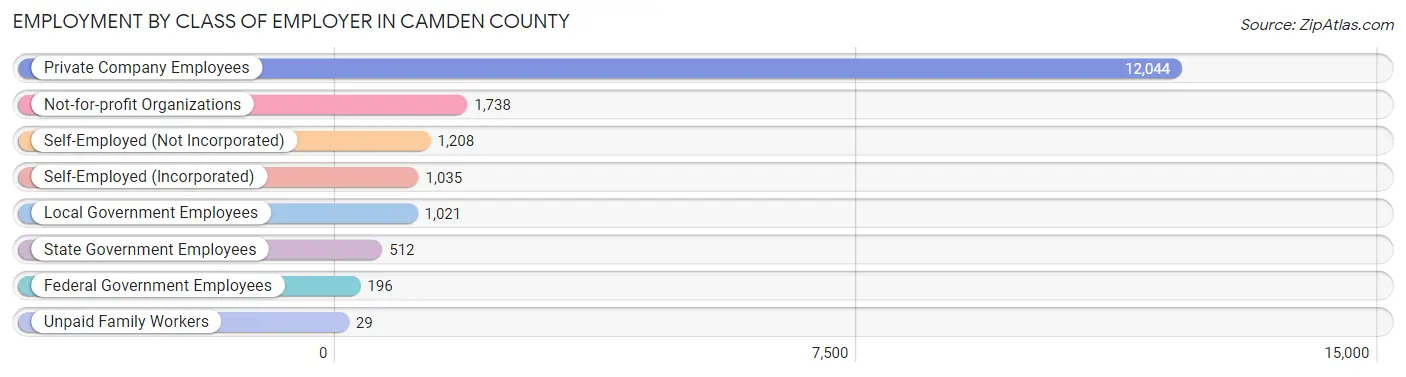
| Employer Class | # Employees | % Employees |
| Private Company Employees | 12,044 | 67.7% |
| Self-Employed (Incorporated) | 1,035 | 5.8% |
| Self-Employed (Not Incorporated) | 1,208 | 6.8% |
| Not-for-profit Organizations | 1,738 | 9.8% |
| Local Government Employees | 1,021 | 5.7% |
| State Government Employees | 512 | 2.9% |
| Federal Government Employees | 196 | 1.1% |
| Unpaid Family Workers | 29 | 0.2% |
| Total | 17,783 | 100.0% |
Employment Status by Age in Camden County
According to the labor force statistics for Camden County, out of the total population over 16 years of age (36,695), 51.9% or 19,045 individuals are in the labor force, with 5.2% or 990 of them unemployed. The age group with the highest labor force participation rate is 35 to 44 years, with 82.9% or 3,401 individuals in the labor force. Within the labor force, the 16 to 19 years age range has the highest percentage of unemployed individuals, with 17.3% or 160 of them being unemployed.
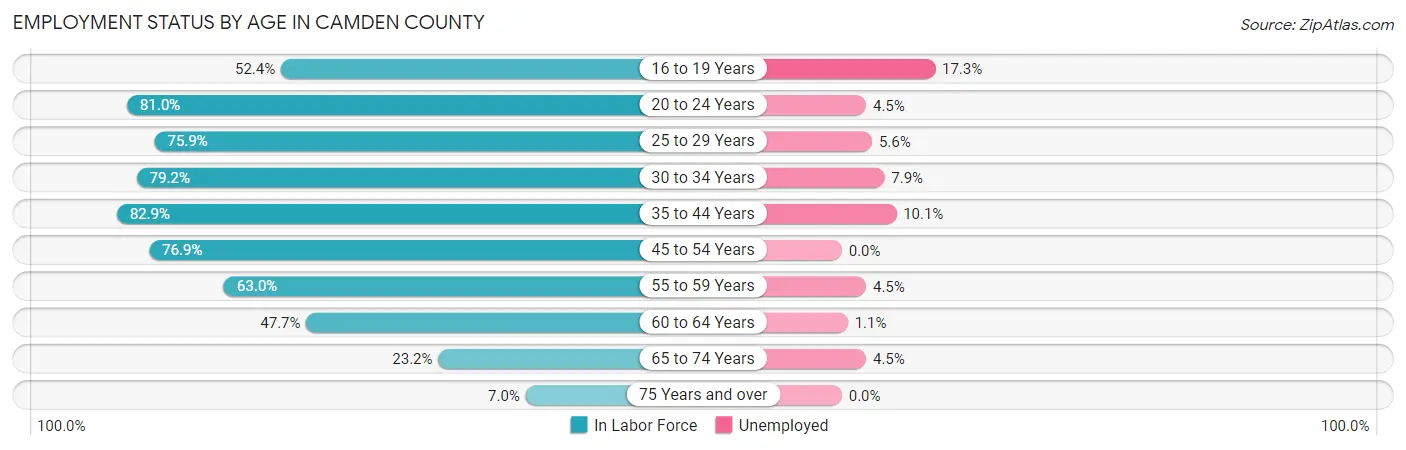
| Age Bracket | In Labor Force | Unemployed |
| 16 to 19 Years | 925 (52.4%) | 160 (17.3%) |
| 20 to 24 Years | 1,528 (81.0%) | 69 (4.5%) |
| 25 to 29 Years | 1,384 (75.9%) | 78 (5.6%) |
| 30 to 34 Years | 1,597 (79.2%) | 126 (7.9%) |
| 35 to 44 Years | 3,401 (82.9%) | 344 (10.1%) |
| 45 to 54 Years | 3,743 (76.9%) | 0 (0.0%) |
| 55 to 59 Years | 2,545 (63.0%) | 115 (4.5%) |
| 60 to 64 Years | 1,833 (47.7%) | 20 (1.1%) |
| 65 to 74 Years | 1,769 (23.2%) | 80 (4.5%) |
| 75 Years and over | 331 (7.0%) | 0 (0.0%) |
| Total | 19,045 (51.9%) | 990 (5.2%) |
Employment Status by Educational Attainment in Camden County
According to labor force statistics for Camden County, 70.1% of individuals (14,505) out of the total population between 25 and 64 years of age (20,692) are in the labor force, with 4.7% or 682 of them being unemployed. The group with the highest labor force participation rate are those with the educational attainment of bachelor's degree or higher, with 78.1% or 3,287 individuals in the labor force. Within the labor force, individuals with less than high school education have the highest percentage of unemployment, with 20.0% or 241 of them being unemployed.
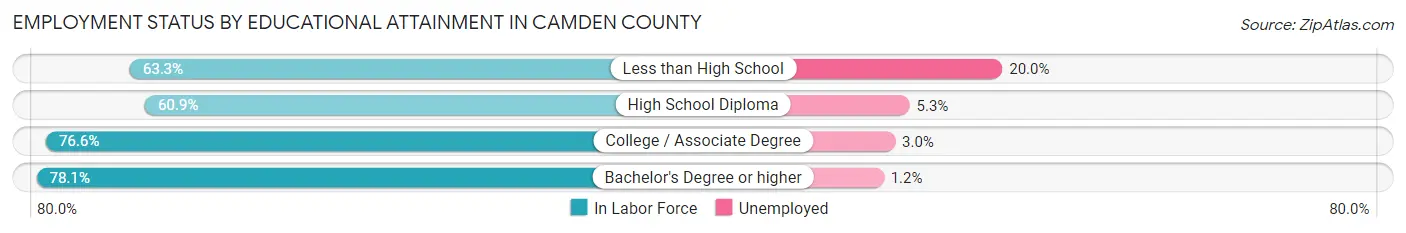
| Educational Attainment | In Labor Force | Unemployed |
| Less than High School | 1,207 (63.3%) | 381 (20.0%) |
| High School Diploma | 4,471 (60.9%) | 389 (5.3%) |
| College / Associate Degree | 5,541 (76.6%) | 217 (3.0%) |
| Bachelor's Degree or higher | 3,287 (78.1%) | 51 (1.2%) |
| Total | 14,505 (70.1%) | 973 (4.7%) |
Employment Occupations by Sex in Camden County
Management, Business, Science and Arts Occupations
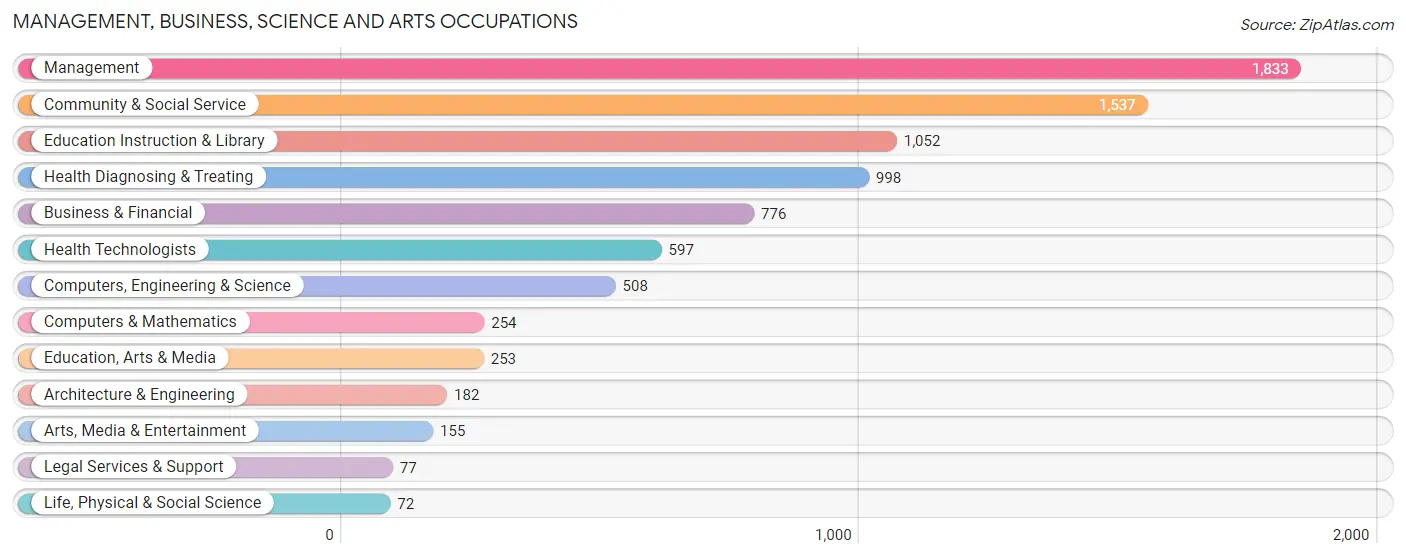
The most common Management, Business, Science and Arts occupations in Camden County are Management (1,833 | 10.1%), Community & Social Service (1,537 | 8.5%), Education Instruction & Library (1,052 | 5.8%), Health Diagnosing & Treating (998 | 5.5%), and Business & Financial (776 | 4.3%).
Management, Business, Science and Arts Occupations by Sex
Within the Management, Business, Science and Arts occupations in Camden County, the most male-oriented occupations are Architecture & Engineering (100.0%), Life, Physical & Social Science (84.7%), and Computers, Engineering & Science (74.6%), while the most female-oriented occupations are Health Diagnosing & Treating (78.9%), Education Instruction & Library (77.3%), and Community & Social Service (69.8%).
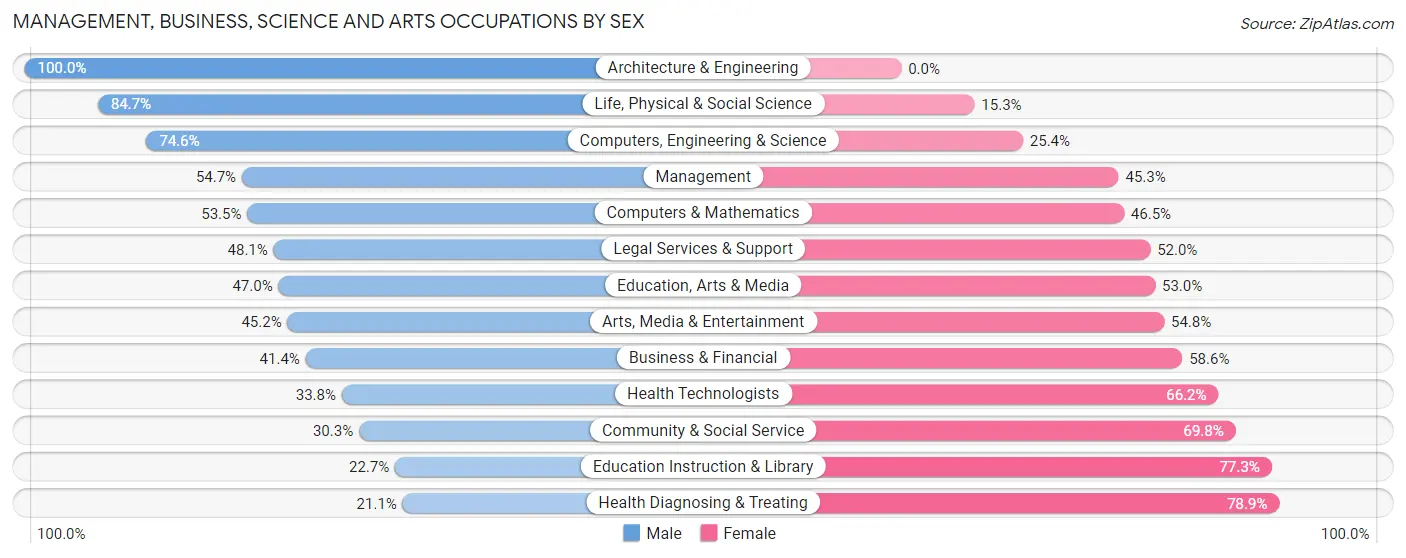
| Occupation | Male | Female |
| Management | 1,002 (54.7%) | 831 (45.3%) |
| Business & Financial | 321 (41.4%) | 455 (58.6%) |
| Computers, Engineering & Science | 379 (74.6%) | 129 (25.4%) |
| Computers & Mathematics | 136 (53.5%) | 118 (46.5%) |
| Architecture & Engineering | 182 (100.0%) | 0 (0.0%) |
| Life, Physical & Social Science | 61 (84.7%) | 11 (15.3%) |
| Community & Social Service | 465 (30.2%) | 1,072 (69.8%) |
| Education, Arts & Media | 119 (47.0%) | 134 (53.0%) |
| Legal Services & Support | 37 (48.0%) | 40 (51.9%) |
| Education Instruction & Library | 239 (22.7%) | 813 (77.3%) |
| Arts, Media & Entertainment | 70 (45.2%) | 85 (54.8%) |
| Health Diagnosing & Treating | 211 (21.1%) | 787 (78.9%) |
| Health Technologists | 202 (33.8%) | 395 (66.2%) |
| Total (Category) | 2,378 (42.1%) | 3,274 (57.9%) |
| Total (Overall) | 9,259 (51.2%) | 8,810 (48.8%) |
Services Occupations
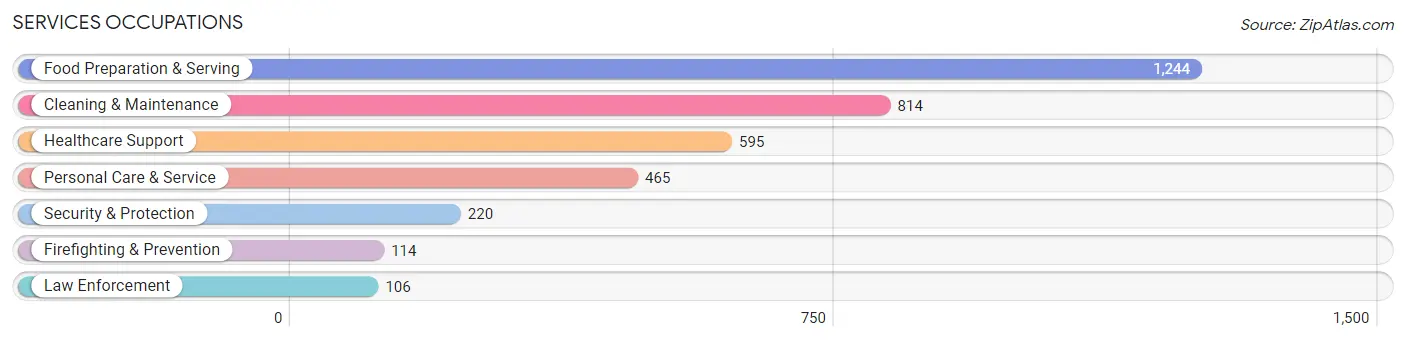
The most common Services occupations in Camden County are Food Preparation & Serving (1,244 | 6.9%), Cleaning & Maintenance (814 | 4.5%), Healthcare Support (595 | 3.3%), Personal Care & Service (465 | 2.6%), and Security & Protection (220 | 1.2%).
Services Occupations by Sex
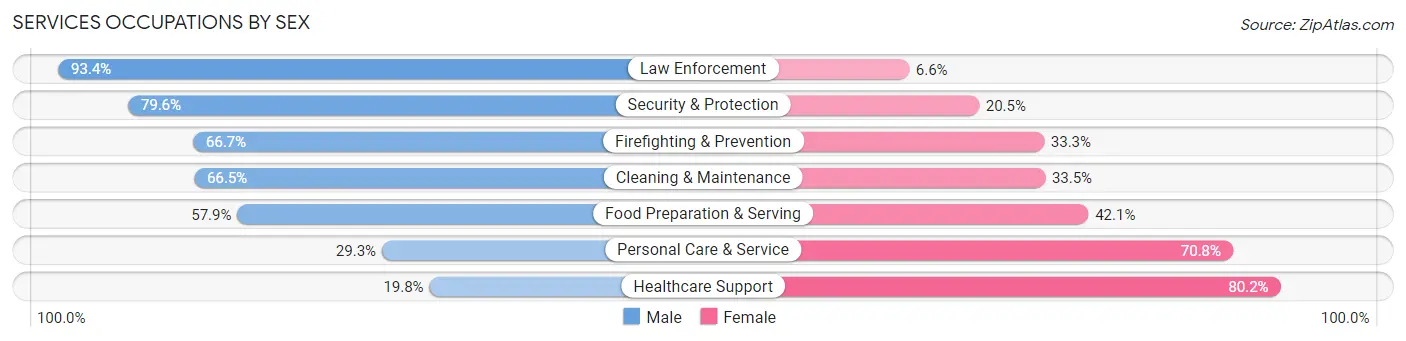
Within the Services occupations in Camden County, the most male-oriented occupations are Law Enforcement (93.4%), Security & Protection (79.5%), and Firefighting & Prevention (66.7%), while the most female-oriented occupations are Healthcare Support (80.2%), Personal Care & Service (70.8%), and Food Preparation & Serving (42.1%).
| Occupation | Male | Female |
| Healthcare Support | 118 (19.8%) | 477 (80.2%) |
| Security & Protection | 175 (79.5%) | 45 (20.4%) |
| Firefighting & Prevention | 76 (66.7%) | 38 (33.3%) |
| Law Enforcement | 99 (93.4%) | 7 (6.6%) |
| Food Preparation & Serving | 720 (57.9%) | 524 (42.1%) |
| Cleaning & Maintenance | 541 (66.5%) | 273 (33.5%) |
| Personal Care & Service | 136 (29.2%) | 329 (70.8%) |
| Total (Category) | 1,690 (50.6%) | 1,648 (49.4%) |
| Total (Overall) | 9,259 (51.2%) | 8,810 (48.8%) |
Sales and Office Occupations
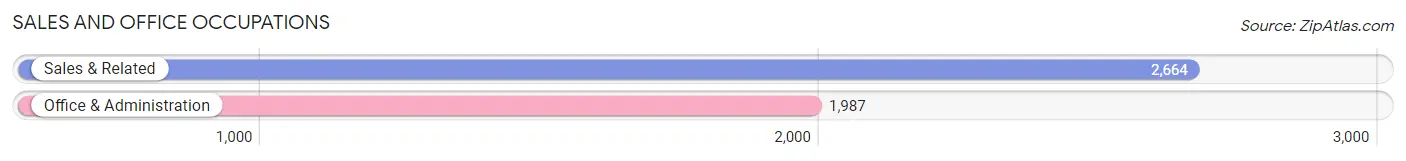
The most common Sales and Office occupations in Camden County are Sales & Related (2,664 | 14.7%), and Office & Administration (1,987 | 11.0%).
Sales and Office Occupations by Sex

| Occupation | Male | Female |
| Sales & Related | 1,240 (46.6%) | 1,424 (53.4%) |
| Office & Administration | 370 (18.6%) | 1,617 (81.4%) |
| Total (Category) | 1,610 (34.6%) | 3,041 (65.4%) |
| Total (Overall) | 9,259 (51.2%) | 8,810 (48.8%) |
Natural Resources, Construction and Maintenance Occupations
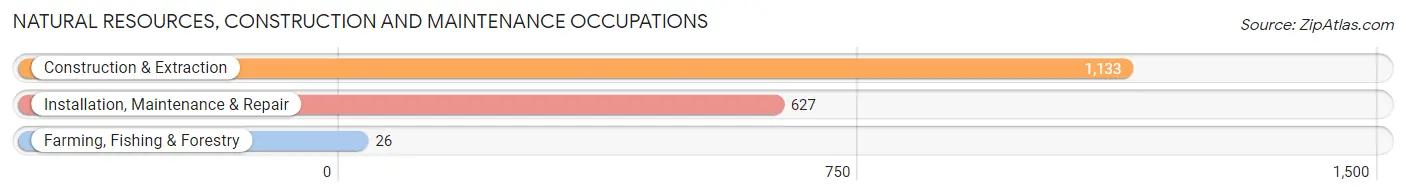
The most common Natural Resources, Construction and Maintenance occupations in Camden County are Construction & Extraction (1,133 | 6.3%), Installation, Maintenance & Repair (627 | 3.5%), and Farming, Fishing & Forestry (26 | 0.1%).
Natural Resources, Construction and Maintenance Occupations by Sex
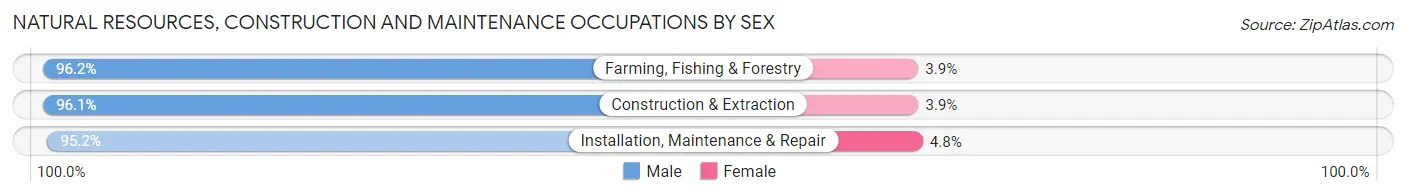
| Occupation | Male | Female |
| Farming, Fishing & Forestry | 25 (96.2%) | 1 (3.8%) |
| Construction & Extraction | 1,089 (96.1%) | 44 (3.9%) |
| Installation, Maintenance & Repair | 597 (95.2%) | 30 (4.8%) |
| Total (Category) | 1,711 (95.8%) | 75 (4.2%) |
| Total (Overall) | 9,259 (51.2%) | 8,810 (48.8%) |
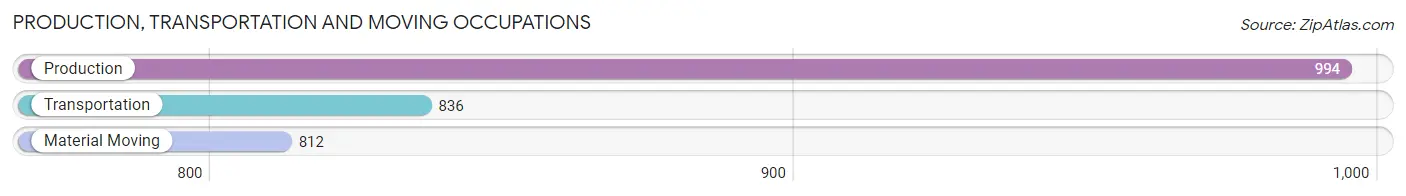
Production, Transportation and Moving Occupations
The most common Production, Transportation and Moving occupations in Camden County are Production (994 | 5.5%), Transportation (836 | 4.6%), and Material Moving (812 | 4.5%).
Production, Transportation and Moving Occupations by Sex
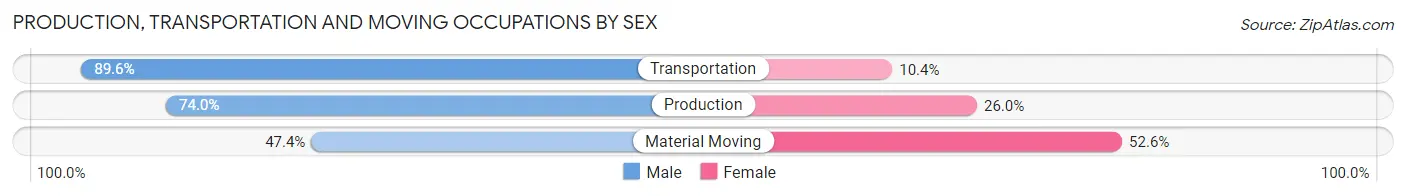
| Occupation | Male | Female |
| Production | 736 (74.0%) | 258 (26.0%) |
| Transportation | 749 (89.6%) | 87 (10.4%) |
| Material Moving | 385 (47.4%) | 427 (52.6%) |
| Total (Category) | 1,870 (70.8%) | 772 (29.2%) |
| Total (Overall) | 9,259 (51.2%) | 8,810 (48.8%) |
Employment Industries by Sex in Camden County
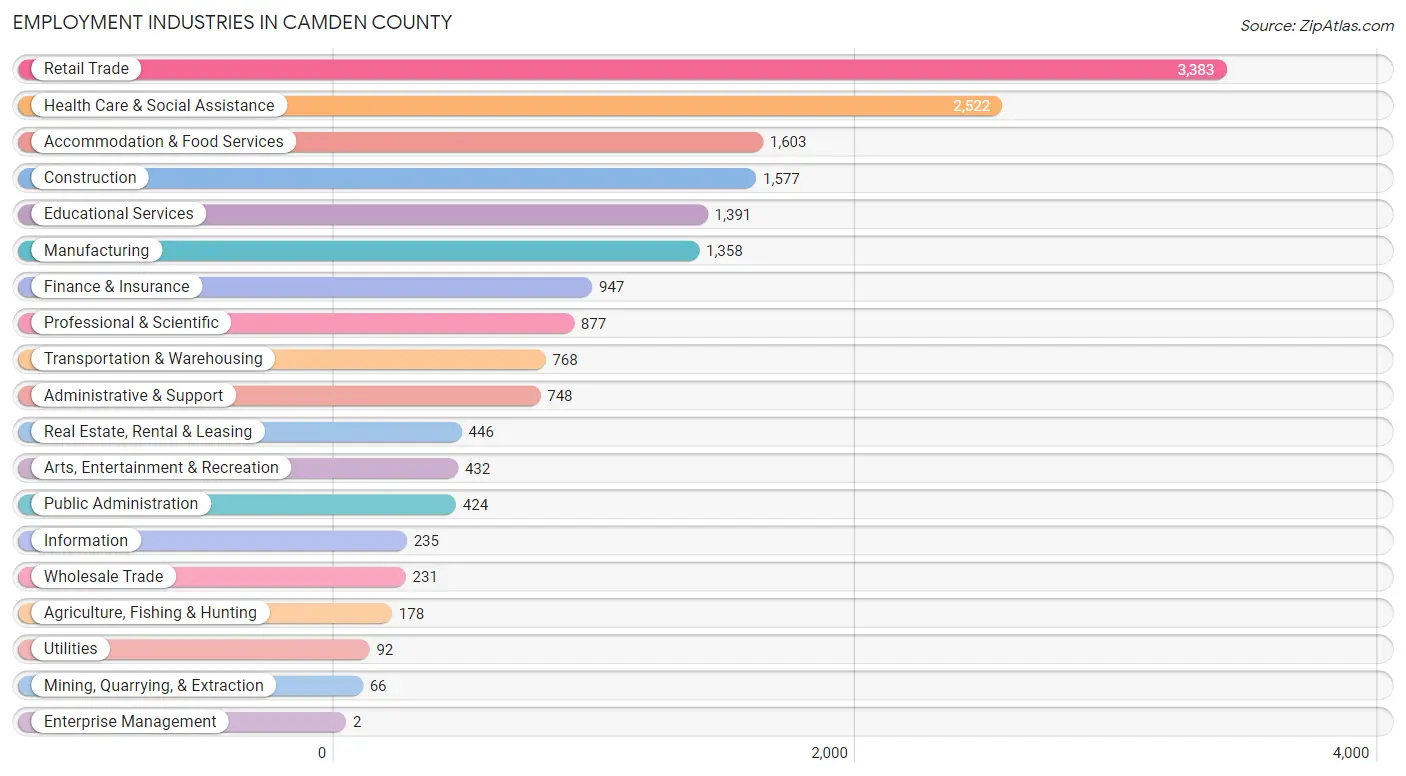
Employment Industries in Camden County
The major employment industries in Camden County include Retail Trade (3,383 | 18.7%), Health Care & Social Assistance (2,522 | 14.0%), Accommodation & Food Services (1,603 | 8.9%), Construction (1,577 | 8.7%), and Educational Services (1,391 | 7.7%).
Employment Industries by Sex in Camden County
The Camden County industries that see more men than women are Agriculture, Fishing & Hunting (99.4%), Mining, Quarrying, & Extraction (90.9%), and Construction (87.8%), whereas the industries that tend to have a higher number of women are Enterprise Management (100.0%), Health Care & Social Assistance (82.5%), and Educational Services (72.0%).
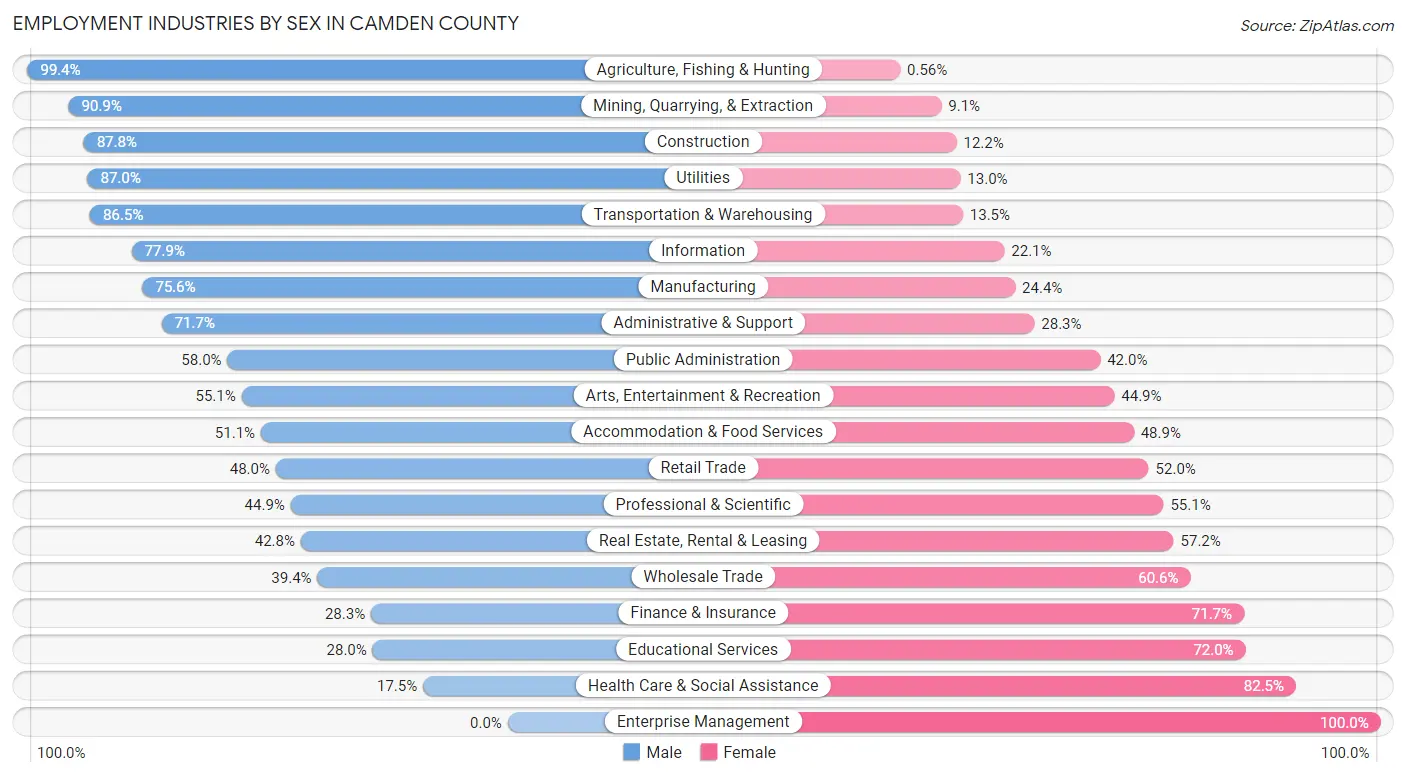
| Industry | Male | Female |
| Agriculture, Fishing & Hunting | 177 (99.4%) | 1 (0.6%) |
| Mining, Quarrying, & Extraction | 60 (90.9%) | 6 (9.1%) |
| Construction | 1,384 (87.8%) | 193 (12.2%) |
| Manufacturing | 1,027 (75.6%) | 331 (24.4%) |
| Wholesale Trade | 91 (39.4%) | 140 (60.6%) |
| Retail Trade | 1,624 (48.0%) | 1,759 (52.0%) |
| Transportation & Warehousing | 664 (86.5%) | 104 (13.5%) |
| Utilities | 80 (87.0%) | 12 (13.0%) |
| Information | 183 (77.9%) | 52 (22.1%) |
| Finance & Insurance | 268 (28.3%) | 679 (71.7%) |
| Real Estate, Rental & Leasing | 191 (42.8%) | 255 (57.2%) |
| Professional & Scientific | 394 (44.9%) | 483 (55.1%) |
| Enterprise Management | 0 (0.0%) | 2 (100.0%) |
| Administrative & Support | 536 (71.7%) | 212 (28.3%) |
| Educational Services | 389 (28.0%) | 1,002 (72.0%) |
| Health Care & Social Assistance | 442 (17.5%) | 2,080 (82.5%) |
| Arts, Entertainment & Recreation | 238 (55.1%) | 194 (44.9%) |
| Accommodation & Food Services | 819 (51.1%) | 784 (48.9%) |
| Public Administration | 246 (58.0%) | 178 (42.0%) |
| Total | 9,259 (51.2%) | 8,810 (48.8%) |
Education in Camden County
School Enrollment in Camden County
The most common levels of schooling among the 7,264 students in Camden County are high school (1,944 | 26.8%), elementary school (1,667 | 23.0%), and middle school (1,609 | 22.2%).
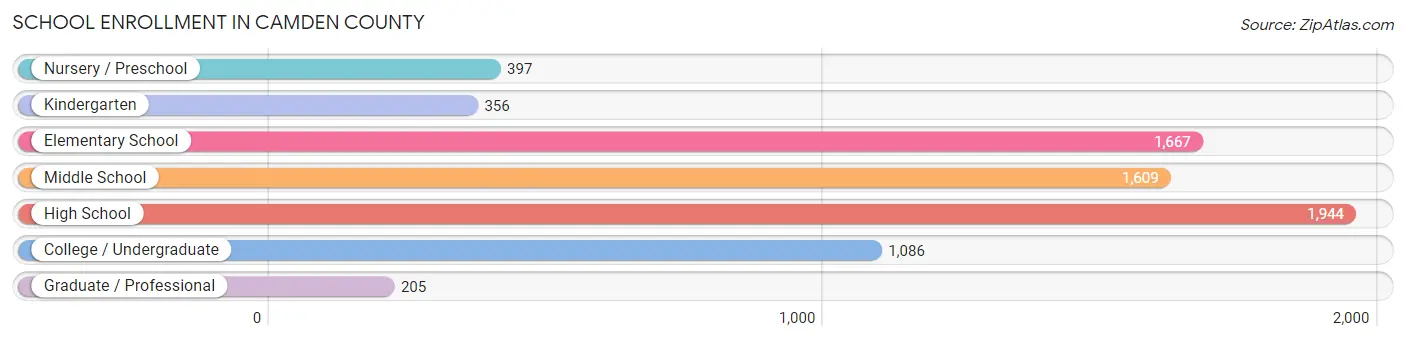
| School Level | # Students | % Students |
| Nursery / Preschool | 397 | 5.5% |
| Kindergarten | 356 | 4.9% |
| Elementary School | 1,667 | 23.0% |
| Middle School | 1,609 | 22.2% |
| High School | 1,944 | 26.8% |
| College / Undergraduate | 1,086 | 14.9% |
| Graduate / Professional | 205 | 2.8% |
| Total | 7,264 | 100.0% |
School Enrollment by Age by Funding Source in Camden County
Out of a total of 7,264 students who are enrolled in schools in Camden County, 763 (10.5%) attend a private institution, while the remaining 6,501 (89.5%) are enrolled in public schools. The age group of 35 years and over has the highest likelihood of being enrolled in private schools, with 89 (22.4% in the age bracket) enrolled. Conversely, the age group of 18 to 19 year olds has the lowest likelihood of being enrolled in a private school, with 410 (93.0% in the age bracket) attending a public institution.
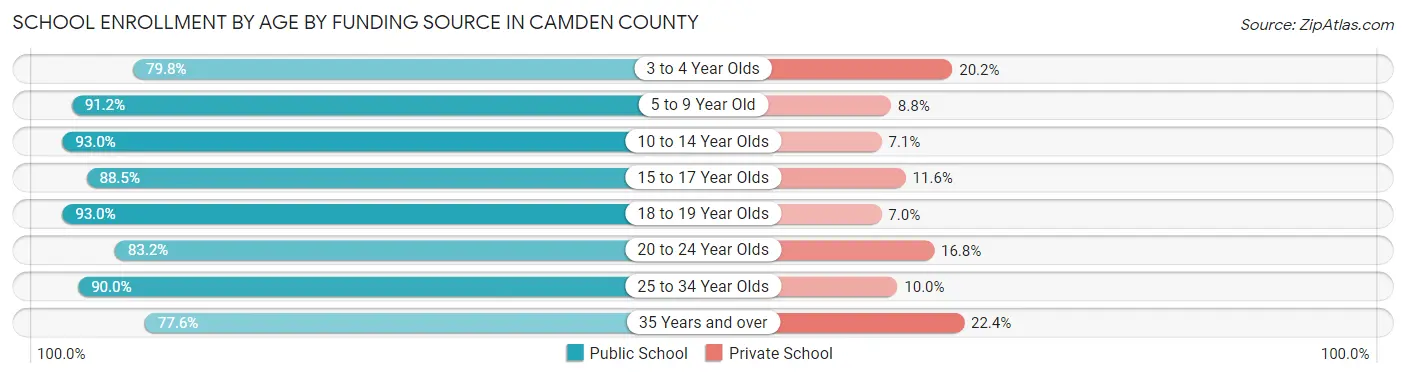
| Age Bracket | Public School | Private School |
| 3 to 4 Year Olds | 205 (79.8%) | 52 (20.2%) |
| 5 to 9 Year Old | 1,823 (91.2%) | 176 (8.8%) |
| 10 to 14 Year Olds | 1,873 (92.9%) | 142 (7.0%) |
| 15 to 17 Year Olds | 1,187 (88.4%) | 155 (11.6%) |
| 18 to 19 Year Olds | 410 (93.0%) | 31 (7.0%) |
| 20 to 24 Year Olds | 435 (83.2%) | 88 (16.8%) |
| 25 to 34 Year Olds | 261 (90.0%) | 29 (10.0%) |
| 35 Years and over | 308 (77.6%) | 89 (22.4%) |
| Total | 6,501 (89.5%) | 763 (10.5%) |
Educational Attainment by Field of Study in Camden County
Business (1,823 | 23.4%), education (1,468 | 18.9%), science & technology (891 | 11.5%), bio, nature & agricultural (587 | 7.5%), and engineering (552 | 7.1%) are the most common fields of study among 7,778 individuals in Camden County who have obtained a bachelor's degree or higher.
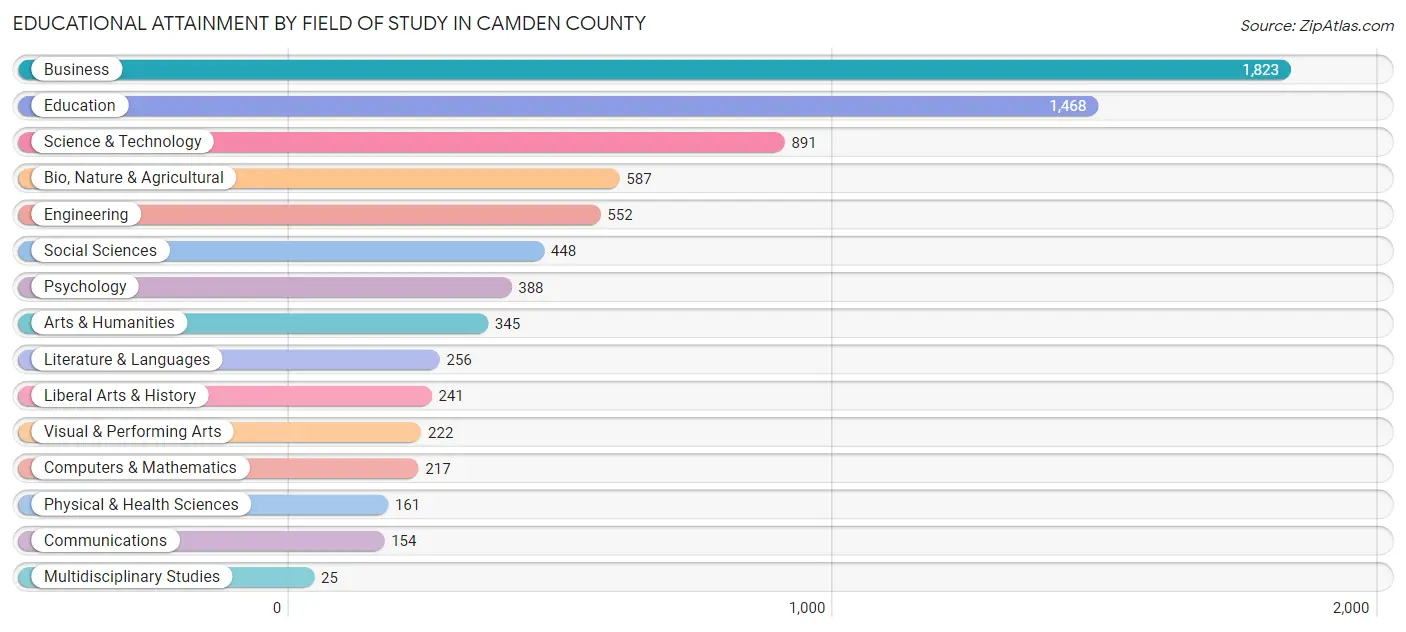
| Field of Study | # Graduates | % Graduates |
| Computers & Mathematics | 217 | 2.8% |
| Bio, Nature & Agricultural | 587 | 7.5% |
| Physical & Health Sciences | 161 | 2.1% |
| Psychology | 388 | 5.0% |
| Social Sciences | 448 | 5.8% |
| Engineering | 552 | 7.1% |
| Multidisciplinary Studies | 25 | 0.3% |
| Science & Technology | 891 | 11.5% |
| Business | 1,823 | 23.4% |
| Education | 1,468 | 18.9% |
| Literature & Languages | 256 | 3.3% |
| Liberal Arts & History | 241 | 3.1% |
| Visual & Performing Arts | 222 | 2.9% |
| Communications | 154 | 2.0% |
| Arts & Humanities | 345 | 4.4% |
| Total | 7,778 | 100.0% |
Transportation & Commute in Camden County
Vehicle Availability by Sex in Camden County
The most prevalent vehicle ownership categories in Camden County are males with 2 vehicles (3,815, accounting for 41.7%) and females with 2 vehicles (3,434, making up 44.3%).
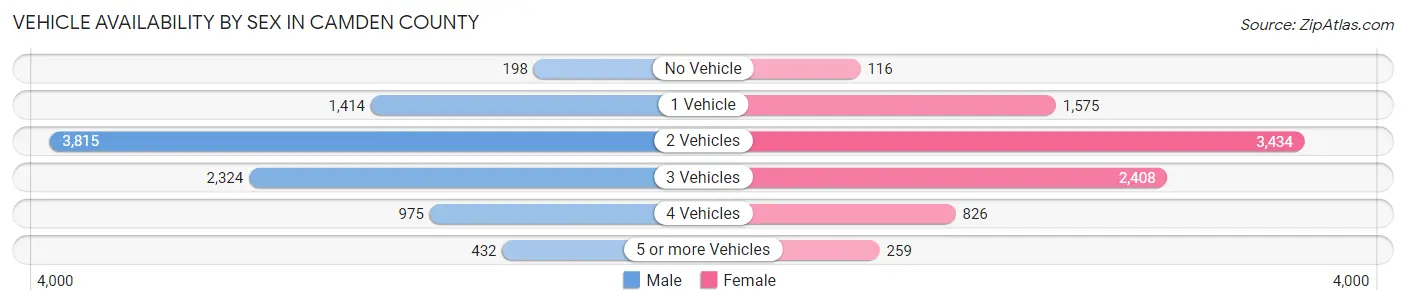
| Vehicles Available | Male | Female |
| No Vehicle | 198 (2.2%) | 116 (1.3%) |
| 1 Vehicle | 1,414 (15.4%) | 1,575 (18.3%) |
| 2 Vehicles | 3,815 (41.7%) | 3,434 (39.9%) |
| 3 Vehicles | 2,324 (25.4%) | 2,408 (27.9%) |
| 4 Vehicles | 975 (10.6%) | 826 (9.6%) |
| 5 or more Vehicles | 432 (4.7%) | 259 (3.0%) |
| Total | 9,158 (100.0%) | 8,618 (100.0%) |
Commute Time in Camden County
The most frequently occuring commute durations in Camden County are 15 to 19 minutes (3,261 commuters, 20.2%), 20 to 24 minutes (2,592 commuters, 16.0%), and 10 to 14 minutes (2,358 commuters, 14.6%).
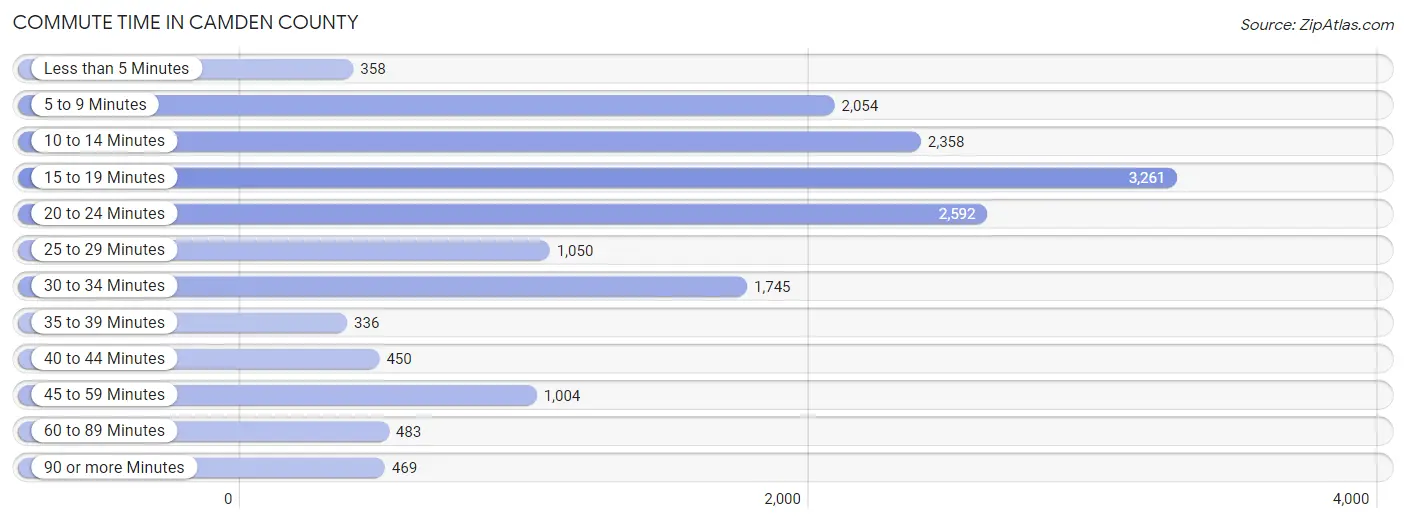
| Commute Time | # Commuters | % Commuters |
| Less than 5 Minutes | 358 | 2.2% |
| 5 to 9 Minutes | 2,054 | 12.7% |
| 10 to 14 Minutes | 2,358 | 14.6% |
| 15 to 19 Minutes | 3,261 | 20.2% |
| 20 to 24 Minutes | 2,592 | 16.0% |
| 25 to 29 Minutes | 1,050 | 6.5% |
| 30 to 34 Minutes | 1,745 | 10.8% |
| 35 to 39 Minutes | 336 | 2.1% |
| 40 to 44 Minutes | 450 | 2.8% |
| 45 to 59 Minutes | 1,004 | 6.2% |
| 60 to 89 Minutes | 483 | 3.0% |
| 90 or more Minutes | 469 | 2.9% |
Commute Time by Sex in Camden County
The most common commute times in Camden County are 15 to 19 minutes (1,500 commuters, 18.0%) for males and 15 to 19 minutes (1,761 commuters, 22.6%) for females.
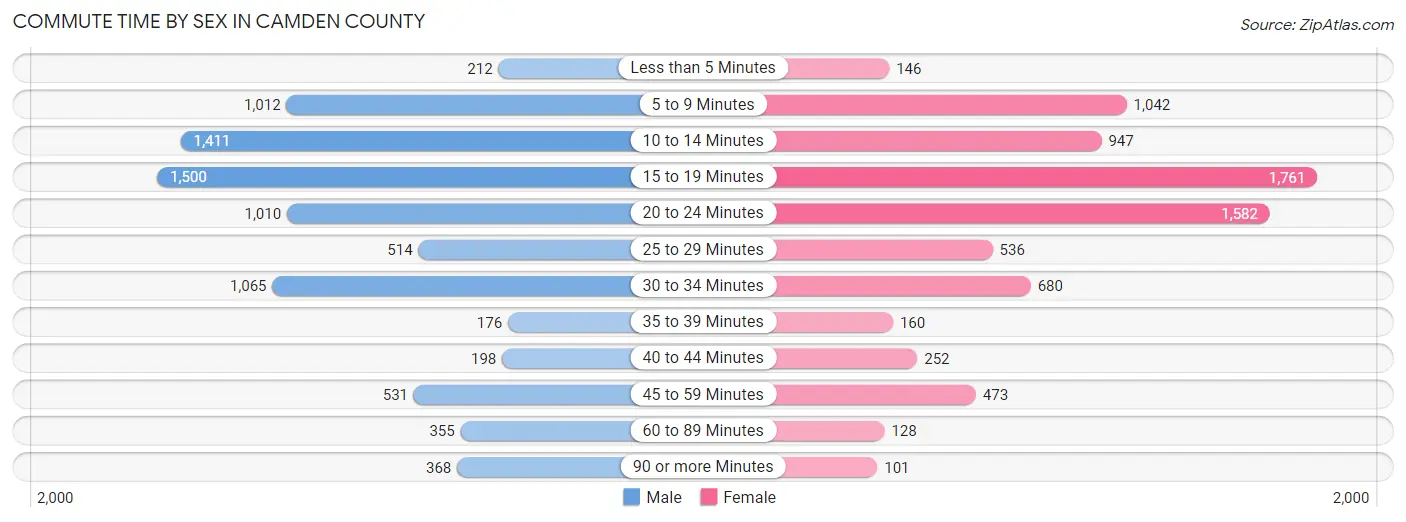
| Commute Time | Male | Female |
| Less than 5 Minutes | 212 (2.5%) | 146 (1.9%) |
| 5 to 9 Minutes | 1,012 (12.1%) | 1,042 (13.4%) |
| 10 to 14 Minutes | 1,411 (16.9%) | 947 (12.1%) |
| 15 to 19 Minutes | 1,500 (18.0%) | 1,761 (22.6%) |
| 20 to 24 Minutes | 1,010 (12.1%) | 1,582 (20.3%) |
| 25 to 29 Minutes | 514 (6.1%) | 536 (6.9%) |
| 30 to 34 Minutes | 1,065 (12.8%) | 680 (8.7%) |
| 35 to 39 Minutes | 176 (2.1%) | 160 (2.1%) |
| 40 to 44 Minutes | 198 (2.4%) | 252 (3.2%) |
| 45 to 59 Minutes | 531 (6.4%) | 473 (6.1%) |
| 60 to 89 Minutes | 355 (4.3%) | 128 (1.6%) |
| 90 or more Minutes | 368 (4.4%) | 101 (1.3%) |
Time of Departure to Work by Sex in Camden County
The most frequent times of departure to work in Camden County are 7:00 AM to 7:29 AM (1,435, 17.2%) for males and 7:00 AM to 7:29 AM (1,606, 20.6%) for females.
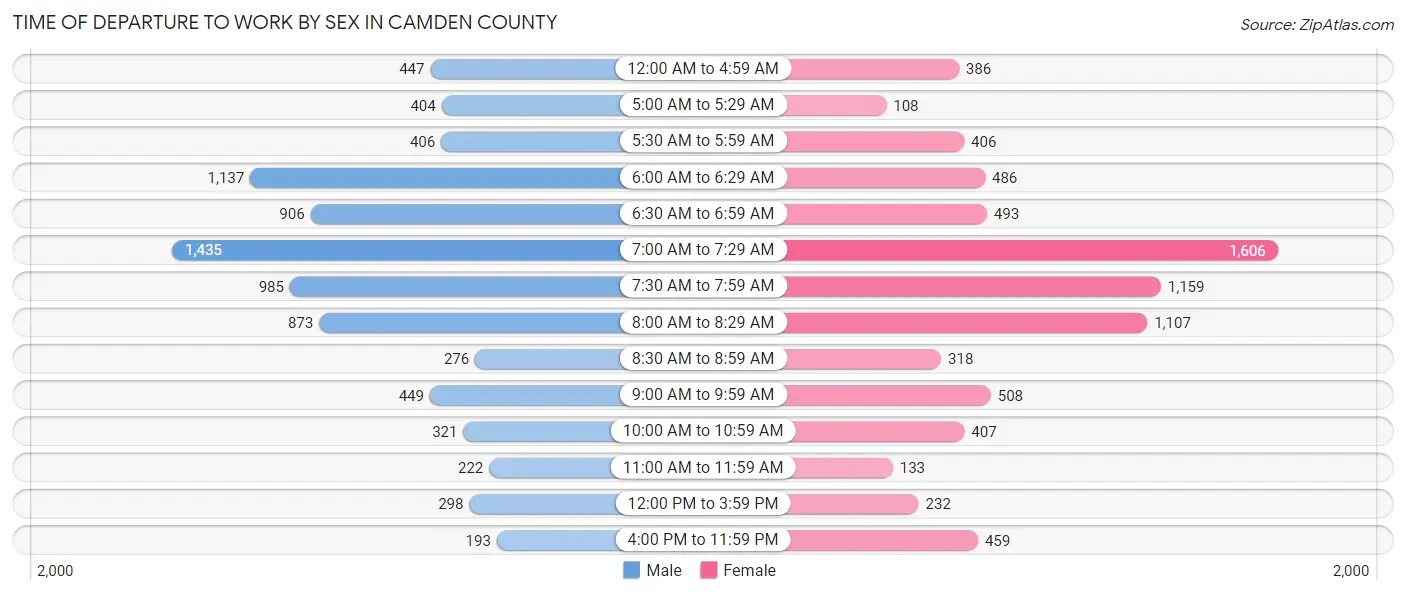
| Time of Departure | Male | Female |
| 12:00 AM to 4:59 AM | 447 (5.3%) | 386 (4.9%) |
| 5:00 AM to 5:29 AM | 404 (4.8%) | 108 (1.4%) |
| 5:30 AM to 5:59 AM | 406 (4.9%) | 406 (5.2%) |
| 6:00 AM to 6:29 AM | 1,137 (13.6%) | 486 (6.2%) |
| 6:30 AM to 6:59 AM | 906 (10.8%) | 493 (6.3%) |
| 7:00 AM to 7:29 AM | 1,435 (17.2%) | 1,606 (20.6%) |
| 7:30 AM to 7:59 AM | 985 (11.8%) | 1,159 (14.8%) |
| 8:00 AM to 8:29 AM | 873 (10.4%) | 1,107 (14.2%) |
| 8:30 AM to 8:59 AM | 276 (3.3%) | 318 (4.1%) |
| 9:00 AM to 9:59 AM | 449 (5.4%) | 508 (6.5%) |
| 10:00 AM to 10:59 AM | 321 (3.8%) | 407 (5.2%) |
| 11:00 AM to 11:59 AM | 222 (2.7%) | 133 (1.7%) |
| 12:00 PM to 3:59 PM | 298 (3.6%) | 232 (3.0%) |
| 4:00 PM to 11:59 PM | 193 (2.3%) | 459 (5.9%) |
| Total | 8,352 (100.0%) | 7,808 (100.0%) |
Housing Occupancy in Camden County
Occupancy by Ownership in Camden County
Of the total 16,494 dwellings in Camden County, owner-occupied units account for 13,508 (81.9%), while renter-occupied units make up 2,986 (18.1%).
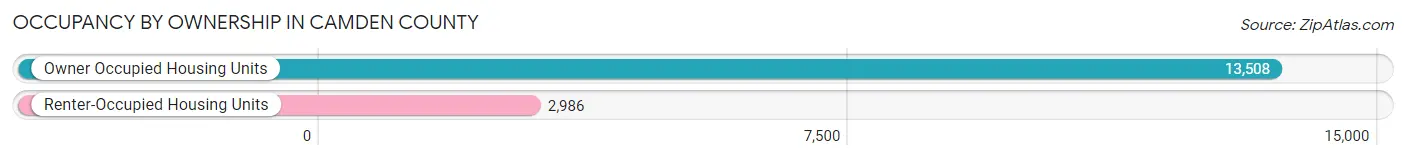
| Occupancy | # Housing Units | % Housing Units |
| Owner Occupied Housing Units | 13,508 | 81.9% |
| Renter-Occupied Housing Units | 2,986 | 18.1% |
| Total Occupied Housing Units | 16,494 | 100.0% |
Occupancy by Household Size in Camden County
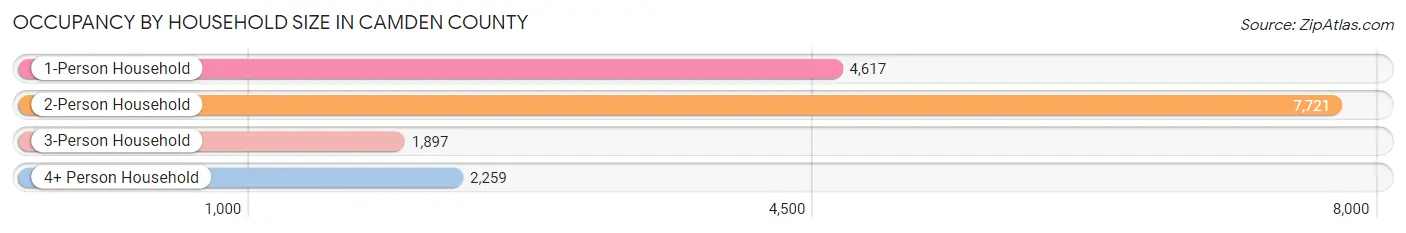
| Household Size | # Housing Units | % Housing Units |
| 1-Person Household | 4,617 | 28.0% |
| 2-Person Household | 7,721 | 46.8% |
| 3-Person Household | 1,897 | 11.5% |
| 4+ Person Household | 2,259 | 13.7% |
| Total Housing Units | 16,494 | 100.0% |
Occupancy by Ownership by Household Size in Camden County
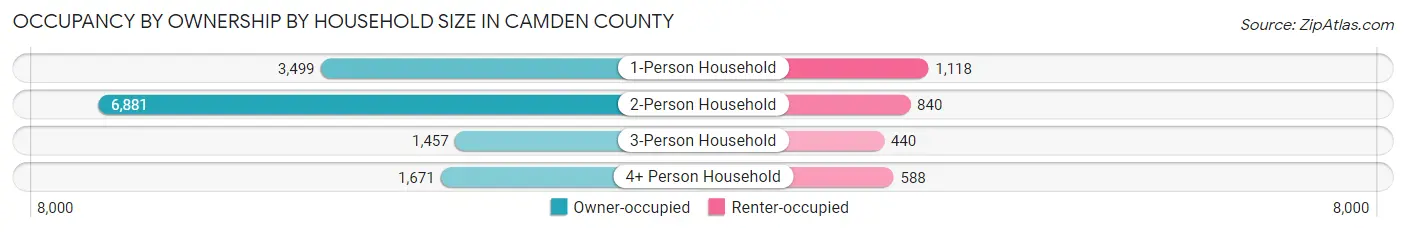
| Household Size | Owner-occupied | Renter-occupied |
| 1-Person Household | 3,499 (75.8%) | 1,118 (24.2%) |
| 2-Person Household | 6,881 (89.1%) | 840 (10.9%) |
| 3-Person Household | 1,457 (76.8%) | 440 (23.2%) |
| 4+ Person Household | 1,671 (74.0%) | 588 (26.0%) |
| Total Housing Units | 13,508 (81.9%) | 2,986 (18.1%) |
Occupancy by Educational Attainment in Camden County
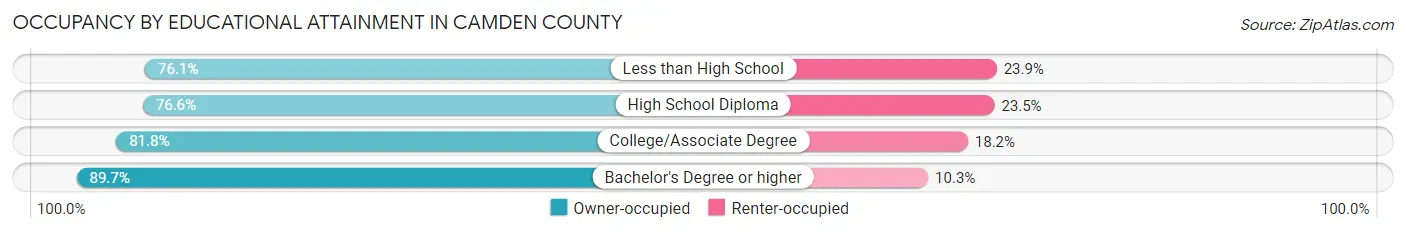
| Household Size | Owner-occupied | Renter-occupied |
| Less than High School | 764 (76.1%) | 240 (23.9%) |
| High School Diploma | 4,097 (76.5%) | 1,255 (23.4%) |
| College/Associate Degree | 4,636 (81.8%) | 1,030 (18.2%) |
| Bachelor's Degree or higher | 4,011 (89.7%) | 461 (10.3%) |
Occupancy by Age of Householder in Camden County
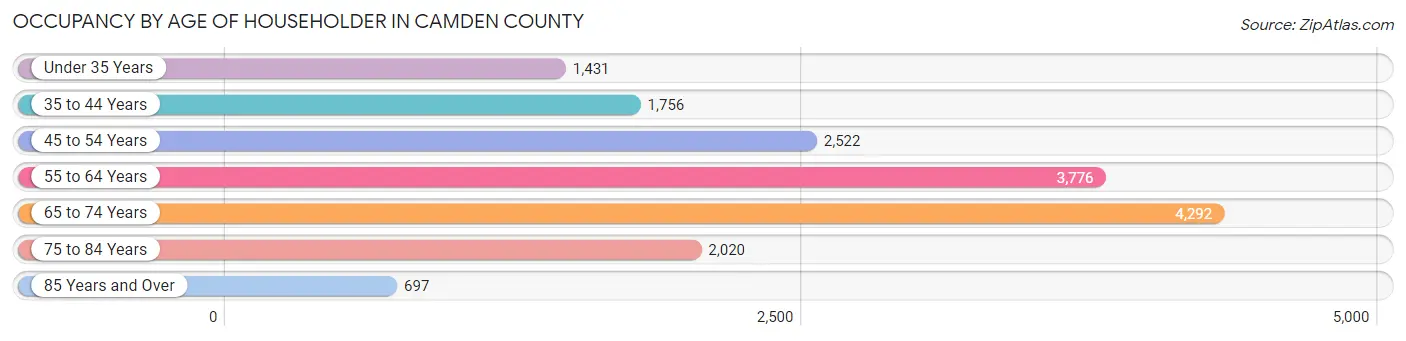
| Age Bracket | # Households | % Households |
| Under 35 Years | 1,431 | 8.7% |
| 35 to 44 Years | 1,756 | 10.6% |
| 45 to 54 Years | 2,522 | 15.3% |
| 55 to 64 Years | 3,776 | 22.9% |
| 65 to 74 Years | 4,292 | 26.0% |
| 75 to 84 Years | 2,020 | 12.2% |
| 85 Years and Over | 697 | 4.2% |
| Total | 16,494 | 100.0% |
Housing Finances in Camden County
Median Income by Occupancy in Camden County
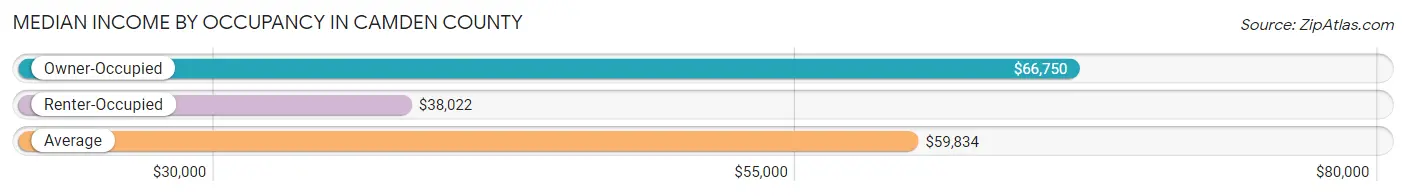
| Occupancy Type | # Households | Median Income |
| Owner-Occupied | 13,508 (81.9%) | $66,750 |
| Renter-Occupied | 2,986 (18.1%) | $38,022 |
| Average | 16,494 (100.0%) | $59,834 |
Occupancy by Householder Income Bracket in Camden County
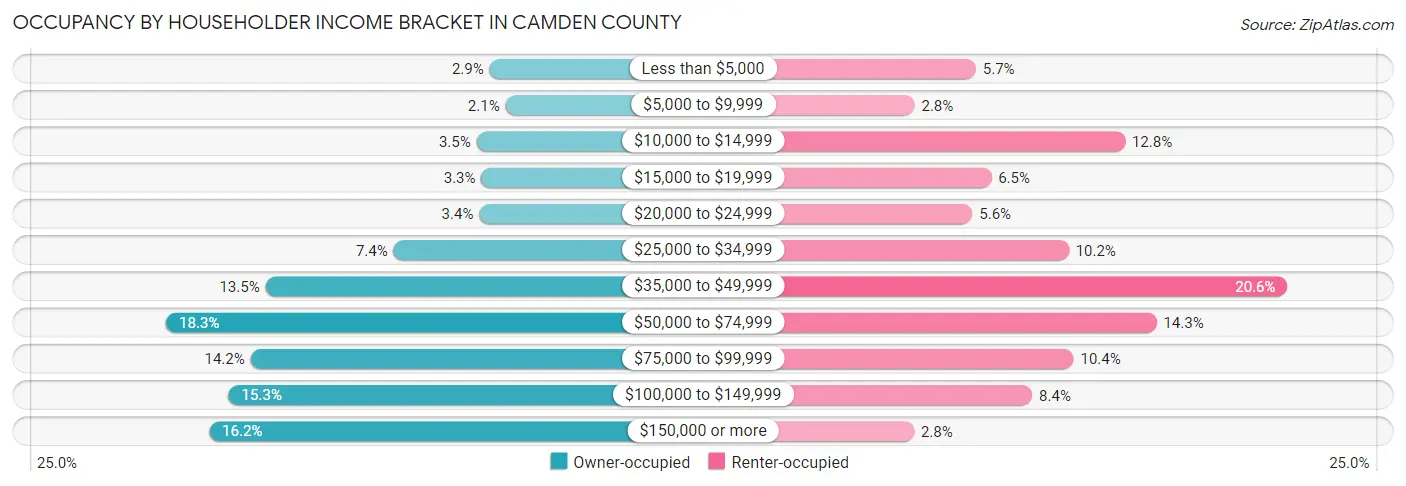
| Income Bracket | Owner-occupied | Renter-occupied |
| Less than $5,000 | 387 (2.9%) | 171 (5.7%) |
| $5,000 to $9,999 | 284 (2.1%) | 84 (2.8%) |
| $10,000 to $14,999 | 470 (3.5%) | 383 (12.8%) |
| $15,000 to $19,999 | 439 (3.3%) | 193 (6.5%) |
| $20,000 to $24,999 | 452 (3.4%) | 166 (5.6%) |
| $25,000 to $34,999 | 1,004 (7.4%) | 303 (10.2%) |
| $35,000 to $49,999 | 1,827 (13.5%) | 614 (20.6%) |
| $50,000 to $74,999 | 2,467 (18.3%) | 428 (14.3%) |
| $75,000 to $99,999 | 1,923 (14.2%) | 310 (10.4%) |
| $100,000 to $149,999 | 2,065 (15.3%) | 251 (8.4%) |
| $150,000 or more | 2,190 (16.2%) | 83 (2.8%) |
| Total | 13,508 (100.0%) | 2,986 (100.0%) |
Monthly Housing Cost Tiers in Camden County
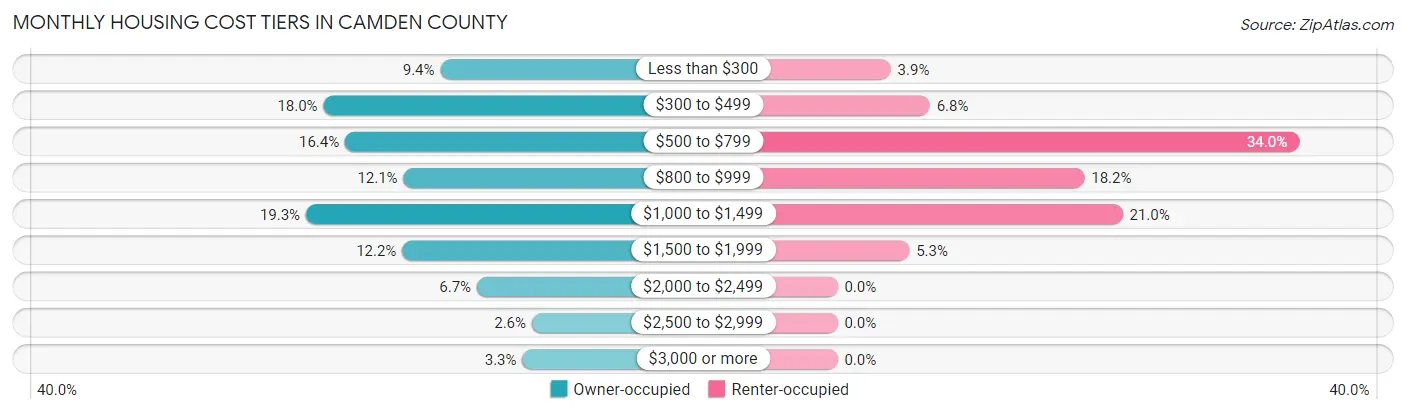
| Monthly Cost | Owner-occupied | Renter-occupied |
| Less than $300 | 1,267 (9.4%) | 117 (3.9%) |
| $300 to $499 | 2,430 (18.0%) | 203 (6.8%) |
| $500 to $799 | 2,215 (16.4%) | 1,015 (34.0%) |
| $800 to $999 | 1,634 (12.1%) | 543 (18.2%) |
| $1,000 to $1,499 | 2,604 (19.3%) | 627 (21.0%) |
| $1,500 to $1,999 | 1,646 (12.2%) | 158 (5.3%) |
| $2,000 to $2,499 | 904 (6.7%) | 0 (0.0%) |
| $2,500 to $2,999 | 357 (2.6%) | 0 (0.0%) |
| $3,000 or more | 451 (3.3%) | 0 (0.0%) |
| Total | 13,508 (100.0%) | 2,986 (100.0%) |
Physical Housing Characteristics in Camden County
Housing Structures in Camden County
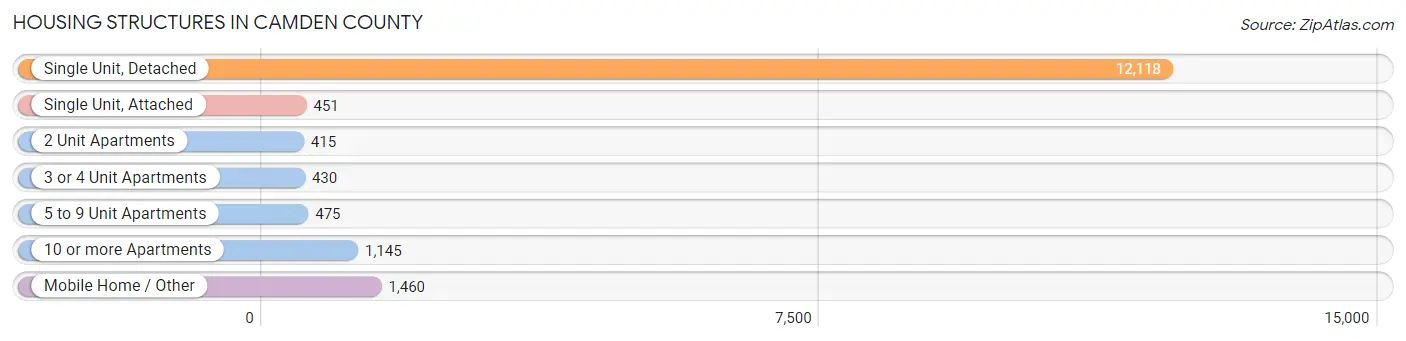
| Structure Type | # Housing Units | % Housing Units |
| Single Unit, Detached | 12,118 | 73.5% |
| Single Unit, Attached | 451 | 2.7% |
| 2 Unit Apartments | 415 | 2.5% |
| 3 or 4 Unit Apartments | 430 | 2.6% |
| 5 to 9 Unit Apartments | 475 | 2.9% |
| 10 or more Apartments | 1,145 | 6.9% |
| Mobile Home / Other | 1,460 | 8.8% |
| Total | 16,494 | 100.0% |
Housing Structures by Occupancy in Camden County
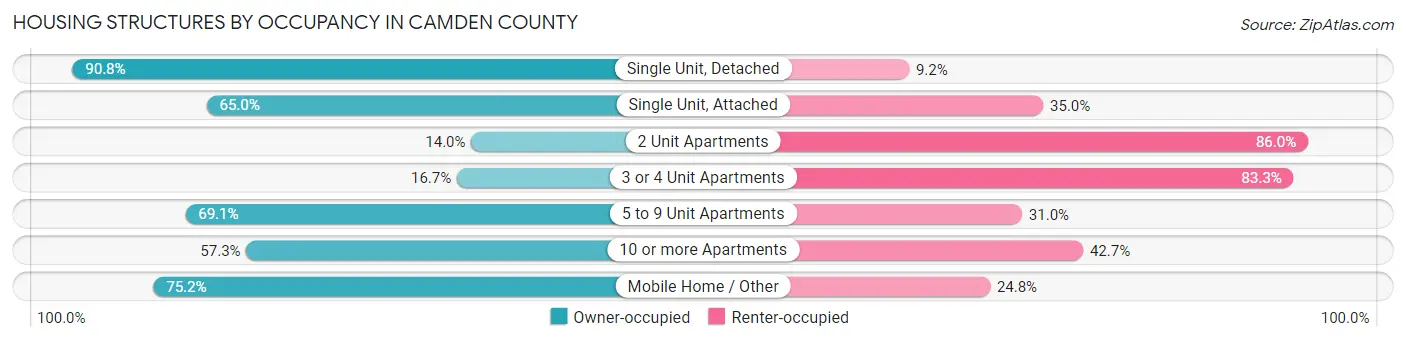
| Structure Type | Owner-occupied | Renter-occupied |
| Single Unit, Detached | 11,003 (90.8%) | 1,115 (9.2%) |
| Single Unit, Attached | 293 (65.0%) | 158 (35.0%) |
| 2 Unit Apartments | 58 (14.0%) | 357 (86.0%) |
| 3 or 4 Unit Apartments | 72 (16.7%) | 358 (83.3%) |
| 5 to 9 Unit Apartments | 328 (69.1%) | 147 (30.9%) |
| 10 or more Apartments | 656 (57.3%) | 489 (42.7%) |
| Mobile Home / Other | 1,098 (75.2%) | 362 (24.8%) |
| Total | 13,508 (81.9%) | 2,986 (18.1%) |
Housing Structures by Number of Rooms in Camden County
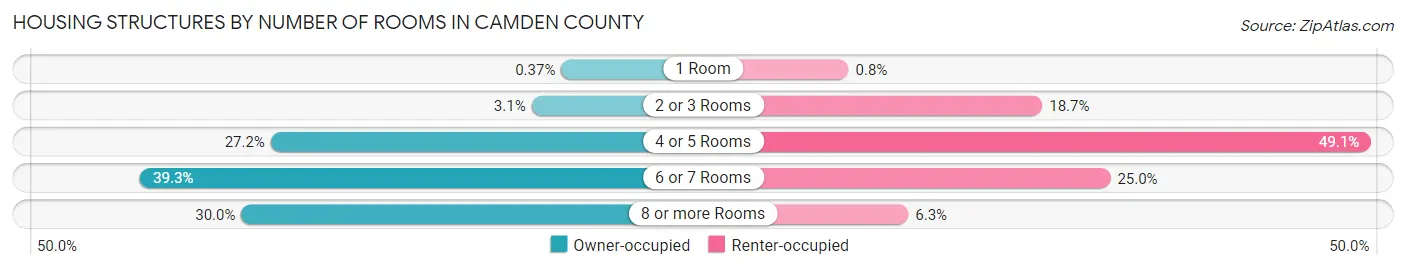
| Number of Rooms | Owner-occupied | Renter-occupied |
| 1 Room | 50 (0.4%) | 24 (0.8%) |
| 2 or 3 Rooms | 421 (3.1%) | 559 (18.7%) |
| 4 or 5 Rooms | 3,680 (27.2%) | 1,467 (49.1%) |
| 6 or 7 Rooms | 5,310 (39.3%) | 747 (25.0%) |
| 8 or more Rooms | 4,047 (30.0%) | 189 (6.3%) |
| Total | 13,508 (100.0%) | 2,986 (100.0%) |
Housing Structure by Heating Type in Camden County
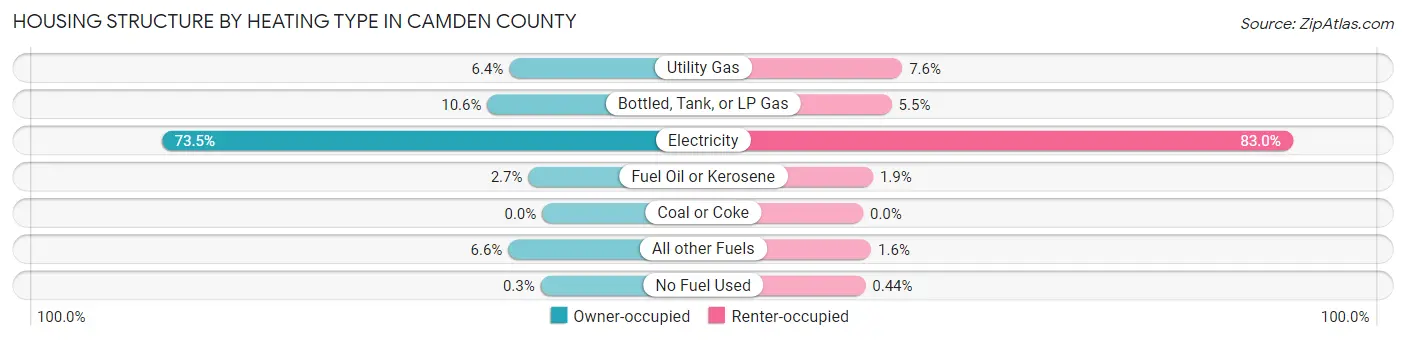
| Heating Type | Owner-occupied | Renter-occupied |
| Utility Gas | 860 (6.4%) | 226 (7.6%) |
| Bottled, Tank, or LP Gas | 1,431 (10.6%) | 165 (5.5%) |
| Electricity | 9,931 (73.5%) | 2,478 (83.0%) |
| Fuel Oil or Kerosene | 360 (2.7%) | 57 (1.9%) |
| Coal or Coke | 0 (0.0%) | 0 (0.0%) |
| All other Fuels | 886 (6.6%) | 47 (1.6%) |
| No Fuel Used | 40 (0.3%) | 13 (0.4%) |
| Total | 13,508 (100.0%) | 2,986 (100.0%) |
Household Vehicle Usage in Camden County
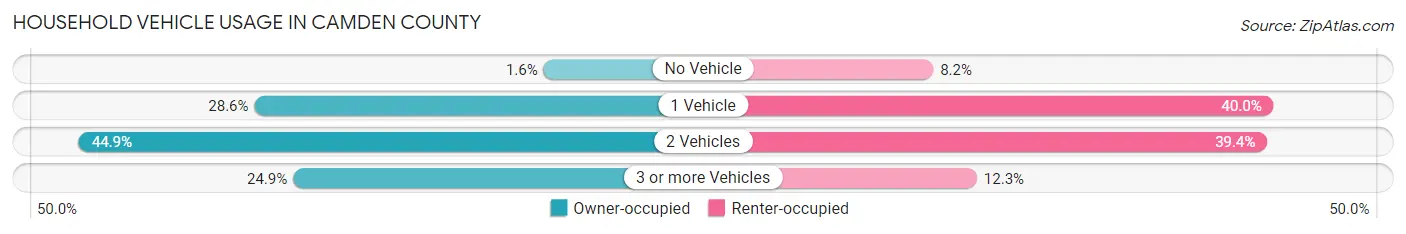
| Vehicles per Household | Owner-occupied | Renter-occupied |
| No Vehicle | 211 (1.6%) | 246 (8.2%) |
| 1 Vehicle | 3,857 (28.5%) | 1,195 (40.0%) |
| 2 Vehicles | 6,071 (44.9%) | 1,177 (39.4%) |
| 3 or more Vehicles | 3,369 (24.9%) | 368 (12.3%) |
| Total | 13,508 (100.0%) | 2,986 (100.0%) |
Real Estate & Mortgages in Camden County
Real Estate and Mortgage Overview in Camden County
| Characteristic | Without Mortgage | With Mortgage |
| Housing Units | 5,967 | 7,541 |
| Median Property Value | $247,200 | $250,000 |
| Median Household Income | $53,714 | $1,455 |
| Monthly Housing Costs | $451 | $431 |
| Real Estate Taxes | $1,368 | $51 |
Property Value by Mortgage Status in Camden County
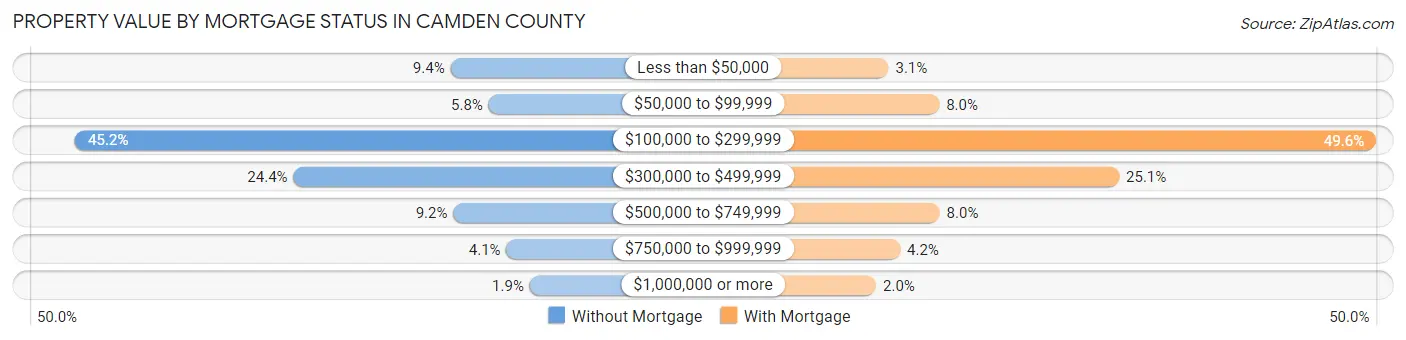
| Property Value | Without Mortgage | With Mortgage |
| Less than $50,000 | 563 (9.4%) | 237 (3.1%) |
| $50,000 to $99,999 | 346 (5.8%) | 601 (8.0%) |
| $100,000 to $299,999 | 2,697 (45.2%) | 3,738 (49.6%) |
| $300,000 to $499,999 | 1,456 (24.4%) | 1,893 (25.1%) |
| $500,000 to $749,999 | 547 (9.2%) | 604 (8.0%) |
| $750,000 to $999,999 | 245 (4.1%) | 320 (4.2%) |
| $1,000,000 or more | 113 (1.9%) | 148 (2.0%) |
| Total | 5,967 (100.0%) | 7,541 (100.0%) |
Household Income by Mortgage Status in Camden County
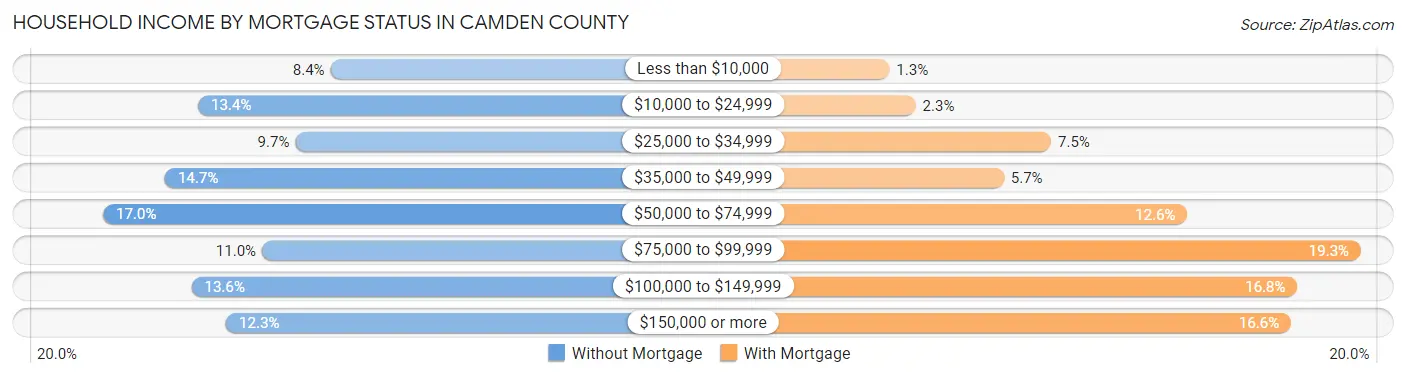
| Household Income | Without Mortgage | With Mortgage |
| Less than $10,000 | 498 (8.4%) | 97 (1.3%) |
| $10,000 to $24,999 | 799 (13.4%) | 173 (2.3%) |
| $25,000 to $34,999 | 578 (9.7%) | 562 (7.4%) |
| $35,000 to $49,999 | 874 (14.6%) | 426 (5.7%) |
| $50,000 to $74,999 | 1,015 (17.0%) | 953 (12.6%) |
| $75,000 to $99,999 | 654 (11.0%) | 1,452 (19.3%) |
| $100,000 to $149,999 | 814 (13.6%) | 1,269 (16.8%) |
| $150,000 or more | 735 (12.3%) | 1,251 (16.6%) |
| Total | 5,967 (100.0%) | 7,541 (100.0%) |
Property Value to Household Income Ratio in Camden County
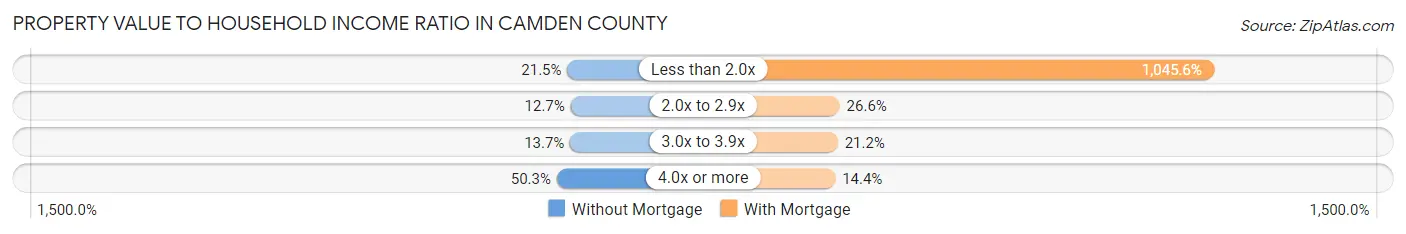
| Value-to-Income Ratio | Without Mortgage | With Mortgage |
| Less than 2.0x | 1,282 (21.5%) | 78,847 (1,045.6%) |
| 2.0x to 2.9x | 755 (12.7%) | 2,004 (26.6%) |
| 3.0x to 3.9x | 816 (13.7%) | 1,598 (21.2%) |
| 4.0x or more | 2,999 (50.3%) | 1,084 (14.4%) |
| Total | 5,967 (100.0%) | 7,541 (100.0%) |
Real Estate Taxes by Mortgage Status in Camden County
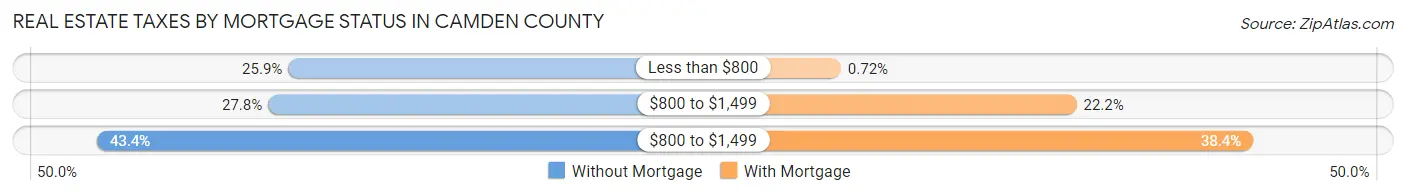
| Property Taxes | Without Mortgage | With Mortgage |
| Less than $800 | 1,547 (25.9%) | 54 (0.7%) |
| $800 to $1,499 | 1,657 (27.8%) | 1,677 (22.2%) |
| $800 to $1,499 | 2,589 (43.4%) | 2,892 (38.4%) |
| Total | 5,967 (100.0%) | 7,541 (100.0%) |
Health & Disability in Camden County
Health Insurance Coverage by Age in Camden County
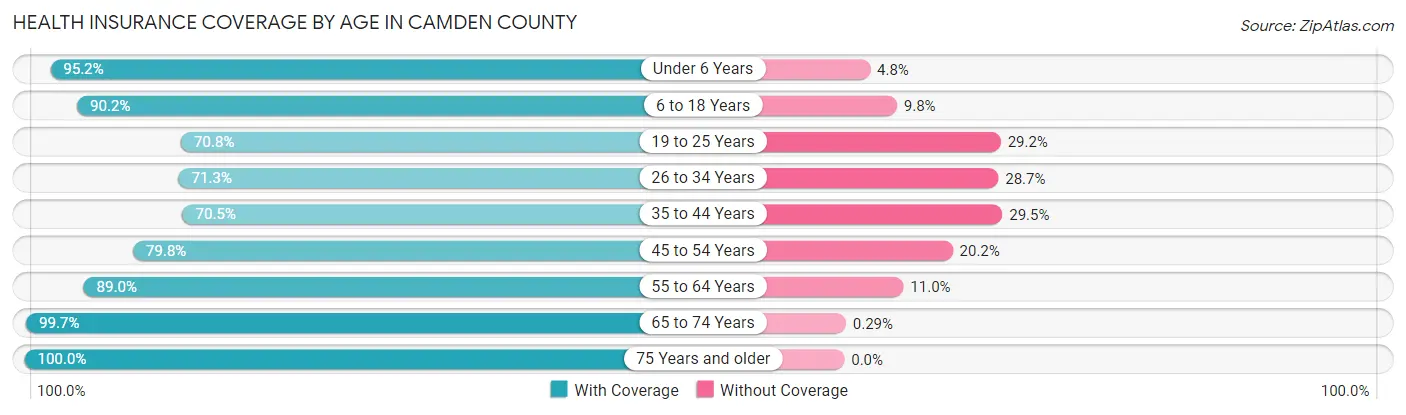
| Age Bracket | With Coverage | Without Coverage |
| Under 6 Years | 2,313 (95.2%) | 117 (4.8%) |
| 6 to 18 Years | 4,802 (90.2%) | 522 (9.8%) |
| 19 to 25 Years | 1,799 (70.8%) | 741 (29.2%) |
| 26 to 34 Years | 2,492 (71.3%) | 1,004 (28.7%) |
| 35 to 44 Years | 2,862 (70.5%) | 1,196 (29.5%) |
| 45 to 54 Years | 3,883 (79.8%) | 983 (20.2%) |
| 55 to 64 Years | 6,973 (89.0%) | 864 (11.0%) |
| 65 to 74 Years | 7,584 (99.7%) | 22 (0.3%) |
| 75 Years and older | 4,620 (100.0%) | 0 (0.0%) |
| Total | 37,328 (87.3%) | 5,449 (12.7%) |
Health Insurance Coverage by Citizenship Status in Camden County
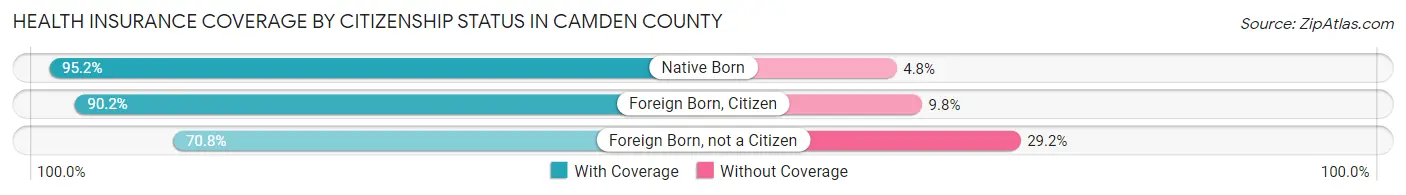
| Citizenship Status | With Coverage | Without Coverage |
| Native Born | 2,313 (95.2%) | 117 (4.8%) |
| Foreign Born, Citizen | 4,802 (90.2%) | 522 (9.8%) |
| Foreign Born, not a Citizen | 1,799 (70.8%) | 741 (29.2%) |
Health Insurance Coverage by Household Income in Camden County
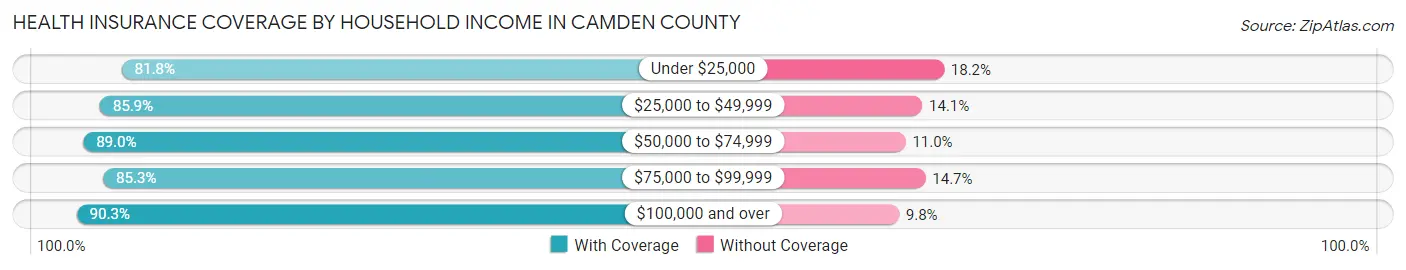
| Household Income | With Coverage | Without Coverage |
| Under $25,000 | 4,405 (81.8%) | 979 (18.2%) |
| $25,000 to $49,999 | 7,503 (85.9%) | 1,233 (14.1%) |
| $50,000 to $74,999 | 6,376 (89.0%) | 787 (11.0%) |
| $75,000 to $99,999 | 6,153 (85.3%) | 1,062 (14.7%) |
| $100,000 and over | 12,836 (90.2%) | 1,387 (9.8%) |
Public vs Private Health Insurance Coverage by Age in Camden County
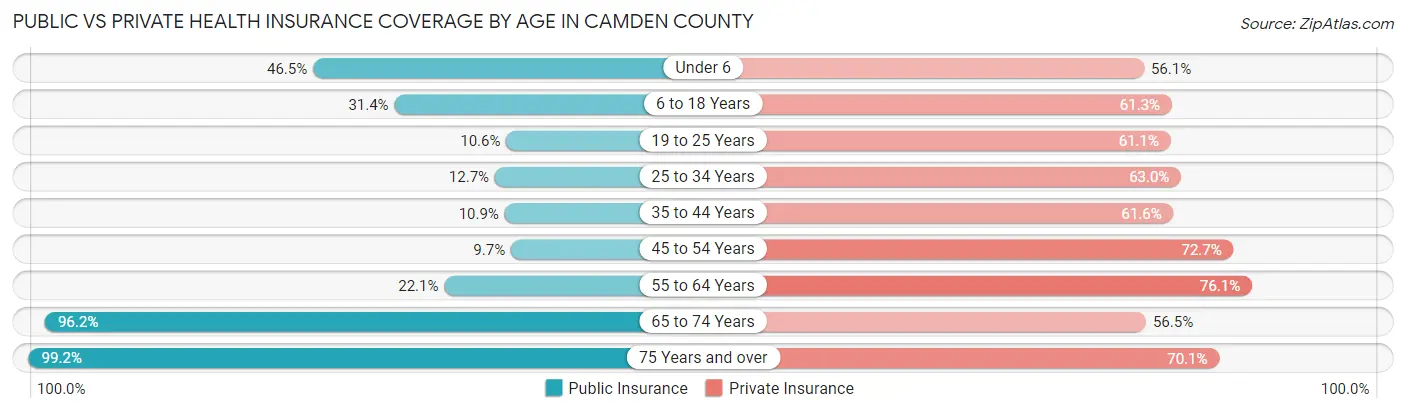
| Age Bracket | Public Insurance | Private Insurance |
| Under 6 | 1,129 (46.5%) | 1,363 (56.1%) |
| 6 to 18 Years | 1,669 (31.4%) | 3,262 (61.3%) |
| 19 to 25 Years | 269 (10.6%) | 1,551 (61.1%) |
| 25 to 34 Years | 444 (12.7%) | 2,202 (63.0%) |
| 35 to 44 Years | 442 (10.9%) | 2,499 (61.6%) |
| 45 to 54 Years | 473 (9.7%) | 3,538 (72.7%) |
| 55 to 64 Years | 1,732 (22.1%) | 5,967 (76.1%) |
| 65 to 74 Years | 7,318 (96.2%) | 4,294 (56.5%) |
| 75 Years and over | 4,585 (99.2%) | 3,237 (70.1%) |
| Total | 18,061 (42.2%) | 27,913 (65.2%) |
Disability Status by Sex by Age in Camden County
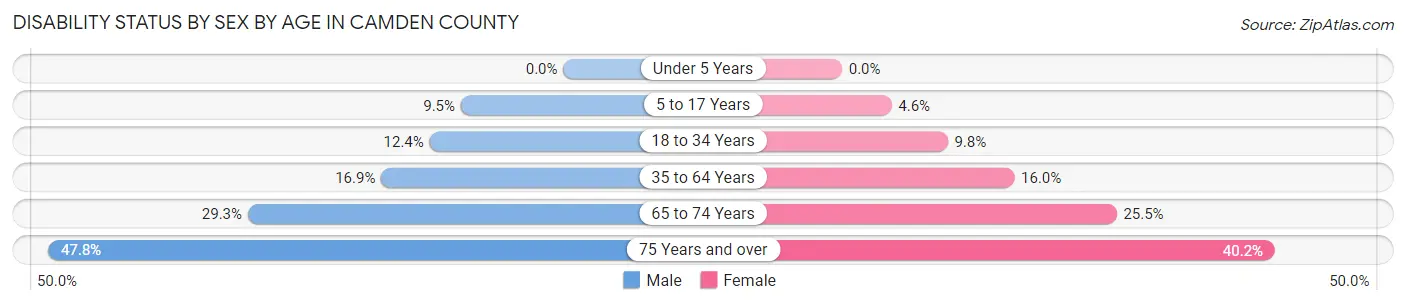
| Age Bracket | Male | Female |
| Under 5 Years | 0 (0.0%) | 0 (0.0%) |
| 5 to 17 Years | 259 (9.5%) | 128 (4.6%) |
| 18 to 34 Years | 419 (12.4%) | 301 (9.8%) |
| 35 to 64 Years | 1,355 (16.9%) | 1,398 (16.0%) |
| 65 to 74 Years | 1,122 (29.3%) | 962 (25.5%) |
| 75 Years and over | 1,079 (47.8%) | 950 (40.2%) |
Disability Class by Sex by Age in Camden County
Disability Class: Hearing Difficulty
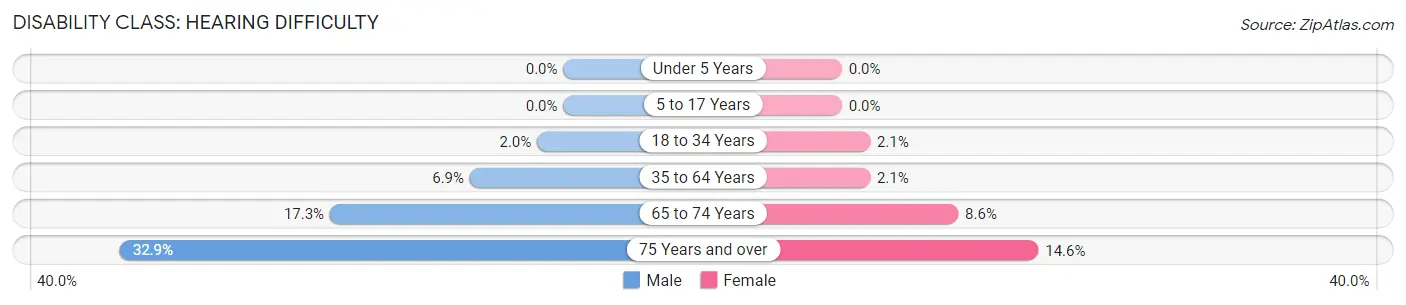
| Age Bracket | Male | Female |
| Under 5 Years | 0 (0.0%) | 0 (0.0%) |
| 5 to 17 Years | 0 (0.0%) | 0 (0.0%) |
| 18 to 34 Years | 66 (1.9%) | 64 (2.1%) |
| 35 to 64 Years | 556 (6.9%) | 183 (2.1%) |
| 65 to 74 Years | 664 (17.3%) | 326 (8.6%) |
| 75 Years and over | 743 (32.9%) | 345 (14.6%) |
Disability Class: Vision Difficulty
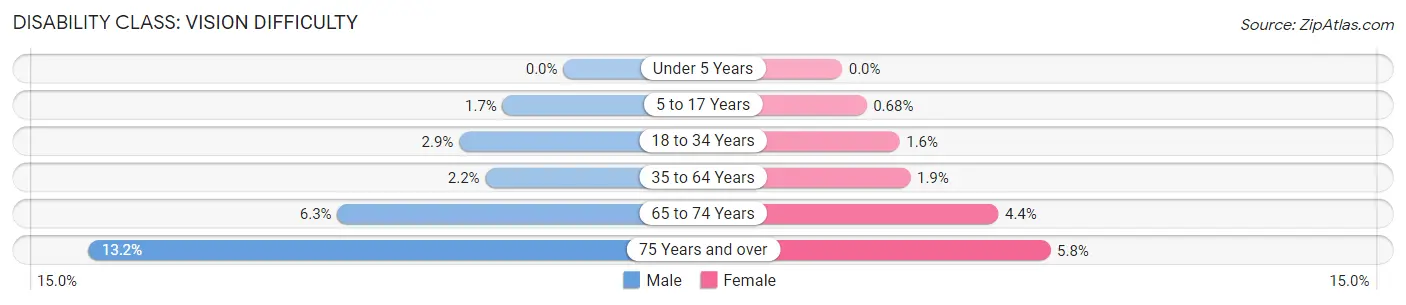
| Age Bracket | Male | Female |
| Under 5 Years | 0 (0.0%) | 0 (0.0%) |
| 5 to 17 Years | 46 (1.7%) | 19 (0.7%) |
| 18 to 34 Years | 98 (2.9%) | 49 (1.6%) |
| 35 to 64 Years | 174 (2.2%) | 166 (1.9%) |
| 65 to 74 Years | 241 (6.3%) | 164 (4.3%) |
| 75 Years and over | 298 (13.2%) | 137 (5.8%) |
Disability Class: Cognitive Difficulty
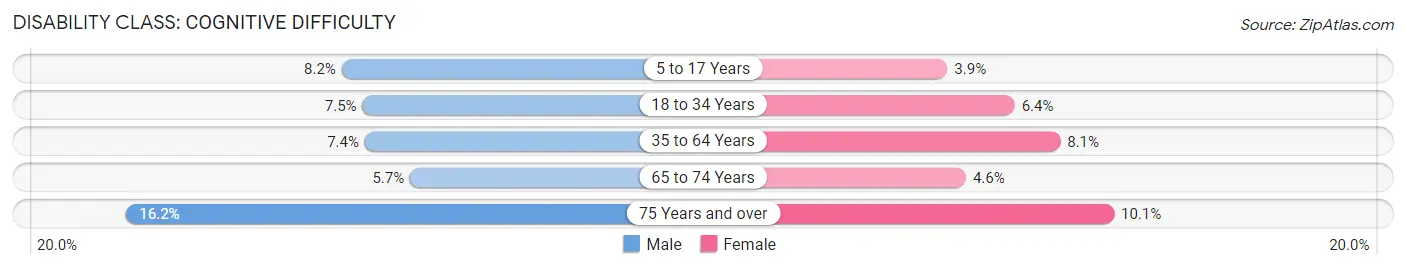
| Age Bracket | Male | Female |
| 5 to 17 Years | 224 (8.2%) | 109 (3.9%) |
| 18 to 34 Years | 252 (7.5%) | 197 (6.4%) |
| 35 to 64 Years | 591 (7.4%) | 709 (8.1%) |
| 65 to 74 Years | 218 (5.7%) | 174 (4.6%) |
| 75 Years and over | 366 (16.2%) | 239 (10.1%) |
Disability Class: Ambulatory Difficulty
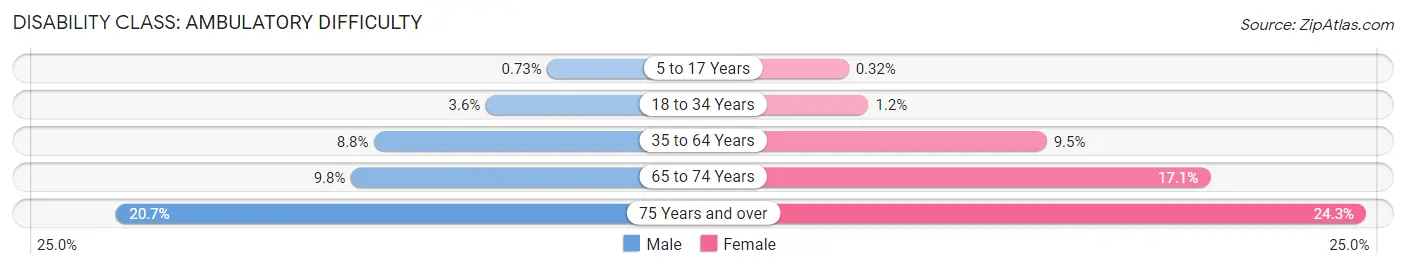
| Age Bracket | Male | Female |
| 5 to 17 Years | 20 (0.7%) | 9 (0.3%) |
| 18 to 34 Years | 121 (3.6%) | 38 (1.2%) |
| 35 to 64 Years | 703 (8.8%) | 832 (9.5%) |
| 65 to 74 Years | 377 (9.8%) | 645 (17.1%) |
| 75 Years and over | 468 (20.7%) | 575 (24.3%) |
Disability Class: Self-Care Difficulty
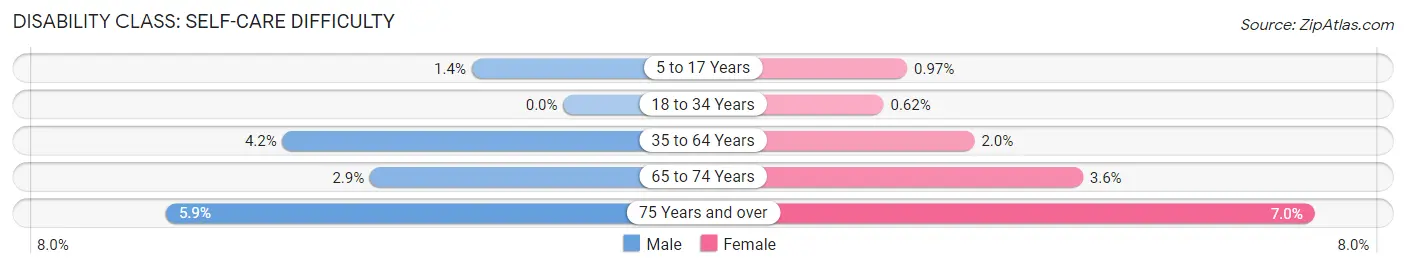
| Age Bracket | Male | Female |
| 5 to 17 Years | 37 (1.4%) | 27 (1.0%) |
| 18 to 34 Years | 0 (0.0%) | 19 (0.6%) |
| 35 to 64 Years | 334 (4.2%) | 172 (2.0%) |
| 65 to 74 Years | 110 (2.9%) | 135 (3.6%) |
| 75 Years and over | 133 (5.9%) | 166 (7.0%) |
Technology Access in Camden County
Computing Device Access in Camden County
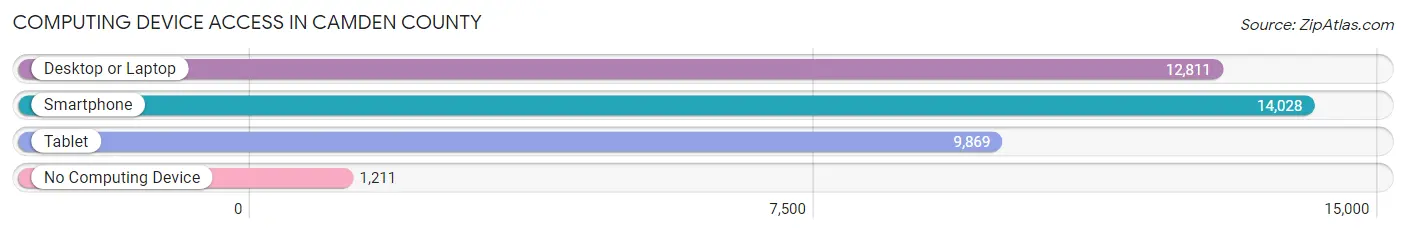
| Device Type | # Households | % Households |
| Desktop or Laptop | 12,811 | 77.7% |
| Smartphone | 14,028 | 85.1% |
| Tablet | 9,869 | 59.8% |
| No Computing Device | 1,211 | 7.3% |
| Total | 16,494 | 100.0% |
Internet Access in Camden County
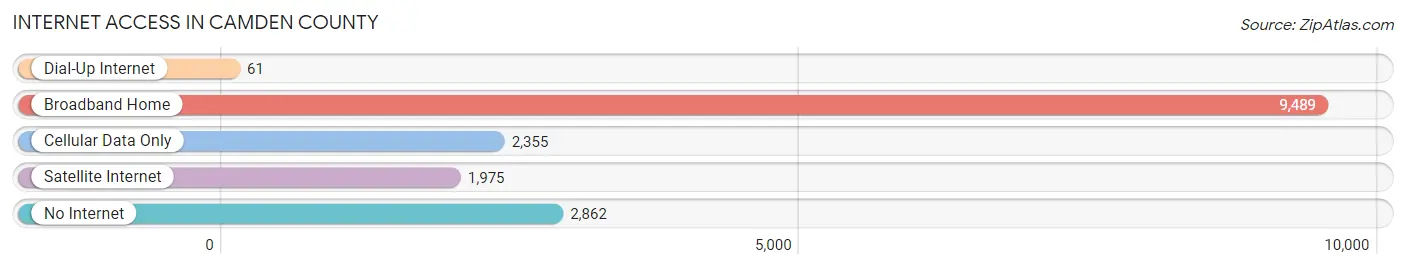
| Internet Type | # Households | % Households |
| Dial-Up Internet | 61 | 0.4% |
| Broadband Home | 9,489 | 57.5% |
| Cellular Data Only | 2,355 | 14.3% |
| Satellite Internet | 1,975 | 12.0% |
| No Internet | 2,862 | 17.3% |
| Total | 16,494 | 100.0% |
Camden County Summary
Camden County is located in the central part of Missouri, in the Ozark region of the state. It is bordered by Miller, Morgan, Laclede, Dallas, Hickory, and Pulaski counties. The county seat is Camdenton, and the largest city is Osage Beach. The county was established in 1841 and named after Charles Pratt, 1st Earl Camden, a British statesman.
Geography
Camden County is located in the Ozark region of Missouri, and is part of the Ozark Plateau. The county is mostly hilly and forested, with some areas of flat land. The highest point in the county is at the summit of the Niangua Arm of the Lake of the Ozarks, at an elevation of 1,068 feet. The county has a total area of 576 square miles, of which 545 square miles is land and 31 square miles is water.
The county is home to the Lake of the Ozarks, a large man-made lake created by the construction of the Bagnell Dam in 1931. The lake is a popular destination for fishing, boating, and other recreational activities.
Economy
The economy of Camden County is largely based on tourism and recreation. The Lake of the Ozarks is a major tourist destination, and the county is home to several resorts, marinas, and other recreational businesses. The county is also home to several manufacturing companies, including a steel mill and a paper mill.
Agriculture is also an important part of the economy, with the county producing corn, soybeans, hay, and other crops. Livestock production is also important, with the county producing beef cattle, dairy cattle, and hogs.
Demographics
As of the 2010 census, the population of Camden County was 44,002. The population density was 79.3 people per square mile. The racial makeup of the county was 95.3% White, 0.7% African American, 0.5% Native American, 0.5% Asian, 0.1% Pacific Islander, 1.3% from other races, and 1.6% from two or more races. Hispanic or Latino of any race were 3.2% of the population.
The median income for a household in the county was $41,945, and the median income for a family was $50,945. The per capita income for the county was $23,945. About 11.3% of families and 14.7% of the population were below the poverty line, including 19.2% of those under age 18 and 8.2% of those age 65 or over.
The largest city in the county is Osage Beach, with a population of 4,351. Other cities in the county include Camdenton, Sunrise Beach, and Lake Ozark.
Common Questions
What is the Total Population of Camden County?
Total Population of Camden County is 43,227.
What is the Total Male Population of Camden County?
Total Male Population of Camden County is 21,504.
What is the Total Female Population of Camden County?
Total Female Population of Camden County is 21,723.
What is the Ratio of Males per 100 Females in Camden County?
There are 98.99 Males per 100 Females in Camden County.
What is the Ratio of Females per 100 Males in Camden County?
There are 101.02 Females per 100 Males in Camden County.
What is the Median Population Age in Camden County?
Median Population Age in Camden County is 52.6 Years.
What is the Average Family Size in Camden County
Average Family Size in Camden County is 3.1 People.
What is the Average Household Size in Camden County
Average Household Size in Camden County is 2.6 People.
What is Per Capita Income in Camden County?
Per Capita income in Camden County is $35,927.
What is the Median Family Income in Camden County?
Median Family Income in Camden County is $76,903.
What is the Median Household income in Camden County?
Median Household Income in Camden County is $59,834.
What is Income or Wage Gap in Camden County?
Income or Wage Gap in Camden County is 20.5%.
Women in Camden County earn 79.5 cents for every dollar earned by a man.
What is Family Income Deficit in Camden County?
Family Income Deficit in Camden County is $11,100.
Families that are below poverty line in Camden County earn $11,100 less on average than the poverty threshold level.
What is Inequality or Gini Index in Camden County?
Inequality or Gini Index in Camden County is 0.47.
How Large is the Labor Force in Camden County?
There are 19,045 People in the Labor Forcein in Camden County.
What is the Percentage of People in the Labor Force in Camden County?
51.9% of People are in the Labor Force in Camden County.
What is the Unemployment Rate in Camden County?
Unemployment Rate in Camden County is 5.2%.