Woodworth, LA
Woodworth Map
Woodworth Overview
2,406
TOTAL POPULATION
1,073
MALE POPULATION
1,333
FEMALE POPULATION
80.50
MALES / 100 FEMALES
124.23
FEMALES / 100 MALES
29.3
MEDIAN AGE
3.6
AVG FAMILY SIZE
3.0
AVG HOUSEHOLD SIZE
$37,606
PER CAPITA INCOME
$126,090
AVG FAMILY INCOME
$103,667
AVG HOUSEHOLD INCOME
13.3%
WAGE / INCOME GAP [ % ]
86.7¢/ $1
WAGE / INCOME GAP [ $ ]
$6,178
FAMILY INCOME DEFICIT
0.44
INEQUALITY / GINI INDEX
1,172
LABOR FORCE [ PEOPLE ]
66.0%
PERCENT IN LABOR FORCE
3.6%
UNEMPLOYMENT RATE
Woodworth Zip Codes
Woodworth Area Codes
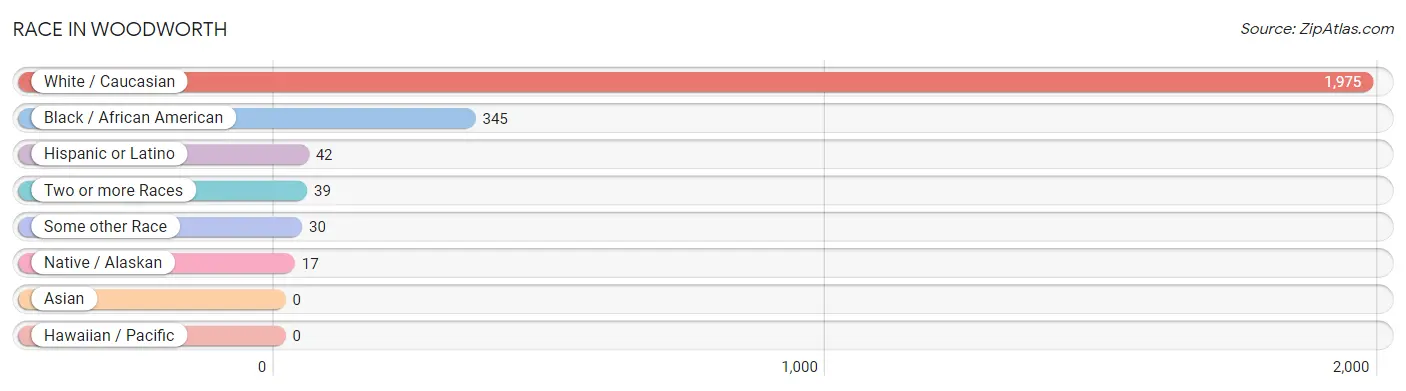
Race in Woodworth
The most populous races in Woodworth are White / Caucasian (1,975 | 82.1%), Black / African American (345 | 14.3%), and Hispanic or Latino (42 | 1.8%).
| Race | # Population | % Population |
| Asian | 0 | 0.0% |
| Black / African American | 345 | 14.3% |
| Hawaiian / Pacific | 0 | 0.0% |
| Hispanic or Latino | 42 | 1.8% |
| Native / Alaskan | 17 | 0.7% |
| White / Caucasian | 1,975 | 82.1% |
| Two or more Races | 39 | 1.6% |
| Some other Race | 30 | 1.3% |
| Total | 2,406 | 100.0% |
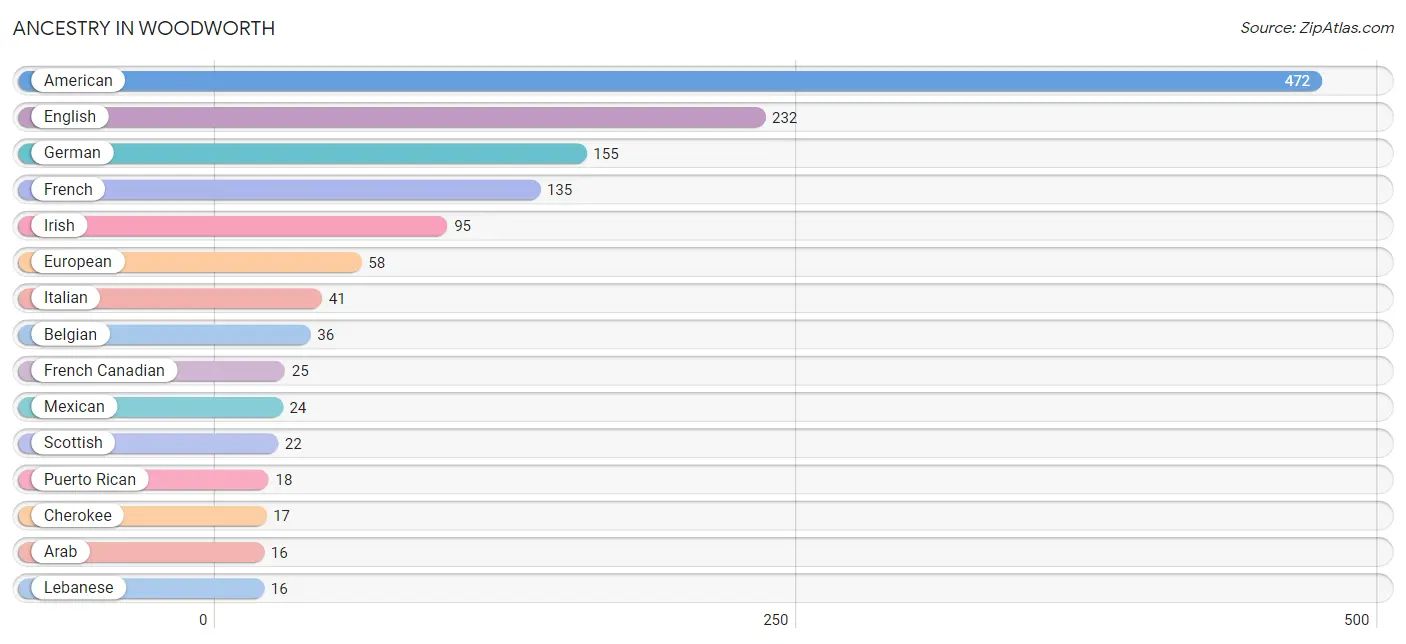
Ancestry in Woodworth
The most populous ancestries reported in Woodworth are American (472 | 19.6%), English (232 | 9.6%), German (155 | 6.4%), French (135 | 5.6%), and Irish (95 | 4.0%), together accounting for 45.3% of all Woodworth residents.
| Ancestry | # Population | % Population |
| African | 7 | 0.3% |
| American | 472 | 19.6% |
| Apache | 6 | 0.3% |
| Arab | 16 | 0.7% |
| Belgian | 36 | 1.5% |
| British | 12 | 0.5% |
| Cajun | 5 | 0.2% |
| Cherokee | 17 | 0.7% |
| Choctaw | 3 | 0.1% |
| Czechoslovakian | 12 | 0.5% |
| Danish | 6 | 0.3% |
| English | 232 | 9.6% |
| European | 58 | 2.4% |
| French | 135 | 5.6% |
| French Canadian | 25 | 1.0% |
| German | 155 | 6.4% |
| Irish | 95 | 4.0% |
| Italian | 41 | 1.7% |
| Lebanese | 16 | 0.7% |
| Mexican | 24 | 1.0% |
| Polish | 3 | 0.1% |
| Portuguese | 9 | 0.4% |
| Puerto Rican | 18 | 0.7% |
| Scandinavian | 6 | 0.3% |
| Scotch-Irish | 16 | 0.7% |
| Scottish | 22 | 0.9% |
| Subsaharan African | 7 | 0.3% |
| Welsh | 13 | 0.5% | View All 28 Rows |
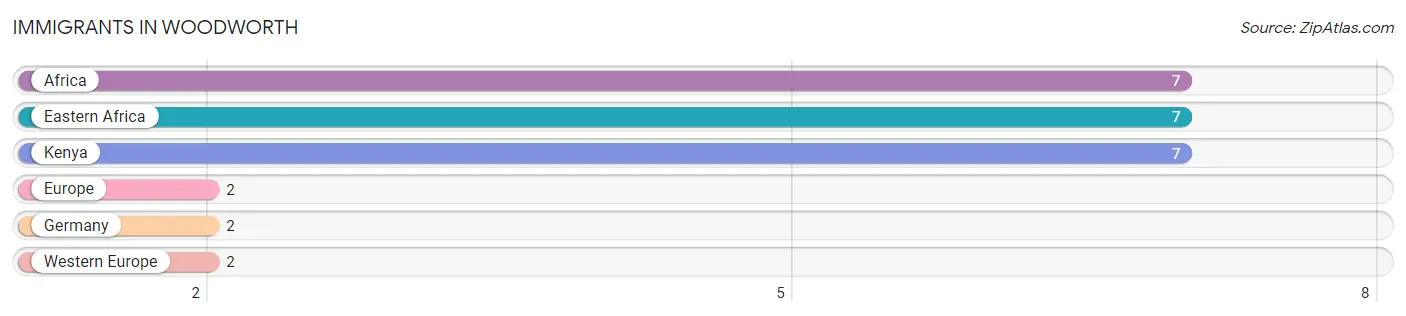
Immigrants in Woodworth
The most numerous immigrant groups reported in Woodworth came from Africa (7 | 0.3%), Eastern Africa (7 | 0.3%), Kenya (7 | 0.3%), Europe (2 | 0.1%), and Germany (2 | 0.1%), together accounting for 1.0% of all Woodworth residents.
| Immigration Origin | # Population | % Population |
| Africa | 7 | 0.3% |
| Eastern Africa | 7 | 0.3% |
| Europe | 2 | 0.1% |
| Germany | 2 | 0.1% |
| Kenya | 7 | 0.3% |
| Western Europe | 2 | 0.1% | View All 6 Rows |
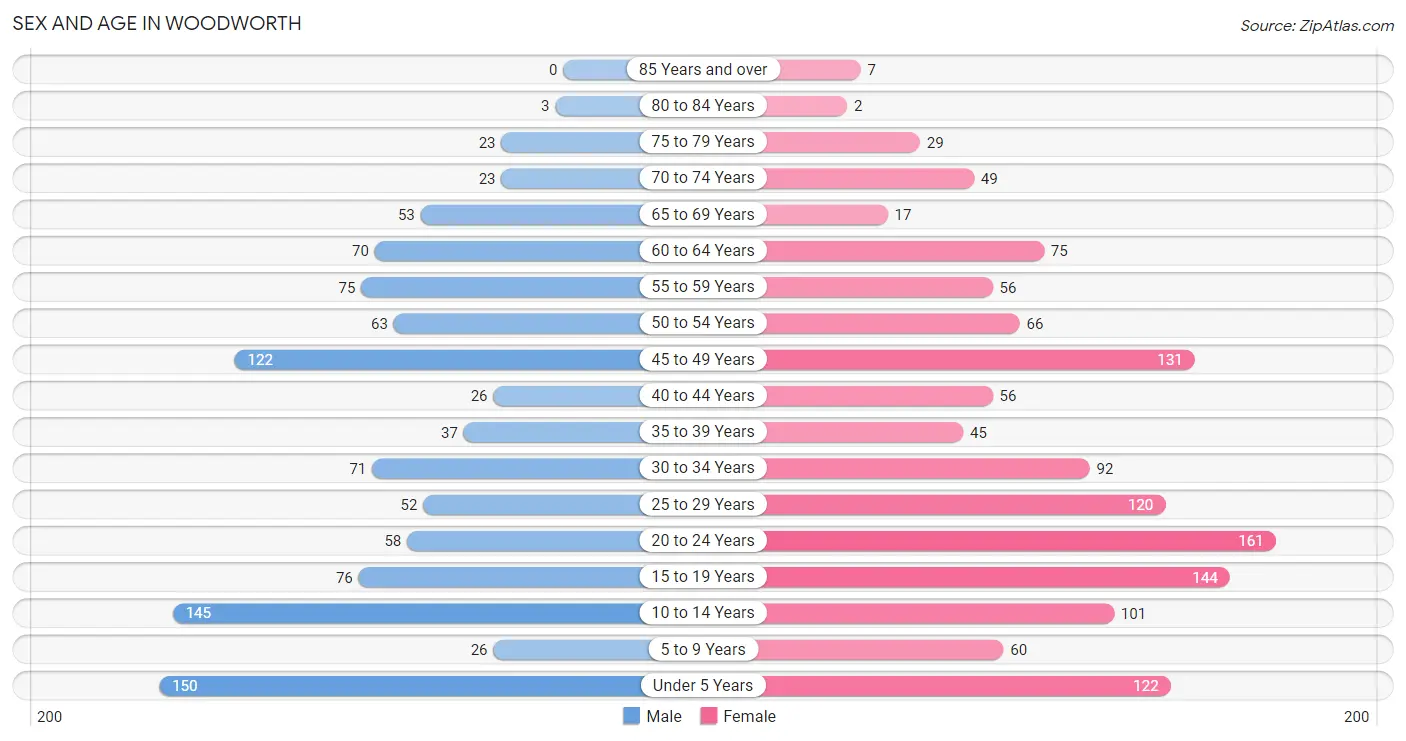
Sex and Age in Woodworth
Sex and Age in Woodworth
The most populous age groups in Woodworth are Under 5 Years (150 | 14.0%) for men and 20 to 24 Years (161 | 12.1%) for women.
| Age Bracket | Male | Female |
| Under 5 Years | 150 (14.0%) | 122 (9.1%) |
| 5 to 9 Years | 26 (2.4%) | 60 (4.5%) |
| 10 to 14 Years | 145 (13.5%) | 101 (7.6%) |
| 15 to 19 Years | 76 (7.1%) | 144 (10.8%) |
| 20 to 24 Years | 58 (5.4%) | 161 (12.1%) |
| 25 to 29 Years | 52 (4.9%) | 120 (9.0%) |
| 30 to 34 Years | 71 (6.6%) | 92 (6.9%) |
| 35 to 39 Years | 37 (3.5%) | 45 (3.4%) |
| 40 to 44 Years | 26 (2.4%) | 56 (4.2%) |
| 45 to 49 Years | 122 (11.4%) | 131 (9.8%) |
| 50 to 54 Years | 63 (5.9%) | 66 (5.0%) |
| 55 to 59 Years | 75 (7.0%) | 56 (4.2%) |
| 60 to 64 Years | 70 (6.5%) | 75 (5.6%) |
| 65 to 69 Years | 53 (4.9%) | 17 (1.3%) |
| 70 to 74 Years | 23 (2.1%) | 49 (3.7%) |
| 75 to 79 Years | 23 (2.1%) | 29 (2.2%) |
| 80 to 84 Years | 3 (0.3%) | 2 (0.2%) |
| 85 Years and over | 0 (0.0%) | 7 (0.5%) |
| Total | 1,073 (100.0%) | 1,333 (100.0%) |
Families and Households in Woodworth
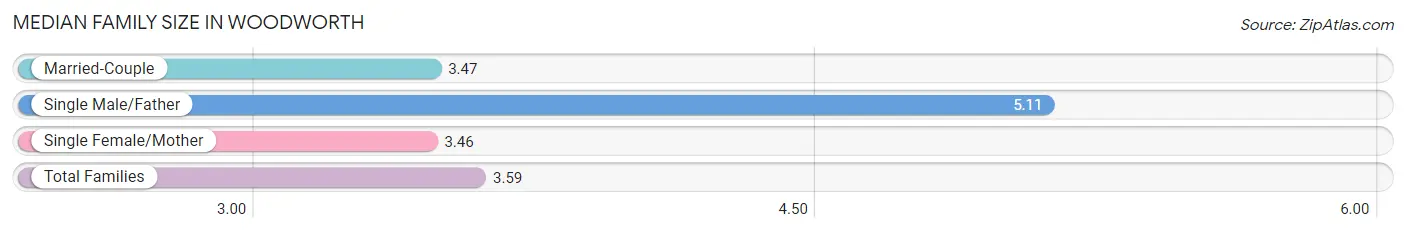
Median Family Size in Woodworth
The median family size in Woodworth is 3.59 persons per family, with single male/father families (45 | 7.6%) accounting for the largest median family size of 5.11 persons per family. On the other hand, single female/mother families (84 | 14.1%) represent the smallest median family size with 3.46 persons per family.
| Family Type | # Families | Family Size |
| Married-Couple | 465 (78.3%) | 3.47 |
| Single Male/Father | 45 (7.6%) | 5.11 |
| Single Female/Mother | 84 (14.1%) | 3.46 |
| Total Families | 594 (100.0%) | 3.59 |
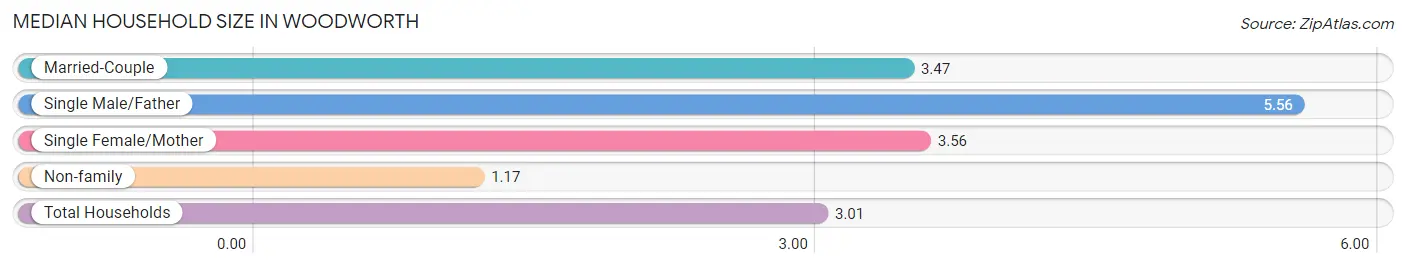
Median Household Size in Woodworth
The median household size in Woodworth is 3.01 persons per household, with single male/father households (45 | 5.7%) accounting for the largest median household size of 5.56 persons per household. non-family households (202 | 25.4%) represent the smallest median household size with 1.17 persons per household.
| Household Type | # Households | Household Size |
| Married-Couple | 465 (58.4%) | 3.47 |
| Single Male/Father | 45 (5.7%) | 5.56 |
| Single Female/Mother | 84 (10.5%) | 3.56 |
| Non-family | 202 (25.4%) | 1.17 |
| Total Households | 796 (100.0%) | 3.01 |
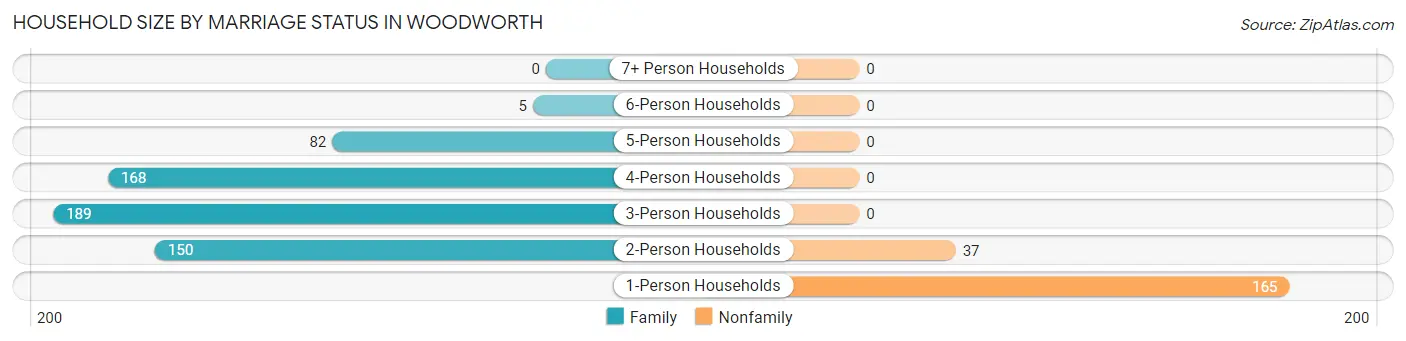
Household Size by Marriage Status in Woodworth
Out of a total of 796 households in Woodworth, 594 (74.6%) are family households, while 202 (25.4%) are nonfamily households. The most numerous type of family households are 3-person households, comprising 189, and the most common type of nonfamily households are 1-person households, comprising 165.
| Household Size | Family Households | Nonfamily Households |
| 1-Person Households | - | 165 (20.7%) |
| 2-Person Households | 150 (18.8%) | 37 (4.6%) |
| 3-Person Households | 189 (23.7%) | 0 (0.0%) |
| 4-Person Households | 168 (21.1%) | 0 (0.0%) |
| 5-Person Households | 82 (10.3%) | 0 (0.0%) |
| 6-Person Households | 5 (0.6%) | 0 (0.0%) |
| 7+ Person Households | 0 (0.0%) | 0 (0.0%) |
| Total | 594 (74.6%) | 202 (25.4%) |
Female Fertility in Woodworth
Fertility by Age in Woodworth
Average fertility rate in Woodworth is 56.0 births per 1,000 women. Women in the age bracket of 20 to 34 years have the highest fertility rate with 113.0 births per 1,000 women. Women in the age bracket of 20 to 34 years acount for 100.0% of all women with births.
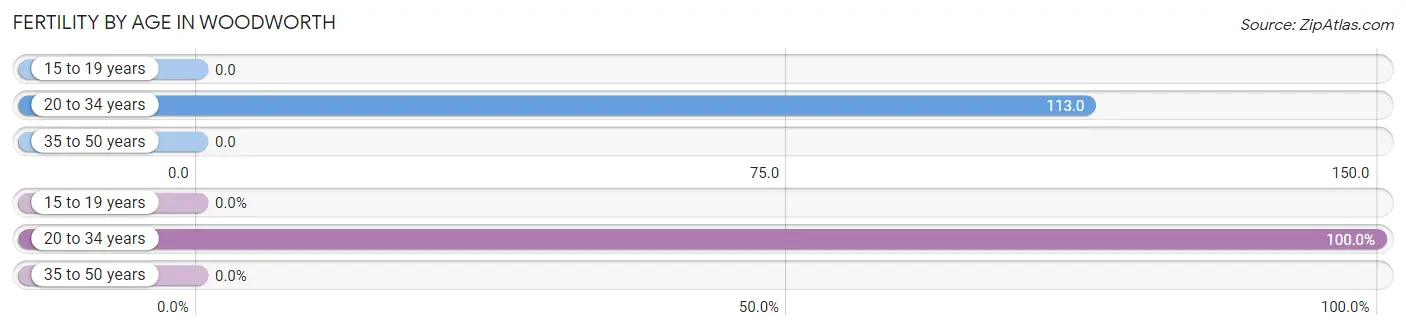
| Age Bracket | Women with Births | Births / 1,000 Women |
| 15 to 19 years | 0 (0.0%) | 0.0 |
| 20 to 34 years | 42 (100.0%) | 113.0 |
| 35 to 50 years | 0 (0.0%) | 0.0 |
| Total | 42 (100.0%) | 56.0 |
Fertility by Age by Marriage Status in Woodworth
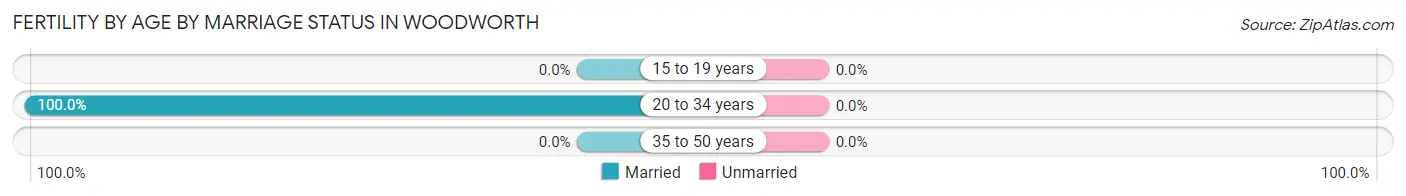
| Age Bracket | Married | Unmarried |
| 15 to 19 years | 0 (0.0%) | 0 (0.0%) |
| 20 to 34 years | 42 (100.0%) | 0 (0.0%) |
| 35 to 50 years | 0 (0.0%) | 0 (0.0%) |
| Total | 42 (100.0%) | 0 (0.0%) |
Fertility by Education in Woodworth
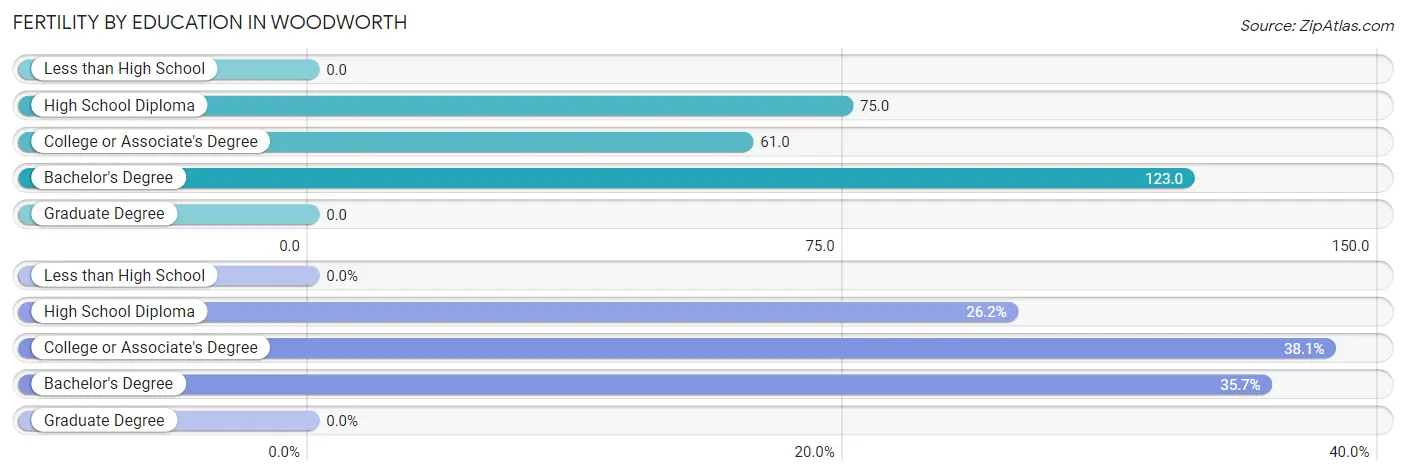
| Educational Attainment | Women with Births | Births / 1,000 Women |
| Less than High School | 0 (0.0%) | 0.0 |
| High School Diploma | 11 (26.2%) | 75.0 |
| College or Associate's Degree | 16 (38.1%) | 61.0 |
| Bachelor's Degree | 15 (35.7%) | 123.0 |
| Graduate Degree | 0 (0.0%) | 0.0 |
| Total | 42 (100.0%) | 56.0 |
Fertility by Education by Marriage Status in Woodworth
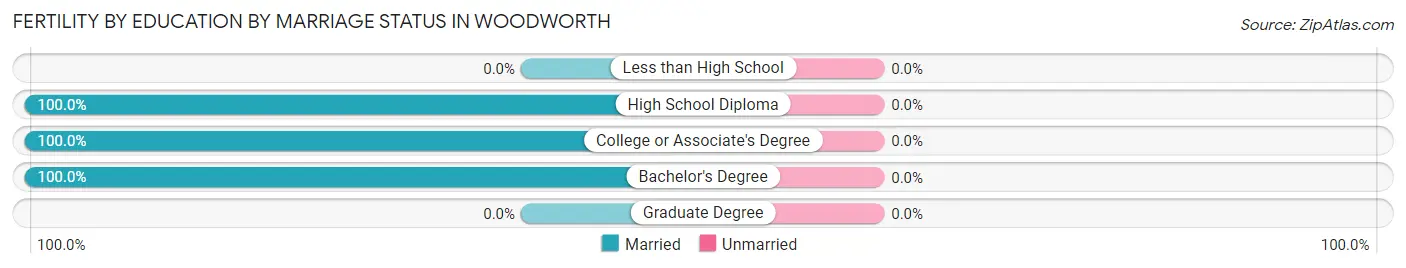
| Educational Attainment | Married | Unmarried |
| Less than High School | 0 (0.0%) | 0 (0.0%) |
| High School Diploma | 11 (100.0%) | 0 (0.0%) |
| College or Associate's Degree | 16 (100.0%) | 0 (0.0%) |
| Bachelor's Degree | 15 (100.0%) | 0 (0.0%) |
| Graduate Degree | 0 (0.0%) | 0 (0.0%) |
| Total | 42 (100.0%) | 0 (0.0%) |
Income in Woodworth
Income Overview in Woodworth
Per Capita Income in Woodworth is $37,606, while median incomes of families and households are $126,090 and $103,667 respectively.
| Characteristic | Number | Measure |
| Per Capita Income | 2,406 | $37,606 |
| Median Family Income | 594 | $126,090 |
| Mean Family Income | 594 | $135,580 |
| Median Household Income | 796 | $103,667 |
| Mean Household Income | 796 | $114,867 |
| Income Deficit | 594 | $6,178 |
| Wage / Income Gap (%) | 2,406 | 13.34% |
| Wage / Income Gap ($) | 2,406 | 86.66¢ per $1 |
| Gini / Inequality Index | 2,406 | 0.44 |
Earnings by Sex in Woodworth
Average Earnings in Woodworth are $47,255, $51,719 for men and $44,821 for women, a difference of 13.3%.
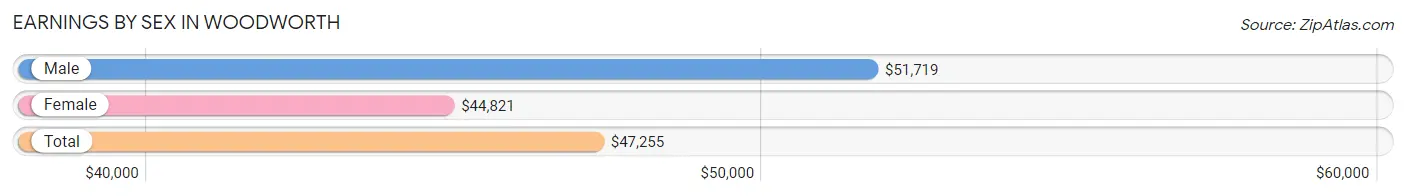
| Sex | Number | Average Earnings |
| Male | 519 (44.5%) | $51,719 |
| Female | 647 (55.5%) | $44,821 |
| Total | 1,166 (100.0%) | $47,255 |
Earnings by Sex by Income Bracket in Woodworth
The most common earnings brackets in Woodworth are $100,000+ for men (156 | 30.1%) and $75,000 to $99,999 for women (99 | 15.3%).
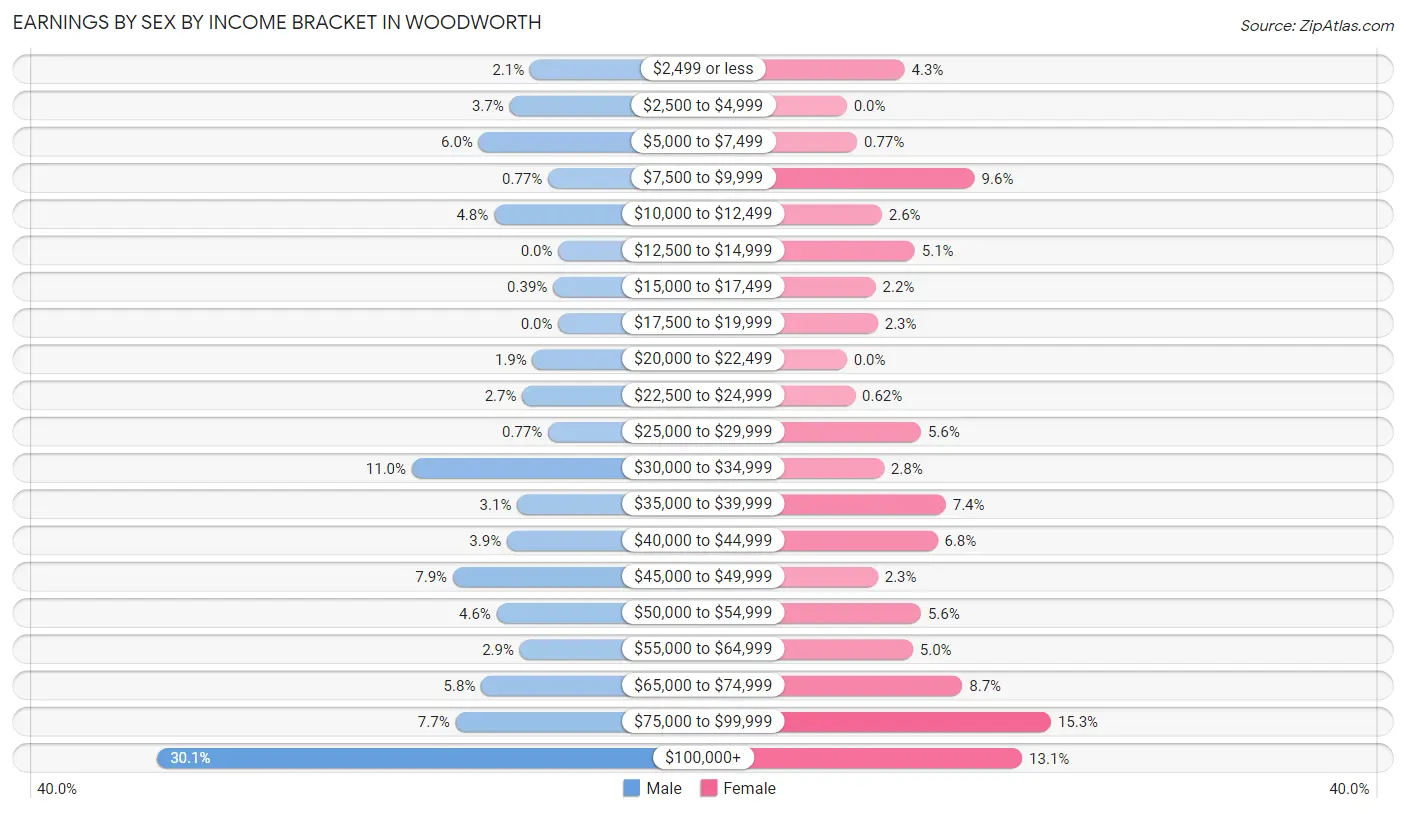
| Income | Male | Female |
| $2,499 or less | 11 (2.1%) | 28 (4.3%) |
| $2,500 to $4,999 | 19 (3.7%) | 0 (0.0%) |
| $5,000 to $7,499 | 31 (6.0%) | 5 (0.8%) |
| $7,500 to $9,999 | 4 (0.8%) | 62 (9.6%) |
| $10,000 to $12,499 | 25 (4.8%) | 17 (2.6%) |
| $12,500 to $14,999 | 0 (0.0%) | 33 (5.1%) |
| $15,000 to $17,499 | 2 (0.4%) | 14 (2.2%) |
| $17,500 to $19,999 | 0 (0.0%) | 15 (2.3%) |
| $20,000 to $22,499 | 10 (1.9%) | 0 (0.0%) |
| $22,500 to $24,999 | 14 (2.7%) | 4 (0.6%) |
| $25,000 to $29,999 | 4 (0.8%) | 36 (5.6%) |
| $30,000 to $34,999 | 57 (11.0%) | 18 (2.8%) |
| $35,000 to $39,999 | 16 (3.1%) | 48 (7.4%) |
| $40,000 to $44,999 | 20 (3.8%) | 44 (6.8%) |
| $45,000 to $49,999 | 41 (7.9%) | 15 (2.3%) |
| $50,000 to $54,999 | 24 (4.6%) | 36 (5.6%) |
| $55,000 to $64,999 | 15 (2.9%) | 32 (5.0%) |
| $65,000 to $74,999 | 30 (5.8%) | 56 (8.7%) |
| $75,000 to $99,999 | 40 (7.7%) | 99 (15.3%) |
| $100,000+ | 156 (30.1%) | 85 (13.1%) |
| Total | 519 (100.0%) | 647 (100.0%) |
Earnings by Sex by Educational Attainment in Woodworth
Average earnings in Woodworth are $61,250 for men and $47,083 for women, a difference of 23.1%. Men with an educational attainment of bachelor's degree enjoy the highest average annual earnings of $118,750, while those with high school diploma education earn the least with $53,125. Women with an educational attainment of graduate degree earn the most with the average annual earnings of $130,583, while those with college or associate's degree education have the smallest earnings of $35,042.
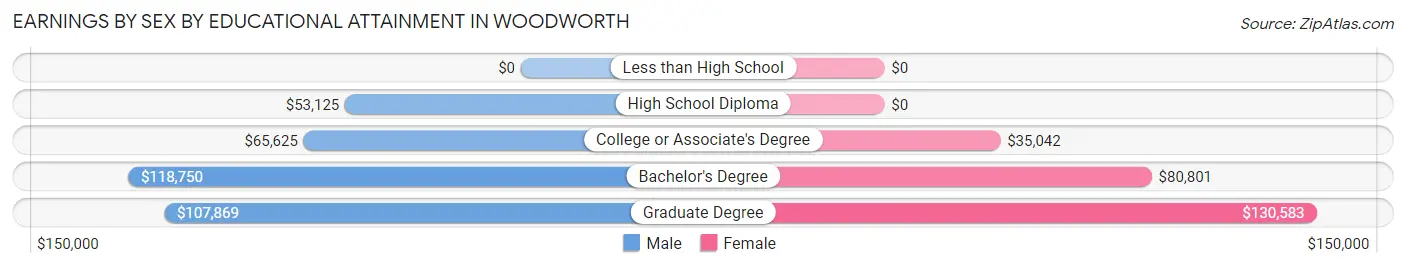
| Educational Attainment | Male Income | Female Income |
| Less than High School | - | - |
| High School Diploma | $53,125 | $0 |
| College or Associate's Degree | $65,625 | $35,042 |
| Bachelor's Degree | $118,750 | $80,801 |
| Graduate Degree | $107,869 | $130,583 |
| Total | $61,250 | $47,083 |
Family Income in Woodworth
Family Income Brackets in Woodworth
According to the Woodworth family income data, there are 174 families falling into the $100,000 to $149,999 income range, which is the most common income bracket and makes up 29.3% of all families.
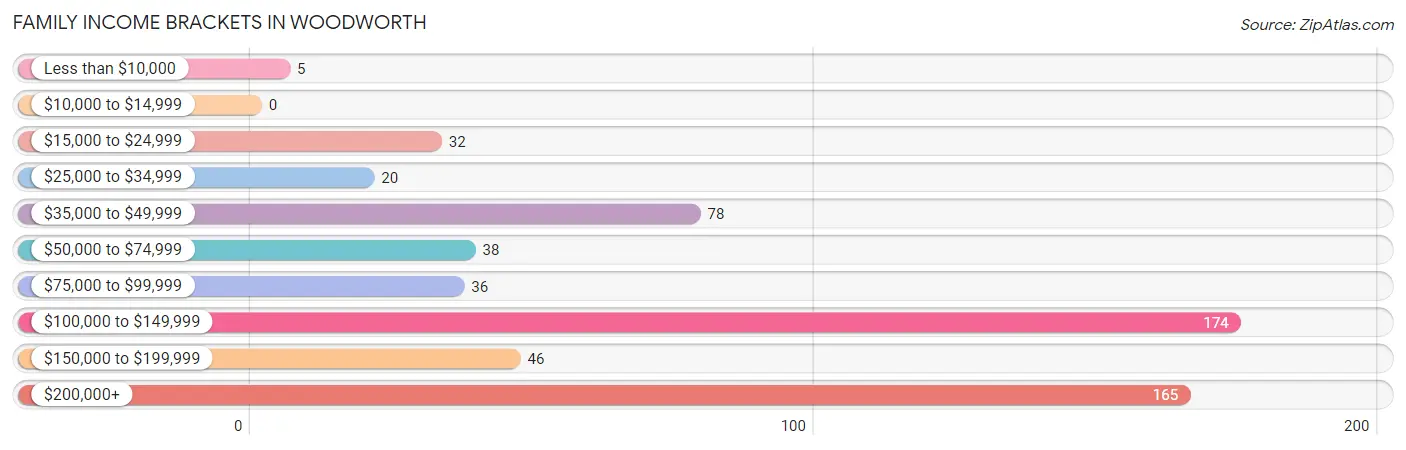
| Income Bracket | # Families | % Families |
| Less than $10,000 | 5 | 0.8% |
| $10,000 to $14,999 | 0 | 0.0% |
| $15,000 to $24,999 | 32 | 5.4% |
| $25,000 to $34,999 | 20 | 3.4% |
| $35,000 to $49,999 | 78 | 13.1% |
| $50,000 to $74,999 | 38 | 6.4% |
| $75,000 to $99,999 | 36 | 6.1% |
| $100,000 to $149,999 | 174 | 29.3% |
| $150,000 to $199,999 | 46 | 7.7% |
| $200,000+ | 165 | 27.8% |
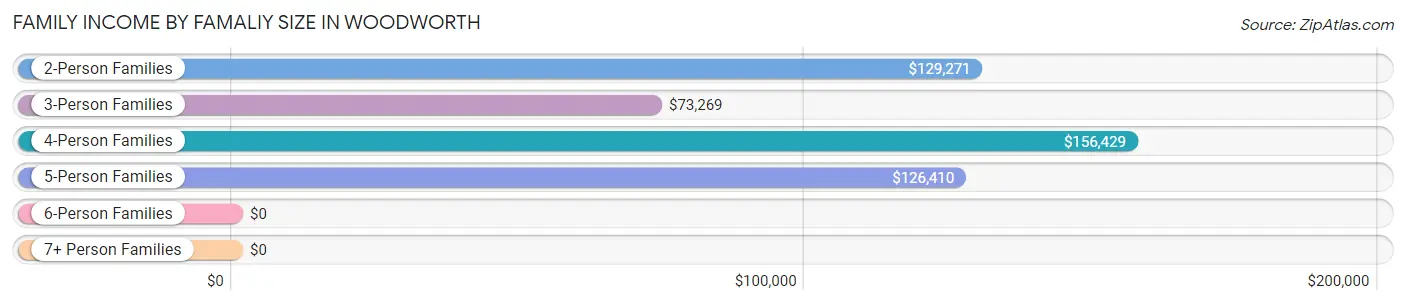
Family Income by Famaliy Size in Woodworth
4-person families (174 | 29.3%) account for the highest median family income in Woodworth with $156,429 per family, while 2-person families (171 | 28.8%) have the highest median income of $64,636 per family member.
| Income Bracket | # Families | Median Income |
| 2-Person Families | 171 (28.8%) | $129,271 |
| 3-Person Families | 168 (28.3%) | $73,269 |
| 4-Person Families | 174 (29.3%) | $156,429 |
| 5-Person Families | 76 (12.8%) | $126,410 |
| 6-Person Families | 5 (0.8%) | $0 |
| 7+ Person Families | 0 (0.0%) | $0 |
| Total | 594 (100.0%) | $126,090 |
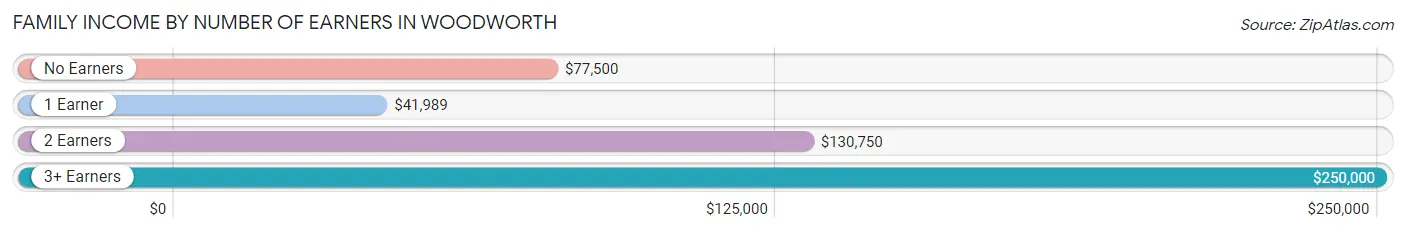
Family Income by Number of Earners in Woodworth
The median family income in Woodworth is $126,090, with families comprising 3+ earners (36) having the highest median family income of $250,000, while families with 1 earner (183) have the lowest median family income of $41,989, accounting for 6.1% and 30.8% of families, respectively.
| Number of Earners | # Families | Median Income |
| No Earners | 34 (5.7%) | $77,500 |
| 1 Earner | 183 (30.8%) | $41,989 |
| 2 Earners | 341 (57.4%) | $130,750 |
| 3+ Earners | 36 (6.1%) | $250,000 |
| Total | 594 (100.0%) | $126,090 |
Household Income in Woodworth
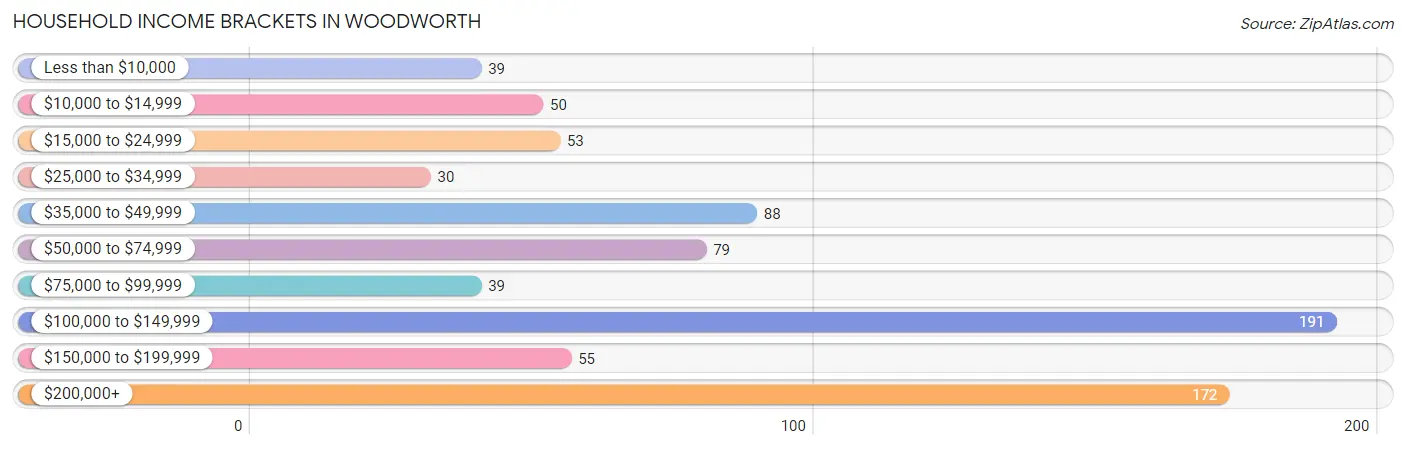
Household Income Brackets in Woodworth
With 191 households falling in the category, the $100,000 to $149,999 income range is the most frequent in Woodworth, accounting for 24.0% of all households. In contrast, only 30 households (3.8%) fall into the $25,000 to $34,999 income bracket, making it the least populous group.
| Income Bracket | # Households | % Households |
| Less than $10,000 | 39 | 4.9% |
| $10,000 to $14,999 | 50 | 6.3% |
| $15,000 to $24,999 | 53 | 6.7% |
| $25,000 to $34,999 | 30 | 3.8% |
| $35,000 to $49,999 | 88 | 11.1% |
| $50,000 to $74,999 | 79 | 9.9% |
| $75,000 to $99,999 | 39 | 4.9% |
| $100,000 to $149,999 | 191 | 24.0% |
| $150,000 to $199,999 | 55 | 6.9% |
| $200,000+ | 172 | 21.6% |
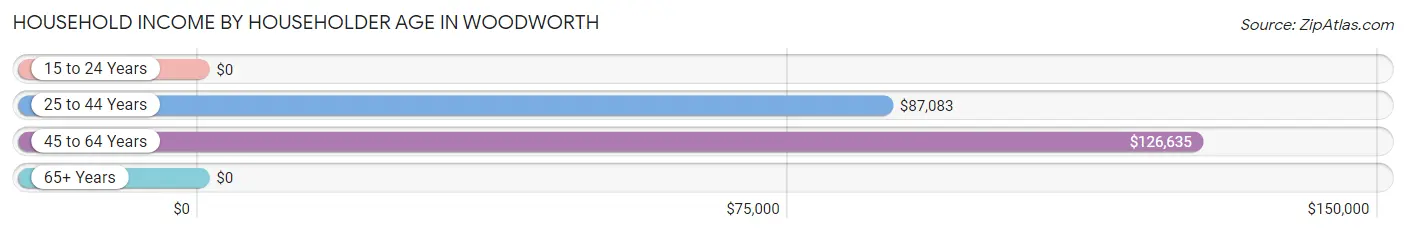
Household Income by Householder Age in Woodworth
The median household income in Woodworth is $103,667, with the highest median household income of $126,635 found in the 45 to 64 years age bracket for the primary householder. A total of 395 households (49.6%) fall into this category. Meanwhile, the 15 to 24 years age bracket for the primary householder has the lowest median household income of $0, with 22 households (2.8%) in this group.
| Income Bracket | # Households | Median Income |
| 15 to 24 Years | 22 (2.8%) | $0 |
| 25 to 44 Years | 240 (30.1%) | $87,083 |
| 45 to 64 Years | 395 (49.6%) | $126,635 |
| 65+ Years | 139 (17.5%) | $0 |
| Total | 796 (100.0%) | $103,667 |
Poverty in Woodworth
Income Below Poverty by Sex and Age in Woodworth
With 10.9% poverty level for males and 10.4% for females among the residents of Woodworth, 5 year old males and 65 to 74 year old females are the most vulnerable to poverty, with 3 males (100.0%) and 30 females (45.5%) in their respective age groups living below the poverty level.
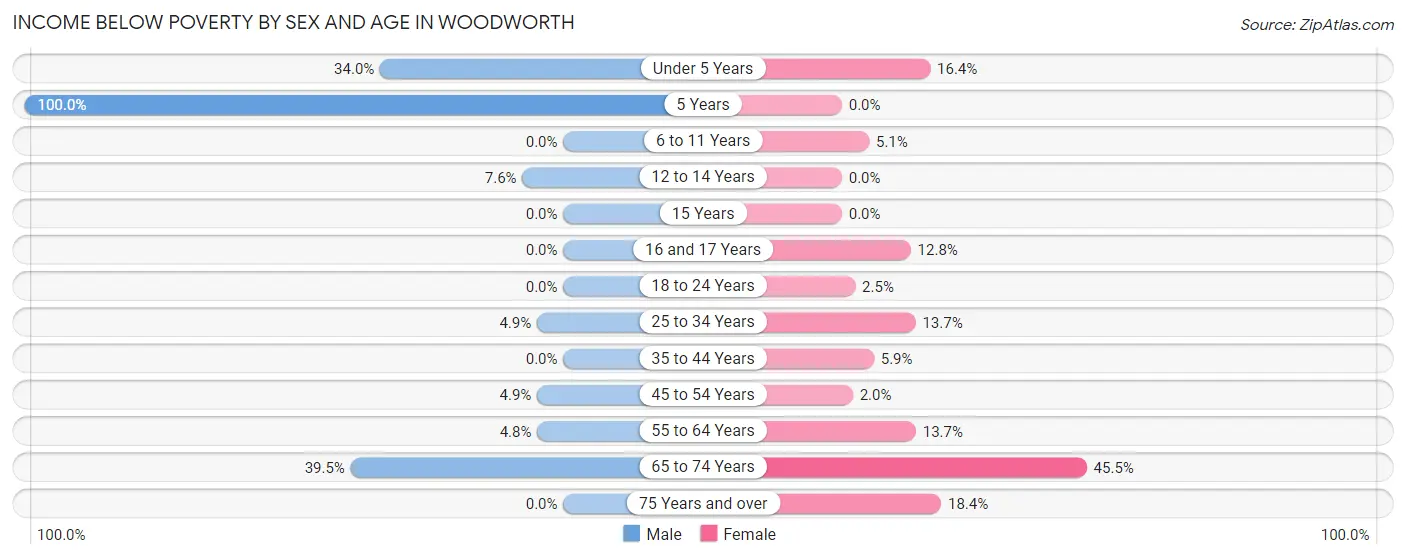
| Age Bracket | Male | Female |
| Under 5 Years | 51 (34.0%) | 20 (16.4%) |
| 5 Years | 3 (100.0%) | 0 (0.0%) |
| 6 to 11 Years | 0 (0.0%) | 4 (5.1%) |
| 12 to 14 Years | 11 (7.6%) | 0 (0.0%) |
| 15 Years | 0 (0.0%) | 0 (0.0%) |
| 16 and 17 Years | 0 (0.0%) | 17 (12.8%) |
| 18 to 24 Years | 0 (0.0%) | 4 (2.5%) |
| 25 to 34 Years | 6 (4.9%) | 29 (13.7%) |
| 35 to 44 Years | 0 (0.0%) | 6 (5.9%) |
| 45 to 54 Years | 9 (4.9%) | 4 (2.0%) |
| 55 to 64 Years | 7 (4.8%) | 18 (13.7%) |
| 65 to 74 Years | 30 (39.5%) | 30 (45.5%) |
| 75 Years and over | 0 (0.0%) | 7 (18.4%) |
| Total | 117 (10.9%) | 139 (10.4%) |
Income Above Poverty by Sex and Age in Woodworth
According to the poverty statistics in Woodworth, males aged 6 to 11 years and females aged 5 years are the age groups that are most secure financially, with 100.0% of males and 100.0% of females in these age groups living above the poverty line.
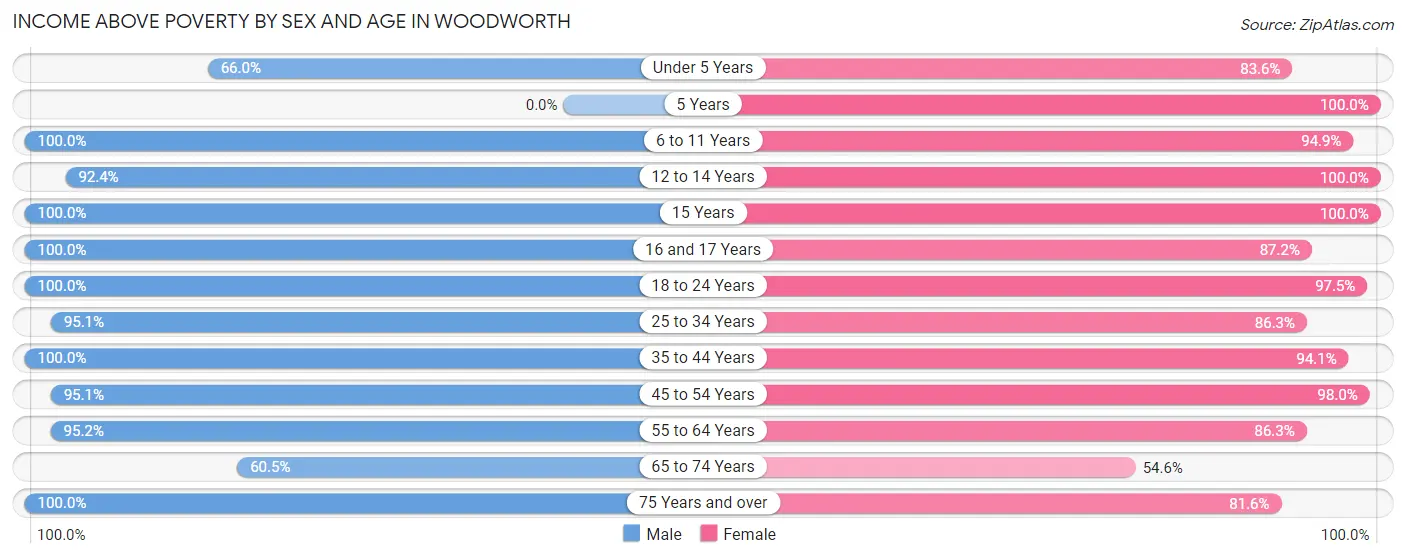
| Age Bracket | Male | Female |
| Under 5 Years | 99 (66.0%) | 102 (83.6%) |
| 5 Years | 0 (0.0%) | 8 (100.0%) |
| 6 to 11 Years | 23 (100.0%) | 75 (94.9%) |
| 12 to 14 Years | 134 (92.4%) | 74 (100.0%) |
| 15 Years | 16 (100.0%) | 11 (100.0%) |
| 16 and 17 Years | 21 (100.0%) | 116 (87.2%) |
| 18 to 24 Years | 97 (100.0%) | 157 (97.5%) |
| 25 to 34 Years | 117 (95.1%) | 183 (86.3%) |
| 35 to 44 Years | 63 (100.0%) | 95 (94.1%) |
| 45 to 54 Years | 176 (95.1%) | 193 (98.0%) |
| 55 to 64 Years | 138 (95.2%) | 113 (86.3%) |
| 65 to 74 Years | 46 (60.5%) | 36 (54.5%) |
| 75 Years and over | 26 (100.0%) | 31 (81.6%) |
| Total | 956 (89.1%) | 1,194 (89.6%) |
Income Below Poverty Among Married-Couple Families in Woodworth
The poverty statistics for married-couple families in Woodworth show that 2.6% or 12 of the total 465 families live below the poverty line. Families with no children have the highest poverty rate of 3.4%, comprising of 6 families. On the other hand, families with 3 or 4 children have the lowest poverty rate of 0.0%, which includes 0 families.
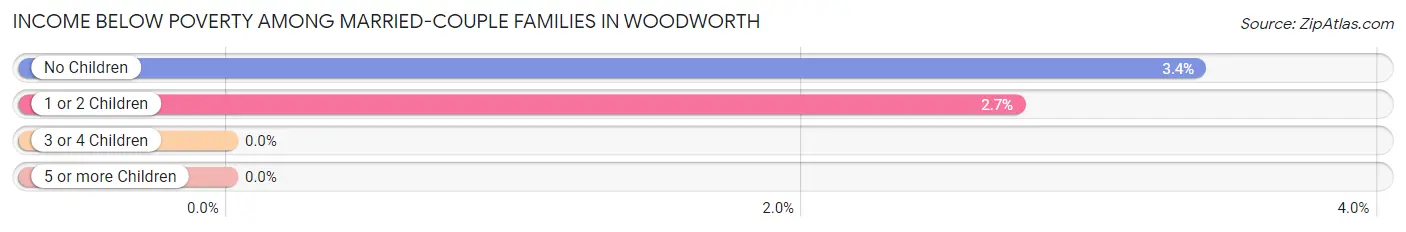
| Children | Above Poverty | Below Poverty |
| No Children | 172 (96.6%) | 6 (3.4%) |
| 1 or 2 Children | 213 (97.3%) | 6 (2.7%) |
| 3 or 4 Children | 68 (100.0%) | 0 (0.0%) |
| 5 or more Children | 0 (0.0%) | 0 (0.0%) |
| Total | 453 (97.4%) | 12 (2.6%) |
Income Below Poverty Among Single-Parent Households in Woodworth
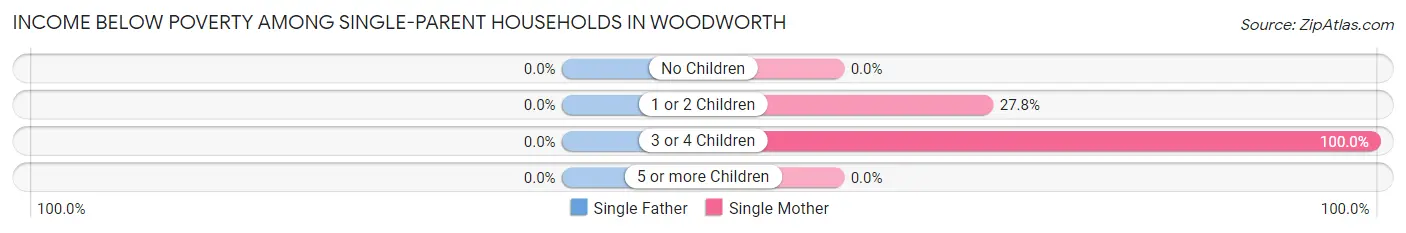
| Children | Single Father | Single Mother |
| No Children | 0 (0.0%) | 0 (0.0%) |
| 1 or 2 Children | 0 (0.0%) | 20 (27.8%) |
| 3 or 4 Children | 0 (0.0%) | 9 (100.0%) |
| 5 or more Children | 0 (0.0%) | 0 (0.0%) |
| Total | 0 (0.0%) | 29 (34.5%) |
Income Below Poverty Among Married-Couple vs Single-Parent Households in Woodworth
The poverty data for Woodworth shows that 12 of the married-couple family households (2.6%) and 29 of the single-parent households (22.5%) are living below the poverty level. Within the married-couple family households, those with no children have the highest poverty rate, with 6 households (3.4%) falling below the poverty line. Among the single-parent households, those with 3 or 4 children have the highest poverty rate, with 9 household (100.0%) living below poverty.
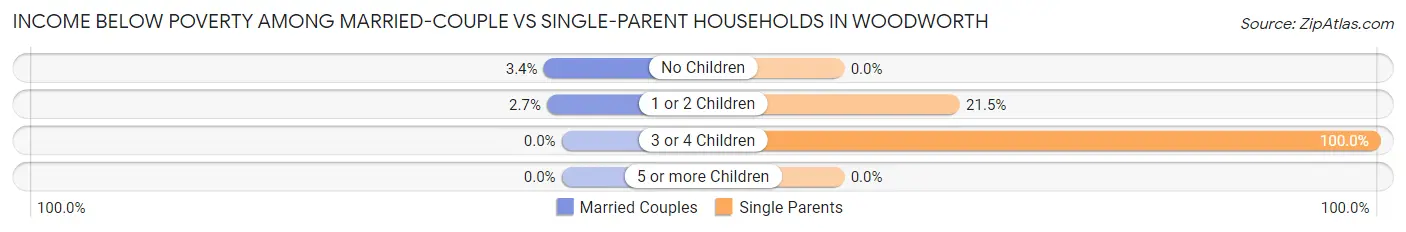
| Children | Married-Couple Families | Single-Parent Households |
| No Children | 6 (3.4%) | 0 (0.0%) |
| 1 or 2 Children | 6 (2.7%) | 20 (21.5%) |
| 3 or 4 Children | 0 (0.0%) | 9 (100.0%) |
| 5 or more Children | 0 (0.0%) | 0 (0.0%) |
| Total | 12 (2.6%) | 29 (22.5%) |
Employment Characteristics in Woodworth
Employment by Class of Employer in Woodworth
Among the 1,095 employed individuals in Woodworth, private company employees (708 | 64.7%), federal government employees (93 | 8.5%), and self-employed (incorporated) (84 | 7.7%) make up the most common classes of employment.
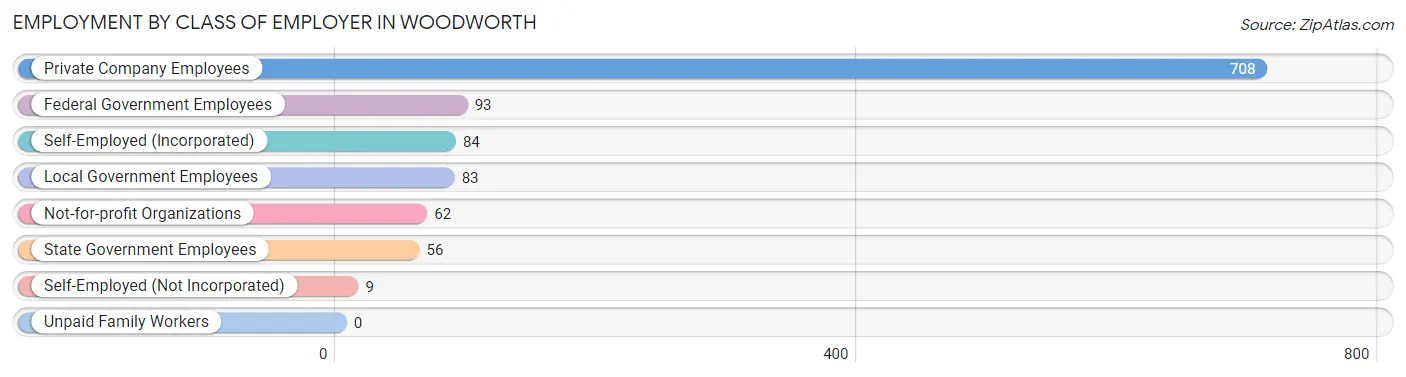
| Employer Class | # Employees | % Employees |
| Private Company Employees | 708 | 64.7% |
| Self-Employed (Incorporated) | 84 | 7.7% |
| Self-Employed (Not Incorporated) | 9 | 0.8% |
| Not-for-profit Organizations | 62 | 5.7% |
| Local Government Employees | 83 | 7.6% |
| State Government Employees | 56 | 5.1% |
| Federal Government Employees | 93 | 8.5% |
| Unpaid Family Workers | 0 | 0.0% |
| Total | 1,095 | 100.0% |
Employment Status by Age in Woodworth
According to the labor force statistics for Woodworth, out of the total population over 16 years of age (1,775), 66.0% or 1,172 individuals are in the labor force, with 3.6% or 42 of them unemployed. The age group with the highest labor force participation rate is 35 to 44 years, with 95.1% or 156 individuals in the labor force. Within the labor force, the 30 to 34 years age range has the highest percentage of unemployed individuals, with 15.1% or 23 of them being unemployed.
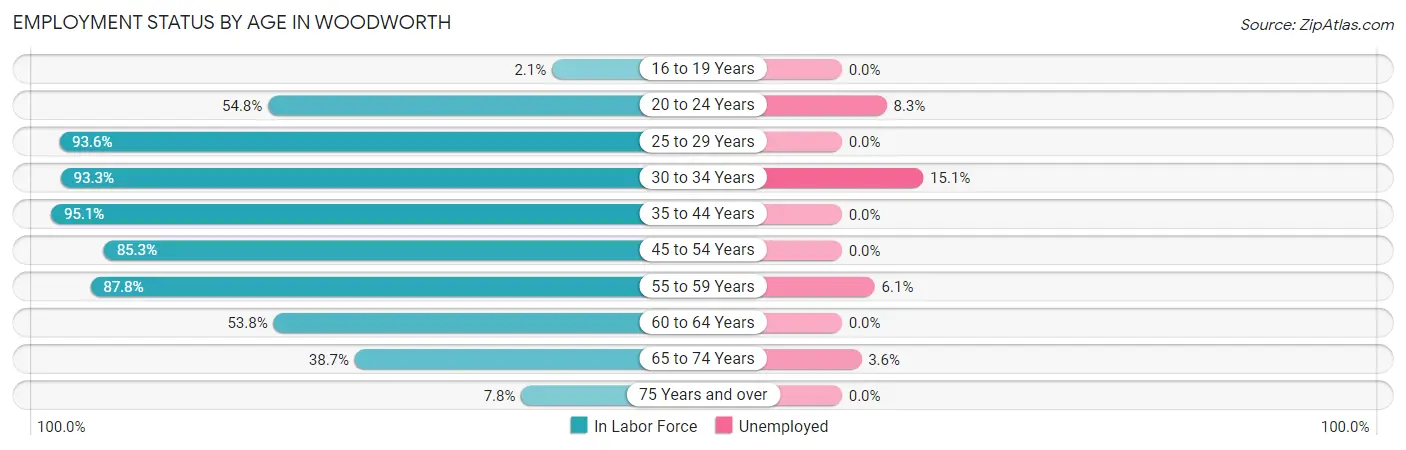
| Age Bracket | In Labor Force | Unemployed |
| 16 to 19 Years | 4 (2.1%) | 0 (0.0%) |
| 20 to 24 Years | 120 (54.8%) | 10 (8.3%) |
| 25 to 29 Years | 161 (93.6%) | 0 (0.0%) |
| 30 to 34 Years | 152 (93.3%) | 23 (15.1%) |
| 35 to 44 Years | 156 (95.1%) | 0 (0.0%) |
| 45 to 54 Years | 326 (85.3%) | 0 (0.0%) |
| 55 to 59 Years | 115 (87.8%) | 7 (6.1%) |
| 60 to 64 Years | 78 (53.8%) | 0 (0.0%) |
| 65 to 74 Years | 55 (38.7%) | 2 (3.6%) |
| 75 Years and over | 5 (7.8%) | 0 (0.0%) |
| Total | 1,172 (66.0%) | 42 (3.6%) |
Employment Status by Educational Attainment in Woodworth
According to labor force statistics for Woodworth, 85.4% of individuals (988) out of the total population between 25 and 64 years of age (1,157) are in the labor force, with 3.0% or 30 of them being unemployed. The group with the highest labor force participation rate are those with the educational attainment of less than high school, with 100.0% or 63 individuals in the labor force. Within the labor force, individuals with high school diploma education have the highest percentage of unemployment, with 14.0% or 20 of them being unemployed.
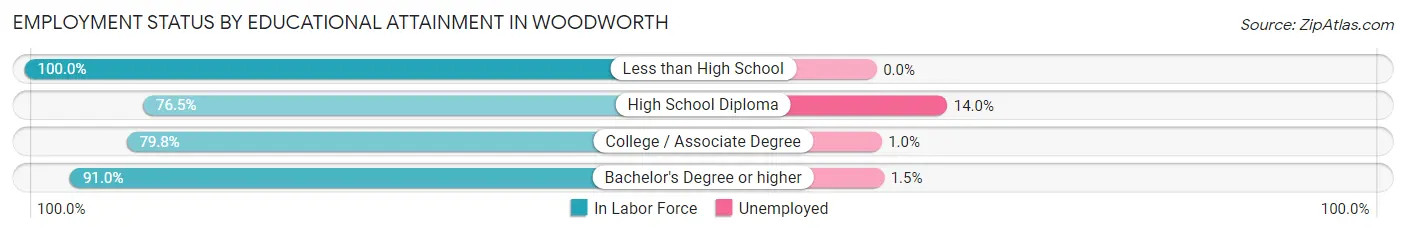
| Educational Attainment | In Labor Force | Unemployed |
| Less than High School | 63 (100.0%) | 0 (0.0%) |
| High School Diploma | 143 (76.5%) | 26 (14.0%) |
| College / Associate Degree | 309 (79.8%) | 4 (1.0%) |
| Bachelor's Degree or higher | 473 (91.0%) | 8 (1.5%) |
| Total | 988 (85.4%) | 35 (3.0%) |
Employment Occupations by Sex in Woodworth
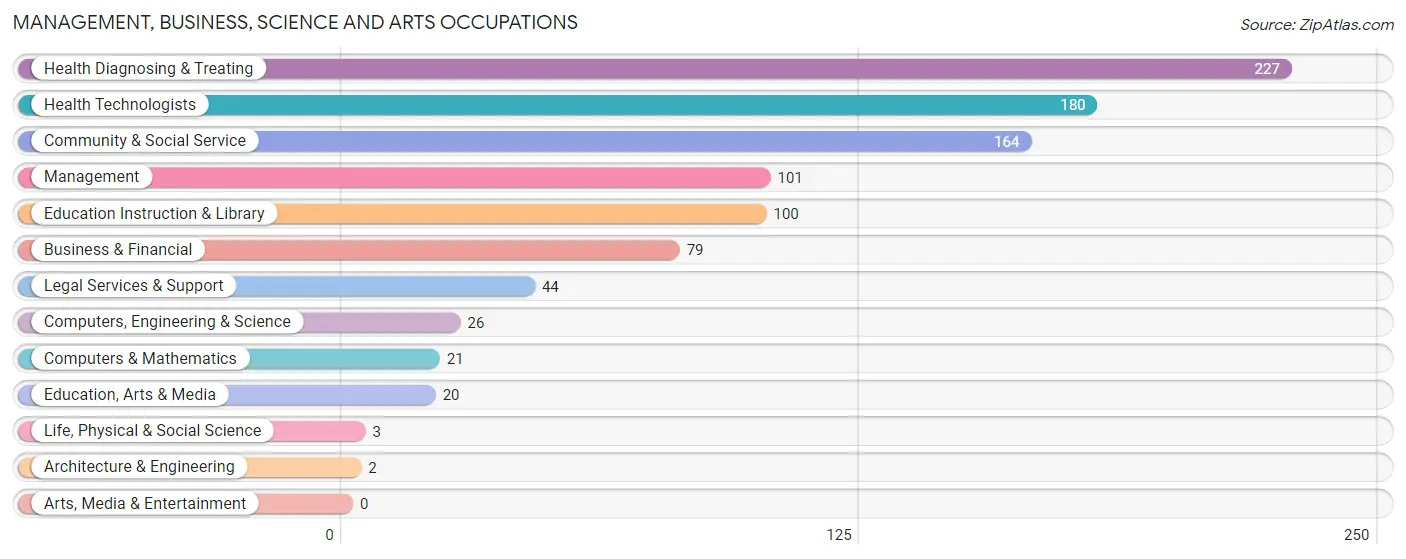
Management, Business, Science and Arts Occupations
The most common Management, Business, Science and Arts occupations in Woodworth are Health Diagnosing & Treating (227 | 20.1%), Health Technologists (180 | 15.9%), Community & Social Service (164 | 14.5%), Management (101 | 8.9%), and Education Instruction & Library (100 | 8.8%).
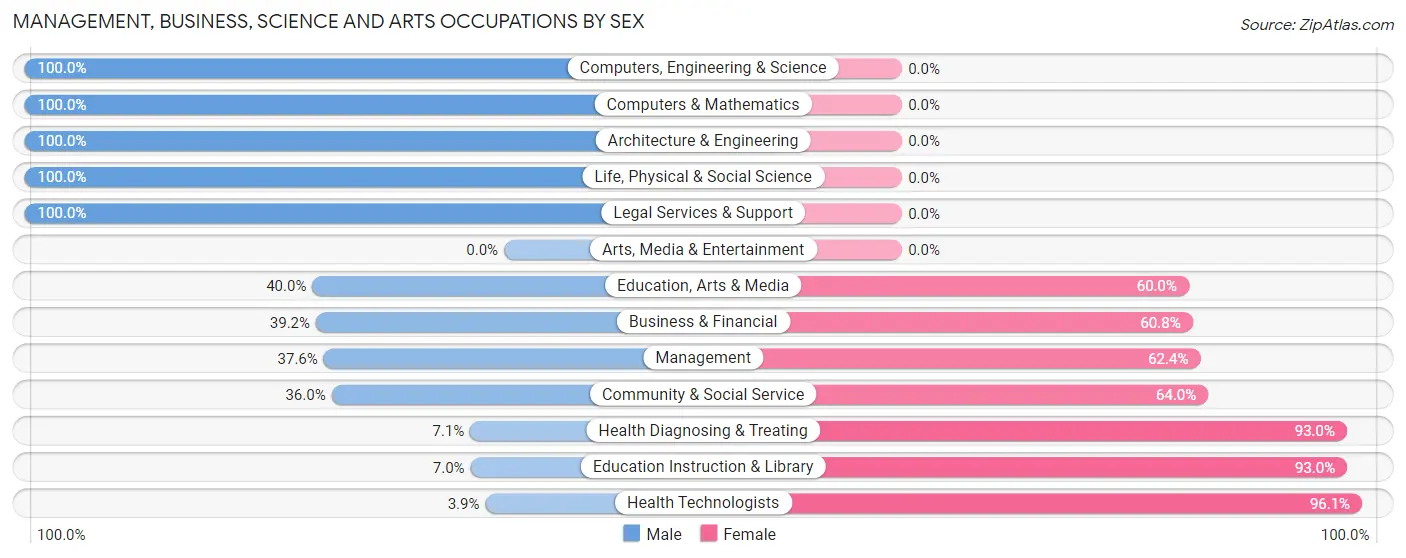
Management, Business, Science and Arts Occupations by Sex
Within the Management, Business, Science and Arts occupations in Woodworth, the most male-oriented occupations are Computers, Engineering & Science (100.0%), Computers & Mathematics (100.0%), and Architecture & Engineering (100.0%), while the most female-oriented occupations are Health Technologists (96.1%), Education Instruction & Library (93.0%), and Health Diagnosing & Treating (92.9%).
| Occupation | Male | Female |
| Management | 38 (37.6%) | 63 (62.4%) |
| Business & Financial | 31 (39.2%) | 48 (60.8%) |
| Computers, Engineering & Science | 26 (100.0%) | 0 (0.0%) |
| Computers & Mathematics | 21 (100.0%) | 0 (0.0%) |
| Architecture & Engineering | 2 (100.0%) | 0 (0.0%) |
| Life, Physical & Social Science | 3 (100.0%) | 0 (0.0%) |
| Community & Social Service | 59 (36.0%) | 105 (64.0%) |
| Education, Arts & Media | 8 (40.0%) | 12 (60.0%) |
| Legal Services & Support | 44 (100.0%) | 0 (0.0%) |
| Education Instruction & Library | 7 (7.0%) | 93 (93.0%) |
| Arts, Media & Entertainment | 0 (0.0%) | 0 (0.0%) |
| Health Diagnosing & Treating | 16 (7.0%) | 211 (92.9%) |
| Health Technologists | 7 (3.9%) | 173 (96.1%) |
| Total (Category) | 170 (28.5%) | 427 (71.5%) |
| Total (Overall) | 490 (43.4%) | 640 (56.6%) |
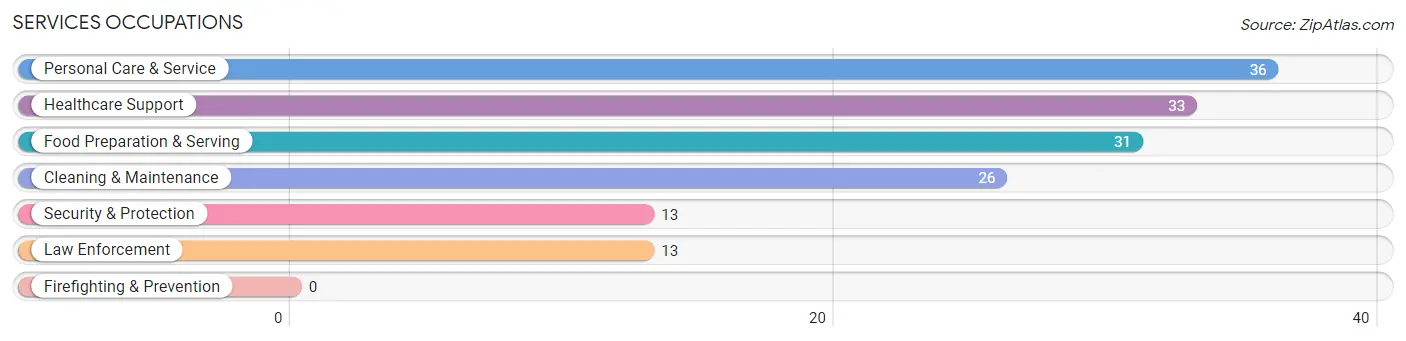
Services Occupations
The most common Services occupations in Woodworth are Personal Care & Service (36 | 3.2%), Healthcare Support (33 | 2.9%), Food Preparation & Serving (31 | 2.7%), Cleaning & Maintenance (26 | 2.3%), and Security & Protection (13 | 1.1%).
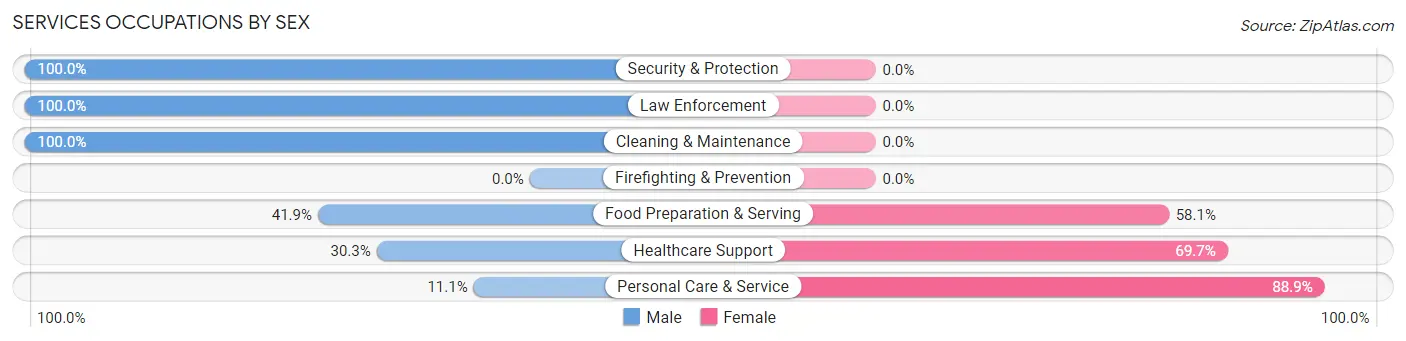
Services Occupations by Sex
Within the Services occupations in Woodworth, the most male-oriented occupations are Security & Protection (100.0%), Law Enforcement (100.0%), and Cleaning & Maintenance (100.0%), while the most female-oriented occupations are Personal Care & Service (88.9%), Healthcare Support (69.7%), and Food Preparation & Serving (58.1%).
| Occupation | Male | Female |
| Healthcare Support | 10 (30.3%) | 23 (69.7%) |
| Security & Protection | 13 (100.0%) | 0 (0.0%) |
| Firefighting & Prevention | 0 (0.0%) | 0 (0.0%) |
| Law Enforcement | 13 (100.0%) | 0 (0.0%) |
| Food Preparation & Serving | 13 (41.9%) | 18 (58.1%) |
| Cleaning & Maintenance | 26 (100.0%) | 0 (0.0%) |
| Personal Care & Service | 4 (11.1%) | 32 (88.9%) |
| Total (Category) | 66 (47.5%) | 73 (52.5%) |
| Total (Overall) | 490 (43.4%) | 640 (56.6%) |
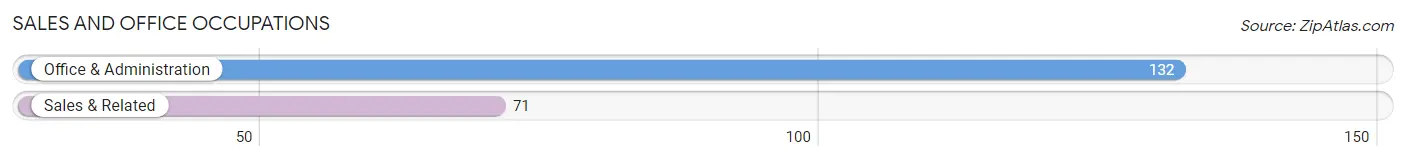
Sales and Office Occupations
The most common Sales and Office occupations in Woodworth are Office & Administration (132 | 11.7%), and Sales & Related (71 | 6.3%).
Sales and Office Occupations by Sex
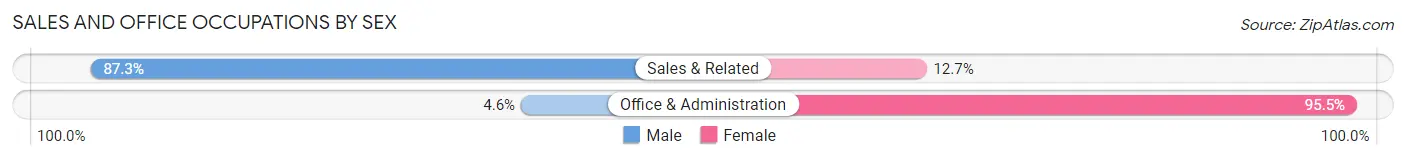
| Occupation | Male | Female |
| Sales & Related | 62 (87.3%) | 9 (12.7%) |
| Office & Administration | 6 (4.5%) | 126 (95.5%) |
| Total (Category) | 68 (33.5%) | 135 (66.5%) |
| Total (Overall) | 490 (43.4%) | 640 (56.6%) |
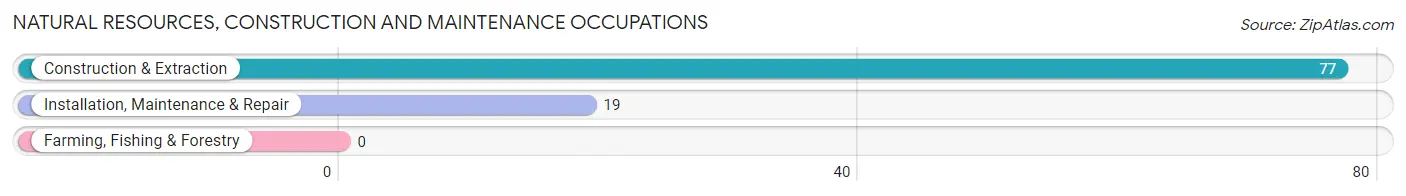
Natural Resources, Construction and Maintenance Occupations
The most common Natural Resources, Construction and Maintenance occupations in Woodworth are Construction & Extraction (77 | 6.8%), and Installation, Maintenance & Repair (19 | 1.7%).
Natural Resources, Construction and Maintenance Occupations by Sex
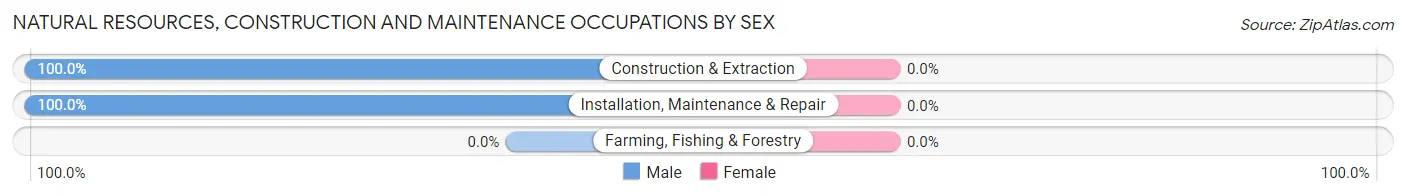
| Occupation | Male | Female |
| Farming, Fishing & Forestry | 0 (0.0%) | 0 (0.0%) |
| Construction & Extraction | 77 (100.0%) | 0 (0.0%) |
| Installation, Maintenance & Repair | 19 (100.0%) | 0 (0.0%) |
| Total (Category) | 96 (100.0%) | 0 (0.0%) |
| Total (Overall) | 490 (43.4%) | 640 (56.6%) |
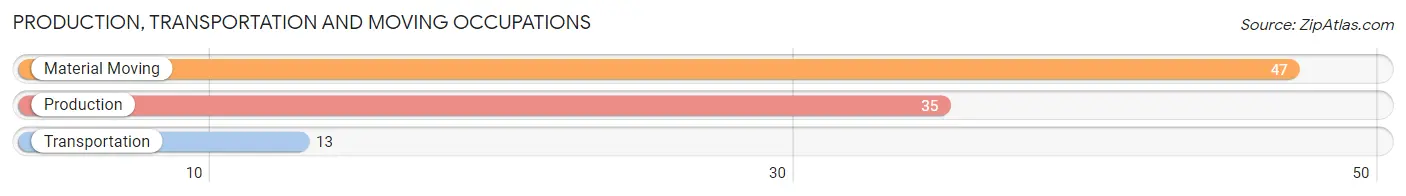
Production, Transportation and Moving Occupations
The most common Production, Transportation and Moving occupations in Woodworth are Material Moving (47 | 4.2%), Production (35 | 3.1%), and Transportation (13 | 1.1%).
Production, Transportation and Moving Occupations by Sex
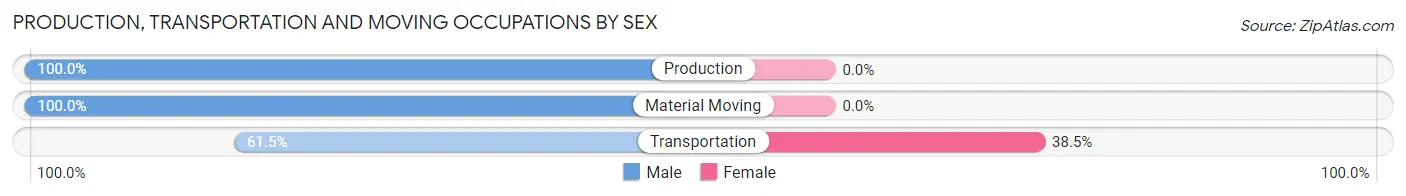
| Occupation | Male | Female |
| Production | 35 (100.0%) | 0 (0.0%) |
| Transportation | 8 (61.5%) | 5 (38.5%) |
| Material Moving | 47 (100.0%) | 0 (0.0%) |
| Total (Category) | 90 (94.7%) | 5 (5.3%) |
| Total (Overall) | 490 (43.4%) | 640 (56.6%) |
Employment Industries by Sex in Woodworth
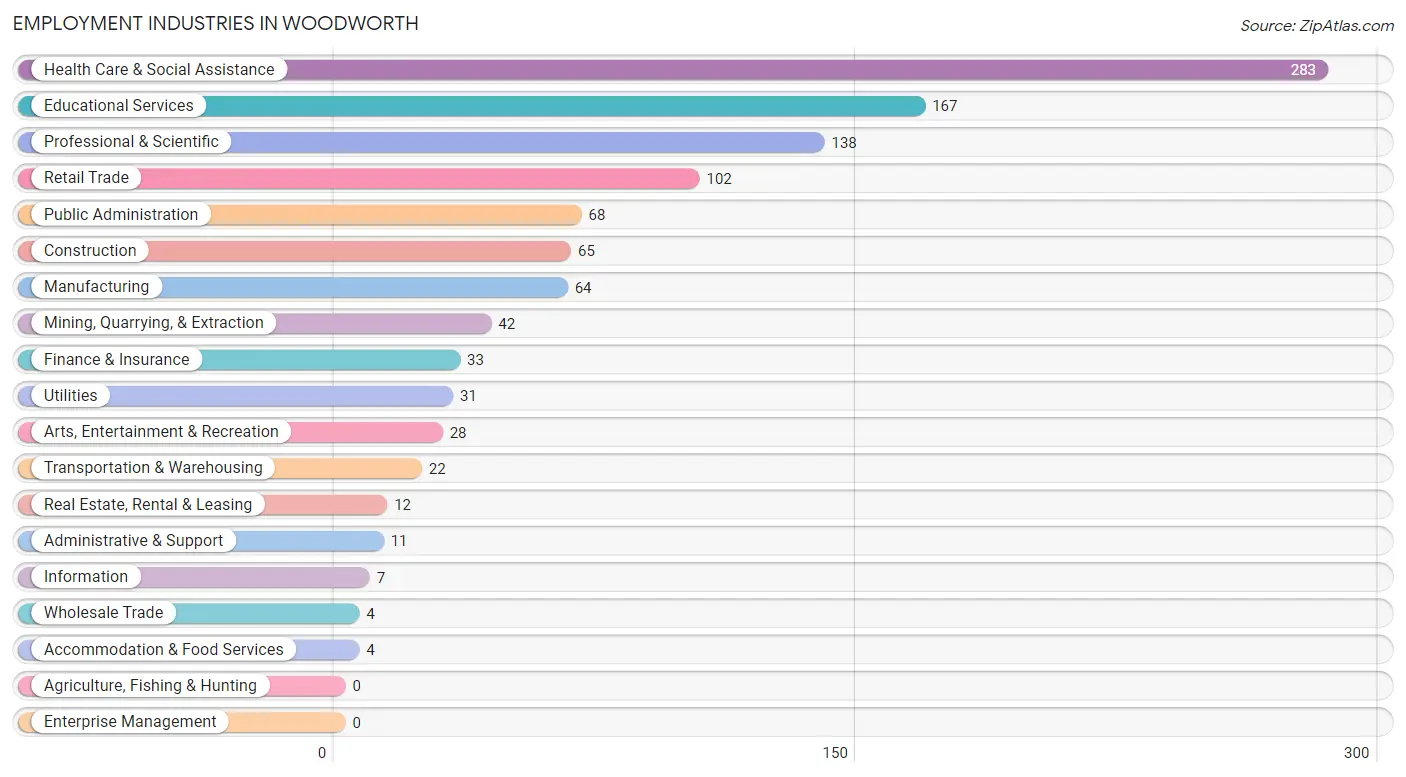
Employment Industries in Woodworth
The major employment industries in Woodworth include Health Care & Social Assistance (283 | 25.0%), Educational Services (167 | 14.8%), Professional & Scientific (138 | 12.2%), Retail Trade (102 | 9.0%), and Public Administration (68 | 6.0%).
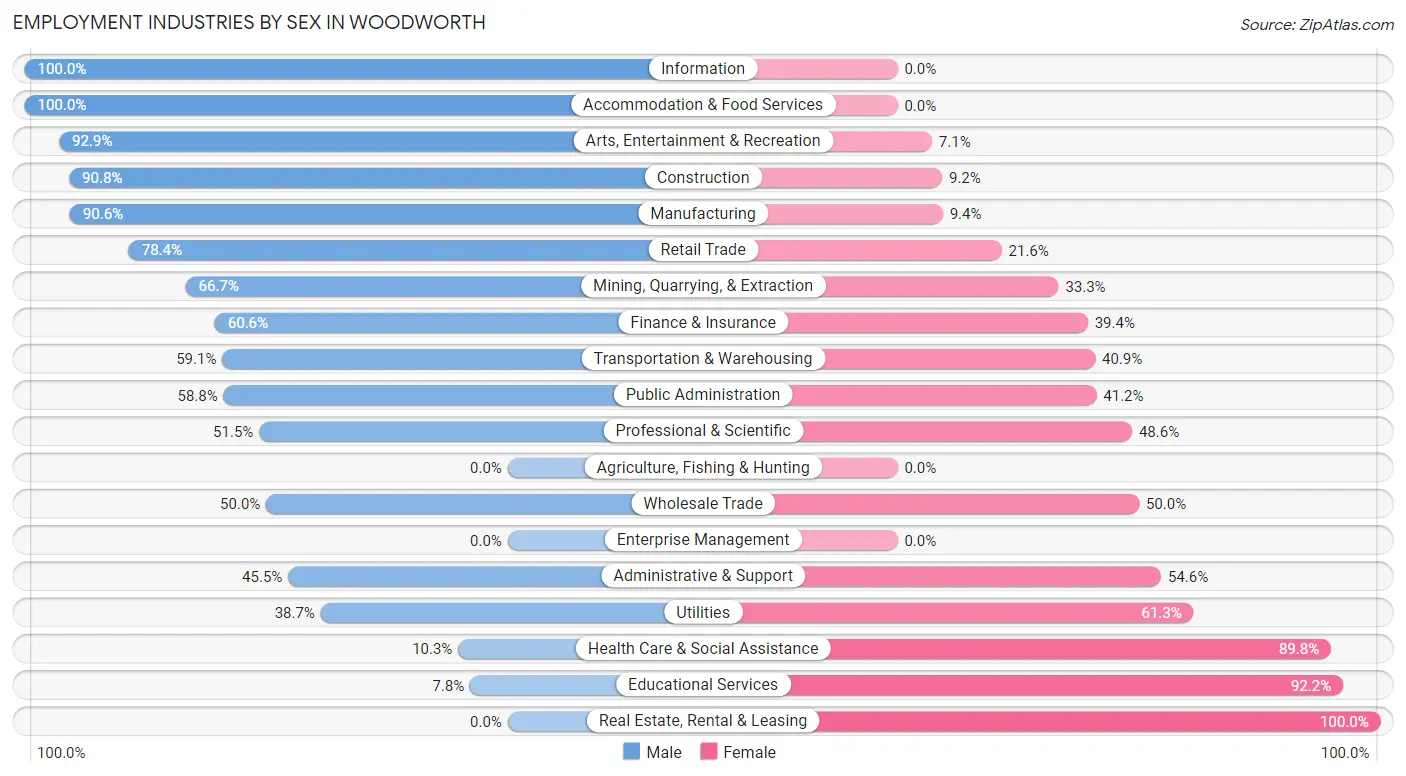
Employment Industries by Sex in Woodworth
The Woodworth industries that see more men than women are Information (100.0%), Accommodation & Food Services (100.0%), and Arts, Entertainment & Recreation (92.9%), whereas the industries that tend to have a higher number of women are Real Estate, Rental & Leasing (100.0%), Educational Services (92.2%), and Health Care & Social Assistance (89.7%).
| Industry | Male | Female |
| Agriculture, Fishing & Hunting | 0 (0.0%) | 0 (0.0%) |
| Mining, Quarrying, & Extraction | 28 (66.7%) | 14 (33.3%) |
| Construction | 59 (90.8%) | 6 (9.2%) |
| Manufacturing | 58 (90.6%) | 6 (9.4%) |
| Wholesale Trade | 2 (50.0%) | 2 (50.0%) |
| Retail Trade | 80 (78.4%) | 22 (21.6%) |
| Transportation & Warehousing | 13 (59.1%) | 9 (40.9%) |
| Utilities | 12 (38.7%) | 19 (61.3%) |
| Information | 7 (100.0%) | 0 (0.0%) |
| Finance & Insurance | 20 (60.6%) | 13 (39.4%) |
| Real Estate, Rental & Leasing | 0 (0.0%) | 12 (100.0%) |
| Professional & Scientific | 71 (51.4%) | 67 (48.5%) |
| Enterprise Management | 0 (0.0%) | 0 (0.0%) |
| Administrative & Support | 5 (45.5%) | 6 (54.5%) |
| Educational Services | 13 (7.8%) | 154 (92.2%) |
| Health Care & Social Assistance | 29 (10.2%) | 254 (89.7%) |
| Arts, Entertainment & Recreation | 26 (92.9%) | 2 (7.1%) |
| Accommodation & Food Services | 4 (100.0%) | 0 (0.0%) |
| Public Administration | 40 (58.8%) | 28 (41.2%) |
| Total | 490 (43.4%) | 640 (56.6%) |
Education in Woodworth
School Enrollment in Woodworth
The most common levels of schooling among the 802 students in Woodworth are high school (242 | 30.2%), middle school (224 | 27.9%), and college / undergraduate (200 | 24.9%).
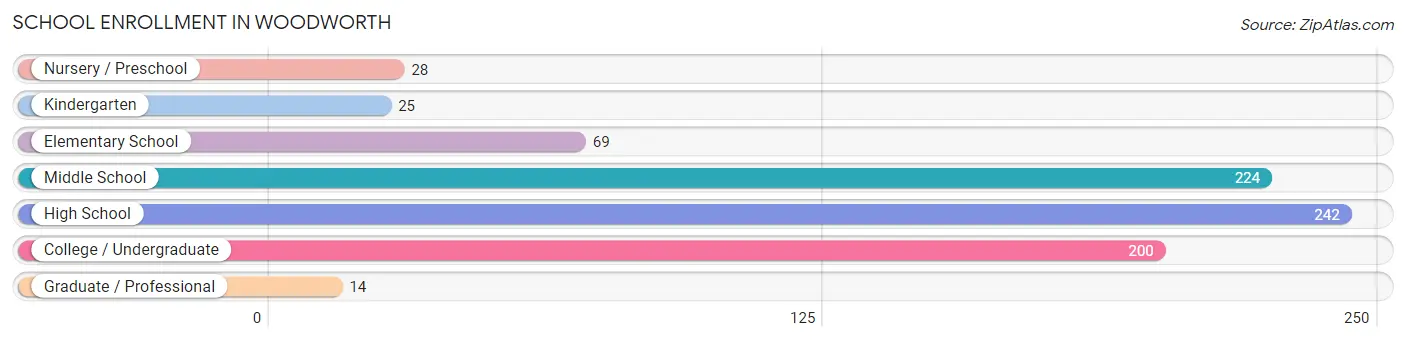
| School Level | # Students | % Students |
| Nursery / Preschool | 28 | 3.5% |
| Kindergarten | 25 | 3.1% |
| Elementary School | 69 | 8.6% |
| Middle School | 224 | 27.9% |
| High School | 242 | 30.2% |
| College / Undergraduate | 200 | 24.9% |
| Graduate / Professional | 14 | 1.8% |
| Total | 802 | 100.0% |
School Enrollment by Age by Funding Source in Woodworth
Out of a total of 802 students who are enrolled in schools in Woodworth, 160 (20.0%) attend a private institution, while the remaining 642 (80.0%) are enrolled in public schools. The age group of 3 to 4 year olds has the highest likelihood of being enrolled in private schools, with 27 (75.0% in the age bracket) enrolled. Conversely, the age group of 18 to 19 year olds has the lowest likelihood of being enrolled in a private school, with 39 (100.0% in the age bracket) attending a public institution.
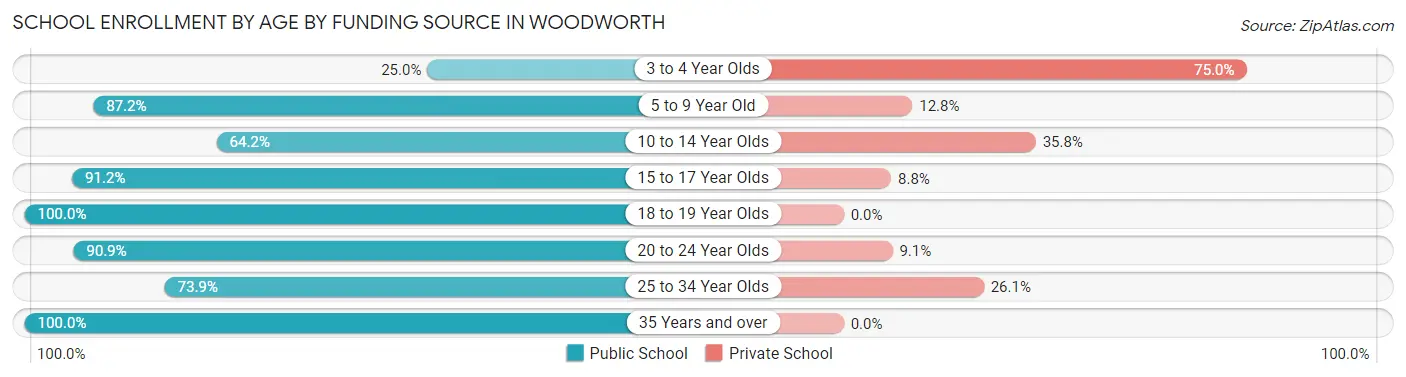
| Age Bracket | Public School | Private School |
| 3 to 4 Year Olds | 9 (25.0%) | 27 (75.0%) |
| 5 to 9 Year Old | 75 (87.2%) | 11 (12.8%) |
| 10 to 14 Year Olds | 158 (64.2%) | 88 (35.8%) |
| 15 to 17 Year Olds | 165 (91.2%) | 16 (8.8%) |
| 18 to 19 Year Olds | 39 (100.0%) | 0 (0.0%) |
| 20 to 24 Year Olds | 120 (90.9%) | 12 (9.1%) |
| 25 to 34 Year Olds | 17 (73.9%) | 6 (26.1%) |
| 35 Years and over | 59 (100.0%) | 0 (0.0%) |
| Total | 642 (80.0%) | 160 (20.0%) |
Educational Attainment by Field of Study in Woodworth
Business (120 | 19.8%), science & technology (96 | 15.8%), bio, nature & agricultural (80 | 13.2%), education (62 | 10.2%), and social sciences (47 | 7.8%) are the most common fields of study among 606 individuals in Woodworth who have obtained a bachelor's degree or higher.
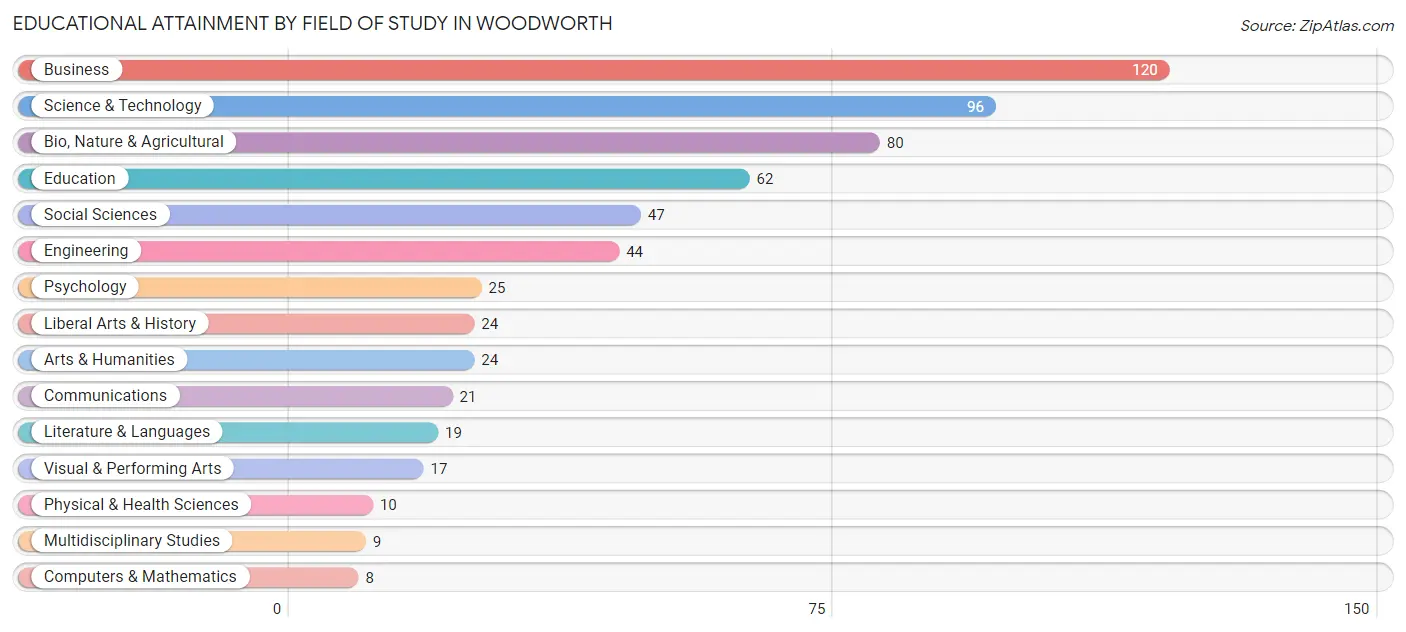
| Field of Study | # Graduates | % Graduates |
| Computers & Mathematics | 8 | 1.3% |
| Bio, Nature & Agricultural | 80 | 13.2% |
| Physical & Health Sciences | 10 | 1.7% |
| Psychology | 25 | 4.1% |
| Social Sciences | 47 | 7.8% |
| Engineering | 44 | 7.3% |
| Multidisciplinary Studies | 9 | 1.5% |
| Science & Technology | 96 | 15.8% |
| Business | 120 | 19.8% |
| Education | 62 | 10.2% |
| Literature & Languages | 19 | 3.1% |
| Liberal Arts & History | 24 | 4.0% |
| Visual & Performing Arts | 17 | 2.8% |
| Communications | 21 | 3.5% |
| Arts & Humanities | 24 | 4.0% |
| Total | 606 | 100.0% |
Transportation & Commute in Woodworth
Vehicle Availability by Sex in Woodworth
The most prevalent vehicle ownership categories in Woodworth are males with 2 vehicles (205, accounting for 42.3%) and females with 2 vehicles (195, making up 33.6%).
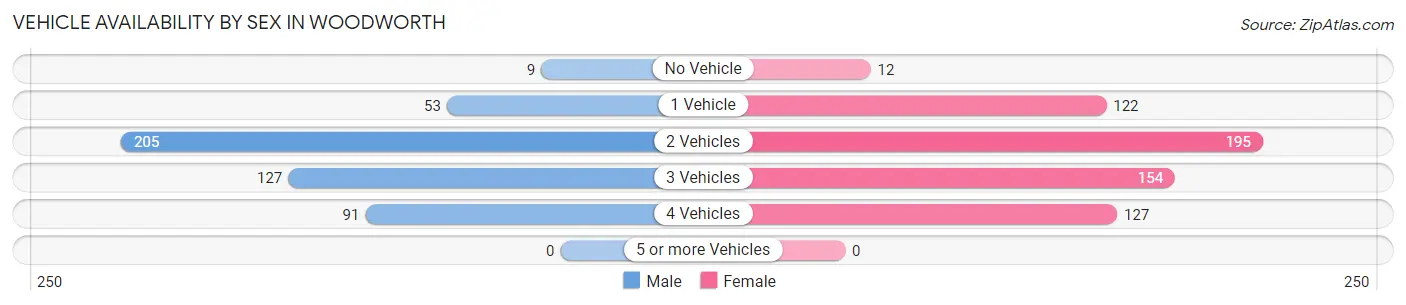
| Vehicles Available | Male | Female |
| No Vehicle | 9 (1.9%) | 12 (2.0%) |
| 1 Vehicle | 53 (10.9%) | 122 (20.0%) |
| 2 Vehicles | 205 (42.3%) | 195 (32.0%) |
| 3 Vehicles | 127 (26.2%) | 154 (25.3%) |
| 4 Vehicles | 91 (18.8%) | 127 (20.8%) |
| 5 or more Vehicles | 0 (0.0%) | 0 (0.0%) |
| Total | 485 (100.0%) | 610 (100.0%) |
Commute Time in Woodworth
The most frequently occuring commute durations in Woodworth are 20 to 24 minutes (312 commuters, 29.2%), 10 to 14 minutes (237 commuters, 22.2%), and 15 to 19 minutes (207 commuters, 19.4%).
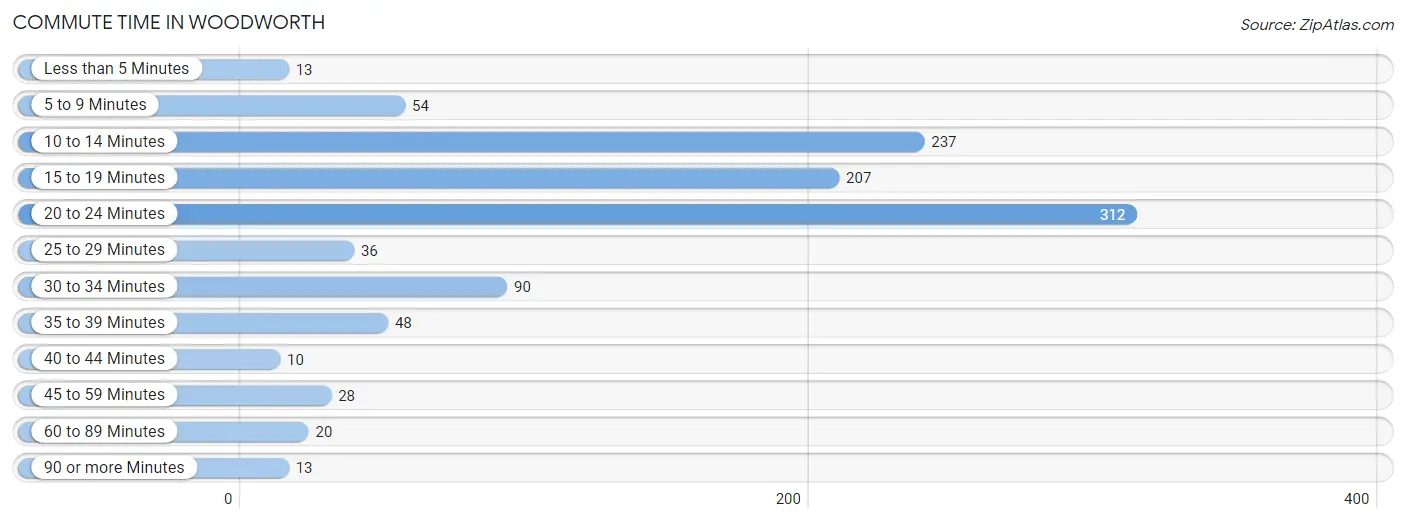
| Commute Time | # Commuters | % Commuters |
| Less than 5 Minutes | 13 | 1.2% |
| 5 to 9 Minutes | 54 | 5.1% |
| 10 to 14 Minutes | 237 | 22.2% |
| 15 to 19 Minutes | 207 | 19.4% |
| 20 to 24 Minutes | 312 | 29.2% |
| 25 to 29 Minutes | 36 | 3.4% |
| 30 to 34 Minutes | 90 | 8.4% |
| 35 to 39 Minutes | 48 | 4.5% |
| 40 to 44 Minutes | 10 | 0.9% |
| 45 to 59 Minutes | 28 | 2.6% |
| 60 to 89 Minutes | 20 | 1.9% |
| 90 or more Minutes | 13 | 1.2% |
Commute Time by Sex in Woodworth
The most common commute times in Woodworth are 20 to 24 minutes (109 commuters, 22.5%) for males and 20 to 24 minutes (203 commuters, 34.8%) for females.
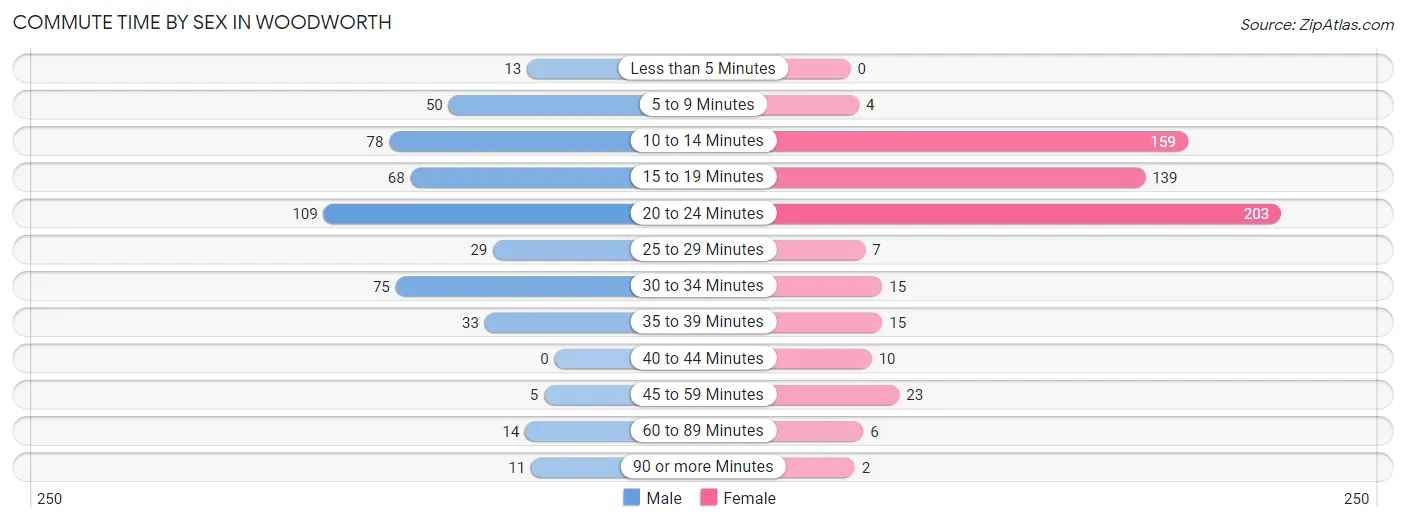
| Commute Time | Male | Female |
| Less than 5 Minutes | 13 (2.7%) | 0 (0.0%) |
| 5 to 9 Minutes | 50 (10.3%) | 4 (0.7%) |
| 10 to 14 Minutes | 78 (16.1%) | 159 (27.3%) |
| 15 to 19 Minutes | 68 (14.0%) | 139 (23.8%) |
| 20 to 24 Minutes | 109 (22.5%) | 203 (34.8%) |
| 25 to 29 Minutes | 29 (6.0%) | 7 (1.2%) |
| 30 to 34 Minutes | 75 (15.5%) | 15 (2.6%) |
| 35 to 39 Minutes | 33 (6.8%) | 15 (2.6%) |
| 40 to 44 Minutes | 0 (0.0%) | 10 (1.7%) |
| 45 to 59 Minutes | 5 (1.0%) | 23 (4.0%) |
| 60 to 89 Minutes | 14 (2.9%) | 6 (1.0%) |
| 90 or more Minutes | 11 (2.3%) | 2 (0.3%) |
Time of Departure to Work by Sex in Woodworth
The most frequent times of departure to work in Woodworth are 6:30 AM to 6:59 AM (100, 20.6%) for males and 7:30 AM to 7:59 AM (156, 26.8%) for females.
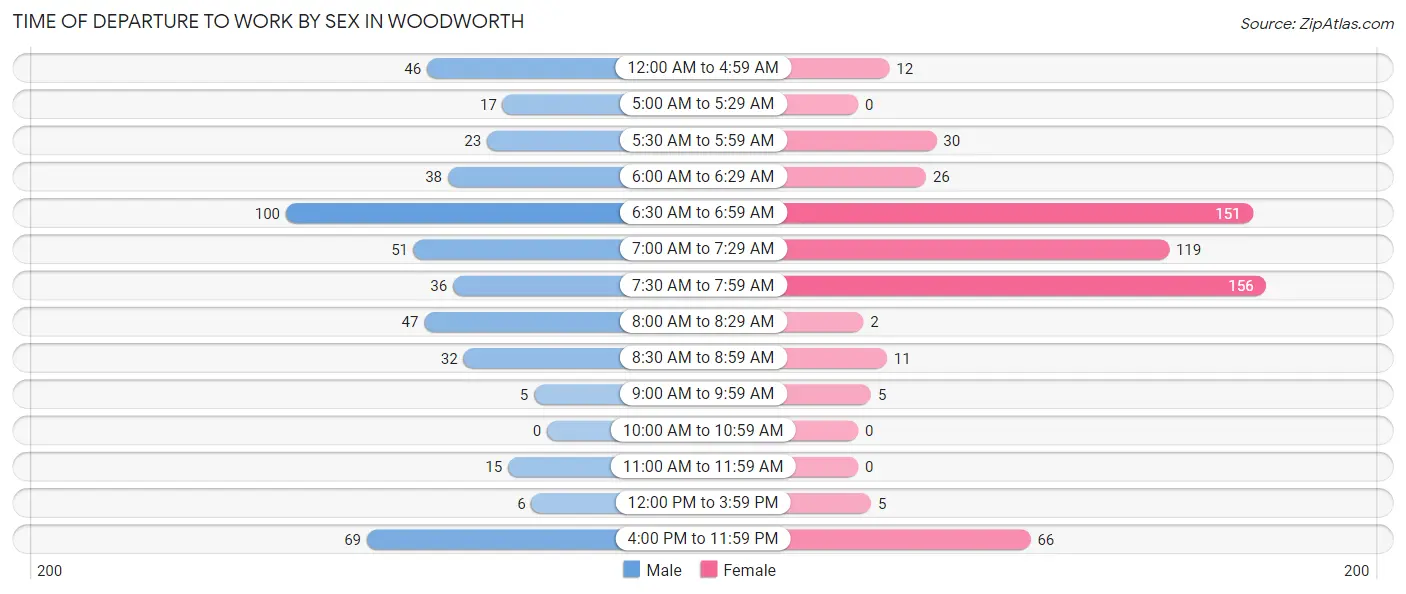
| Time of Departure | Male | Female |
| 12:00 AM to 4:59 AM | 46 (9.5%) | 12 (2.1%) |
| 5:00 AM to 5:29 AM | 17 (3.5%) | 0 (0.0%) |
| 5:30 AM to 5:59 AM | 23 (4.7%) | 30 (5.1%) |
| 6:00 AM to 6:29 AM | 38 (7.8%) | 26 (4.5%) |
| 6:30 AM to 6:59 AM | 100 (20.6%) | 151 (25.9%) |
| 7:00 AM to 7:29 AM | 51 (10.5%) | 119 (20.4%) |
| 7:30 AM to 7:59 AM | 36 (7.4%) | 156 (26.8%) |
| 8:00 AM to 8:29 AM | 47 (9.7%) | 2 (0.3%) |
| 8:30 AM to 8:59 AM | 32 (6.6%) | 11 (1.9%) |
| 9:00 AM to 9:59 AM | 5 (1.0%) | 5 (0.9%) |
| 10:00 AM to 10:59 AM | 0 (0.0%) | 0 (0.0%) |
| 11:00 AM to 11:59 AM | 15 (3.1%) | 0 (0.0%) |
| 12:00 PM to 3:59 PM | 6 (1.2%) | 5 (0.9%) |
| 4:00 PM to 11:59 PM | 69 (14.2%) | 66 (11.3%) |
| Total | 485 (100.0%) | 583 (100.0%) |
Housing Occupancy in Woodworth
Occupancy by Ownership in Woodworth
Of the total 796 dwellings in Woodworth, owner-occupied units account for 613 (77.0%), while renter-occupied units make up 183 (23.0%).
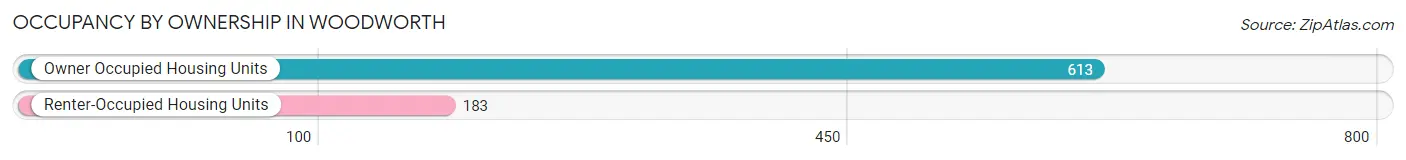
| Occupancy | # Housing Units | % Housing Units |
| Owner Occupied Housing Units | 613 | 77.0% |
| Renter-Occupied Housing Units | 183 | 23.0% |
| Total Occupied Housing Units | 796 | 100.0% |
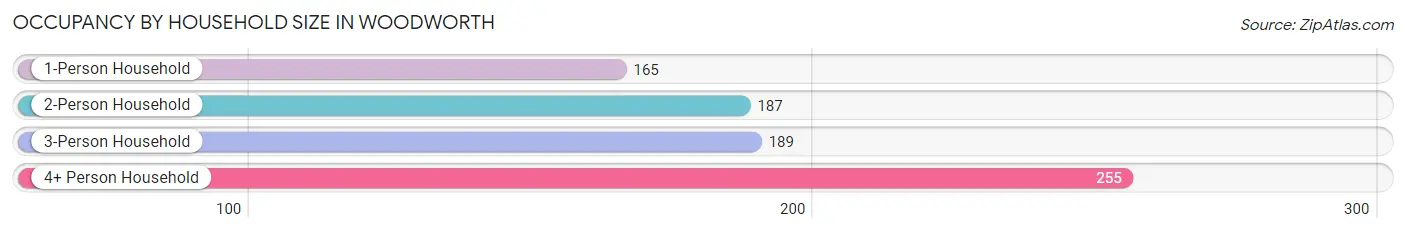
Occupancy by Household Size in Woodworth
| Household Size | # Housing Units | % Housing Units |
| 1-Person Household | 165 | 20.7% |
| 2-Person Household | 187 | 23.5% |
| 3-Person Household | 189 | 23.7% |
| 4+ Person Household | 255 | 32.0% |
| Total Housing Units | 796 | 100.0% |
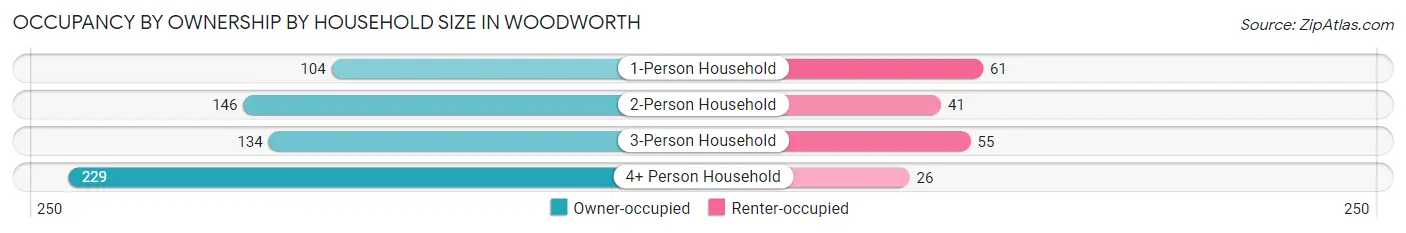
Occupancy by Ownership by Household Size in Woodworth
| Household Size | Owner-occupied | Renter-occupied |
| 1-Person Household | 104 (63.0%) | 61 (37.0%) |
| 2-Person Household | 146 (78.1%) | 41 (21.9%) |
| 3-Person Household | 134 (70.9%) | 55 (29.1%) |
| 4+ Person Household | 229 (89.8%) | 26 (10.2%) |
| Total Housing Units | 613 (77.0%) | 183 (23.0%) |
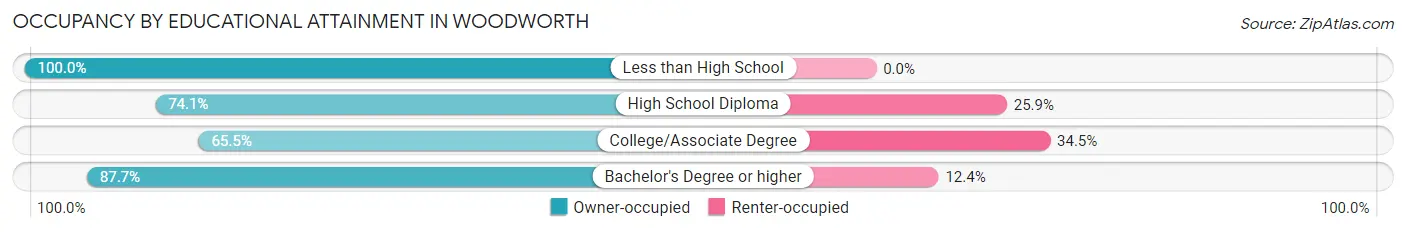
Occupancy by Educational Attainment in Woodworth
| Household Size | Owner-occupied | Renter-occupied |
| Less than High School | 16 (100.0%) | 0 (0.0%) |
| High School Diploma | 123 (74.1%) | 43 (25.9%) |
| College/Associate Degree | 190 (65.5%) | 100 (34.5%) |
| Bachelor's Degree or higher | 284 (87.6%) | 40 (12.3%) |
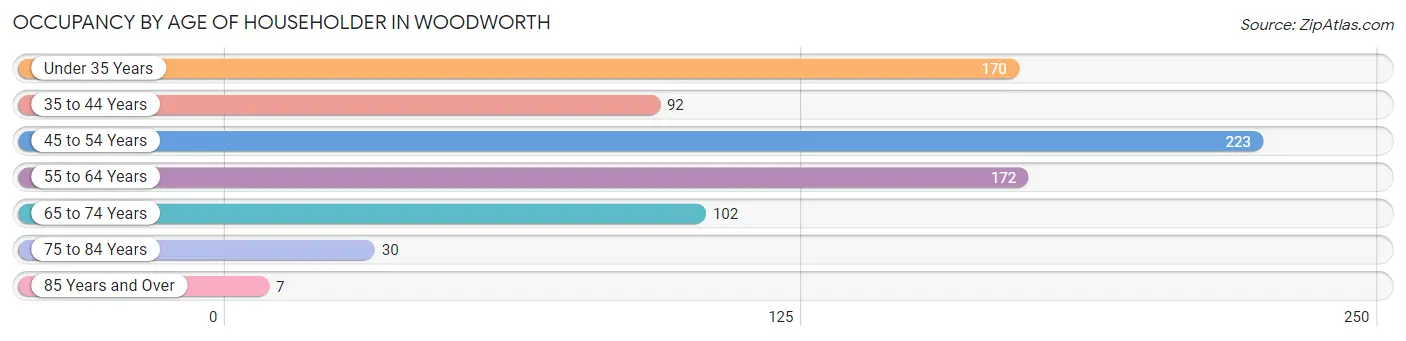
Occupancy by Age of Householder in Woodworth
| Age Bracket | # Households | % Households |
| Under 35 Years | 170 | 21.4% |
| 35 to 44 Years | 92 | 11.6% |
| 45 to 54 Years | 223 | 28.0% |
| 55 to 64 Years | 172 | 21.6% |
| 65 to 74 Years | 102 | 12.8% |
| 75 to 84 Years | 30 | 3.8% |
| 85 Years and Over | 7 | 0.9% |
| Total | 796 | 100.0% |
Housing Finances in Woodworth
Median Income by Occupancy in Woodworth
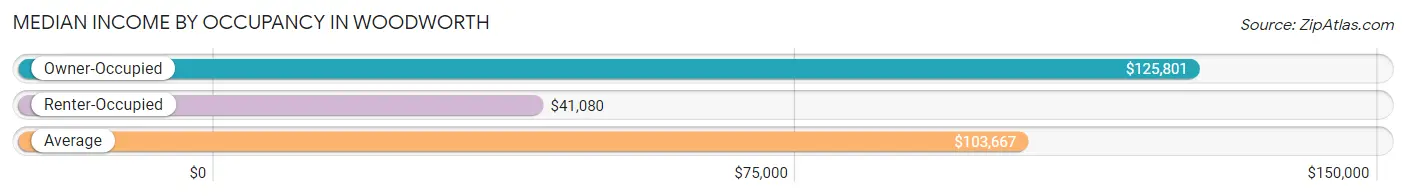
| Occupancy Type | # Households | Median Income |
| Owner-Occupied | 613 (77.0%) | $125,801 |
| Renter-Occupied | 183 (23.0%) | $41,080 |
| Average | 796 (100.0%) | $103,667 |
Occupancy by Householder Income Bracket in Woodworth
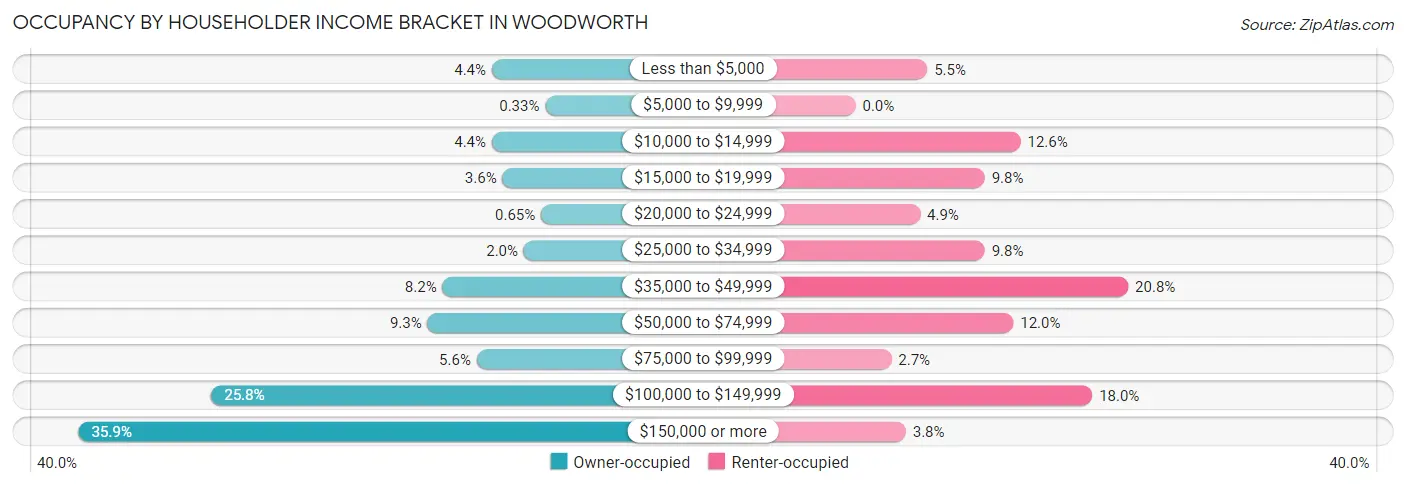
| Income Bracket | Owner-occupied | Renter-occupied |
| Less than $5,000 | 27 (4.4%) | 10 (5.5%) |
| $5,000 to $9,999 | 2 (0.3%) | 0 (0.0%) |
| $10,000 to $14,999 | 27 (4.4%) | 23 (12.6%) |
| $15,000 to $19,999 | 22 (3.6%) | 18 (9.8%) |
| $20,000 to $24,999 | 4 (0.6%) | 9 (4.9%) |
| $25,000 to $34,999 | 12 (2.0%) | 18 (9.8%) |
| $35,000 to $49,999 | 50 (8.2%) | 38 (20.8%) |
| $50,000 to $74,999 | 57 (9.3%) | 22 (12.0%) |
| $75,000 to $99,999 | 34 (5.6%) | 5 (2.7%) |
| $100,000 to $149,999 | 158 (25.8%) | 33 (18.0%) |
| $150,000 or more | 220 (35.9%) | 7 (3.8%) |
| Total | 613 (100.0%) | 183 (100.0%) |
Monthly Housing Cost Tiers in Woodworth
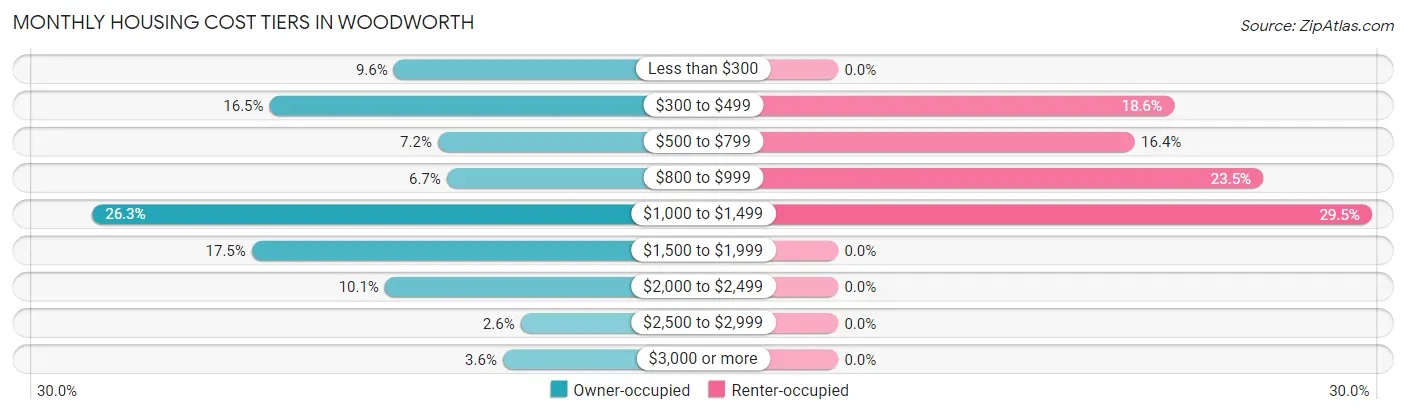
| Monthly Cost | Owner-occupied | Renter-occupied |
| Less than $300 | 59 (9.6%) | 0 (0.0%) |
| $300 to $499 | 101 (16.5%) | 34 (18.6%) |
| $500 to $799 | 44 (7.2%) | 30 (16.4%) |
| $800 to $999 | 41 (6.7%) | 43 (23.5%) |
| $1,000 to $1,499 | 161 (26.3%) | 54 (29.5%) |
| $1,500 to $1,999 | 107 (17.5%) | 0 (0.0%) |
| $2,000 to $2,499 | 62 (10.1%) | 0 (0.0%) |
| $2,500 to $2,999 | 16 (2.6%) | 0 (0.0%) |
| $3,000 or more | 22 (3.6%) | 0 (0.0%) |
| Total | 613 (100.0%) | 183 (100.0%) |
Physical Housing Characteristics in Woodworth
Housing Structures in Woodworth
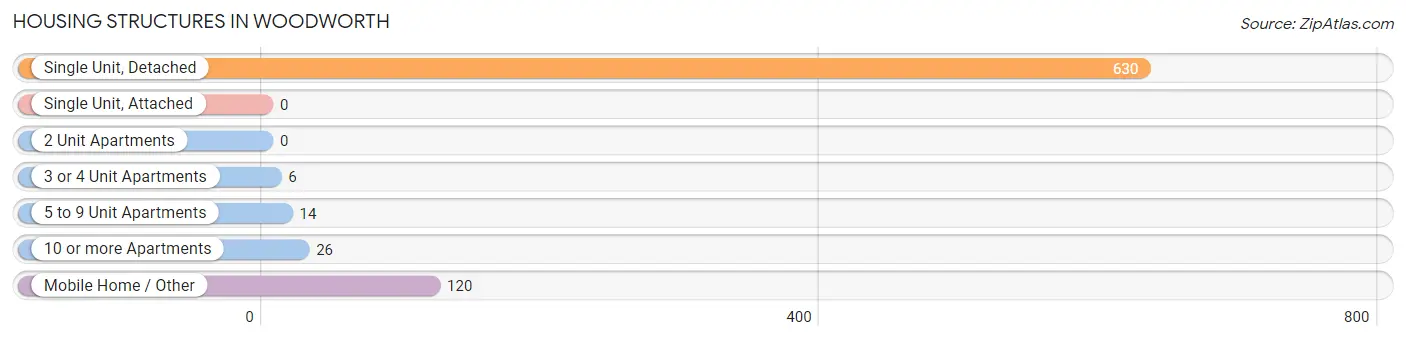
| Structure Type | # Housing Units | % Housing Units |
| Single Unit, Detached | 630 | 79.1% |
| Single Unit, Attached | 0 | 0.0% |
| 2 Unit Apartments | 0 | 0.0% |
| 3 or 4 Unit Apartments | 6 | 0.7% |
| 5 to 9 Unit Apartments | 14 | 1.8% |
| 10 or more Apartments | 26 | 3.3% |
| Mobile Home / Other | 120 | 15.1% |
| Total | 796 | 100.0% |
Housing Structures by Occupancy in Woodworth
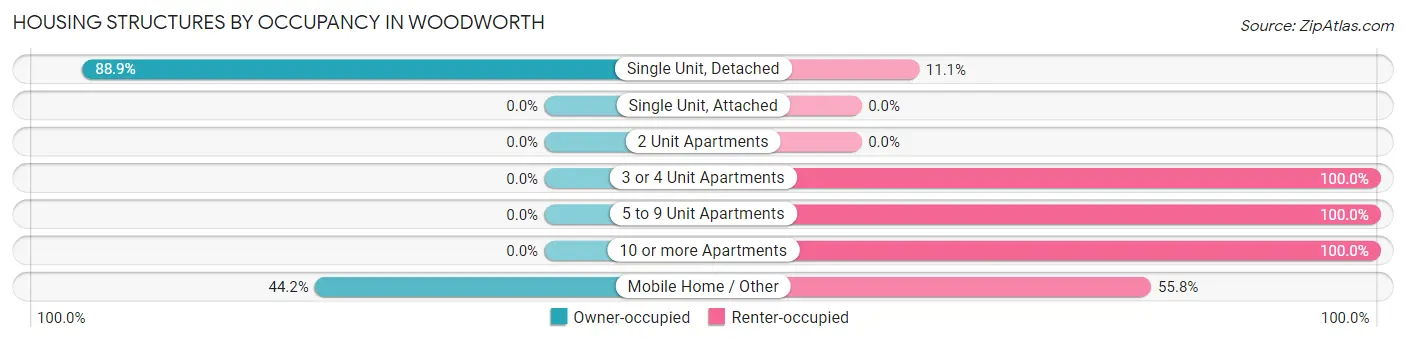
| Structure Type | Owner-occupied | Renter-occupied |
| Single Unit, Detached | 560 (88.9%) | 70 (11.1%) |
| Single Unit, Attached | 0 (0.0%) | 0 (0.0%) |
| 2 Unit Apartments | 0 (0.0%) | 0 (0.0%) |
| 3 or 4 Unit Apartments | 0 (0.0%) | 6 (100.0%) |
| 5 to 9 Unit Apartments | 0 (0.0%) | 14 (100.0%) |
| 10 or more Apartments | 0 (0.0%) | 26 (100.0%) |
| Mobile Home / Other | 53 (44.2%) | 67 (55.8%) |
| Total | 613 (77.0%) | 183 (23.0%) |
Housing Structures by Number of Rooms in Woodworth
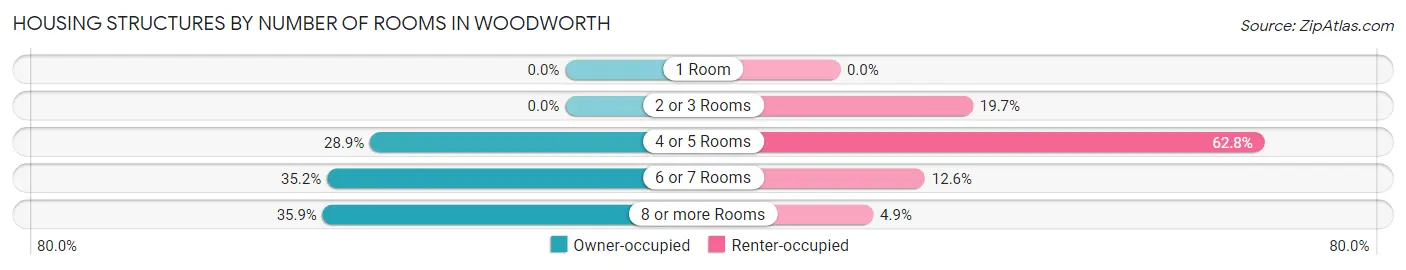
| Number of Rooms | Owner-occupied | Renter-occupied |
| 1 Room | 0 (0.0%) | 0 (0.0%) |
| 2 or 3 Rooms | 0 (0.0%) | 36 (19.7%) |
| 4 or 5 Rooms | 177 (28.9%) | 115 (62.8%) |
| 6 or 7 Rooms | 216 (35.2%) | 23 (12.6%) |
| 8 or more Rooms | 220 (35.9%) | 9 (4.9%) |
| Total | 613 (100.0%) | 183 (100.0%) |
Housing Structure by Heating Type in Woodworth
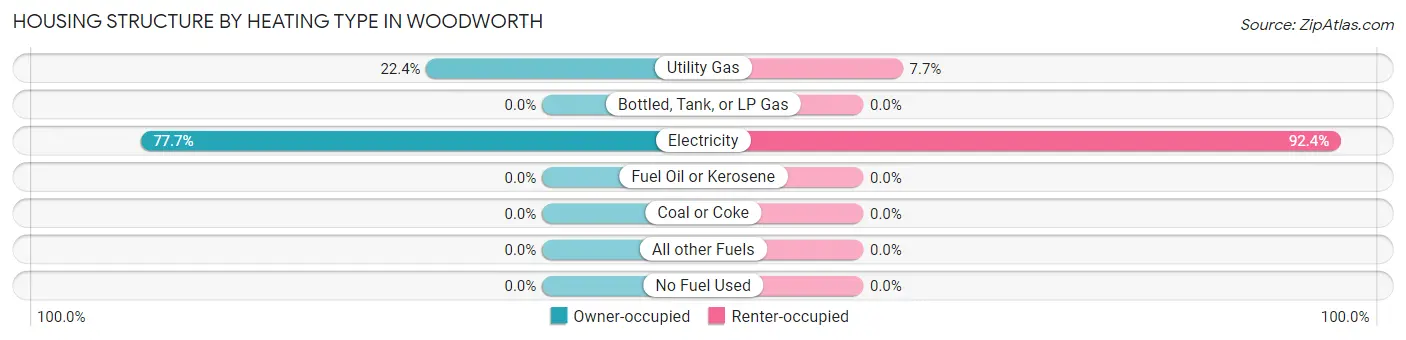
| Heating Type | Owner-occupied | Renter-occupied |
| Utility Gas | 137 (22.4%) | 14 (7.6%) |
| Bottled, Tank, or LP Gas | 0 (0.0%) | 0 (0.0%) |
| Electricity | 476 (77.6%) | 169 (92.3%) |
| Fuel Oil or Kerosene | 0 (0.0%) | 0 (0.0%) |
| Coal or Coke | 0 (0.0%) | 0 (0.0%) |
| All other Fuels | 0 (0.0%) | 0 (0.0%) |
| No Fuel Used | 0 (0.0%) | 0 (0.0%) |
| Total | 613 (100.0%) | 183 (100.0%) |
Household Vehicle Usage in Woodworth
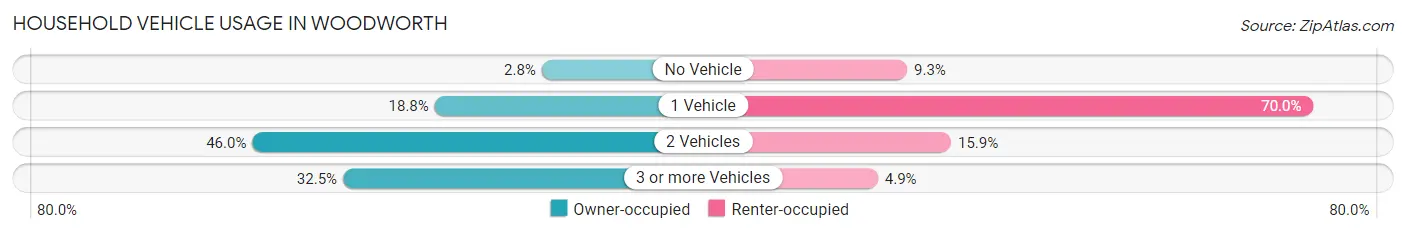
| Vehicles per Household | Owner-occupied | Renter-occupied |
| No Vehicle | 17 (2.8%) | 17 (9.3%) |
| 1 Vehicle | 115 (18.8%) | 128 (70.0%) |
| 2 Vehicles | 282 (46.0%) | 29 (15.9%) |
| 3 or more Vehicles | 199 (32.5%) | 9 (4.9%) |
| Total | 613 (100.0%) | 183 (100.0%) |
Real Estate & Mortgages in Woodworth
Real Estate and Mortgage Overview in Woodworth
| Characteristic | Without Mortgage | With Mortgage |
| Housing Units | 246 | 367 |
| Median Property Value | $139,100 | $321,800 |
| Median Household Income | $125,641 | $145 |
| Monthly Housing Costs | $405 | $22 |
| Real Estate Taxes | - | - |
Property Value by Mortgage Status in Woodworth
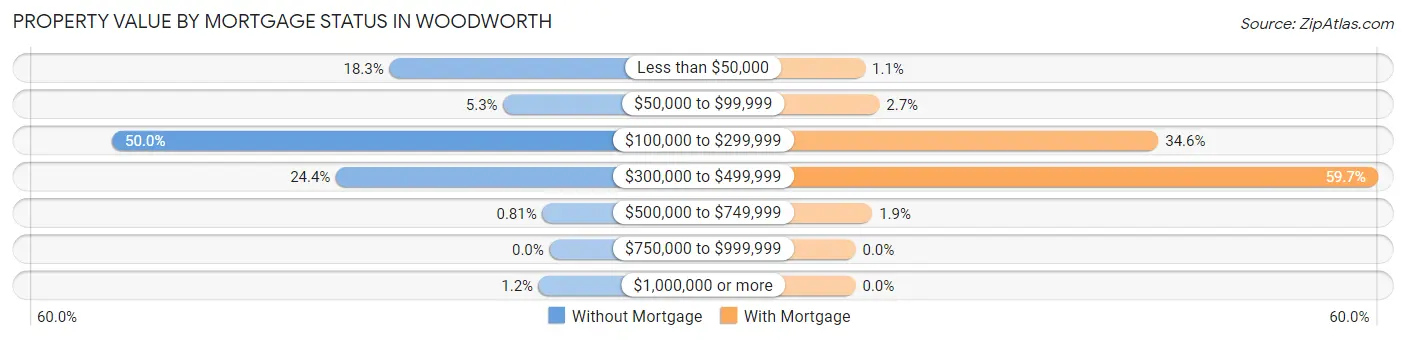
| Property Value | Without Mortgage | With Mortgage |
| Less than $50,000 | 45 (18.3%) | 4 (1.1%) |
| $50,000 to $99,999 | 13 (5.3%) | 10 (2.7%) |
| $100,000 to $299,999 | 123 (50.0%) | 127 (34.6%) |
| $300,000 to $499,999 | 60 (24.4%) | 219 (59.7%) |
| $500,000 to $749,999 | 2 (0.8%) | 7 (1.9%) |
| $750,000 to $999,999 | 0 (0.0%) | 0 (0.0%) |
| $1,000,000 or more | 3 (1.2%) | 0 (0.0%) |
| Total | 246 (100.0%) | 367 (100.0%) |
Household Income by Mortgage Status in Woodworth
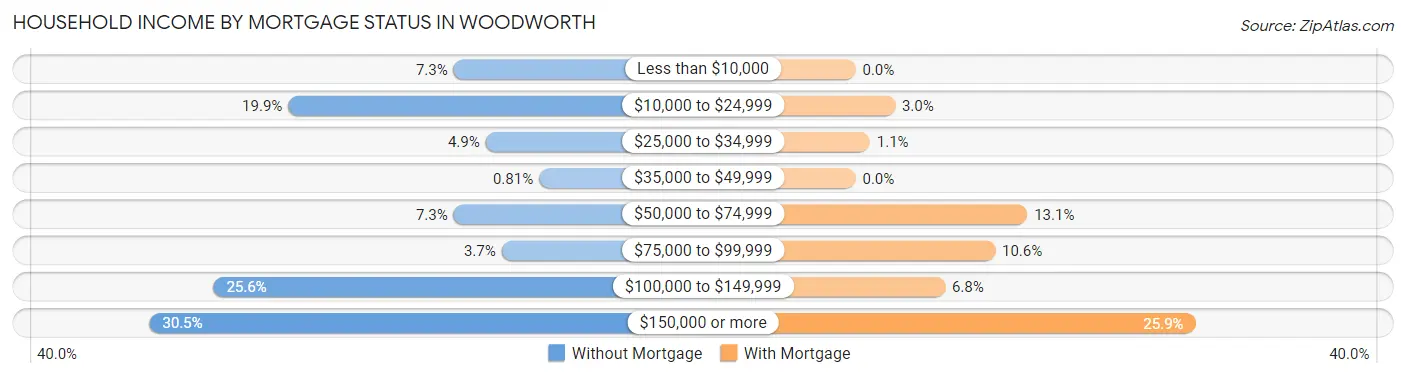
| Household Income | Without Mortgage | With Mortgage |
| Less than $10,000 | 18 (7.3%) | 0 (0.0%) |
| $10,000 to $24,999 | 49 (19.9%) | 11 (3.0%) |
| $25,000 to $34,999 | 12 (4.9%) | 4 (1.1%) |
| $35,000 to $49,999 | 2 (0.8%) | 0 (0.0%) |
| $50,000 to $74,999 | 18 (7.3%) | 48 (13.1%) |
| $75,000 to $99,999 | 9 (3.7%) | 39 (10.6%) |
| $100,000 to $149,999 | 63 (25.6%) | 25 (6.8%) |
| $150,000 or more | 75 (30.5%) | 95 (25.9%) |
| Total | 246 (100.0%) | 367 (100.0%) |
Property Value to Household Income Ratio in Woodworth
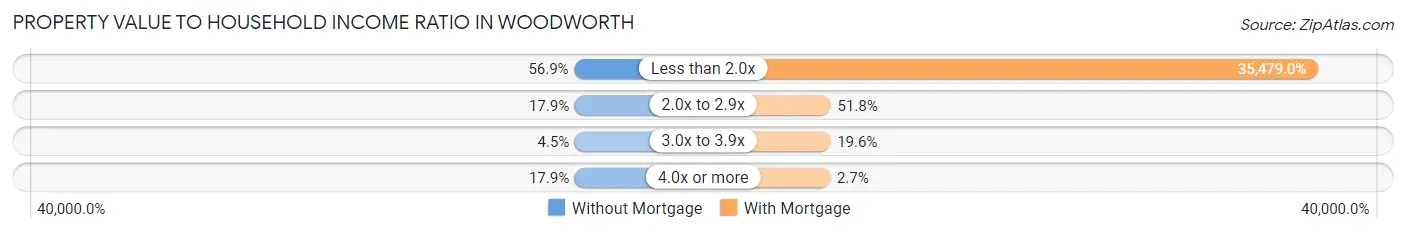
| Value-to-Income Ratio | Without Mortgage | With Mortgage |
| Less than 2.0x | 140 (56.9%) | 130,208 (35,479.0%) |
| 2.0x to 2.9x | 44 (17.9%) | 190 (51.8%) |
| 3.0x to 3.9x | 11 (4.5%) | 72 (19.6%) |
| 4.0x or more | 44 (17.9%) | 10 (2.7%) |
| Total | 246 (100.0%) | 367 (100.0%) |
Real Estate Taxes by Mortgage Status in Woodworth
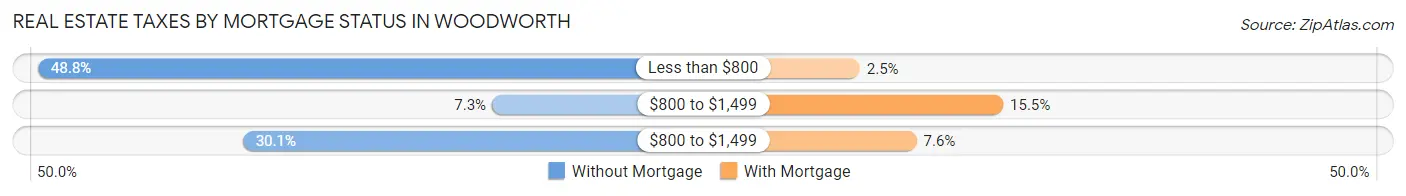
| Property Taxes | Without Mortgage | With Mortgage |
| Less than $800 | 120 (48.8%) | 9 (2.5%) |
| $800 to $1,499 | 18 (7.3%) | 57 (15.5%) |
| $800 to $1,499 | 74 (30.1%) | 28 (7.6%) |
| Total | 246 (100.0%) | 367 (100.0%) |
Health & Disability in Woodworth
Health Insurance Coverage by Age in Woodworth
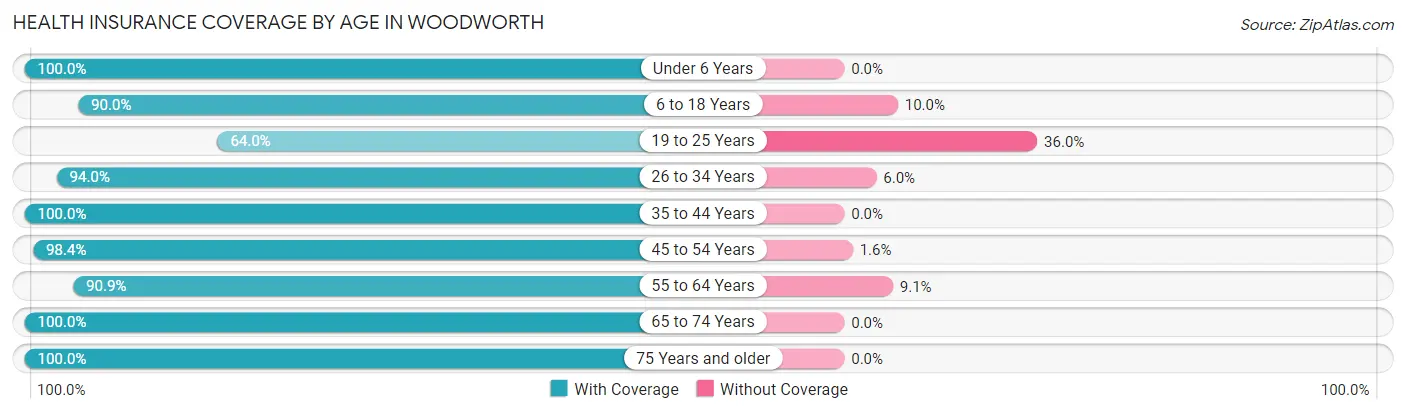
| Age Bracket | With Coverage | Without Coverage |
| Under 6 Years | 283 (100.0%) | 0 (0.0%) |
| 6 to 18 Years | 487 (90.0%) | 54 (10.0%) |
| 19 to 25 Years | 162 (64.0%) | 91 (36.0%) |
| 26 to 34 Years | 283 (94.0%) | 18 (6.0%) |
| 35 to 44 Years | 164 (100.0%) | 0 (0.0%) |
| 45 to 54 Years | 376 (98.4%) | 6 (1.6%) |
| 55 to 64 Years | 251 (90.9%) | 25 (9.1%) |
| 65 to 74 Years | 142 (100.0%) | 0 (0.0%) |
| 75 Years and older | 64 (100.0%) | 0 (0.0%) |
| Total | 2,212 (91.9%) | 194 (8.1%) |
Health Insurance Coverage by Citizenship Status in Woodworth
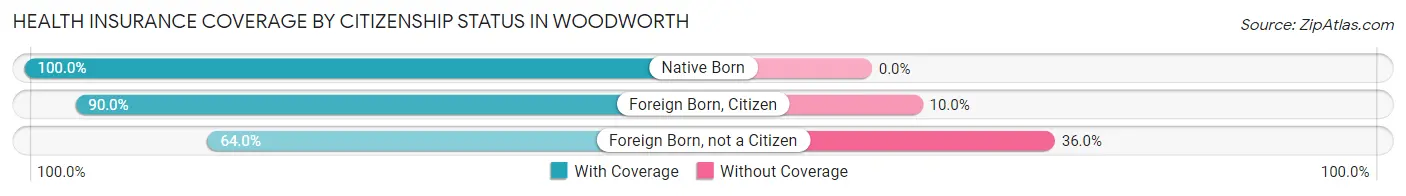
| Citizenship Status | With Coverage | Without Coverage |
| Native Born | 283 (100.0%) | 0 (0.0%) |
| Foreign Born, Citizen | 487 (90.0%) | 54 (10.0%) |
| Foreign Born, not a Citizen | 162 (64.0%) | 91 (36.0%) |
Health Insurance Coverage by Household Income in Woodworth
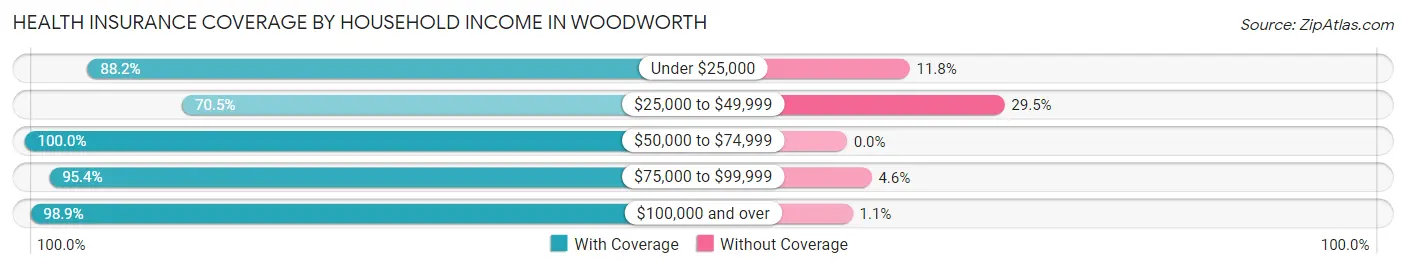
| Household Income | With Coverage | Without Coverage |
| Under $25,000 | 210 (88.2%) | 28 (11.8%) |
| $25,000 to $49,999 | 346 (70.5%) | 145 (29.5%) |
| $50,000 to $74,999 | 145 (100.0%) | 0 (0.0%) |
| $75,000 to $99,999 | 124 (95.4%) | 6 (4.6%) |
| $100,000 and over | 1,379 (98.9%) | 15 (1.1%) |
Public vs Private Health Insurance Coverage by Age in Woodworth
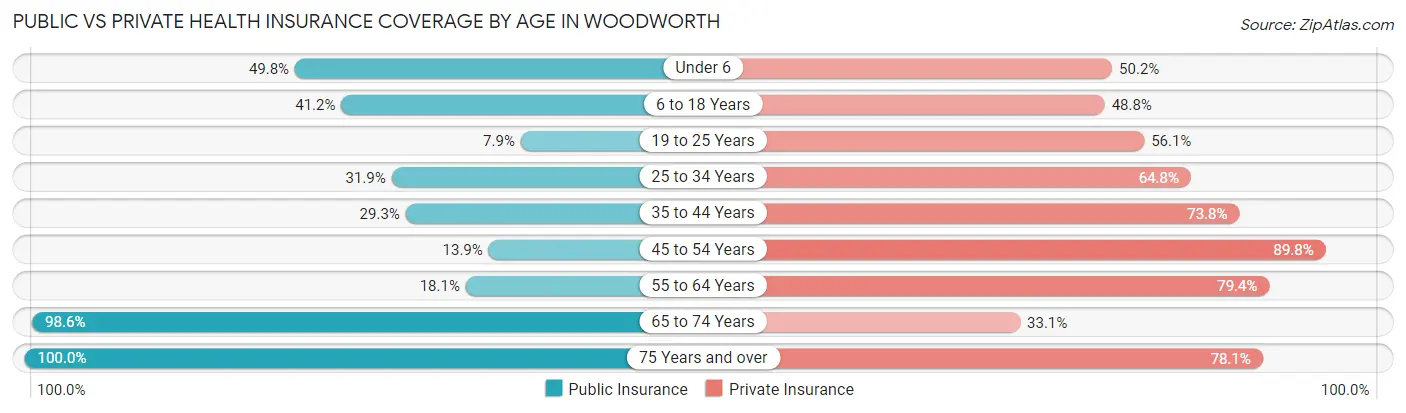
| Age Bracket | Public Insurance | Private Insurance |
| Under 6 | 141 (49.8%) | 142 (50.2%) |
| 6 to 18 Years | 223 (41.2%) | 264 (48.8%) |
| 19 to 25 Years | 20 (7.9%) | 142 (56.1%) |
| 25 to 34 Years | 96 (31.9%) | 195 (64.8%) |
| 35 to 44 Years | 48 (29.3%) | 121 (73.8%) |
| 45 to 54 Years | 53 (13.9%) | 343 (89.8%) |
| 55 to 64 Years | 50 (18.1%) | 219 (79.3%) |
| 65 to 74 Years | 140 (98.6%) | 47 (33.1%) |
| 75 Years and over | 64 (100.0%) | 50 (78.1%) |
| Total | 835 (34.7%) | 1,523 (63.3%) |
Disability Status by Sex by Age in Woodworth
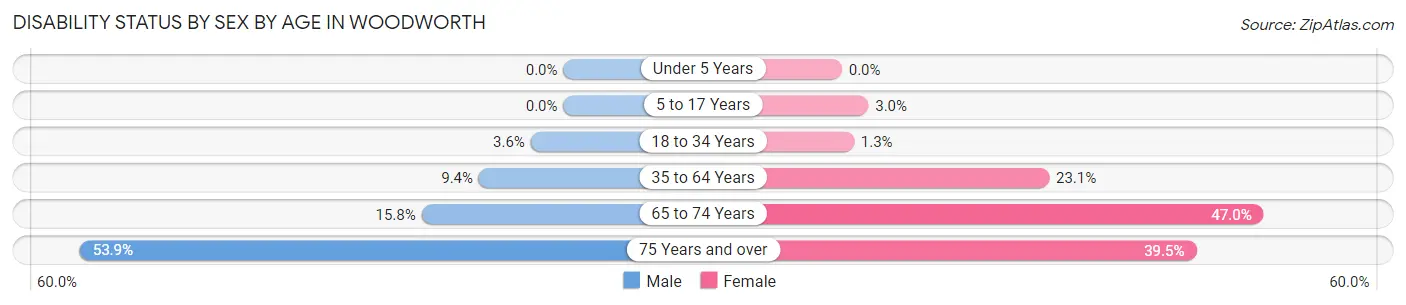
| Age Bracket | Male | Female |
| Under 5 Years | 0 (0.0%) | 0 (0.0%) |
| 5 to 17 Years | 0 (0.0%) | 9 (2.9%) |
| 18 to 34 Years | 8 (3.6%) | 5 (1.3%) |
| 35 to 64 Years | 37 (9.4%) | 99 (23.1%) |
| 65 to 74 Years | 12 (15.8%) | 31 (47.0%) |
| 75 Years and over | 14 (53.8%) | 15 (39.5%) |
Disability Class by Sex by Age in Woodworth
Disability Class: Hearing Difficulty
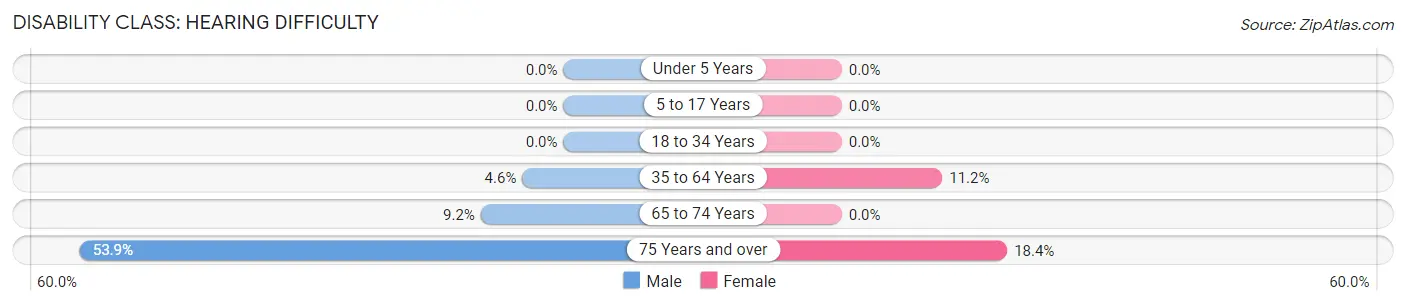
| Age Bracket | Male | Female |
| Under 5 Years | 0 (0.0%) | 0 (0.0%) |
| 5 to 17 Years | 0 (0.0%) | 0 (0.0%) |
| 18 to 34 Years | 0 (0.0%) | 0 (0.0%) |
| 35 to 64 Years | 18 (4.6%) | 48 (11.2%) |
| 65 to 74 Years | 7 (9.2%) | 0 (0.0%) |
| 75 Years and over | 14 (53.8%) | 7 (18.4%) |
Disability Class: Vision Difficulty
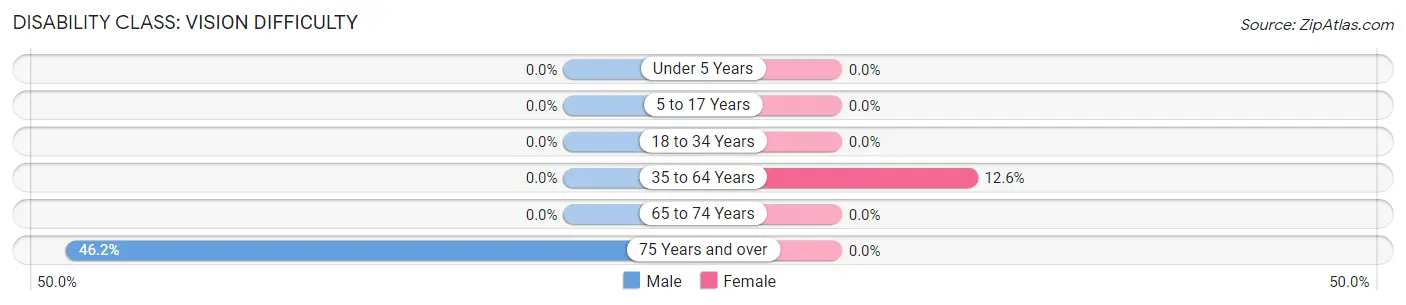
| Age Bracket | Male | Female |
| Under 5 Years | 0 (0.0%) | 0 (0.0%) |
| 5 to 17 Years | 0 (0.0%) | 0 (0.0%) |
| 18 to 34 Years | 0 (0.0%) | 0 (0.0%) |
| 35 to 64 Years | 0 (0.0%) | 54 (12.6%) |
| 65 to 74 Years | 0 (0.0%) | 0 (0.0%) |
| 75 Years and over | 12 (46.2%) | 0 (0.0%) |
Disability Class: Cognitive Difficulty
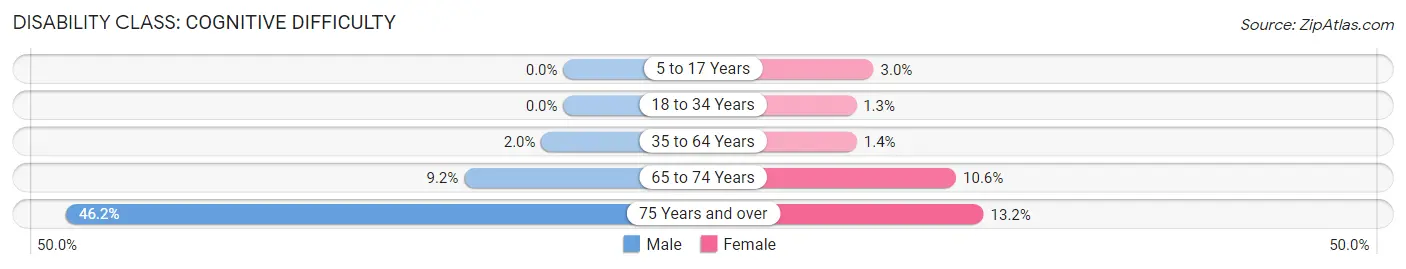
| Age Bracket | Male | Female |
| 5 to 17 Years | 0 (0.0%) | 9 (2.9%) |
| 18 to 34 Years | 0 (0.0%) | 5 (1.3%) |
| 35 to 64 Years | 8 (2.0%) | 6 (1.4%) |
| 65 to 74 Years | 7 (9.2%) | 7 (10.6%) |
| 75 Years and over | 12 (46.2%) | 5 (13.2%) |
Disability Class: Ambulatory Difficulty
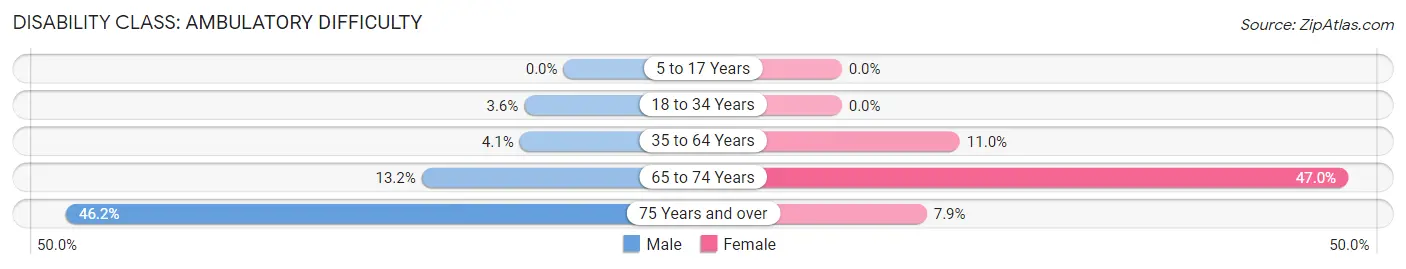
| Age Bracket | Male | Female |
| 5 to 17 Years | 0 (0.0%) | 0 (0.0%) |
| 18 to 34 Years | 8 (3.6%) | 0 (0.0%) |
| 35 to 64 Years | 16 (4.1%) | 47 (11.0%) |
| 65 to 74 Years | 10 (13.2%) | 31 (47.0%) |
| 75 Years and over | 12 (46.2%) | 3 (7.9%) |
Disability Class: Self-Care Difficulty
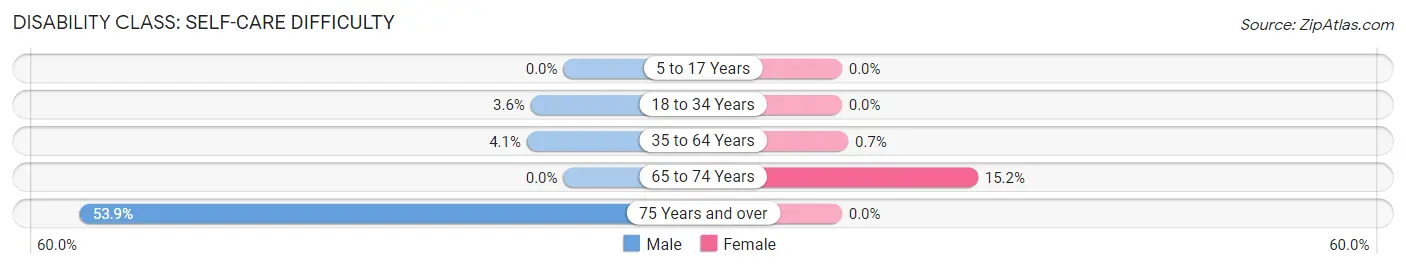
| Age Bracket | Male | Female |
| 5 to 17 Years | 0 (0.0%) | 0 (0.0%) |
| 18 to 34 Years | 8 (3.6%) | 0 (0.0%) |
| 35 to 64 Years | 16 (4.1%) | 3 (0.7%) |
| 65 to 74 Years | 0 (0.0%) | 10 (15.1%) |
| 75 Years and over | 14 (53.8%) | 0 (0.0%) |
Technology Access in Woodworth
Computing Device Access in Woodworth
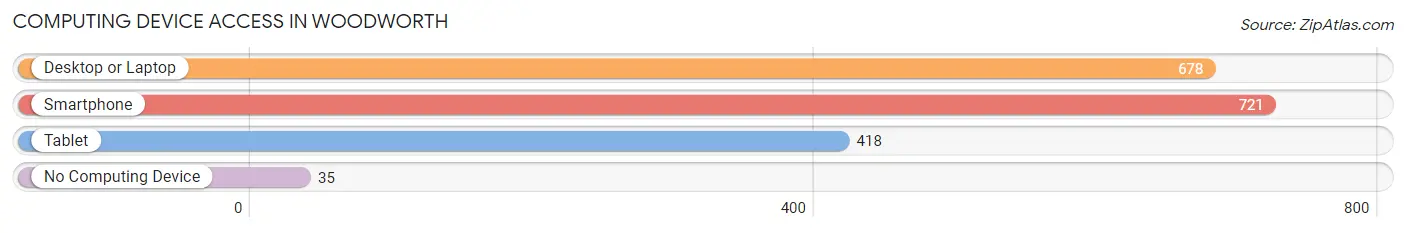
| Device Type | # Households | % Households |
| Desktop or Laptop | 678 | 85.2% |
| Smartphone | 721 | 90.6% |
| Tablet | 418 | 52.5% |
| No Computing Device | 35 | 4.4% |
| Total | 796 | 100.0% |
Internet Access in Woodworth
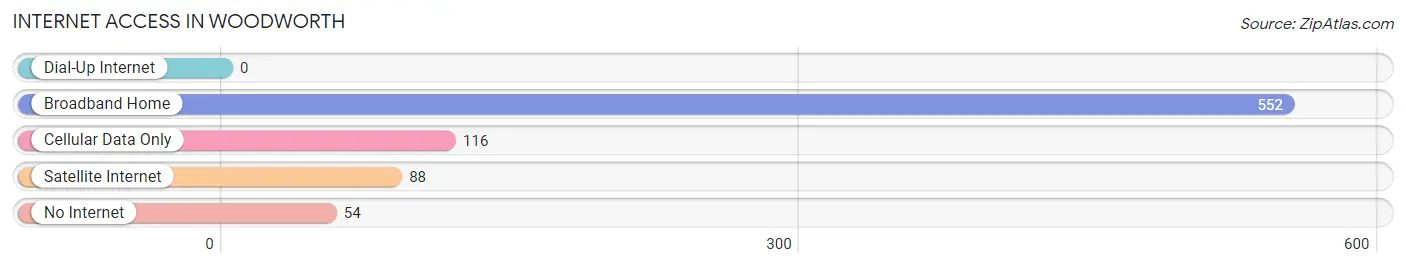
| Internet Type | # Households | % Households |
| Dial-Up Internet | 0 | 0.0% |
| Broadband Home | 552 | 69.4% |
| Cellular Data Only | 116 | 14.6% |
| Satellite Internet | 88 | 11.1% |
| No Internet | 54 | 6.8% |
| Total | 796 | 100.0% |
Woodworth Summary
Woodworth is a small town located in Rapides Parish, Louisiana. It is situated in the heart of the Red River Valley, approximately 10 miles south of Alexandria. The town was founded in 1883 and has a population of approximately 1,500 people.
Geography
Woodworth is located in the Red River Valley, which is a flat, alluvial plain that stretches from the Mississippi River to the Sabine River. The town is situated on the banks of the Red River, which is the main source of water for the area. The town is surrounded by agricultural land, with cotton, corn, and soybeans being the main crops. The town is also home to a variety of wildlife, including deer, wild turkeys, and waterfowl.
Economy
Woodworth’s economy is largely based on agriculture. The town is home to several large farms, which produce cotton, corn, and soybeans. The town also has a number of small businesses, including a grocery store, a hardware store, and a few restaurants. The town is also home to a number of small manufacturing companies, which produce a variety of products, including furniture, clothing, and electronics.
Demographics
Woodworth is a predominantly white town, with approximately 90% of the population being Caucasian. The remaining 10% of the population is made up of African Americans, Hispanics, and Native Americans. The median household income in Woodworth is approximately $35,000, which is slightly lower than the national average. The town has a low unemployment rate, with only 4.5% of the population being unemployed.
Education
Woodworth is served by the Rapides Parish School District, which operates two elementary schools, one middle school, and one high school. The town also has a number of private schools, including a Catholic school and a Christian school. The town is also home to a branch of Louisiana State University, which offers a variety of degree programs.
Conclusion
Woodworth is a small town located in Rapides Parish, Louisiana. It is situated in the heart of the Red River Valley and is home to approximately 1,500 people. The town’s economy is largely based on agriculture, with cotton, corn, and soybeans being the main crops. The town is also home to a number of small businesses and manufacturing companies. The town is predominantly white, with approximately 90% of the population being Caucasian. The town is served by the Rapides Parish School District and is home to a branch of Louisiana State University.
Common Questions
What is the Total Population of Woodworth?
Total Population of Woodworth is 2,406.
What is the Total Male Population of Woodworth?
Total Male Population of Woodworth is 1,073.
What is the Total Female Population of Woodworth?
Total Female Population of Woodworth is 1,333.
What is the Ratio of Males per 100 Females in Woodworth?
There are 80.50 Males per 100 Females in Woodworth.
What is the Ratio of Females per 100 Males in Woodworth?
There are 124.23 Females per 100 Males in Woodworth.
What is the Median Population Age in Woodworth?
Median Population Age in Woodworth is 29.3 Years.
What is the Average Family Size in Woodworth
Average Family Size in Woodworth is 3.6 People.
What is the Average Household Size in Woodworth
Average Household Size in Woodworth is 3.0 People.
What is Per Capita Income in Woodworth?
Per Capita income in Woodworth is $37,606.
What is the Median Family Income in Woodworth?
Median Family Income in Woodworth is $126,090.
What is the Median Household income in Woodworth?
Median Household Income in Woodworth is $103,667.
What is Income or Wage Gap in Woodworth?
Income or Wage Gap in Woodworth is 13.3%.
Women in Woodworth earn 86.7 cents for every dollar earned by a man.
What is Family Income Deficit in Woodworth?
Family Income Deficit in Woodworth is $6,178.
Families that are below poverty line in Woodworth earn $6,178 less on average than the poverty threshold level.
What is Inequality or Gini Index in Woodworth?
Inequality or Gini Index in Woodworth is 0.44.
How Large is the Labor Force in Woodworth?
There are 1,172 People in the Labor Forcein in Woodworth.
What is the Percentage of People in the Labor Force in Woodworth?
66.0% of People are in the Labor Force in Woodworth.
What is the Unemployment Rate in Woodworth?
Unemployment Rate in Woodworth is 3.6%.