St Francisville, LA
St Francisville Map
St Francisville Overview
1,724
TOTAL POPULATION
915
MALE POPULATION
809
FEMALE POPULATION
113.10
MALES / 100 FEMALES
88.42
FEMALES / 100 MALES
41.7
MEDIAN AGE
4.5
AVG FAMILY SIZE
2.9
AVG HOUSEHOLD SIZE
$25,169
PER CAPITA INCOME
$75,268
AVG FAMILY INCOME
$46,681
AVG HOUSEHOLD INCOME
25.6%
WAGE / INCOME GAP [ % ]
74.4¢/ $1
WAGE / INCOME GAP [ $ ]
0.48
INEQUALITY / GINI INDEX
772
LABOR FORCE [ PEOPLE ]
57.8%
PERCENT IN LABOR FORCE
24.7%
UNEMPLOYMENT RATE
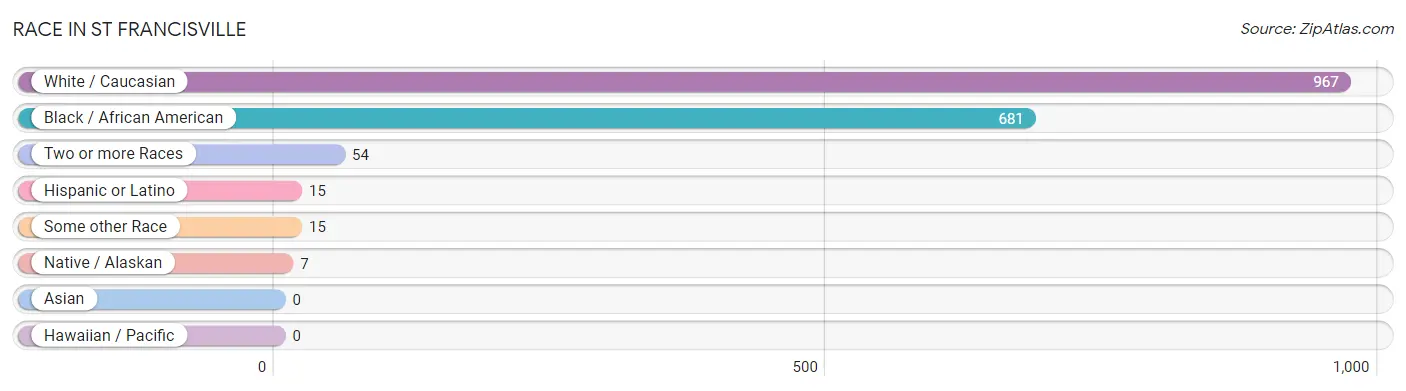
Race in St Francisville
The most populous races in St Francisville are White / Caucasian (967 | 56.1%), Black / African American (681 | 39.5%), and Two or more Races (54 | 3.1%).
| Race | # Population | % Population |
| Asian | 0 | 0.0% |
| Black / African American | 681 | 39.5% |
| Hawaiian / Pacific | 0 | 0.0% |
| Hispanic or Latino | 15 | 0.9% |
| Native / Alaskan | 7 | 0.4% |
| White / Caucasian | 967 | 56.1% |
| Two or more Races | 54 | 3.1% |
| Some other Race | 15 | 0.9% |
| Total | 1,724 | 100.0% |
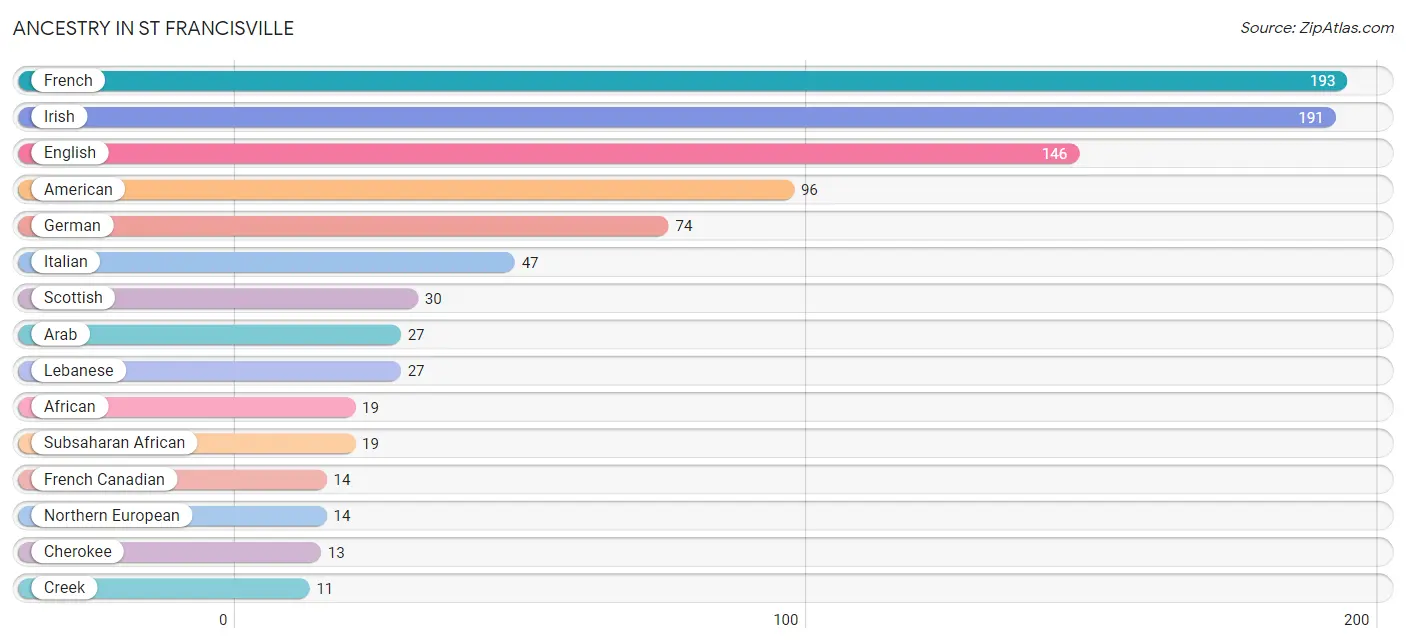
Ancestry in St Francisville
The most populous ancestries reported in St Francisville are French (193 | 11.2%), Irish (191 | 11.1%), English (146 | 8.5%), American (96 | 5.6%), and German (74 | 4.3%), together accounting for 40.6% of all St Francisville residents.
| Ancestry | # Population | % Population |
| African | 19 | 1.1% |
| American | 96 | 5.6% |
| Arab | 27 | 1.6% |
| British | 2 | 0.1% |
| Cajun | 3 | 0.2% |
| Cherokee | 13 | 0.7% |
| Creek | 11 | 0.6% |
| English | 146 | 8.5% |
| European | 9 | 0.5% |
| French | 193 | 11.2% |
| French Canadian | 14 | 0.8% |
| German | 74 | 4.3% |
| Indian (Asian) | 8 | 0.5% |
| Irish | 191 | 11.1% |
| Italian | 47 | 2.7% |
| Lebanese | 27 | 1.6% |
| Mexican | 5 | 0.3% |
| Northern European | 14 | 0.8% |
| Scottish | 30 | 1.7% |
| Subsaharan African | 19 | 1.1% | View All 20 Rows |
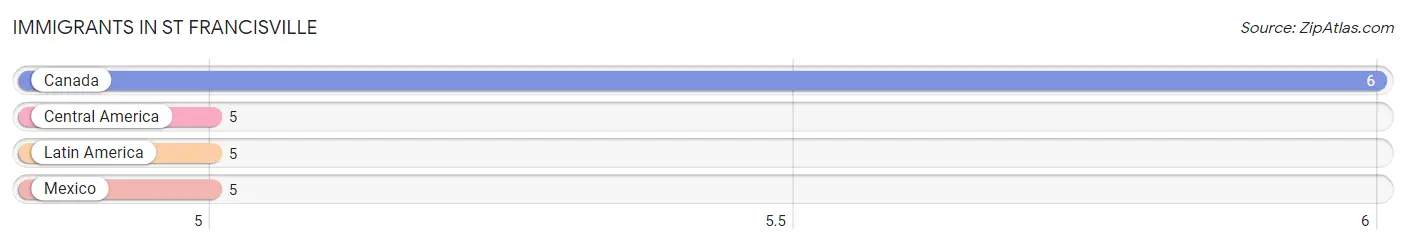
Immigrants in St Francisville
The most numerous immigrant groups reported in St Francisville came from Canada (6 | 0.4%), Central America (5 | 0.3%), Latin America (5 | 0.3%), and Mexico (5 | 0.3%), together accounting for 1.2% of all St Francisville residents.
| Immigration Origin | # Population | % Population |
| Canada | 6 | 0.4% |
| Central America | 5 | 0.3% |
| Latin America | 5 | 0.3% |
| Mexico | 5 | 0.3% | View All 4 Rows |
Sex and Age in St Francisville
Sex and Age in St Francisville
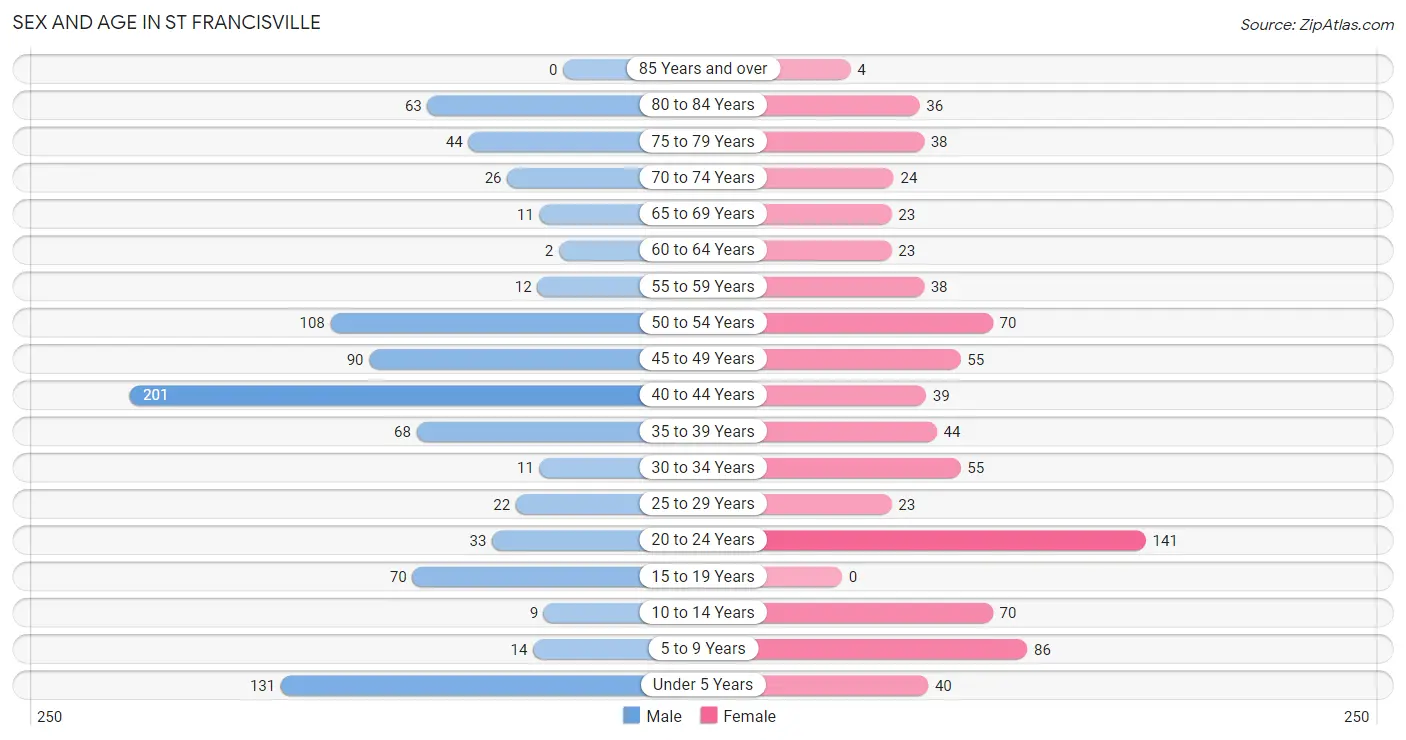
The most populous age groups in St Francisville are 40 to 44 Years (201 | 22.0%) for men and 20 to 24 Years (141 | 17.4%) for women.
| Age Bracket | Male | Female |
| Under 5 Years | 131 (14.3%) | 40 (4.9%) |
| 5 to 9 Years | 14 (1.5%) | 86 (10.6%) |
| 10 to 14 Years | 9 (1.0%) | 70 (8.6%) |
| 15 to 19 Years | 70 (7.6%) | 0 (0.0%) |
| 20 to 24 Years | 33 (3.6%) | 141 (17.4%) |
| 25 to 29 Years | 22 (2.4%) | 23 (2.8%) |
| 30 to 34 Years | 11 (1.2%) | 55 (6.8%) |
| 35 to 39 Years | 68 (7.4%) | 44 (5.4%) |
| 40 to 44 Years | 201 (22.0%) | 39 (4.8%) |
| 45 to 49 Years | 90 (9.8%) | 55 (6.8%) |
| 50 to 54 Years | 108 (11.8%) | 70 (8.6%) |
| 55 to 59 Years | 12 (1.3%) | 38 (4.7%) |
| 60 to 64 Years | 2 (0.2%) | 23 (2.8%) |
| 65 to 69 Years | 11 (1.2%) | 23 (2.8%) |
| 70 to 74 Years | 26 (2.8%) | 24 (3.0%) |
| 75 to 79 Years | 44 (4.8%) | 38 (4.7%) |
| 80 to 84 Years | 63 (6.9%) | 36 (4.4%) |
| 85 Years and over | 0 (0.0%) | 4 (0.5%) |
| Total | 915 (100.0%) | 809 (100.0%) |
Families and Households in St Francisville
Median Family Size in St Francisville
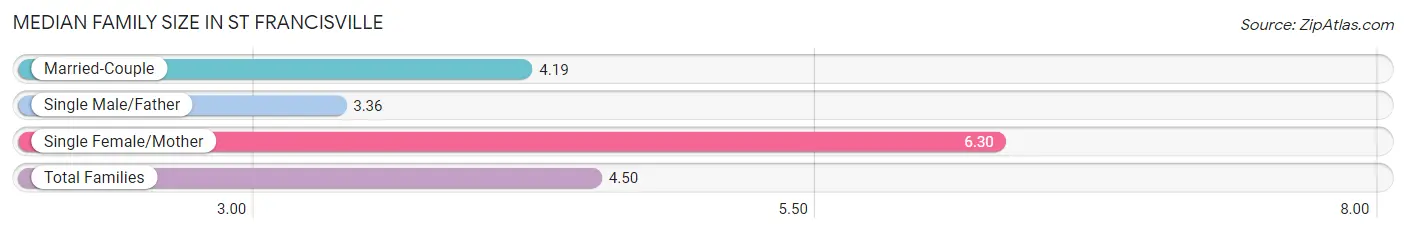
The median family size in St Francisville is 4.50 persons per family, with single female/mother families (79 | 25.4%) accounting for the largest median family size of 6.3 persons per family. On the other hand, single male/father families (84 | 27.0%) represent the smallest median family size with 3.36 persons per family.
| Family Type | # Families | Family Size |
| Married-Couple | 148 (47.6%) | 4.19 |
| Single Male/Father | 84 (27.0%) | 3.36 |
| Single Female/Mother | 79 (25.4%) | 6.30 |
| Total Families | 311 (100.0%) | 4.50 |
Median Household Size in St Francisville
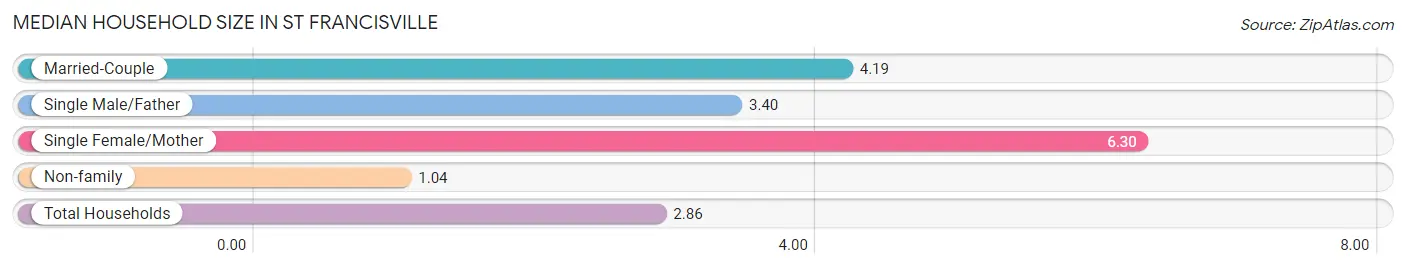
The median household size in St Francisville is 2.86 persons per household, with single female/mother households (79 | 13.3%) accounting for the largest median household size of 6.3 persons per household. non-family households (284 | 47.7%) represent the smallest median household size with 1.04 persons per household.
| Household Type | # Households | Household Size |
| Married-Couple | 148 (24.9%) | 4.19 |
| Single Male/Father | 84 (14.1%) | 3.40 |
| Single Female/Mother | 79 (13.3%) | 6.30 |
| Non-family | 284 (47.7%) | 1.04 |
| Total Households | 595 (100.0%) | 2.86 |
Household Size by Marriage Status in St Francisville
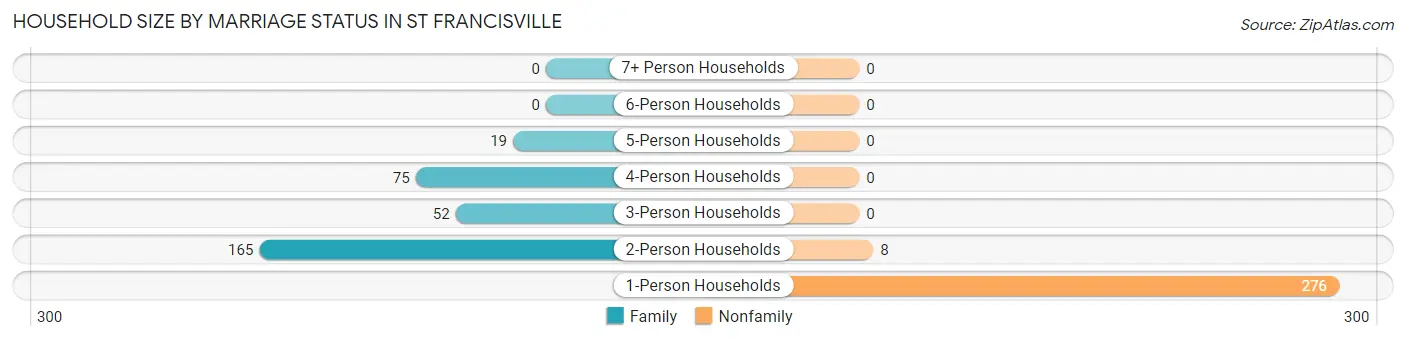
Out of a total of 595 households in St Francisville, 311 (52.3%) are family households, while 284 (47.7%) are nonfamily households. The most numerous type of family households are 2-person households, comprising 165, and the most common type of nonfamily households are 1-person households, comprising 276.
| Household Size | Family Households | Nonfamily Households |
| 1-Person Households | - | 276 (46.4%) |
| 2-Person Households | 165 (27.7%) | 8 (1.3%) |
| 3-Person Households | 52 (8.7%) | 0 (0.0%) |
| 4-Person Households | 75 (12.6%) | 0 (0.0%) |
| 5-Person Households | 19 (3.2%) | 0 (0.0%) |
| 6-Person Households | 0 (0.0%) | 0 (0.0%) |
| 7+ Person Households | 0 (0.0%) | 0 (0.0%) |
| Total | 311 (52.3%) | 284 (47.7%) |
Female Fertility in St Francisville
Fertility by Age in St Francisville
Average fertility rate in St Francisville is 56.0 births per 1,000 women. Women in the age bracket of 20 to 34 years have the highest fertility rate with 91.0 births per 1,000 women. Women in the age bracket of 20 to 34 years acount for 100.0% of all women with births.
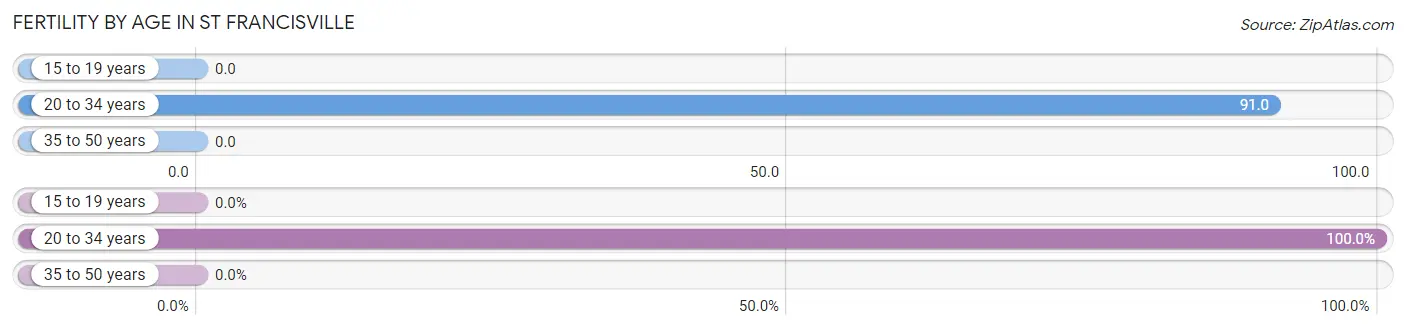
| Age Bracket | Women with Births | Births / 1,000 Women |
| 15 to 19 years | 0 (0.0%) | 0.0 |
| 20 to 34 years | 20 (100.0%) | 91.0 |
| 35 to 50 years | 0 (0.0%) | 0.0 |
| Total | 20 (100.0%) | 56.0 |
Fertility by Age by Marriage Status in St Francisville
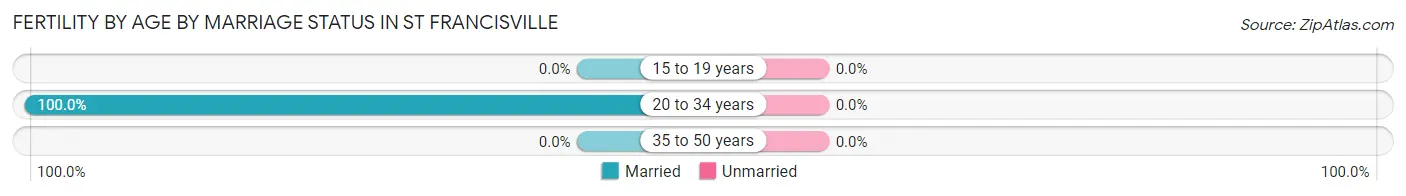
| Age Bracket | Married | Unmarried |
| 15 to 19 years | 0 (0.0%) | 0 (0.0%) |
| 20 to 34 years | 20 (100.0%) | 0 (0.0%) |
| 35 to 50 years | 0 (0.0%) | 0 (0.0%) |
| Total | 20 (100.0%) | 0 (0.0%) |
Fertility by Education in St Francisville
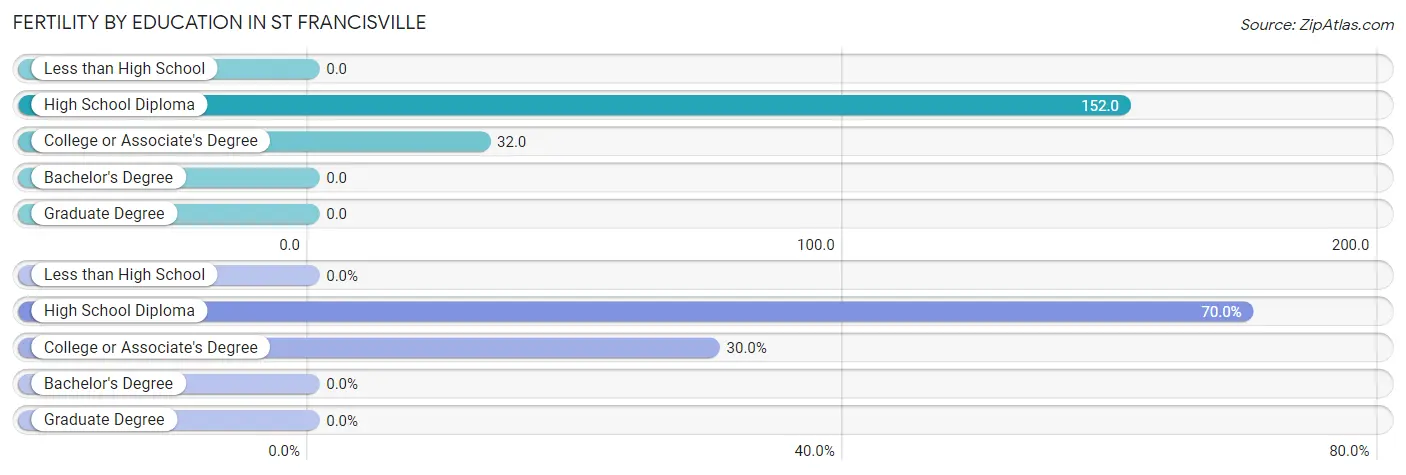
| Educational Attainment | Women with Births | Births / 1,000 Women |
| Less than High School | 0 (0.0%) | 0.0 |
| High School Diploma | 14 (70.0%) | 152.0 |
| College or Associate's Degree | 6 (30.0%) | 32.0 |
| Bachelor's Degree | 0 (0.0%) | 0.0 |
| Graduate Degree | 0 (0.0%) | 0.0 |
| Total | 20 (100.0%) | 56.0 |
Fertility by Education by Marriage Status in St Francisville
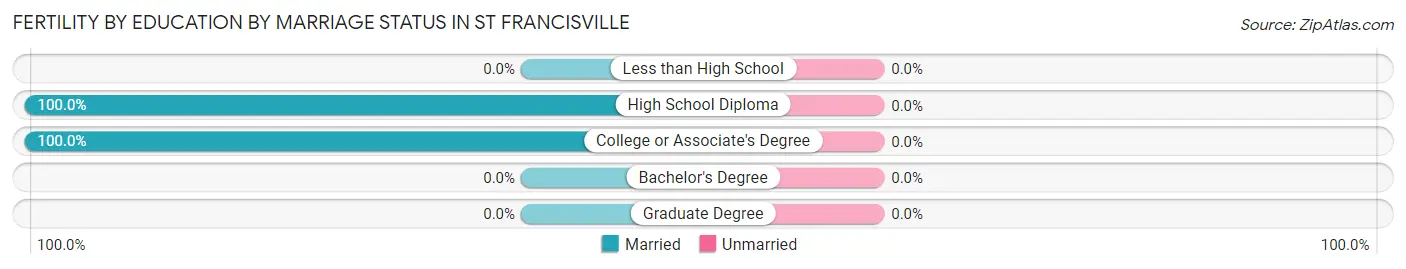
| Educational Attainment | Married | Unmarried |
| Less than High School | 0 (0.0%) | 0 (0.0%) |
| High School Diploma | 14 (100.0%) | 0 (0.0%) |
| College or Associate's Degree | 6 (100.0%) | 0 (0.0%) |
| Bachelor's Degree | 0 (0.0%) | 0 (0.0%) |
| Graduate Degree | 0 (0.0%) | 0 (0.0%) |
| Total | 20 (100.0%) | 0 (0.0%) |
Income in St Francisville
Income Overview in St Francisville
Per Capita Income in St Francisville is $25,169, while median incomes of families and households are $75,268 and $46,681 respectively.
| Characteristic | Number | Measure |
| Per Capita Income | 1,724 | $25,169 |
| Median Family Income | 311 | $75,268 |
| Mean Family Income | 311 | $87,692 |
| Median Household Income | 595 | $46,681 |
| Mean Household Income | 595 | $60,989 |
| Income Deficit | 311 | $0 |
| Wage / Income Gap (%) | 1,724 | 25.64% |
| Wage / Income Gap ($) | 1,724 | 74.36¢ per $1 |
| Gini / Inequality Index | 1,724 | 0.48 |
Earnings by Sex in St Francisville
Average Earnings in St Francisville are $37,679, $48,750 for men and $36,250 for women, a difference of 25.6%.

| Sex | Number | Average Earnings |
| Male | 305 (48.6%) | $48,750 |
| Female | 322 (51.4%) | $36,250 |
| Total | 627 (100.0%) | $37,679 |
Earnings by Sex by Income Bracket in St Francisville
The most common earnings brackets in St Francisville are $75,000 to $99,999 for men (50 | 16.4%) and $35,000 to $39,999 for women (47 | 14.6%).
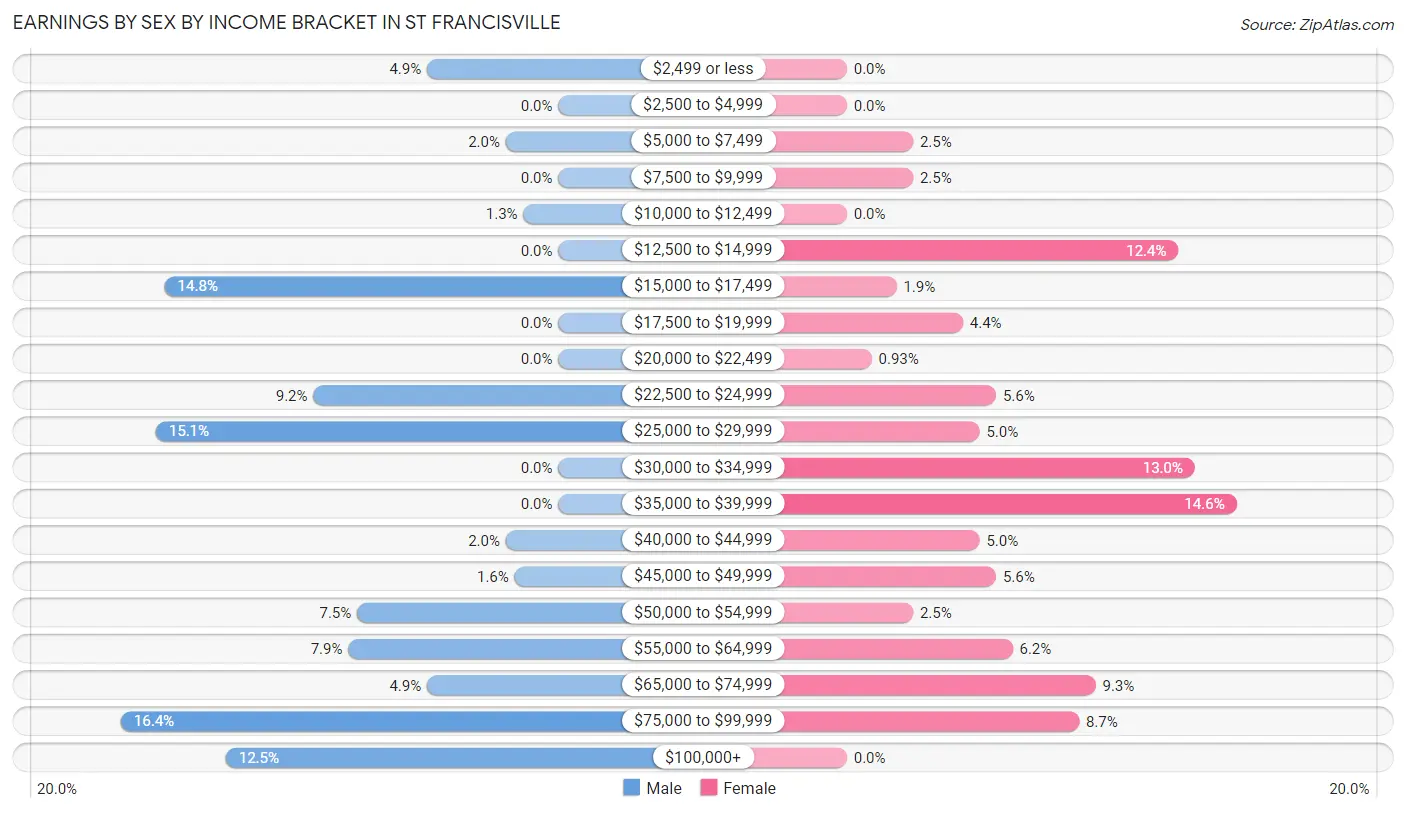
| Income | Male | Female |
| $2,499 or less | 15 (4.9%) | 0 (0.0%) |
| $2,500 to $4,999 | 0 (0.0%) | 0 (0.0%) |
| $5,000 to $7,499 | 6 (2.0%) | 8 (2.5%) |
| $7,500 to $9,999 | 0 (0.0%) | 8 (2.5%) |
| $10,000 to $12,499 | 4 (1.3%) | 0 (0.0%) |
| $12,500 to $14,999 | 0 (0.0%) | 40 (12.4%) |
| $15,000 to $17,499 | 45 (14.7%) | 6 (1.9%) |
| $17,500 to $19,999 | 0 (0.0%) | 14 (4.3%) |
| $20,000 to $22,499 | 0 (0.0%) | 3 (0.9%) |
| $22,500 to $24,999 | 28 (9.2%) | 18 (5.6%) |
| $25,000 to $29,999 | 46 (15.1%) | 16 (5.0%) |
| $30,000 to $34,999 | 0 (0.0%) | 42 (13.0%) |
| $35,000 to $39,999 | 0 (0.0%) | 47 (14.6%) |
| $40,000 to $44,999 | 6 (2.0%) | 16 (5.0%) |
| $45,000 to $49,999 | 5 (1.6%) | 18 (5.6%) |
| $50,000 to $54,999 | 23 (7.5%) | 8 (2.5%) |
| $55,000 to $64,999 | 24 (7.9%) | 20 (6.2%) |
| $65,000 to $74,999 | 15 (4.9%) | 30 (9.3%) |
| $75,000 to $99,999 | 50 (16.4%) | 28 (8.7%) |
| $100,000+ | 38 (12.5%) | 0 (0.0%) |
| Total | 305 (100.0%) | 322 (100.0%) |
Earnings by Sex by Educational Attainment in St Francisville
Average earnings in St Francisville are $55,357 for men and $39,071 for women, a difference of 29.4%. Men with an educational attainment of high school diploma enjoy the highest average annual earnings of $75,568, while those with high school diploma education earn the least with $75,568. Women with an educational attainment of college or associate's degree earn the most with the average annual earnings of $43,125, while those with bachelor's degree education have the smallest earnings of $36,771.
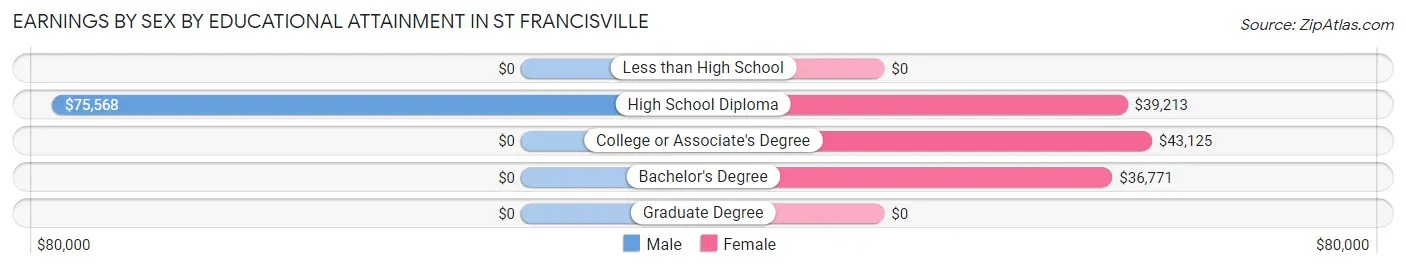
| Educational Attainment | Male Income | Female Income |
| Less than High School | - | - |
| High School Diploma | $75,568 | $39,213 |
| College or Associate's Degree | - | - |
| Bachelor's Degree | - | - |
| Graduate Degree | - | - |
| Total | $55,357 | $39,071 |
Family Income in St Francisville
Family Income Brackets in St Francisville
According to the St Francisville family income data, there are 72 families falling into the $75,000 to $99,999 income range, which is the most common income bracket and makes up 23.2% of all families.
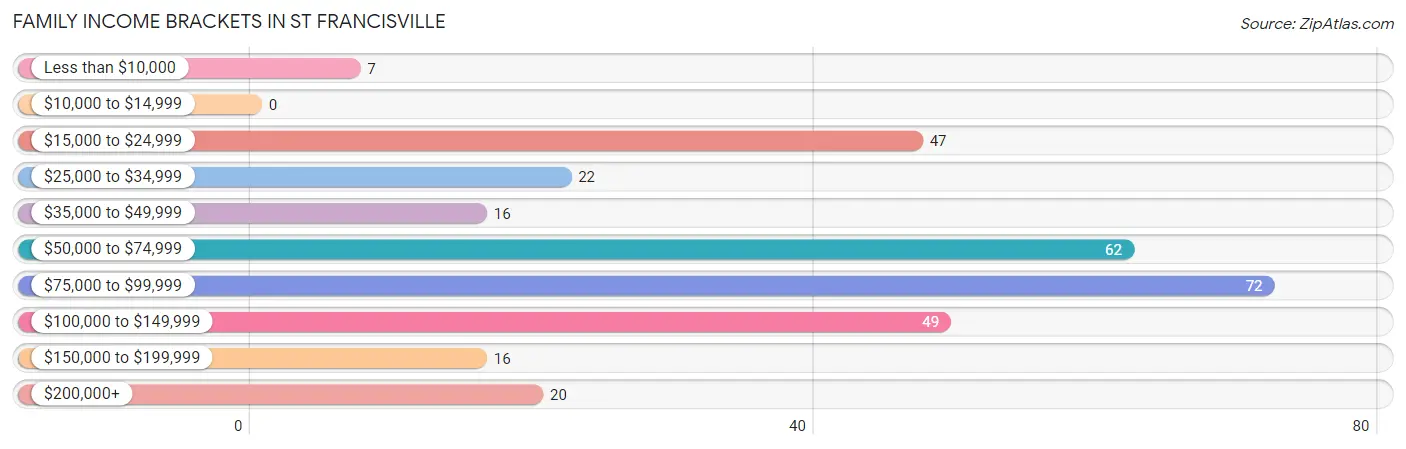
| Income Bracket | # Families | % Families |
| Less than $10,000 | 7 | 2.3% |
| $10,000 to $14,999 | 0 | 0.0% |
| $15,000 to $24,999 | 47 | 15.1% |
| $25,000 to $34,999 | 22 | 7.1% |
| $35,000 to $49,999 | 16 | 5.1% |
| $50,000 to $74,999 | 62 | 19.9% |
| $75,000 to $99,999 | 72 | 23.2% |
| $100,000 to $149,999 | 49 | 15.8% |
| $150,000 to $199,999 | 16 | 5.1% |
| $200,000+ | 20 | 6.4% |
Family Income by Famaliy Size in St Francisville
3-person families (47 | 15.1%) account for the highest median family income in St Francisville with $83,281 per family, while 2-person families (170 | 54.7%) have the highest median income of $35,104 per family member.
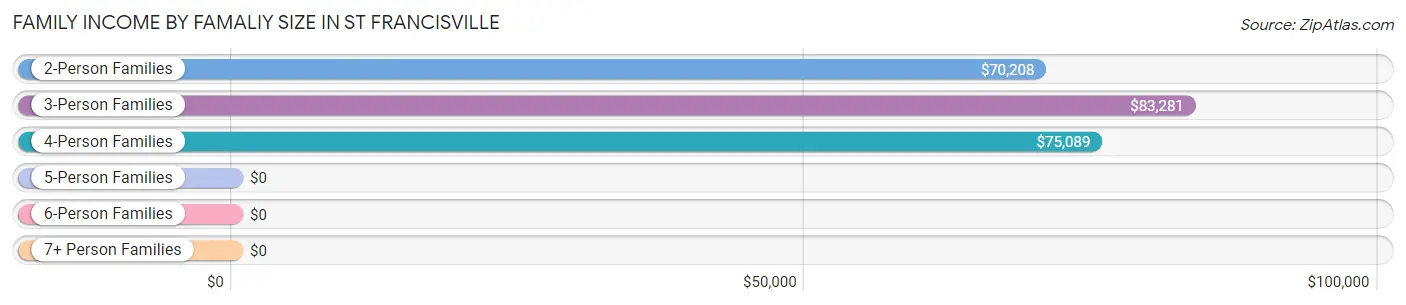
| Income Bracket | # Families | Median Income |
| 2-Person Families | 170 (54.7%) | $70,208 |
| 3-Person Families | 47 (15.1%) | $83,281 |
| 4-Person Families | 75 (24.1%) | $75,089 |
| 5-Person Families | 19 (6.1%) | $0 |
| 6-Person Families | 0 (0.0%) | $0 |
| 7+ Person Families | 0 (0.0%) | $0 |
| Total | 311 (100.0%) | $75,268 |
Family Income by Number of Earners in St Francisville
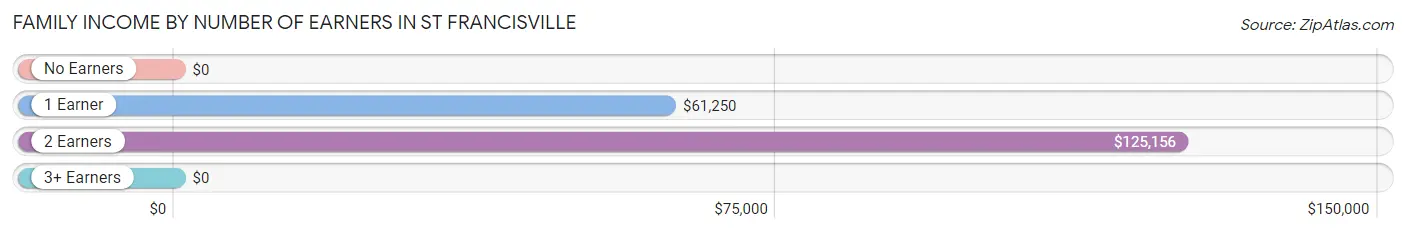
| Number of Earners | # Families | Median Income |
| No Earners | 97 (31.2%) | $0 |
| 1 Earner | 114 (36.7%) | $61,250 |
| 2 Earners | 69 (22.2%) | $125,156 |
| 3+ Earners | 31 (10.0%) | $0 |
| Total | 311 (100.0%) | $75,268 |
Household Income in St Francisville
Household Income Brackets in St Francisville
With 95 households falling in the category, the $75,000 to $99,999 income range is the most frequent in St Francisville, accounting for 16.0% of all households. In contrast, only 16 households (2.7%) fall into the $150,000 to $199,999 income bracket, making it the least populous group.
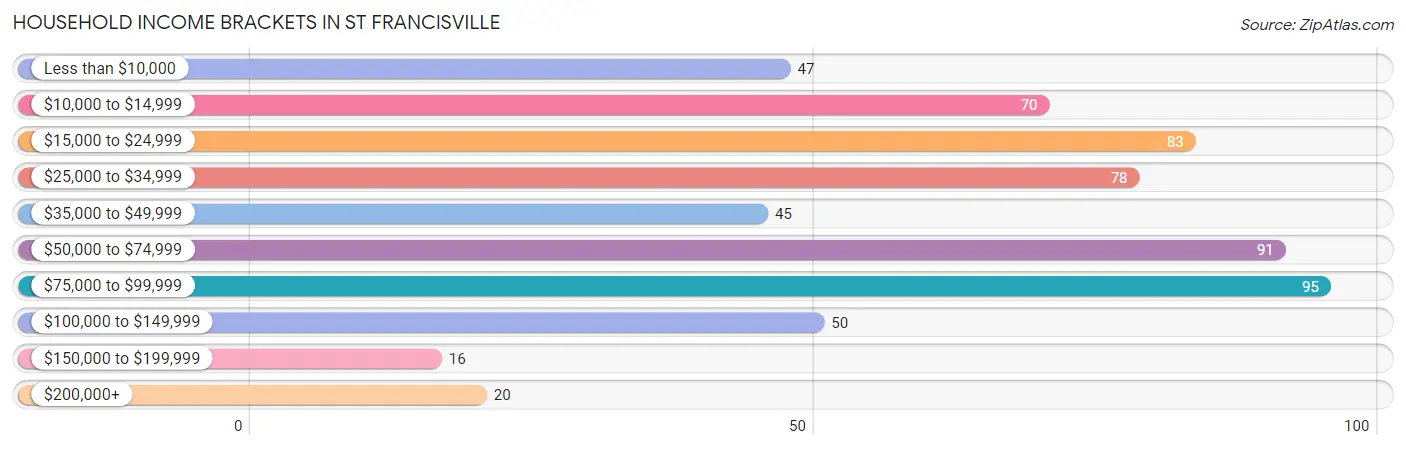
| Income Bracket | # Households | % Households |
| Less than $10,000 | 47 | 7.9% |
| $10,000 to $14,999 | 70 | 11.8% |
| $15,000 to $24,999 | 83 | 13.9% |
| $25,000 to $34,999 | 78 | 13.1% |
| $35,000 to $49,999 | 45 | 7.6% |
| $50,000 to $74,999 | 91 | 15.3% |
| $75,000 to $99,999 | 95 | 16.0% |
| $100,000 to $149,999 | 50 | 8.4% |
| $150,000 to $199,999 | 16 | 2.7% |
| $200,000+ | 20 | 3.4% |
Household Income by Householder Age in St Francisville
The median household income in St Francisville is $46,681, with the highest median household income of $77,054 found in the 25 to 44 years age bracket for the primary householder. A total of 145 households (24.4%) fall into this category. Meanwhile, the 15 to 24 years age bracket for the primary householder has the lowest median household income of $0, with 23 households (3.9%) in this group.
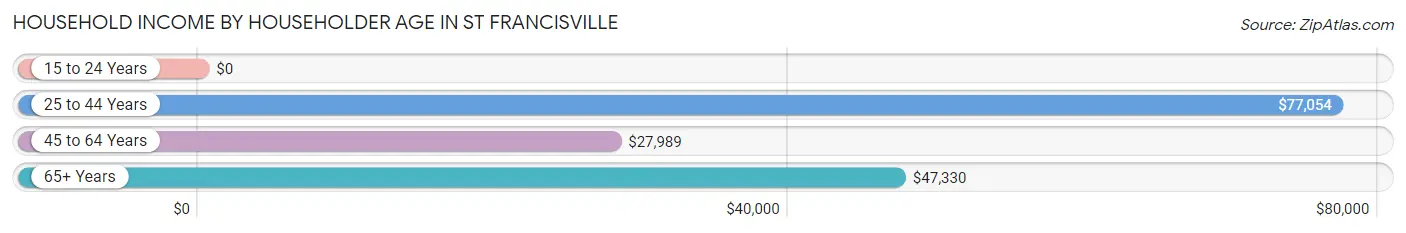
| Income Bracket | # Households | Median Income |
| 15 to 24 Years | 23 (3.9%) | $0 |
| 25 to 44 Years | 145 (24.4%) | $77,054 |
| 45 to 64 Years | 256 (43.0%) | $27,989 |
| 65+ Years | 171 (28.7%) | $47,330 |
| Total | 595 (100.0%) | $46,681 |
Poverty in St Francisville
Income Below Poverty by Sex and Age in St Francisville
With 43.9% poverty level for males and 16.3% for females among the residents of St Francisville, under 5 year old males and 45 to 54 year old females are the most vulnerable to poverty, with 116 males (88.5%) and 44 females (35.2%) in their respective age groups living below the poverty level.
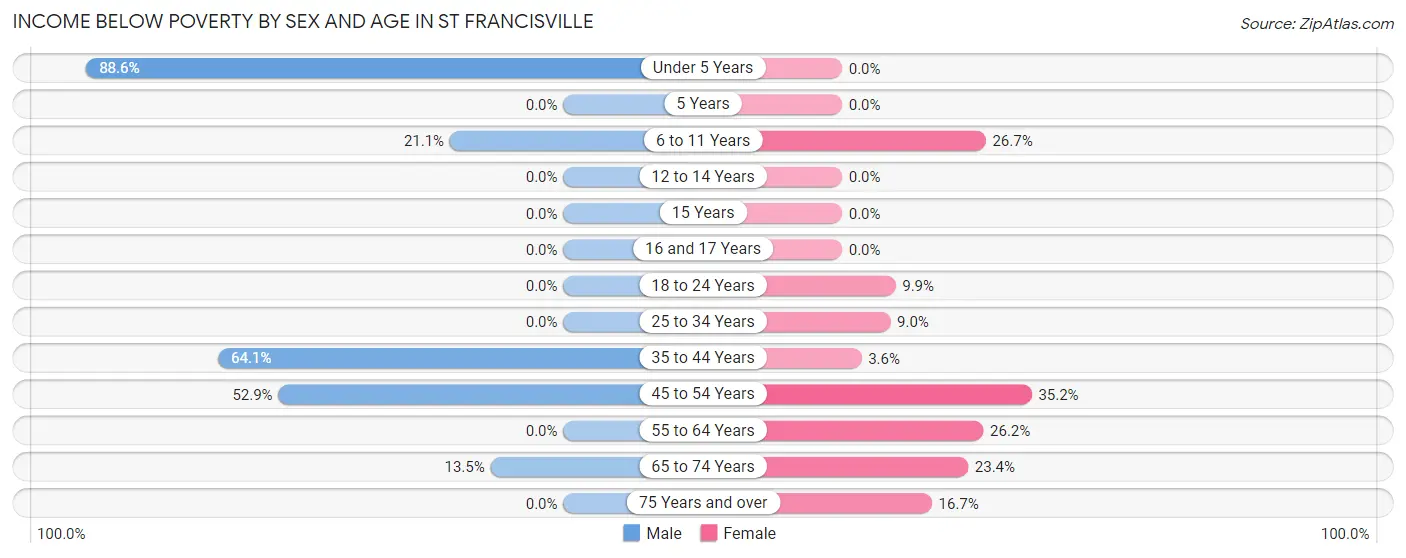
| Age Bracket | Male | Female |
| Under 5 Years | 116 (88.5%) | 0 (0.0%) |
| 5 Years | 0 (0.0%) | 0 (0.0%) |
| 6 to 11 Years | 4 (21.0%) | 24 (26.7%) |
| 12 to 14 Years | 0 (0.0%) | 0 (0.0%) |
| 15 Years | 0 (0.0%) | 0 (0.0%) |
| 16 and 17 Years | 0 (0.0%) | 0 (0.0%) |
| 18 to 24 Years | 0 (0.0%) | 14 (9.9%) |
| 25 to 34 Years | 0 (0.0%) | 7 (9.0%) |
| 35 to 44 Years | 166 (64.1%) | 3 (3.6%) |
| 45 to 54 Years | 101 (52.9%) | 44 (35.2%) |
| 55 to 64 Years | 0 (0.0%) | 16 (26.2%) |
| 65 to 74 Years | 5 (13.5%) | 11 (23.4%) |
| 75 Years and over | 0 (0.0%) | 13 (16.7%) |
| Total | 392 (43.9%) | 132 (16.3%) |
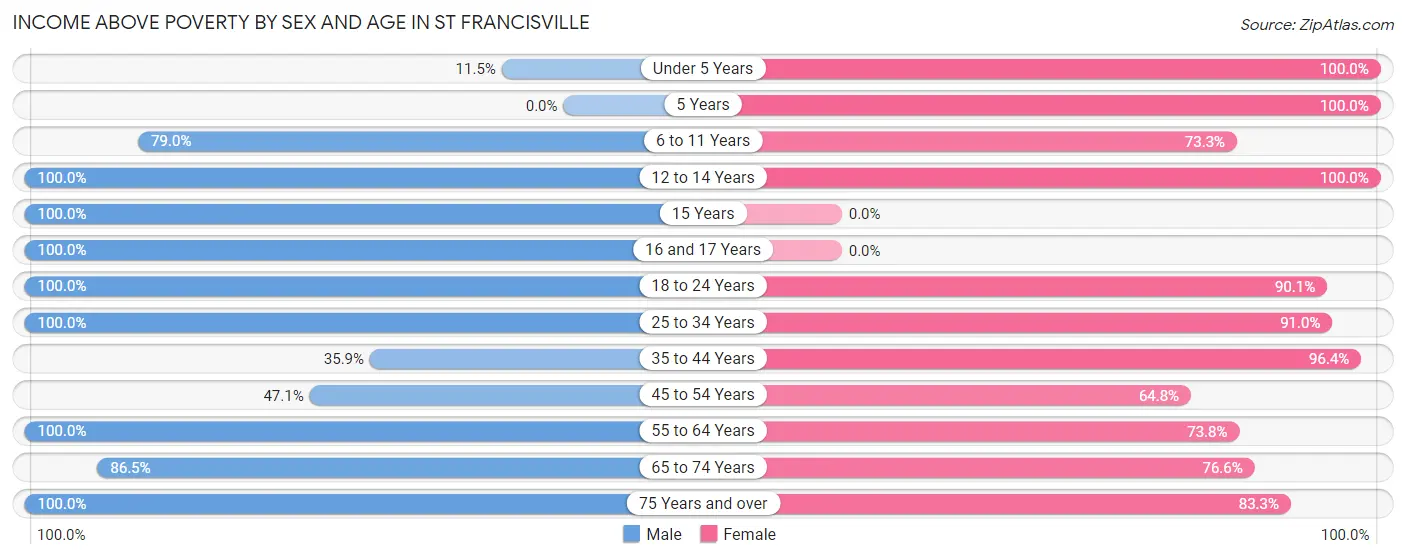
Income Above Poverty by Sex and Age in St Francisville
According to the poverty statistics in St Francisville, males aged 12 to 14 years and females aged under 5 years are the age groups that are most secure financially, with 100.0% of males and 100.0% of females in these age groups living above the poverty line.
| Age Bracket | Male | Female |
| Under 5 Years | 15 (11.5%) | 40 (100.0%) |
| 5 Years | 0 (0.0%) | 26 (100.0%) |
| 6 to 11 Years | 15 (78.9%) | 66 (73.3%) |
| 12 to 14 Years | 4 (100.0%) | 40 (100.0%) |
| 15 Years | 38 (100.0%) | 0 (0.0%) |
| 16 and 17 Years | 15 (100.0%) | 0 (0.0%) |
| 18 to 24 Years | 50 (100.0%) | 127 (90.1%) |
| 25 to 34 Years | 28 (100.0%) | 71 (91.0%) |
| 35 to 44 Years | 93 (35.9%) | 80 (96.4%) |
| 45 to 54 Years | 90 (47.1%) | 81 (64.8%) |
| 55 to 64 Years | 14 (100.0%) | 45 (73.8%) |
| 65 to 74 Years | 32 (86.5%) | 36 (76.6%) |
| 75 Years and over | 107 (100.0%) | 65 (83.3%) |
| Total | 501 (56.1%) | 677 (83.7%) |
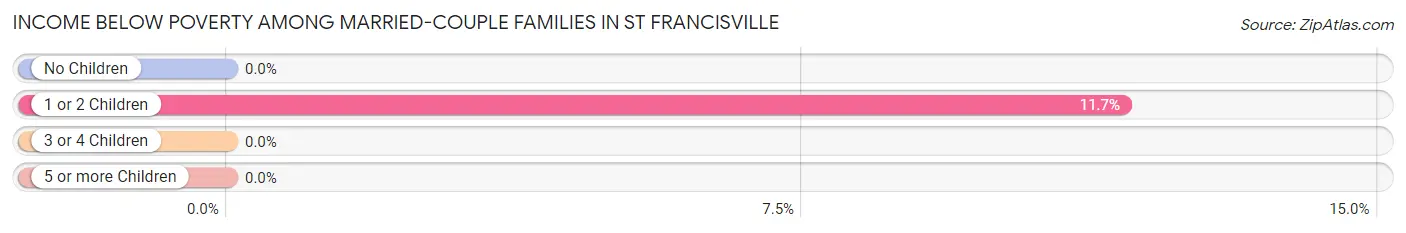
Income Below Poverty Among Married-Couple Families in St Francisville
The poverty statistics for married-couple families in St Francisville show that 4.7% or 7 of the total 148 families live below the poverty line. Families with 1 or 2 children have the highest poverty rate of 11.7%, comprising of 7 families. On the other hand, families with no children have the lowest poverty rate of 0.0%, which includes 0 families.
| Children | Above Poverty | Below Poverty |
| No Children | 80 (100.0%) | 0 (0.0%) |
| 1 or 2 Children | 53 (88.3%) | 7 (11.7%) |
| 3 or 4 Children | 8 (100.0%) | 0 (0.0%) |
| 5 or more Children | 0 (0.0%) | 0 (0.0%) |
| Total | 141 (95.3%) | 7 (4.7%) |
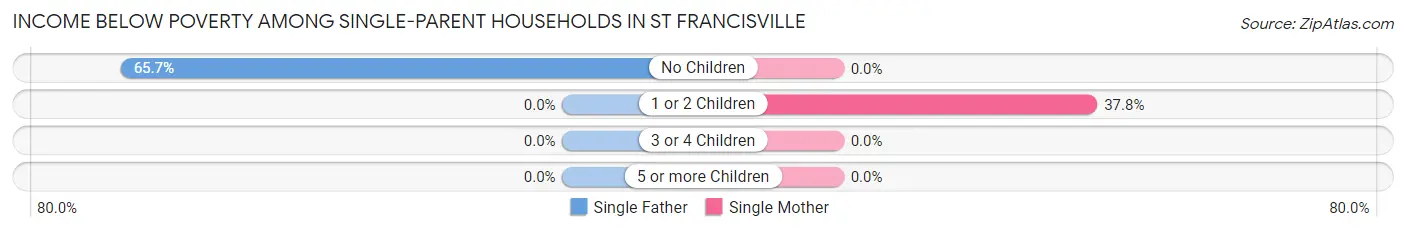
Income Below Poverty Among Single-Parent Households in St Francisville
According to the poverty data in St Francisville, 52.4% or 44 single-father households and 21.5% or 17 single-mother households are living below the poverty line. Among single-father households, those with no children have the highest poverty rate, with 44 households (65.7%) experiencing poverty. Likewise, among single-mother households, those with 1 or 2 children have the highest poverty rate, with 17 households (37.8%) falling below the poverty line.
| Children | Single Father | Single Mother |
| No Children | 44 (65.7%) | 0 (0.0%) |
| 1 or 2 Children | 0 (0.0%) | 17 (37.8%) |
| 3 or 4 Children | 0 (0.0%) | 0 (0.0%) |
| 5 or more Children | 0 (0.0%) | 0 (0.0%) |
| Total | 44 (52.4%) | 17 (21.5%) |
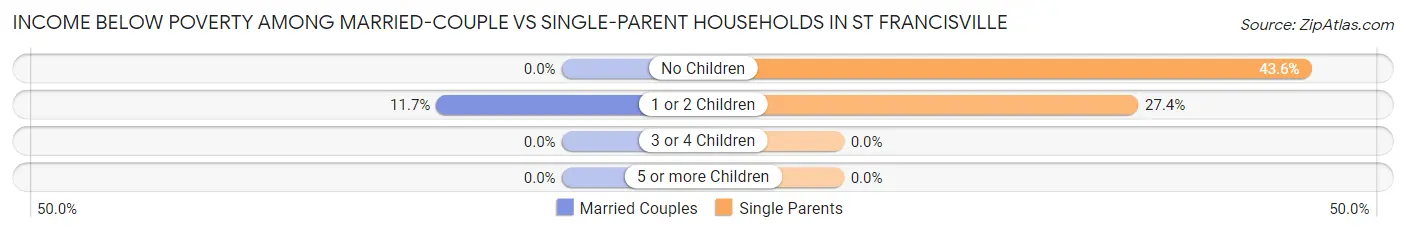
Income Below Poverty Among Married-Couple vs Single-Parent Households in St Francisville
The poverty data for St Francisville shows that 7 of the married-couple family households (4.7%) and 61 of the single-parent households (37.4%) are living below the poverty level. Within the married-couple family households, those with 1 or 2 children have the highest poverty rate, with 7 households (11.7%) falling below the poverty line. Among the single-parent households, those with no children have the highest poverty rate, with 44 household (43.6%) living below poverty.
| Children | Married-Couple Families | Single-Parent Households |
| No Children | 0 (0.0%) | 44 (43.6%) |
| 1 or 2 Children | 7 (11.7%) | 17 (27.4%) |
| 3 or 4 Children | 0 (0.0%) | 0 (0.0%) |
| 5 or more Children | 0 (0.0%) | 0 (0.0%) |
| Total | 7 (4.7%) | 61 (37.4%) |
Employment Characteristics in St Francisville
Employment by Class of Employer in St Francisville
Among the 582 employed individuals in St Francisville, private company employees (371 | 63.7%), state government employees (69 | 11.9%), and local government employees (66 | 11.3%) make up the most common classes of employment.
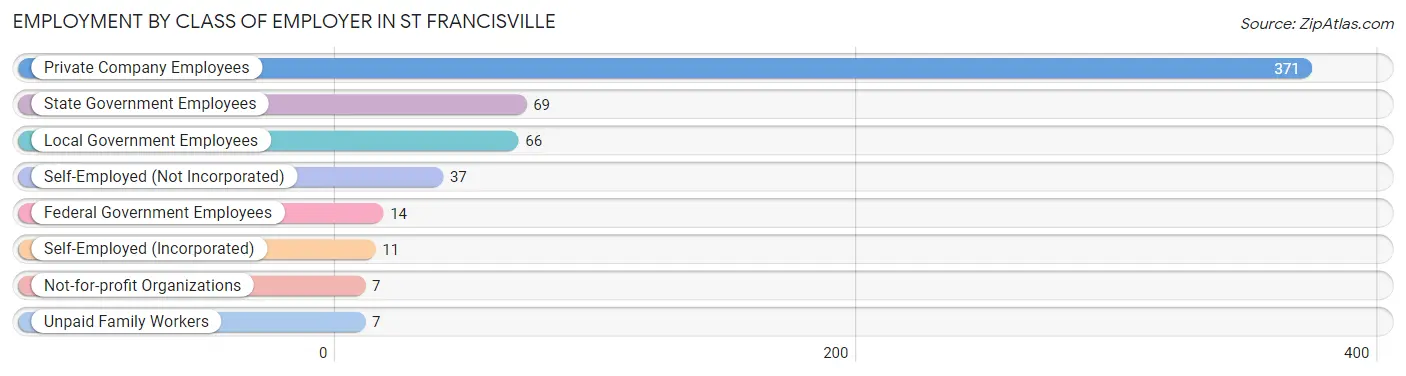
| Employer Class | # Employees | % Employees |
| Private Company Employees | 371 | 63.7% |
| Self-Employed (Incorporated) | 11 | 1.9% |
| Self-Employed (Not Incorporated) | 37 | 6.4% |
| Not-for-profit Organizations | 7 | 1.2% |
| Local Government Employees | 66 | 11.3% |
| State Government Employees | 69 | 11.9% |
| Federal Government Employees | 14 | 2.4% |
| Unpaid Family Workers | 7 | 1.2% |
| Total | 582 | 100.0% |
Employment Status by Age in St Francisville
According to the labor force statistics for St Francisville, out of the total population over 16 years of age (1,336), 57.8% or 772 individuals are in the labor force, with 24.7% or 191 of them unemployed. The age group with the highest labor force participation rate is 25 to 29 years, with 88.9% or 40 individuals in the labor force. Within the labor force, the 35 to 44 years age range has the highest percentage of unemployed individuals, with 60.1% or 188 of them being unemployed.
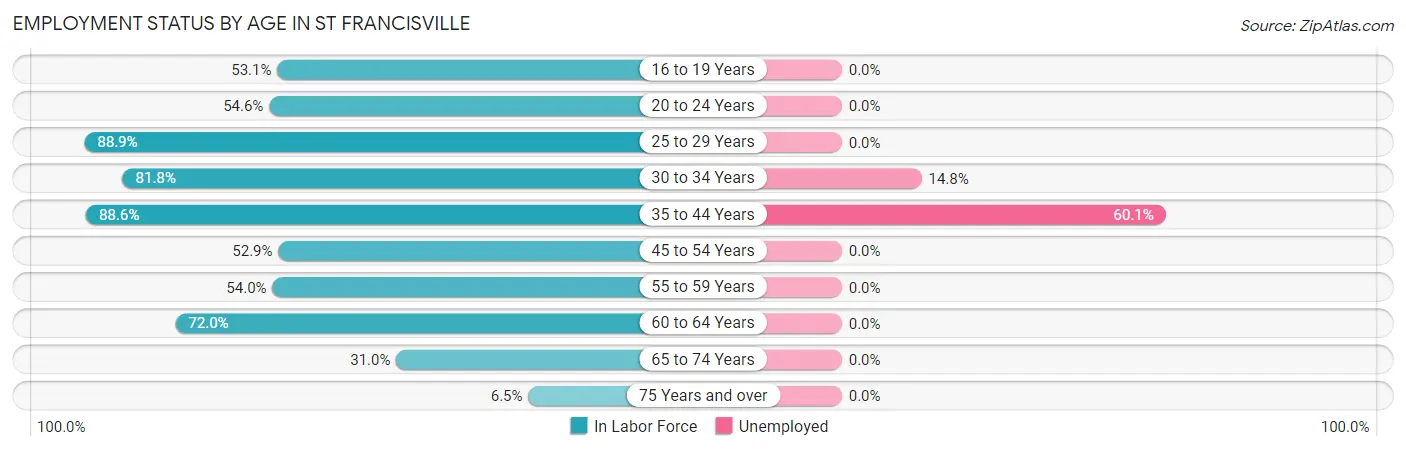
| Age Bracket | In Labor Force | Unemployed |
| 16 to 19 Years | 17 (53.1%) | 0 (0.0%) |
| 20 to 24 Years | 95 (54.6%) | 0 (0.0%) |
| 25 to 29 Years | 40 (88.9%) | 0 (0.0%) |
| 30 to 34 Years | 54 (81.8%) | 8 (14.8%) |
| 35 to 44 Years | 312 (88.6%) | 188 (60.1%) |
| 45 to 54 Years | 171 (52.9%) | 0 (0.0%) |
| 55 to 59 Years | 27 (54.0%) | 0 (0.0%) |
| 60 to 64 Years | 18 (72.0%) | 0 (0.0%) |
| 65 to 74 Years | 26 (31.0%) | 0 (0.0%) |
| 75 Years and over | 12 (6.5%) | 0 (0.0%) |
| Total | 772 (57.8%) | 191 (24.7%) |
Employment Status by Educational Attainment in St Francisville
According to labor force statistics for St Francisville, 72.2% of individuals (622) out of the total population between 25 and 64 years of age (861) are in the labor force, with 30.8% or 192 of them being unemployed. The group with the highest labor force participation rate are those with the educational attainment of bachelor's degree or higher, with 86.8% or 105 individuals in the labor force. Within the labor force, individuals with less than high school education have the highest percentage of unemployment, with 100.0% or 29 of them being unemployed.
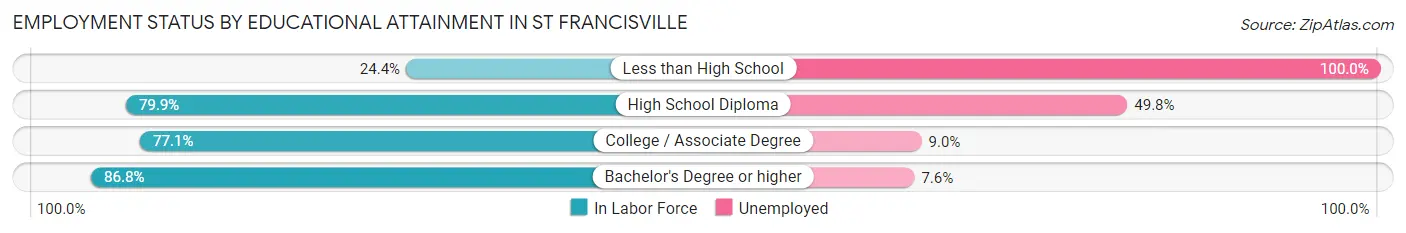
| Educational Attainment | In Labor Force | Unemployed |
| Less than High School | 29 (24.4%) | 119 (100.0%) |
| High School Diploma | 263 (79.9%) | 164 (49.8%) |
| College / Associate Degree | 225 (77.1%) | 26 (9.0%) |
| Bachelor's Degree or higher | 105 (86.8%) | 9 (7.6%) |
| Total | 622 (72.2%) | 265 (30.8%) |
Employment Occupations by Sex in St Francisville
Management, Business, Science and Arts Occupations
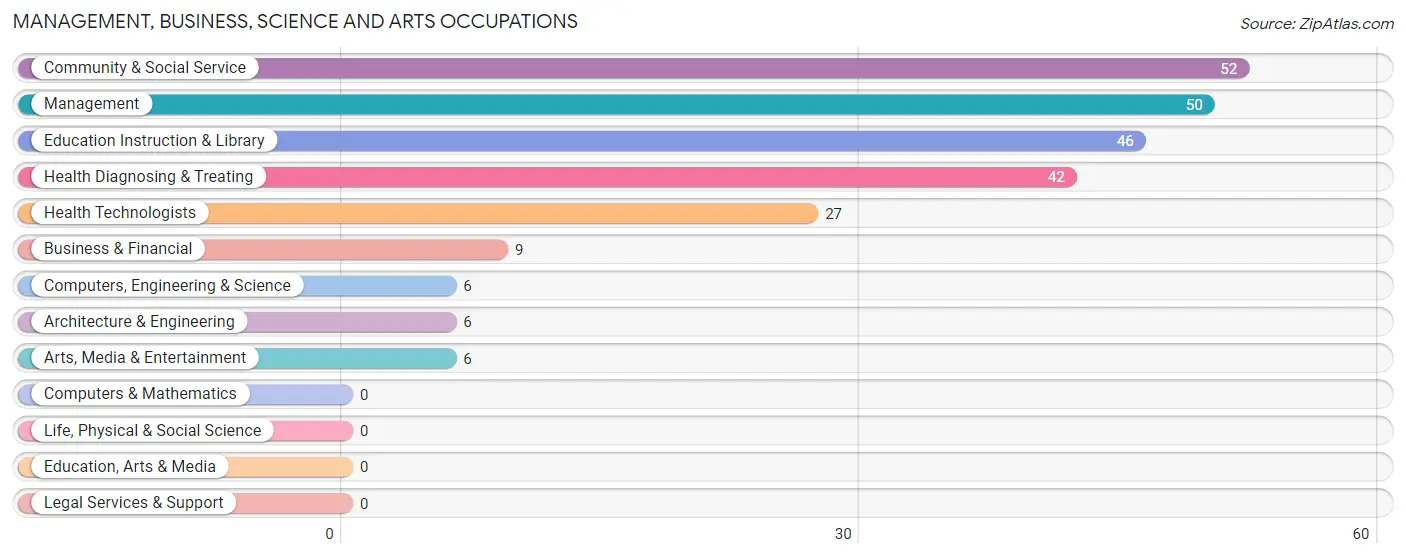
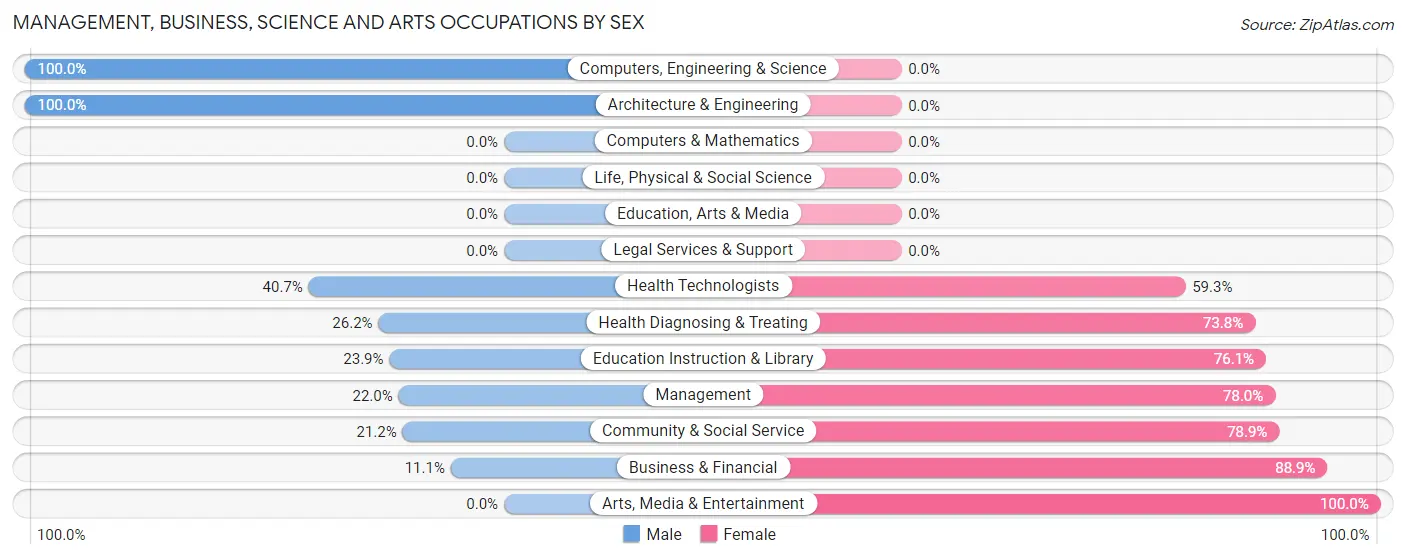
The most common Management, Business, Science and Arts occupations in St Francisville are Community & Social Service (52 | 9.1%), Management (50 | 8.8%), Education Instruction & Library (46 | 8.1%), Health Diagnosing & Treating (42 | 7.4%), and Health Technologists (27 | 4.7%).
Management, Business, Science and Arts Occupations by Sex
Within the Management, Business, Science and Arts occupations in St Francisville, the most male-oriented occupations are Computers, Engineering & Science (100.0%), Architecture & Engineering (100.0%), and Health Technologists (40.7%), while the most female-oriented occupations are Arts, Media & Entertainment (100.0%), Business & Financial (88.9%), and Community & Social Service (78.8%).
| Occupation | Male | Female |
| Management | 11 (22.0%) | 39 (78.0%) |
| Business & Financial | 1 (11.1%) | 8 (88.9%) |
| Computers, Engineering & Science | 6 (100.0%) | 0 (0.0%) |
| Computers & Mathematics | 0 (0.0%) | 0 (0.0%) |
| Architecture & Engineering | 6 (100.0%) | 0 (0.0%) |
| Life, Physical & Social Science | 0 (0.0%) | 0 (0.0%) |
| Community & Social Service | 11 (21.1%) | 41 (78.8%) |
| Education, Arts & Media | 0 (0.0%) | 0 (0.0%) |
| Legal Services & Support | 0 (0.0%) | 0 (0.0%) |
| Education Instruction & Library | 11 (23.9%) | 35 (76.1%) |
| Arts, Media & Entertainment | 0 (0.0%) | 6 (100.0%) |
| Health Diagnosing & Treating | 11 (26.2%) | 31 (73.8%) |
| Health Technologists | 11 (40.7%) | 16 (59.3%) |
| Total (Category) | 40 (25.2%) | 119 (74.8%) |
| Total (Overall) | 271 (47.5%) | 300 (52.5%) |
Services Occupations
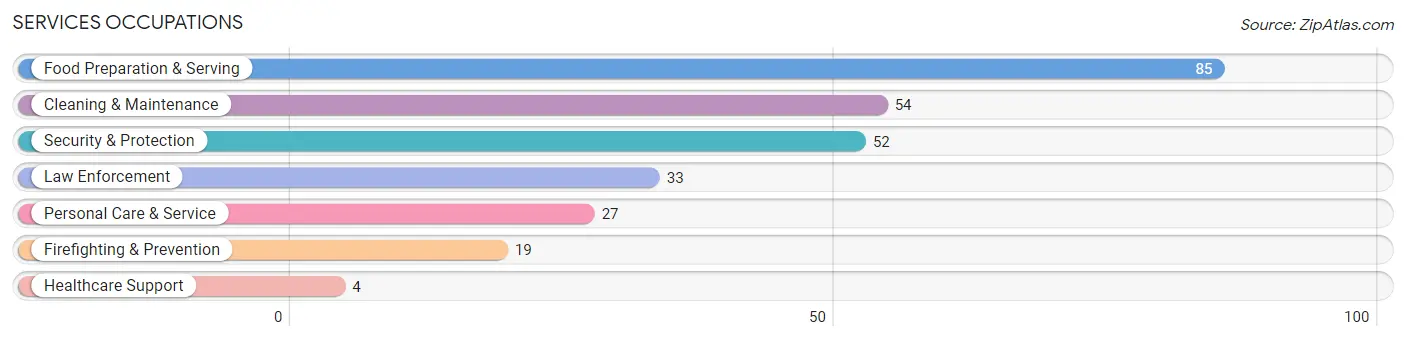
The most common Services occupations in St Francisville are Food Preparation & Serving (85 | 14.9%), Cleaning & Maintenance (54 | 9.5%), Security & Protection (52 | 9.1%), Law Enforcement (33 | 5.8%), and Personal Care & Service (27 | 4.7%).
Services Occupations by Sex
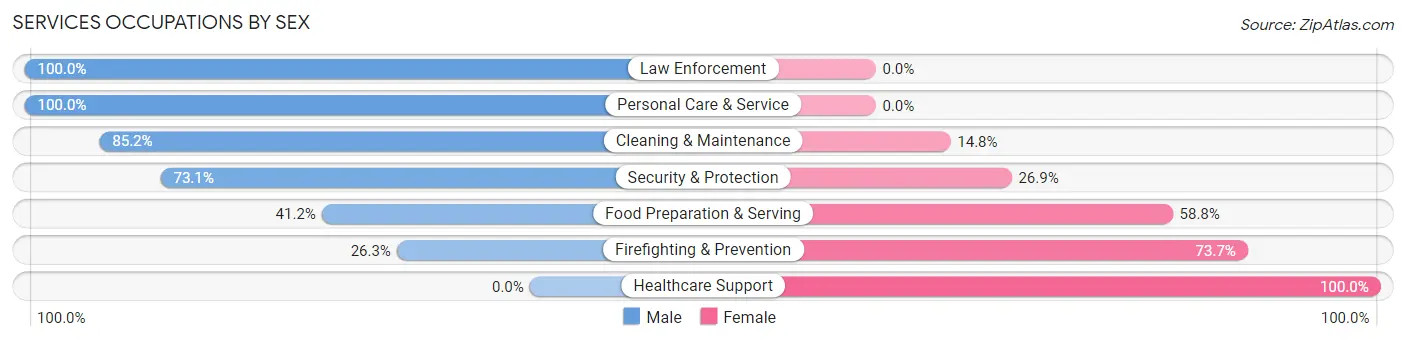
Within the Services occupations in St Francisville, the most male-oriented occupations are Law Enforcement (100.0%), Personal Care & Service (100.0%), and Cleaning & Maintenance (85.2%), while the most female-oriented occupations are Healthcare Support (100.0%), Firefighting & Prevention (73.7%), and Food Preparation & Serving (58.8%).
| Occupation | Male | Female |
| Healthcare Support | 0 (0.0%) | 4 (100.0%) |
| Security & Protection | 38 (73.1%) | 14 (26.9%) |
| Firefighting & Prevention | 5 (26.3%) | 14 (73.7%) |
| Law Enforcement | 33 (100.0%) | 0 (0.0%) |
| Food Preparation & Serving | 35 (41.2%) | 50 (58.8%) |
| Cleaning & Maintenance | 46 (85.2%) | 8 (14.8%) |
| Personal Care & Service | 27 (100.0%) | 0 (0.0%) |
| Total (Category) | 146 (65.8%) | 76 (34.2%) |
| Total (Overall) | 271 (47.5%) | 300 (52.5%) |
Sales and Office Occupations
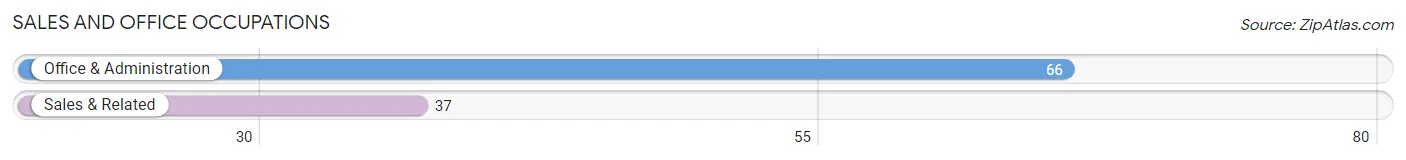
The most common Sales and Office occupations in St Francisville are Office & Administration (66 | 11.6%), and Sales & Related (37 | 6.5%).
Sales and Office Occupations by Sex
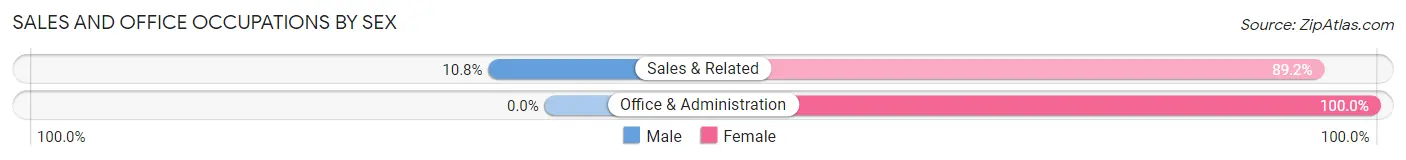
| Occupation | Male | Female |
| Sales & Related | 4 (10.8%) | 33 (89.2%) |
| Office & Administration | 0 (0.0%) | 66 (100.0%) |
| Total (Category) | 4 (3.9%) | 99 (96.1%) |
| Total (Overall) | 271 (47.5%) | 300 (52.5%) |
Natural Resources, Construction and Maintenance Occupations
The most common Natural Resources, Construction and Maintenance occupations in St Francisville are Construction & Extraction (29 | 5.1%), and Installation, Maintenance & Repair (22 | 3.8%).
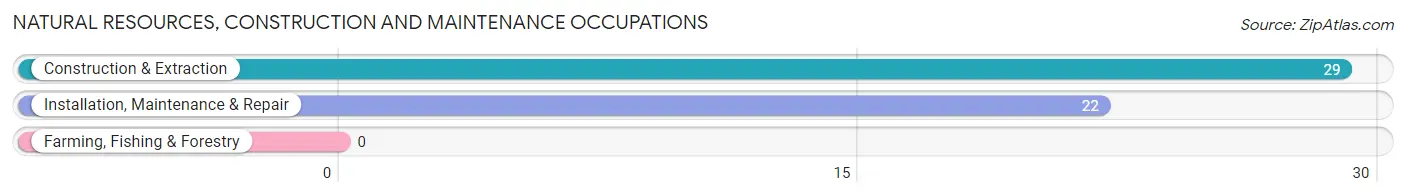
Natural Resources, Construction and Maintenance Occupations by Sex

| Occupation | Male | Female |
| Farming, Fishing & Forestry | 0 (0.0%) | 0 (0.0%) |
| Construction & Extraction | 29 (100.0%) | 0 (0.0%) |
| Installation, Maintenance & Repair | 22 (100.0%) | 0 (0.0%) |
| Total (Category) | 51 (100.0%) | 0 (0.0%) |
| Total (Overall) | 271 (47.5%) | 300 (52.5%) |
Production, Transportation and Moving Occupations
The most common Production, Transportation and Moving occupations in St Francisville are Material Moving (17 | 3.0%), Transportation (13 | 2.3%), and Production (6 | 1.1%).
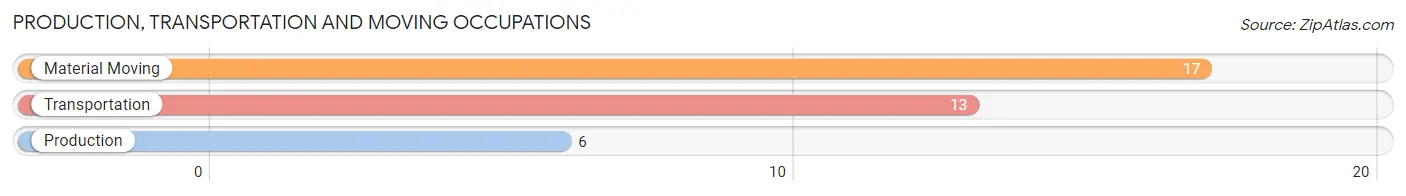
Production, Transportation and Moving Occupations by Sex
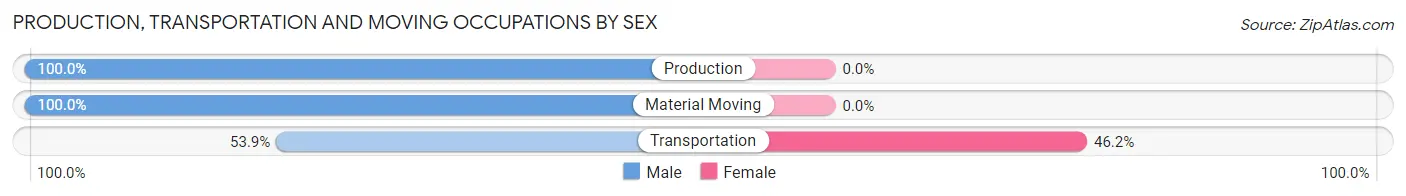
| Occupation | Male | Female |
| Production | 6 (100.0%) | 0 (0.0%) |
| Transportation | 7 (53.8%) | 6 (46.2%) |
| Material Moving | 17 (100.0%) | 0 (0.0%) |
| Total (Category) | 30 (83.3%) | 6 (16.7%) |
| Total (Overall) | 271 (47.5%) | 300 (52.5%) |
Employment Industries by Sex in St Francisville
Employment Industries in St Francisville
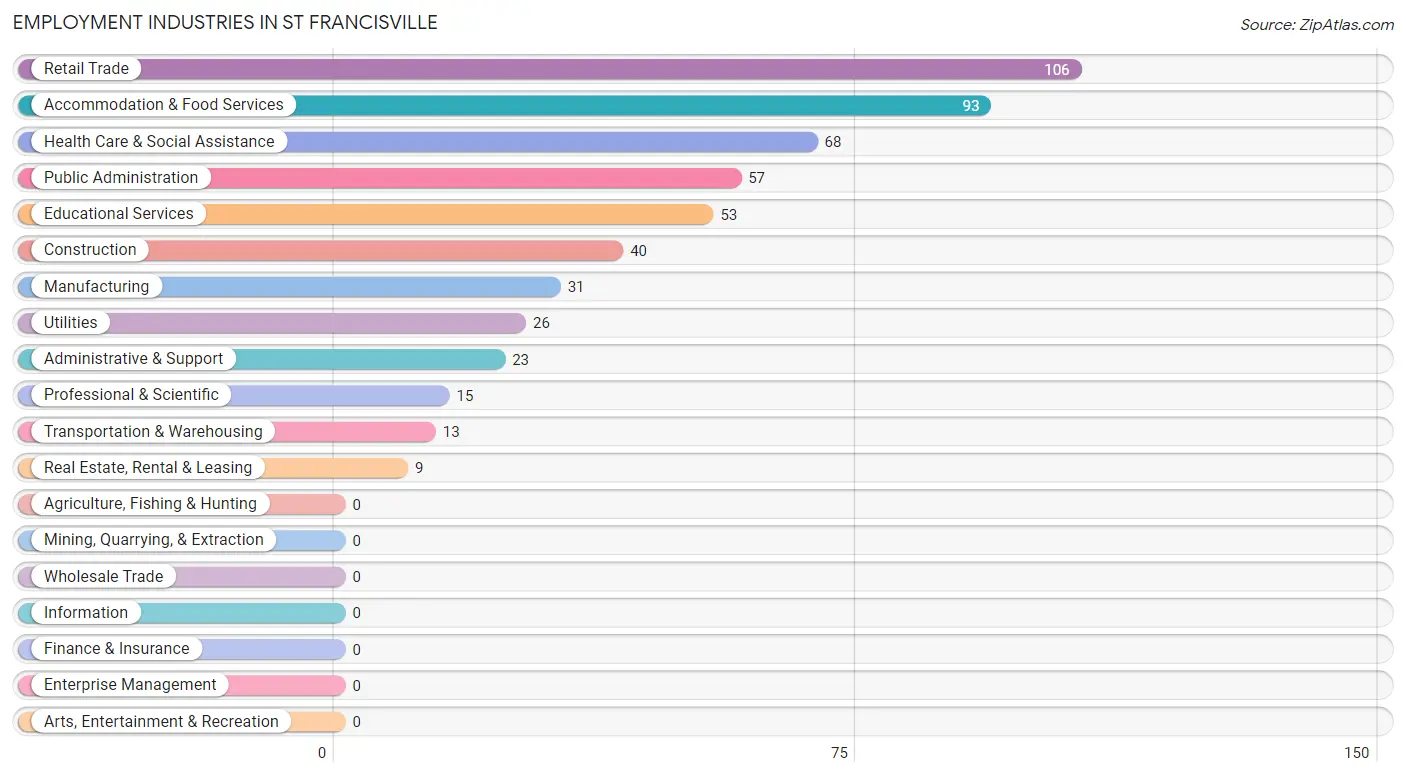
The major employment industries in St Francisville include Retail Trade (106 | 18.6%), Accommodation & Food Services (93 | 16.3%), Health Care & Social Assistance (68 | 11.9%), Public Administration (57 | 10.0%), and Educational Services (53 | 9.3%).
Employment Industries by Sex in St Francisville
The St Francisville industries that see more men than women are Construction (100.0%), Utilities (100.0%), and Manufacturing (61.3%), whereas the industries that tend to have a higher number of women are Real Estate, Rental & Leasing (100.0%), Administrative & Support (100.0%), and Health Care & Social Assistance (83.8%).
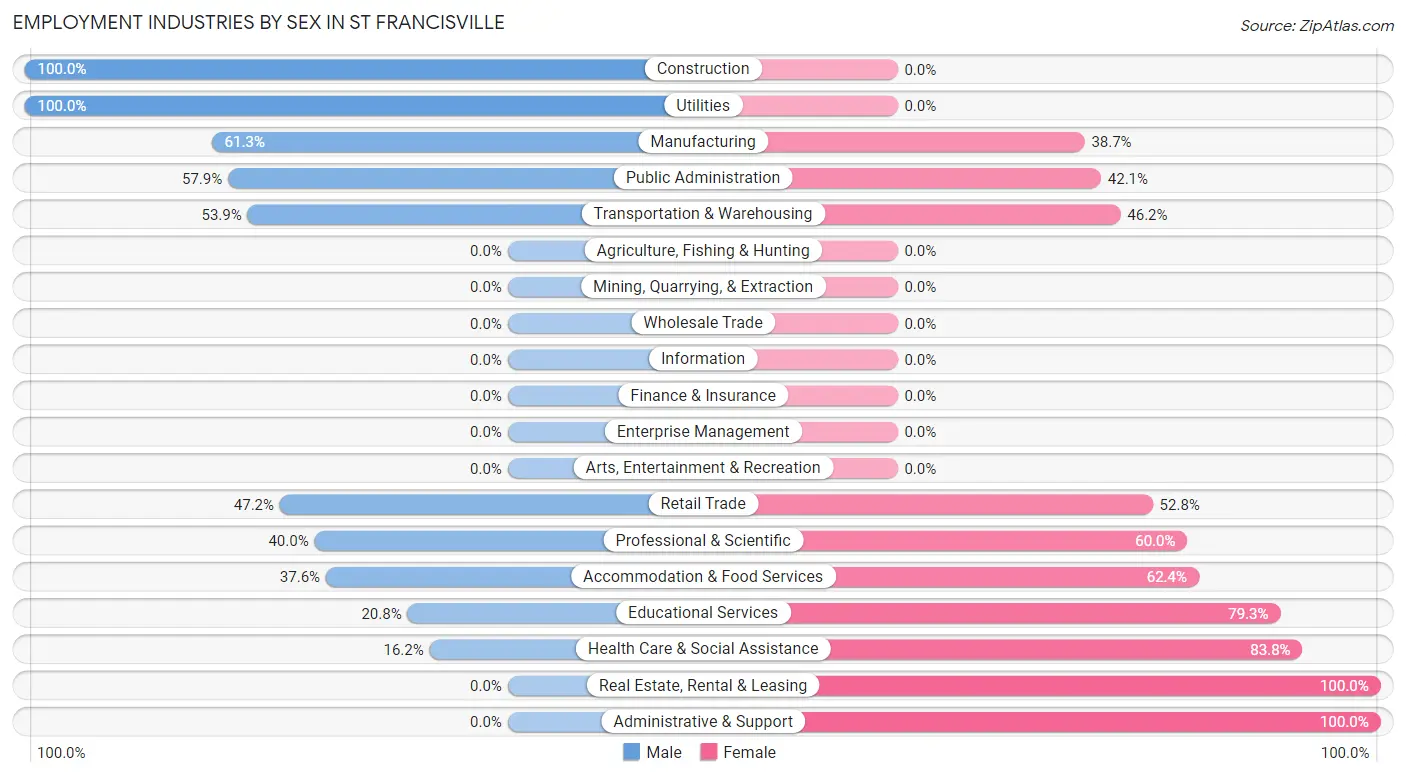
| Industry | Male | Female |
| Agriculture, Fishing & Hunting | 0 (0.0%) | 0 (0.0%) |
| Mining, Quarrying, & Extraction | 0 (0.0%) | 0 (0.0%) |
| Construction | 40 (100.0%) | 0 (0.0%) |
| Manufacturing | 19 (61.3%) | 12 (38.7%) |
| Wholesale Trade | 0 (0.0%) | 0 (0.0%) |
| Retail Trade | 50 (47.2%) | 56 (52.8%) |
| Transportation & Warehousing | 7 (53.8%) | 6 (46.2%) |
| Utilities | 26 (100.0%) | 0 (0.0%) |
| Information | 0 (0.0%) | 0 (0.0%) |
| Finance & Insurance | 0 (0.0%) | 0 (0.0%) |
| Real Estate, Rental & Leasing | 0 (0.0%) | 9 (100.0%) |
| Professional & Scientific | 6 (40.0%) | 9 (60.0%) |
| Enterprise Management | 0 (0.0%) | 0 (0.0%) |
| Administrative & Support | 0 (0.0%) | 23 (100.0%) |
| Educational Services | 11 (20.7%) | 42 (79.2%) |
| Health Care & Social Assistance | 11 (16.2%) | 57 (83.8%) |
| Arts, Entertainment & Recreation | 0 (0.0%) | 0 (0.0%) |
| Accommodation & Food Services | 35 (37.6%) | 58 (62.4%) |
| Public Administration | 33 (57.9%) | 24 (42.1%) |
| Total | 271 (47.5%) | 300 (52.5%) |
Education in St Francisville
School Enrollment in St Francisville
The most common levels of schooling among the 359 students in St Francisville are college / undergraduate (102 | 28.4%), middle school (96 | 26.7%), and elementary school (83 | 23.1%).
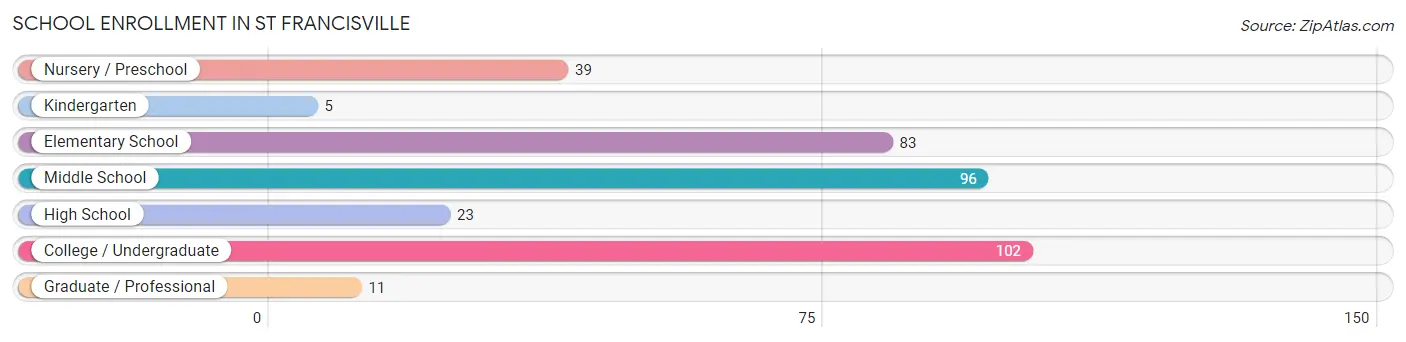
| School Level | # Students | % Students |
| Nursery / Preschool | 39 | 10.9% |
| Kindergarten | 5 | 1.4% |
| Elementary School | 83 | 23.1% |
| Middle School | 96 | 26.7% |
| High School | 23 | 6.4% |
| College / Undergraduate | 102 | 28.4% |
| Graduate / Professional | 11 | 3.1% |
| Total | 359 | 100.0% |
School Enrollment by Age by Funding Source in St Francisville
Out of a total of 359 students who are enrolled in schools in St Francisville, 72 (20.1%) attend a private institution, while the remaining 287 (79.9%) are enrolled in public schools. The age group of 3 to 4 year olds has the highest likelihood of being enrolled in private schools, with 13 (72.2% in the age bracket) enrolled. Conversely, the age group of 5 to 9 year old has the lowest likelihood of being enrolled in a private school, with 100 (100.0% in the age bracket) attending a public institution.
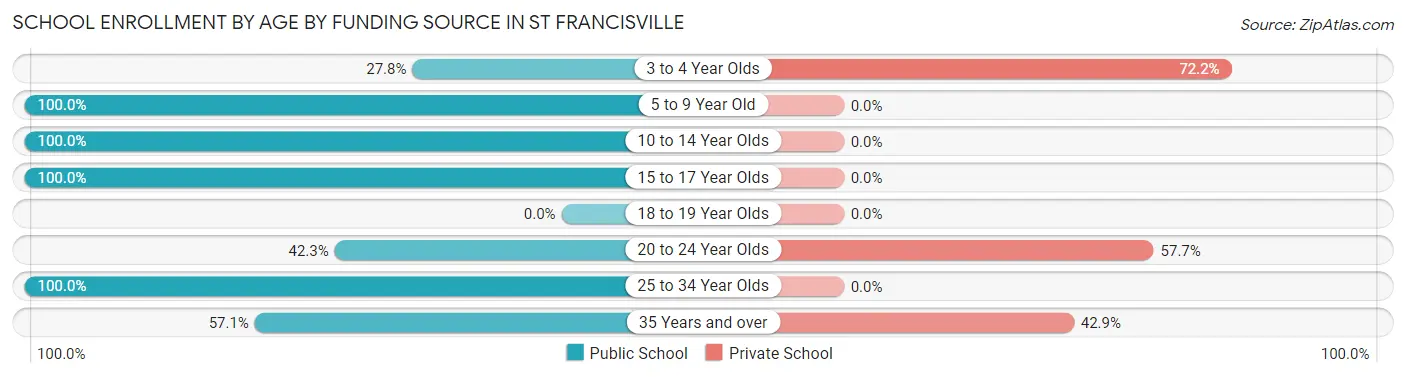
| Age Bracket | Public School | Private School |
| 3 to 4 Year Olds | 5 (27.8%) | 13 (72.2%) |
| 5 to 9 Year Old | 100 (100.0%) | 0 (0.0%) |
| 10 to 14 Year Olds | 71 (100.0%) | 0 (0.0%) |
| 15 to 17 Year Olds | 53 (100.0%) | 0 (0.0%) |
| 18 to 19 Year Olds | 0 (0.0%) | 0 (0.0%) |
| 20 to 24 Year Olds | 41 (42.3%) | 56 (57.7%) |
| 25 to 34 Year Olds | 13 (100.0%) | 0 (0.0%) |
| 35 Years and over | 4 (57.1%) | 3 (42.9%) |
| Total | 287 (79.9%) | 72 (20.1%) |
Educational Attainment by Field of Study in St Francisville
Education (56 | 27.2%), visual & performing arts (24 | 11.7%), liberal arts & history (22 | 10.7%), engineering (21 | 10.2%), and business (20 | 9.7%) are the most common fields of study among 206 individuals in St Francisville who have obtained a bachelor's degree or higher.
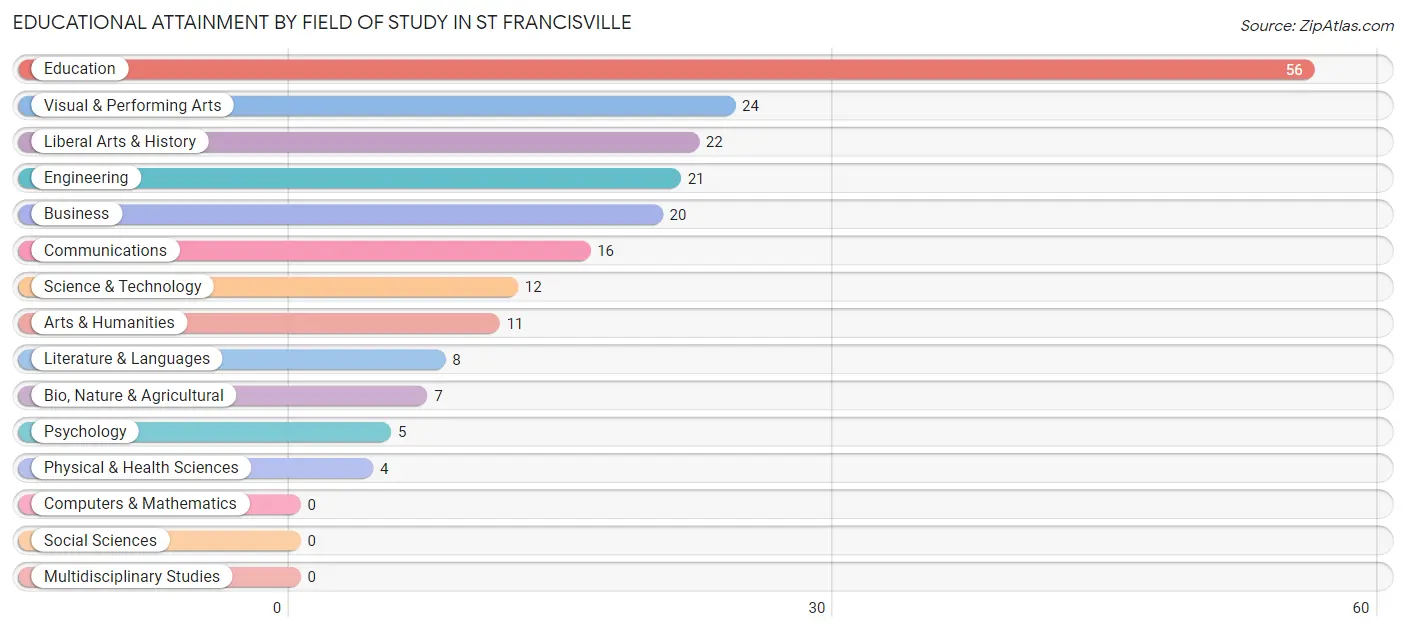
| Field of Study | # Graduates | % Graduates |
| Computers & Mathematics | 0 | 0.0% |
| Bio, Nature & Agricultural | 7 | 3.4% |
| Physical & Health Sciences | 4 | 1.9% |
| Psychology | 5 | 2.4% |
| Social Sciences | 0 | 0.0% |
| Engineering | 21 | 10.2% |
| Multidisciplinary Studies | 0 | 0.0% |
| Science & Technology | 12 | 5.8% |
| Business | 20 | 9.7% |
| Education | 56 | 27.2% |
| Literature & Languages | 8 | 3.9% |
| Liberal Arts & History | 22 | 10.7% |
| Visual & Performing Arts | 24 | 11.7% |
| Communications | 16 | 7.8% |
| Arts & Humanities | 11 | 5.3% |
| Total | 206 | 100.0% |
Transportation & Commute in St Francisville
Vehicle Availability by Sex in St Francisville
The most prevalent vehicle ownership categories in St Francisville are males with 2 vehicles (92, accounting for 32.3%) and females with 2 vehicles (132, making up 31.0%).
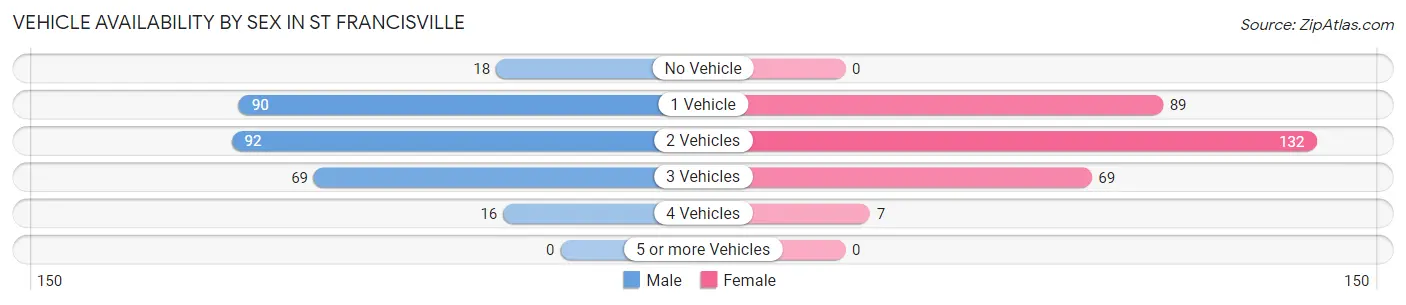
| Vehicles Available | Male | Female |
| No Vehicle | 18 (6.3%) | 0 (0.0%) |
| 1 Vehicle | 90 (31.6%) | 89 (30.0%) |
| 2 Vehicles | 92 (32.3%) | 132 (44.4%) |
| 3 Vehicles | 69 (24.2%) | 69 (23.2%) |
| 4 Vehicles | 16 (5.6%) | 7 (2.4%) |
| 5 or more Vehicles | 0 (0.0%) | 0 (0.0%) |
| Total | 285 (100.0%) | 297 (100.0%) |
Commute Time in St Francisville
The most frequently occuring commute durations in St Francisville are 5 to 9 minutes (188 commuters, 33.6%), 20 to 24 minutes (83 commuters, 14.8%), and 10 to 14 minutes (65 commuters, 11.6%).
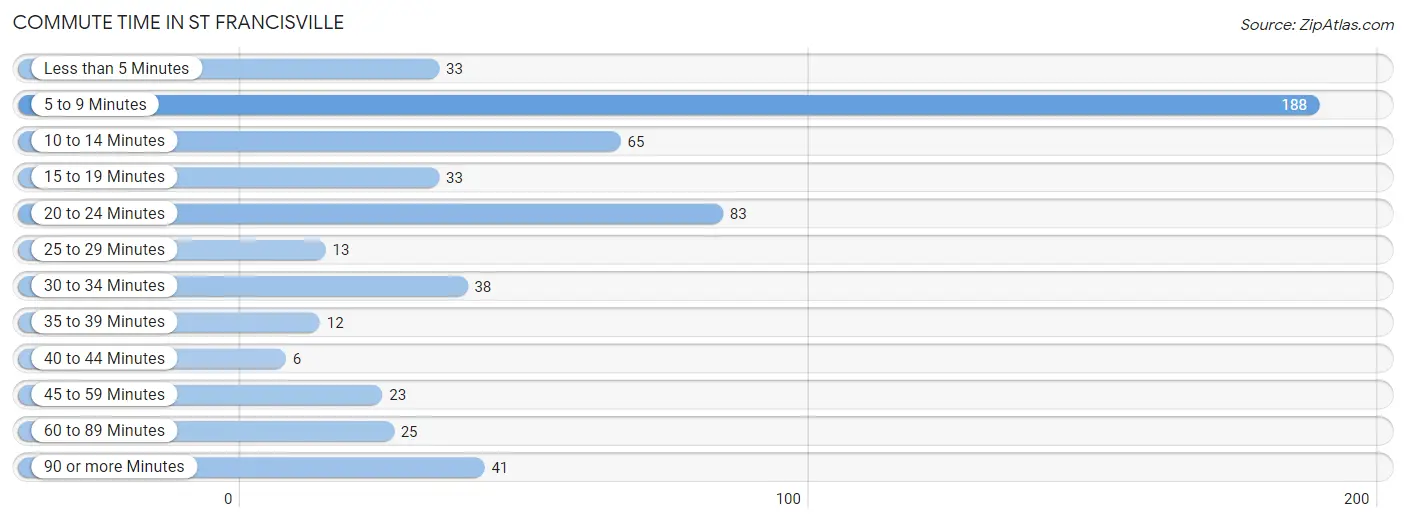
| Commute Time | # Commuters | % Commuters |
| Less than 5 Minutes | 33 | 5.9% |
| 5 to 9 Minutes | 188 | 33.6% |
| 10 to 14 Minutes | 65 | 11.6% |
| 15 to 19 Minutes | 33 | 5.9% |
| 20 to 24 Minutes | 83 | 14.8% |
| 25 to 29 Minutes | 13 | 2.3% |
| 30 to 34 Minutes | 38 | 6.8% |
| 35 to 39 Minutes | 12 | 2.1% |
| 40 to 44 Minutes | 6 | 1.1% |
| 45 to 59 Minutes | 23 | 4.1% |
| 60 to 89 Minutes | 25 | 4.5% |
| 90 or more Minutes | 41 | 7.3% |
Commute Time by Sex in St Francisville
The most common commute times in St Francisville are 20 to 24 minutes (57 commuters, 20.4%) for males and 5 to 9 minutes (140 commuters, 49.8%) for females.
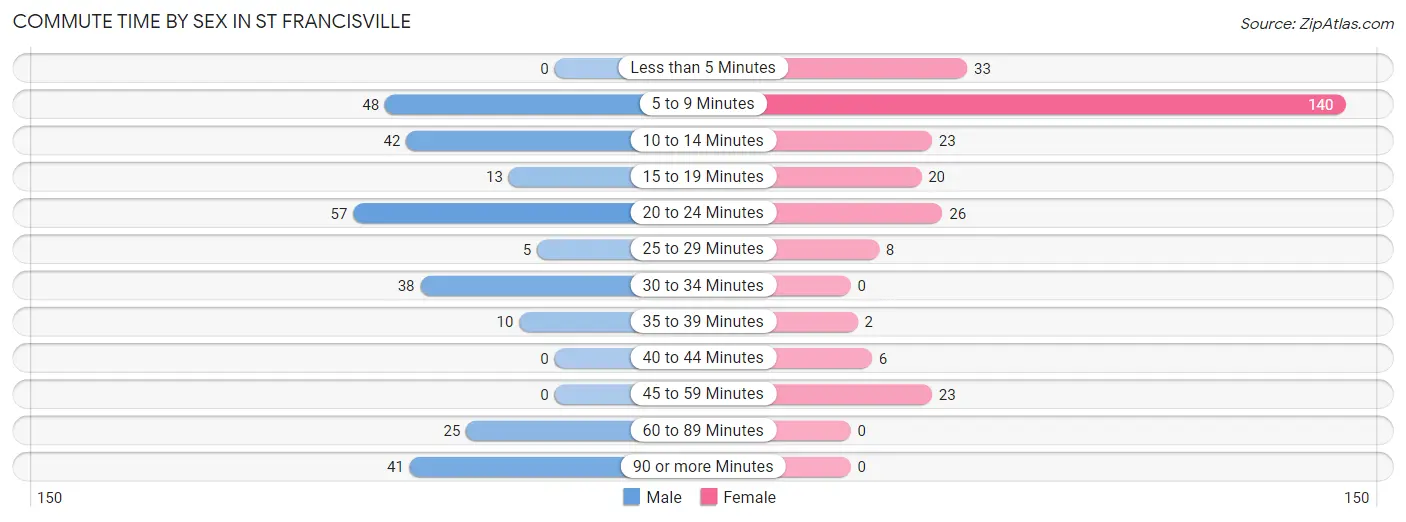
| Commute Time | Male | Female |
| Less than 5 Minutes | 0 (0.0%) | 33 (11.7%) |
| 5 to 9 Minutes | 48 (17.2%) | 140 (49.8%) |
| 10 to 14 Minutes | 42 (15.0%) | 23 (8.2%) |
| 15 to 19 Minutes | 13 (4.7%) | 20 (7.1%) |
| 20 to 24 Minutes | 57 (20.4%) | 26 (9.2%) |
| 25 to 29 Minutes | 5 (1.8%) | 8 (2.9%) |
| 30 to 34 Minutes | 38 (13.6%) | 0 (0.0%) |
| 35 to 39 Minutes | 10 (3.6%) | 2 (0.7%) |
| 40 to 44 Minutes | 0 (0.0%) | 6 (2.1%) |
| 45 to 59 Minutes | 0 (0.0%) | 23 (8.2%) |
| 60 to 89 Minutes | 25 (9.0%) | 0 (0.0%) |
| 90 or more Minutes | 41 (14.7%) | 0 (0.0%) |
Time of Departure to Work by Sex in St Francisville
The most frequent times of departure to work in St Francisville are 12:00 AM to 4:59 AM (104, 37.3%) for males and 8:00 AM to 8:29 AM (52, 18.5%) for females.
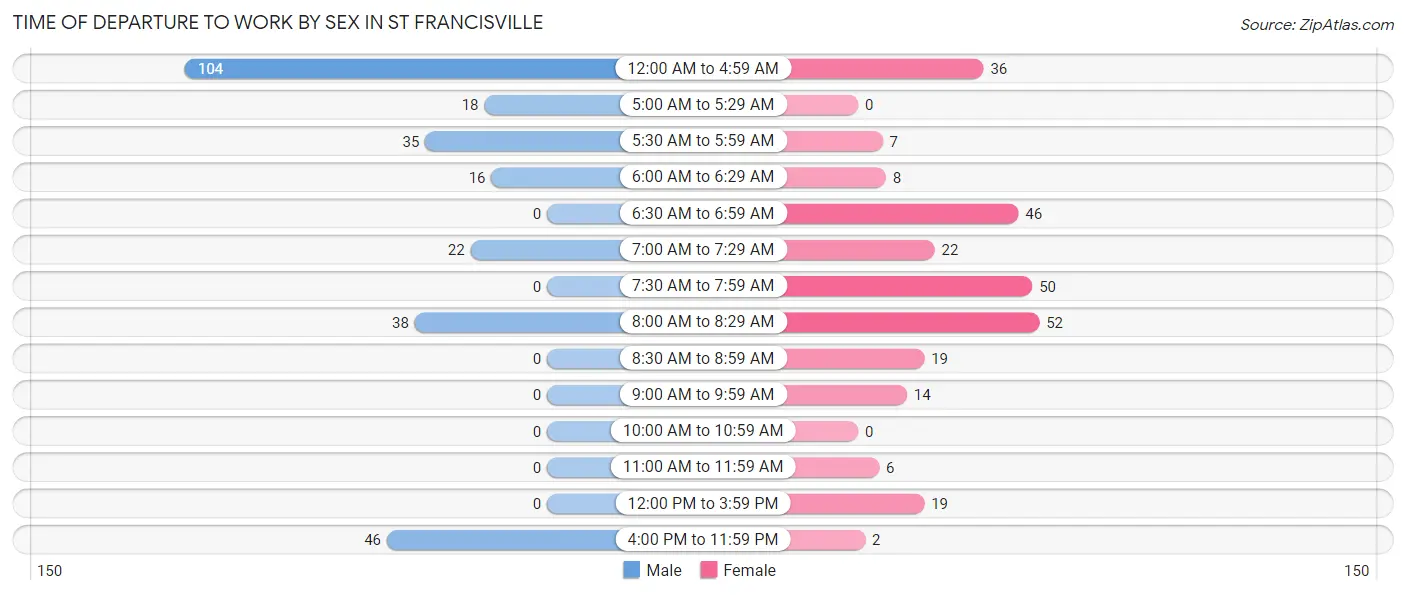
| Time of Departure | Male | Female |
| 12:00 AM to 4:59 AM | 104 (37.3%) | 36 (12.8%) |
| 5:00 AM to 5:29 AM | 18 (6.5%) | 0 (0.0%) |
| 5:30 AM to 5:59 AM | 35 (12.5%) | 7 (2.5%) |
| 6:00 AM to 6:29 AM | 16 (5.7%) | 8 (2.9%) |
| 6:30 AM to 6:59 AM | 0 (0.0%) | 46 (16.4%) |
| 7:00 AM to 7:29 AM | 22 (7.9%) | 22 (7.8%) |
| 7:30 AM to 7:59 AM | 0 (0.0%) | 50 (17.8%) |
| 8:00 AM to 8:29 AM | 38 (13.6%) | 52 (18.5%) |
| 8:30 AM to 8:59 AM | 0 (0.0%) | 19 (6.8%) |
| 9:00 AM to 9:59 AM | 0 (0.0%) | 14 (5.0%) |
| 10:00 AM to 10:59 AM | 0 (0.0%) | 0 (0.0%) |
| 11:00 AM to 11:59 AM | 0 (0.0%) | 6 (2.1%) |
| 12:00 PM to 3:59 PM | 0 (0.0%) | 19 (6.8%) |
| 4:00 PM to 11:59 PM | 46 (16.5%) | 2 (0.7%) |
| Total | 279 (100.0%) | 281 (100.0%) |
Housing Occupancy in St Francisville
Occupancy by Ownership in St Francisville
Of the total 595 dwellings in St Francisville, owner-occupied units account for 287 (48.2%), while renter-occupied units make up 308 (51.8%).
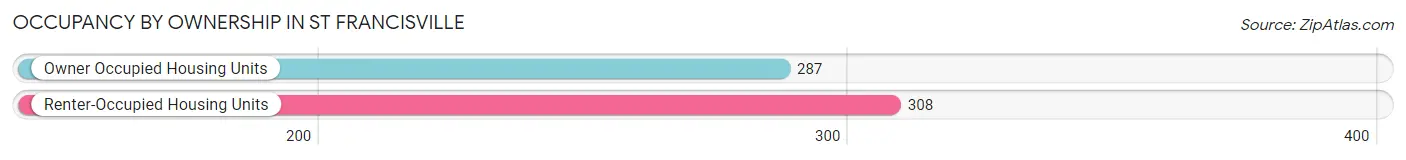
| Occupancy | # Housing Units | % Housing Units |
| Owner Occupied Housing Units | 287 | 48.2% |
| Renter-Occupied Housing Units | 308 | 51.8% |
| Total Occupied Housing Units | 595 | 100.0% |
Occupancy by Household Size in St Francisville
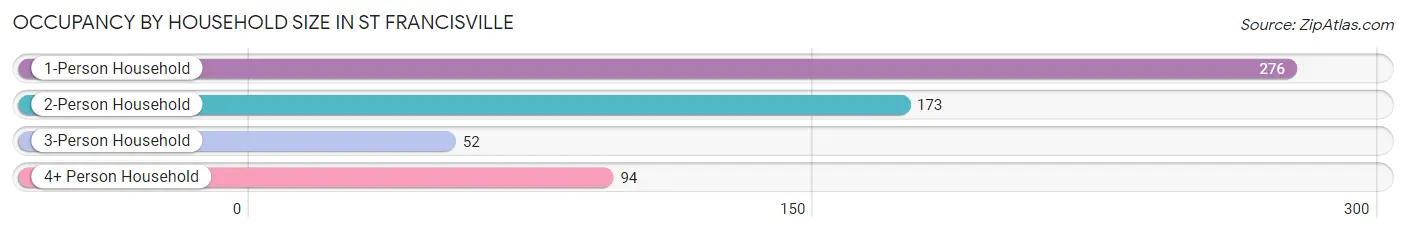
| Household Size | # Housing Units | % Housing Units |
| 1-Person Household | 276 | 46.4% |
| 2-Person Household | 173 | 29.1% |
| 3-Person Household | 52 | 8.7% |
| 4+ Person Household | 94 | 15.8% |
| Total Housing Units | 595 | 100.0% |
Occupancy by Ownership by Household Size in St Francisville
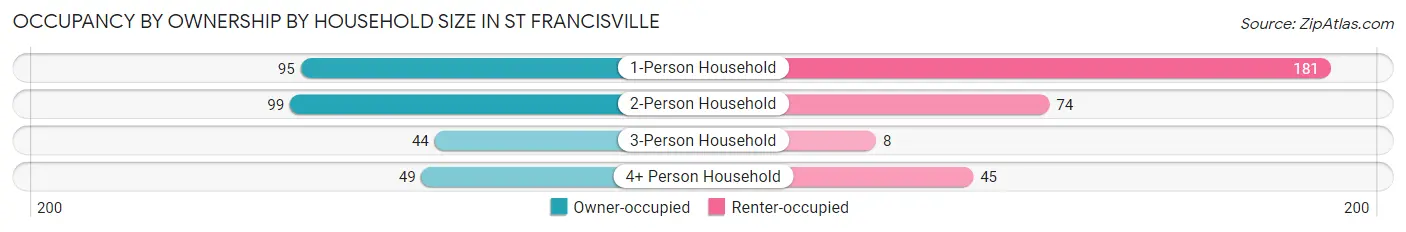
| Household Size | Owner-occupied | Renter-occupied |
| 1-Person Household | 95 (34.4%) | 181 (65.6%) |
| 2-Person Household | 99 (57.2%) | 74 (42.8%) |
| 3-Person Household | 44 (84.6%) | 8 (15.4%) |
| 4+ Person Household | 49 (52.1%) | 45 (47.9%) |
| Total Housing Units | 287 (48.2%) | 308 (51.8%) |
Occupancy by Educational Attainment in St Francisville
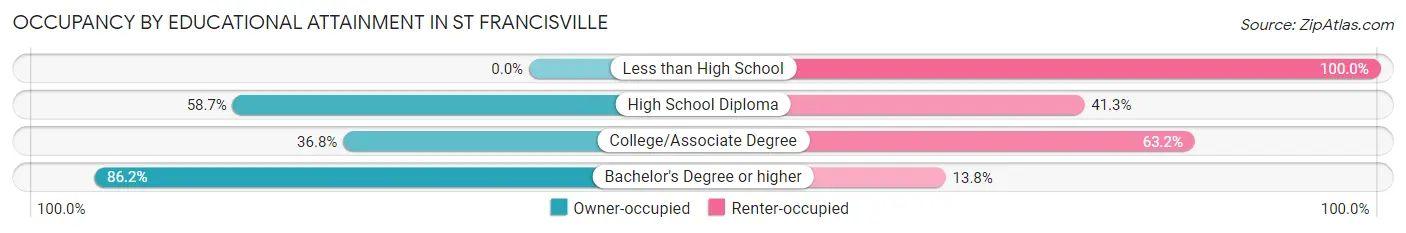
| Household Size | Owner-occupied | Renter-occupied |
| Less than High School | 0 (0.0%) | 86 (100.0%) |
| High School Diploma | 84 (58.7%) | 59 (41.3%) |
| College/Associate Degree | 84 (36.8%) | 144 (63.2%) |
| Bachelor's Degree or higher | 119 (86.2%) | 19 (13.8%) |
Occupancy by Age of Householder in St Francisville
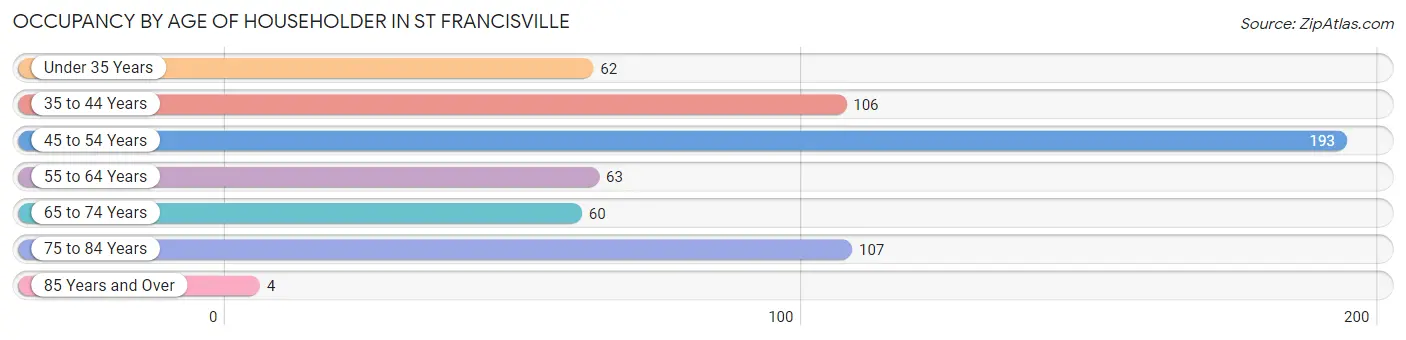
| Age Bracket | # Households | % Households |
| Under 35 Years | 62 | 10.4% |
| 35 to 44 Years | 106 | 17.8% |
| 45 to 54 Years | 193 | 32.4% |
| 55 to 64 Years | 63 | 10.6% |
| 65 to 74 Years | 60 | 10.1% |
| 75 to 84 Years | 107 | 18.0% |
| 85 Years and Over | 4 | 0.7% |
| Total | 595 | 100.0% |
Housing Finances in St Francisville
Median Income by Occupancy in St Francisville
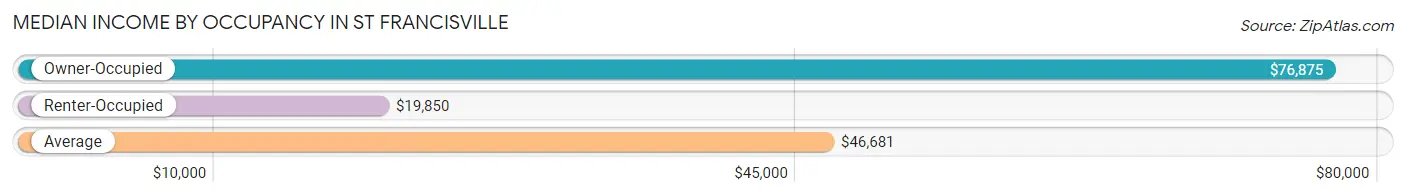
| Occupancy Type | # Households | Median Income |
| Owner-Occupied | 287 (48.2%) | $76,875 |
| Renter-Occupied | 308 (51.8%) | $19,850 |
| Average | 595 (100.0%) | $46,681 |
Occupancy by Householder Income Bracket in St Francisville

| Income Bracket | Owner-occupied | Renter-occupied |
| Less than $5,000 | 0 (0.0%) | 7 (2.3%) |
| $5,000 to $9,999 | 10 (3.5%) | 30 (9.7%) |
| $10,000 to $14,999 | 0 (0.0%) | 70 (22.7%) |
| $15,000 to $19,999 | 1 (0.4%) | 50 (16.2%) |
| $20,000 to $24,999 | 14 (4.9%) | 18 (5.8%) |
| $25,000 to $34,999 | 10 (3.5%) | 68 (22.1%) |
| $35,000 to $49,999 | 29 (10.1%) | 16 (5.2%) |
| $50,000 to $74,999 | 69 (24.0%) | 22 (7.1%) |
| $75,000 to $99,999 | 87 (30.3%) | 8 (2.6%) |
| $100,000 to $149,999 | 31 (10.8%) | 19 (6.2%) |
| $150,000 or more | 36 (12.5%) | 0 (0.0%) |
| Total | 287 (100.0%) | 308 (100.0%) |
Monthly Housing Cost Tiers in St Francisville
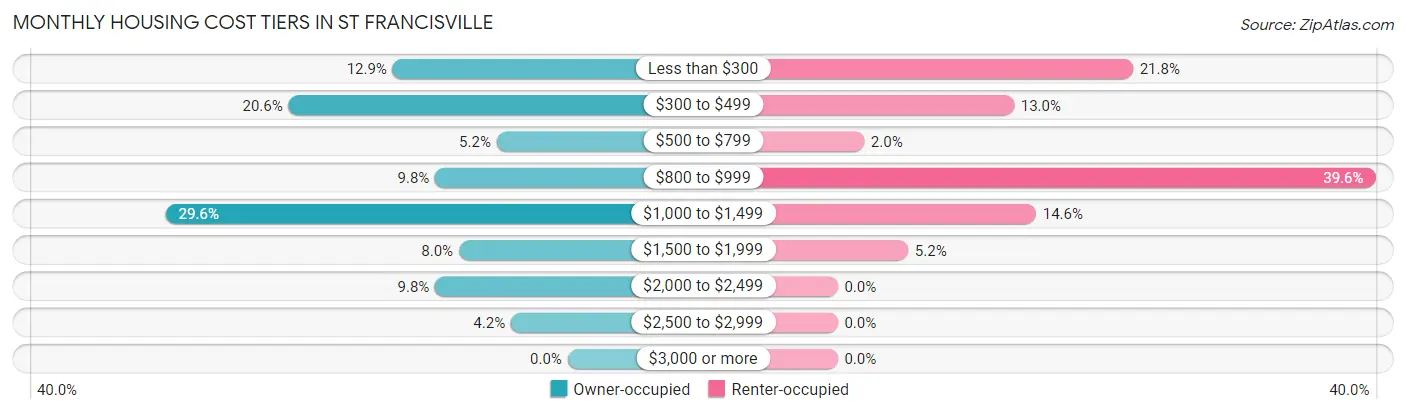
| Monthly Cost | Owner-occupied | Renter-occupied |
| Less than $300 | 37 (12.9%) | 67 (21.7%) |
| $300 to $499 | 59 (20.6%) | 40 (13.0%) |
| $500 to $799 | 15 (5.2%) | 6 (1.9%) |
| $800 to $999 | 28 (9.8%) | 122 (39.6%) |
| $1,000 to $1,499 | 85 (29.6%) | 45 (14.6%) |
| $1,500 to $1,999 | 23 (8.0%) | 16 (5.2%) |
| $2,000 to $2,499 | 28 (9.8%) | 0 (0.0%) |
| $2,500 to $2,999 | 12 (4.2%) | 0 (0.0%) |
| $3,000 or more | 0 (0.0%) | 0 (0.0%) |
| Total | 287 (100.0%) | 308 (100.0%) |
Physical Housing Characteristics in St Francisville
Housing Structures in St Francisville
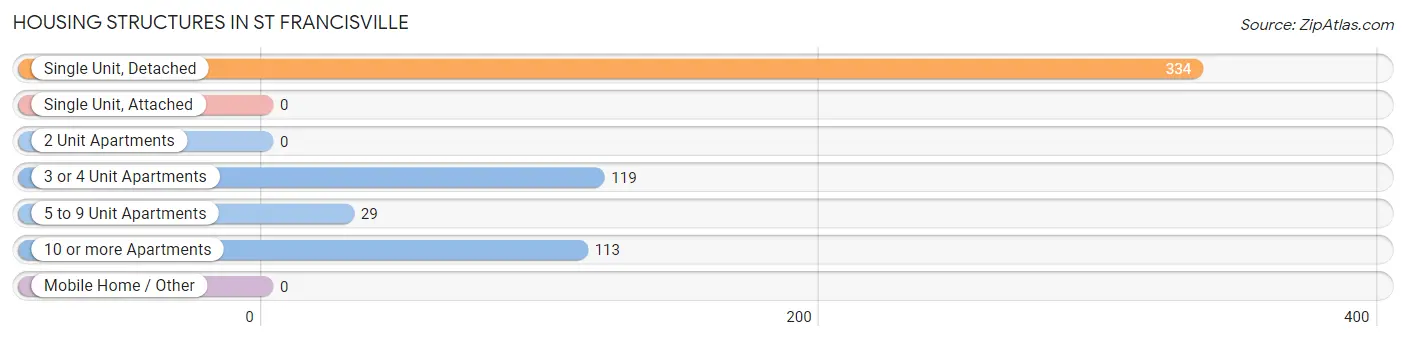
| Structure Type | # Housing Units | % Housing Units |
| Single Unit, Detached | 334 | 56.1% |
| Single Unit, Attached | 0 | 0.0% |
| 2 Unit Apartments | 0 | 0.0% |
| 3 or 4 Unit Apartments | 119 | 20.0% |
| 5 to 9 Unit Apartments | 29 | 4.9% |
| 10 or more Apartments | 113 | 19.0% |
| Mobile Home / Other | 0 | 0.0% |
| Total | 595 | 100.0% |
Housing Structures by Occupancy in St Francisville
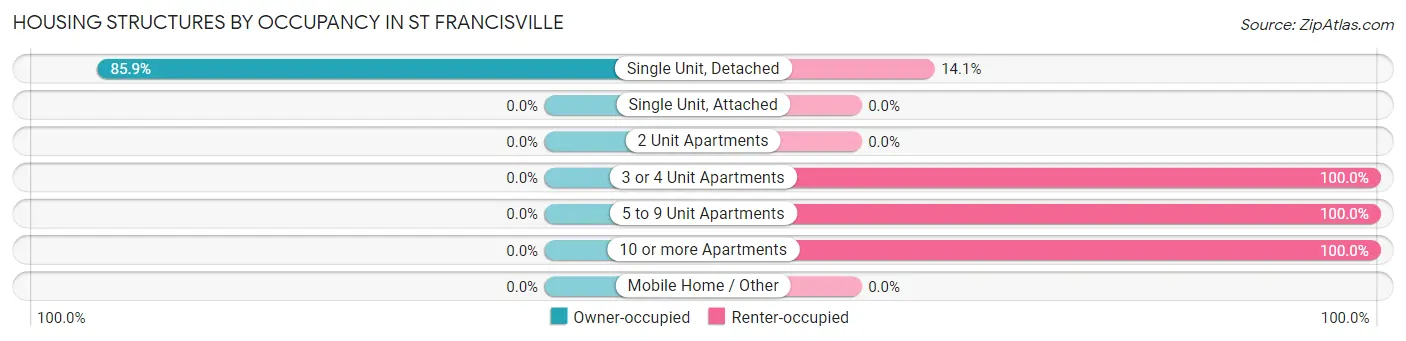
| Structure Type | Owner-occupied | Renter-occupied |
| Single Unit, Detached | 287 (85.9%) | 47 (14.1%) |
| Single Unit, Attached | 0 (0.0%) | 0 (0.0%) |
| 2 Unit Apartments | 0 (0.0%) | 0 (0.0%) |
| 3 or 4 Unit Apartments | 0 (0.0%) | 119 (100.0%) |
| 5 to 9 Unit Apartments | 0 (0.0%) | 29 (100.0%) |
| 10 or more Apartments | 0 (0.0%) | 113 (100.0%) |
| Mobile Home / Other | 0 (0.0%) | 0 (0.0%) |
| Total | 287 (48.2%) | 308 (51.8%) |
Housing Structures by Number of Rooms in St Francisville
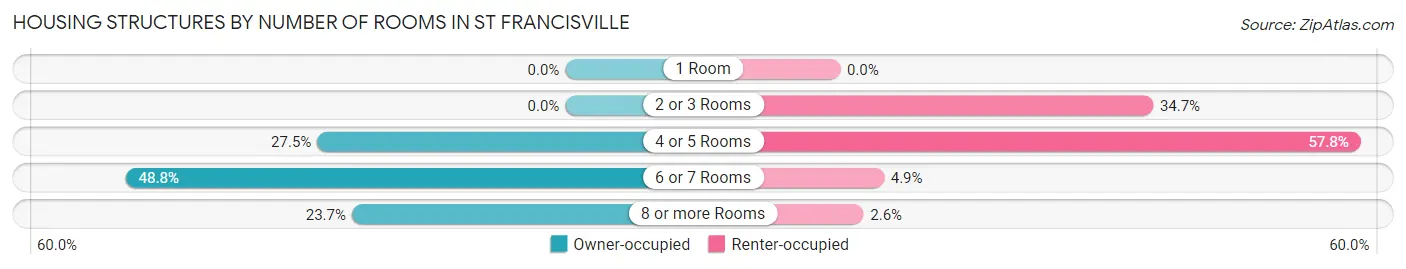
| Number of Rooms | Owner-occupied | Renter-occupied |
| 1 Room | 0 (0.0%) | 0 (0.0%) |
| 2 or 3 Rooms | 0 (0.0%) | 107 (34.7%) |
| 4 or 5 Rooms | 79 (27.5%) | 178 (57.8%) |
| 6 or 7 Rooms | 140 (48.8%) | 15 (4.9%) |
| 8 or more Rooms | 68 (23.7%) | 8 (2.6%) |
| Total | 287 (100.0%) | 308 (100.0%) |
Housing Structure by Heating Type in St Francisville
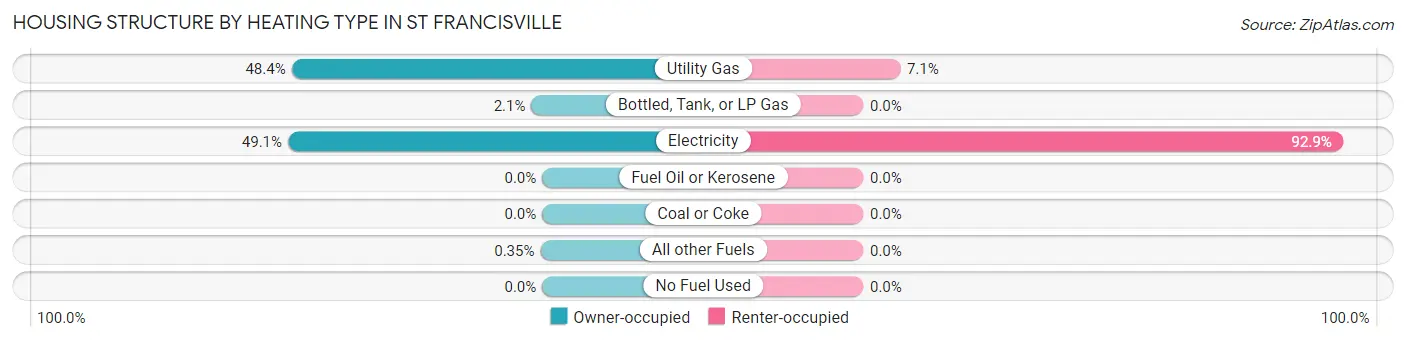
| Heating Type | Owner-occupied | Renter-occupied |
| Utility Gas | 139 (48.4%) | 22 (7.1%) |
| Bottled, Tank, or LP Gas | 6 (2.1%) | 0 (0.0%) |
| Electricity | 141 (49.1%) | 286 (92.9%) |
| Fuel Oil or Kerosene | 0 (0.0%) | 0 (0.0%) |
| Coal or Coke | 0 (0.0%) | 0 (0.0%) |
| All other Fuels | 1 (0.4%) | 0 (0.0%) |
| No Fuel Used | 0 (0.0%) | 0 (0.0%) |
| Total | 287 (100.0%) | 308 (100.0%) |
Household Vehicle Usage in St Francisville
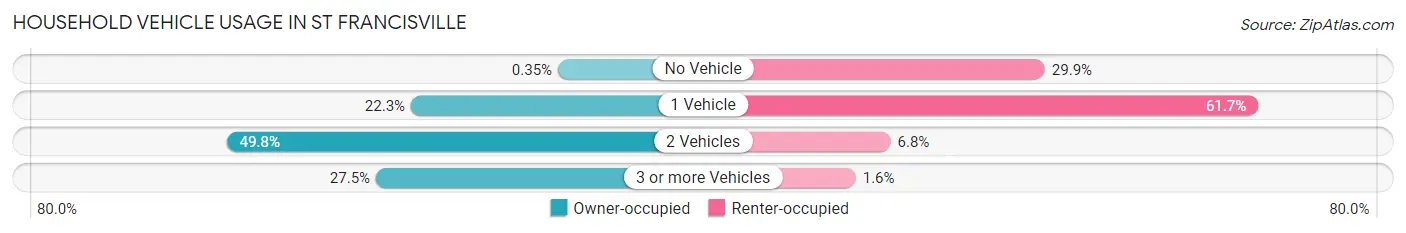
| Vehicles per Household | Owner-occupied | Renter-occupied |
| No Vehicle | 1 (0.4%) | 92 (29.9%) |
| 1 Vehicle | 64 (22.3%) | 190 (61.7%) |
| 2 Vehicles | 143 (49.8%) | 21 (6.8%) |
| 3 or more Vehicles | 79 (27.5%) | 5 (1.6%) |
| Total | 287 (100.0%) | 308 (100.0%) |
Real Estate & Mortgages in St Francisville
Real Estate and Mortgage Overview in St Francisville
| Characteristic | Without Mortgage | With Mortgage |
| Housing Units | 139 | 148 |
| Median Property Value | $269,600 | $239,000 |
| Median Household Income | $63,015 | $36 |
| Monthly Housing Costs | $402 | $0 |
| Real Estate Taxes | $1,169 | $14 |
Property Value by Mortgage Status in St Francisville
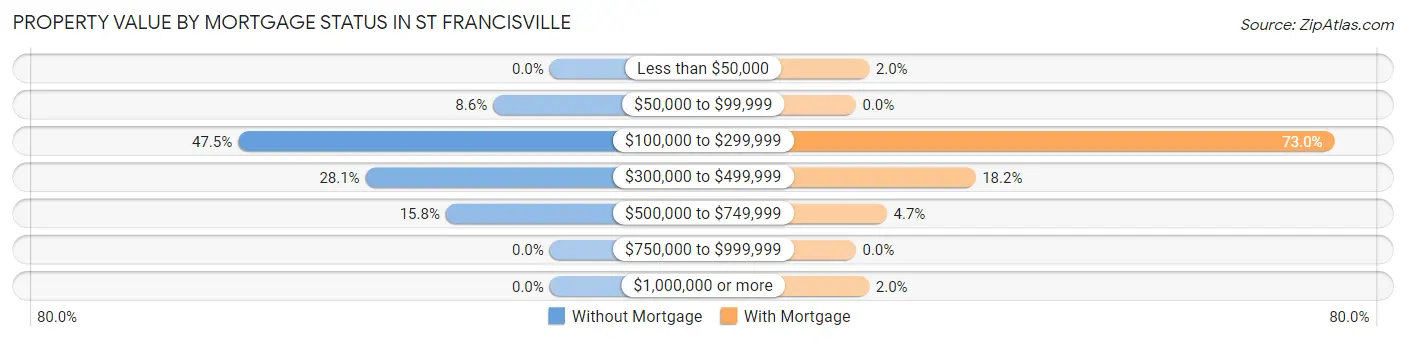
| Property Value | Without Mortgage | With Mortgage |
| Less than $50,000 | 0 (0.0%) | 3 (2.0%) |
| $50,000 to $99,999 | 12 (8.6%) | 0 (0.0%) |
| $100,000 to $299,999 | 66 (47.5%) | 108 (73.0%) |
| $300,000 to $499,999 | 39 (28.1%) | 27 (18.2%) |
| $500,000 to $749,999 | 22 (15.8%) | 7 (4.7%) |
| $750,000 to $999,999 | 0 (0.0%) | 0 (0.0%) |
| $1,000,000 or more | 0 (0.0%) | 3 (2.0%) |
| Total | 139 (100.0%) | 148 (100.0%) |
Household Income by Mortgage Status in St Francisville
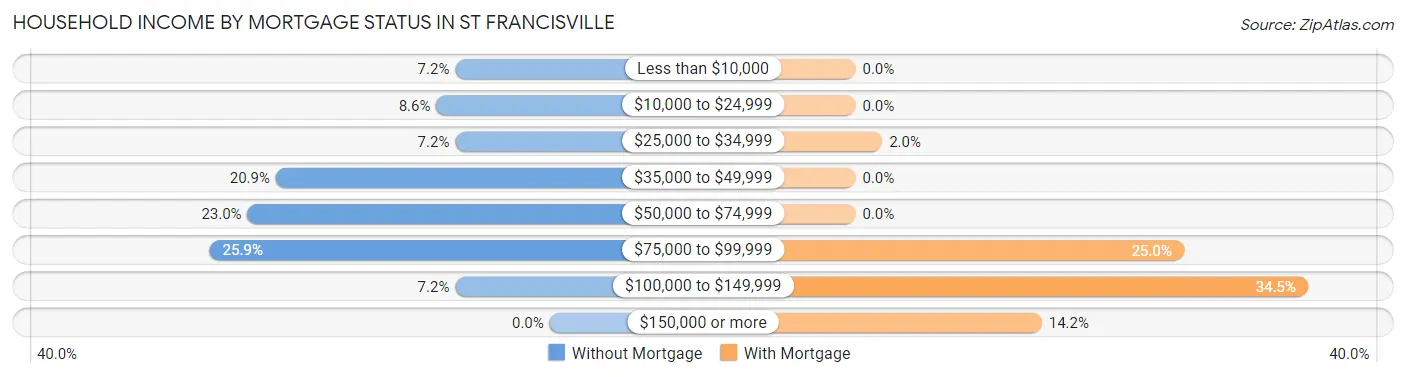
| Household Income | Without Mortgage | With Mortgage |
| Less than $10,000 | 10 (7.2%) | 0 (0.0%) |
| $10,000 to $24,999 | 12 (8.6%) | 0 (0.0%) |
| $25,000 to $34,999 | 10 (7.2%) | 3 (2.0%) |
| $35,000 to $49,999 | 29 (20.9%) | 0 (0.0%) |
| $50,000 to $74,999 | 32 (23.0%) | 0 (0.0%) |
| $75,000 to $99,999 | 36 (25.9%) | 37 (25.0%) |
| $100,000 to $149,999 | 10 (7.2%) | 51 (34.5%) |
| $150,000 or more | 0 (0.0%) | 21 (14.2%) |
| Total | 139 (100.0%) | 148 (100.0%) |
Property Value to Household Income Ratio in St Francisville
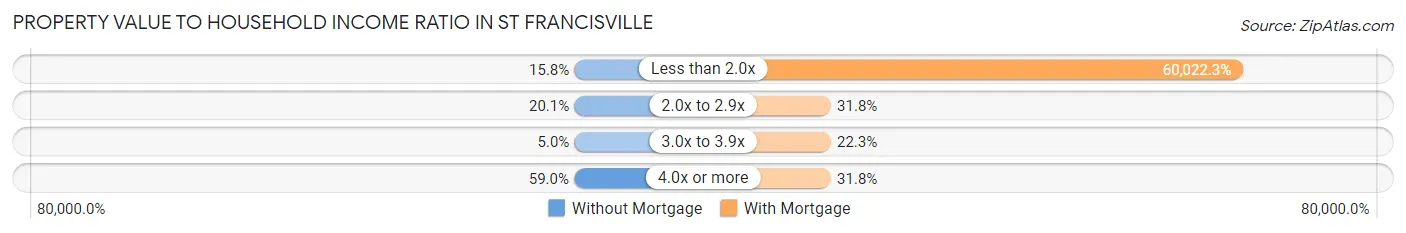
| Value-to-Income Ratio | Without Mortgage | With Mortgage |
| Less than 2.0x | 22 (15.8%) | 88,833 (60,022.3%) |
| 2.0x to 2.9x | 28 (20.1%) | 47 (31.8%) |
| 3.0x to 3.9x | 7 (5.0%) | 33 (22.3%) |
| 4.0x or more | 82 (59.0%) | 47 (31.8%) |
| Total | 139 (100.0%) | 148 (100.0%) |
Real Estate Taxes by Mortgage Status in St Francisville
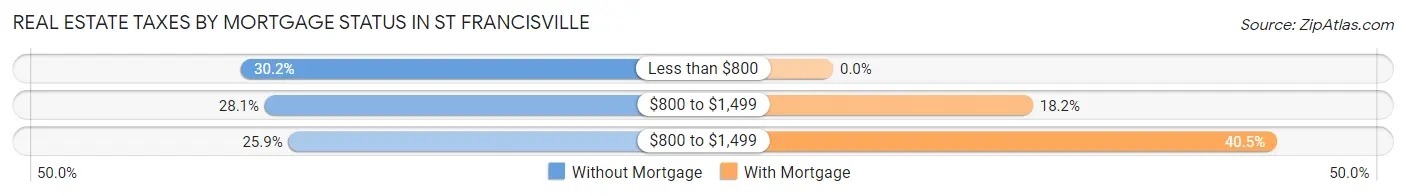
| Property Taxes | Without Mortgage | With Mortgage |
| Less than $800 | 42 (30.2%) | 0 (0.0%) |
| $800 to $1,499 | 39 (28.1%) | 27 (18.2%) |
| $800 to $1,499 | 36 (25.9%) | 60 (40.5%) |
| Total | 139 (100.0%) | 148 (100.0%) |
Health & Disability in St Francisville
Health Insurance Coverage by Age in St Francisville
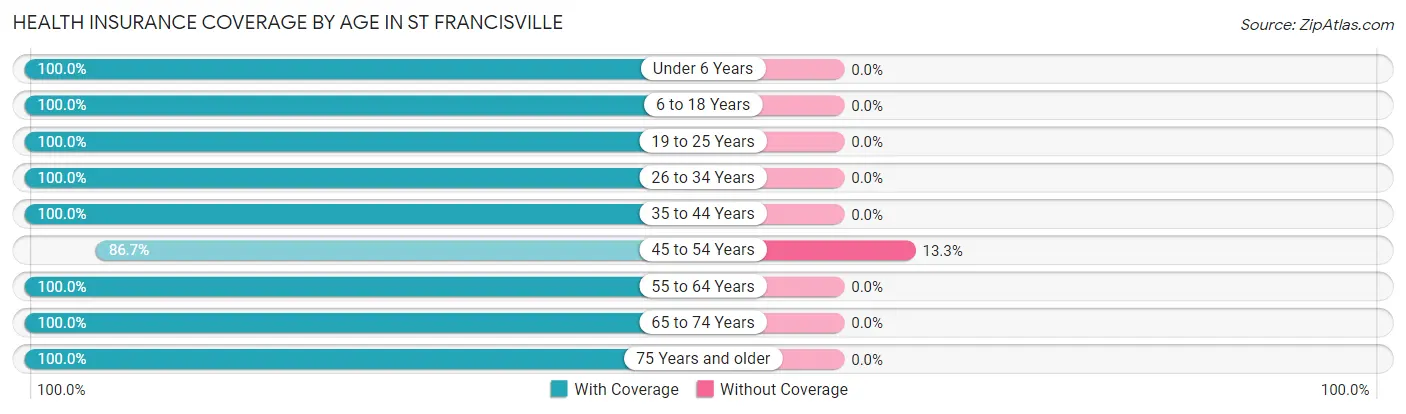
| Age Bracket | With Coverage | Without Coverage |
| Under 6 Years | 197 (100.0%) | 0 (0.0%) |
| 6 to 18 Years | 206 (100.0%) | 0 (0.0%) |
| 19 to 25 Years | 203 (100.0%) | 0 (0.0%) |
| 26 to 34 Years | 94 (100.0%) | 0 (0.0%) |
| 35 to 44 Years | 328 (100.0%) | 0 (0.0%) |
| 45 to 54 Years | 274 (86.7%) | 42 (13.3%) |
| 55 to 64 Years | 75 (100.0%) | 0 (0.0%) |
| 65 to 74 Years | 84 (100.0%) | 0 (0.0%) |
| 75 Years and older | 185 (100.0%) | 0 (0.0%) |
| Total | 1,646 (97.5%) | 42 (2.5%) |
Health Insurance Coverage by Citizenship Status in St Francisville
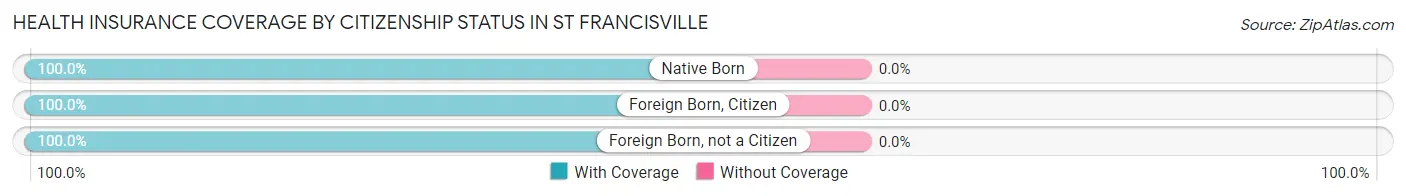
| Citizenship Status | With Coverage | Without Coverage |
| Native Born | 197 (100.0%) | 0 (0.0%) |
| Foreign Born, Citizen | 206 (100.0%) | 0 (0.0%) |
| Foreign Born, not a Citizen | 203 (100.0%) | 0 (0.0%) |
Health Insurance Coverage by Household Income in St Francisville
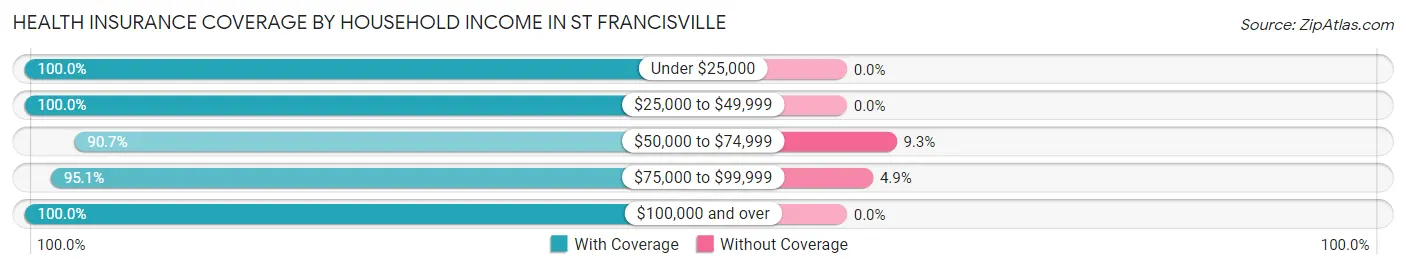
| Household Income | With Coverage | Without Coverage |
| Under $25,000 | 388 (100.0%) | 0 (0.0%) |
| $25,000 to $49,999 | 349 (100.0%) | 0 (0.0%) |
| $50,000 to $74,999 | 263 (90.7%) | 27 (9.3%) |
| $75,000 to $99,999 | 252 (95.1%) | 13 (4.9%) |
| $100,000 and over | 394 (100.0%) | 0 (0.0%) |
Public vs Private Health Insurance Coverage by Age in St Francisville
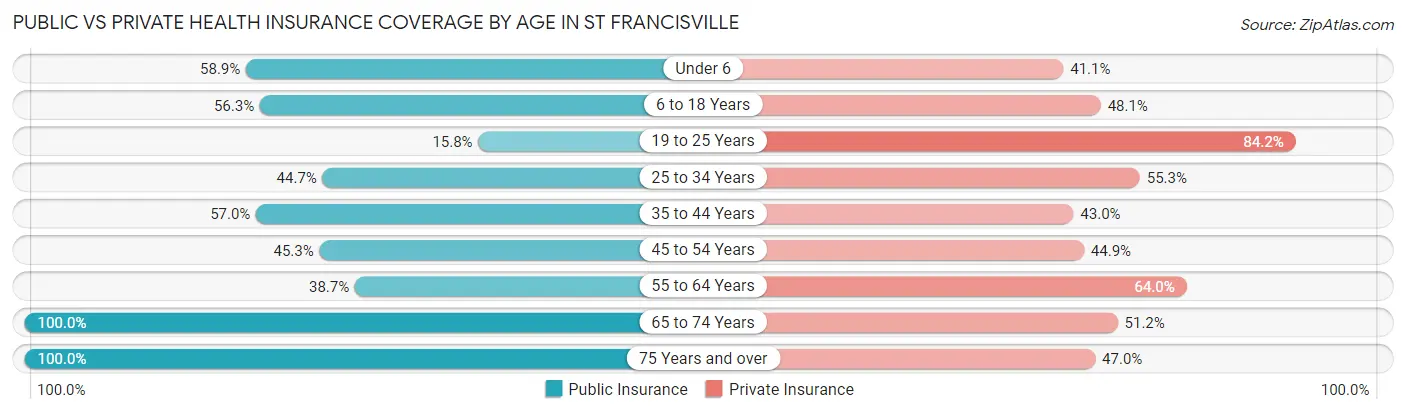
| Age Bracket | Public Insurance | Private Insurance |
| Under 6 | 116 (58.9%) | 81 (41.1%) |
| 6 to 18 Years | 116 (56.3%) | 99 (48.1%) |
| 19 to 25 Years | 32 (15.8%) | 171 (84.2%) |
| 25 to 34 Years | 42 (44.7%) | 52 (55.3%) |
| 35 to 44 Years | 187 (57.0%) | 141 (43.0%) |
| 45 to 54 Years | 143 (45.3%) | 142 (44.9%) |
| 55 to 64 Years | 29 (38.7%) | 48 (64.0%) |
| 65 to 74 Years | 84 (100.0%) | 43 (51.2%) |
| 75 Years and over | 185 (100.0%) | 87 (47.0%) |
| Total | 934 (55.3%) | 864 (51.2%) |
Disability Status by Sex by Age in St Francisville
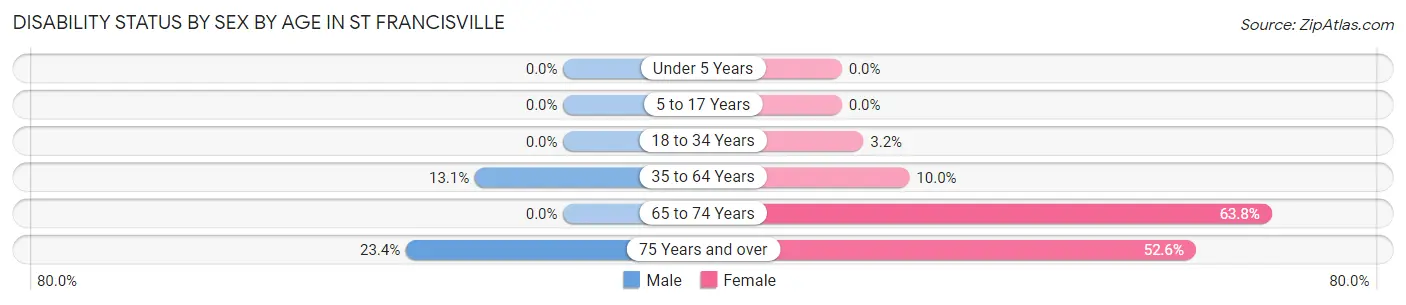
| Age Bracket | Male | Female |
| Under 5 Years | 0 (0.0%) | 0 (0.0%) |
| 5 to 17 Years | 0 (0.0%) | 0 (0.0%) |
| 18 to 34 Years | 0 (0.0%) | 7 (3.2%) |
| 35 to 64 Years | 59 (13.1%) | 27 (10.0%) |
| 65 to 74 Years | 0 (0.0%) | 30 (63.8%) |
| 75 Years and over | 25 (23.4%) | 41 (52.6%) |
Disability Class by Sex by Age in St Francisville
Disability Class: Hearing Difficulty
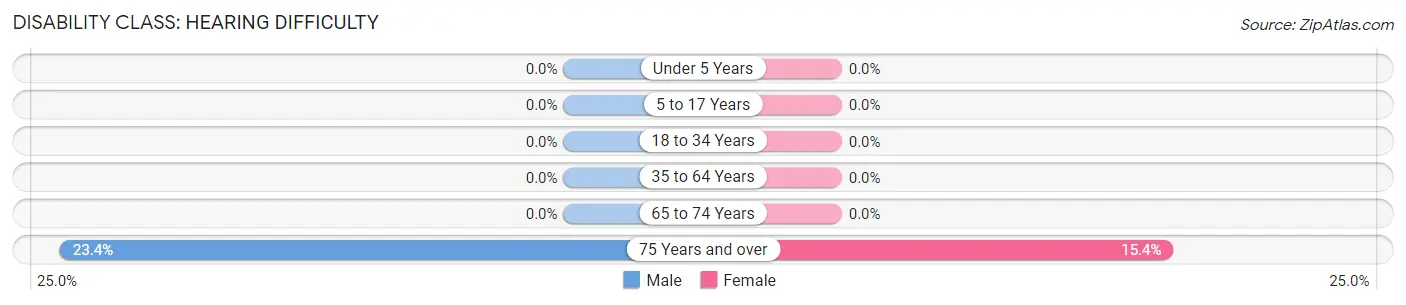
| Age Bracket | Male | Female |
| Under 5 Years | 0 (0.0%) | 0 (0.0%) |
| 5 to 17 Years | 0 (0.0%) | 0 (0.0%) |
| 18 to 34 Years | 0 (0.0%) | 0 (0.0%) |
| 35 to 64 Years | 0 (0.0%) | 0 (0.0%) |
| 65 to 74 Years | 0 (0.0%) | 0 (0.0%) |
| 75 Years and over | 25 (23.4%) | 12 (15.4%) |
Disability Class: Vision Difficulty
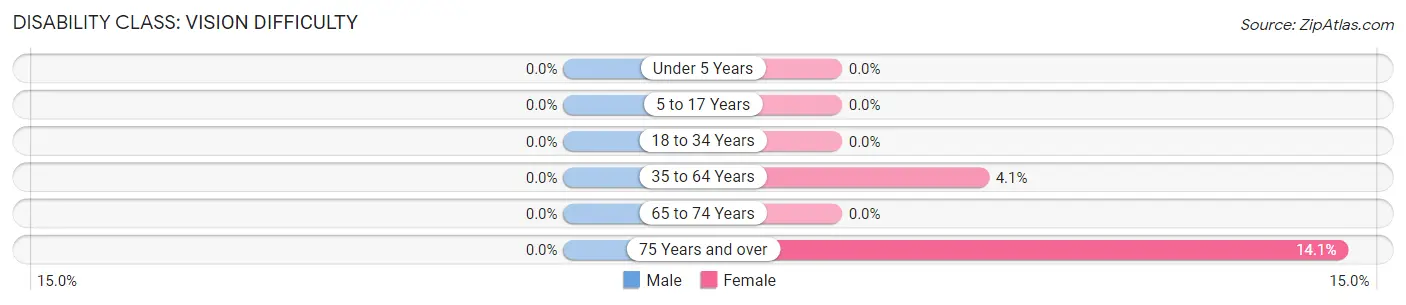
| Age Bracket | Male | Female |
| Under 5 Years | 0 (0.0%) | 0 (0.0%) |
| 5 to 17 Years | 0 (0.0%) | 0 (0.0%) |
| 18 to 34 Years | 0 (0.0%) | 0 (0.0%) |
| 35 to 64 Years | 0 (0.0%) | 11 (4.1%) |
| 65 to 74 Years | 0 (0.0%) | 0 (0.0%) |
| 75 Years and over | 0 (0.0%) | 11 (14.1%) |
Disability Class: Cognitive Difficulty
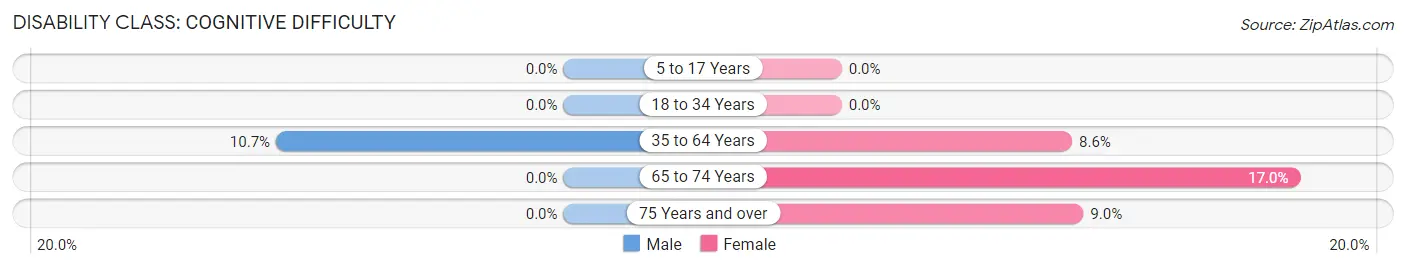
| Age Bracket | Male | Female |
| 5 to 17 Years | 0 (0.0%) | 0 (0.0%) |
| 18 to 34 Years | 0 (0.0%) | 0 (0.0%) |
| 35 to 64 Years | 48 (10.7%) | 23 (8.6%) |
| 65 to 74 Years | 0 (0.0%) | 8 (17.0%) |
| 75 Years and over | 0 (0.0%) | 7 (9.0%) |
Disability Class: Ambulatory Difficulty
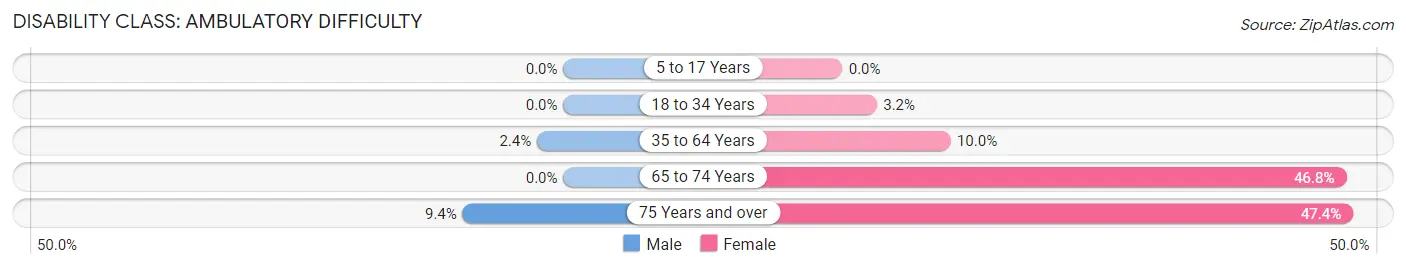
| Age Bracket | Male | Female |
| 5 to 17 Years | 0 (0.0%) | 0 (0.0%) |
| 18 to 34 Years | 0 (0.0%) | 7 (3.2%) |
| 35 to 64 Years | 11 (2.4%) | 27 (10.0%) |
| 65 to 74 Years | 0 (0.0%) | 22 (46.8%) |
| 75 Years and over | 10 (9.3%) | 37 (47.4%) |
Disability Class: Self-Care Difficulty
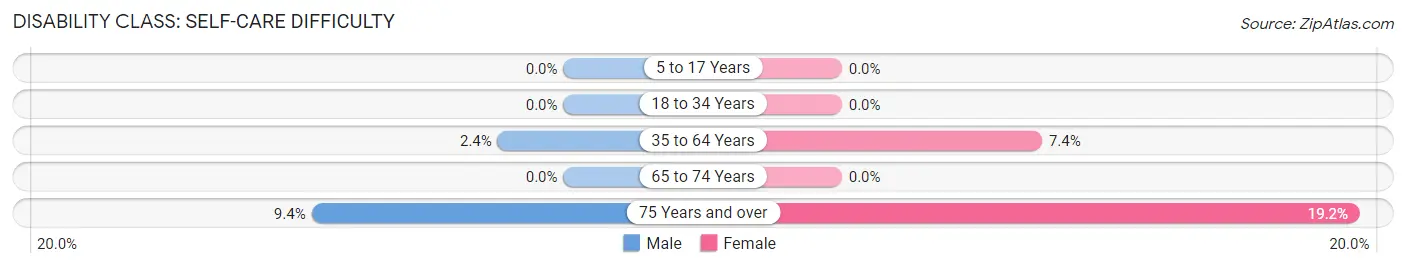
| Age Bracket | Male | Female |
| 5 to 17 Years | 0 (0.0%) | 0 (0.0%) |
| 18 to 34 Years | 0 (0.0%) | 0 (0.0%) |
| 35 to 64 Years | 11 (2.4%) | 20 (7.4%) |
| 65 to 74 Years | 0 (0.0%) | 0 (0.0%) |
| 75 Years and over | 10 (9.3%) | 15 (19.2%) |
Technology Access in St Francisville
Computing Device Access in St Francisville
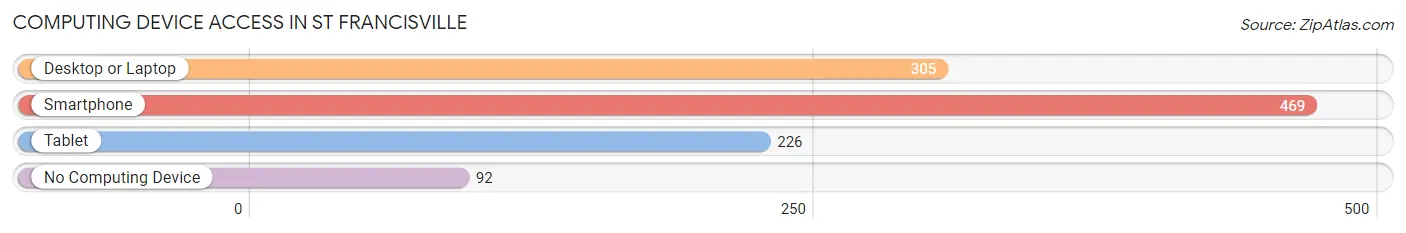
| Device Type | # Households | % Households |
| Desktop or Laptop | 305 | 51.3% |
| Smartphone | 469 | 78.8% |
| Tablet | 226 | 38.0% |
| No Computing Device | 92 | 15.5% |
| Total | 595 | 100.0% |
Internet Access in St Francisville
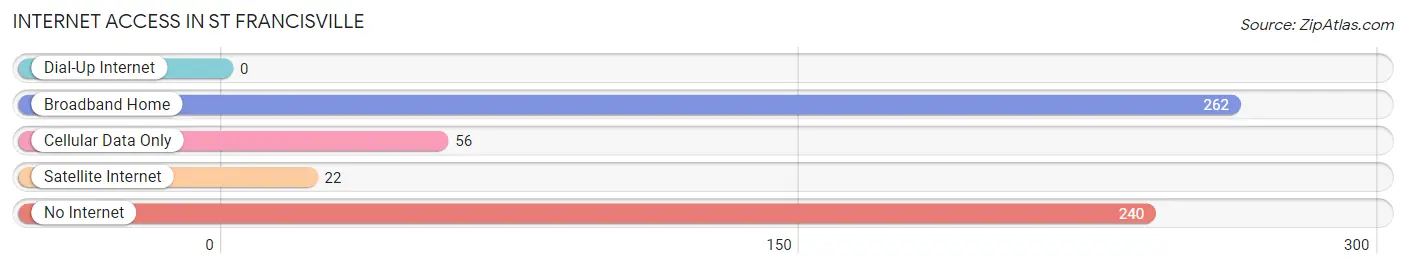
| Internet Type | # Households | % Households |
| Dial-Up Internet | 0 | 0.0% |
| Broadband Home | 262 | 44.0% |
| Cellular Data Only | 56 | 9.4% |
| Satellite Internet | 22 | 3.7% |
| No Internet | 240 | 40.3% |
| Total | 595 | 100.0% |
St Francisville Summary
Francisville, Louisiana is a small town located in West Feliciana Parish, Louisiana. It is situated on the banks of the Mississippi River, approximately 40 miles north of Baton Rouge. The town was founded in 1809 and is the oldest settlement in the parish. It is known for its historic homes, churches, and plantations, as well as its unique culture and cuisine.
History
Francisville was founded in 1809 by William C. C. Claiborne, the first governor of the Louisiana Territory. The town was named after the Spanish governor of Louisiana, Francisco Luis Héctor de Carondelet. The town was originally a trading post and was the first settlement in West Feliciana Parish.
In 1810, the town was incorporated and the first mayor was elected. The town quickly grew and by 1820, it had a population of over 500. During the Civil War, the town was occupied by Union forces and many of the buildings were destroyed. After the war, the town was rebuilt and the population grew to over 1,000 by 1880.
In the late 19th century, the town became a popular tourist destination due to its proximity to the Mississippi River. The town was also known for its many historic homes, churches, and plantations. In the early 20th century, the town experienced a period of decline due to the Great Depression and the decline of the cotton industry.
Geography
Francisville is located in West Feliciana Parish, Louisiana. It is situated on the banks of the Mississippi River, approximately 40 miles north of Baton Rouge. The town is located in a rural area and is surrounded by rolling hills and forests. The climate is humid subtropical, with hot summers and mild winters.
Economy
The economy of Francisville is largely based on agriculture and tourism. The town is home to several historic plantations, which attract tourists from all over the world. The town is also home to several small businesses, including restaurants, antique stores, and art galleries.
Demographics
As of the 2010 census, the population of Francisville was 1,719. The racial makeup of the town was 79.3% White, 19.2% African American, 0.3% Native American, 0.2% Asian, and 0.9% from other races. The median household income was $37,917 and the median family income was $45,938. The per capita income was $20,945.
Conclusion
Francisville, Louisiana is a small town located in West Feliciana Parish, Louisiana. It is situated on the banks of the Mississippi River, approximately 40 miles north of Baton Rouge. The town was founded in 1809 and is the oldest settlement in the parish. It is known for its historic homes, churches, and plantations, as well as its unique culture and cuisine. The economy of Francisville is largely based on agriculture and tourism. As of the 2010 census, the population of Francisville was 1,719. The racial makeup of the town was 79.3% White, 19.2% African American, 0.3% Native American, 0.2% Asian, and 0.9% from other races. The median household income was $37,917 and the median family income was $45,938. The per capita income was $20,945.
Common Questions
What is the Total Population of St Francisville?
Total Population of St Francisville is 1,724.
What is the Total Male Population of St Francisville?
Total Male Population of St Francisville is 915.
What is the Total Female Population of St Francisville?
Total Female Population of St Francisville is 809.
What is the Ratio of Males per 100 Females in St Francisville?
There are 113.10 Males per 100 Females in St Francisville.
What is the Ratio of Females per 100 Males in St Francisville?
There are 88.42 Females per 100 Males in St Francisville.
What is the Median Population Age in St Francisville?
Median Population Age in St Francisville is 41.7 Years.
What is the Average Family Size in St Francisville
Average Family Size in St Francisville is 4.5 People.
What is the Average Household Size in St Francisville
Average Household Size in St Francisville is 2.9 People.
What is Per Capita Income in St Francisville?
Per Capita income in St Francisville is $25,169.
What is the Median Family Income in St Francisville?
Median Family Income in St Francisville is $75,268.
What is the Median Household income in St Francisville?
Median Household Income in St Francisville is $46,681.
What is Income or Wage Gap in St Francisville?
Income or Wage Gap in St Francisville is 25.6%.
Women in St Francisville earn 74.4 cents for every dollar earned by a man.
What is Inequality or Gini Index in St Francisville?
Inequality or Gini Index in St Francisville is 0.48.
How Large is the Labor Force in St Francisville?
There are 772 People in the Labor Forcein in St Francisville.
What is the Percentage of People in the Labor Force in St Francisville?
57.8% of People are in the Labor Force in St Francisville.
What is the Unemployment Rate in St Francisville?
Unemployment Rate in St Francisville is 24.7%.