Cities with the Highest Percentage of Population Employed in Legal Services & Support in Nevada
RELATED REPORTS & OPTIONS
Legal Services & Support
Nevada
Compare Cities
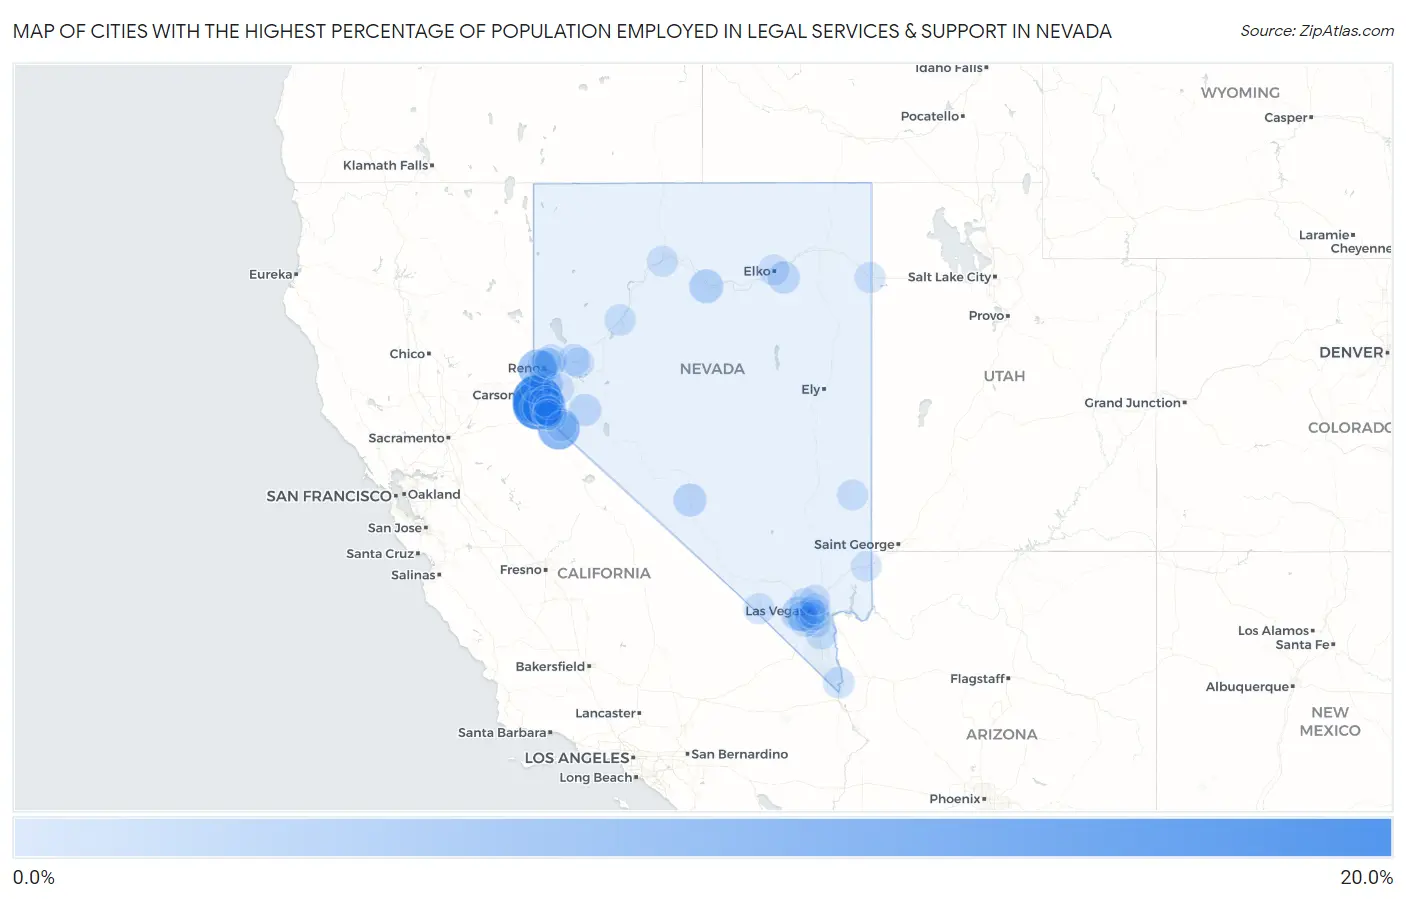
Map of Cities with the Highest Percentage of Population Employed in Legal Services & Support in Nevada
0.0%
20.0%
Cities with the Highest Percentage of Population Employed in Legal Services & Support in Nevada
| City | % Employed | vs State | vs National | |
| 1. | Glenbrook | 17.3% | 0.99%(+16.3)#1 | 1.2%(+16.1)#78 |
| 2. | Skyland | 16.8% | 0.99%(+15.8)#2 | 1.2%(+15.6)#84 |
| 3. | Genoa | 11.4% | 0.99%(+10.4)#3 | 1.2%(+10.2)#173 |
| 4. | Topaz Lake | 10.0% | 0.99%(+9.01)#4 | 1.2%(+8.82)#220 |
| 5. | Mogul | 7.1% | 0.99%(+6.07)#5 | 1.2%(+5.87)#435 |
| 6. | Round Hill Village | 4.3% | 0.99%(+3.33)#6 | 1.2%(+3.13)#1,082 |
| 7. | Kingsbury | 3.9% | 0.99%(+2.86)#7 | 1.2%(+2.67)#1,303 |
| 8. | Summerlin South | 3.7% | 0.99%(+2.71)#8 | 1.2%(+2.52)#1,399 |
| 9. | Battle Mountain | 3.2% | 0.99%(+2.22)#9 | 1.2%(+2.02)#1,756 |
| 10. | East Valley | 2.5% | 0.99%(+1.56)#10 | 1.2%(+1.36)#2,406 |
| 11. | Goldfield | 2.5% | 0.99%(+1.51)#11 | 1.2%(+1.32)#2,444 |
| 12. | Washoe Valley | 2.4% | 0.99%(+1.42)#12 | 1.2%(+1.23)#2,568 |
| 13. | Yerington | 1.9% | 0.99%(+0.900)#13 | 1.2%(+0.703)#3,430 |
| 14. | Spring Creek | 1.7% | 0.99%(+0.724)#14 | 1.2%(+0.527)#3,861 |
| 15. | Henderson | 1.6% | 0.99%(+0.623)#15 | 1.2%(+0.426)#4,093 |
| 16. | Wadsworth | 1.5% | 0.99%(+0.497)#16 | 1.2%(+0.300)#4,463 |
| 17. | Laughlin | 1.2% | 0.99%(+0.224)#17 | 1.2%(+0.027)#5,419 |
| 18. | Las Vegas | 1.2% | 0.99%(+0.195)#18 | 1.2%(-0.002)#5,523 |
| 19. | Spanish Springs | 1.1% | 0.99%(+0.122)#19 | 1.2%(-0.075)#5,835 |
| 20. | Boulder City | 1.1% | 0.99%(+0.085)#20 | 1.2%(-0.112)#6,000 |
| 21. | Enterprise | 1.1% | 0.99%(+0.078)#21 | 1.2%(-0.120)#6,039 |
| 22. | Incline Village | 1.0% | 0.99%(+0.051)#22 | 1.2%(-0.146)#6,176 |
| 23. | Reno | 1.0% | 0.99%(+0.039)#23 | 1.2%(-0.158)#6,232 |
| 24. | Ruhenstroth | 0.90% | 0.99%(-0.085)#24 | 1.2%(-0.282)#6,872 |
| 25. | Lovelock | 0.86% | 0.99%(-0.130)#25 | 1.2%(-0.328)#7,111 |
| 26. | Carson | 0.84% | 0.99%(-0.142)#26 | 1.2%(-0.339)#7,176 |
| 27. | Paradise | 0.81% | 0.99%(-0.176)#27 | 1.2%(-0.373)#7,356 |
| 28. | Winchester | 0.75% | 0.99%(-0.241)#28 | 1.2%(-0.438)#7,768 |
| 29. | West Wendover | 0.75% | 0.99%(-0.241)#29 | 1.2%(-0.438)#7,770 |
| 30. | Spring Valley | 0.74% | 0.99%(-0.244)#30 | 1.2%(-0.441)#7,785 |
| 31. | Minden | 0.74% | 0.99%(-0.245)#31 | 1.2%(-0.442)#7,791 |
| 32. | Sparks | 0.74% | 0.99%(-0.250)#32 | 1.2%(-0.448)#7,831 |
| 33. | Elko | 0.72% | 0.99%(-0.269)#33 | 1.2%(-0.467)#7,950 |
| 34. | Winnemucca | 0.71% | 0.99%(-0.276)#34 | 1.2%(-0.473)#7,997 |
| 35. | Pahrump | 0.70% | 0.99%(-0.290)#35 | 1.2%(-0.487)#8,099 |
| 36. | Whitney | 0.63% | 0.99%(-0.357)#36 | 1.2%(-0.554)#8,566 |
| 37. | Dayton | 0.62% | 0.99%(-0.367)#37 | 1.2%(-0.565)#8,653 |
| 38. | Panaca | 0.58% | 0.99%(-0.403)#38 | 1.2%(-0.601)#8,916 |
| 39. | Sunrise Manor | 0.54% | 0.99%(-0.449)#39 | 1.2%(-0.646)#9,228 |
| 40. | North Las Vegas | 0.48% | 0.99%(-0.507)#40 | 1.2%(-0.704)#9,666 |
| 41. | Johnson Lane | 0.48% | 0.99%(-0.510)#41 | 1.2%(-0.708)#9,691 |
| 42. | Fernley | 0.43% | 0.99%(-0.552)#42 | 1.2%(-0.749)#9,997 |
| 43. | Indian Hills | 0.31% | 0.99%(-0.675)#43 | 1.2%(-0.873)#10,858 |
| 44. | Mesquite | 0.30% | 0.99%(-0.687)#44 | 1.2%(-0.885)#10,929 |
| 45. | Gardnerville | 0.27% | 0.99%(-0.712)#45 | 1.2%(-0.910)#11,085 |
| 46. | Sun Valley | 0.23% | 0.99%(-0.756)#46 | 1.2%(-0.953)#11,295 |
| 47. | Topaz Ranch Estates | 0.15% | 0.99%(-0.833)#47 | 1.2%(-1.03)#11,603 |
| 48. | Gardnerville Ranchos | 0.13% | 0.99%(-0.857)#48 | 1.2%(-1.05)#11,687 |
1
2Common Questions
What are the Top 10 Cities with the Highest Percentage of Population Employed in Legal Services & Support in Nevada?
Top 10 Cities with the Highest Percentage of Population Employed in Legal Services & Support in Nevada are:
#1
17.3%
#2
16.8%
#3
11.4%
#4
10.0%
#5
7.1%
#6
4.3%
#7
3.9%
#8
3.7%
#9
3.2%
#10
2.5%
What city has the Highest Percentage of Population Employed in Legal Services & Support in Nevada?
Glenbrook has the Highest Percentage of Population Employed in Legal Services & Support in Nevada with 17.3%.
What is the Percentage of Population Employed in Legal Services & Support in the State of Nevada?
Percentage of Population Employed in Legal Services & Support in Nevada is 0.99%.
What is the Percentage of Population Employed in Legal Services & Support in the United States?
Percentage of Population Employed in Legal Services & Support in the United States is 1.2%.