Zip Codes with the Highest Percentage of Population Employed in Legal Services & Support in Dubuque, IA
RELATED REPORTS & OPTIONS
Legal Services & Support
Dubuque
Compare Zip Codes
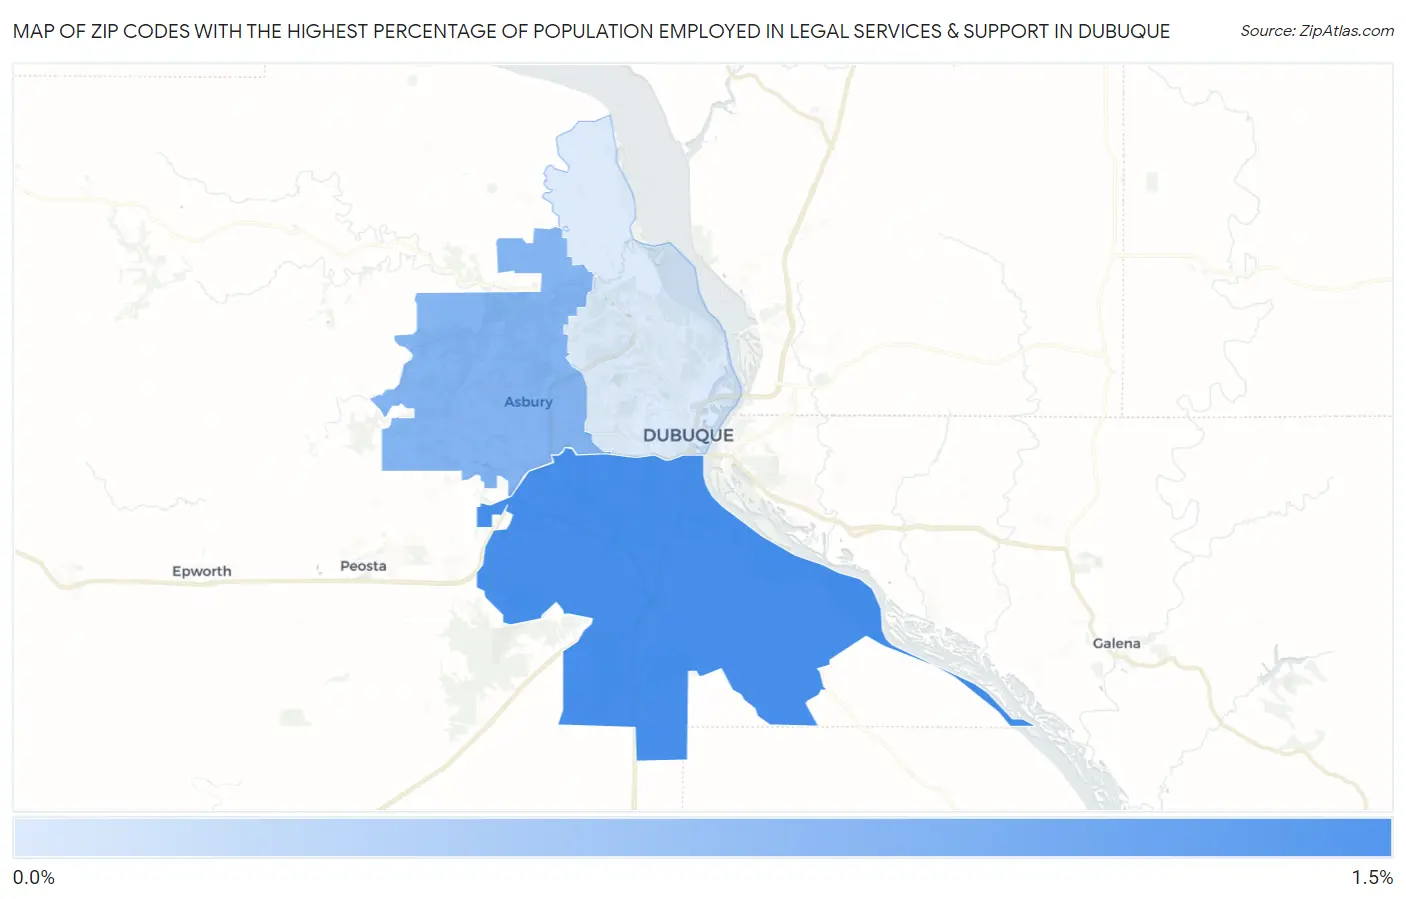
Map of Zip Codes with the Highest Percentage of Population Employed in Legal Services & Support in Dubuque
0.0%
1.5%
Zip Codes with the Highest Percentage of Population Employed in Legal Services & Support in Dubuque, IA
| Zip Code | % Employed | vs State | vs National | |
| 1. | 52003 | 1.3% | 0.75%(+0.509)#95 | 1.2%(+0.070)#6,181 |
| 2. | 52002 | 0.84% | 0.75%(+0.099)#152 | 1.2%(-0.340)#9,067 |
| 3. | 52001 | 0.21% | 0.75%(-0.532)#339 | 1.2%(-0.970)#16,049 |
1
Common Questions
What are the Top Zip Codes with the Highest Percentage of Population Employed in Legal Services & Support in Dubuque, IA?
Top Zip Codes with the Highest Percentage of Population Employed in Legal Services & Support in Dubuque, IA are:
What zip code has the Highest Percentage of Population Employed in Legal Services & Support in Dubuque, IA?
52003 has the Highest Percentage of Population Employed in Legal Services & Support in Dubuque, IA with 1.3%.
What is the Percentage of Population Employed in Legal Services & Support in Dubuque, IA?
Percentage of Population Employed in Legal Services & Support in Dubuque is 0.53%.
What is the Percentage of Population Employed in Legal Services & Support in Iowa?
Percentage of Population Employed in Legal Services & Support in Iowa is 0.75%.
What is the Percentage of Population Employed in Legal Services & Support in the United States?
Percentage of Population Employed in Legal Services & Support in the United States is 1.2%.