Cities with the Highest Percentage of Population Employed in Legal Services & Support in New Mexico
RELATED REPORTS & OPTIONS
Legal Services & Support
New Mexico
Compare Cities
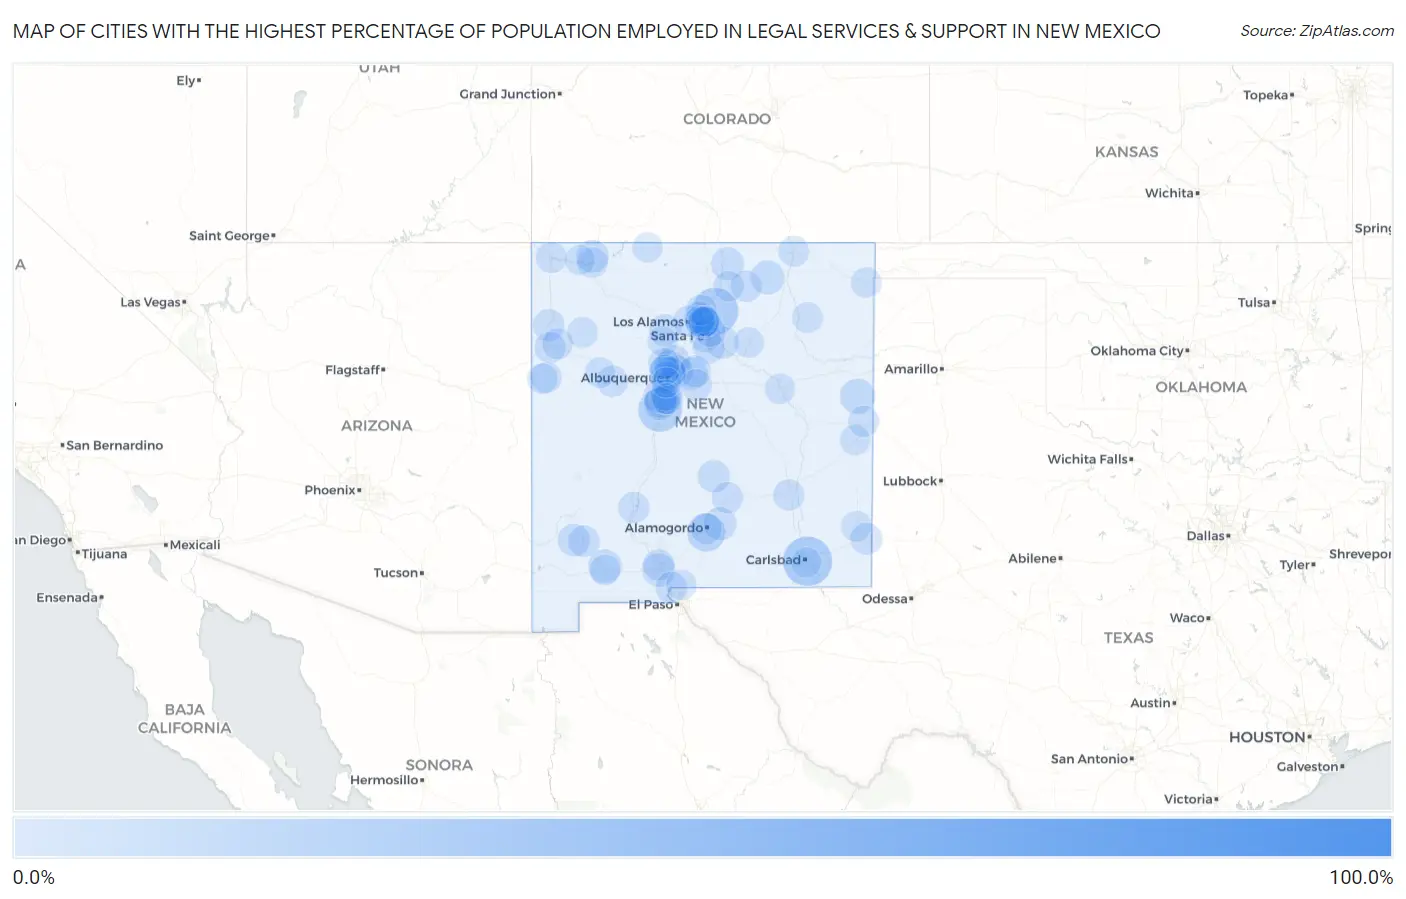
Map of Cities with the Highest Percentage of Population Employed in Legal Services & Support in New Mexico
0.0%
100.0%
Cities with the Highest Percentage of Population Employed in Legal Services & Support in New Mexico
| City | % Employed | vs State | vs National | |
| 1. | Seton | 100.0% | 1.3%(+98.7)#1 | 1.2%(+98.8)#2 |
| 2. | Deer Canyon | 100.0% | 1.3%(+98.7)#2 | 1.2%(+98.8)#3 |
| 3. | Livingston Wheeler | 23.6% | 1.3%(+22.3)#3 | 1.2%(+22.4)#41 |
| 4. | Truchas | 20.3% | 1.3%(+19.0)#4 | 1.2%(+19.1)#56 |
| 5. | Conejo | 18.6% | 1.3%(+17.3)#5 | 1.2%(+17.5)#70 |
| 6. | Santa Fe Foothills | 18.5% | 1.3%(+17.2)#6 | 1.2%(+17.3)#73 |
| 7. | Pueblitos | 16.2% | 1.3%(+14.9)#7 | 1.2%(+15.0)#89 |
| 8. | Las Campanas | 13.9% | 1.3%(+12.6)#8 | 1.2%(+12.8)#123 |
| 9. | Rio Rancho Estates | 11.0% | 1.3%(+9.66)#9 | 1.2%(+9.79)#184 |
| 10. | Angustura | 10.4% | 1.3%(+9.08)#10 | 1.2%(+9.21)#205 |
| 11. | Boles Acres | 9.8% | 1.3%(+8.48)#11 | 1.2%(+8.61)#236 |
| 12. | Hyde Park | 8.6% | 1.3%(+7.27)#12 | 1.2%(+7.40)#299 |
| 13. | Paa-Ko | 7.1% | 1.3%(+5.83)#13 | 1.2%(+5.96)#427 |
| 14. | Los Ranchos De Albuquerque | 7.1% | 1.3%(+5.75)#14 | 1.2%(+5.88)#433 |
| 15. | Grady | 6.0% | 1.3%(+4.64)#15 | 1.2%(+4.77)#612 |
| 16. | Isleta | 4.9% | 1.3%(+3.57)#16 | 1.2%(+3.69)#883 |
| 17. | Cimarron | 4.5% | 1.3%(+3.15)#17 | 1.2%(+3.27)#1,026 |
| 18. | Jacona | 4.4% | 1.3%(+3.08)#18 | 1.2%(+3.20)#1,050 |
| 19. | Keeler Farm | 4.3% | 1.3%(+2.98)#19 | 1.2%(+3.11)#1,090 |
| 20. | Mesilla | 3.8% | 1.3%(+2.47)#20 | 1.2%(+2.60)#1,331 |
| 21. | Los Lunas | 3.6% | 1.3%(+2.34)#21 | 1.2%(+2.46)#1,431 |
| 22. | Los Chaves | 3.6% | 1.3%(+2.29)#22 | 1.2%(+2.42)#1,459 |
| 23. | Cloudcroft | 3.5% | 1.3%(+2.19)#23 | 1.2%(+2.32)#1,533 |
| 24. | Belen | 3.5% | 1.3%(+2.15)#24 | 1.2%(+2.28)#1,564 |
| 25. | Questa | 3.3% | 1.3%(+2.02)#25 | 1.2%(+2.15)#1,661 |
| 26. | Tano Road | 3.0% | 1.3%(+1.70)#26 | 1.2%(+1.83)#1,920 |
| 27. | Pecos | 3.0% | 1.3%(+1.69)#27 | 1.2%(+1.81)#1,935 |
| 28. | Aztec | 3.0% | 1.3%(+1.66)#28 | 1.2%(+1.78)#1,963 |
| 29. | Cuyamungue Grant | 2.9% | 1.3%(+1.62)#29 | 1.2%(+1.75)#2,008 |
| 30. | Bernalillo | 2.8% | 1.3%(+1.48)#30 | 1.2%(+1.61)#2,135 |
| 31. | Carrizozo | 2.8% | 1.3%(+1.47)#31 | 1.2%(+1.59)#2,151 |
| 32. | Tyrone | 2.7% | 1.3%(+1.41)#32 | 1.2%(+1.54)#2,218 |
| 33. | Edgewood | 2.5% | 1.3%(+1.19)#33 | 1.2%(+1.31)#2,448 |
| 34. | Santa Fe | 2.4% | 1.3%(+1.06)#34 | 1.2%(+1.19)#2,616 |
| 35. | Corrales | 2.3% | 1.3%(+0.995)#35 | 1.2%(+1.12)#2,713 |
| 36. | Hobbs | 2.3% | 1.3%(+0.945)#36 | 1.2%(+1.07)#2,784 |
| 37. | Eldorado At Santa Fe | 2.1% | 1.3%(+0.794)#37 | 1.2%(+0.921)#3,029 |
| 38. | Placitas Cdp Sandoval County | 2.1% | 1.3%(+0.784)#38 | 1.2%(+0.911)#3,046 |
| 39. | Sandia Heights | 2.1% | 1.3%(+0.749)#39 | 1.2%(+0.876)#3,111 |
| 40. | Hurley | 2.0% | 1.3%(+0.737)#40 | 1.2%(+0.863)#3,130 |
| 41. | Edith Enclave | 2.0% | 1.3%(+0.710)#41 | 1.2%(+0.836)#3,173 |
| 42. | South River | 1.9% | 1.3%(+0.593)#42 | 1.2%(+0.720)#3,397 |
| 43. | Cedar Grove | 1.9% | 1.3%(+0.590)#43 | 1.2%(+0.717)#3,402 |
| 44. | Indian Hills | 1.8% | 1.3%(+0.520)#44 | 1.2%(+0.647)#3,565 |
| 45. | Albuquerque | 1.8% | 1.3%(+0.489)#45 | 1.2%(+0.616)#3,645 |
| 46. | Tohatchi | 1.8% | 1.3%(+0.483)#46 | 1.2%(+0.610)#3,663 |
| 47. | Jemez Springs | 1.8% | 1.3%(+0.454)#47 | 1.2%(+0.581)#3,723 |
| 48. | La Mesilla | 1.8% | 1.3%(+0.444)#48 | 1.2%(+0.571)#3,741 |
| 49. | North Valley | 1.7% | 1.3%(+0.426)#49 | 1.2%(+0.553)#3,787 |
| 50. | Thunder Mountain | 1.7% | 1.3%(+0.379)#50 | 1.2%(+0.505)#3,919 |
| 51. | Las Cruces | 1.6% | 1.3%(+0.275)#51 | 1.2%(+0.402)#4,159 |
| 52. | Tesuque | 1.5% | 1.3%(+0.223)#52 | 1.2%(+0.350)#4,302 |
| 53. | Anthony | 1.5% | 1.3%(+0.213)#53 | 1.2%(+0.340)#4,335 |
| 54. | Truth Or Consequences | 1.5% | 1.3%(+0.209)#54 | 1.2%(+0.336)#4,351 |
| 55. | Angel Fire | 1.3% | 1.3%(+0.030)#55 | 1.2%(+0.157)#4,930 |
| 56. | Pena Blanca | 1.3% | 1.3%(+0.030)#56 | 1.2%(+0.157)#4,933 |
| 57. | Skyline Ganipa | 1.3% | 1.3%(+0.023)#57 | 1.2%(+0.150)#4,957 |
| 58. | Rio Rancho | 1.3% | 1.3%(+0.007)#58 | 1.2%(+0.134)#5,011 |
| 59. | Los Alamos | 1.3% | 1.3%(-0.016)#59 | 1.2%(+0.111)#5,083 |
| 60. | Ruidoso Downs | 1.3% | 1.3%(-0.045)#60 | 1.2%(+0.082)#5,181 |
| 61. | Alamogordo | 1.2% | 1.3%(-0.077)#61 | 1.2%(+0.050)#5,311 |
| 62. | Peralta | 1.2% | 1.3%(-0.094)#62 | 1.2%(+0.033)#5,390 |
| 63. | Roswell | 1.1% | 1.3%(-0.188)#63 | 1.2%(-0.062)#5,771 |
| 64. | El Cerro | 1.1% | 1.3%(-0.238)#64 | 1.2%(-0.111)#5,997 |
| 65. | El Cerro Mission | 1.0% | 1.3%(-0.276)#65 | 1.2%(-0.149)#6,191 |
| 66. | Clovis | 0.99% | 1.3%(-0.321)#66 | 1.2%(-0.195)#6,427 |
| 67. | Cuyamungue | 0.95% | 1.3%(-0.358)#67 | 1.2%(-0.231)#6,612 |
| 68. | Tres Arroyos | 0.93% | 1.3%(-0.381)#68 | 1.2%(-0.254)#6,736 |
| 69. | Gallup | 0.92% | 1.3%(-0.395)#69 | 1.2%(-0.268)#6,804 |
| 70. | Church Rock | 0.90% | 1.3%(-0.406)#70 | 1.2%(-0.279)#6,857 |
| 71. | Shiprock | 0.89% | 1.3%(-0.416)#71 | 1.2%(-0.289)#6,902 |
| 72. | Black Rock | 0.87% | 1.3%(-0.437)#72 | 1.2%(-0.310)#7,022 |
| 73. | Crownpoint | 0.80% | 1.3%(-0.506)#73 | 1.2%(-0.379)#7,388 |
| 74. | Raton | 0.75% | 1.3%(-0.562)#74 | 1.2%(-0.435)#7,748 |
| 75. | Bloomfield | 0.73% | 1.3%(-0.584)#75 | 1.2%(-0.458)#7,888 |
| 76. | Roy | 0.68% | 1.3%(-0.630)#76 | 1.2%(-0.504)#8,223 |
| 77. | Ohkay Owingeh | 0.58% | 1.3%(-0.726)#77 | 1.2%(-0.599)#8,902 |
| 78. | Zuni Pueblo | 0.56% | 1.3%(-0.753)#78 | 1.2%(-0.626)#9,095 |
| 79. | Lovington | 0.48% | 1.3%(-0.830)#79 | 1.2%(-0.703)#9,657 |
| 80. | Grants | 0.46% | 1.3%(-0.849)#80 | 1.2%(-0.722)#9,804 |
| 81. | Deming | 0.43% | 1.3%(-0.882)#81 | 1.2%(-0.755)#10,047 |
| 82. | Nambe | 0.38% | 1.3%(-0.934)#82 | 1.2%(-0.807)#10,381 |
| 83. | Clayton | 0.37% | 1.3%(-0.937)#83 | 1.2%(-0.810)#10,401 |
| 84. | Paradise Hills | 0.35% | 1.3%(-0.962)#84 | 1.2%(-0.835)#10,601 |
| 85. | Portales | 0.34% | 1.3%(-0.966)#85 | 1.2%(-0.840)#10,637 |
| 86. | Espanola | 0.33% | 1.3%(-0.978)#86 | 1.2%(-0.851)#10,710 |
| 87. | Taos | 0.32% | 1.3%(-0.995)#87 | 1.2%(-0.869)#10,828 |
| 88. | Las Vegas | 0.31% | 1.3%(-1.00)#88 | 1.2%(-0.875)#10,869 |
| 89. | Carlsbad | 0.27% | 1.3%(-1.05)#89 | 1.2%(-0.918)#11,126 |
| 90. | Pojoaque | 0.25% | 1.3%(-1.06)#90 | 1.2%(-0.937)#11,224 |
| 91. | Santa Rosa | 0.23% | 1.3%(-1.08)#91 | 1.2%(-0.951)#11,285 |
| 92. | Farmington | 0.21% | 1.3%(-1.10)#92 | 1.2%(-0.970)#11,370 |
| 93. | South Valley | 0.15% | 1.3%(-1.16)#93 | 1.2%(-1.03)#11,610 |
| 94. | El Rancho | 0.15% | 1.3%(-1.17)#94 | 1.2%(-1.04)#11,629 |
| 95. | Jemez Pueblo | 0.12% | 1.3%(-1.20)#95 | 1.2%(-1.07)#11,714 |
| 96. | Dulce | 0.11% | 1.3%(-1.20)#96 | 1.2%(-1.07)#11,715 |
| 97. | Chaparral | 0.035% | 1.3%(-1.28)#97 | 1.2%(-1.15)#11,827 |
Common Questions
What are the Top 10 Cities with the Highest Percentage of Population Employed in Legal Services & Support in New Mexico?
Top 10 Cities with the Highest Percentage of Population Employed in Legal Services & Support in New Mexico are:
#1
23.6%
#2
20.3%
#3
16.2%
#4
9.8%
#5
7.1%
#6
6.0%
#7
4.5%
#8
4.4%
#9
4.3%
#10
3.8%
What city has the Highest Percentage of Population Employed in Legal Services & Support in New Mexico?
Livingston Wheeler has the Highest Percentage of Population Employed in Legal Services & Support in New Mexico with 23.6%.
What is the Percentage of Population Employed in Legal Services & Support in the State of New Mexico?
Percentage of Population Employed in Legal Services & Support in New Mexico is 1.3%.
What is the Percentage of Population Employed in Legal Services & Support in the United States?
Percentage of Population Employed in Legal Services & Support in the United States is 1.2%.