Camanche, IA
Camanche Map
Camanche Overview
4,546
TOTAL POPULATION
2,173
MALE POPULATION
2,373
FEMALE POPULATION
91.57
MALES / 100 FEMALES
109.20
FEMALES / 100 MALES
42.3
MEDIAN AGE
2.8
AVG FAMILY SIZE
2.3
AVG HOUSEHOLD SIZE
$33,189
PER CAPITA INCOME
$83,911
AVG FAMILY INCOME
$65,090
AVG HOUSEHOLD INCOME
38.9%
WAGE / INCOME GAP [ % ]
61.1¢/ $1
WAGE / INCOME GAP [ $ ]
0.39
INEQUALITY / GINI INDEX
2,352
LABOR FORCE [ PEOPLE ]
66.7%
PERCENT IN LABOR FORCE
3.6%
UNEMPLOYMENT RATE
Camanche Zip Codes
Camanche Area Codes
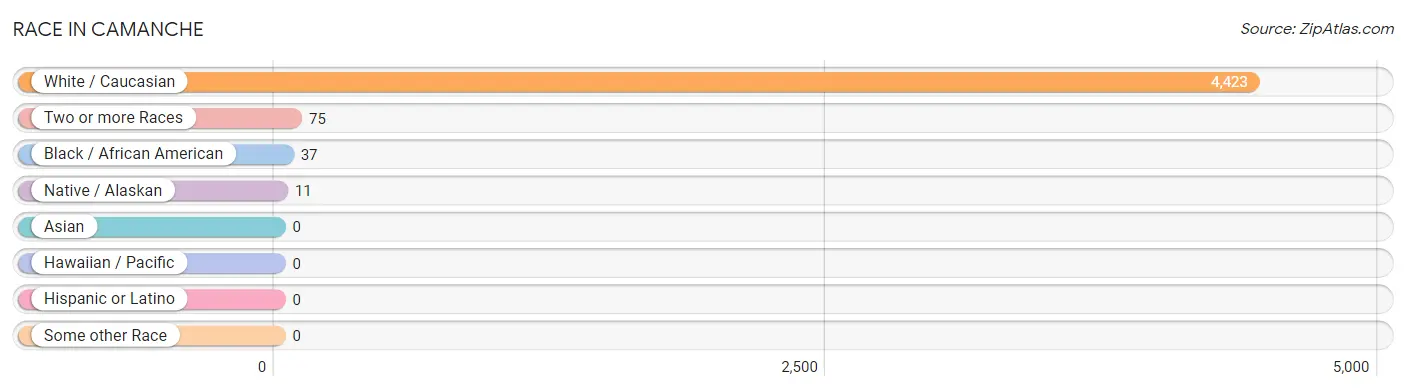
Race in Camanche
The most populous races in Camanche are White / Caucasian (4,423 | 97.3%), Two or more Races (75 | 1.7%), and Black / African American (37 | 0.8%).
| Race | # Population | % Population |
| Asian | 0 | 0.0% |
| Black / African American | 37 | 0.8% |
| Hawaiian / Pacific | 0 | 0.0% |
| Hispanic or Latino | 0 | 0.0% |
| Native / Alaskan | 11 | 0.2% |
| White / Caucasian | 4,423 | 97.3% |
| Two or more Races | 75 | 1.7% |
| Some other Race | 0 | 0.0% |
| Total | 4,546 | 100.0% |
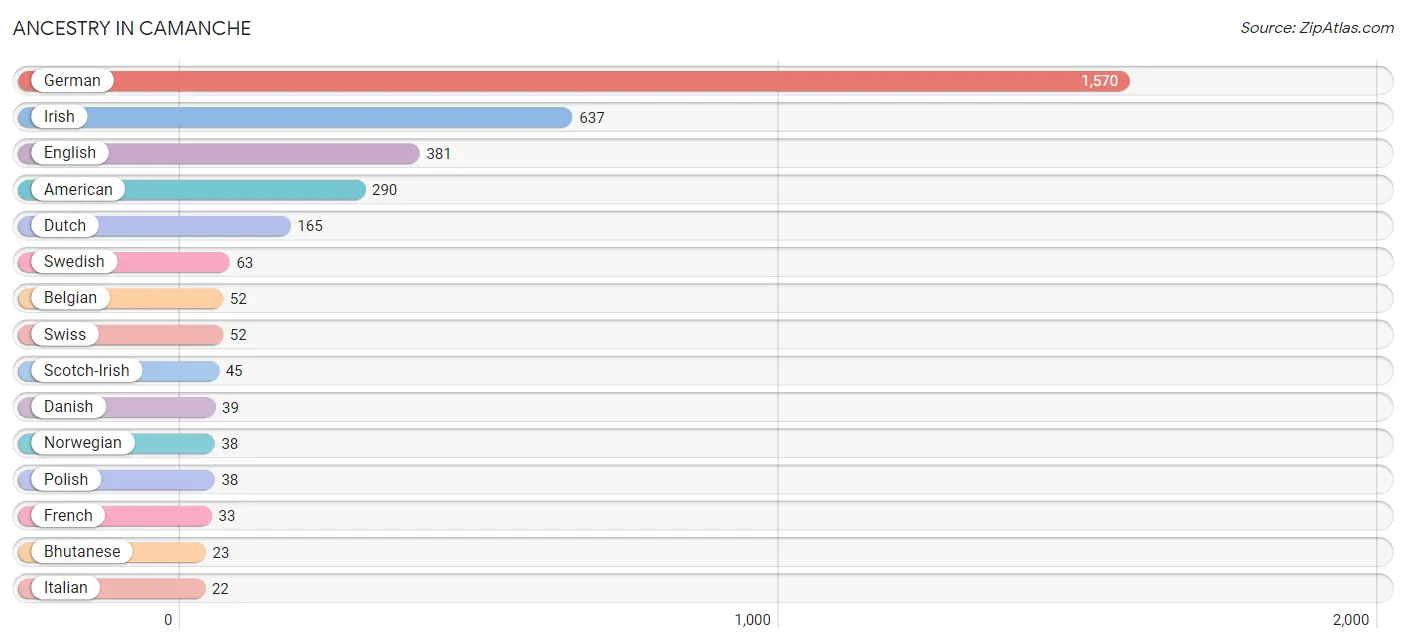
Ancestry in Camanche
The most populous ancestries reported in Camanche are German (1,570 | 34.5%), Irish (637 | 14.0%), English (381 | 8.4%), American (290 | 6.4%), and Dutch (165 | 3.6%), together accounting for 66.9% of all Camanche residents.
| Ancestry | # Population | % Population |
| American | 290 | 6.4% |
| Belgian | 52 | 1.1% |
| Bhutanese | 23 | 0.5% |
| Cherokee | 11 | 0.2% |
| Choctaw | 21 | 0.5% |
| Czech | 13 | 0.3% |
| Danish | 39 | 0.9% |
| Dutch | 165 | 3.6% |
| English | 381 | 8.4% |
| French | 33 | 0.7% |
| French Canadian | 13 | 0.3% |
| German | 1,570 | 34.5% |
| Greek | 15 | 0.3% |
| Irish | 637 | 14.0% |
| Italian | 22 | 0.5% |
| Luxembourger | 20 | 0.4% |
| Norwegian | 38 | 0.8% |
| Polish | 38 | 0.8% |
| Scotch-Irish | 45 | 1.0% |
| Swedish | 63 | 1.4% |
| Swiss | 52 | 1.1% |
| Ukrainian | 14 | 0.3% | View All 22 Rows |
Immigrants in Camanche

| Immigration Origin | # Population | % Population | View All 0 Rows |
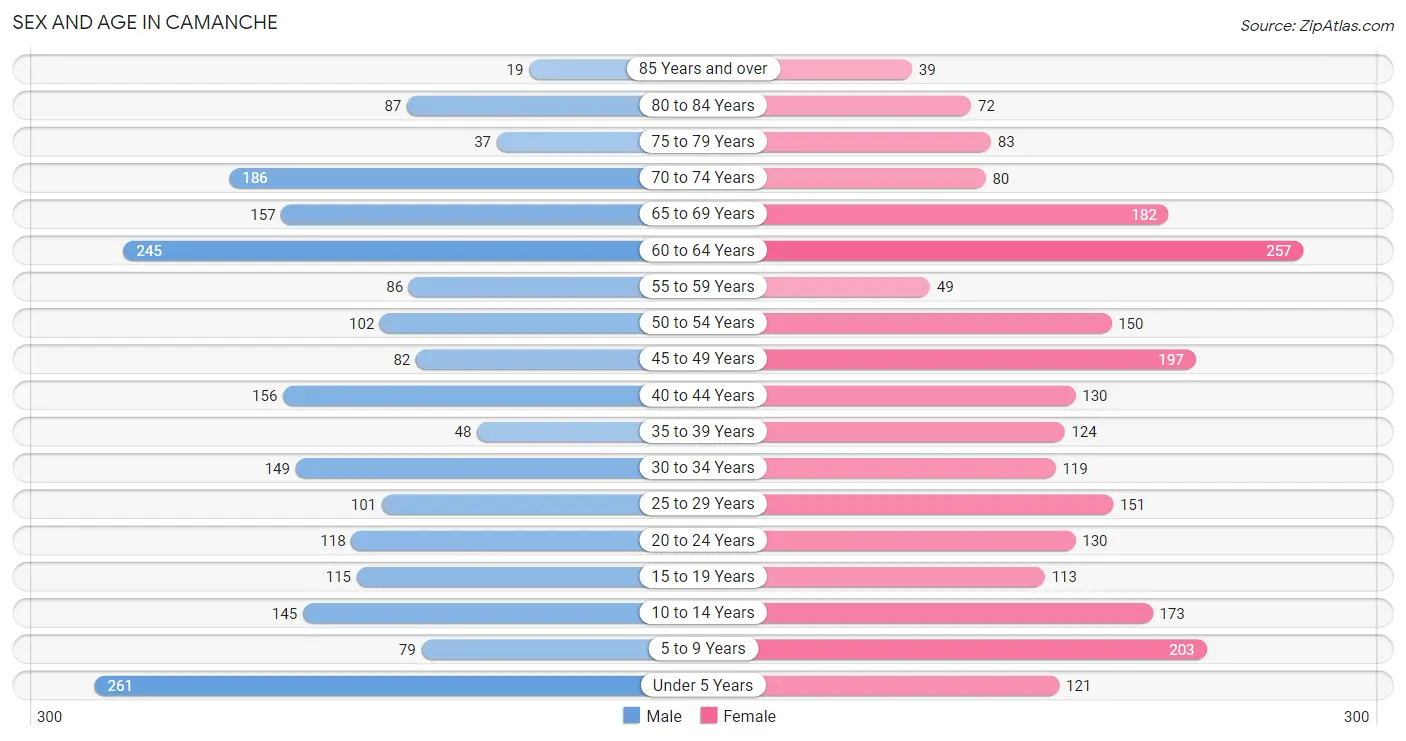
Sex and Age in Camanche
Sex and Age in Camanche
The most populous age groups in Camanche are Under 5 Years (261 | 12.0%) for men and 60 to 64 Years (257 | 10.8%) for women.
| Age Bracket | Male | Female |
| Under 5 Years | 261 (12.0%) | 121 (5.1%) |
| 5 to 9 Years | 79 (3.6%) | 203 (8.6%) |
| 10 to 14 Years | 145 (6.7%) | 173 (7.3%) |
| 15 to 19 Years | 115 (5.3%) | 113 (4.8%) |
| 20 to 24 Years | 118 (5.4%) | 130 (5.5%) |
| 25 to 29 Years | 101 (4.6%) | 151 (6.4%) |
| 30 to 34 Years | 149 (6.9%) | 119 (5.0%) |
| 35 to 39 Years | 48 (2.2%) | 124 (5.2%) |
| 40 to 44 Years | 156 (7.2%) | 130 (5.5%) |
| 45 to 49 Years | 82 (3.8%) | 197 (8.3%) |
| 50 to 54 Years | 102 (4.7%) | 150 (6.3%) |
| 55 to 59 Years | 86 (4.0%) | 49 (2.1%) |
| 60 to 64 Years | 245 (11.3%) | 257 (10.8%) |
| 65 to 69 Years | 157 (7.2%) | 182 (7.7%) |
| 70 to 74 Years | 186 (8.6%) | 80 (3.4%) |
| 75 to 79 Years | 37 (1.7%) | 83 (3.5%) |
| 80 to 84 Years | 87 (4.0%) | 72 (3.0%) |
| 85 Years and over | 19 (0.9%) | 39 (1.6%) |
| Total | 2,173 (100.0%) | 2,373 (100.0%) |
Families and Households in Camanche
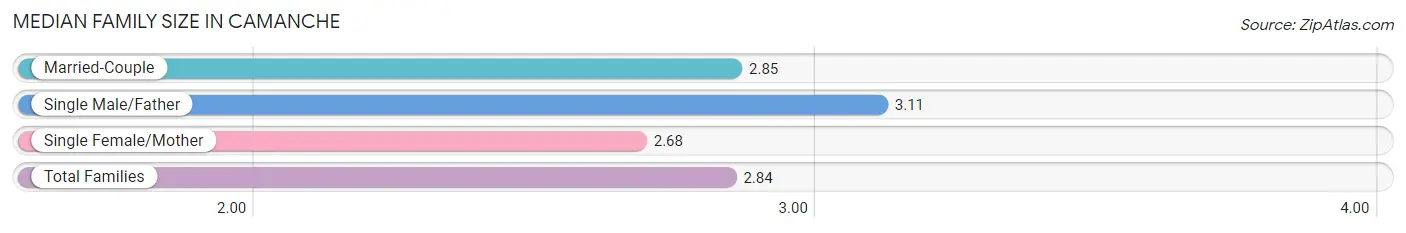
Median Family Size in Camanche
The median family size in Camanche is 2.84 persons per family, with single male/father families (53 | 4.0%) accounting for the largest median family size of 3.11 persons per family. On the other hand, single female/mother families (180 | 13.5%) represent the smallest median family size with 2.68 persons per family.
| Family Type | # Families | Family Size |
| Married-Couple | 1,104 (82.6%) | 2.85 |
| Single Male/Father | 53 (4.0%) | 3.11 |
| Single Female/Mother | 180 (13.5%) | 2.68 |
| Total Families | 1,337 (100.0%) | 2.84 |
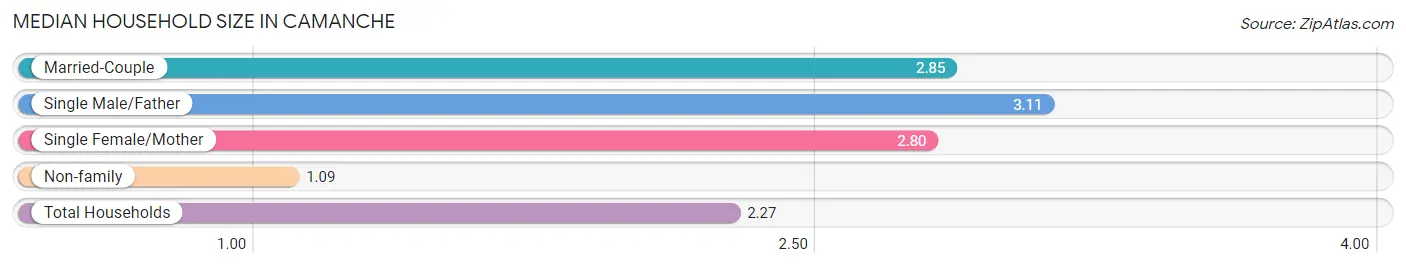
Median Household Size in Camanche
The median household size in Camanche is 2.27 persons per household, with single male/father households (53 | 2.7%) accounting for the largest median household size of 3.11 persons per household. non-family households (659 | 33.0%) represent the smallest median household size with 1.09 persons per household.
| Household Type | # Households | Household Size |
| Married-Couple | 1,104 (55.3%) | 2.85 |
| Single Male/Father | 53 (2.7%) | 3.11 |
| Single Female/Mother | 180 (9.0%) | 2.80 |
| Non-family | 659 (33.0%) | 1.09 |
| Total Households | 1,996 (100.0%) | 2.27 |
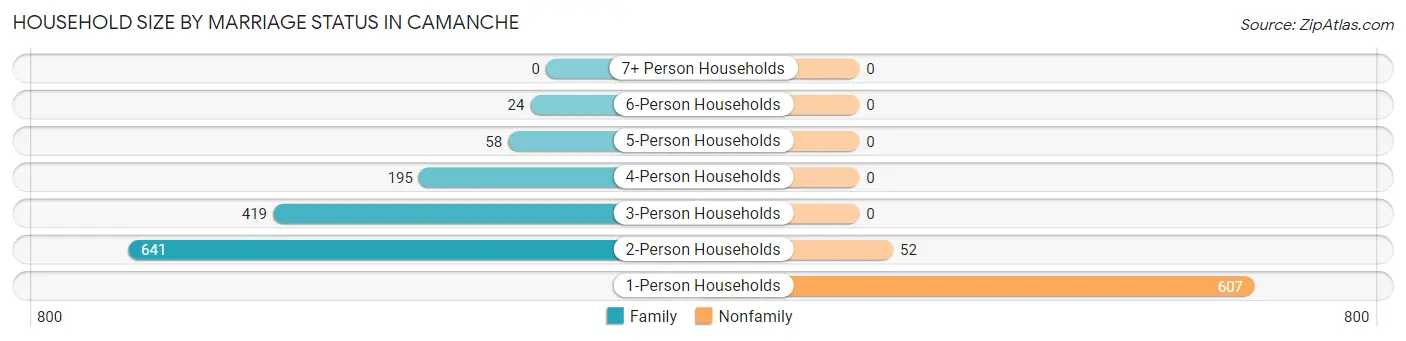
Household Size by Marriage Status in Camanche
Out of a total of 1,996 households in Camanche, 1,337 (67.0%) are family households, while 659 (33.0%) are nonfamily households. The most numerous type of family households are 2-person households, comprising 641, and the most common type of nonfamily households are 1-person households, comprising 607.
| Household Size | Family Households | Nonfamily Households |
| 1-Person Households | - | 607 (30.4%) |
| 2-Person Households | 641 (32.1%) | 52 (2.6%) |
| 3-Person Households | 419 (21.0%) | 0 (0.0%) |
| 4-Person Households | 195 (9.8%) | 0 (0.0%) |
| 5-Person Households | 58 (2.9%) | 0 (0.0%) |
| 6-Person Households | 24 (1.2%) | 0 (0.0%) |
| 7+ Person Households | 0 (0.0%) | 0 (0.0%) |
| Total | 1,337 (67.0%) | 659 (33.0%) |
Female Fertility in Camanche
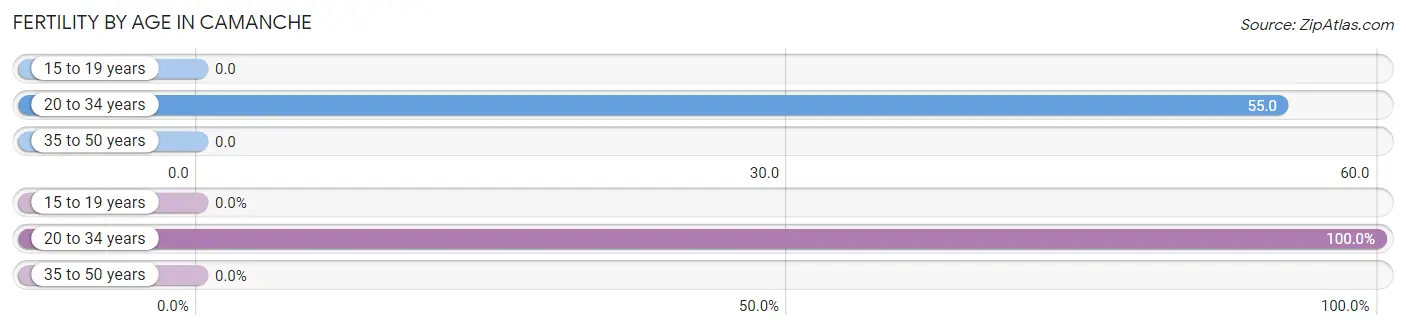
Fertility by Age in Camanche
Average fertility rate in Camanche is 22.0 births per 1,000 women. Women in the age bracket of 20 to 34 years have the highest fertility rate with 55.0 births per 1,000 women. Women in the age bracket of 20 to 34 years acount for 100.0% of all women with births.
| Age Bracket | Women with Births | Births / 1,000 Women |
| 15 to 19 years | 0 (0.0%) | 0.0 |
| 20 to 34 years | 22 (100.0%) | 55.0 |
| 35 to 50 years | 0 (0.0%) | 0.0 |
| Total | 22 (100.0%) | 22.0 |
Fertility by Age by Marriage Status in Camanche
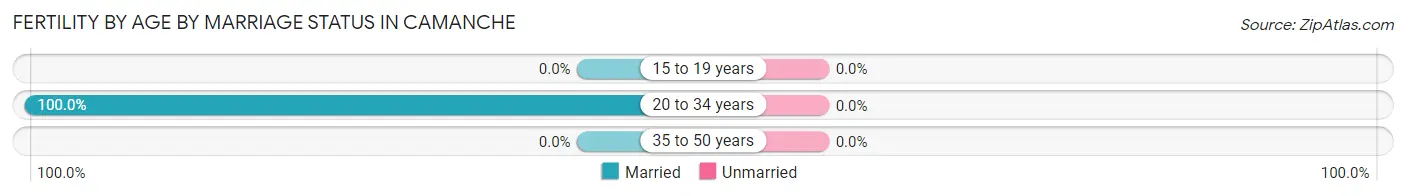
| Age Bracket | Married | Unmarried |
| 15 to 19 years | 0 (0.0%) | 0 (0.0%) |
| 20 to 34 years | 22 (100.0%) | 0 (0.0%) |
| 35 to 50 years | 0 (0.0%) | 0 (0.0%) |
| Total | 22 (100.0%) | 0 (0.0%) |
Fertility by Education in Camanche
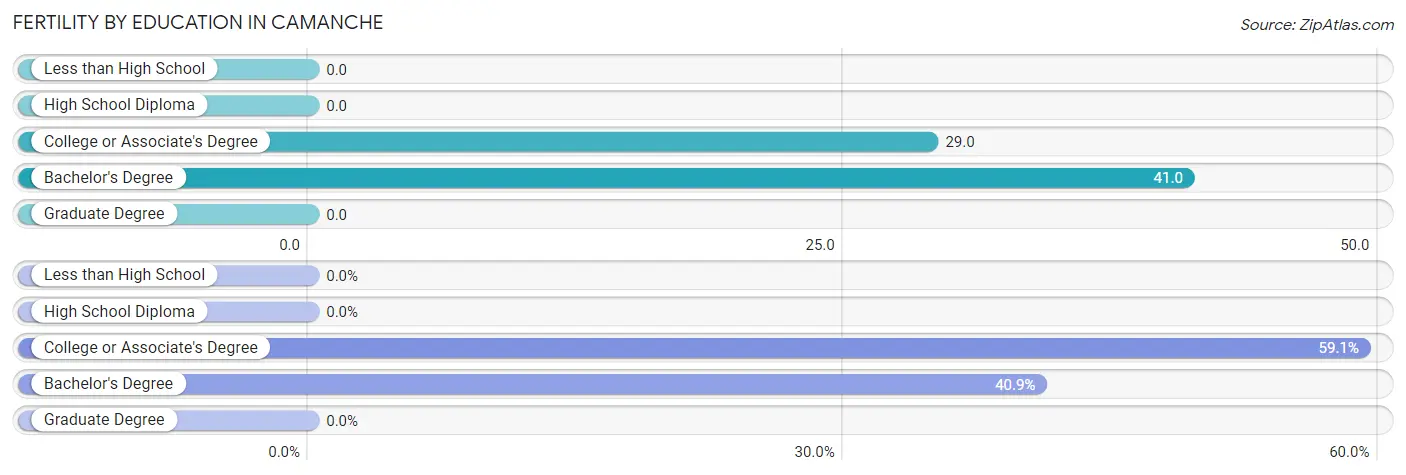
| Educational Attainment | Women with Births | Births / 1,000 Women |
| Less than High School | 0 (0.0%) | 0.0 |
| High School Diploma | 0 (0.0%) | 0.0 |
| College or Associate's Degree | 13 (59.1%) | 29.0 |
| Bachelor's Degree | 9 (40.9%) | 41.0 |
| Graduate Degree | 0 (0.0%) | 0.0 |
| Total | 22 (100.0%) | 22.0 |
Fertility by Education by Marriage Status in Camanche
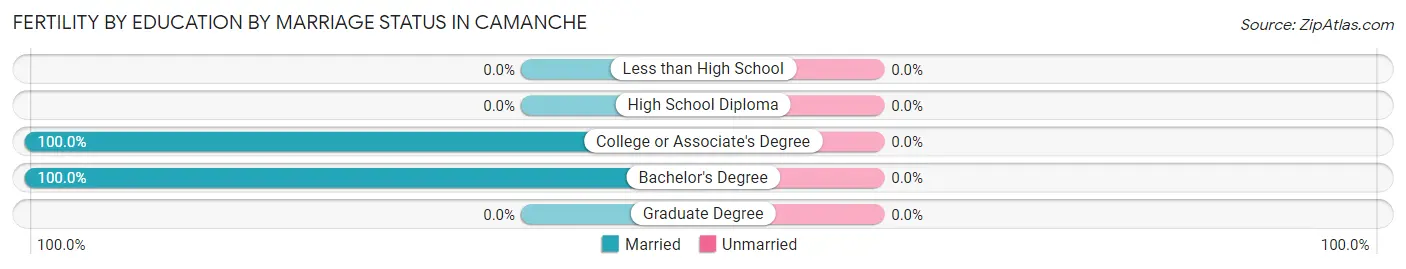
| Educational Attainment | Married | Unmarried |
| Less than High School | 0 (0.0%) | 0 (0.0%) |
| High School Diploma | 0 (0.0%) | 0 (0.0%) |
| College or Associate's Degree | 13 (100.0%) | 0 (0.0%) |
| Bachelor's Degree | 9 (100.0%) | 0 (0.0%) |
| Graduate Degree | 0 (0.0%) | 0 (0.0%) |
| Total | 22 (100.0%) | 0 (0.0%) |
Income in Camanche
Income Overview in Camanche
Per Capita Income in Camanche is $33,189, while median incomes of families and households are $83,911 and $65,090 respectively.
| Characteristic | Number | Measure |
| Per Capita Income | 4,546 | $33,189 |
| Median Family Income | 1,337 | $83,911 |
| Mean Family Income | 1,337 | $95,513 |
| Median Household Income | 1,996 | $65,090 |
| Mean Household Income | 1,996 | $76,994 |
| Income Deficit | 1,337 | $0 |
| Wage / Income Gap (%) | 4,546 | 38.89% |
| Wage / Income Gap ($) | 4,546 | 61.11¢ per $1 |
| Gini / Inequality Index | 4,546 | 0.39 |
Earnings by Sex in Camanche
Average Earnings in Camanche are $33,783, $47,154 for men and $28,815 for women, a difference of 38.9%.
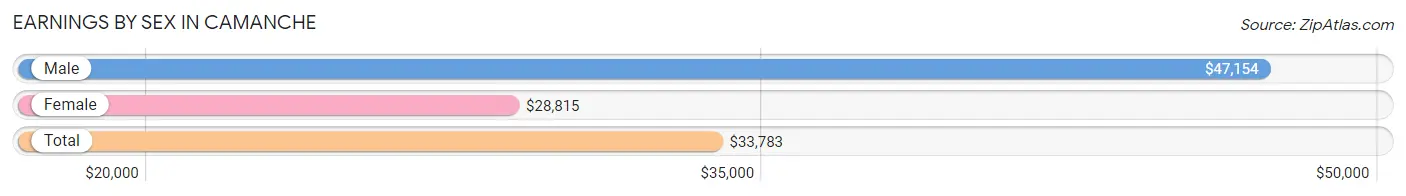
| Sex | Number | Average Earnings |
| Male | 1,221 (48.2%) | $47,154 |
| Female | 1,313 (51.8%) | $28,815 |
| Total | 2,534 (100.0%) | $33,783 |
Earnings by Sex by Income Bracket in Camanche
The most common earnings brackets in Camanche are $65,000 to $74,999 for men (160 | 13.1%) and $55,000 to $64,999 for women (248 | 18.9%).
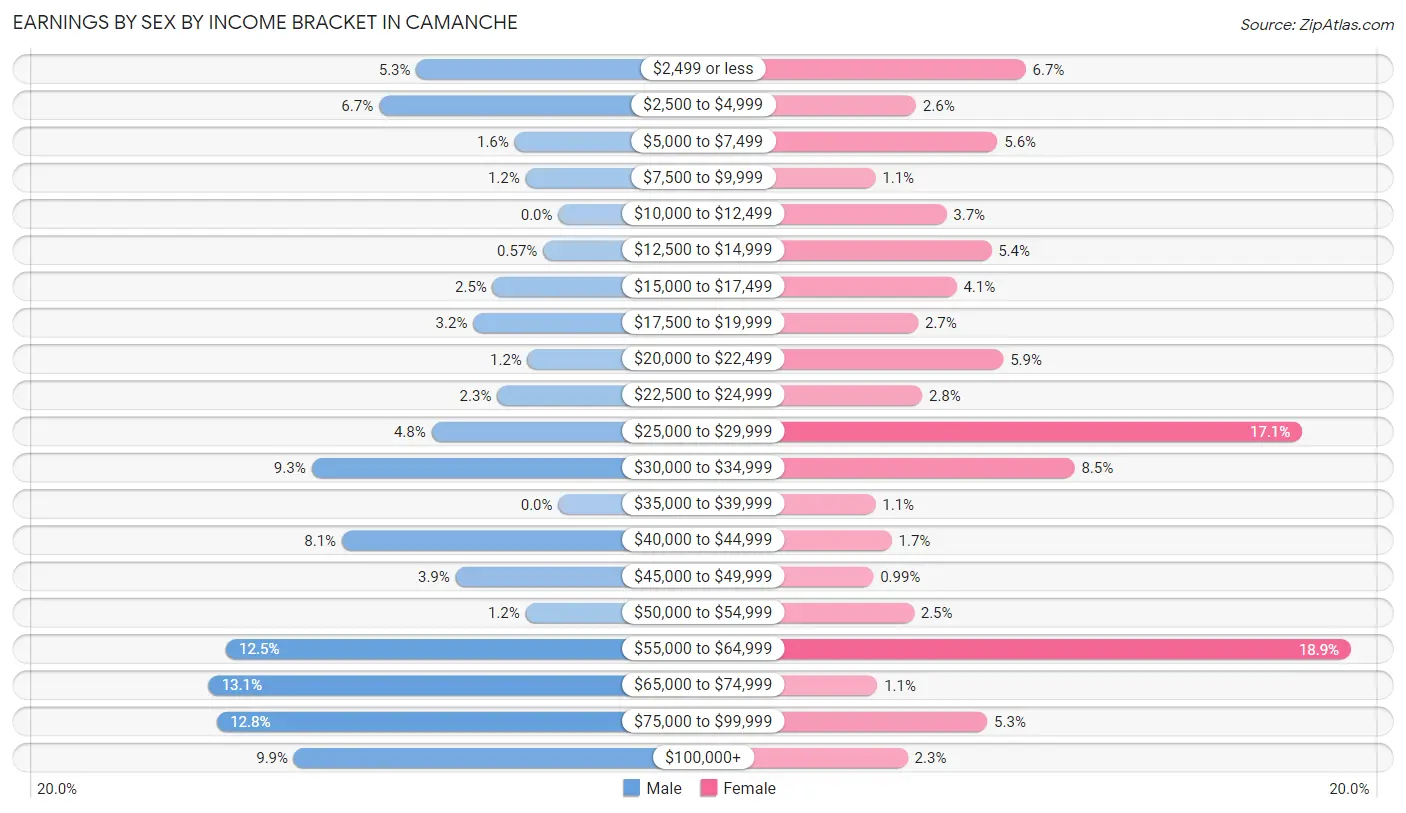
| Income | Male | Female |
| $2,499 or less | 65 (5.3%) | 88 (6.7%) |
| $2,500 to $4,999 | 82 (6.7%) | 34 (2.6%) |
| $5,000 to $7,499 | 20 (1.6%) | 74 (5.6%) |
| $7,500 to $9,999 | 15 (1.2%) | 14 (1.1%) |
| $10,000 to $12,499 | 0 (0.0%) | 49 (3.7%) |
| $12,500 to $14,999 | 7 (0.6%) | 71 (5.4%) |
| $15,000 to $17,499 | 30 (2.5%) | 54 (4.1%) |
| $17,500 to $19,999 | 39 (3.2%) | 35 (2.7%) |
| $20,000 to $22,499 | 14 (1.1%) | 77 (5.9%) |
| $22,500 to $24,999 | 28 (2.3%) | 37 (2.8%) |
| $25,000 to $29,999 | 58 (4.8%) | 224 (17.1%) |
| $30,000 to $34,999 | 113 (9.2%) | 112 (8.5%) |
| $35,000 to $39,999 | 0 (0.0%) | 14 (1.1%) |
| $40,000 to $44,999 | 99 (8.1%) | 22 (1.7%) |
| $45,000 to $49,999 | 47 (3.8%) | 13 (1.0%) |
| $50,000 to $54,999 | 15 (1.2%) | 33 (2.5%) |
| $55,000 to $64,999 | 152 (12.4%) | 248 (18.9%) |
| $65,000 to $74,999 | 160 (13.1%) | 15 (1.1%) |
| $75,000 to $99,999 | 156 (12.8%) | 69 (5.3%) |
| $100,000+ | 121 (9.9%) | 30 (2.3%) |
| Total | 1,221 (100.0%) | 1,313 (100.0%) |
Earnings by Sex by Educational Attainment in Camanche
Average earnings in Camanche are $58,703 for men and $29,245 for women, a difference of 50.2%. Men with an educational attainment of bachelor's degree enjoy the highest average annual earnings of $71,613, while those with high school diploma education earn the least with $46,324. Women with an educational attainment of graduate degree earn the most with the average annual earnings of $59,556, while those with high school diploma education have the smallest earnings of $27,292.
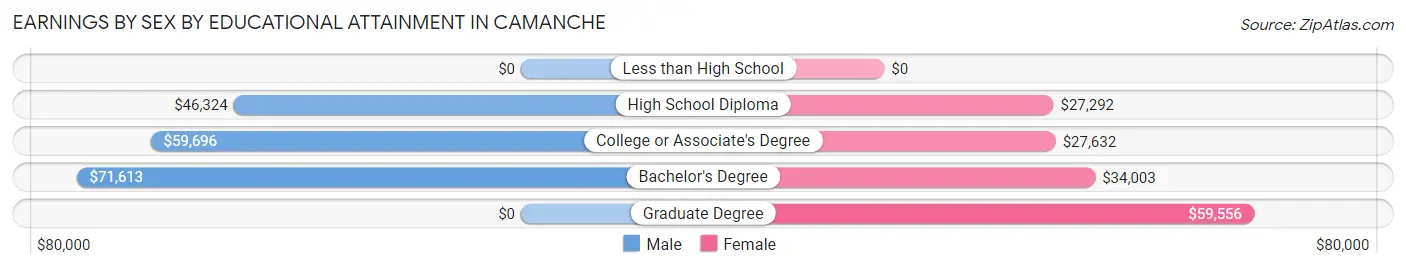
| Educational Attainment | Male Income | Female Income |
| Less than High School | - | - |
| High School Diploma | $46,324 | $27,292 |
| College or Associate's Degree | $59,696 | $27,632 |
| Bachelor's Degree | $71,613 | $34,003 |
| Graduate Degree | - | - |
| Total | $58,703 | $29,245 |
Family Income in Camanche
Family Income Brackets in Camanche
According to the Camanche family income data, there are 422 families falling into the $100,000 to $149,999 income range, which is the most common income bracket and makes up 31.6% of all families.
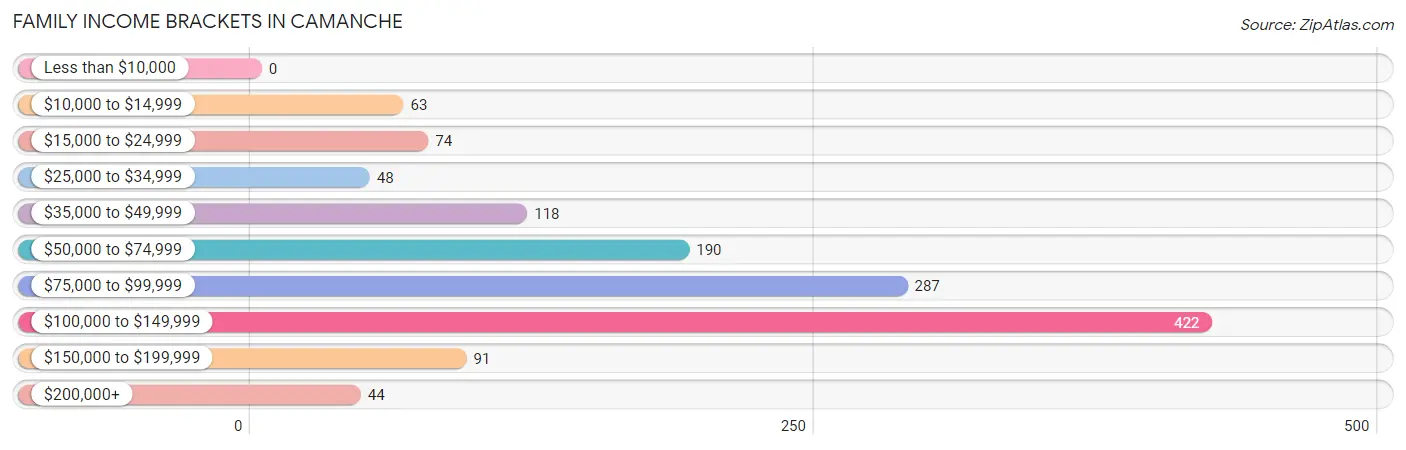
| Income Bracket | # Families | % Families |
| Less than $10,000 | 0 | 0.0% |
| $10,000 to $14,999 | 63 | 4.7% |
| $15,000 to $24,999 | 74 | 5.5% |
| $25,000 to $34,999 | 48 | 3.6% |
| $35,000 to $49,999 | 118 | 8.8% |
| $50,000 to $74,999 | 190 | 14.2% |
| $75,000 to $99,999 | 287 | 21.5% |
| $100,000 to $149,999 | 422 | 31.6% |
| $150,000 to $199,999 | 91 | 6.8% |
| $200,000+ | 44 | 3.3% |
Family Income by Famaliy Size in Camanche
5-person families (58 | 4.3%) account for the highest median family income in Camanche with $117,619 per family, while 2-person families (660 | 49.4%) have the highest median income of $38,261 per family member.
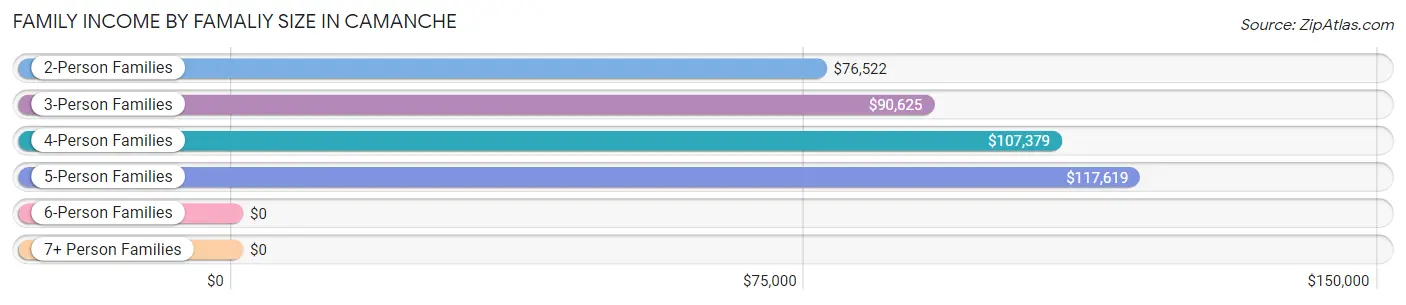
| Income Bracket | # Families | Median Income |
| 2-Person Families | 660 (49.4%) | $76,522 |
| 3-Person Families | 400 (29.9%) | $90,625 |
| 4-Person Families | 195 (14.6%) | $107,379 |
| 5-Person Families | 58 (4.3%) | $117,619 |
| 6-Person Families | 24 (1.8%) | $0 |
| 7+ Person Families | 0 (0.0%) | $0 |
| Total | 1,337 (100.0%) | $83,911 |
Family Income by Number of Earners in Camanche
The median family income in Camanche is $83,911, with families comprising 2 earners (734) having the highest median family income of $109,500, while families with no earners (241) have the lowest median family income of $44,671, accounting for 54.9% and 18.0% of families, respectively.
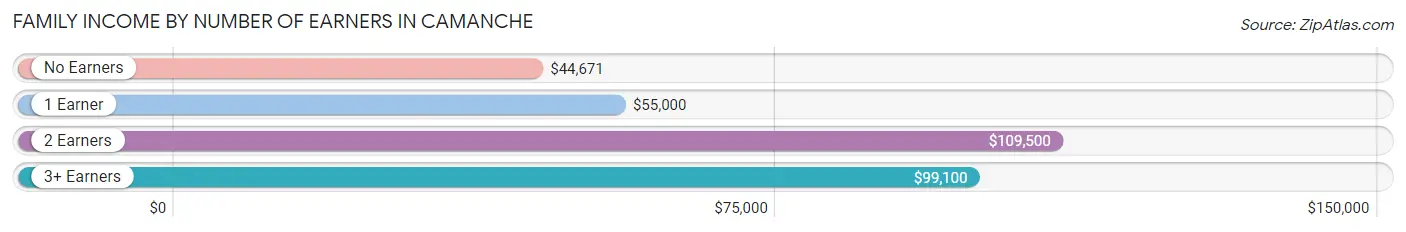
| Number of Earners | # Families | Median Income |
| No Earners | 241 (18.0%) | $44,671 |
| 1 Earner | 226 (16.9%) | $55,000 |
| 2 Earners | 734 (54.9%) | $109,500 |
| 3+ Earners | 136 (10.2%) | $99,100 |
| Total | 1,337 (100.0%) | $83,911 |
Household Income in Camanche
Household Income Brackets in Camanche
With 421 households falling in the category, the $100,000 to $149,999 income range is the most frequent in Camanche, accounting for 21.1% of all households. In contrast, only 32 households (1.6%) fall into the less than $10,000 income bracket, making it the least populous group.
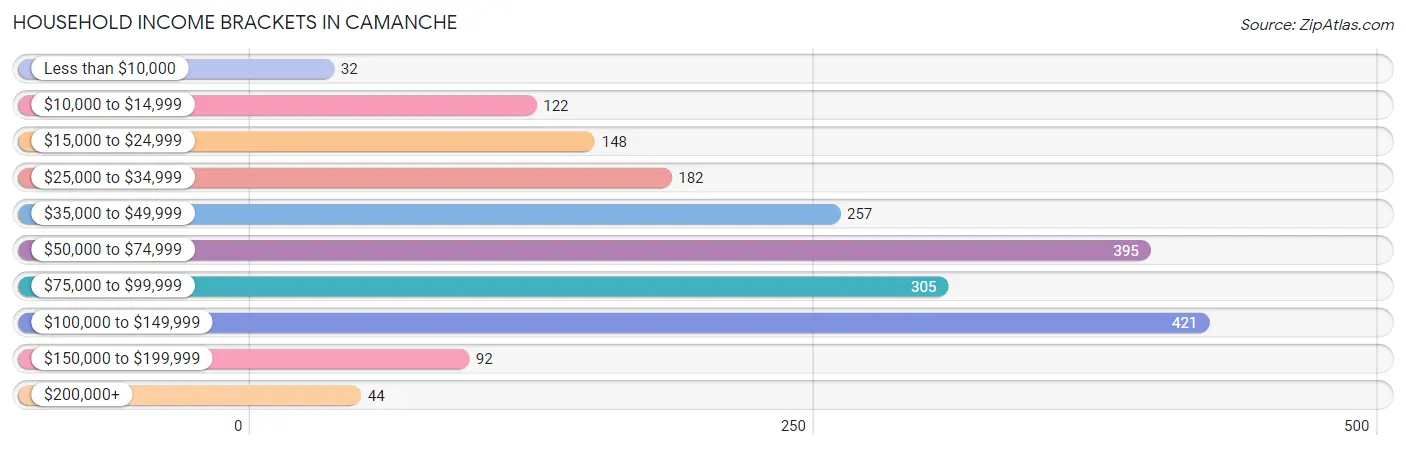
| Income Bracket | # Households | % Households |
| Less than $10,000 | 32 | 1.6% |
| $10,000 to $14,999 | 122 | 6.1% |
| $15,000 to $24,999 | 148 | 7.4% |
| $25,000 to $34,999 | 182 | 9.1% |
| $35,000 to $49,999 | 257 | 12.9% |
| $50,000 to $74,999 | 395 | 19.8% |
| $75,000 to $99,999 | 305 | 15.3% |
| $100,000 to $149,999 | 421 | 21.1% |
| $150,000 to $199,999 | 92 | 4.6% |
| $200,000+ | 44 | 2.2% |
Household Income by Householder Age in Camanche
The median household income in Camanche is $65,090, with the highest median household income of $101,182 found in the 25 to 44 years age bracket for the primary householder. A total of 497 households (24.9%) fall into this category. Meanwhile, the 15 to 24 years age bracket for the primary householder has the lowest median household income of $0, with 118 households (5.9%) in this group.
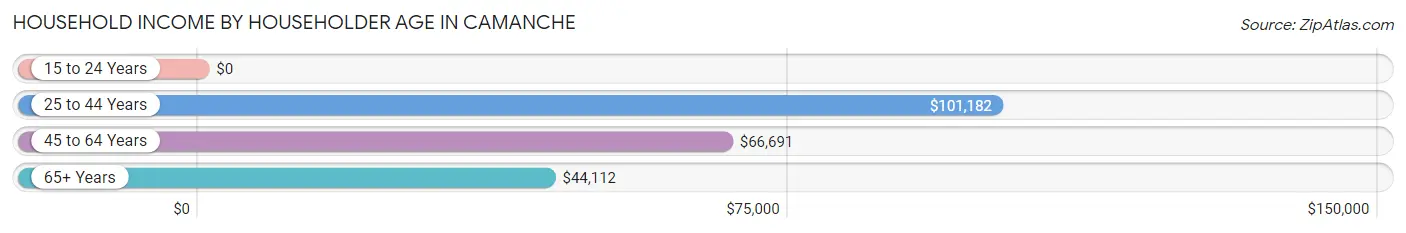
| Income Bracket | # Households | Median Income |
| 15 to 24 Years | 118 (5.9%) | $0 |
| 25 to 44 Years | 497 (24.9%) | $101,182 |
| 45 to 64 Years | 800 (40.1%) | $66,691 |
| 65+ Years | 581 (29.1%) | $44,112 |
| Total | 1,996 (100.0%) | $65,090 |
Poverty in Camanche
Income Below Poverty by Sex and Age in Camanche
With 4.3% poverty level for males and 9.2% for females among the residents of Camanche, 75 year old and over males and 16 and 17 year old females are the most vulnerable to poverty, with 37 males (25.9%) and 22 females (59.5%) in their respective age groups living below the poverty level.
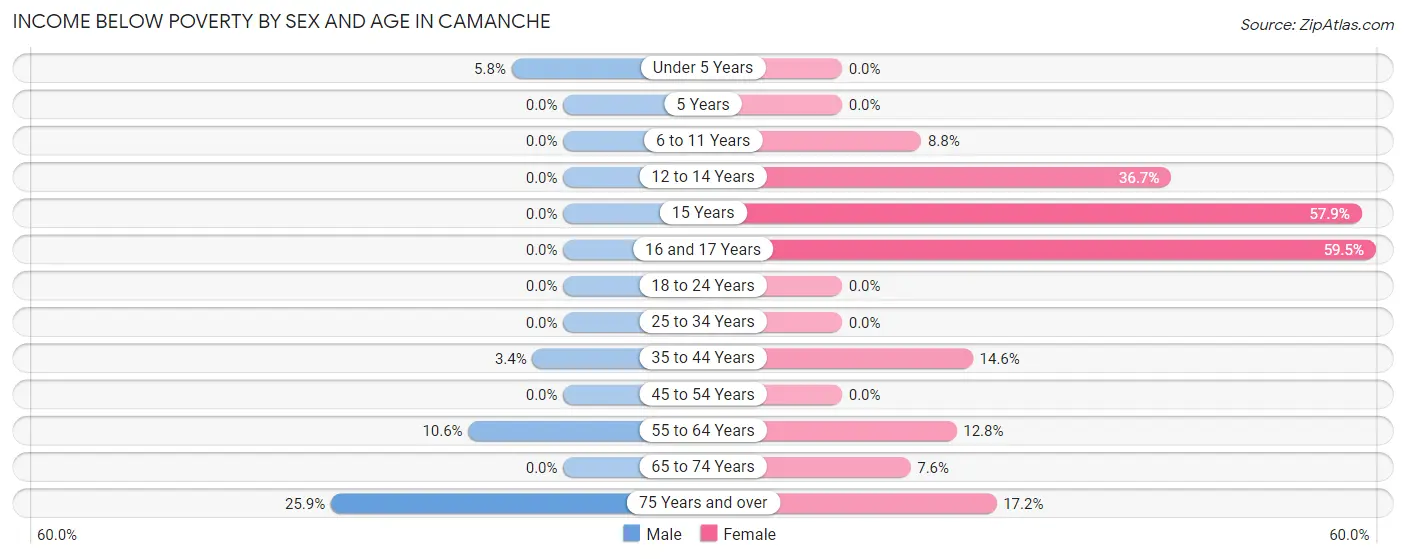
| Age Bracket | Male | Female |
| Under 5 Years | 15 (5.8%) | 0 (0.0%) |
| 5 Years | 0 (0.0%) | 0 (0.0%) |
| 6 to 11 Years | 0 (0.0%) | 24 (8.8%) |
| 12 to 14 Years | 0 (0.0%) | 22 (36.7%) |
| 15 Years | 0 (0.0%) | 22 (57.9%) |
| 16 and 17 Years | 0 (0.0%) | 22 (59.5%) |
| 18 to 24 Years | 0 (0.0%) | 0 (0.0%) |
| 25 to 34 Years | 0 (0.0%) | 0 (0.0%) |
| 35 to 44 Years | 7 (3.4%) | 37 (14.6%) |
| 45 to 54 Years | 0 (0.0%) | 0 (0.0%) |
| 55 to 64 Years | 35 (10.6%) | 39 (12.8%) |
| 65 to 74 Years | 0 (0.0%) | 20 (7.6%) |
| 75 Years and over | 37 (25.9%) | 32 (17.2%) |
| Total | 94 (4.3%) | 218 (9.2%) |
Income Above Poverty by Sex and Age in Camanche
According to the poverty statistics in Camanche, males aged 6 to 11 years and females aged under 5 years are the age groups that are most secure financially, with 100.0% of males and 100.0% of females in these age groups living above the poverty line.
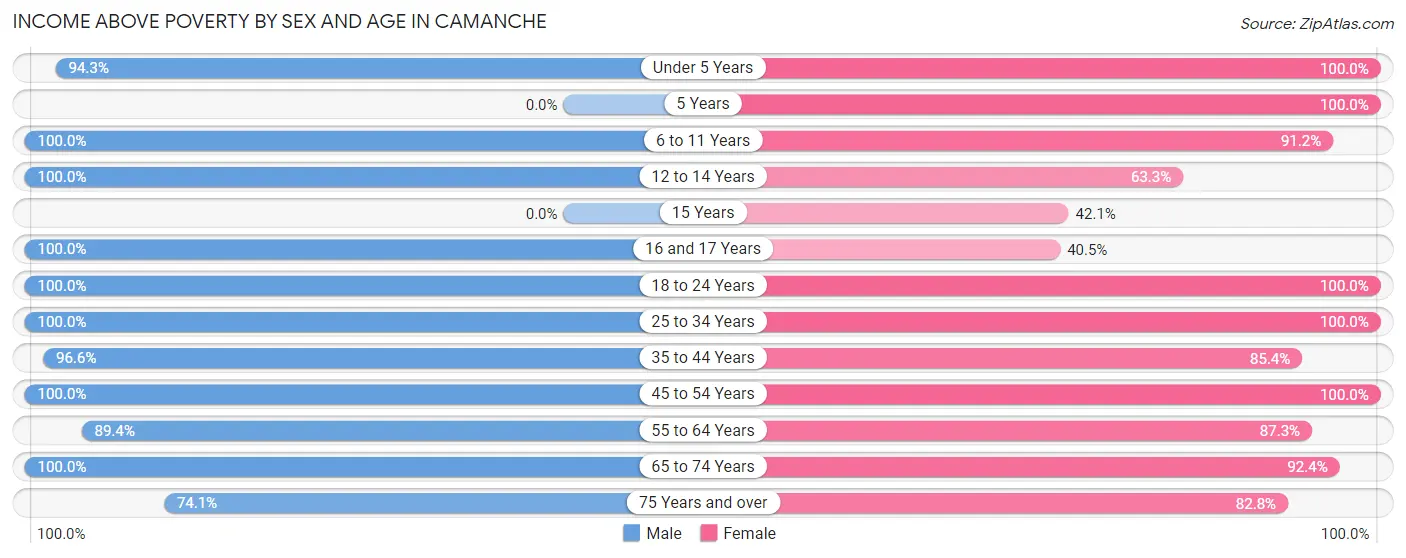
| Age Bracket | Male | Female |
| Under 5 Years | 246 (94.3%) | 121 (100.0%) |
| 5 Years | 0 (0.0%) | 44 (100.0%) |
| 6 to 11 Years | 129 (100.0%) | 248 (91.2%) |
| 12 to 14 Years | 95 (100.0%) | 38 (63.3%) |
| 15 Years | 0 (0.0%) | 16 (42.1%) |
| 16 and 17 Years | 40 (100.0%) | 15 (40.5%) |
| 18 to 24 Years | 193 (100.0%) | 168 (100.0%) |
| 25 to 34 Years | 250 (100.0%) | 270 (100.0%) |
| 35 to 44 Years | 197 (96.6%) | 217 (85.4%) |
| 45 to 54 Years | 184 (100.0%) | 347 (100.0%) |
| 55 to 64 Years | 296 (89.4%) | 267 (87.3%) |
| 65 to 74 Years | 343 (100.0%) | 242 (92.4%) |
| 75 Years and over | 106 (74.1%) | 154 (82.8%) |
| Total | 2,079 (95.7%) | 2,147 (90.8%) |
Income Below Poverty Among Married-Couple Families in Camanche
The poverty statistics for married-couple families in Camanche show that 1.9% or 21 of the total 1,104 families live below the poverty line. Families with no children have the highest poverty rate of 3.3%, comprising of 21 families. On the other hand, families with 1 or 2 children have the lowest poverty rate of 0.0%, which includes 0 families.
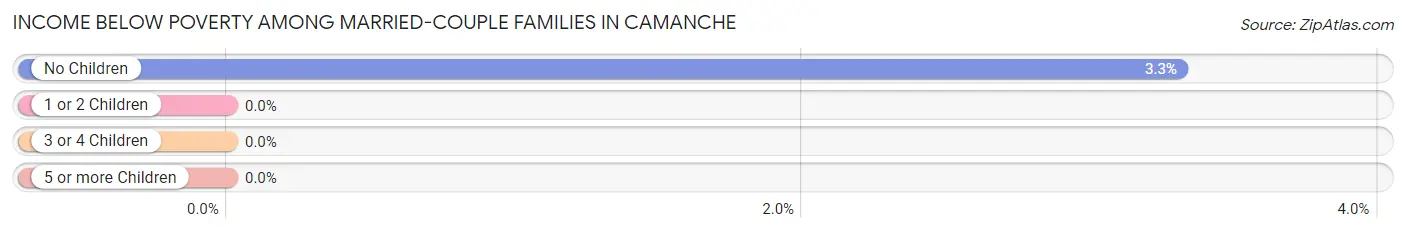
| Children | Above Poverty | Below Poverty |
| No Children | 614 (96.7%) | 21 (3.3%) |
| 1 or 2 Children | 425 (100.0%) | 0 (0.0%) |
| 3 or 4 Children | 44 (100.0%) | 0 (0.0%) |
| 5 or more Children | 0 (0.0%) | 0 (0.0%) |
| Total | 1,083 (98.1%) | 21 (1.9%) |
Income Below Poverty Among Single-Parent Households in Camanche
According to the poverty data in Camanche, 39.6% or 21 single-father households and 11.7% or 21 single-mother households are living below the poverty line. Among single-father households, those with 1 or 2 children have the highest poverty rate, with 7 households (100.0%) experiencing poverty. Likewise, among single-mother households, those with 1 or 2 children have the highest poverty rate, with 21 households (14.6%) falling below the poverty line.
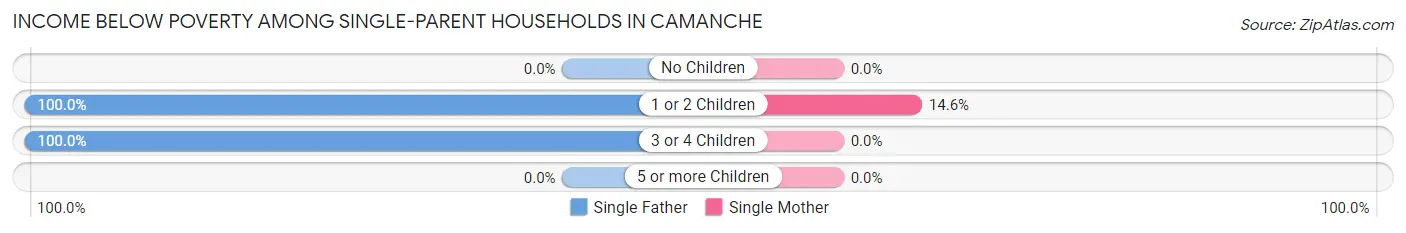
| Children | Single Father | Single Mother |
| No Children | 0 (0.0%) | 0 (0.0%) |
| 1 or 2 Children | 7 (100.0%) | 21 (14.6%) |
| 3 or 4 Children | 14 (100.0%) | 0 (0.0%) |
| 5 or more Children | 0 (0.0%) | 0 (0.0%) |
| Total | 21 (39.6%) | 21 (11.7%) |
Income Below Poverty Among Married-Couple vs Single-Parent Households in Camanche
The poverty data for Camanche shows that 21 of the married-couple family households (1.9%) and 42 of the single-parent households (18.0%) are living below the poverty level. Within the married-couple family households, those with no children have the highest poverty rate, with 21 households (3.3%) falling below the poverty line. Among the single-parent households, those with 3 or 4 children have the highest poverty rate, with 14 household (100.0%) living below poverty.
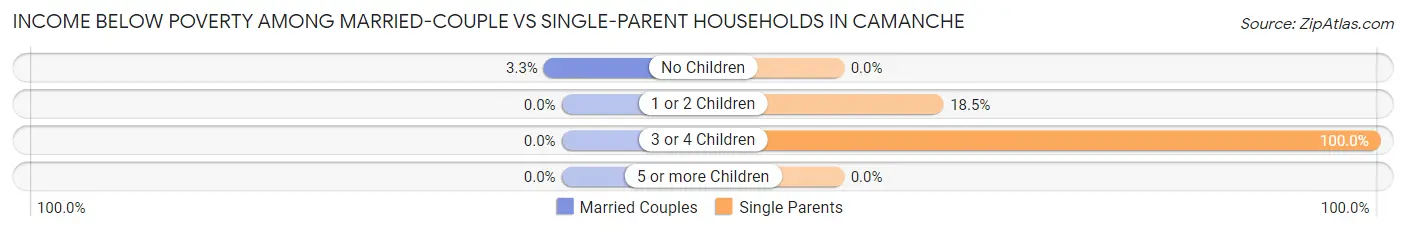
| Children | Married-Couple Families | Single-Parent Households |
| No Children | 21 (3.3%) | 0 (0.0%) |
| 1 or 2 Children | 0 (0.0%) | 28 (18.5%) |
| 3 or 4 Children | 0 (0.0%) | 14 (100.0%) |
| 5 or more Children | 0 (0.0%) | 0 (0.0%) |
| Total | 21 (1.9%) | 42 (18.0%) |
Employment Characteristics in Camanche
Employment by Class of Employer in Camanche
Among the 2,268 employed individuals in Camanche, private company employees (1,662 | 73.3%), local government employees (227 | 10.0%), and self-employed (not incorporated) (123 | 5.4%) make up the most common classes of employment.
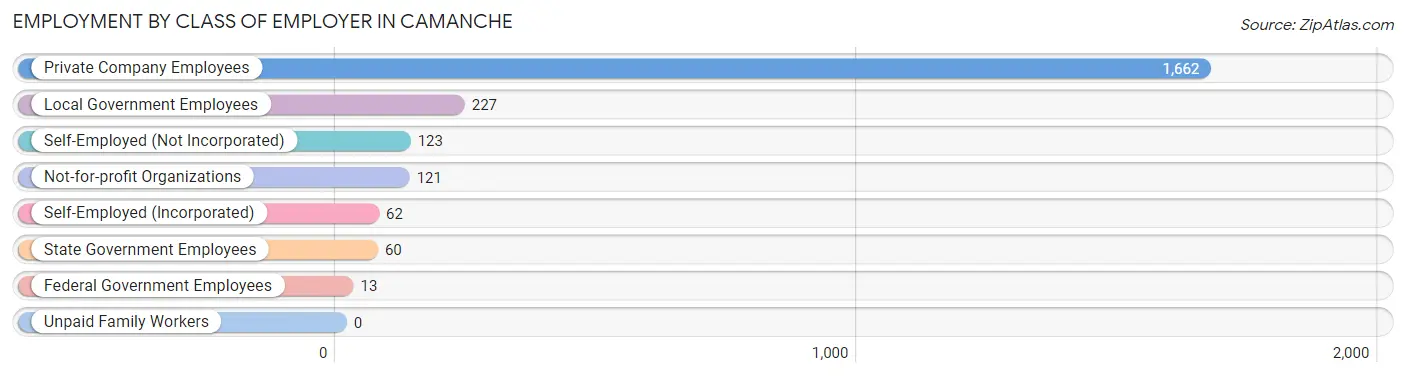
| Employer Class | # Employees | % Employees |
| Private Company Employees | 1,662 | 73.3% |
| Self-Employed (Incorporated) | 62 | 2.7% |
| Self-Employed (Not Incorporated) | 123 | 5.4% |
| Not-for-profit Organizations | 121 | 5.3% |
| Local Government Employees | 227 | 10.0% |
| State Government Employees | 60 | 2.6% |
| Federal Government Employees | 13 | 0.6% |
| Unpaid Family Workers | 0 | 0.0% |
| Total | 2,268 | 100.0% |
Employment Status by Age in Camanche
According to the labor force statistics for Camanche, out of the total population over 16 years of age (3,526), 66.7% or 2,352 individuals are in the labor force, with 3.6% or 85 of them unemployed. The age group with the highest labor force participation rate is 20 to 24 years, with 100.0% or 248 individuals in the labor force. Within the labor force, the 20 to 24 years age range has the highest percentage of unemployed individuals, with 12.5% or 31 of them being unemployed.
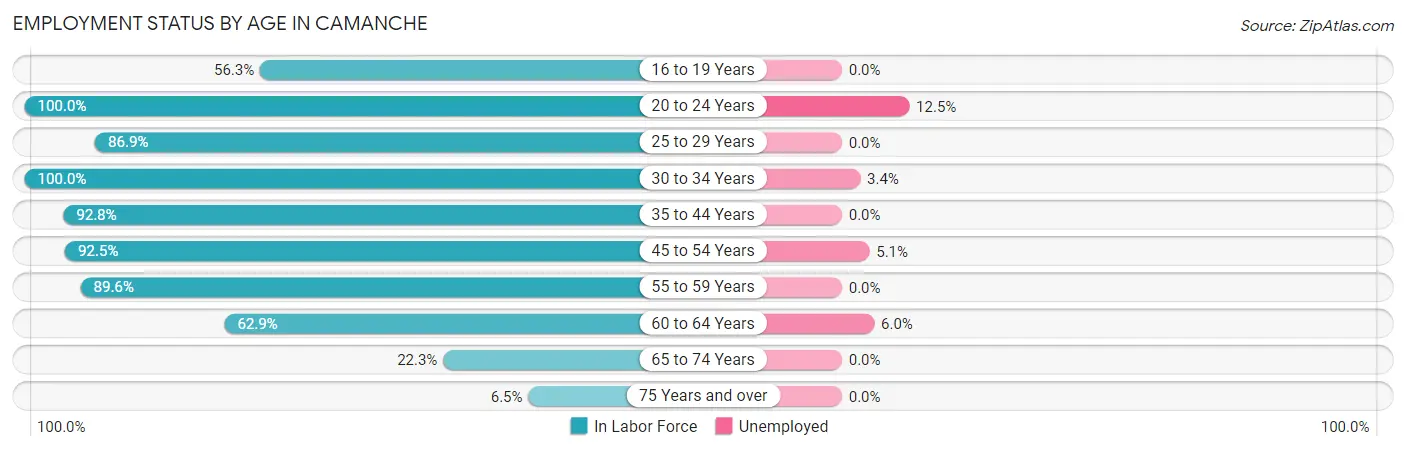
| Age Bracket | In Labor Force | Unemployed |
| 16 to 19 Years | 107 (56.3%) | 0 (0.0%) |
| 20 to 24 Years | 248 (100.0%) | 31 (12.5%) |
| 25 to 29 Years | 219 (86.9%) | 0 (0.0%) |
| 30 to 34 Years | 268 (100.0%) | 9 (3.4%) |
| 35 to 44 Years | 425 (92.8%) | 0 (0.0%) |
| 45 to 54 Years | 491 (92.5%) | 25 (5.1%) |
| 55 to 59 Years | 121 (89.6%) | 0 (0.0%) |
| 60 to 64 Years | 316 (62.9%) | 19 (6.0%) |
| 65 to 74 Years | 135 (22.3%) | 0 (0.0%) |
| 75 Years and over | 22 (6.5%) | 0 (0.0%) |
| Total | 2,352 (66.7%) | 85 (3.6%) |
Employment Status by Educational Attainment in Camanche
According to labor force statistics for Camanche, 85.7% of individuals (1,839) out of the total population between 25 and 64 years of age (2,146) are in the labor force, with 2.9% or 53 of them being unemployed. The group with the highest labor force participation rate are those with the educational attainment of less than high school, with 100.0% or 39 individuals in the labor force. Within the labor force, individuals with high school diploma education have the highest percentage of unemployment, with 3.6% or 19 of them being unemployed.
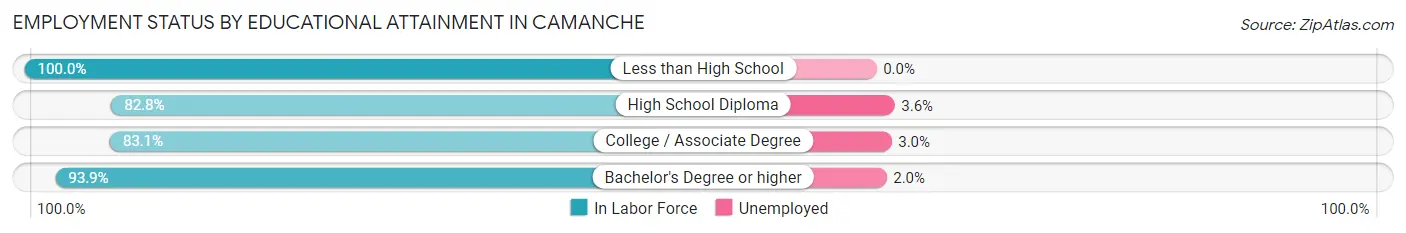
| Educational Attainment | In Labor Force | Unemployed |
| Less than High School | 39 (100.0%) | 0 (0.0%) |
| High School Diploma | 525 (82.8%) | 23 (3.6%) |
| College / Associate Degree | 828 (83.1%) | 30 (3.0%) |
| Bachelor's Degree or higher | 448 (93.9%) | 10 (2.0%) |
| Total | 1,839 (85.7%) | 62 (2.9%) |
Employment Occupations by Sex in Camanche
Management, Business, Science and Arts Occupations
The most common Management, Business, Science and Arts occupations in Camanche are Community & Social Service (250 | 11.0%), Business & Financial (179 | 7.9%), Education Instruction & Library (166 | 7.3%), Management (144 | 6.4%), and Computers, Engineering & Science (117 | 5.2%).
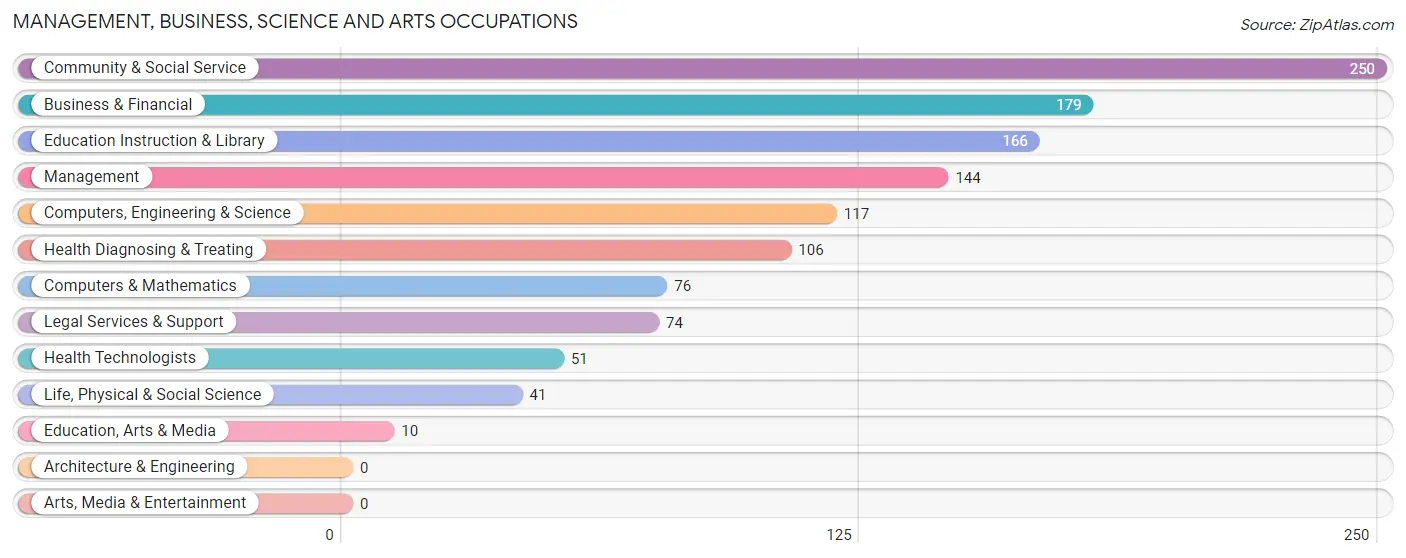
Management, Business, Science and Arts Occupations by Sex
Within the Management, Business, Science and Arts occupations in Camanche, the most male-oriented occupations are Life, Physical & Social Science (100.0%), Computers, Engineering & Science (59.8%), and Management (54.9%), while the most female-oriented occupations are Community & Social Service (100.0%), Education, Arts & Media (100.0%), and Legal Services & Support (100.0%).
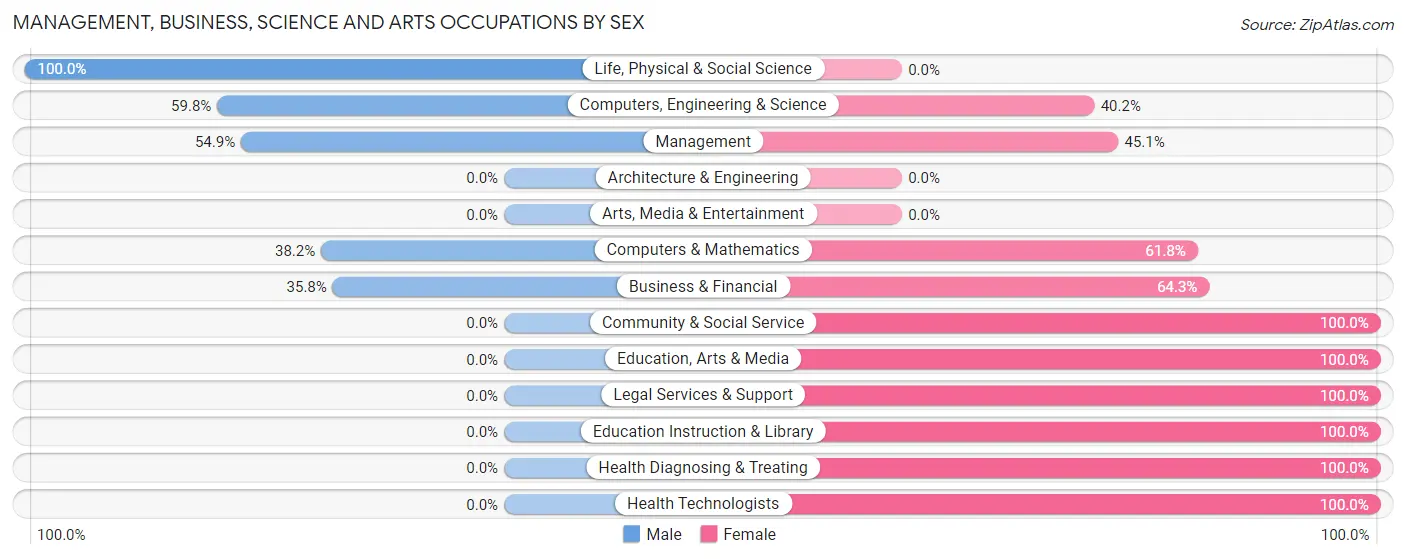
| Occupation | Male | Female |
| Management | 79 (54.9%) | 65 (45.1%) |
| Business & Financial | 64 (35.7%) | 115 (64.2%) |
| Computers, Engineering & Science | 70 (59.8%) | 47 (40.2%) |
| Computers & Mathematics | 29 (38.2%) | 47 (61.8%) |
| Architecture & Engineering | 0 (0.0%) | 0 (0.0%) |
| Life, Physical & Social Science | 41 (100.0%) | 0 (0.0%) |
| Community & Social Service | 0 (0.0%) | 250 (100.0%) |
| Education, Arts & Media | 0 (0.0%) | 10 (100.0%) |
| Legal Services & Support | 0 (0.0%) | 74 (100.0%) |
| Education Instruction & Library | 0 (0.0%) | 166 (100.0%) |
| Arts, Media & Entertainment | 0 (0.0%) | 0 (0.0%) |
| Health Diagnosing & Treating | 0 (0.0%) | 106 (100.0%) |
| Health Technologists | 0 (0.0%) | 51 (100.0%) |
| Total (Category) | 213 (26.8%) | 583 (73.2%) |
| Total (Overall) | 1,076 (47.4%) | 1,192 (52.6%) |
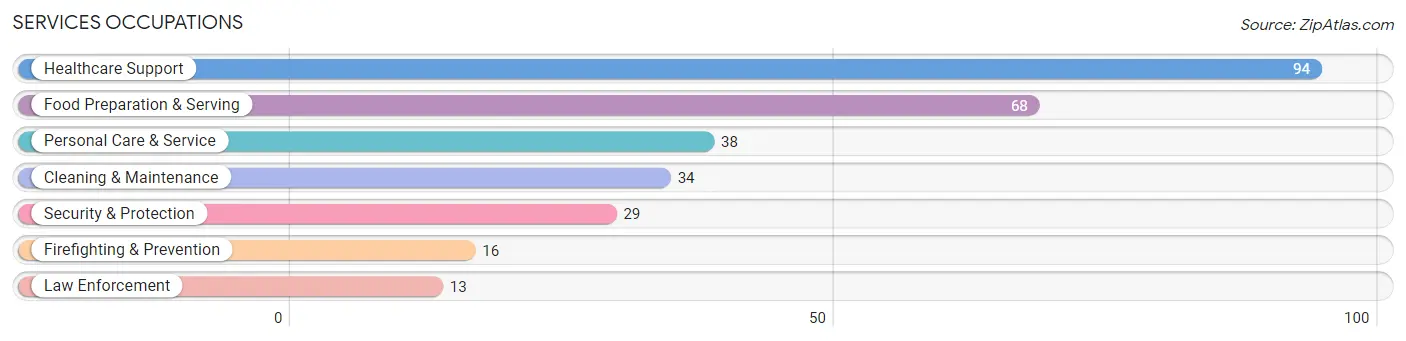
Services Occupations
The most common Services occupations in Camanche are Healthcare Support (94 | 4.1%), Food Preparation & Serving (68 | 3.0%), Personal Care & Service (38 | 1.7%), Cleaning & Maintenance (34 | 1.5%), and Security & Protection (29 | 1.3%).
Services Occupations by Sex
Within the Services occupations in Camanche, the most male-oriented occupations are Security & Protection (100.0%), Firefighting & Prevention (100.0%), and Law Enforcement (100.0%), while the most female-oriented occupations are Healthcare Support (100.0%), Personal Care & Service (100.0%), and Food Preparation & Serving (41.2%).
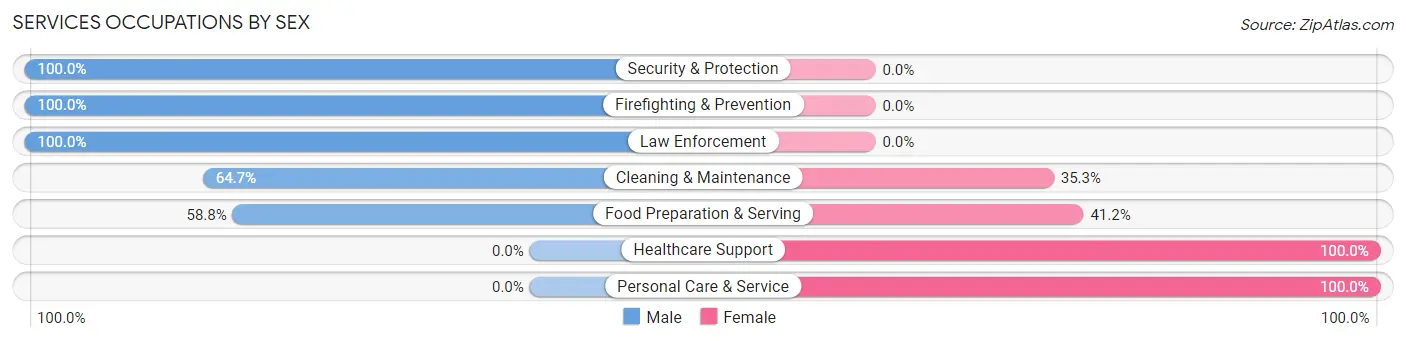
| Occupation | Male | Female |
| Healthcare Support | 0 (0.0%) | 94 (100.0%) |
| Security & Protection | 29 (100.0%) | 0 (0.0%) |
| Firefighting & Prevention | 16 (100.0%) | 0 (0.0%) |
| Law Enforcement | 13 (100.0%) | 0 (0.0%) |
| Food Preparation & Serving | 40 (58.8%) | 28 (41.2%) |
| Cleaning & Maintenance | 22 (64.7%) | 12 (35.3%) |
| Personal Care & Service | 0 (0.0%) | 38 (100.0%) |
| Total (Category) | 91 (34.6%) | 172 (65.4%) |
| Total (Overall) | 1,076 (47.4%) | 1,192 (52.6%) |
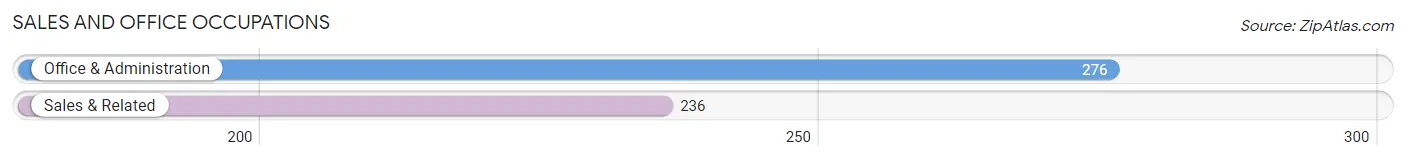
Sales and Office Occupations
The most common Sales and Office occupations in Camanche are Office & Administration (276 | 12.2%), and Sales & Related (236 | 10.4%).
Sales and Office Occupations by Sex
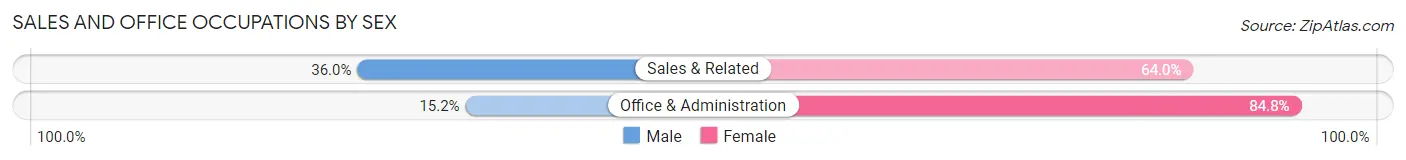
| Occupation | Male | Female |
| Sales & Related | 85 (36.0%) | 151 (64.0%) |
| Office & Administration | 42 (15.2%) | 234 (84.8%) |
| Total (Category) | 127 (24.8%) | 385 (75.2%) |
| Total (Overall) | 1,076 (47.4%) | 1,192 (52.6%) |
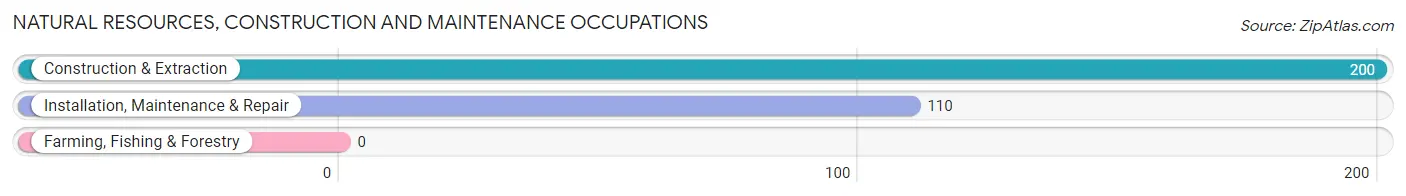
Natural Resources, Construction and Maintenance Occupations
The most common Natural Resources, Construction and Maintenance occupations in Camanche are Construction & Extraction (200 | 8.8%), and Installation, Maintenance & Repair (110 | 4.9%).
Natural Resources, Construction and Maintenance Occupations by Sex
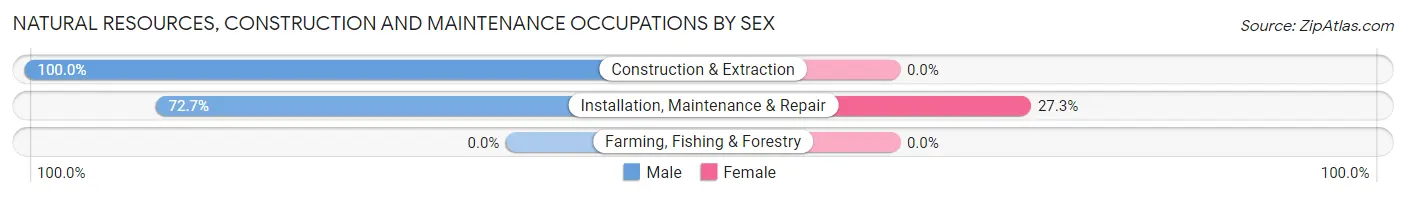
| Occupation | Male | Female |
| Farming, Fishing & Forestry | 0 (0.0%) | 0 (0.0%) |
| Construction & Extraction | 200 (100.0%) | 0 (0.0%) |
| Installation, Maintenance & Repair | 80 (72.7%) | 30 (27.3%) |
| Total (Category) | 280 (90.3%) | 30 (9.7%) |
| Total (Overall) | 1,076 (47.4%) | 1,192 (52.6%) |
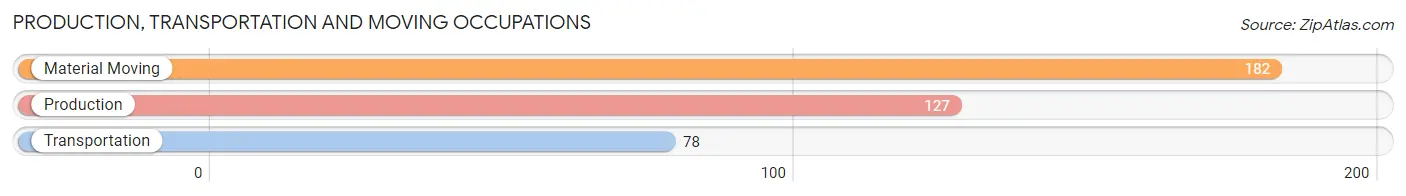
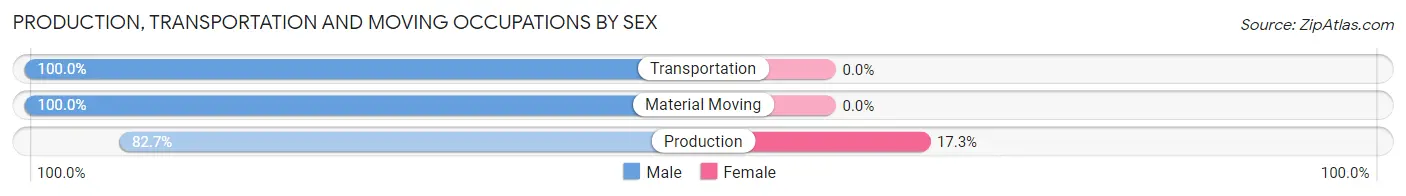
Production, Transportation and Moving Occupations
The most common Production, Transportation and Moving occupations in Camanche are Material Moving (182 | 8.0%), Production (127 | 5.6%), and Transportation (78 | 3.4%).
Production, Transportation and Moving Occupations by Sex
| Occupation | Male | Female |
| Production | 105 (82.7%) | 22 (17.3%) |
| Transportation | 78 (100.0%) | 0 (0.0%) |
| Material Moving | 182 (100.0%) | 0 (0.0%) |
| Total (Category) | 365 (94.3%) | 22 (5.7%) |
| Total (Overall) | 1,076 (47.4%) | 1,192 (52.6%) |
Employment Industries by Sex in Camanche
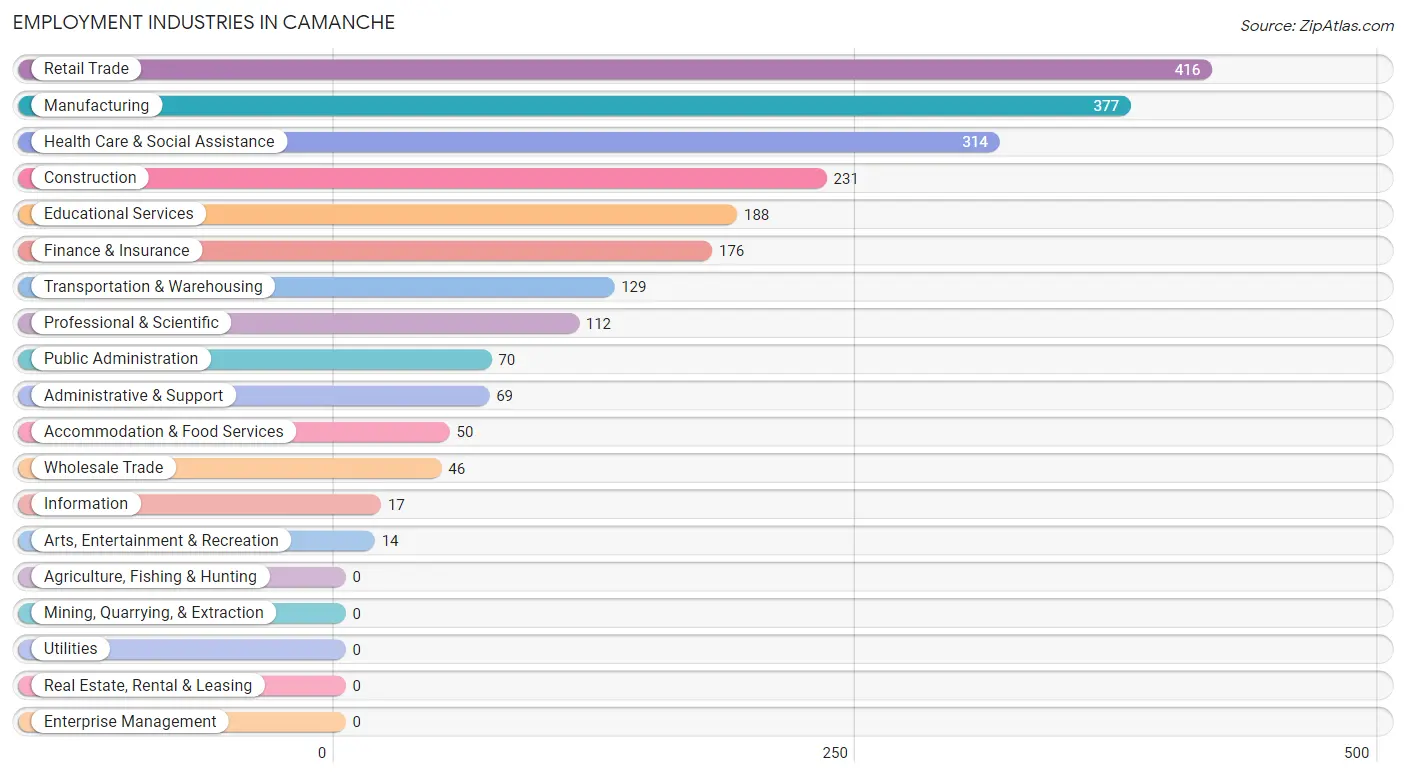
Employment Industries in Camanche
The major employment industries in Camanche include Retail Trade (416 | 18.3%), Manufacturing (377 | 16.6%), Health Care & Social Assistance (314 | 13.8%), Construction (231 | 10.2%), and Educational Services (188 | 8.3%).
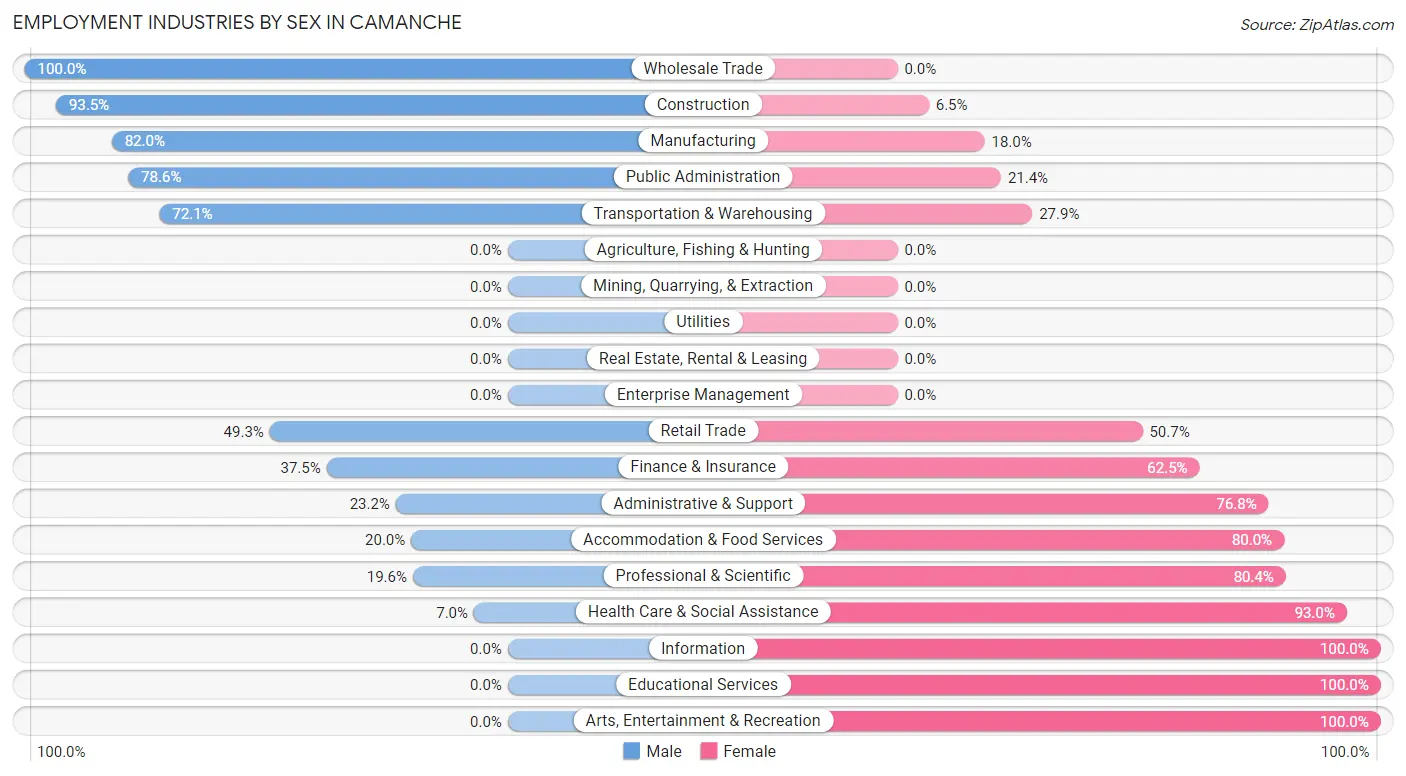
Employment Industries by Sex in Camanche
The Camanche industries that see more men than women are Wholesale Trade (100.0%), Construction (93.5%), and Manufacturing (82.0%), whereas the industries that tend to have a higher number of women are Information (100.0%), Educational Services (100.0%), and Arts, Entertainment & Recreation (100.0%).
| Industry | Male | Female |
| Agriculture, Fishing & Hunting | 0 (0.0%) | 0 (0.0%) |
| Mining, Quarrying, & Extraction | 0 (0.0%) | 0 (0.0%) |
| Construction | 216 (93.5%) | 15 (6.5%) |
| Manufacturing | 309 (82.0%) | 68 (18.0%) |
| Wholesale Trade | 46 (100.0%) | 0 (0.0%) |
| Retail Trade | 205 (49.3%) | 211 (50.7%) |
| Transportation & Warehousing | 93 (72.1%) | 36 (27.9%) |
| Utilities | 0 (0.0%) | 0 (0.0%) |
| Information | 0 (0.0%) | 17 (100.0%) |
| Finance & Insurance | 66 (37.5%) | 110 (62.5%) |
| Real Estate, Rental & Leasing | 0 (0.0%) | 0 (0.0%) |
| Professional & Scientific | 22 (19.6%) | 90 (80.4%) |
| Enterprise Management | 0 (0.0%) | 0 (0.0%) |
| Administrative & Support | 16 (23.2%) | 53 (76.8%) |
| Educational Services | 0 (0.0%) | 188 (100.0%) |
| Health Care & Social Assistance | 22 (7.0%) | 292 (93.0%) |
| Arts, Entertainment & Recreation | 0 (0.0%) | 14 (100.0%) |
| Accommodation & Food Services | 10 (20.0%) | 40 (80.0%) |
| Public Administration | 55 (78.6%) | 15 (21.4%) |
| Total | 1,076 (47.4%) | 1,192 (52.6%) |
Education in Camanche
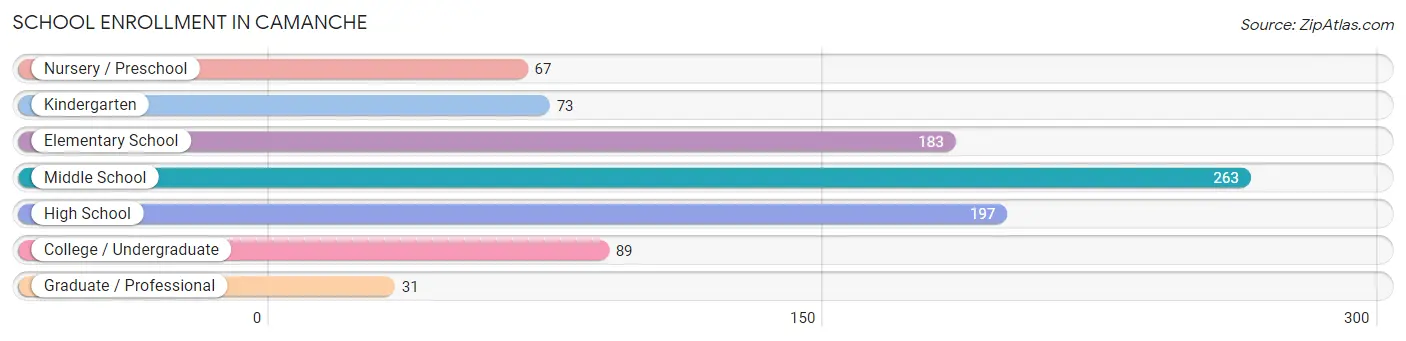
School Enrollment in Camanche
The most common levels of schooling among the 903 students in Camanche are middle school (263 | 29.1%), high school (197 | 21.8%), and elementary school (183 | 20.3%).
| School Level | # Students | % Students |
| Nursery / Preschool | 67 | 7.4% |
| Kindergarten | 73 | 8.1% |
| Elementary School | 183 | 20.3% |
| Middle School | 263 | 29.1% |
| High School | 197 | 21.8% |
| College / Undergraduate | 89 | 9.9% |
| Graduate / Professional | 31 | 3.4% |
| Total | 903 | 100.0% |
School Enrollment by Age by Funding Source in Camanche
Out of a total of 903 students who are enrolled in schools in Camanche, 66 (7.3%) attend a private institution, while the remaining 837 (92.7%) are enrolled in public schools. The age group of 18 to 19 year olds has the highest likelihood of being enrolled in private schools, with 45 (54.2% in the age bracket) enrolled. Conversely, the age group of 3 to 4 year olds has the lowest likelihood of being enrolled in a private school, with 23 (100.0% in the age bracket) attending a public institution.
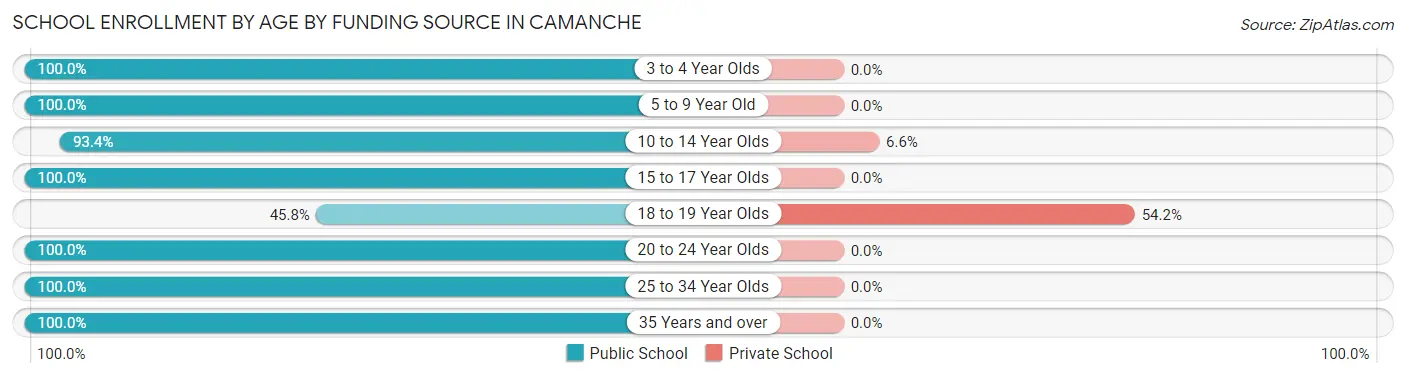
| Age Bracket | Public School | Private School |
| 3 to 4 Year Olds | 23 (100.0%) | 0 (0.0%) |
| 5 to 9 Year Old | 282 (100.0%) | 0 (0.0%) |
| 10 to 14 Year Olds | 297 (93.4%) | 21 (6.6%) |
| 15 to 17 Year Olds | 115 (100.0%) | 0 (0.0%) |
| 18 to 19 Year Olds | 38 (45.8%) | 45 (54.2%) |
| 20 to 24 Year Olds | 51 (100.0%) | 0 (0.0%) |
| 25 to 34 Year Olds | 18 (100.0%) | 0 (0.0%) |
| 35 Years and over | 13 (100.0%) | 0 (0.0%) |
| Total | 837 (92.7%) | 66 (7.3%) |
Educational Attainment by Field of Study in Camanche
Education (237 | 38.2%), business (178 | 28.7%), bio, nature & agricultural (39 | 6.3%), social sciences (35 | 5.6%), and arts & humanities (26 | 4.2%) are the most common fields of study among 621 individuals in Camanche who have obtained a bachelor's degree or higher.
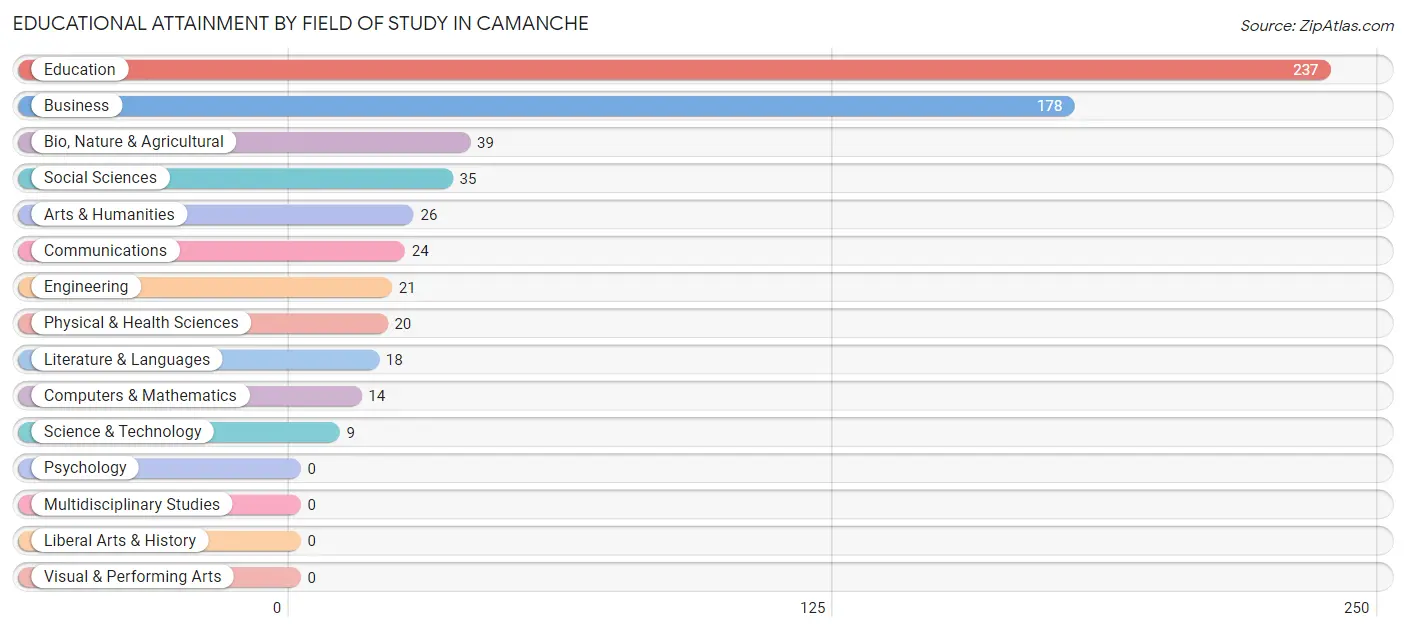
| Field of Study | # Graduates | % Graduates |
| Computers & Mathematics | 14 | 2.2% |
| Bio, Nature & Agricultural | 39 | 6.3% |
| Physical & Health Sciences | 20 | 3.2% |
| Psychology | 0 | 0.0% |
| Social Sciences | 35 | 5.6% |
| Engineering | 21 | 3.4% |
| Multidisciplinary Studies | 0 | 0.0% |
| Science & Technology | 9 | 1.5% |
| Business | 178 | 28.7% |
| Education | 237 | 38.2% |
| Literature & Languages | 18 | 2.9% |
| Liberal Arts & History | 0 | 0.0% |
| Visual & Performing Arts | 0 | 0.0% |
| Communications | 24 | 3.9% |
| Arts & Humanities | 26 | 4.2% |
| Total | 621 | 100.0% |
Transportation & Commute in Camanche
Vehicle Availability by Sex in Camanche
The most prevalent vehicle ownership categories in Camanche are males with 2 vehicles (598, accounting for 55.6%) and females with 2 vehicles (527, making up 50.2%).
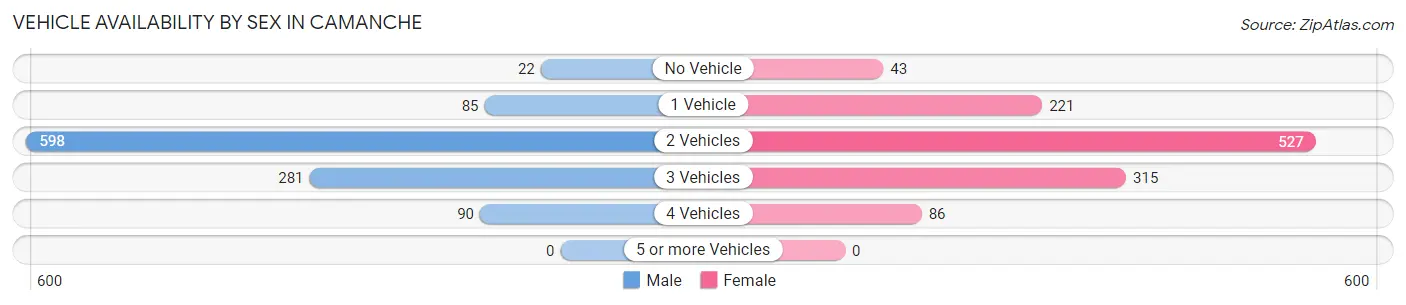
| Vehicles Available | Male | Female |
| No Vehicle | 22 (2.0%) | 43 (3.6%) |
| 1 Vehicle | 85 (7.9%) | 221 (18.5%) |
| 2 Vehicles | 598 (55.6%) | 527 (44.2%) |
| 3 Vehicles | 281 (26.1%) | 315 (26.4%) |
| 4 Vehicles | 90 (8.4%) | 86 (7.2%) |
| 5 or more Vehicles | 0 (0.0%) | 0 (0.0%) |
| Total | 1,076 (100.0%) | 1,192 (100.0%) |
Commute Time in Camanche
The most frequently occuring commute durations in Camanche are 10 to 14 minutes (515 commuters, 23.8%), 5 to 9 minutes (439 commuters, 20.3%), and 15 to 19 minutes (328 commuters, 15.2%).
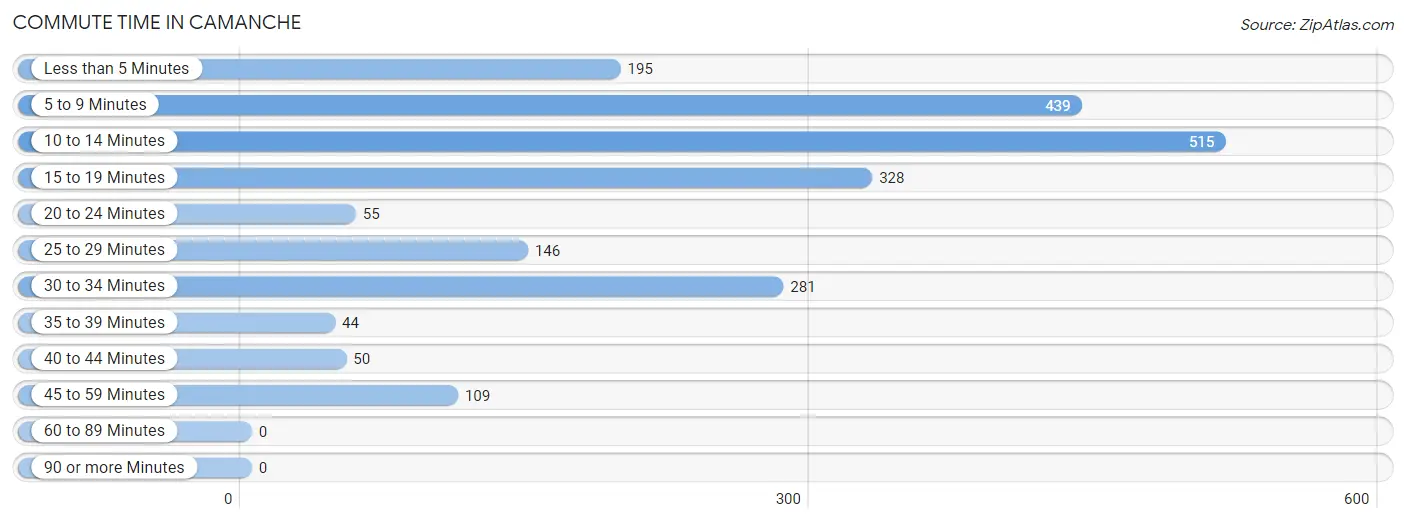
| Commute Time | # Commuters | % Commuters |
| Less than 5 Minutes | 195 | 9.0% |
| 5 to 9 Minutes | 439 | 20.3% |
| 10 to 14 Minutes | 515 | 23.8% |
| 15 to 19 Minutes | 328 | 15.2% |
| 20 to 24 Minutes | 55 | 2.5% |
| 25 to 29 Minutes | 146 | 6.8% |
| 30 to 34 Minutes | 281 | 13.0% |
| 35 to 39 Minutes | 44 | 2.0% |
| 40 to 44 Minutes | 50 | 2.3% |
| 45 to 59 Minutes | 109 | 5.0% |
| 60 to 89 Minutes | 0 | 0.0% |
| 90 or more Minutes | 0 | 0.0% |
Commute Time by Sex in Camanche
The most common commute times in Camanche are 10 to 14 minutes (294 commuters, 27.8%) for males and 5 to 9 minutes (249 commuters, 22.6%) for females.
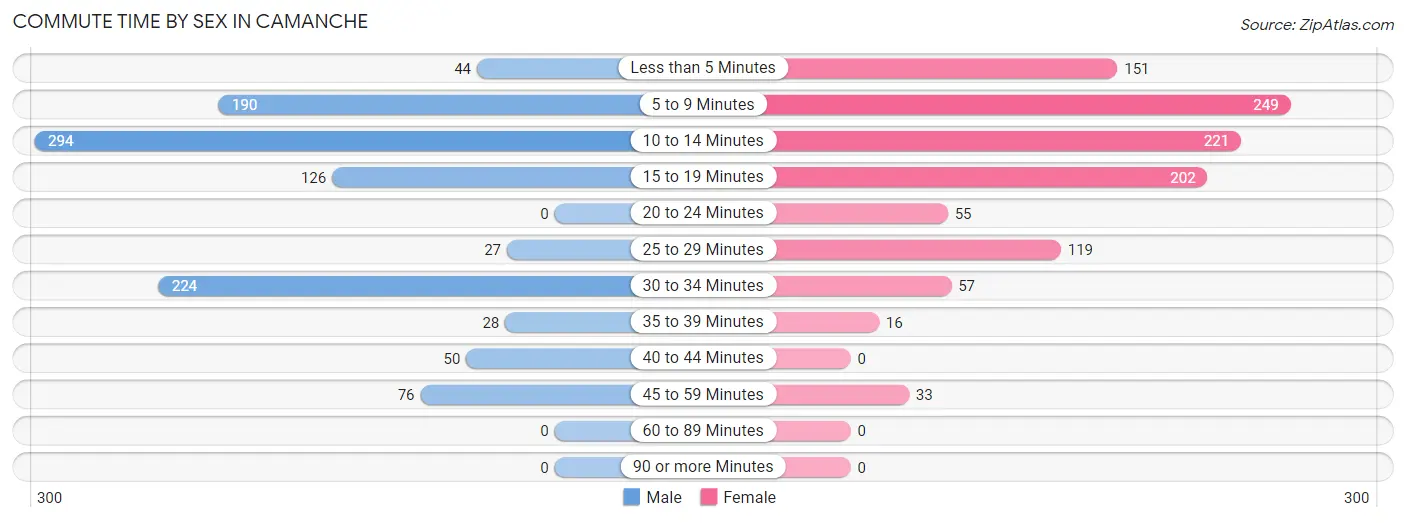
| Commute Time | Male | Female |
| Less than 5 Minutes | 44 (4.2%) | 151 (13.7%) |
| 5 to 9 Minutes | 190 (17.9%) | 249 (22.6%) |
| 10 to 14 Minutes | 294 (27.8%) | 221 (20.0%) |
| 15 to 19 Minutes | 126 (11.9%) | 202 (18.3%) |
| 20 to 24 Minutes | 0 (0.0%) | 55 (5.0%) |
| 25 to 29 Minutes | 27 (2.5%) | 119 (10.8%) |
| 30 to 34 Minutes | 224 (21.1%) | 57 (5.2%) |
| 35 to 39 Minutes | 28 (2.6%) | 16 (1.5%) |
| 40 to 44 Minutes | 50 (4.7%) | 0 (0.0%) |
| 45 to 59 Minutes | 76 (7.2%) | 33 (3.0%) |
| 60 to 89 Minutes | 0 (0.0%) | 0 (0.0%) |
| 90 or more Minutes | 0 (0.0%) | 0 (0.0%) |
Time of Departure to Work by Sex in Camanche
The most frequent times of departure to work in Camanche are 4:00 PM to 11:59 PM (188, 17.7%) for males and 7:00 AM to 7:29 AM (247, 22.4%) for females.
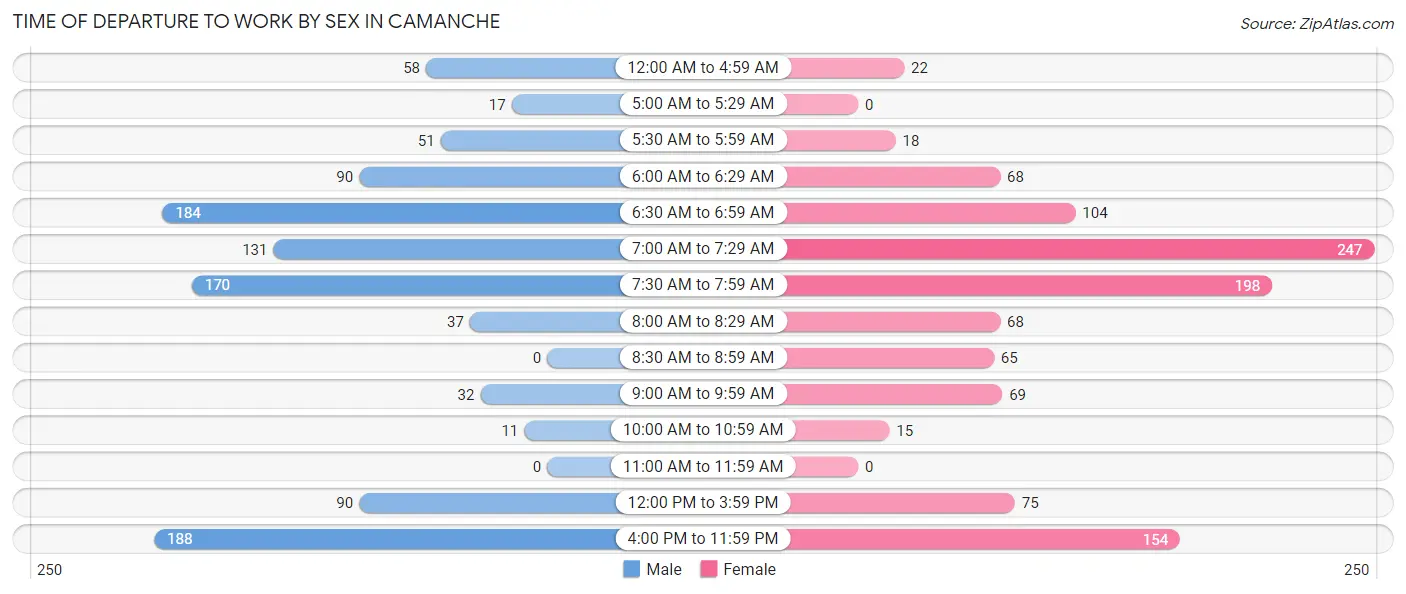
| Time of Departure | Male | Female |
| 12:00 AM to 4:59 AM | 58 (5.5%) | 22 (2.0%) |
| 5:00 AM to 5:29 AM | 17 (1.6%) | 0 (0.0%) |
| 5:30 AM to 5:59 AM | 51 (4.8%) | 18 (1.6%) |
| 6:00 AM to 6:29 AM | 90 (8.5%) | 68 (6.2%) |
| 6:30 AM to 6:59 AM | 184 (17.4%) | 104 (9.4%) |
| 7:00 AM to 7:29 AM | 131 (12.4%) | 247 (22.4%) |
| 7:30 AM to 7:59 AM | 170 (16.1%) | 198 (17.9%) |
| 8:00 AM to 8:29 AM | 37 (3.5%) | 68 (6.2%) |
| 8:30 AM to 8:59 AM | 0 (0.0%) | 65 (5.9%) |
| 9:00 AM to 9:59 AM | 32 (3.0%) | 69 (6.3%) |
| 10:00 AM to 10:59 AM | 11 (1.0%) | 15 (1.4%) |
| 11:00 AM to 11:59 AM | 0 (0.0%) | 0 (0.0%) |
| 12:00 PM to 3:59 PM | 90 (8.5%) | 75 (6.8%) |
| 4:00 PM to 11:59 PM | 188 (17.7%) | 154 (14.0%) |
| Total | 1,059 (100.0%) | 1,103 (100.0%) |
Housing Occupancy in Camanche
Occupancy by Ownership in Camanche
Of the total 1,996 dwellings in Camanche, owner-occupied units account for 1,469 (73.6%), while renter-occupied units make up 527 (26.4%).
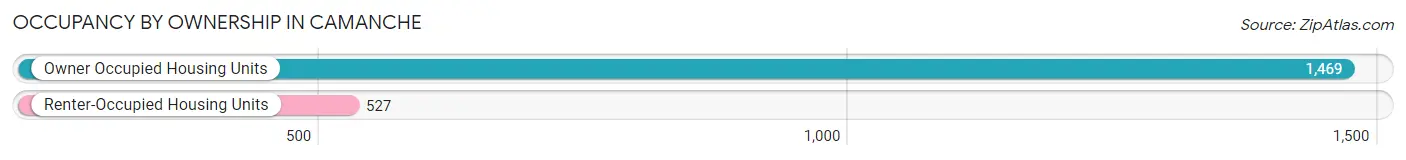
| Occupancy | # Housing Units | % Housing Units |
| Owner Occupied Housing Units | 1,469 | 73.6% |
| Renter-Occupied Housing Units | 527 | 26.4% |
| Total Occupied Housing Units | 1,996 | 100.0% |
Occupancy by Household Size in Camanche
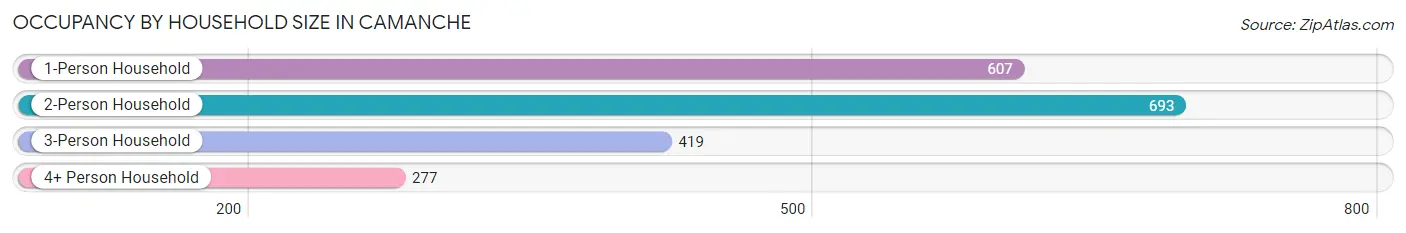
| Household Size | # Housing Units | % Housing Units |
| 1-Person Household | 607 | 30.4% |
| 2-Person Household | 693 | 34.7% |
| 3-Person Household | 419 | 21.0% |
| 4+ Person Household | 277 | 13.9% |
| Total Housing Units | 1,996 | 100.0% |
Occupancy by Ownership by Household Size in Camanche
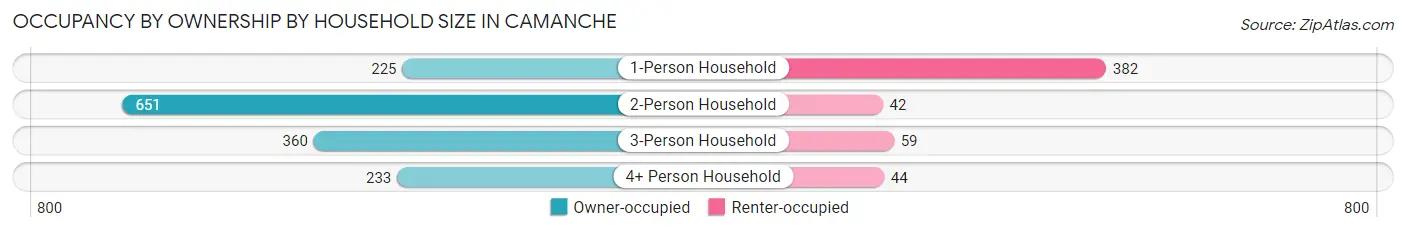
| Household Size | Owner-occupied | Renter-occupied |
| 1-Person Household | 225 (37.1%) | 382 (62.9%) |
| 2-Person Household | 651 (93.9%) | 42 (6.1%) |
| 3-Person Household | 360 (85.9%) | 59 (14.1%) |
| 4+ Person Household | 233 (84.1%) | 44 (15.9%) |
| Total Housing Units | 1,469 (73.6%) | 527 (26.4%) |
Occupancy by Educational Attainment in Camanche
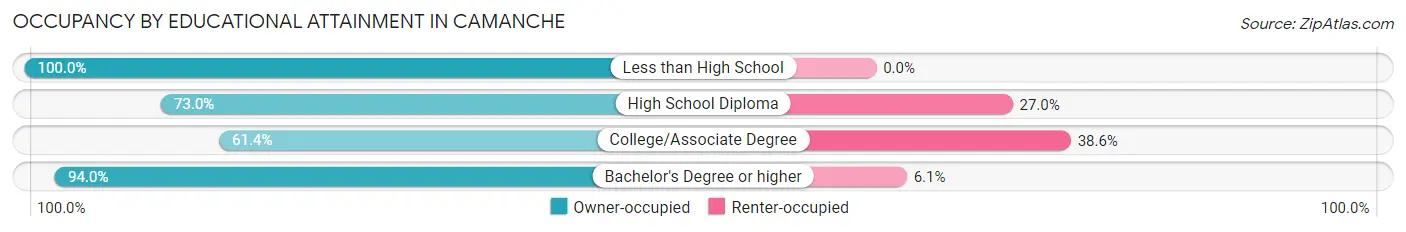
| Household Size | Owner-occupied | Renter-occupied |
| Less than High School | 58 (100.0%) | 0 (0.0%) |
| High School Diploma | 510 (73.0%) | 189 (27.0%) |
| College/Associate Degree | 497 (61.4%) | 312 (38.6%) |
| Bachelor's Degree or higher | 404 (94.0%) | 26 (6.0%) |
Occupancy by Age of Householder in Camanche
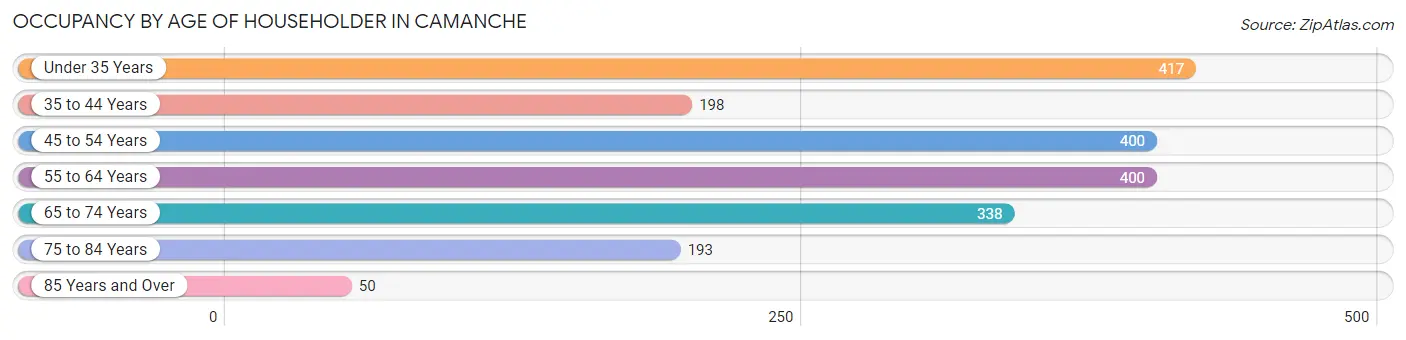
| Age Bracket | # Households | % Households |
| Under 35 Years | 417 | 20.9% |
| 35 to 44 Years | 198 | 9.9% |
| 45 to 54 Years | 400 | 20.0% |
| 55 to 64 Years | 400 | 20.0% |
| 65 to 74 Years | 338 | 16.9% |
| 75 to 84 Years | 193 | 9.7% |
| 85 Years and Over | 50 | 2.5% |
| Total | 1,996 | 100.0% |
Housing Finances in Camanche
Median Income by Occupancy in Camanche
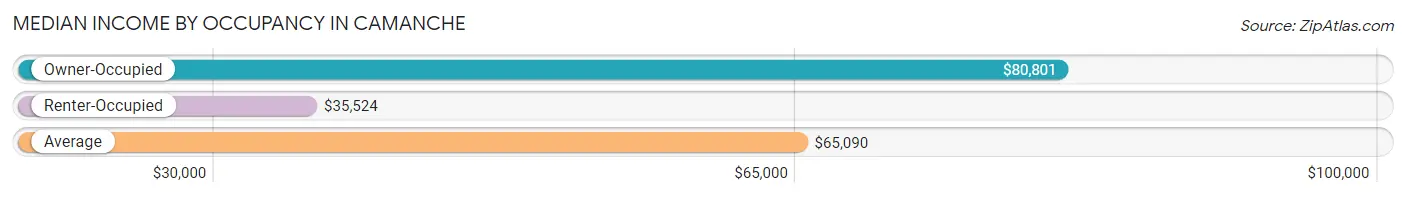
| Occupancy Type | # Households | Median Income |
| Owner-Occupied | 1,469 (73.6%) | $80,801 |
| Renter-Occupied | 527 (26.4%) | $35,524 |
| Average | 1,996 (100.0%) | $65,090 |
Occupancy by Householder Income Bracket in Camanche
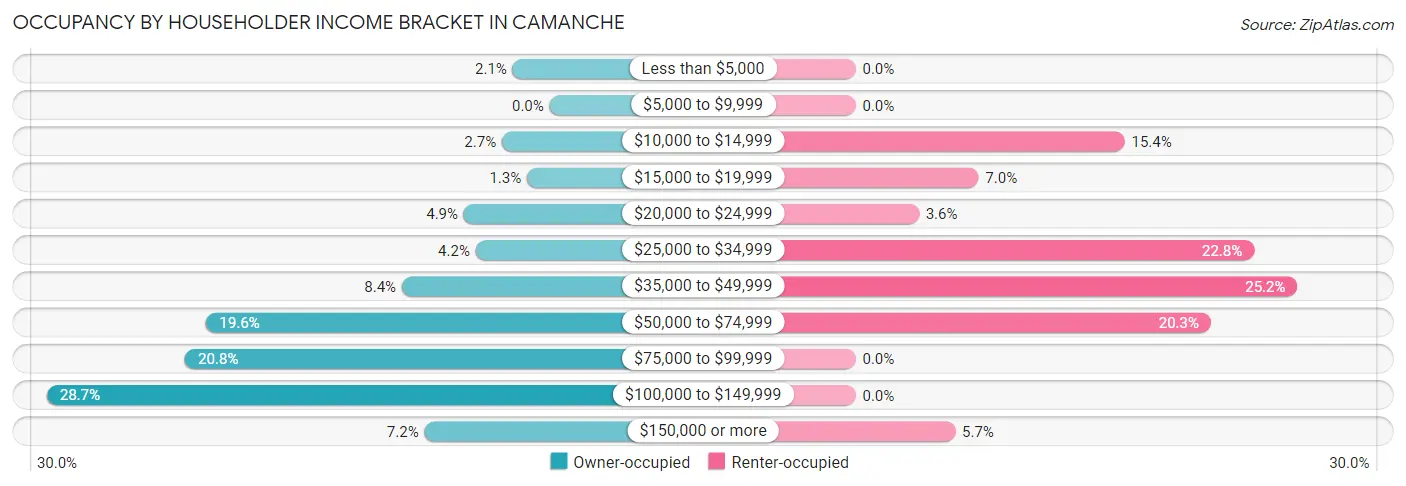
| Income Bracket | Owner-occupied | Renter-occupied |
| Less than $5,000 | 31 (2.1%) | 0 (0.0%) |
| $5,000 to $9,999 | 0 (0.0%) | 0 (0.0%) |
| $10,000 to $14,999 | 40 (2.7%) | 81 (15.4%) |
| $15,000 to $19,999 | 19 (1.3%) | 37 (7.0%) |
| $20,000 to $24,999 | 72 (4.9%) | 19 (3.6%) |
| $25,000 to $34,999 | 62 (4.2%) | 120 (22.8%) |
| $35,000 to $49,999 | 124 (8.4%) | 133 (25.2%) |
| $50,000 to $74,999 | 288 (19.6%) | 107 (20.3%) |
| $75,000 to $99,999 | 306 (20.8%) | 0 (0.0%) |
| $100,000 to $149,999 | 422 (28.7%) | 0 (0.0%) |
| $150,000 or more | 105 (7.1%) | 30 (5.7%) |
| Total | 1,469 (100.0%) | 527 (100.0%) |
Monthly Housing Cost Tiers in Camanche
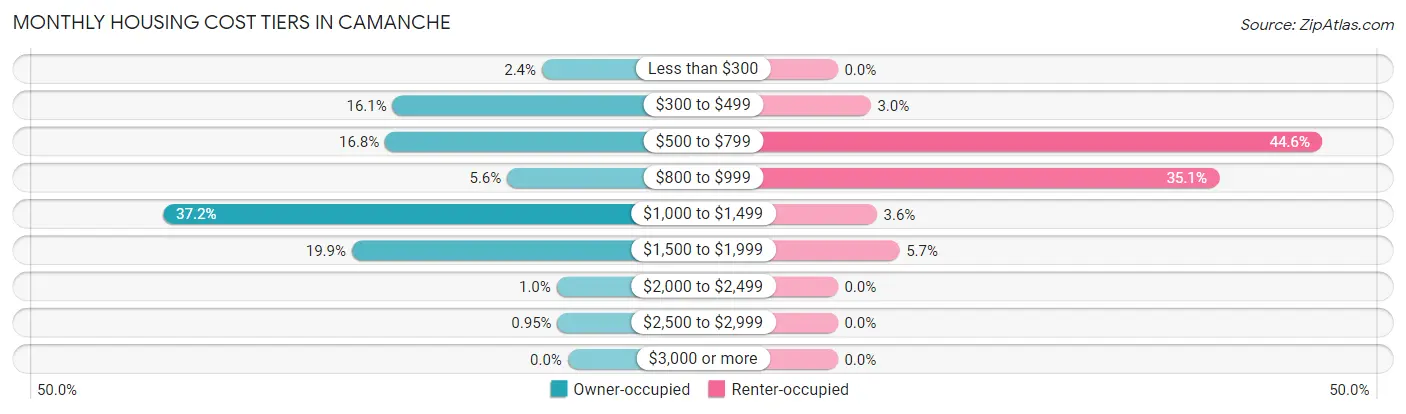
| Monthly Cost | Owner-occupied | Renter-occupied |
| Less than $300 | 35 (2.4%) | 0 (0.0%) |
| $300 to $499 | 237 (16.1%) | 16 (3.0%) |
| $500 to $799 | 247 (16.8%) | 235 (44.6%) |
| $800 to $999 | 82 (5.6%) | 185 (35.1%) |
| $1,000 to $1,499 | 547 (37.2%) | 19 (3.6%) |
| $1,500 to $1,999 | 292 (19.9%) | 30 (5.7%) |
| $2,000 to $2,499 | 15 (1.0%) | 0 (0.0%) |
| $2,500 to $2,999 | 14 (0.9%) | 0 (0.0%) |
| $3,000 or more | 0 (0.0%) | 0 (0.0%) |
| Total | 1,469 (100.0%) | 527 (100.0%) |
Physical Housing Characteristics in Camanche
Housing Structures in Camanche
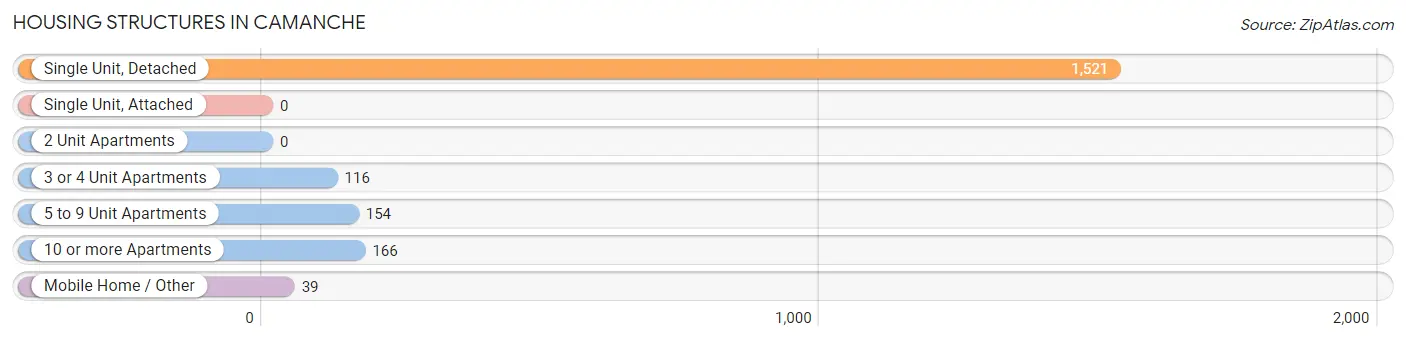
| Structure Type | # Housing Units | % Housing Units |
| Single Unit, Detached | 1,521 | 76.2% |
| Single Unit, Attached | 0 | 0.0% |
| 2 Unit Apartments | 0 | 0.0% |
| 3 or 4 Unit Apartments | 116 | 5.8% |
| 5 to 9 Unit Apartments | 154 | 7.7% |
| 10 or more Apartments | 166 | 8.3% |
| Mobile Home / Other | 39 | 1.9% |
| Total | 1,996 | 100.0% |
Housing Structures by Occupancy in Camanche
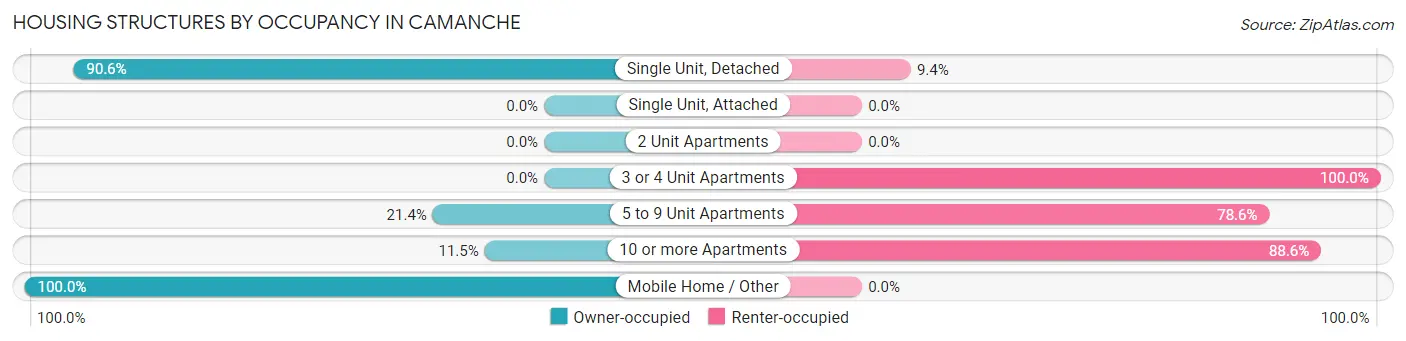
| Structure Type | Owner-occupied | Renter-occupied |
| Single Unit, Detached | 1,378 (90.6%) | 143 (9.4%) |
| Single Unit, Attached | 0 (0.0%) | 0 (0.0%) |
| 2 Unit Apartments | 0 (0.0%) | 0 (0.0%) |
| 3 or 4 Unit Apartments | 0 (0.0%) | 116 (100.0%) |
| 5 to 9 Unit Apartments | 33 (21.4%) | 121 (78.6%) |
| 10 or more Apartments | 19 (11.5%) | 147 (88.5%) |
| Mobile Home / Other | 39 (100.0%) | 0 (0.0%) |
| Total | 1,469 (73.6%) | 527 (26.4%) |
Housing Structures by Number of Rooms in Camanche
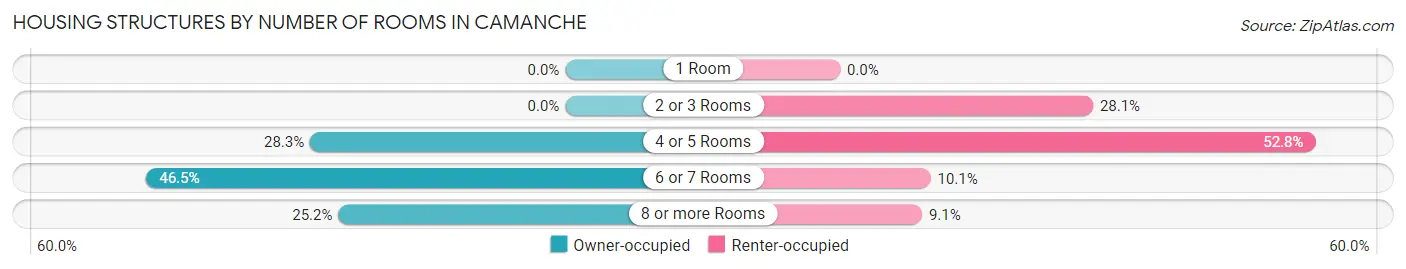
| Number of Rooms | Owner-occupied | Renter-occupied |
| 1 Room | 0 (0.0%) | 0 (0.0%) |
| 2 or 3 Rooms | 0 (0.0%) | 148 (28.1%) |
| 4 or 5 Rooms | 416 (28.3%) | 278 (52.7%) |
| 6 or 7 Rooms | 683 (46.5%) | 53 (10.1%) |
| 8 or more Rooms | 370 (25.2%) | 48 (9.1%) |
| Total | 1,469 (100.0%) | 527 (100.0%) |
Housing Structure by Heating Type in Camanche

| Heating Type | Owner-occupied | Renter-occupied |
| Utility Gas | 1,176 (80.0%) | 164 (31.1%) |
| Bottled, Tank, or LP Gas | 141 (9.6%) | 0 (0.0%) |
| Electricity | 136 (9.3%) | 363 (68.9%) |
| Fuel Oil or Kerosene | 0 (0.0%) | 0 (0.0%) |
| Coal or Coke | 0 (0.0%) | 0 (0.0%) |
| All other Fuels | 16 (1.1%) | 0 (0.0%) |
| No Fuel Used | 0 (0.0%) | 0 (0.0%) |
| Total | 1,469 (100.0%) | 527 (100.0%) |
Household Vehicle Usage in Camanche
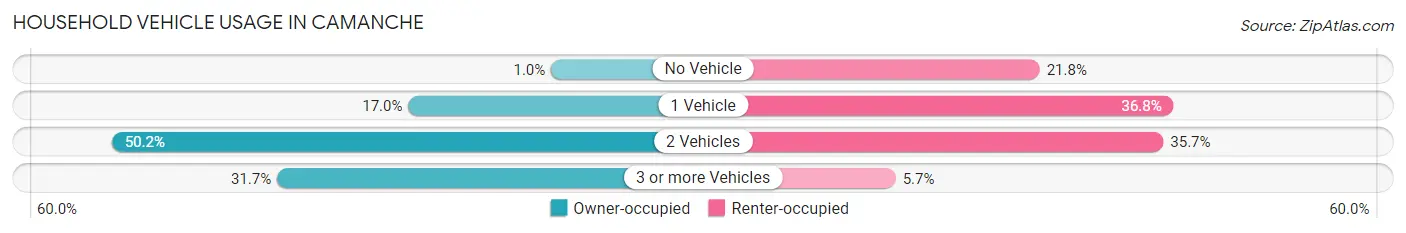
| Vehicles per Household | Owner-occupied | Renter-occupied |
| No Vehicle | 15 (1.0%) | 115 (21.8%) |
| 1 Vehicle | 250 (17.0%) | 194 (36.8%) |
| 2 Vehicles | 738 (50.2%) | 188 (35.7%) |
| 3 or more Vehicles | 466 (31.7%) | 30 (5.7%) |
| Total | 1,469 (100.0%) | 527 (100.0%) |
Real Estate & Mortgages in Camanche
Real Estate and Mortgage Overview in Camanche
| Characteristic | Without Mortgage | With Mortgage |
| Housing Units | 593 | 876 |
| Median Property Value | $141,200 | $184,300 |
| Median Household Income | $52,798 | $74 |
| Monthly Housing Costs | $531 | $0 |
| Real Estate Taxes | $2,533 | $0 |
Property Value by Mortgage Status in Camanche
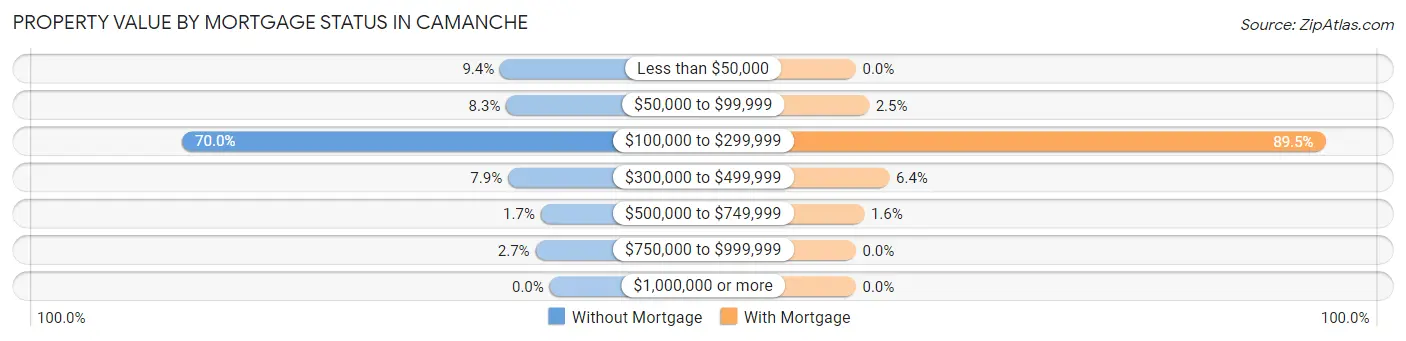
| Property Value | Without Mortgage | With Mortgage |
| Less than $50,000 | 56 (9.4%) | 0 (0.0%) |
| $50,000 to $99,999 | 49 (8.3%) | 22 (2.5%) |
| $100,000 to $299,999 | 415 (70.0%) | 784 (89.5%) |
| $300,000 to $499,999 | 47 (7.9%) | 56 (6.4%) |
| $500,000 to $749,999 | 10 (1.7%) | 14 (1.6%) |
| $750,000 to $999,999 | 16 (2.7%) | 0 (0.0%) |
| $1,000,000 or more | 0 (0.0%) | 0 (0.0%) |
| Total | 593 (100.0%) | 876 (100.0%) |
Household Income by Mortgage Status in Camanche
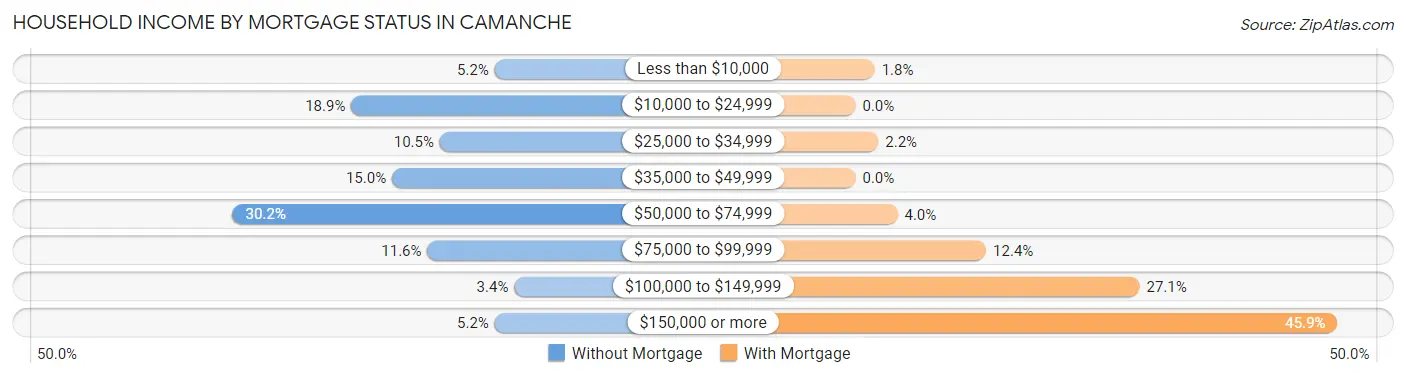
| Household Income | Without Mortgage | With Mortgage |
| Less than $10,000 | 31 (5.2%) | 16 (1.8%) |
| $10,000 to $24,999 | 112 (18.9%) | 0 (0.0%) |
| $25,000 to $34,999 | 62 (10.5%) | 19 (2.2%) |
| $35,000 to $49,999 | 89 (15.0%) | 0 (0.0%) |
| $50,000 to $74,999 | 179 (30.2%) | 35 (4.0%) |
| $75,000 to $99,999 | 69 (11.6%) | 109 (12.4%) |
| $100,000 to $149,999 | 20 (3.4%) | 237 (27.1%) |
| $150,000 or more | 31 (5.2%) | 402 (45.9%) |
| Total | 593 (100.0%) | 876 (100.0%) |
Property Value to Household Income Ratio in Camanche
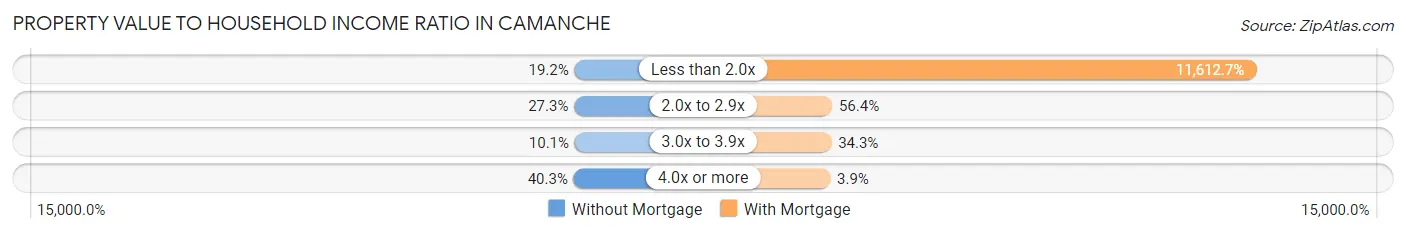
| Value-to-Income Ratio | Without Mortgage | With Mortgage |
| Less than 2.0x | 114 (19.2%) | 101,727 (11,612.7%) |
| 2.0x to 2.9x | 162 (27.3%) | 494 (56.4%) |
| 3.0x to 3.9x | 60 (10.1%) | 300 (34.3%) |
| 4.0x or more | 239 (40.3%) | 34 (3.9%) |
| Total | 593 (100.0%) | 876 (100.0%) |
Real Estate Taxes by Mortgage Status in Camanche
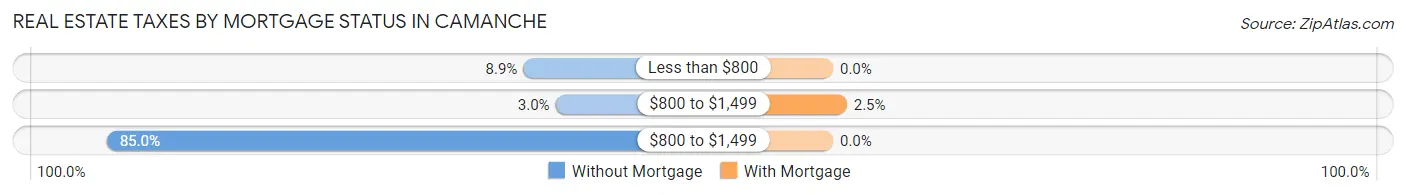
| Property Taxes | Without Mortgage | With Mortgage |
| Less than $800 | 53 (8.9%) | 0 (0.0%) |
| $800 to $1,499 | 18 (3.0%) | 22 (2.5%) |
| $800 to $1,499 | 504 (85.0%) | 0 (0.0%) |
| Total | 593 (100.0%) | 876 (100.0%) |
Health & Disability in Camanche
Health Insurance Coverage by Age in Camanche
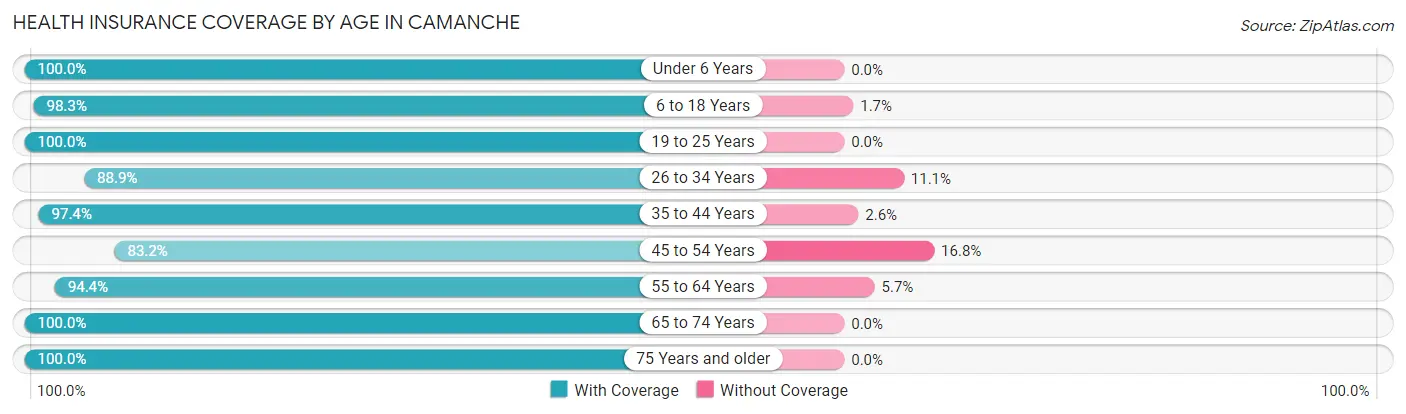
| Age Bracket | With Coverage | Without Coverage |
| Under 6 Years | 426 (100.0%) | 0 (0.0%) |
| 6 to 18 Years | 704 (98.3%) | 12 (1.7%) |
| 19 to 25 Years | 332 (100.0%) | 0 (0.0%) |
| 26 to 34 Years | 448 (88.9%) | 56 (11.1%) |
| 35 to 44 Years | 446 (97.4%) | 12 (2.6%) |
| 45 to 54 Years | 442 (83.2%) | 89 (16.8%) |
| 55 to 64 Years | 601 (94.4%) | 36 (5.7%) |
| 65 to 74 Years | 605 (100.0%) | 0 (0.0%) |
| 75 Years and older | 329 (100.0%) | 0 (0.0%) |
| Total | 4,333 (95.5%) | 205 (4.5%) |
Health Insurance Coverage by Citizenship Status in Camanche
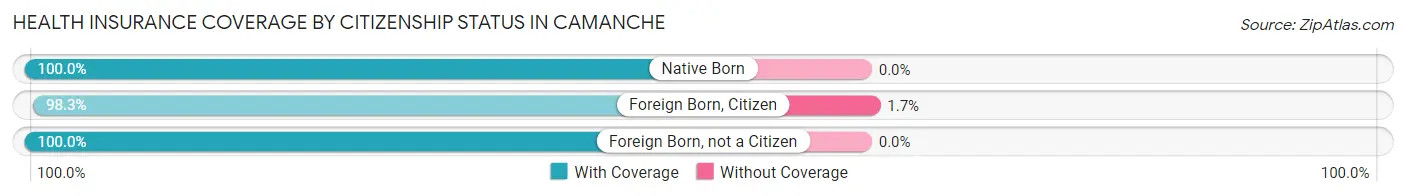
| Citizenship Status | With Coverage | Without Coverage |
| Native Born | 426 (100.0%) | 0 (0.0%) |
| Foreign Born, Citizen | 704 (98.3%) | 12 (1.7%) |
| Foreign Born, not a Citizen | 332 (100.0%) | 0 (0.0%) |
Health Insurance Coverage by Household Income in Camanche
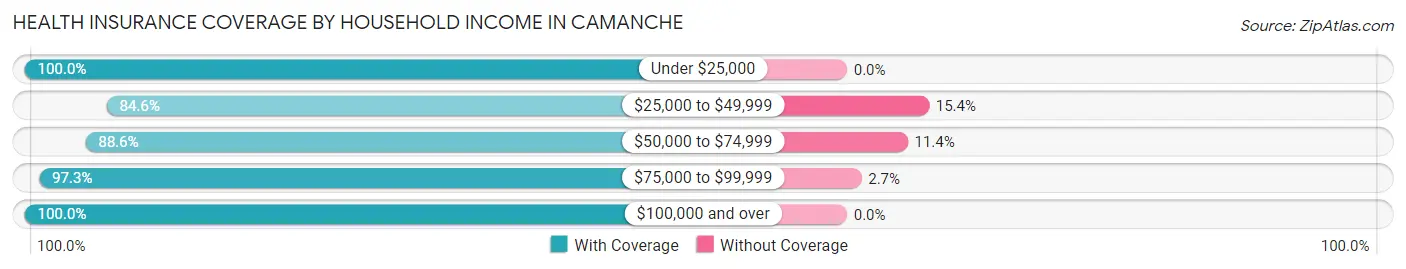
| Household Income | With Coverage | Without Coverage |
| Under $25,000 | 496 (100.0%) | 0 (0.0%) |
| $25,000 to $49,999 | 529 (84.6%) | 96 (15.4%) |
| $50,000 to $74,999 | 701 (88.6%) | 90 (11.4%) |
| $75,000 to $99,999 | 681 (97.3%) | 19 (2.7%) |
| $100,000 and over | 1,926 (100.0%) | 0 (0.0%) |
Public vs Private Health Insurance Coverage by Age in Camanche
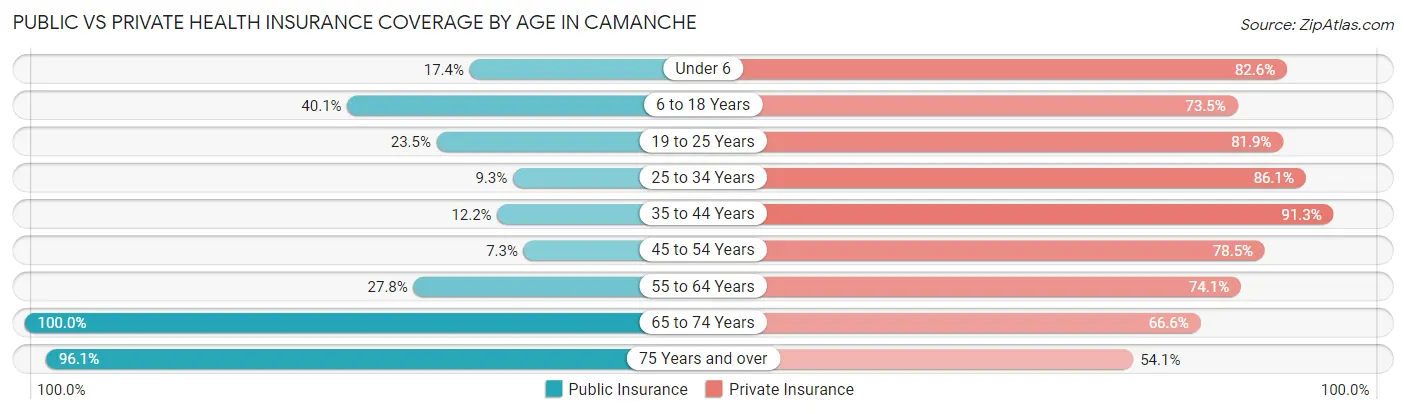
| Age Bracket | Public Insurance | Private Insurance |
| Under 6 | 74 (17.4%) | 352 (82.6%) |
| 6 to 18 Years | 287 (40.1%) | 526 (73.5%) |
| 19 to 25 Years | 78 (23.5%) | 272 (81.9%) |
| 25 to 34 Years | 47 (9.3%) | 434 (86.1%) |
| 35 to 44 Years | 56 (12.2%) | 418 (91.3%) |
| 45 to 54 Years | 39 (7.3%) | 417 (78.5%) |
| 55 to 64 Years | 177 (27.8%) | 472 (74.1%) |
| 65 to 74 Years | 605 (100.0%) | 403 (66.6%) |
| 75 Years and over | 316 (96.1%) | 178 (54.1%) |
| Total | 1,679 (37.0%) | 3,472 (76.5%) |
Disability Status by Sex by Age in Camanche
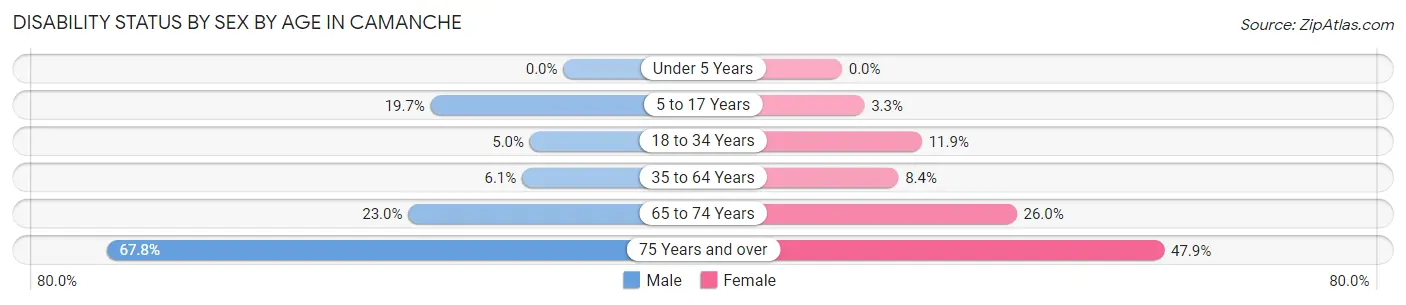
| Age Bracket | Male | Female |
| Under 5 Years | 0 (0.0%) | 0 (0.0%) |
| 5 to 17 Years | 52 (19.7%) | 15 (3.3%) |
| 18 to 34 Years | 22 (5.0%) | 52 (11.9%) |
| 35 to 64 Years | 44 (6.1%) | 76 (8.4%) |
| 65 to 74 Years | 79 (23.0%) | 68 (26.0%) |
| 75 Years and over | 97 (67.8%) | 89 (47.8%) |
Disability Class by Sex by Age in Camanche
Disability Class: Hearing Difficulty
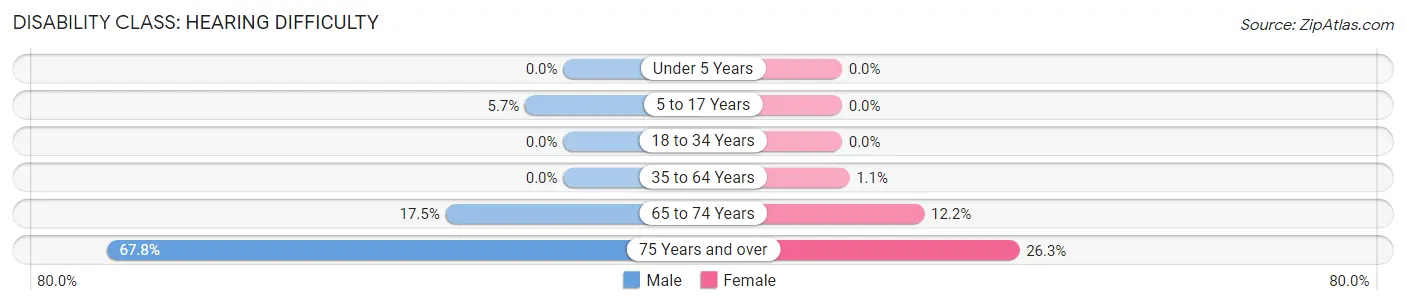
| Age Bracket | Male | Female |
| Under 5 Years | 0 (0.0%) | 0 (0.0%) |
| 5 to 17 Years | 15 (5.7%) | 0 (0.0%) |
| 18 to 34 Years | 0 (0.0%) | 0 (0.0%) |
| 35 to 64 Years | 0 (0.0%) | 10 (1.1%) |
| 65 to 74 Years | 60 (17.5%) | 32 (12.2%) |
| 75 Years and over | 97 (67.8%) | 49 (26.3%) |
Disability Class: Vision Difficulty
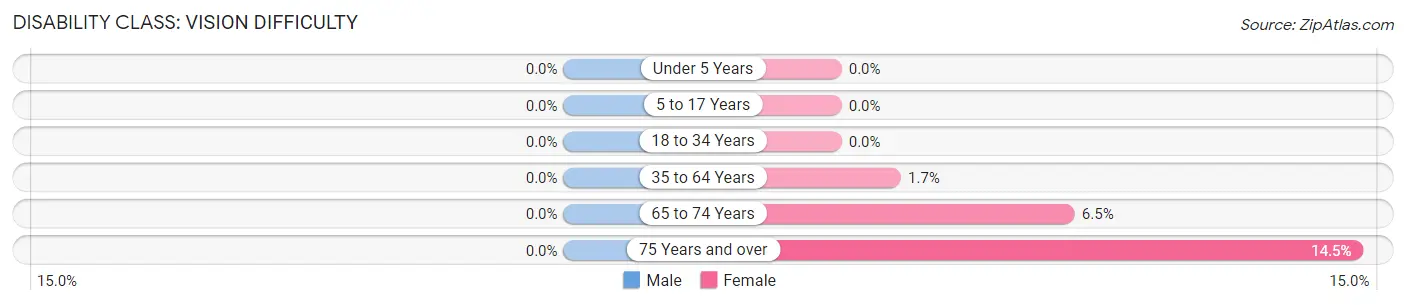
| Age Bracket | Male | Female |
| Under 5 Years | 0 (0.0%) | 0 (0.0%) |
| 5 to 17 Years | 0 (0.0%) | 0 (0.0%) |
| 18 to 34 Years | 0 (0.0%) | 0 (0.0%) |
| 35 to 64 Years | 0 (0.0%) | 15 (1.7%) |
| 65 to 74 Years | 0 (0.0%) | 17 (6.5%) |
| 75 Years and over | 0 (0.0%) | 27 (14.5%) |
Disability Class: Cognitive Difficulty
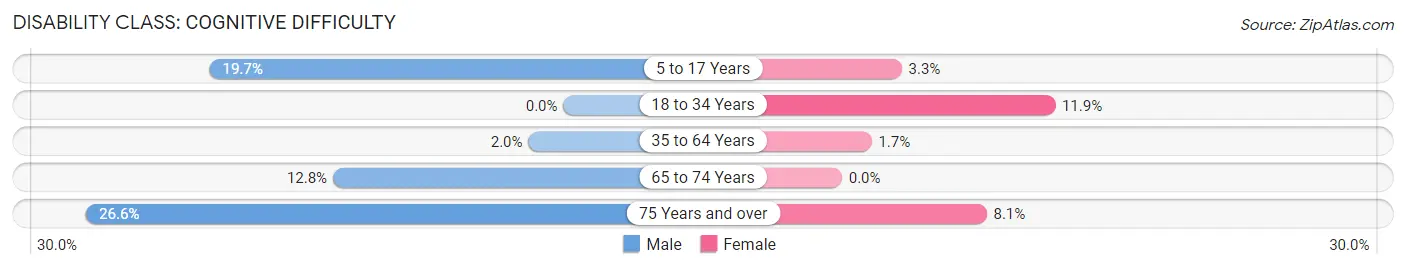
| Age Bracket | Male | Female |
| 5 to 17 Years | 52 (19.7%) | 15 (3.3%) |
| 18 to 34 Years | 0 (0.0%) | 52 (11.9%) |
| 35 to 64 Years | 14 (1.9%) | 15 (1.7%) |
| 65 to 74 Years | 44 (12.8%) | 0 (0.0%) |
| 75 Years and over | 38 (26.6%) | 15 (8.1%) |
Disability Class: Ambulatory Difficulty
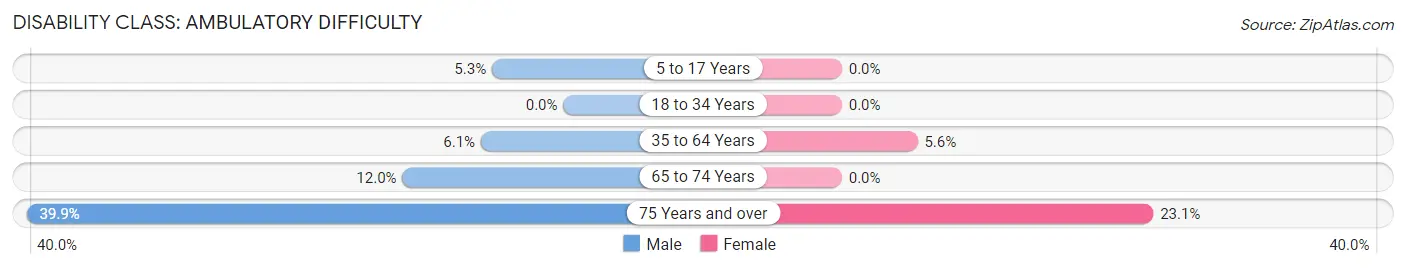
| Age Bracket | Male | Female |
| 5 to 17 Years | 14 (5.3%) | 0 (0.0%) |
| 18 to 34 Years | 0 (0.0%) | 0 (0.0%) |
| 35 to 64 Years | 44 (6.1%) | 51 (5.6%) |
| 65 to 74 Years | 41 (11.9%) | 0 (0.0%) |
| 75 Years and over | 57 (39.9%) | 43 (23.1%) |
Disability Class: Self-Care Difficulty
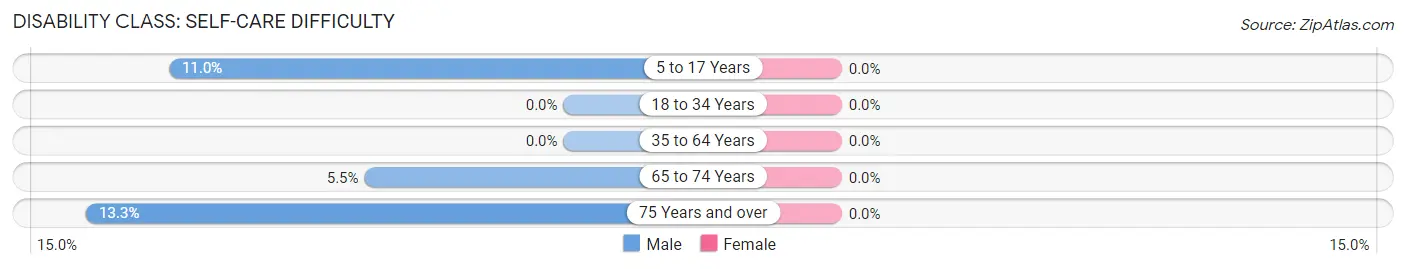
| Age Bracket | Male | Female |
| 5 to 17 Years | 29 (11.0%) | 0 (0.0%) |
| 18 to 34 Years | 0 (0.0%) | 0 (0.0%) |
| 35 to 64 Years | 0 (0.0%) | 0 (0.0%) |
| 65 to 74 Years | 19 (5.5%) | 0 (0.0%) |
| 75 Years and over | 19 (13.3%) | 0 (0.0%) |
Technology Access in Camanche
Computing Device Access in Camanche
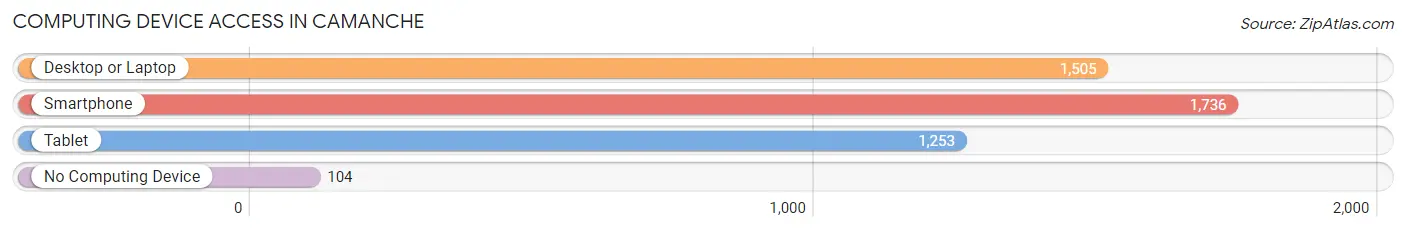
| Device Type | # Households | % Households |
| Desktop or Laptop | 1,505 | 75.4% |
| Smartphone | 1,736 | 87.0% |
| Tablet | 1,253 | 62.8% |
| No Computing Device | 104 | 5.2% |
| Total | 1,996 | 100.0% |
Internet Access in Camanche
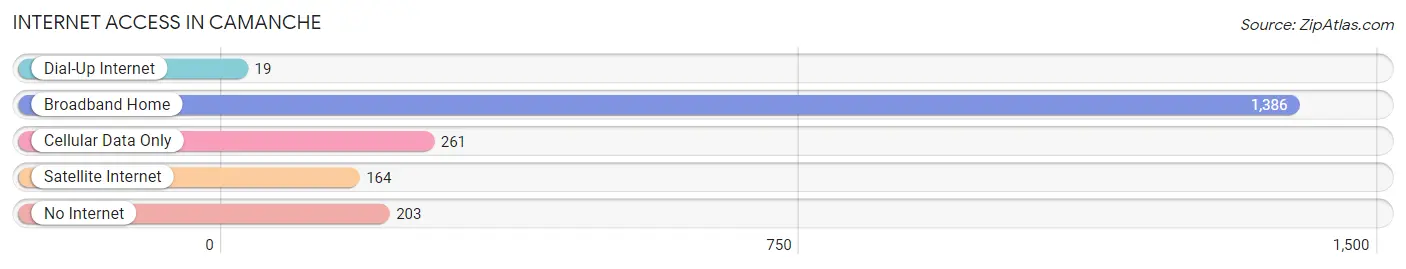
| Internet Type | # Households | % Households |
| Dial-Up Internet | 19 | 0.9% |
| Broadband Home | 1,386 | 69.4% |
| Cellular Data Only | 261 | 13.1% |
| Satellite Internet | 164 | 8.2% |
| No Internet | 203 | 10.2% |
| Total | 1,996 | 100.0% |
Camanche Summary
History
The city of Camanche, Iowa is located in Clinton County, Iowa, and is situated along the Mississippi River. The city was founded in 1837 by a group of settlers from New York, who named the city after the nearby Camanche Creek. The city was originally a trading post and ferry crossing, and was the first settlement in the area.
The city of Camanche was officially incorporated in 1853, and the first mayor was elected in 1854. The city quickly grew and prospered, and by the late 19th century, it was a thriving river port and industrial center. The city was home to several factories, including a flour mill, a sawmill, a brickyard, and a paper mill.
The city was also home to a number of businesses, including a hotel, a bank, a newspaper, and a variety of stores. The city was also home to a number of churches, including the First Presbyterian Church, which was founded in 1854.
The city of Camanche was also home to a number of educational institutions, including the Camanche Academy, which was founded in 1856. The academy was a private school that offered classes in a variety of subjects, including Latin, Greek, and mathematics.
The city of Camanche was also home to a number of cultural institutions, including the Camanche Opera House, which was built in 1891. The opera house hosted a variety of performances, including plays, concerts, and lectures.
The city of Camanche was also home to a number of recreational activities, including fishing, boating, and swimming. The city was also home to a number of parks, including the Camanche Park, which was established in 1891.
Geography
The city of Camanche is located in Clinton County, Iowa, and is situated along the Mississippi River. The city is located approximately 25 miles east of the city of Davenport, and is approximately 40 miles west of the city of Dubuque.
The city of Camanche is located in a region of rolling hills and valleys, and is surrounded by a number of small towns and villages. The city is located in a temperate climate, with hot summers and cold winters.
The city of Camanche is located in a region of fertile soil, and is home to a variety of agricultural activities, including corn, soybeans, and hay. The city is also home to a number of small businesses, including a variety of restaurants, stores, and other services.
Economy
The economy of Camanche is largely based on agriculture and manufacturing. The city is home to a number of agricultural businesses, including a variety of farms, feed mills, and grain elevators. The city is also home to a number of manufacturing businesses, including a paper mill, a brickyard, and a sawmill.
The city of Camanche is also home to a number of small businesses, including a variety of restaurants, stores, and other services. The city is also home to a number of educational institutions, including the Camanche Academy, which was founded in 1856.
Demographics
The population of Camanche, Iowa was 5,845 in the year 2020. The population is largely white, with a small percentage of African Americans, Hispanics, and Asians. The median age of the population is 43.7 years, and the median household income is $50,945.
The city of Camanche is home to a number of churches, including the First Presbyterian Church, which was founded in 1854. The city is also home to a number of cultural institutions, including the Camanche Opera House, which was built in 1891. The city is also home to a number of recreational activities, including fishing, boating, and swimming.
Common Questions
What is the Total Population of Camanche?
Total Population of Camanche is 4,546.
What is the Total Male Population of Camanche?
Total Male Population of Camanche is 2,173.
What is the Total Female Population of Camanche?
Total Female Population of Camanche is 2,373.
What is the Ratio of Males per 100 Females in Camanche?
There are 91.57 Males per 100 Females in Camanche.
What is the Ratio of Females per 100 Males in Camanche?
There are 109.20 Females per 100 Males in Camanche.
What is the Median Population Age in Camanche?
Median Population Age in Camanche is 42.3 Years.
What is the Average Family Size in Camanche
Average Family Size in Camanche is 2.8 People.
What is the Average Household Size in Camanche
Average Household Size in Camanche is 2.3 People.
What is Per Capita Income in Camanche?
Per Capita income in Camanche is $33,189.
What is the Median Family Income in Camanche?
Median Family Income in Camanche is $83,911.
What is the Median Household income in Camanche?
Median Household Income in Camanche is $65,090.
What is Income or Wage Gap in Camanche?
Income or Wage Gap in Camanche is 38.9%.
Women in Camanche earn 61.1 cents for every dollar earned by a man.
What is Inequality or Gini Index in Camanche?
Inequality or Gini Index in Camanche is 0.39.
How Large is the Labor Force in Camanche?
There are 2,352 People in the Labor Forcein in Camanche.
What is the Percentage of People in the Labor Force in Camanche?
66.7% of People are in the Labor Force in Camanche.
What is the Unemployment Rate in Camanche?
Unemployment Rate in Camanche is 3.6%.