Rosburg, WA
Rosburg Map
Rosburg Overview
429
TOTAL POPULATION
252
MALE POPULATION
177
FEMALE POPULATION
142.37
MALES / 100 FEMALES
70.24
FEMALES / 100 MALES
35.9
MEDIAN AGE
3.2
AVG FAMILY SIZE
2.7
AVG HOUSEHOLD SIZE
$21,718
PER CAPITA INCOME
$56,050
AVG FAMILY INCOME
$54,776
AVG HOUSEHOLD INCOME
0.39
INEQUALITY / GINI INDEX
194
LABOR FORCE [ PEOPLE ]
63.6%
PERCENT IN LABOR FORCE
9.8%
UNEMPLOYMENT RATE
Rosburg Zip Codes
Rosburg Area Codes
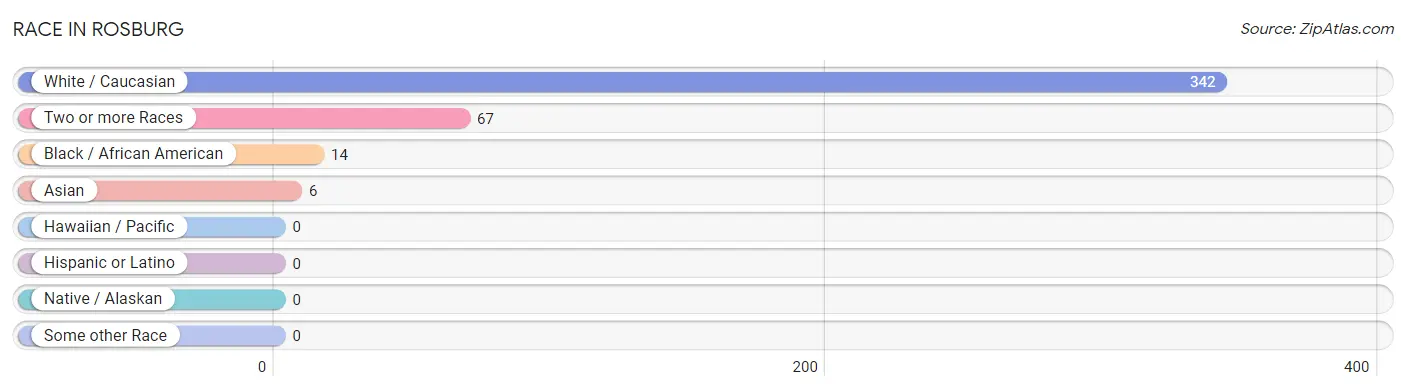
Race in Rosburg
The most populous races in Rosburg are White / Caucasian (342 | 79.7%), Two or more Races (67 | 15.6%), and Black / African American (14 | 3.3%).
| Race | # Population | % Population |
| Asian | 6 | 1.4% |
| Black / African American | 14 | 3.3% |
| Hawaiian / Pacific | 0 | 0.0% |
| Hispanic or Latino | 0 | 0.0% |
| Native / Alaskan | 0 | 0.0% |
| White / Caucasian | 342 | 79.7% |
| Two or more Races | 67 | 15.6% |
| Some other Race | 0 | 0.0% |
| Total | 429 | 100.0% |
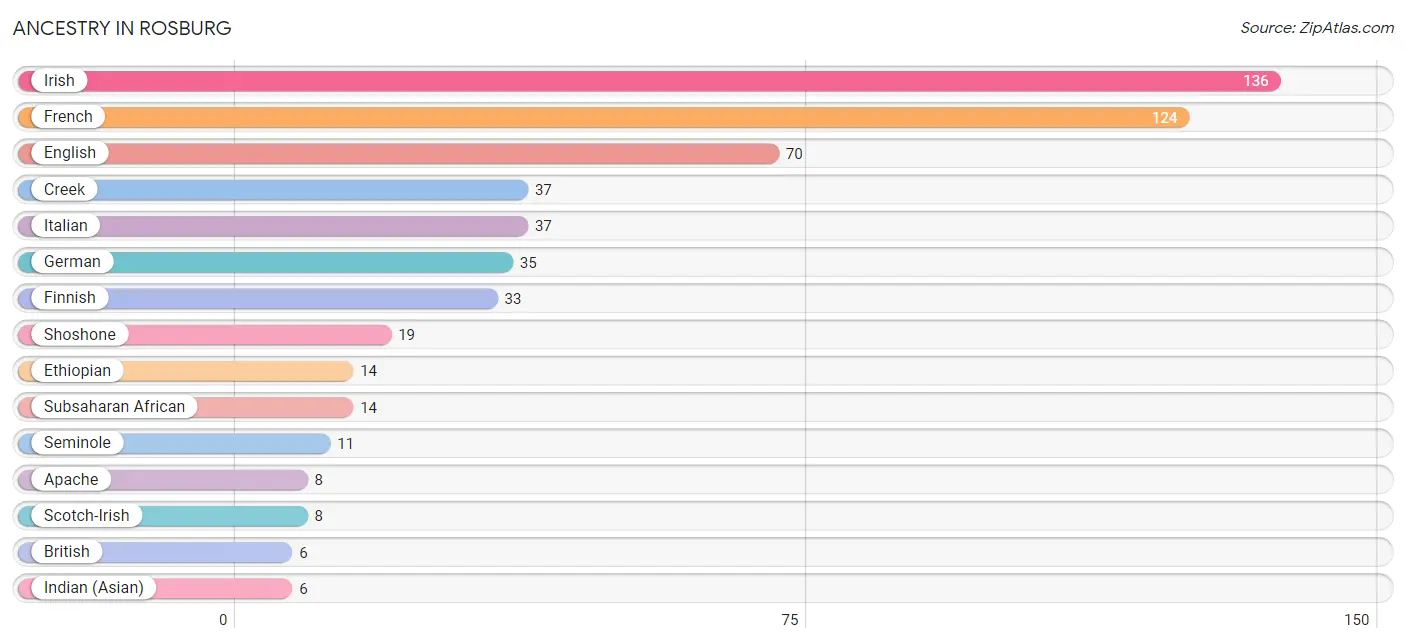
Ancestry in Rosburg
The most populous ancestries reported in Rosburg are Irish (136 | 31.7%), French (124 | 28.9%), English (70 | 16.3%), Creek (37 | 8.6%), and Italian (37 | 8.6%), together accounting for 94.2% of all Rosburg residents.
| Ancestry | # Population | % Population |
| Apache | 8 | 1.9% |
| British | 6 | 1.4% |
| Creek | 37 | 8.6% |
| English | 70 | 16.3% |
| Ethiopian | 14 | 3.3% |
| Finnish | 33 | 7.7% |
| French | 124 | 28.9% |
| German | 35 | 8.2% |
| Indian (Asian) | 6 | 1.4% |
| Irish | 136 | 31.7% |
| Italian | 37 | 8.6% |
| Norwegian | 4 | 0.9% |
| Scotch-Irish | 8 | 1.9% |
| Scottish | 5 | 1.2% |
| Seminole | 11 | 2.6% |
| Shoshone | 19 | 4.4% |
| Subsaharan African | 14 | 3.3% |
| Swedish | 3 | 0.7% |
| Swiss | 5 | 1.2% | View All 19 Rows |
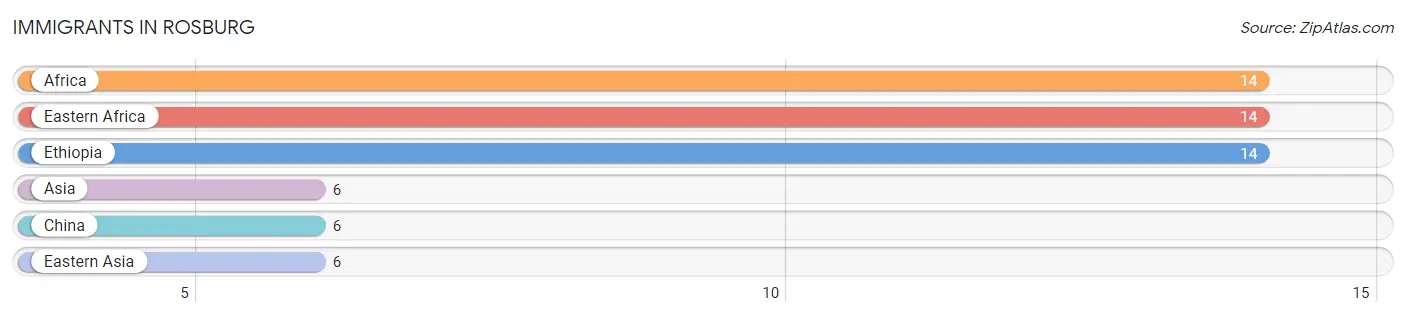
Immigrants in Rosburg
The most numerous immigrant groups reported in Rosburg came from Africa (14 | 3.3%), Eastern Africa (14 | 3.3%), Ethiopia (14 | 3.3%), Asia (6 | 1.4%), and China (6 | 1.4%), together accounting for 12.6% of all Rosburg residents.
| Immigration Origin | # Population | % Population |
| Africa | 14 | 3.3% |
| Asia | 6 | 1.4% |
| China | 6 | 1.4% |
| Eastern Africa | 14 | 3.3% |
| Eastern Asia | 6 | 1.4% |
| Ethiopia | 14 | 3.3% | View All 6 Rows |
Sex and Age in Rosburg
Sex and Age in Rosburg
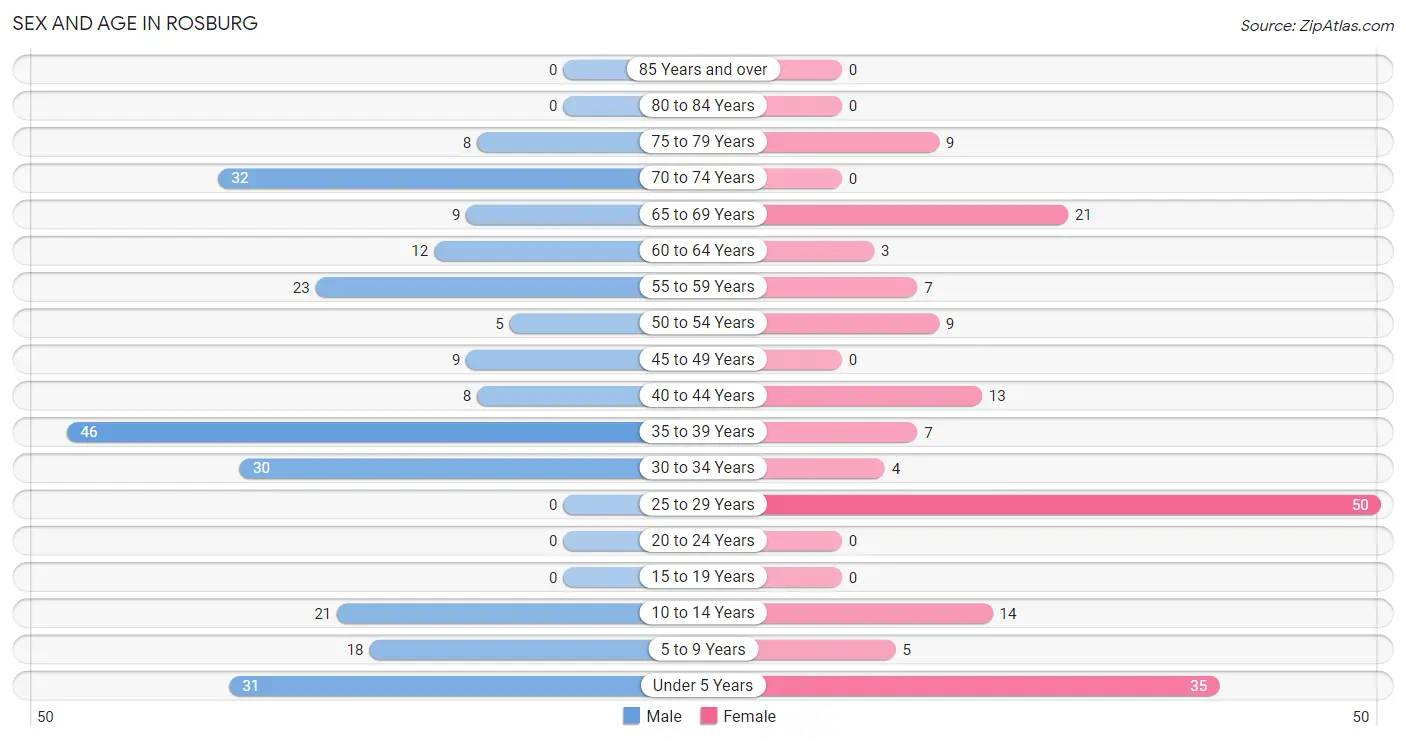
The most populous age groups in Rosburg are 35 to 39 Years (46 | 18.2%) for men and 25 to 29 Years (50 | 28.2%) for women.
| Age Bracket | Male | Female |
| Under 5 Years | 31 (12.3%) | 35 (19.8%) |
| 5 to 9 Years | 18 (7.1%) | 5 (2.8%) |
| 10 to 14 Years | 21 (8.3%) | 14 (7.9%) |
| 15 to 19 Years | 0 (0.0%) | 0 (0.0%) |
| 20 to 24 Years | 0 (0.0%) | 0 (0.0%) |
| 25 to 29 Years | 0 (0.0%) | 50 (28.2%) |
| 30 to 34 Years | 30 (11.9%) | 4 (2.3%) |
| 35 to 39 Years | 46 (18.2%) | 7 (4.0%) |
| 40 to 44 Years | 8 (3.2%) | 13 (7.3%) |
| 45 to 49 Years | 9 (3.6%) | 0 (0.0%) |
| 50 to 54 Years | 5 (2.0%) | 9 (5.1%) |
| 55 to 59 Years | 23 (9.1%) | 7 (4.0%) |
| 60 to 64 Years | 12 (4.8%) | 3 (1.7%) |
| 65 to 69 Years | 9 (3.6%) | 21 (11.9%) |
| 70 to 74 Years | 32 (12.7%) | 0 (0.0%) |
| 75 to 79 Years | 8 (3.2%) | 9 (5.1%) |
| 80 to 84 Years | 0 (0.0%) | 0 (0.0%) |
| 85 Years and over | 0 (0.0%) | 0 (0.0%) |
| Total | 252 (100.0%) | 177 (100.0%) |
Families and Households in Rosburg
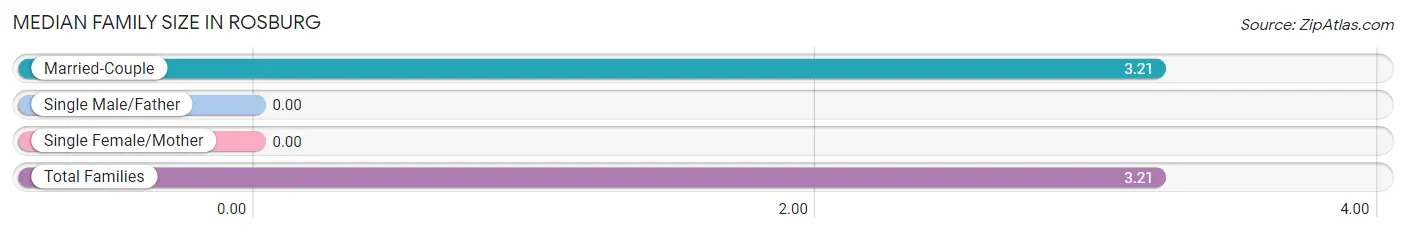
Median Family Size in Rosburg
| Family Type | # Families | Family Size |
| Married-Couple | 115 (100.0%) | 3.21 |
| Single Male/Father | 0 (0.0%) | - |
| Single Female/Mother | 0 (0.0%) | - |
| Total Families | 115 (100.0%) | 3.21 |
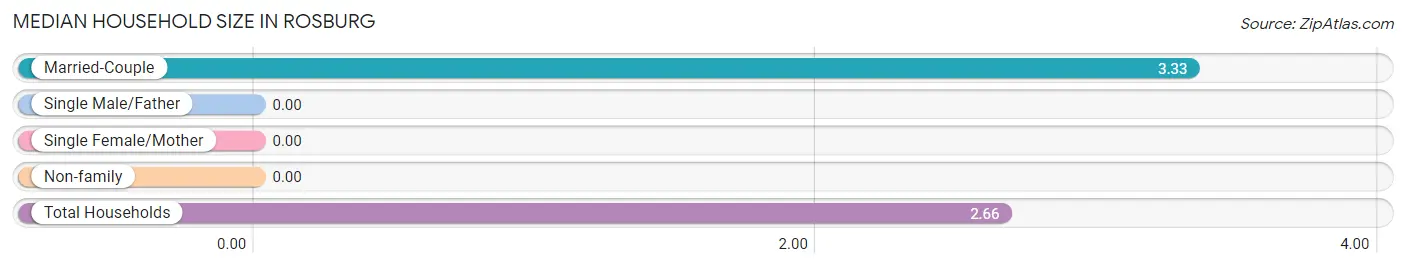
Median Household Size in Rosburg
| Household Type | # Households | Household Size |
| Married-Couple | 115 (71.4%) | 3.33 |
| Single Male/Father | 0 (0.0%) | - |
| Single Female/Mother | 0 (0.0%) | - |
| Non-family | 46 (28.6%) | - |
| Total Households | 161 (100.0%) | 2.66 |
Household Size by Marriage Status in Rosburg
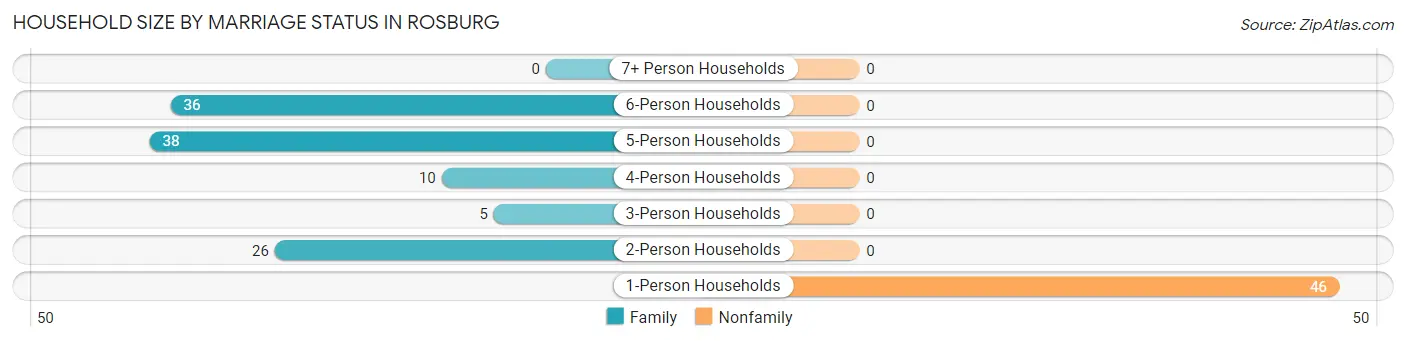
Out of a total of 161 households in Rosburg, 115 (71.4%) are family households, while 46 (28.6%) are nonfamily households. The most numerous type of family households are 5-person households, comprising 38, and the most common type of nonfamily households are 1-person households, comprising 46.
| Household Size | Family Households | Nonfamily Households |
| 1-Person Households | - | 46 (28.6%) |
| 2-Person Households | 26 (16.2%) | 0 (0.0%) |
| 3-Person Households | 5 (3.1%) | 0 (0.0%) |
| 4-Person Households | 10 (6.2%) | 0 (0.0%) |
| 5-Person Households | 38 (23.6%) | 0 (0.0%) |
| 6-Person Households | 36 (22.4%) | 0 (0.0%) |
| 7+ Person Households | 0 (0.0%) | 0 (0.0%) |
| Total | 115 (71.4%) | 46 (28.6%) |
Female Fertility in Rosburg
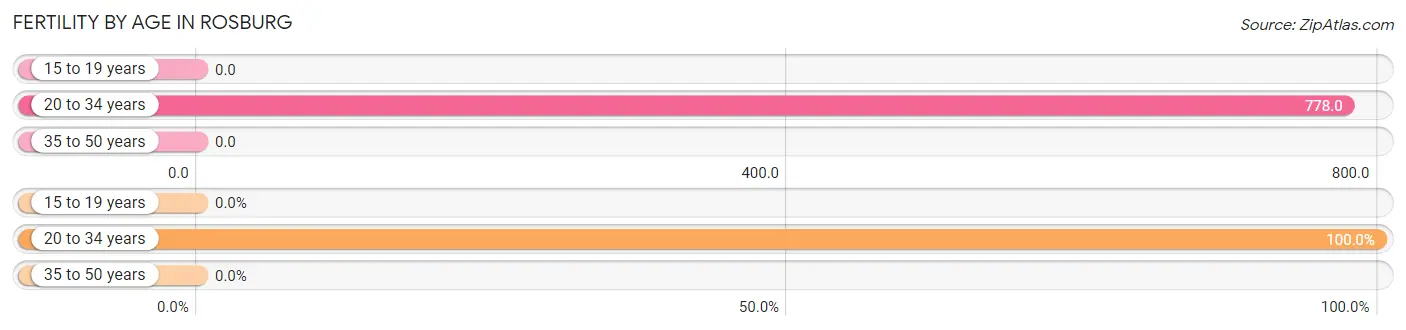
Fertility by Age in Rosburg
Average fertility rate in Rosburg is 568.0 births per 1,000 women. Women in the age bracket of 20 to 34 years have the highest fertility rate with 778.0 births per 1,000 women. Women in the age bracket of 20 to 34 years acount for 100.0% of all women with births.
| Age Bracket | Women with Births | Births / 1,000 Women |
| 15 to 19 years | 0 (0.0%) | 0.0 |
| 20 to 34 years | 42 (100.0%) | 778.0 |
| 35 to 50 years | 0 (0.0%) | 0.0 |
| Total | 42 (100.0%) | 568.0 |
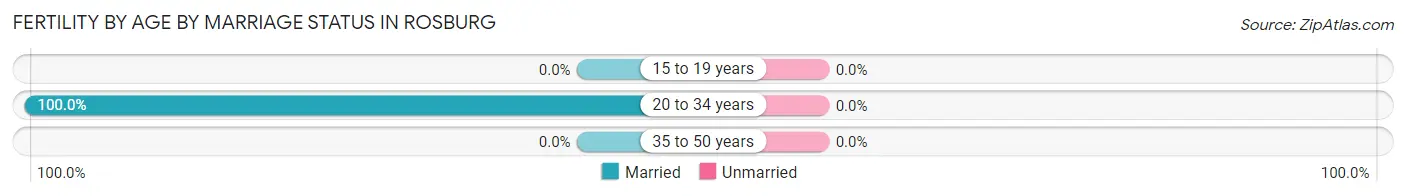
Fertility by Age by Marriage Status in Rosburg
| Age Bracket | Married | Unmarried |
| 15 to 19 years | 0 (0.0%) | 0 (0.0%) |
| 20 to 34 years | 42 (100.0%) | 0 (0.0%) |
| 35 to 50 years | 0 (0.0%) | 0 (0.0%) |
| Total | 42 (100.0%) | 0 (0.0%) |
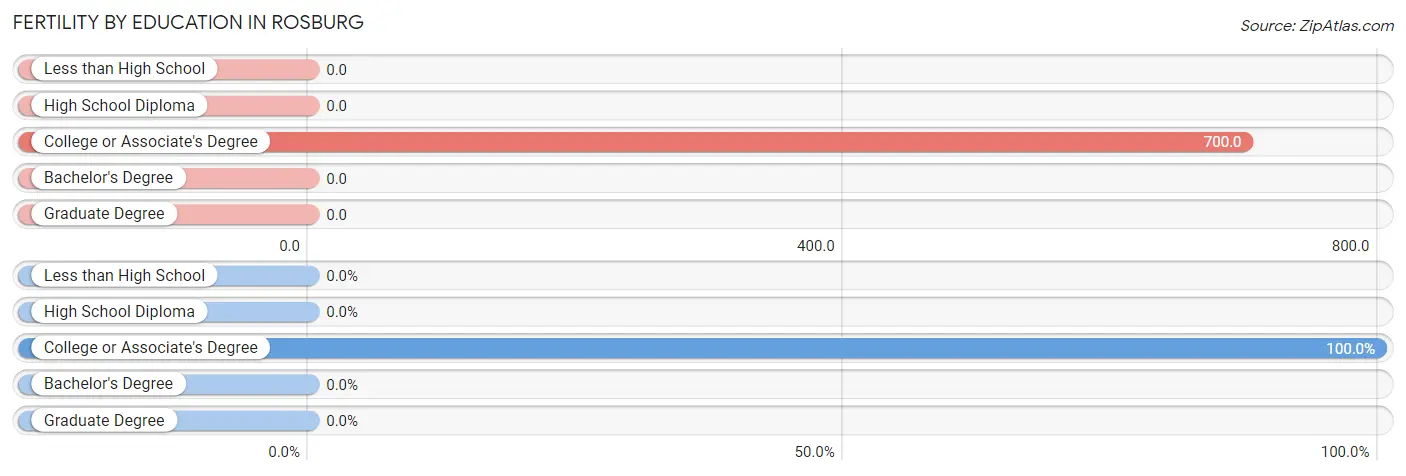
Fertility by Education in Rosburg
| Educational Attainment | Women with Births | Births / 1,000 Women |
| Less than High School | 0 (0.0%) | 0.0 |
| High School Diploma | 0 (0.0%) | 0.0 |
| College or Associate's Degree | 42 (100.0%) | 700.0 |
| Bachelor's Degree | 0 (0.0%) | 0.0 |
| Graduate Degree | 0 (0.0%) | 0.0 |
| Total | 42 (100.0%) | 568.0 |
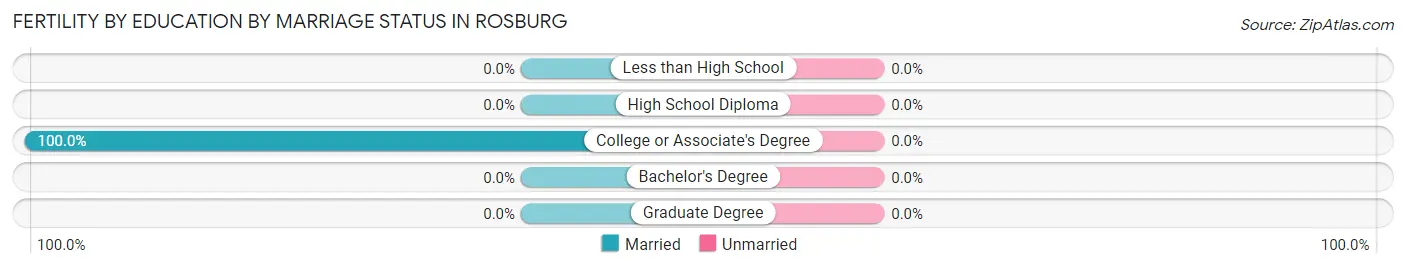
Fertility by Education by Marriage Status in Rosburg
| Educational Attainment | Married | Unmarried |
| Less than High School | 0 (0.0%) | 0 (0.0%) |
| High School Diploma | 0 (0.0%) | 0 (0.0%) |
| College or Associate's Degree | 42 (100.0%) | 0 (0.0%) |
| Bachelor's Degree | 0 (0.0%) | 0 (0.0%) |
| Graduate Degree | 0 (0.0%) | 0 (0.0%) |
| Total | 42 (100.0%) | 0 (0.0%) |
Income in Rosburg
Income Overview in Rosburg
Per Capita Income in Rosburg is $21,718, while median incomes of families and households are $56,050 and $54,776 respectively.
| Characteristic | Number | Measure |
| Per Capita Income | 429 | $21,718 |
| Median Family Income | 115 | $56,050 |
| Mean Family Income | 115 | $77,401 |
| Median Household Income | 161 | $54,776 |
| Mean Household Income | 161 | $64,739 |
| Income Deficit | 115 | $0 |
| Wage / Income Gap (%) | 429 | 0.00% |
| Wage / Income Gap ($) | 429 | 100.00¢ per $1 |
| Gini / Inequality Index | 429 | 0.39 |
Earnings by Sex in Rosburg
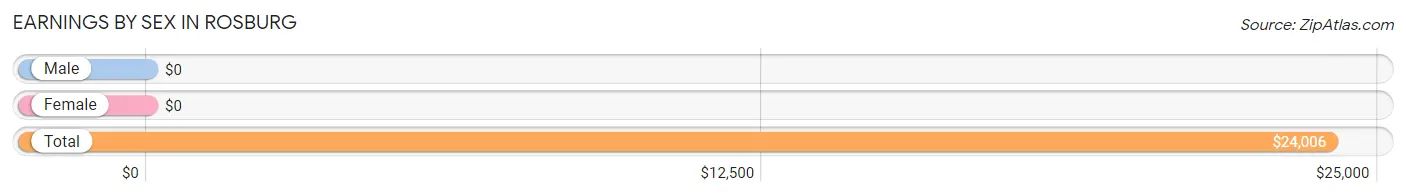
| Sex | Number | Average Earnings |
| Male | 117 (58.2%) | $0 |
| Female | 84 (41.8%) | $0 |
| Total | 201 (100.0%) | $24,006 |
Earnings by Sex by Income Bracket in Rosburg
The most common earnings brackets in Rosburg are $22,500 to $24,999 for men (35 | 29.9%) and $2,499 or less for women (42 | 50.0%).
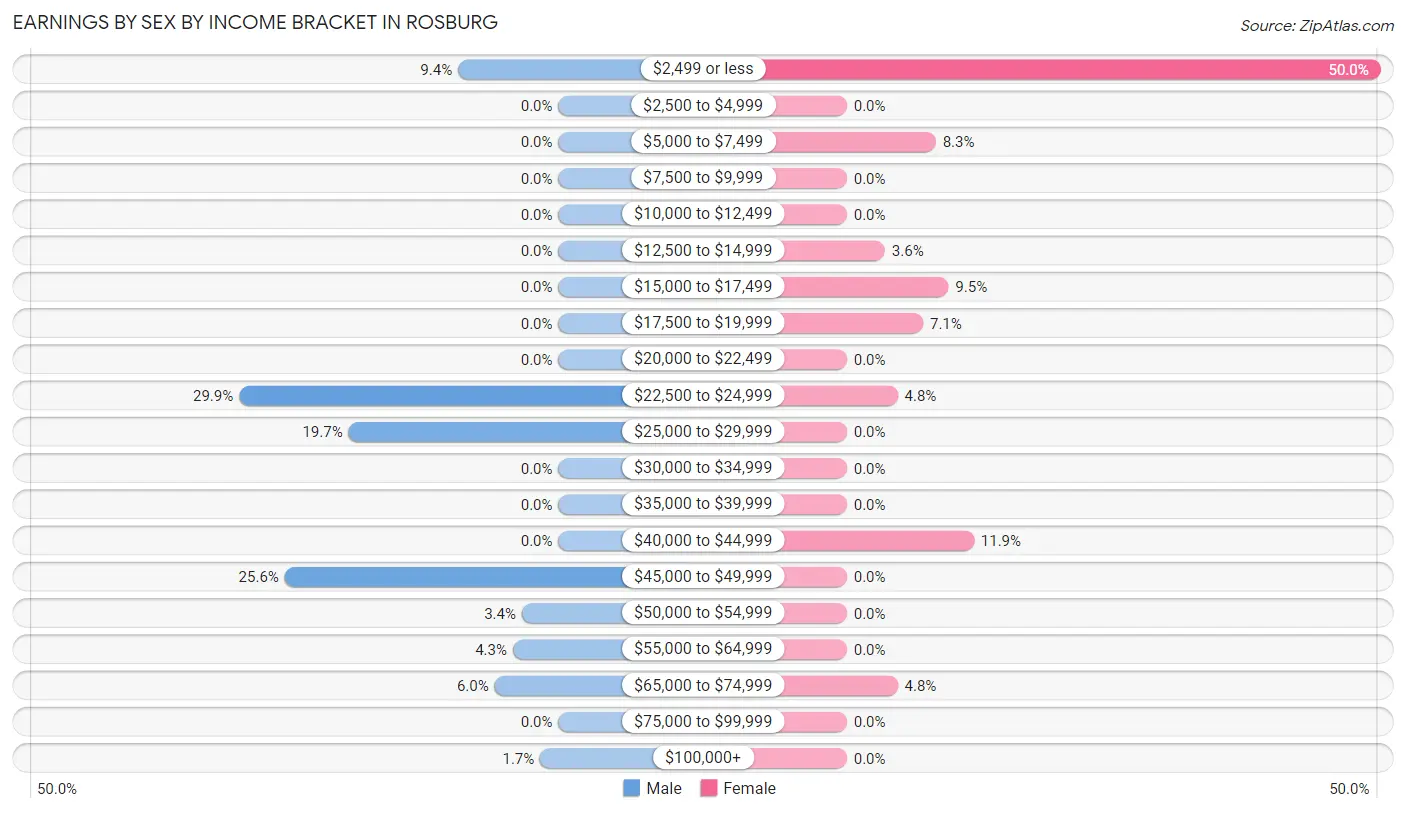
| Income | Male | Female |
| $2,499 or less | 11 (9.4%) | 42 (50.0%) |
| $2,500 to $4,999 | 0 (0.0%) | 0 (0.0%) |
| $5,000 to $7,499 | 0 (0.0%) | 7 (8.3%) |
| $7,500 to $9,999 | 0 (0.0%) | 0 (0.0%) |
| $10,000 to $12,499 | 0 (0.0%) | 0 (0.0%) |
| $12,500 to $14,999 | 0 (0.0%) | 3 (3.6%) |
| $15,000 to $17,499 | 0 (0.0%) | 8 (9.5%) |
| $17,500 to $19,999 | 0 (0.0%) | 6 (7.1%) |
| $20,000 to $22,499 | 0 (0.0%) | 0 (0.0%) |
| $22,500 to $24,999 | 35 (29.9%) | 4 (4.8%) |
| $25,000 to $29,999 | 23 (19.7%) | 0 (0.0%) |
| $30,000 to $34,999 | 0 (0.0%) | 0 (0.0%) |
| $35,000 to $39,999 | 0 (0.0%) | 0 (0.0%) |
| $40,000 to $44,999 | 0 (0.0%) | 10 (11.9%) |
| $45,000 to $49,999 | 30 (25.6%) | 0 (0.0%) |
| $50,000 to $54,999 | 4 (3.4%) | 0 (0.0%) |
| $55,000 to $64,999 | 5 (4.3%) | 0 (0.0%) |
| $65,000 to $74,999 | 7 (6.0%) | 4 (4.8%) |
| $75,000 to $99,999 | 0 (0.0%) | 0 (0.0%) |
| $100,000+ | 2 (1.7%) | 0 (0.0%) |
| Total | 117 (100.0%) | 84 (100.0%) |
Earnings by Sex by Educational Attainment in Rosburg
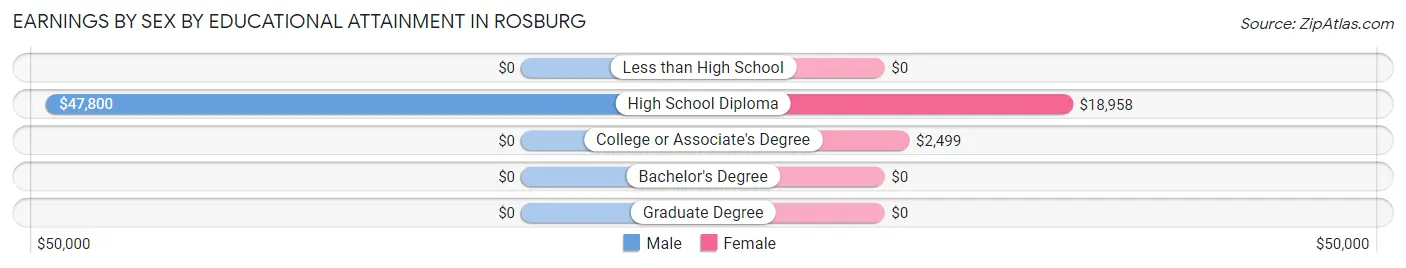
| Educational Attainment | Male Income | Female Income |
| Less than High School | - | - |
| High School Diploma | $47,800 | $18,958 |
| College or Associate's Degree | - | - |
| Bachelor's Degree | - | - |
| Graduate Degree | - | - |
| Total | - | - |
Family Income in Rosburg
Family Income Brackets in Rosburg
According to the Rosburg family income data, there are 64 families falling into the $50,000 to $74,999 income range, which is the most common income bracket and makes up 55.6% of all families.
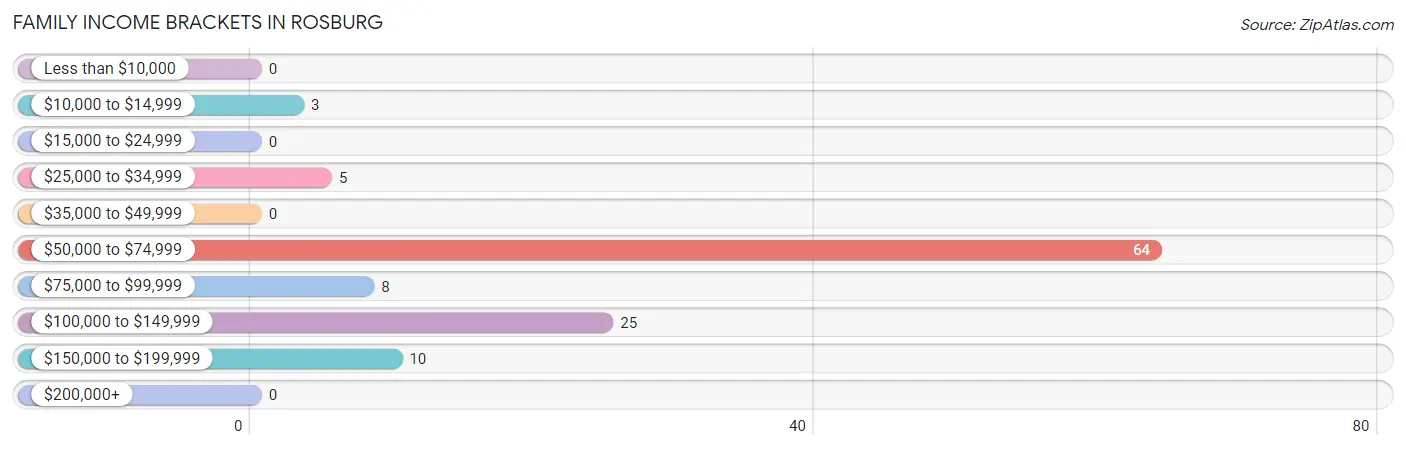
| Income Bracket | # Families | % Families |
| Less than $10,000 | 0 | 0.0% |
| $10,000 to $14,999 | 3 | 2.6% |
| $15,000 to $24,999 | 0 | 0.0% |
| $25,000 to $34,999 | 5 | 4.3% |
| $35,000 to $49,999 | 0 | 0.0% |
| $50,000 to $74,999 | 64 | 55.7% |
| $75,000 to $99,999 | 8 | 7.0% |
| $100,000 to $149,999 | 25 | 21.7% |
| $150,000 to $199,999 | 10 | 8.7% |
| $200,000+ | 0 | 0.0% |
Family Income by Famaliy Size in Rosburg
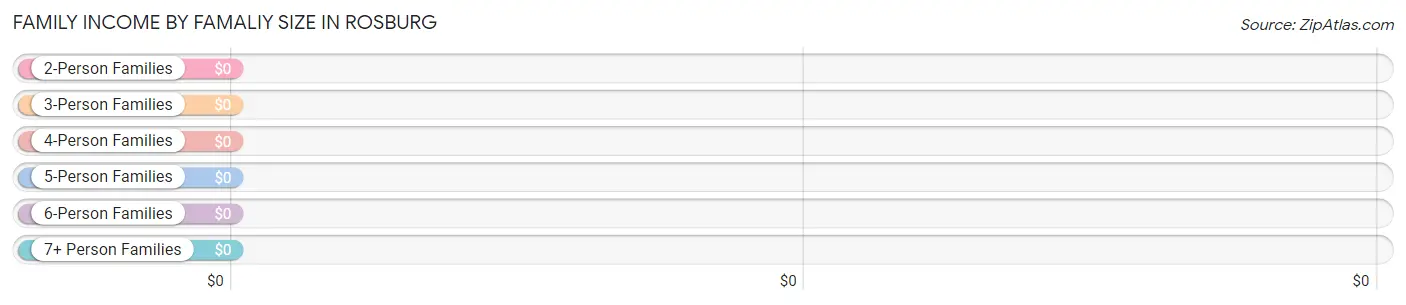
| Income Bracket | # Families | Median Income |
| 2-Person Families | 26 (22.6%) | $0 |
| 3-Person Families | 5 (4.3%) | $0 |
| 4-Person Families | 18 (15.7%) | $0 |
| 5-Person Families | 38 (33.0%) | $0 |
| 6-Person Families | 28 (24.3%) | $0 |
| 7+ Person Families | 0 (0.0%) | $0 |
| Total | 115 (100.0%) | $56,050 |
Family Income by Number of Earners in Rosburg
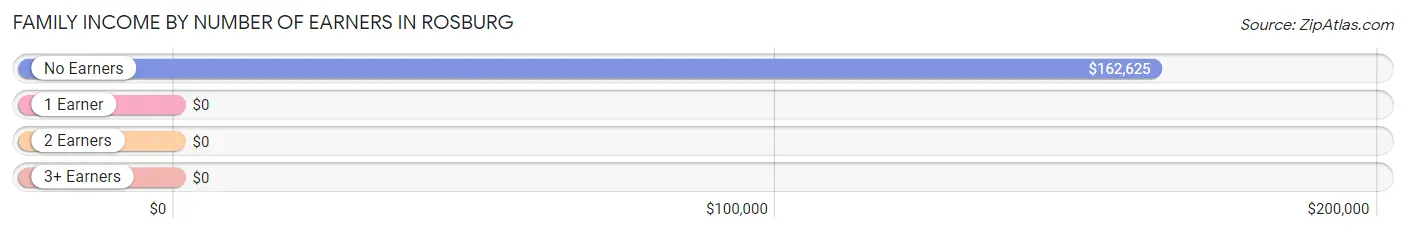
| Number of Earners | # Families | Median Income |
| No Earners | 19 (16.5%) | $162,625 |
| 1 Earner | 9 (7.8%) | $0 |
| 2 Earners | 44 (38.3%) | $0 |
| 3+ Earners | 43 (37.4%) | $0 |
| Total | 115 (100.0%) | $56,050 |
Household Income in Rosburg
Household Income Brackets in Rosburg
With 68 households falling in the category, the $50,000 to $74,999 income range is the most frequent in Rosburg, accounting for 42.2% of all households.
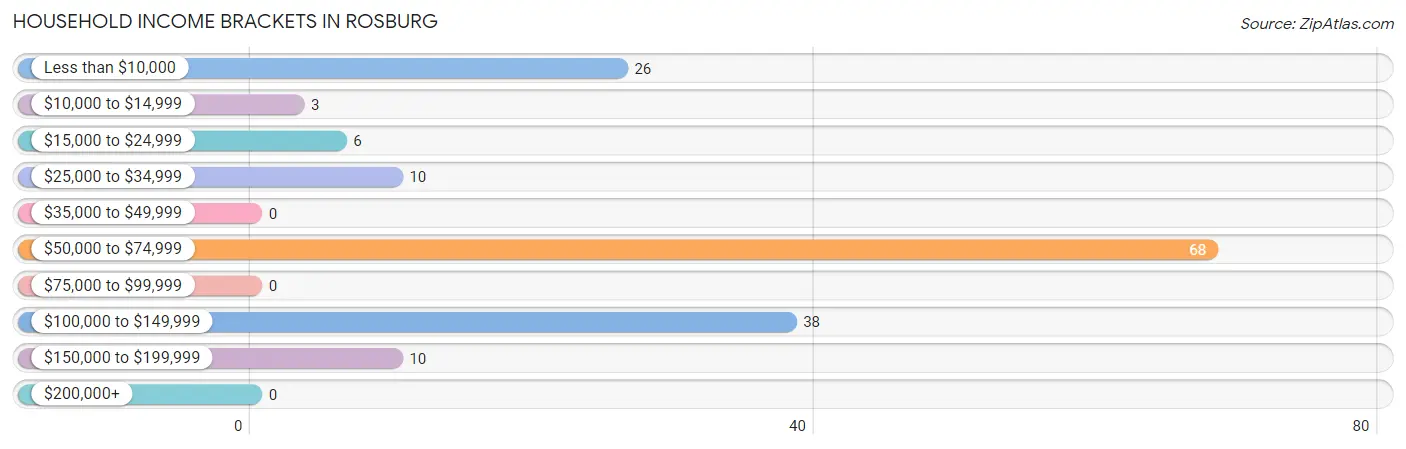
| Income Bracket | # Households | % Households |
| Less than $10,000 | 26 | 16.1% |
| $10,000 to $14,999 | 3 | 1.9% |
| $15,000 to $24,999 | 6 | 3.7% |
| $25,000 to $34,999 | 10 | 6.2% |
| $35,000 to $49,999 | 0 | 0.0% |
| $50,000 to $74,999 | 68 | 42.2% |
| $75,000 to $99,999 | 0 | 0.0% |
| $100,000 to $149,999 | 38 | 23.6% |
| $150,000 to $199,999 | 10 | 6.2% |
| $200,000+ | 0 | 0.0% |
Household Income by Householder Age in Rosburg
The median household income in Rosburg is $54,776, with the highest median household income of $55,800 found in the 25 to 44 years age bracket for the primary householder. A total of 86 households (53.4%) fall into this category.
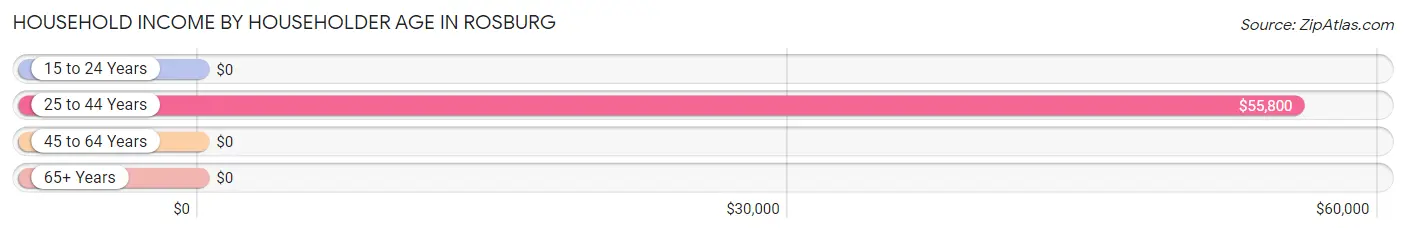
| Income Bracket | # Households | Median Income |
| 15 to 24 Years | 0 (0.0%) | $0 |
| 25 to 44 Years | 86 (53.4%) | $55,800 |
| 45 to 64 Years | 15 (9.3%) | $0 |
| 65+ Years | 60 (37.3%) | $0 |
| Total | 161 (100.0%) | $54,776 |
Poverty in Rosburg
Income Below Poverty by Sex and Age in Rosburg
With 14.7% poverty level for males and 1.7% for females among the residents of Rosburg, 65 to 74 year old males and 55 to 64 year old females are the most vulnerable to poverty, with 26 males (63.4%) and 3 females (30.0%) in their respective age groups living below the poverty level.
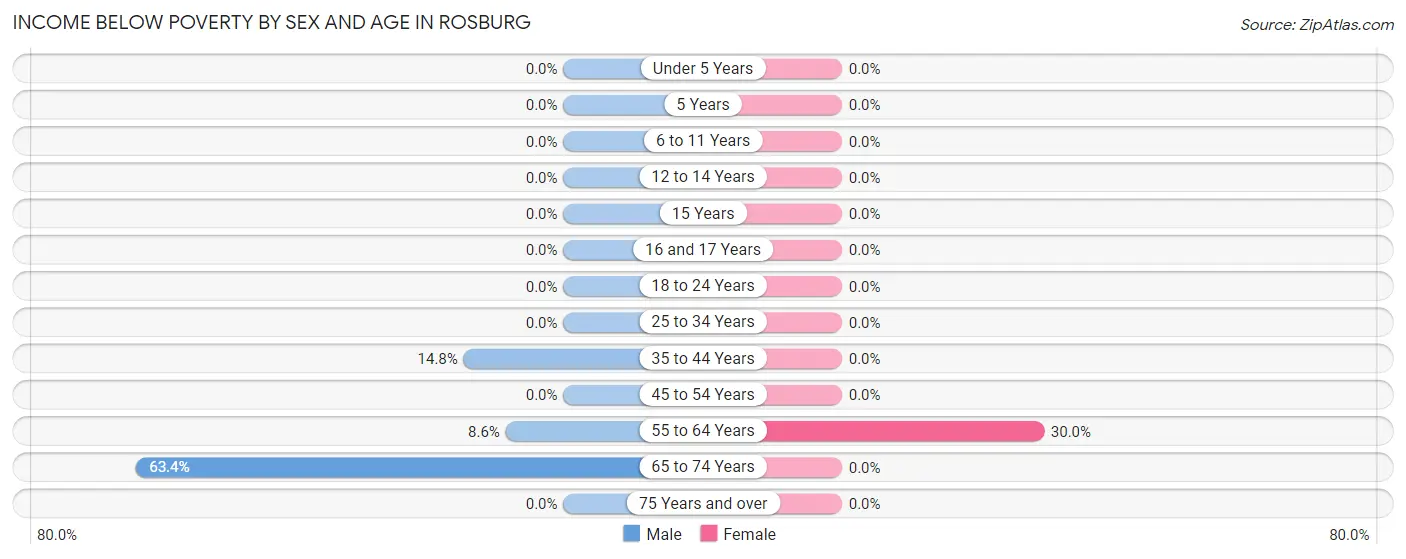
| Age Bracket | Male | Female |
| Under 5 Years | 0 (0.0%) | 0 (0.0%) |
| 5 Years | 0 (0.0%) | 0 (0.0%) |
| 6 to 11 Years | 0 (0.0%) | 0 (0.0%) |
| 12 to 14 Years | 0 (0.0%) | 0 (0.0%) |
| 15 Years | 0 (0.0%) | 0 (0.0%) |
| 16 and 17 Years | 0 (0.0%) | 0 (0.0%) |
| 18 to 24 Years | 0 (0.0%) | 0 (0.0%) |
| 25 to 34 Years | 0 (0.0%) | 0 (0.0%) |
| 35 to 44 Years | 8 (14.8%) | 0 (0.0%) |
| 45 to 54 Years | 0 (0.0%) | 0 (0.0%) |
| 55 to 64 Years | 3 (8.6%) | 3 (30.0%) |
| 65 to 74 Years | 26 (63.4%) | 0 (0.0%) |
| 75 Years and over | 0 (0.0%) | 0 (0.0%) |
| Total | 37 (14.7%) | 3 (1.7%) |
Income Above Poverty by Sex and Age in Rosburg
According to the poverty statistics in Rosburg, males aged under 5 years and females aged under 5 years are the age groups that are most secure financially, with 100.0% of males and 100.0% of females in these age groups living above the poverty line.
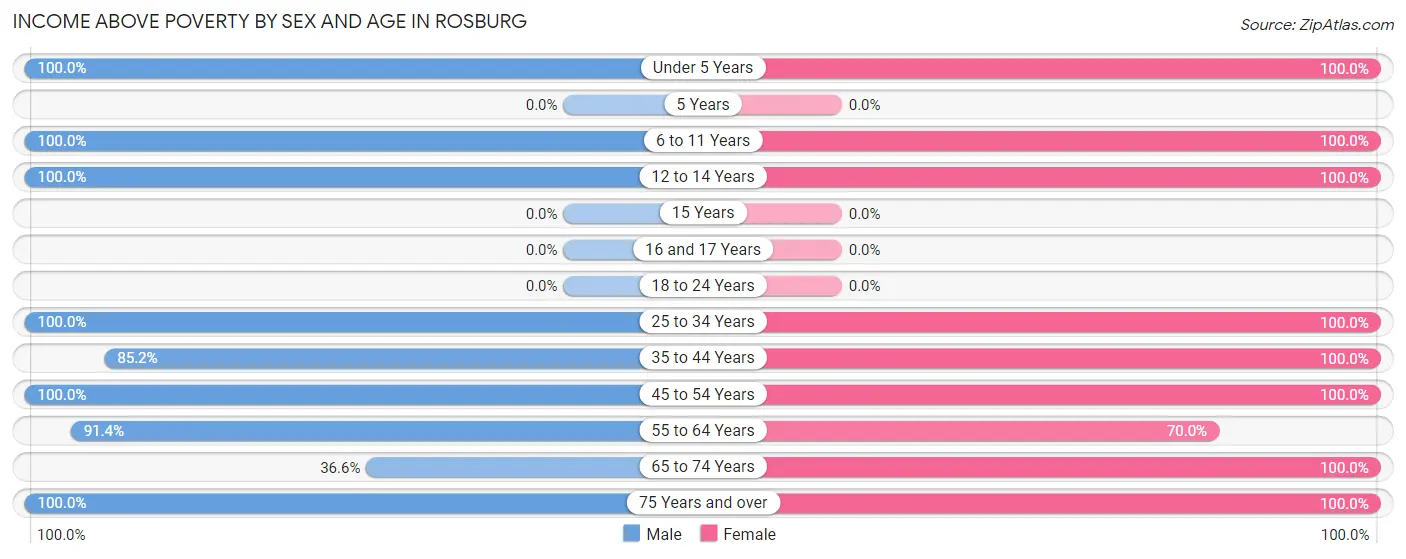
| Age Bracket | Male | Female |
| Under 5 Years | 31 (100.0%) | 35 (100.0%) |
| 5 Years | 0 (0.0%) | 0 (0.0%) |
| 6 to 11 Years | 25 (100.0%) | 7 (100.0%) |
| 12 to 14 Years | 14 (100.0%) | 12 (100.0%) |
| 15 Years | 0 (0.0%) | 0 (0.0%) |
| 16 and 17 Years | 0 (0.0%) | 0 (0.0%) |
| 18 to 24 Years | 0 (0.0%) | 0 (0.0%) |
| 25 to 34 Years | 30 (100.0%) | 54 (100.0%) |
| 35 to 44 Years | 46 (85.2%) | 20 (100.0%) |
| 45 to 54 Years | 14 (100.0%) | 9 (100.0%) |
| 55 to 64 Years | 32 (91.4%) | 7 (70.0%) |
| 65 to 74 Years | 15 (36.6%) | 21 (100.0%) |
| 75 Years and over | 8 (100.0%) | 9 (100.0%) |
| Total | 215 (85.3%) | 174 (98.3%) |
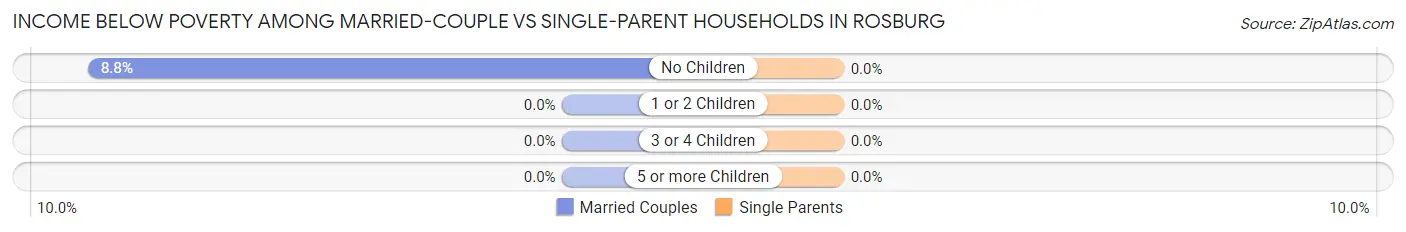
Income Below Poverty Among Married-Couple Families in Rosburg
The poverty statistics for married-couple families in Rosburg show that 2.6% or 3 of the total 115 families live below the poverty line. Families with no children have the highest poverty rate of 8.8%, comprising of 3 families. On the other hand, families with 1 or 2 children have the lowest poverty rate of 0.0%, which includes 0 families.
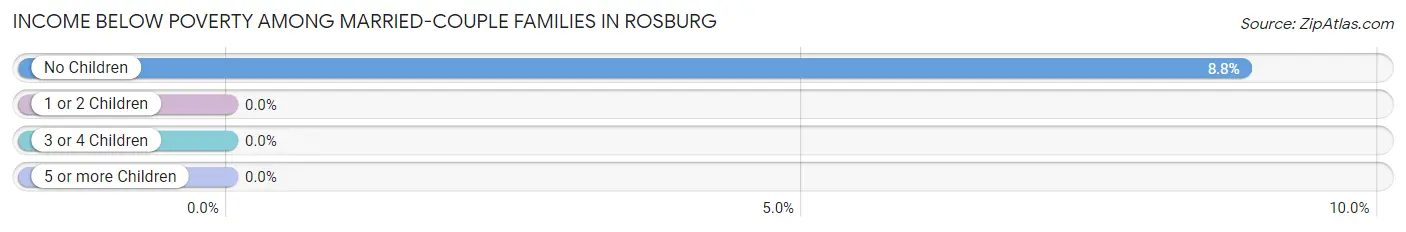
| Children | Above Poverty | Below Poverty |
| No Children | 31 (91.2%) | 3 (8.8%) |
| 1 or 2 Children | 50 (100.0%) | 0 (0.0%) |
| 3 or 4 Children | 31 (100.0%) | 0 (0.0%) |
| 5 or more Children | 0 (0.0%) | 0 (0.0%) |
| Total | 112 (97.4%) | 3 (2.6%) |
Income Below Poverty Among Single-Parent Households in Rosburg
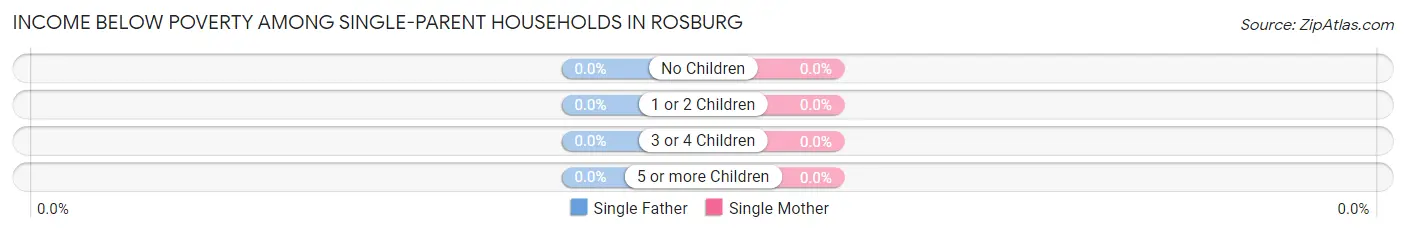
| Children | Single Father | Single Mother |
| No Children | 0 (0.0%) | 0 (0.0%) |
| 1 or 2 Children | 0 (0.0%) | 0 (0.0%) |
| 3 or 4 Children | 0 (0.0%) | 0 (0.0%) |
| 5 or more Children | 0 (0.0%) | 0 (0.0%) |
| Total | 0 (0.0%) | 0 (0.0%) |
Income Below Poverty Among Married-Couple vs Single-Parent Households in Rosburg
| Children | Married-Couple Families | Single-Parent Households |
| No Children | 3 (8.8%) | 0 (0.0%) |
| 1 or 2 Children | 0 (0.0%) | 0 (0.0%) |
| 3 or 4 Children | 0 (0.0%) | 0 (0.0%) |
| 5 or more Children | 0 (0.0%) | 0 (0.0%) |
| Total | 3 (2.6%) | 0 (0.0%) |
Employment Characteristics in Rosburg
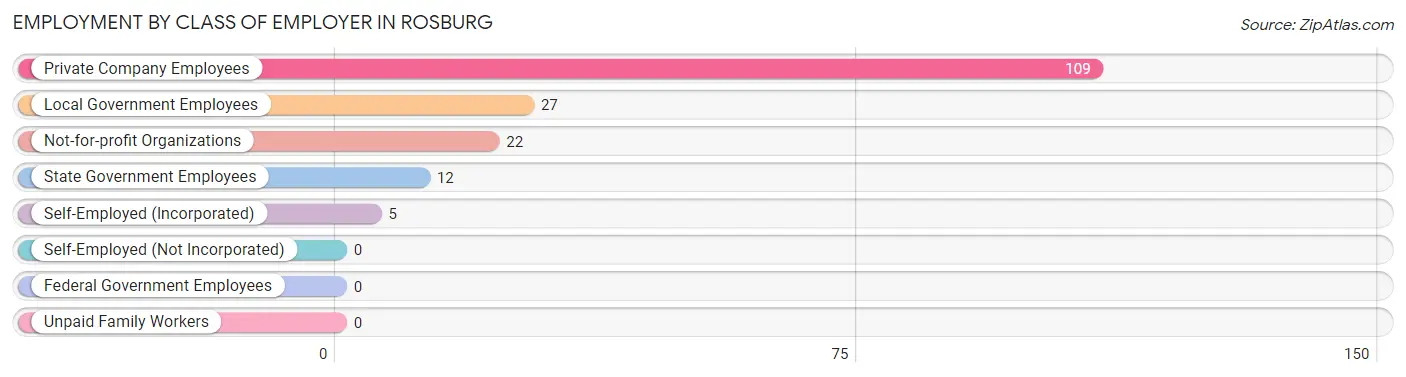
Employment by Class of Employer in Rosburg
Among the 175 employed individuals in Rosburg, private company employees (109 | 62.3%), local government employees (27 | 15.4%), and not-for-profit organizations (22 | 12.6%) make up the most common classes of employment.
| Employer Class | # Employees | % Employees |
| Private Company Employees | 109 | 62.3% |
| Self-Employed (Incorporated) | 5 | 2.9% |
| Self-Employed (Not Incorporated) | 0 | 0.0% |
| Not-for-profit Organizations | 22 | 12.6% |
| Local Government Employees | 27 | 15.4% |
| State Government Employees | 12 | 6.9% |
| Federal Government Employees | 0 | 0.0% |
| Unpaid Family Workers | 0 | 0.0% |
| Total | 175 | 100.0% |
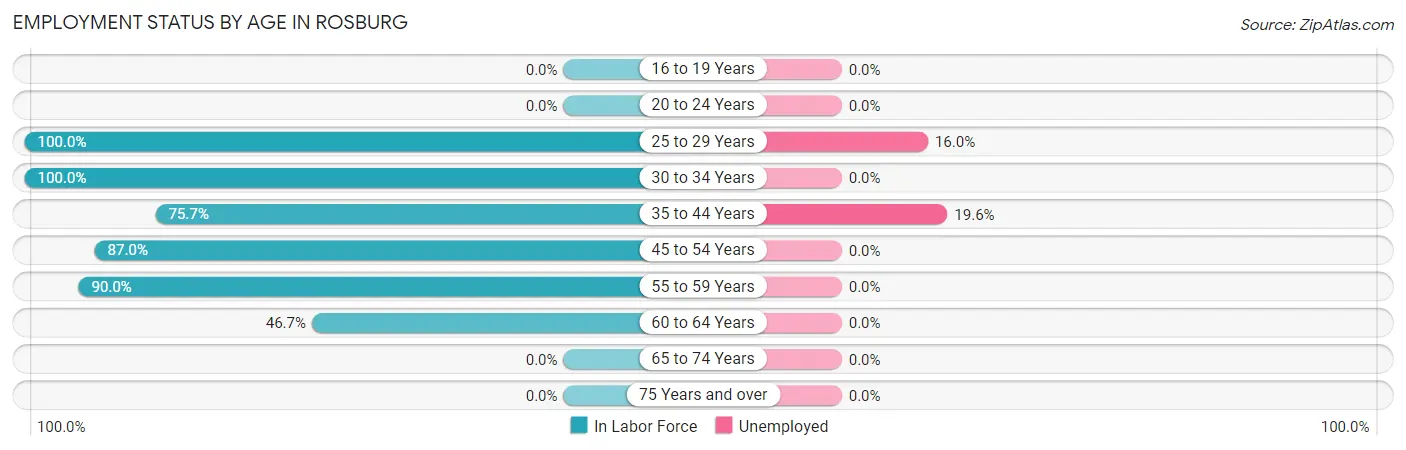
Employment Status by Age in Rosburg
According to the labor force statistics for Rosburg, out of the total population over 16 years of age (305), 63.6% or 194 individuals are in the labor force, with 9.8% or 19 of them unemployed. The age group with the highest labor force participation rate is 25 to 29 years, with 100.0% or 50 individuals in the labor force. Within the labor force, the 35 to 44 years age range has the highest percentage of unemployed individuals, with 19.6% or 11 of them being unemployed.
| Age Bracket | In Labor Force | Unemployed |
| 16 to 19 Years | 0 (0.0%) | 0 (0.0%) |
| 20 to 24 Years | 0 (0.0%) | 0 (0.0%) |
| 25 to 29 Years | 50 (100.0%) | 8 (16.0%) |
| 30 to 34 Years | 34 (100.0%) | 0 (0.0%) |
| 35 to 44 Years | 56 (75.7%) | 11 (19.6%) |
| 45 to 54 Years | 20 (87.0%) | 0 (0.0%) |
| 55 to 59 Years | 27 (90.0%) | 0 (0.0%) |
| 60 to 64 Years | 7 (46.7%) | 0 (0.0%) |
| 65 to 74 Years | 0 (0.0%) | 0 (0.0%) |
| 75 Years and over | 0 (0.0%) | 0 (0.0%) |
| Total | 194 (63.6%) | 19 (9.8%) |
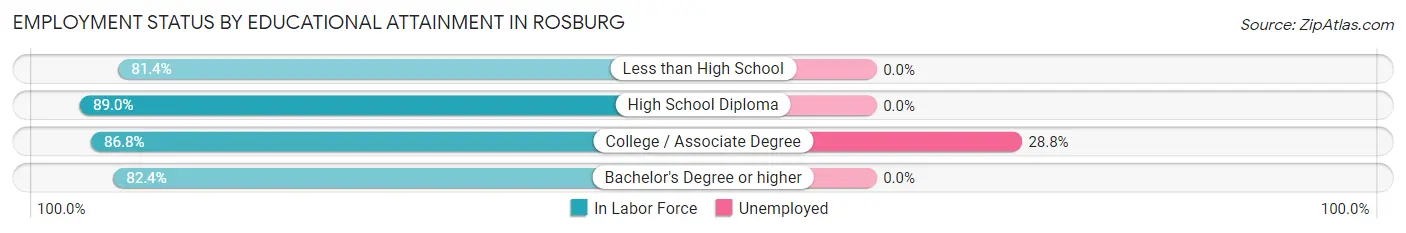
Employment Status by Educational Attainment in Rosburg
According to labor force statistics for Rosburg, 85.8% of individuals (194) out of the total population between 25 and 64 years of age (226) are in the labor force, with 9.8% or 19 of them being unemployed. The group with the highest labor force participation rate are those with the educational attainment of high school diploma, with 89.0% or 65 individuals in the labor force. Within the labor force, individuals with college / associate degree education have the highest percentage of unemployment, with 28.8% or 19 of them being unemployed.
| Educational Attainment | In Labor Force | Unemployed |
| Less than High School | 35 (81.4%) | 0 (0.0%) |
| High School Diploma | 65 (89.0%) | 0 (0.0%) |
| College / Associate Degree | 66 (86.8%) | 22 (28.8%) |
| Bachelor's Degree or higher | 28 (82.4%) | 0 (0.0%) |
| Total | 194 (85.8%) | 22 (9.8%) |
Employment Occupations by Sex in Rosburg
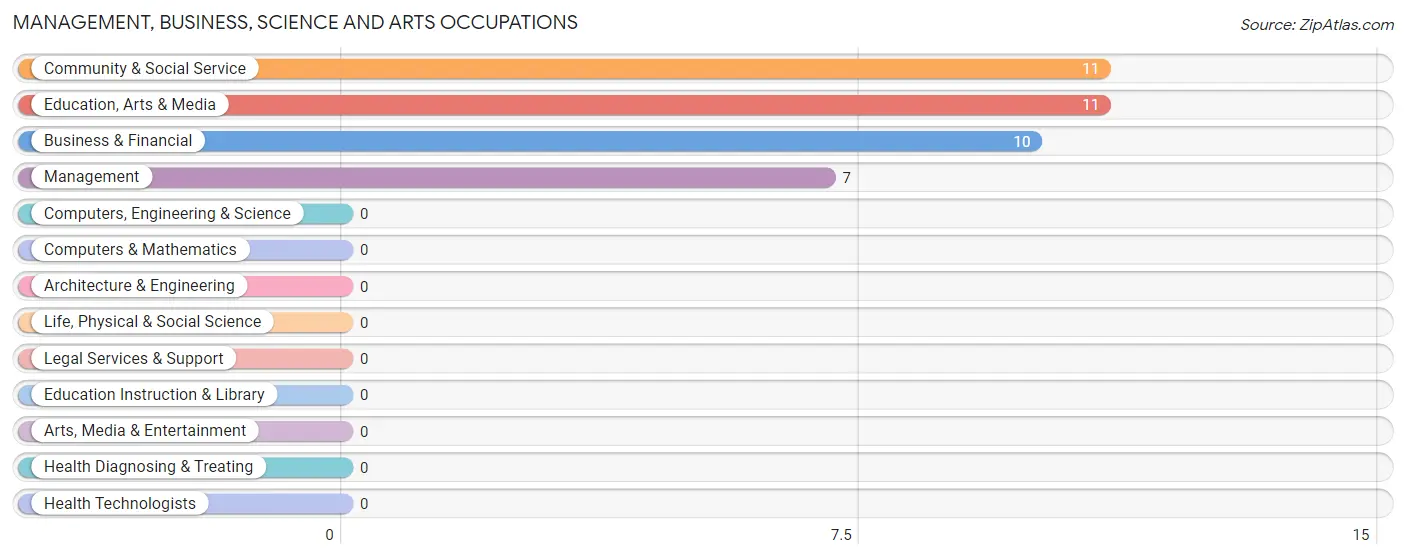
Management, Business, Science and Arts Occupations
The most common Management, Business, Science and Arts occupations in Rosburg are Community & Social Service (11 | 6.3%), Education, Arts & Media (11 | 6.3%), Business & Financial (10 | 5.7%), and Management (7 | 4.0%).
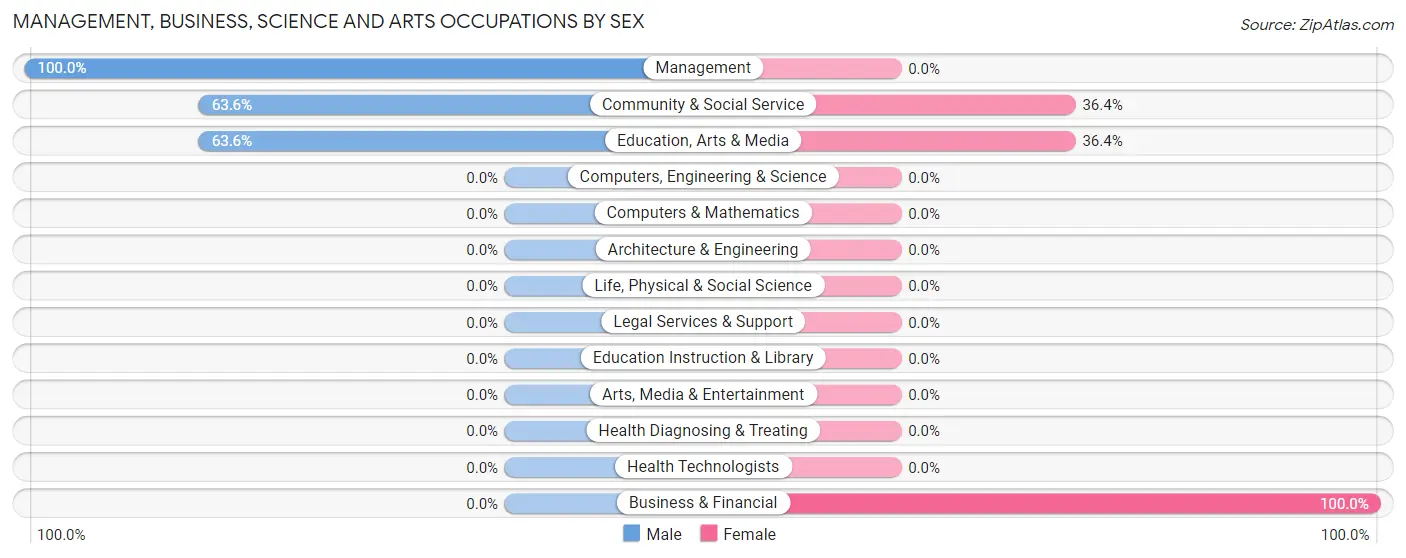
Management, Business, Science and Arts Occupations by Sex
Within the Management, Business, Science and Arts occupations in Rosburg, the most male-oriented occupations are Management (100.0%), Community & Social Service (63.6%), and Education, Arts & Media (63.6%), while the most female-oriented occupations are Business & Financial (100.0%), Community & Social Service (36.4%), and Education, Arts & Media (36.4%).
| Occupation | Male | Female |
| Management | 7 (100.0%) | 0 (0.0%) |
| Business & Financial | 0 (0.0%) | 10 (100.0%) |
| Computers, Engineering & Science | 0 (0.0%) | 0 (0.0%) |
| Computers & Mathematics | 0 (0.0%) | 0 (0.0%) |
| Architecture & Engineering | 0 (0.0%) | 0 (0.0%) |
| Life, Physical & Social Science | 0 (0.0%) | 0 (0.0%) |
| Community & Social Service | 7 (63.6%) | 4 (36.4%) |
| Education, Arts & Media | 7 (63.6%) | 4 (36.4%) |
| Legal Services & Support | 0 (0.0%) | 0 (0.0%) |
| Education Instruction & Library | 0 (0.0%) | 0 (0.0%) |
| Arts, Media & Entertainment | 0 (0.0%) | 0 (0.0%) |
| Health Diagnosing & Treating | 0 (0.0%) | 0 (0.0%) |
| Health Technologists | 0 (0.0%) | 0 (0.0%) |
| Total (Category) | 14 (50.0%) | 14 (50.0%) |
| Total (Overall) | 106 (60.6%) | 69 (39.4%) |
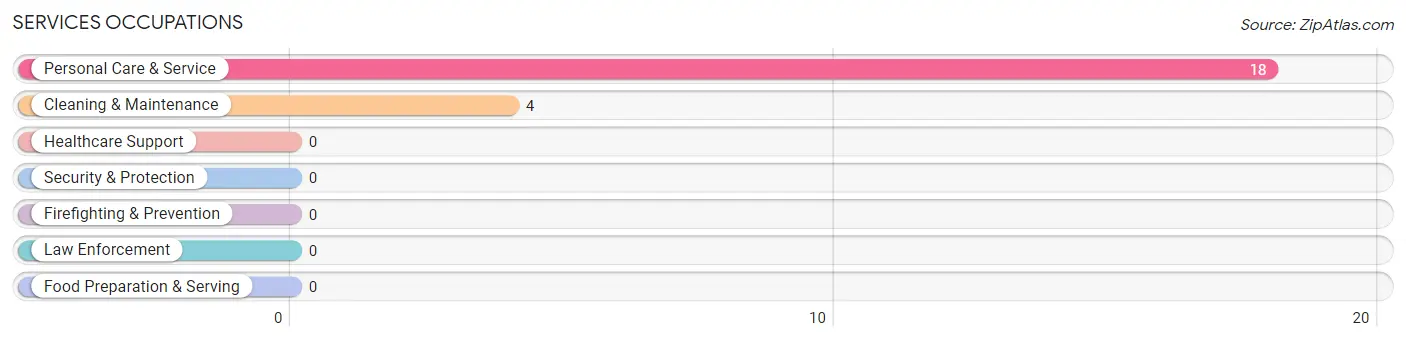
Services Occupations
The most common Services occupations in Rosburg are Personal Care & Service (18 | 10.3%), and Cleaning & Maintenance (4 | 2.3%).
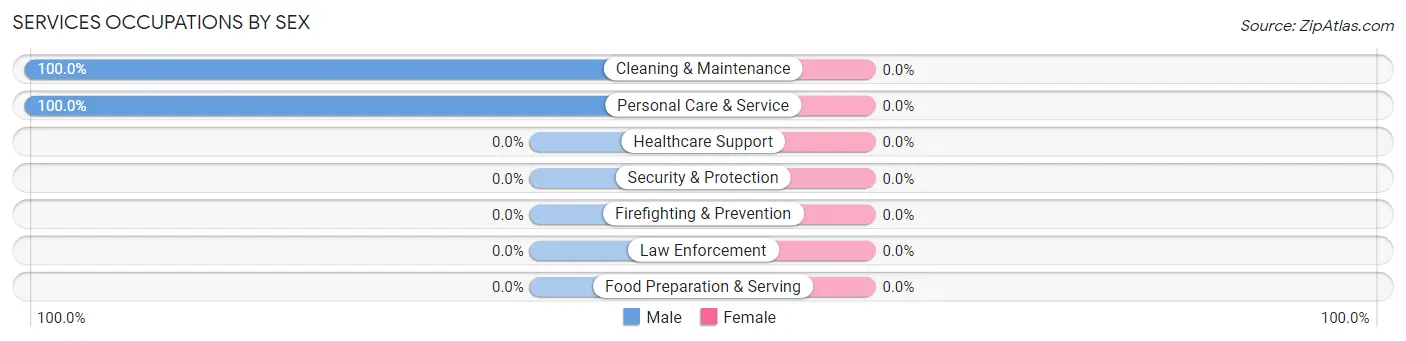
Services Occupations by Sex
| Occupation | Male | Female |
| Healthcare Support | 0 (0.0%) | 0 (0.0%) |
| Security & Protection | 0 (0.0%) | 0 (0.0%) |
| Firefighting & Prevention | 0 (0.0%) | 0 (0.0%) |
| Law Enforcement | 0 (0.0%) | 0 (0.0%) |
| Food Preparation & Serving | 0 (0.0%) | 0 (0.0%) |
| Cleaning & Maintenance | 4 (100.0%) | 0 (0.0%) |
| Personal Care & Service | 18 (100.0%) | 0 (0.0%) |
| Total (Category) | 22 (100.0%) | 0 (0.0%) |
| Total (Overall) | 106 (60.6%) | 69 (39.4%) |
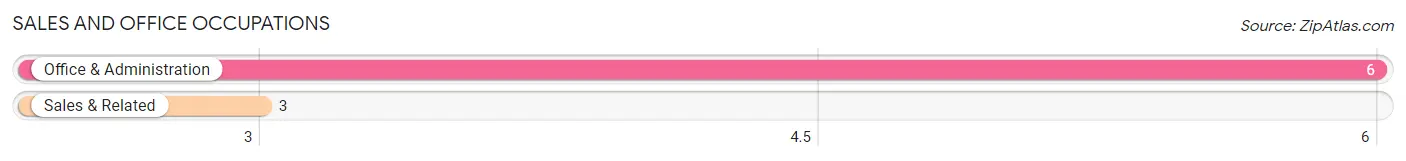
Sales and Office Occupations
The most common Sales and Office occupations in Rosburg are Office & Administration (6 | 3.4%), and Sales & Related (3 | 1.7%).
Sales and Office Occupations by Sex
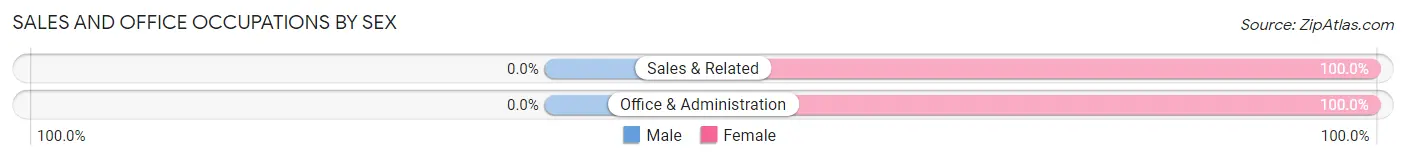
| Occupation | Male | Female |
| Sales & Related | 0 (0.0%) | 3 (100.0%) |
| Office & Administration | 0 (0.0%) | 6 (100.0%) |
| Total (Category) | 0 (0.0%) | 9 (100.0%) |
| Total (Overall) | 106 (60.6%) | 69 (39.4%) |
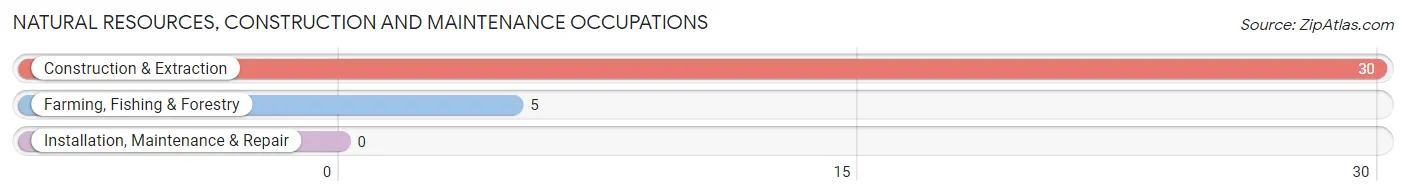
Natural Resources, Construction and Maintenance Occupations
The most common Natural Resources, Construction and Maintenance occupations in Rosburg are Construction & Extraction (30 | 17.1%), and Farming, Fishing & Forestry (5 | 2.9%).
Natural Resources, Construction and Maintenance Occupations by Sex
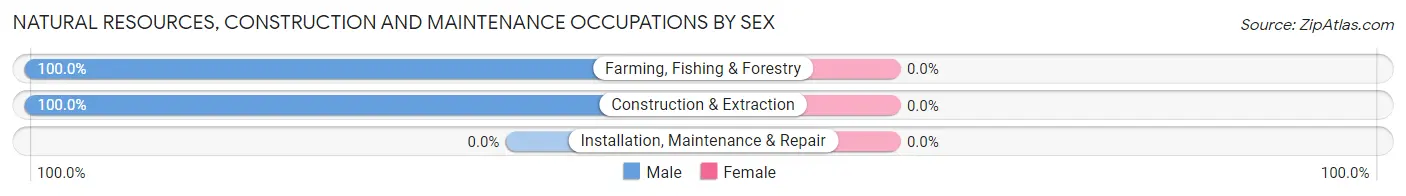
| Occupation | Male | Female |
| Farming, Fishing & Forestry | 5 (100.0%) | 0 (0.0%) |
| Construction & Extraction | 30 (100.0%) | 0 (0.0%) |
| Installation, Maintenance & Repair | 0 (0.0%) | 0 (0.0%) |
| Total (Category) | 35 (100.0%) | 0 (0.0%) |
| Total (Overall) | 106 (60.6%) | 69 (39.4%) |
Production, Transportation and Moving Occupations
The most common Production, Transportation and Moving occupations in Rosburg are Material Moving (77 | 44.0%), and Production (4 | 2.3%).
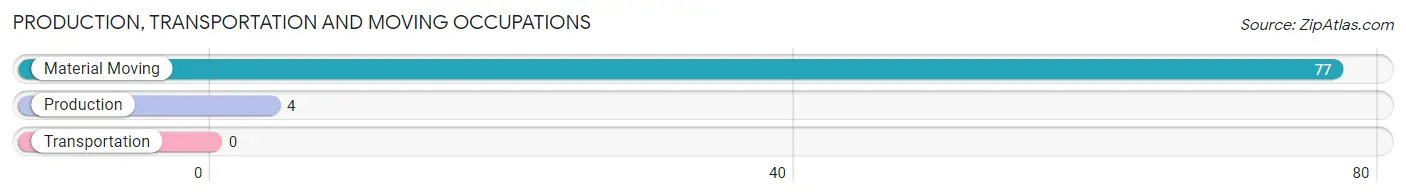
Production, Transportation and Moving Occupations by Sex
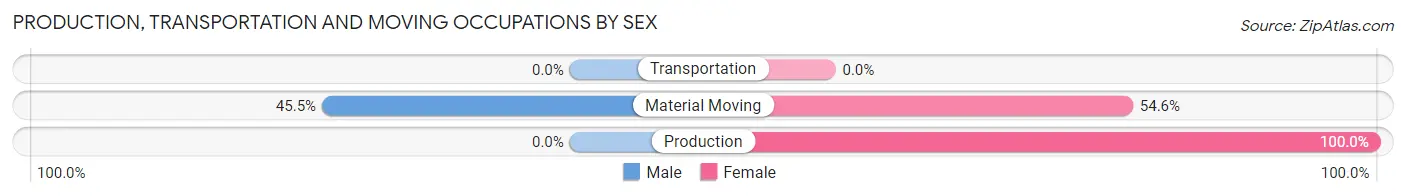
| Occupation | Male | Female |
| Production | 0 (0.0%) | 4 (100.0%) |
| Transportation | 0 (0.0%) | 0 (0.0%) |
| Material Moving | 35 (45.5%) | 42 (54.5%) |
| Total (Category) | 35 (43.2%) | 46 (56.8%) |
| Total (Overall) | 106 (60.6%) | 69 (39.4%) |
Employment Industries by Sex in Rosburg
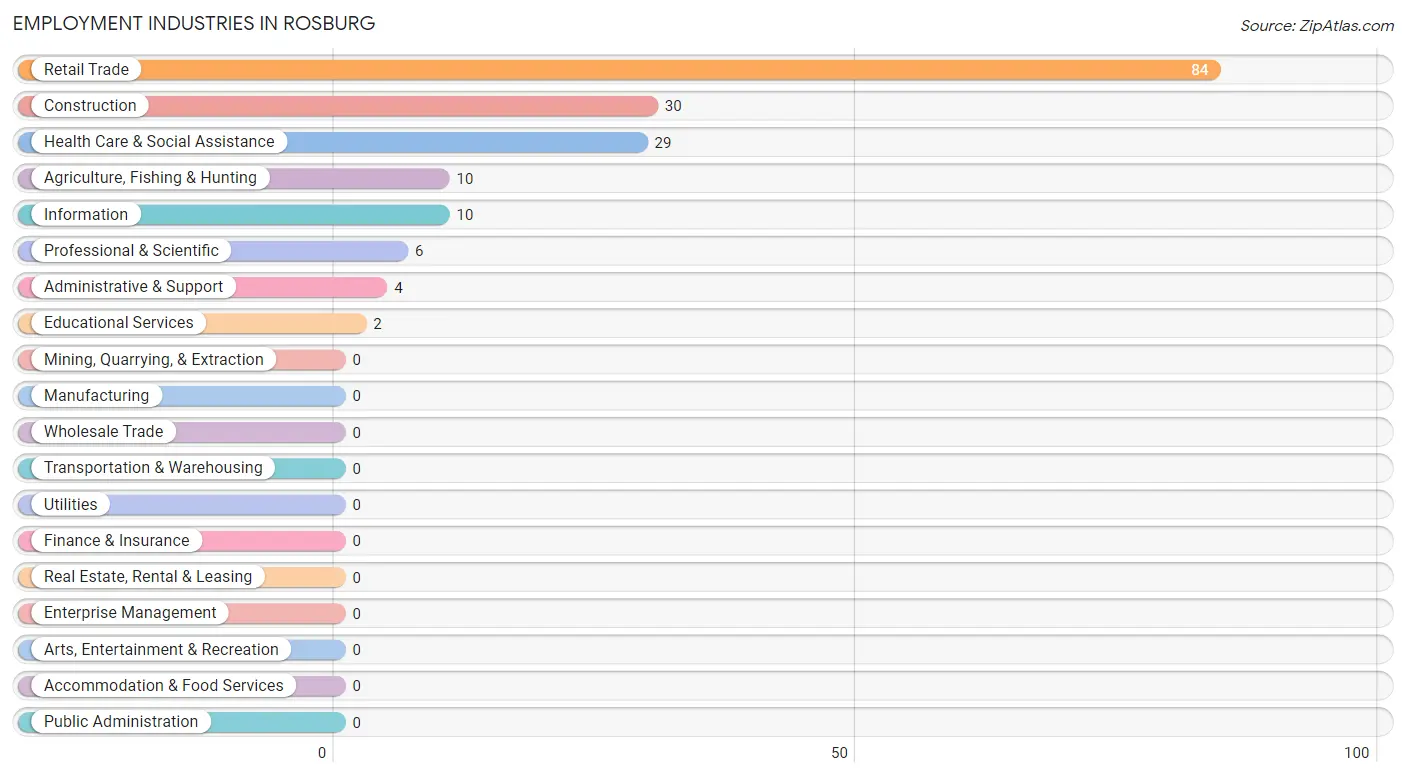
Employment Industries in Rosburg
The major employment industries in Rosburg include Retail Trade (84 | 48.0%), Construction (30 | 17.1%), Health Care & Social Assistance (29 | 16.6%), Agriculture, Fishing & Hunting (10 | 5.7%), and Information (10 | 5.7%).
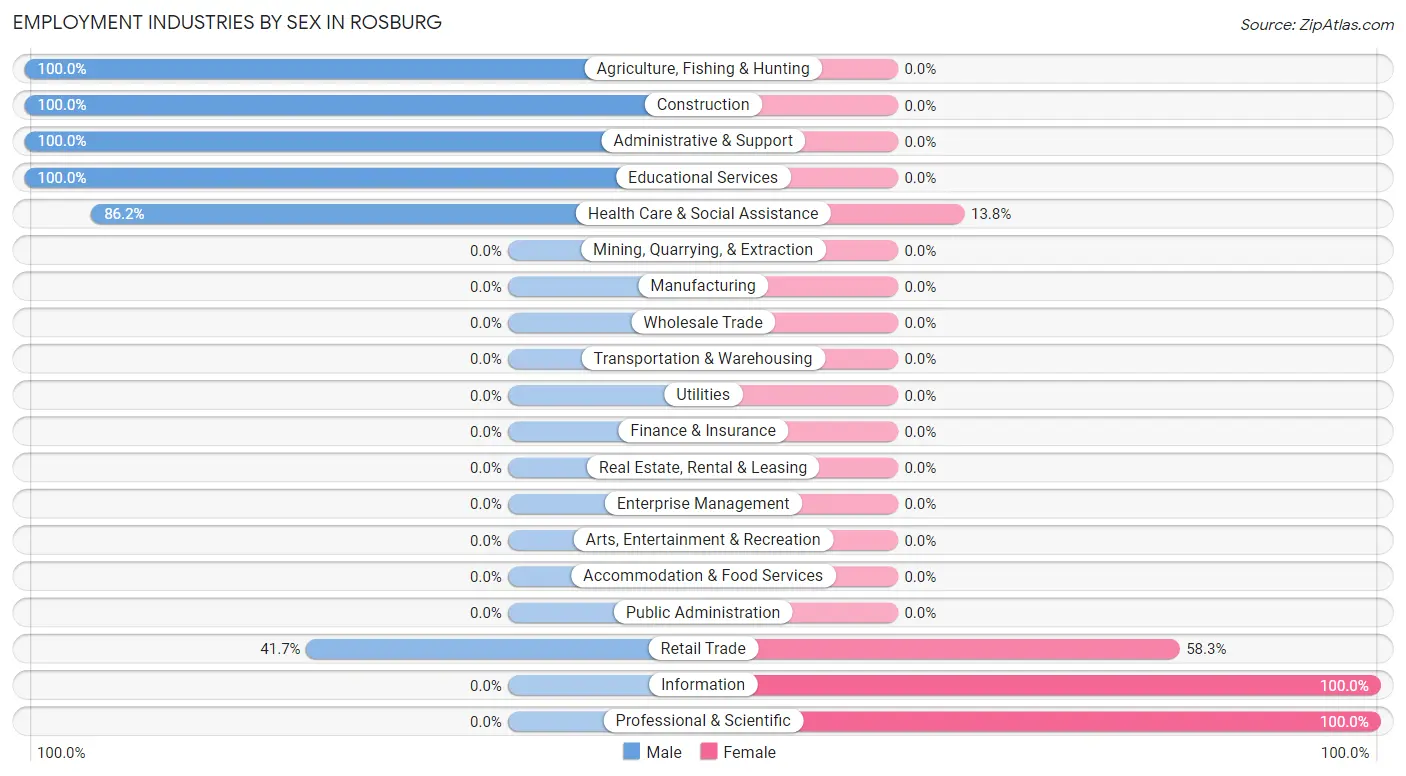
Employment Industries by Sex in Rosburg
The Rosburg industries that see more men than women are Agriculture, Fishing & Hunting (100.0%), Construction (100.0%), and Administrative & Support (100.0%), whereas the industries that tend to have a higher number of women are Information (100.0%), Professional & Scientific (100.0%), and Retail Trade (58.3%).
| Industry | Male | Female |
| Agriculture, Fishing & Hunting | 10 (100.0%) | 0 (0.0%) |
| Mining, Quarrying, & Extraction | 0 (0.0%) | 0 (0.0%) |
| Construction | 30 (100.0%) | 0 (0.0%) |
| Manufacturing | 0 (0.0%) | 0 (0.0%) |
| Wholesale Trade | 0 (0.0%) | 0 (0.0%) |
| Retail Trade | 35 (41.7%) | 49 (58.3%) |
| Transportation & Warehousing | 0 (0.0%) | 0 (0.0%) |
| Utilities | 0 (0.0%) | 0 (0.0%) |
| Information | 0 (0.0%) | 10 (100.0%) |
| Finance & Insurance | 0 (0.0%) | 0 (0.0%) |
| Real Estate, Rental & Leasing | 0 (0.0%) | 0 (0.0%) |
| Professional & Scientific | 0 (0.0%) | 6 (100.0%) |
| Enterprise Management | 0 (0.0%) | 0 (0.0%) |
| Administrative & Support | 4 (100.0%) | 0 (0.0%) |
| Educational Services | 2 (100.0%) | 0 (0.0%) |
| Health Care & Social Assistance | 25 (86.2%) | 4 (13.8%) |
| Arts, Entertainment & Recreation | 0 (0.0%) | 0 (0.0%) |
| Accommodation & Food Services | 0 (0.0%) | 0 (0.0%) |
| Public Administration | 0 (0.0%) | 0 (0.0%) |
| Total | 106 (60.6%) | 69 (39.4%) |
Education in Rosburg
School Enrollment in Rosburg
The most common levels of schooling among the 58 students in Rosburg are elementary school (32 | 55.2%), and middle school (26 | 44.8%).
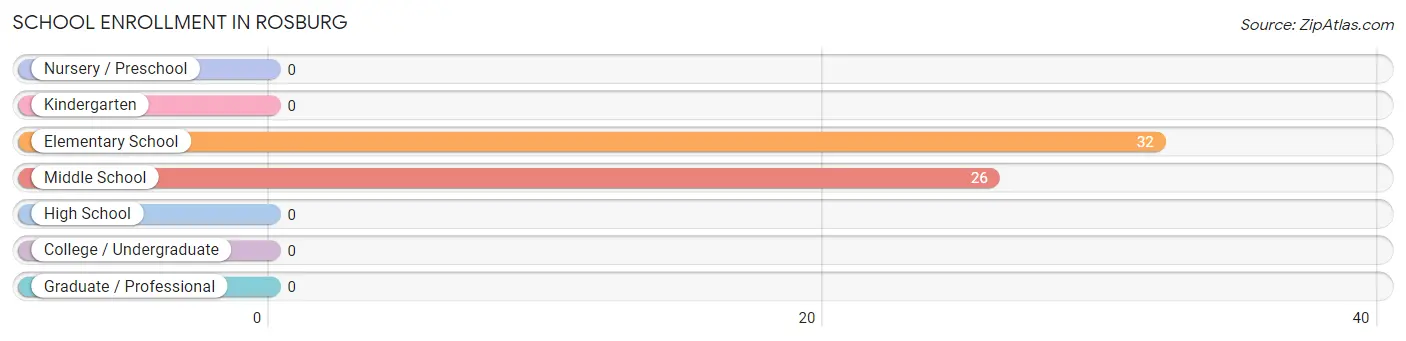
| School Level | # Students | % Students |
| Nursery / Preschool | 0 | 0.0% |
| Kindergarten | 0 | 0.0% |
| Elementary School | 32 | 55.2% |
| Middle School | 26 | 44.8% |
| High School | 0 | 0.0% |
| College / Undergraduate | 0 | 0.0% |
| Graduate / Professional | 0 | 0.0% |
| Total | 58 | 100.0% |
School Enrollment by Age by Funding Source in Rosburg
Out of a total of 58 students who are enrolled in schools in Rosburg, 9 (15.5%) attend a private institution, while the remaining 49 (84.5%) are enrolled in public schools. The age group of 10 to 14 year olds has the highest likelihood of being enrolled in private schools, with 7 (20.0% in the age bracket) enrolled. Conversely, the age group of 5 to 9 year old has the lowest likelihood of being enrolled in a private school, with 21 (91.3% in the age bracket) attending a public institution.
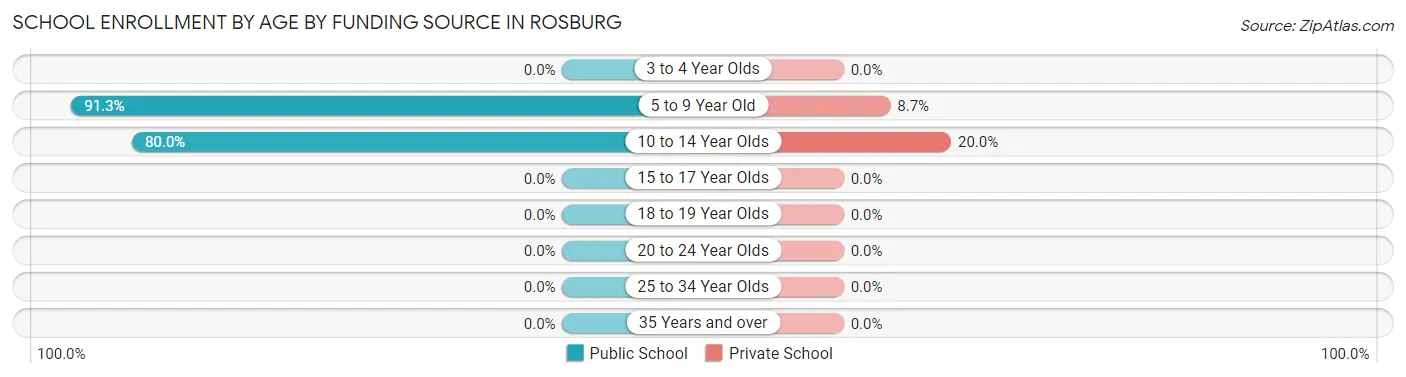
| Age Bracket | Public School | Private School |
| 3 to 4 Year Olds | 0 (0.0%) | 0 (0.0%) |
| 5 to 9 Year Old | 21 (91.3%) | 2 (8.7%) |
| 10 to 14 Year Olds | 28 (80.0%) | 7 (20.0%) |
| 15 to 17 Year Olds | 0 (0.0%) | 0 (0.0%) |
| 18 to 19 Year Olds | 0 (0.0%) | 0 (0.0%) |
| 20 to 24 Year Olds | 0 (0.0%) | 0 (0.0%) |
| 25 to 34 Year Olds | 0 (0.0%) | 0 (0.0%) |
| 35 Years and over | 0 (0.0%) | 0 (0.0%) |
| Total | 49 (84.5%) | 9 (15.5%) |
Educational Attainment by Field of Study in Rosburg
Education (18 | 31.6%), business (14 | 24.6%), arts & humanities (8 | 14.0%), science & technology (7 | 12.3%), and bio, nature & agricultural (5 | 8.8%) are the most common fields of study among 57 individuals in Rosburg who have obtained a bachelor's degree or higher.
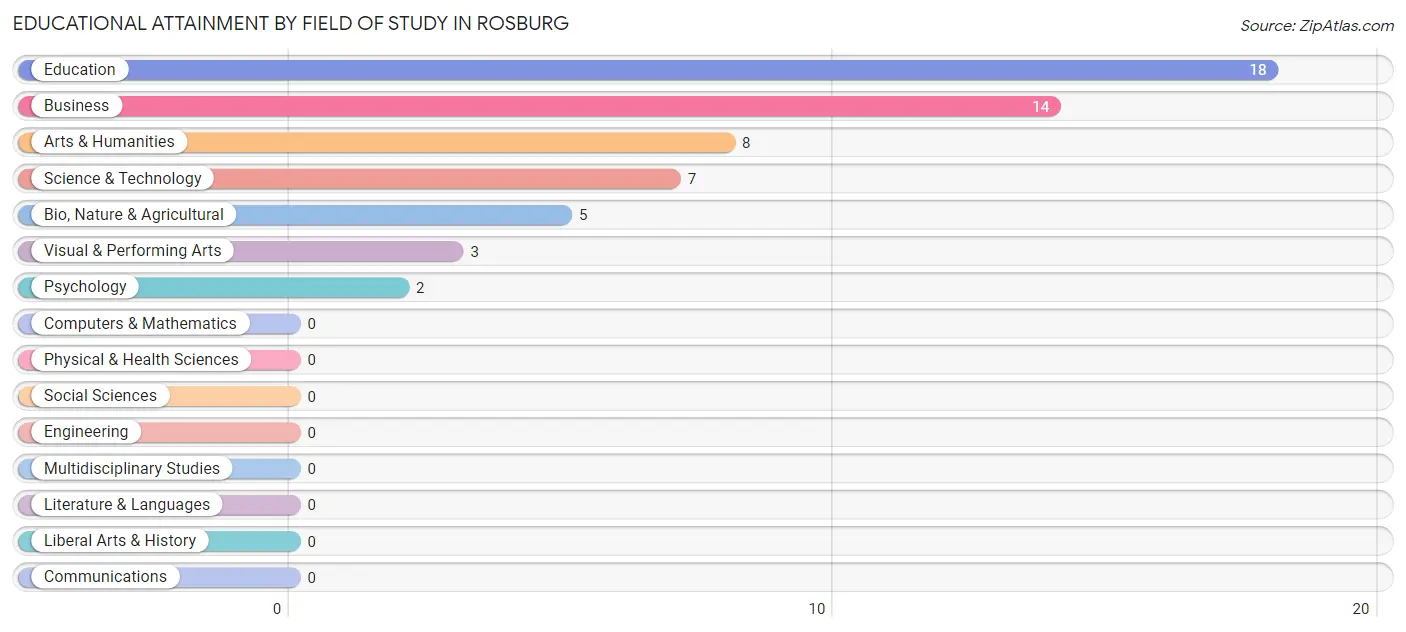
| Field of Study | # Graduates | % Graduates |
| Computers & Mathematics | 0 | 0.0% |
| Bio, Nature & Agricultural | 5 | 8.8% |
| Physical & Health Sciences | 0 | 0.0% |
| Psychology | 2 | 3.5% |
| Social Sciences | 0 | 0.0% |
| Engineering | 0 | 0.0% |
| Multidisciplinary Studies | 0 | 0.0% |
| Science & Technology | 7 | 12.3% |
| Business | 14 | 24.6% |
| Education | 18 | 31.6% |
| Literature & Languages | 0 | 0.0% |
| Liberal Arts & History | 0 | 0.0% |
| Visual & Performing Arts | 3 | 5.3% |
| Communications | 0 | 0.0% |
| Arts & Humanities | 8 | 14.0% |
| Total | 57 | 100.0% |
Transportation & Commute in Rosburg
Vehicle Availability by Sex in Rosburg
The most prevalent vehicle ownership categories in Rosburg are males with 3 vehicles (72, accounting for 67.9%) and females with 3 vehicles (60, making up 104.4%).
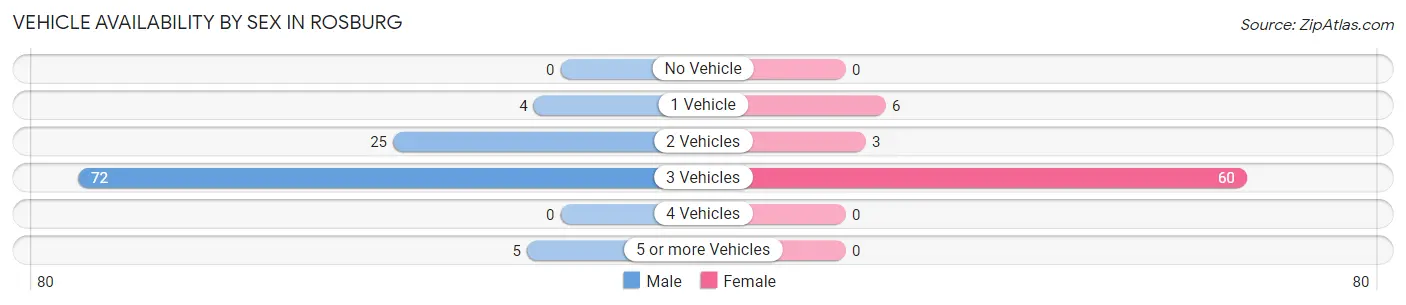
| Vehicles Available | Male | Female |
| No Vehicle | 0 (0.0%) | 0 (0.0%) |
| 1 Vehicle | 4 (3.8%) | 6 (8.7%) |
| 2 Vehicles | 25 (23.6%) | 3 (4.3%) |
| 3 Vehicles | 72 (67.9%) | 60 (87.0%) |
| 4 Vehicles | 0 (0.0%) | 0 (0.0%) |
| 5 or more Vehicles | 5 (4.7%) | 0 (0.0%) |
| Total | 106 (100.0%) | 69 (100.0%) |
Commute Time in Rosburg
The most frequently occuring commute durations in Rosburg are 45 to 59 minutes (88 commuters, 50.3%), less than 5 minutes (30 commuters, 17.1%), and 90 or more minutes (22 commuters, 12.6%).
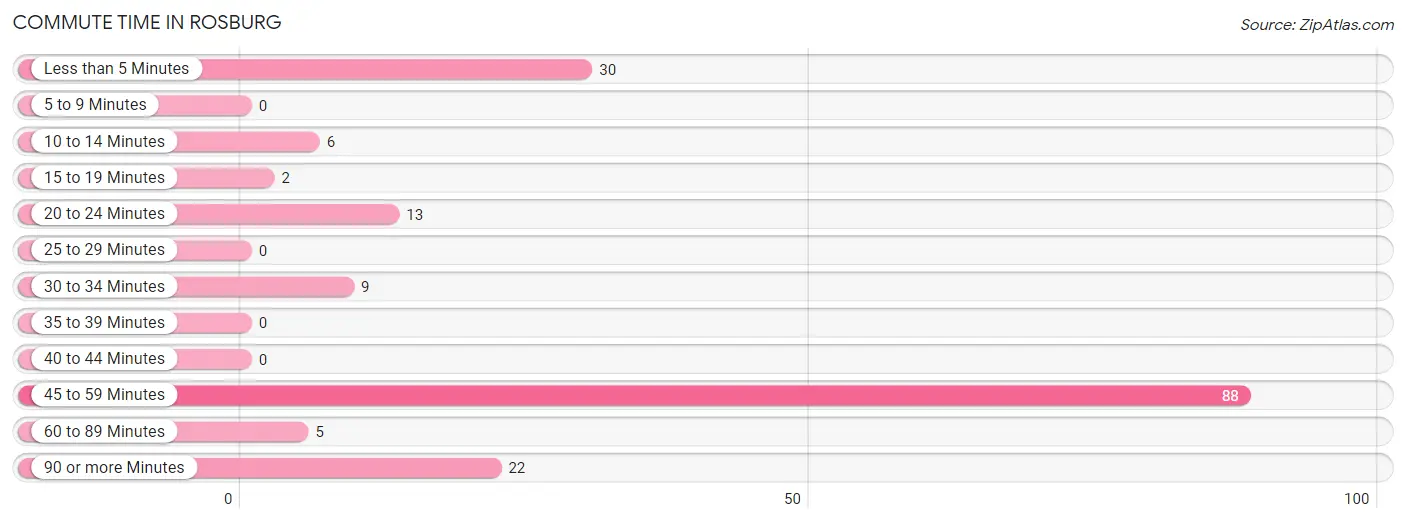
| Commute Time | # Commuters | % Commuters |
| Less than 5 Minutes | 30 | 17.1% |
| 5 to 9 Minutes | 0 | 0.0% |
| 10 to 14 Minutes | 6 | 3.4% |
| 15 to 19 Minutes | 2 | 1.1% |
| 20 to 24 Minutes | 13 | 7.4% |
| 25 to 29 Minutes | 0 | 0.0% |
| 30 to 34 Minutes | 9 | 5.1% |
| 35 to 39 Minutes | 0 | 0.0% |
| 40 to 44 Minutes | 0 | 0.0% |
| 45 to 59 Minutes | 88 | 50.3% |
| 60 to 89 Minutes | 5 | 2.9% |
| 90 or more Minutes | 22 | 12.6% |
Commute Time by Sex in Rosburg
The most common commute times in Rosburg are 45 to 59 minutes (42 commuters, 39.6%) for males and 45 to 59 minutes (46 commuters, 66.7%) for females.
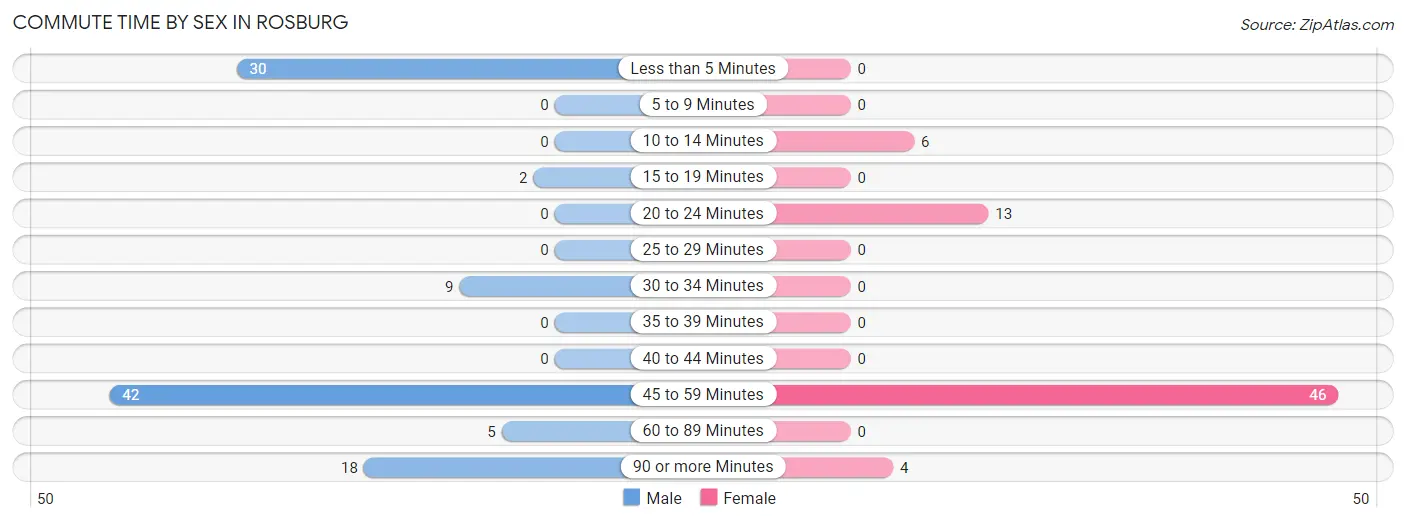
| Commute Time | Male | Female |
| Less than 5 Minutes | 30 (28.3%) | 0 (0.0%) |
| 5 to 9 Minutes | 0 (0.0%) | 0 (0.0%) |
| 10 to 14 Minutes | 0 (0.0%) | 6 (8.7%) |
| 15 to 19 Minutes | 2 (1.9%) | 0 (0.0%) |
| 20 to 24 Minutes | 0 (0.0%) | 13 (18.8%) |
| 25 to 29 Minutes | 0 (0.0%) | 0 (0.0%) |
| 30 to 34 Minutes | 9 (8.5%) | 0 (0.0%) |
| 35 to 39 Minutes | 0 (0.0%) | 0 (0.0%) |
| 40 to 44 Minutes | 0 (0.0%) | 0 (0.0%) |
| 45 to 59 Minutes | 42 (39.6%) | 46 (66.7%) |
| 60 to 89 Minutes | 5 (4.7%) | 0 (0.0%) |
| 90 or more Minutes | 18 (17.0%) | 4 (5.8%) |
Time of Departure to Work by Sex in Rosburg
The most frequent times of departure to work in Rosburg are 6:30 AM to 6:59 AM (35, 33.0%) for males and 6:30 AM to 6:59 AM (46, 66.7%) for females.
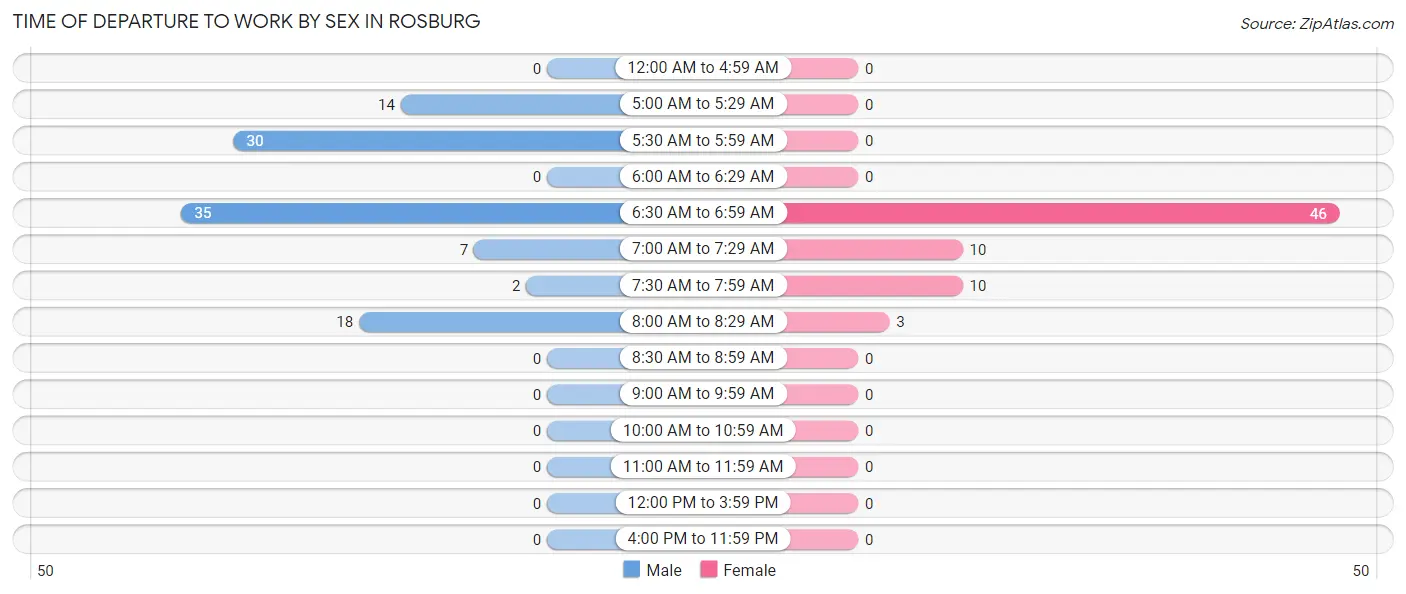
| Time of Departure | Male | Female |
| 12:00 AM to 4:59 AM | 0 (0.0%) | 0 (0.0%) |
| 5:00 AM to 5:29 AM | 14 (13.2%) | 0 (0.0%) |
| 5:30 AM to 5:59 AM | 30 (28.3%) | 0 (0.0%) |
| 6:00 AM to 6:29 AM | 0 (0.0%) | 0 (0.0%) |
| 6:30 AM to 6:59 AM | 35 (33.0%) | 46 (66.7%) |
| 7:00 AM to 7:29 AM | 7 (6.6%) | 10 (14.5%) |
| 7:30 AM to 7:59 AM | 2 (1.9%) | 10 (14.5%) |
| 8:00 AM to 8:29 AM | 18 (17.0%) | 3 (4.3%) |
| 8:30 AM to 8:59 AM | 0 (0.0%) | 0 (0.0%) |
| 9:00 AM to 9:59 AM | 0 (0.0%) | 0 (0.0%) |
| 10:00 AM to 10:59 AM | 0 (0.0%) | 0 (0.0%) |
| 11:00 AM to 11:59 AM | 0 (0.0%) | 0 (0.0%) |
| 12:00 PM to 3:59 PM | 0 (0.0%) | 0 (0.0%) |
| 4:00 PM to 11:59 PM | 0 (0.0%) | 0 (0.0%) |
| Total | 106 (100.0%) | 69 (100.0%) |
Housing Occupancy in Rosburg
Occupancy by Ownership in Rosburg
Of the total 161 dwellings in Rosburg, owner-occupied units account for 115 (71.4%), while renter-occupied units make up 46 (28.6%).
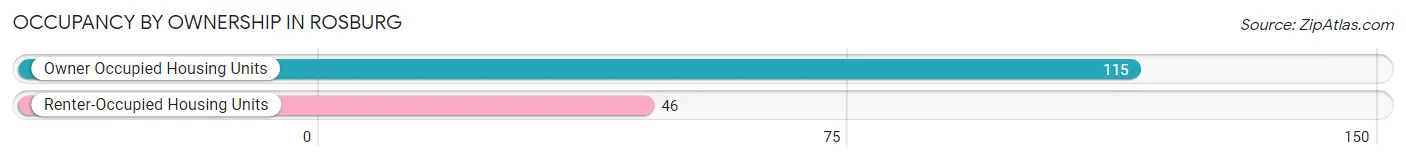
| Occupancy | # Housing Units | % Housing Units |
| Owner Occupied Housing Units | 115 | 71.4% |
| Renter-Occupied Housing Units | 46 | 28.6% |
| Total Occupied Housing Units | 161 | 100.0% |
Occupancy by Household Size in Rosburg
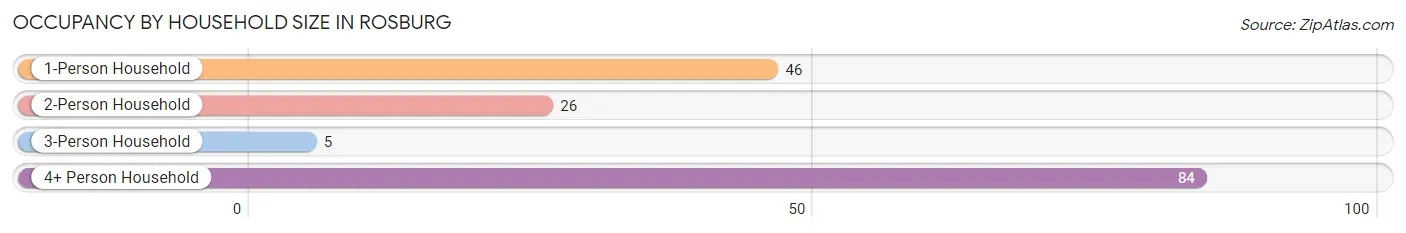
| Household Size | # Housing Units | % Housing Units |
| 1-Person Household | 46 | 28.6% |
| 2-Person Household | 26 | 16.2% |
| 3-Person Household | 5 | 3.1% |
| 4+ Person Household | 84 | 52.2% |
| Total Housing Units | 161 | 100.0% |
Occupancy by Ownership by Household Size in Rosburg
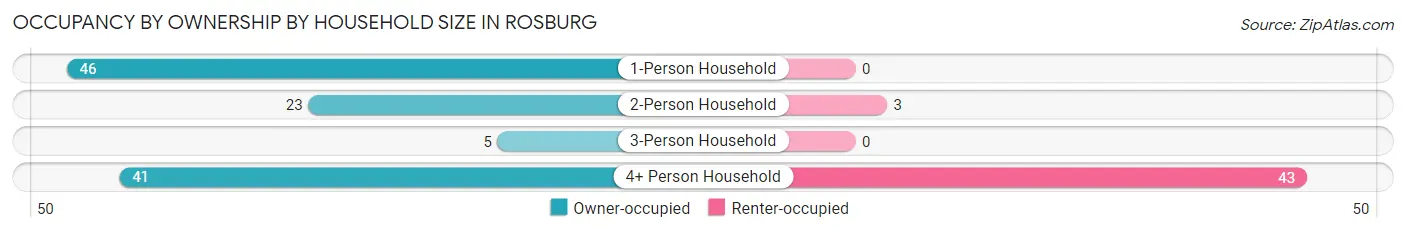
| Household Size | Owner-occupied | Renter-occupied |
| 1-Person Household | 46 (100.0%) | 0 (0.0%) |
| 2-Person Household | 23 (88.5%) | 3 (11.5%) |
| 3-Person Household | 5 (100.0%) | 0 (0.0%) |
| 4+ Person Household | 41 (48.8%) | 43 (51.2%) |
| Total Housing Units | 115 (71.4%) | 46 (28.6%) |
Occupancy by Educational Attainment in Rosburg
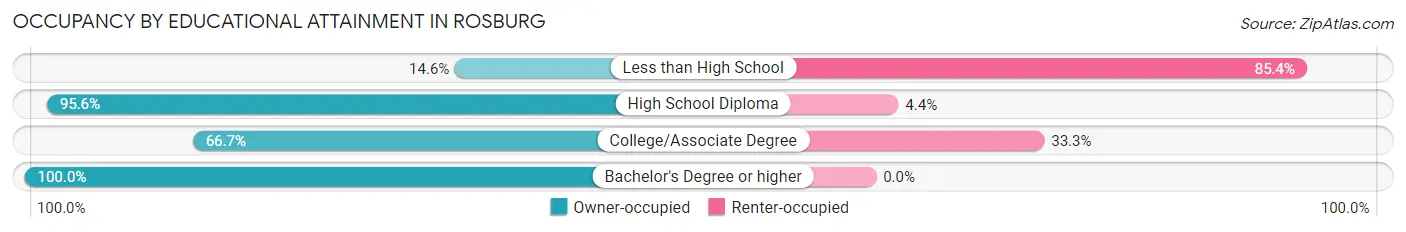
| Household Size | Owner-occupied | Renter-occupied |
| Less than High School | 6 (14.6%) | 35 (85.4%) |
| High School Diploma | 65 (95.6%) | 3 (4.4%) |
| College/Associate Degree | 16 (66.7%) | 8 (33.3%) |
| Bachelor's Degree or higher | 28 (100.0%) | 0 (0.0%) |
Occupancy by Age of Householder in Rosburg
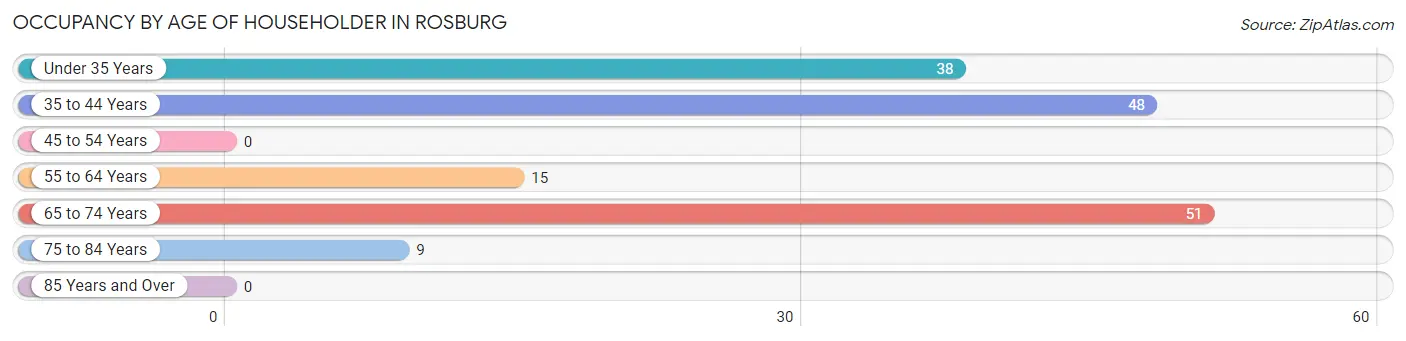
| Age Bracket | # Households | % Households |
| Under 35 Years | 38 | 23.6% |
| 35 to 44 Years | 48 | 29.8% |
| 45 to 54 Years | 0 | 0.0% |
| 55 to 64 Years | 15 | 9.3% |
| 65 to 74 Years | 51 | 31.7% |
| 75 to 84 Years | 9 | 5.6% |
| 85 Years and Over | 0 | 0.0% |
| Total | 161 | 100.0% |
Housing Finances in Rosburg
Median Income by Occupancy in Rosburg
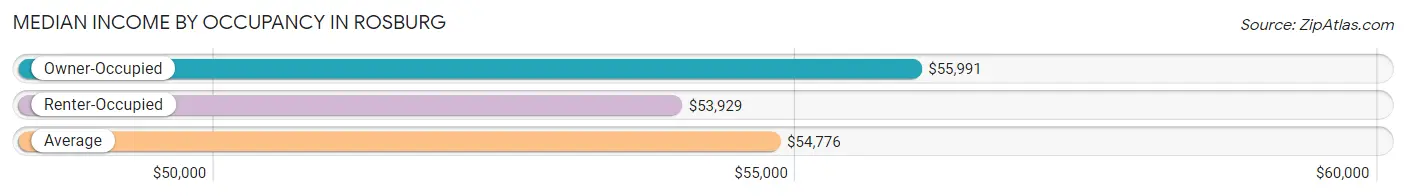
| Occupancy Type | # Households | Median Income |
| Owner-Occupied | 115 (71.4%) | $55,991 |
| Renter-Occupied | 46 (28.6%) | $53,929 |
| Average | 161 (100.0%) | $54,776 |
Occupancy by Householder Income Bracket in Rosburg
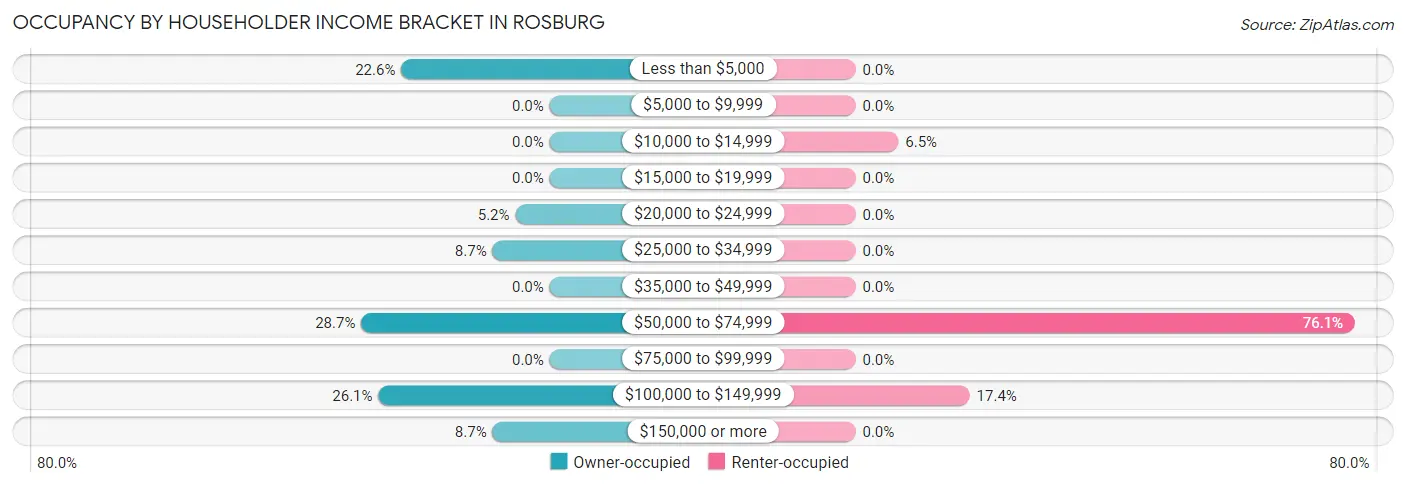
| Income Bracket | Owner-occupied | Renter-occupied |
| Less than $5,000 | 26 (22.6%) | 0 (0.0%) |
| $5,000 to $9,999 | 0 (0.0%) | 0 (0.0%) |
| $10,000 to $14,999 | 0 (0.0%) | 3 (6.5%) |
| $15,000 to $19,999 | 0 (0.0%) | 0 (0.0%) |
| $20,000 to $24,999 | 6 (5.2%) | 0 (0.0%) |
| $25,000 to $34,999 | 10 (8.7%) | 0 (0.0%) |
| $35,000 to $49,999 | 0 (0.0%) | 0 (0.0%) |
| $50,000 to $74,999 | 33 (28.7%) | 35 (76.1%) |
| $75,000 to $99,999 | 0 (0.0%) | 0 (0.0%) |
| $100,000 to $149,999 | 30 (26.1%) | 8 (17.4%) |
| $150,000 or more | 10 (8.7%) | 0 (0.0%) |
| Total | 115 (100.0%) | 46 (100.0%) |
Monthly Housing Cost Tiers in Rosburg
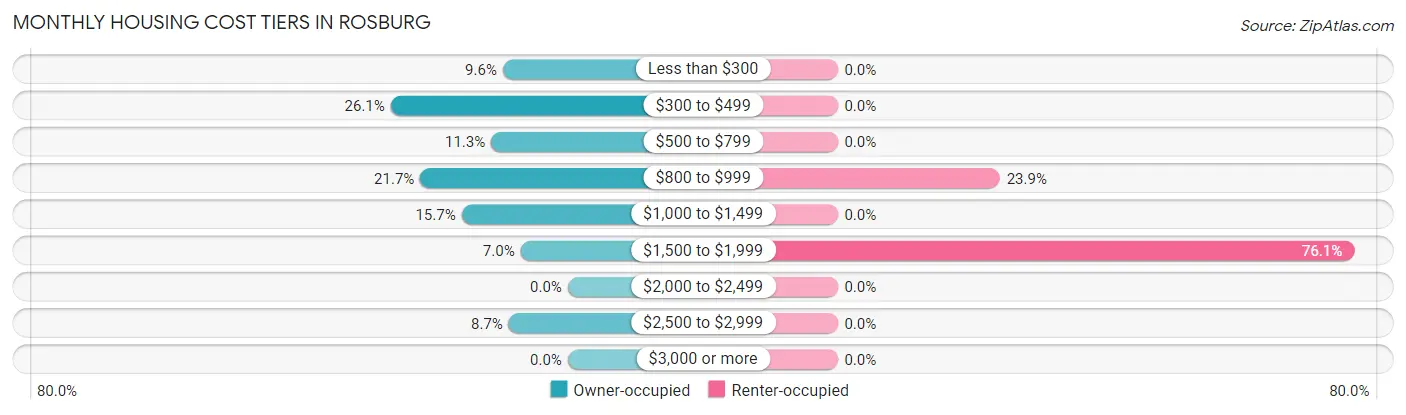
| Monthly Cost | Owner-occupied | Renter-occupied |
| Less than $300 | 11 (9.6%) | 0 (0.0%) |
| $300 to $499 | 30 (26.1%) | 0 (0.0%) |
| $500 to $799 | 13 (11.3%) | 0 (0.0%) |
| $800 to $999 | 25 (21.7%) | 11 (23.9%) |
| $1,000 to $1,499 | 18 (15.7%) | 0 (0.0%) |
| $1,500 to $1,999 | 8 (7.0%) | 35 (76.1%) |
| $2,000 to $2,499 | 0 (0.0%) | 0 (0.0%) |
| $2,500 to $2,999 | 10 (8.7%) | 0 (0.0%) |
| $3,000 or more | 0 (0.0%) | 0 (0.0%) |
| Total | 115 (100.0%) | 46 (100.0%) |
Physical Housing Characteristics in Rosburg
Housing Structures in Rosburg
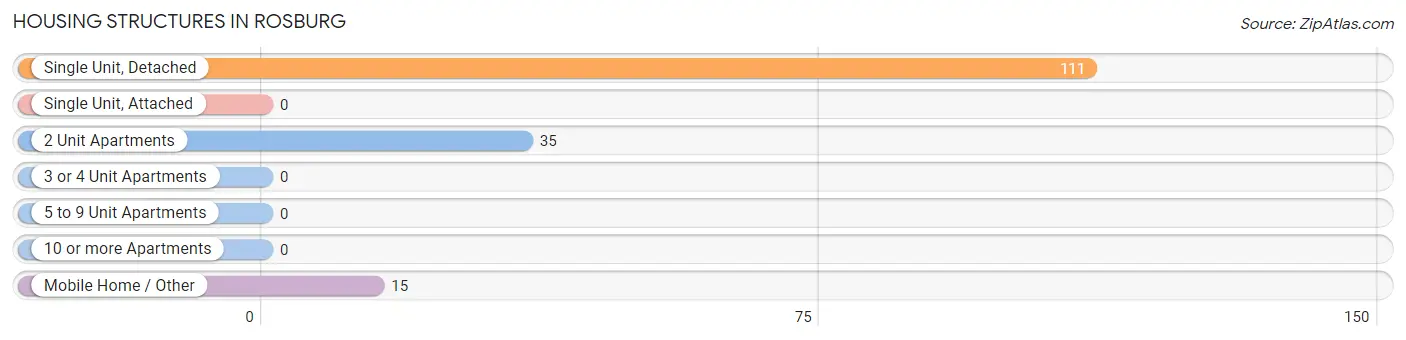
| Structure Type | # Housing Units | % Housing Units |
| Single Unit, Detached | 111 | 68.9% |
| Single Unit, Attached | 0 | 0.0% |
| 2 Unit Apartments | 35 | 21.7% |
| 3 or 4 Unit Apartments | 0 | 0.0% |
| 5 to 9 Unit Apartments | 0 | 0.0% |
| 10 or more Apartments | 0 | 0.0% |
| Mobile Home / Other | 15 | 9.3% |
| Total | 161 | 100.0% |
Housing Structures by Occupancy in Rosburg
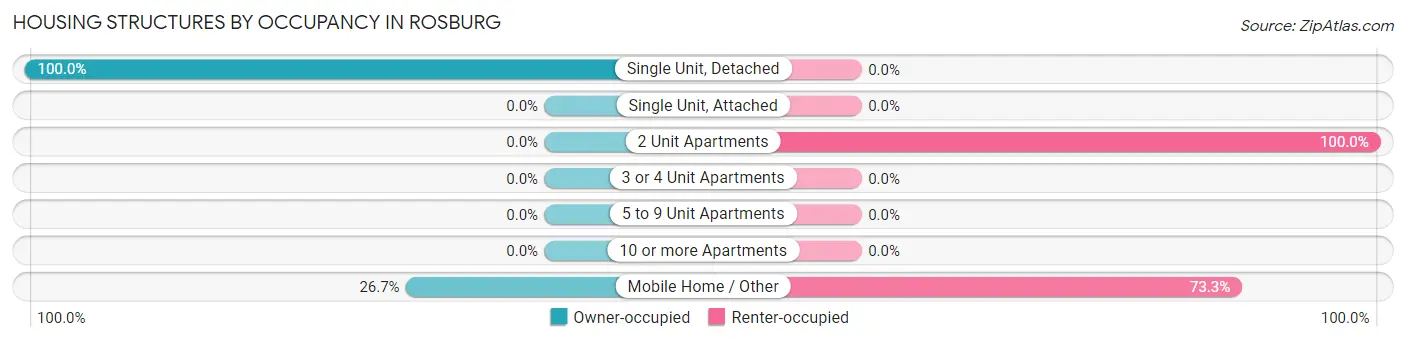
| Structure Type | Owner-occupied | Renter-occupied |
| Single Unit, Detached | 111 (100.0%) | 0 (0.0%) |
| Single Unit, Attached | 0 (0.0%) | 0 (0.0%) |
| 2 Unit Apartments | 0 (0.0%) | 35 (100.0%) |
| 3 or 4 Unit Apartments | 0 (0.0%) | 0 (0.0%) |
| 5 to 9 Unit Apartments | 0 (0.0%) | 0 (0.0%) |
| 10 or more Apartments | 0 (0.0%) | 0 (0.0%) |
| Mobile Home / Other | 4 (26.7%) | 11 (73.3%) |
| Total | 115 (71.4%) | 46 (28.6%) |
Housing Structures by Number of Rooms in Rosburg
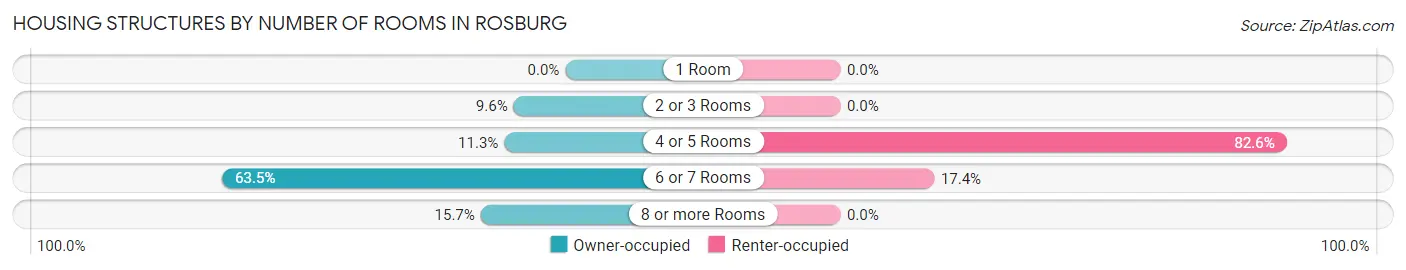
| Number of Rooms | Owner-occupied | Renter-occupied |
| 1 Room | 0 (0.0%) | 0 (0.0%) |
| 2 or 3 Rooms | 11 (9.6%) | 0 (0.0%) |
| 4 or 5 Rooms | 13 (11.3%) | 38 (82.6%) |
| 6 or 7 Rooms | 73 (63.5%) | 8 (17.4%) |
| 8 or more Rooms | 18 (15.7%) | 0 (0.0%) |
| Total | 115 (100.0%) | 46 (100.0%) |
Housing Structure by Heating Type in Rosburg
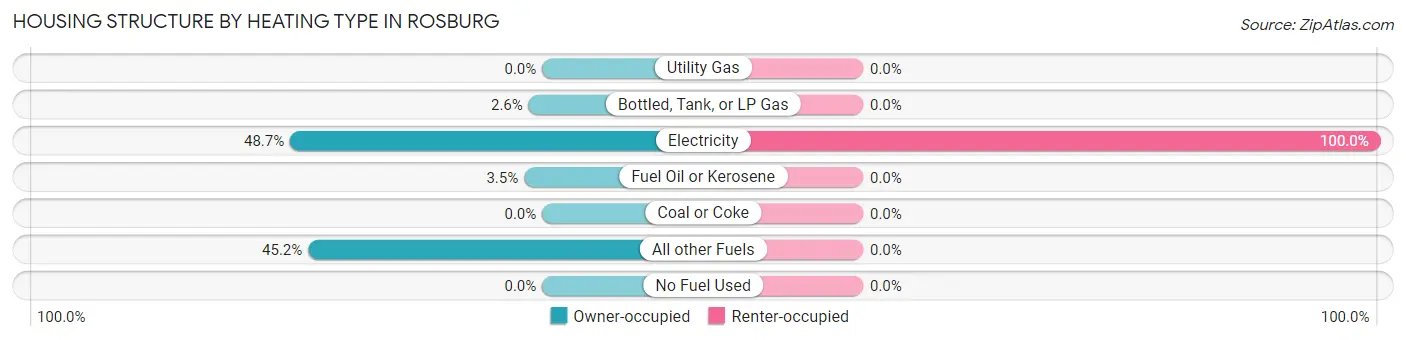
| Heating Type | Owner-occupied | Renter-occupied |
| Utility Gas | 0 (0.0%) | 0 (0.0%) |
| Bottled, Tank, or LP Gas | 3 (2.6%) | 0 (0.0%) |
| Electricity | 56 (48.7%) | 46 (100.0%) |
| Fuel Oil or Kerosene | 4 (3.5%) | 0 (0.0%) |
| Coal or Coke | 0 (0.0%) | 0 (0.0%) |
| All other Fuels | 52 (45.2%) | 0 (0.0%) |
| No Fuel Used | 0 (0.0%) | 0 (0.0%) |
| Total | 115 (100.0%) | 46 (100.0%) |
Household Vehicle Usage in Rosburg
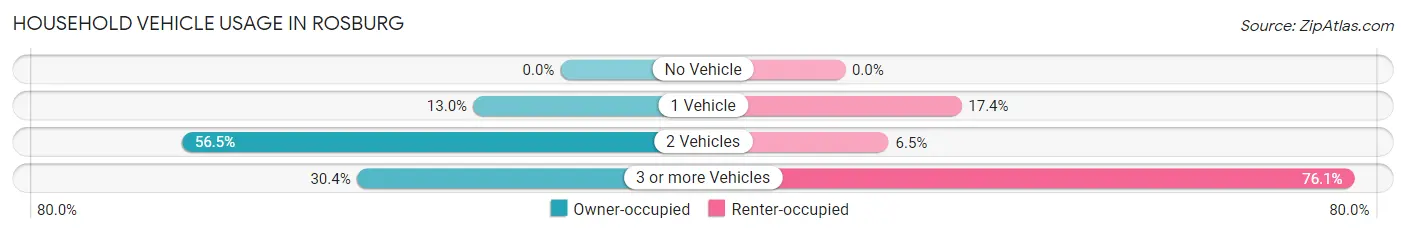
| Vehicles per Household | Owner-occupied | Renter-occupied |
| No Vehicle | 0 (0.0%) | 0 (0.0%) |
| 1 Vehicle | 15 (13.0%) | 8 (17.4%) |
| 2 Vehicles | 65 (56.5%) | 3 (6.5%) |
| 3 or more Vehicles | 35 (30.4%) | 35 (76.1%) |
| Total | 115 (100.0%) | 46 (100.0%) |
Real Estate & Mortgages in Rosburg
Real Estate and Mortgage Overview in Rosburg
| Characteristic | Without Mortgage | With Mortgage |
| Housing Units | 79 | 36 |
| Median Property Value | $212,100 | $243,300 |
| Median Household Income | $55,647 | $0 |
| Monthly Housing Costs | - | - |
| Real Estate Taxes | $1,043 | $0 |
Property Value by Mortgage Status in Rosburg
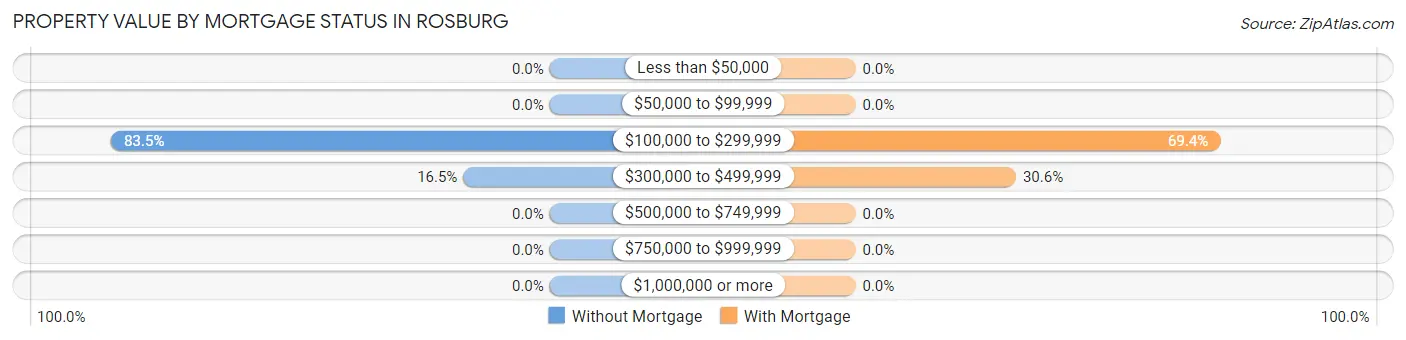
| Property Value | Without Mortgage | With Mortgage |
| Less than $50,000 | 0 (0.0%) | 0 (0.0%) |
| $50,000 to $99,999 | 0 (0.0%) | 0 (0.0%) |
| $100,000 to $299,999 | 66 (83.5%) | 25 (69.4%) |
| $300,000 to $499,999 | 13 (16.5%) | 11 (30.6%) |
| $500,000 to $749,999 | 0 (0.0%) | 0 (0.0%) |
| $750,000 to $999,999 | 0 (0.0%) | 0 (0.0%) |
| $1,000,000 or more | 0 (0.0%) | 0 (0.0%) |
| Total | 79 (100.0%) | 36 (100.0%) |
Household Income by Mortgage Status in Rosburg
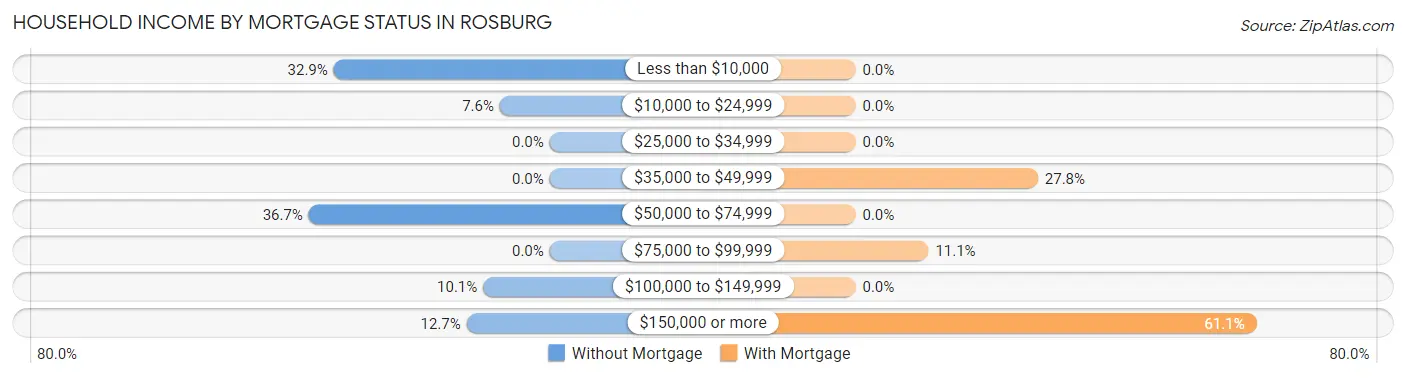
| Household Income | Without Mortgage | With Mortgage |
| Less than $10,000 | 26 (32.9%) | 0 (0.0%) |
| $10,000 to $24,999 | 6 (7.6%) | 0 (0.0%) |
| $25,000 to $34,999 | 0 (0.0%) | 0 (0.0%) |
| $35,000 to $49,999 | 0 (0.0%) | 10 (27.8%) |
| $50,000 to $74,999 | 29 (36.7%) | 0 (0.0%) |
| $75,000 to $99,999 | 0 (0.0%) | 4 (11.1%) |
| $100,000 to $149,999 | 8 (10.1%) | 0 (0.0%) |
| $150,000 or more | 10 (12.7%) | 22 (61.1%) |
| Total | 79 (100.0%) | 36 (100.0%) |
Property Value to Household Income Ratio in Rosburg
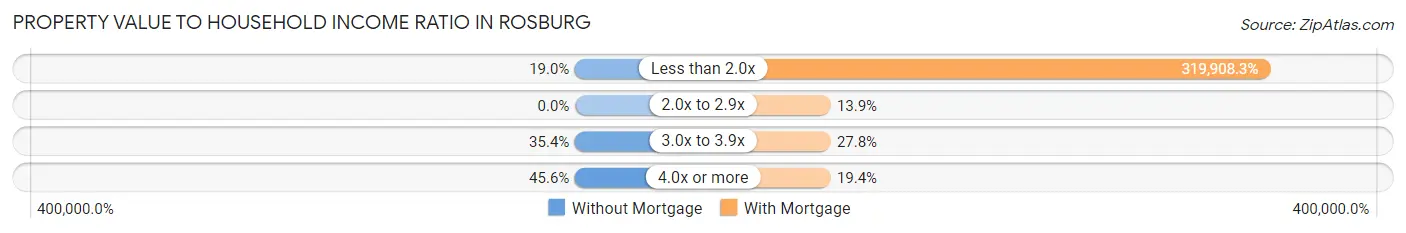
| Value-to-Income Ratio | Without Mortgage | With Mortgage |
| Less than 2.0x | 15 (19.0%) | 115,167 (319,908.3%) |
| 2.0x to 2.9x | 0 (0.0%) | 5 (13.9%) |
| 3.0x to 3.9x | 28 (35.4%) | 10 (27.8%) |
| 4.0x or more | 36 (45.6%) | 7 (19.4%) |
| Total | 79 (100.0%) | 36 (100.0%) |
Real Estate Taxes by Mortgage Status in Rosburg
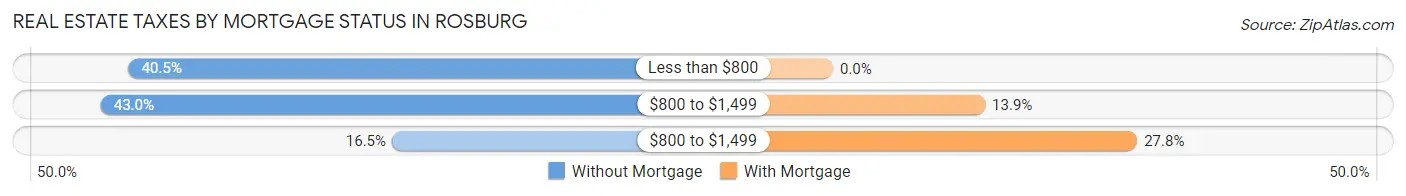
| Property Taxes | Without Mortgage | With Mortgage |
| Less than $800 | 32 (40.5%) | 0 (0.0%) |
| $800 to $1,499 | 34 (43.0%) | 5 (13.9%) |
| $800 to $1,499 | 13 (16.5%) | 10 (27.8%) |
| Total | 79 (100.0%) | 36 (100.0%) |
Health & Disability in Rosburg
Health Insurance Coverage by Age in Rosburg
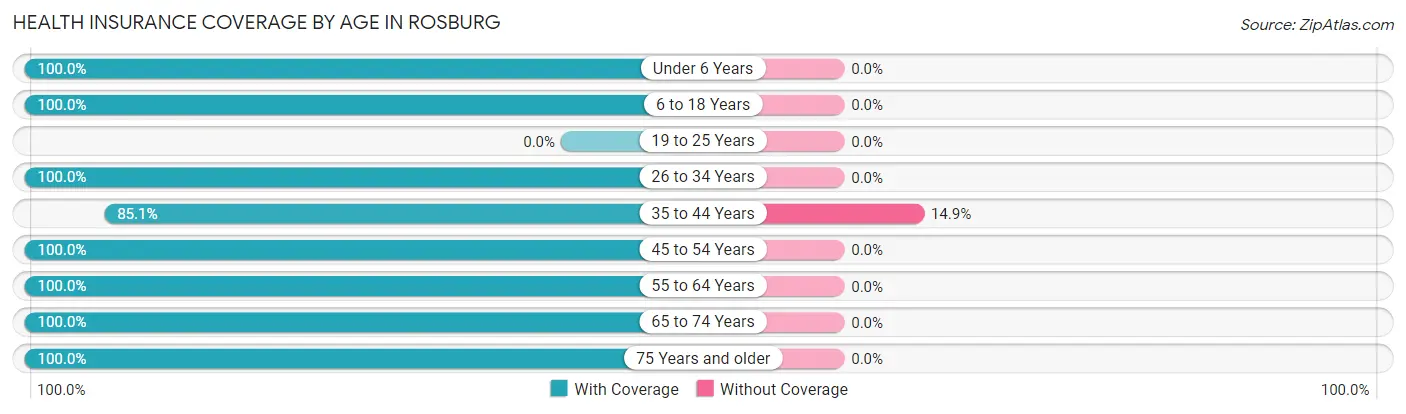
| Age Bracket | With Coverage | Without Coverage |
| Under 6 Years | 66 (100.0%) | 0 (0.0%) |
| 6 to 18 Years | 58 (100.0%) | 0 (0.0%) |
| 19 to 25 Years | 0 (0.0%) | 0 (0.0%) |
| 26 to 34 Years | 84 (100.0%) | 0 (0.0%) |
| 35 to 44 Years | 63 (85.1%) | 11 (14.9%) |
| 45 to 54 Years | 23 (100.0%) | 0 (0.0%) |
| 55 to 64 Years | 45 (100.0%) | 0 (0.0%) |
| 65 to 74 Years | 62 (100.0%) | 0 (0.0%) |
| 75 Years and older | 17 (100.0%) | 0 (0.0%) |
| Total | 418 (97.4%) | 11 (2.6%) |
Health Insurance Coverage by Citizenship Status in Rosburg
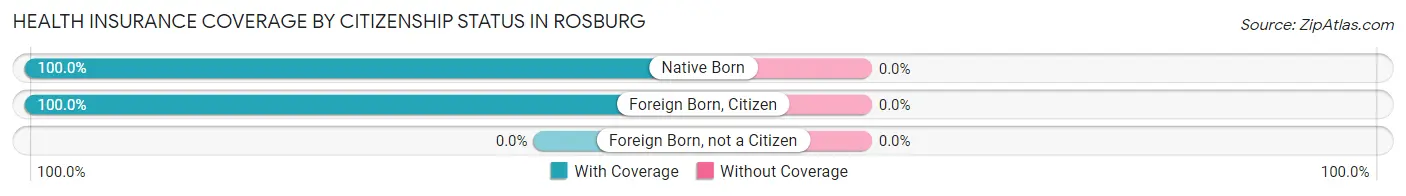
| Citizenship Status | With Coverage | Without Coverage |
| Native Born | 66 (100.0%) | 0 (0.0%) |
| Foreign Born, Citizen | 58 (100.0%) | 0 (0.0%) |
| Foreign Born, not a Citizen | 0 (0.0%) | 0 (0.0%) |
Health Insurance Coverage by Household Income in Rosburg
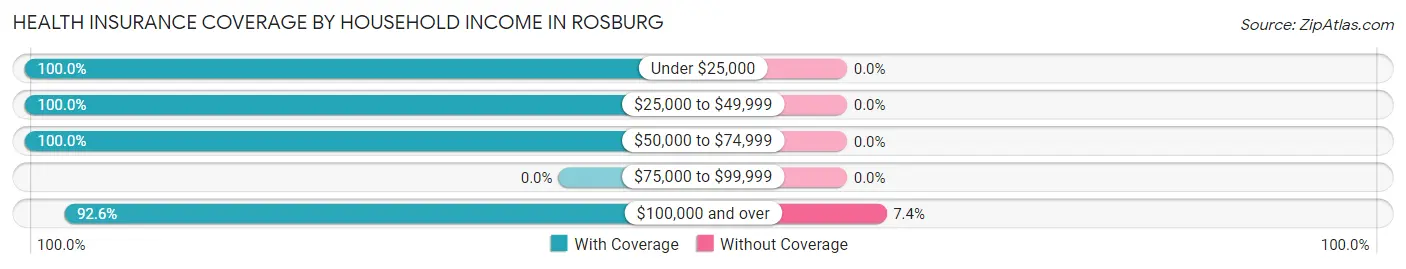
| Household Income | With Coverage | Without Coverage |
| Under $25,000 | 38 (100.0%) | 0 (0.0%) |
| $25,000 to $49,999 | 16 (100.0%) | 0 (0.0%) |
| $50,000 to $74,999 | 226 (100.0%) | 0 (0.0%) |
| $75,000 to $99,999 | 0 (0.0%) | 0 (0.0%) |
| $100,000 and over | 138 (92.6%) | 11 (7.4%) |
Public vs Private Health Insurance Coverage by Age in Rosburg
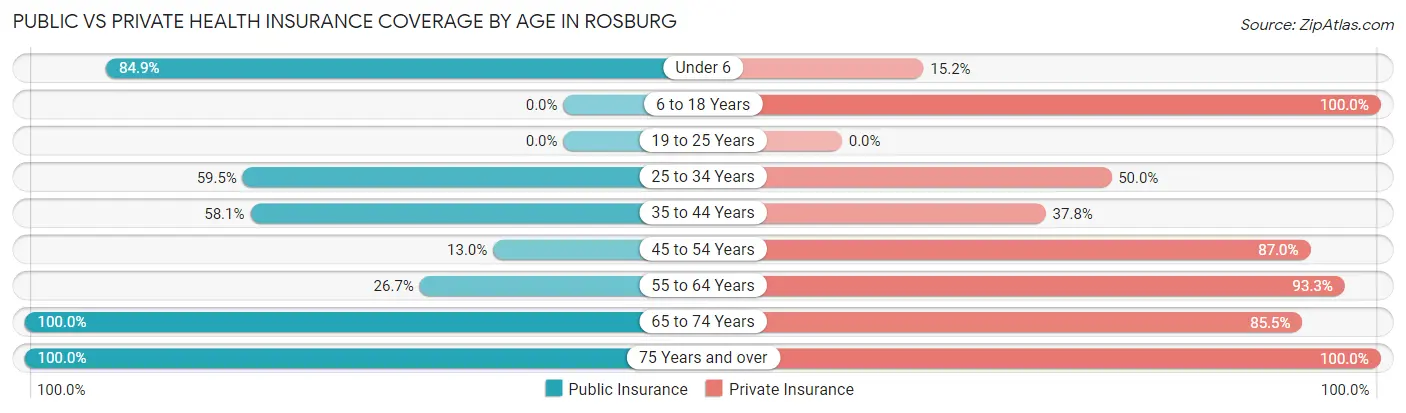
| Age Bracket | Public Insurance | Private Insurance |
| Under 6 | 56 (84.9%) | 10 (15.1%) |
| 6 to 18 Years | 0 (0.0%) | 58 (100.0%) |
| 19 to 25 Years | 0 (0.0%) | 0 (0.0%) |
| 25 to 34 Years | 50 (59.5%) | 42 (50.0%) |
| 35 to 44 Years | 43 (58.1%) | 28 (37.8%) |
| 45 to 54 Years | 3 (13.0%) | 20 (87.0%) |
| 55 to 64 Years | 12 (26.7%) | 42 (93.3%) |
| 65 to 74 Years | 62 (100.0%) | 53 (85.5%) |
| 75 Years and over | 17 (100.0%) | 17 (100.0%) |
| Total | 243 (56.6%) | 270 (62.9%) |
Disability Status by Sex by Age in Rosburg
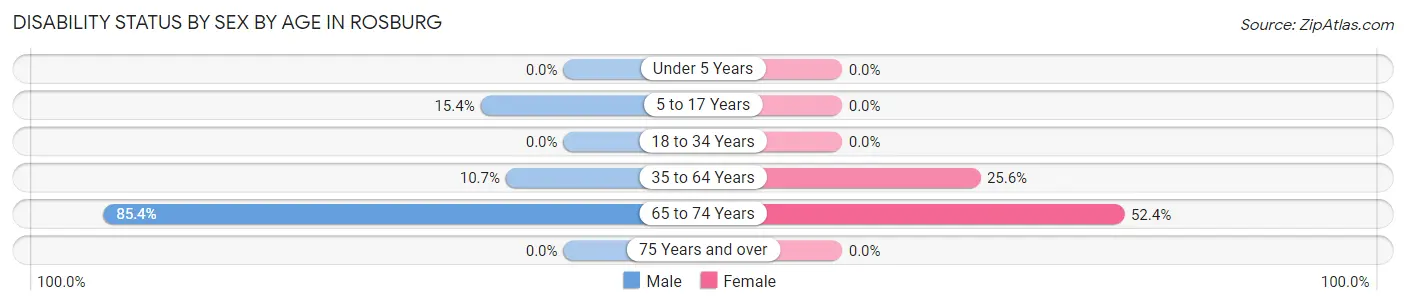
| Age Bracket | Male | Female |
| Under 5 Years | 0 (0.0%) | 0 (0.0%) |
| 5 to 17 Years | 6 (15.4%) | 0 (0.0%) |
| 18 to 34 Years | 0 (0.0%) | 0 (0.0%) |
| 35 to 64 Years | 11 (10.7%) | 10 (25.6%) |
| 65 to 74 Years | 35 (85.4%) | 11 (52.4%) |
| 75 Years and over | 0 (0.0%) | 0 (0.0%) |
Disability Class by Sex by Age in Rosburg
Disability Class: Hearing Difficulty
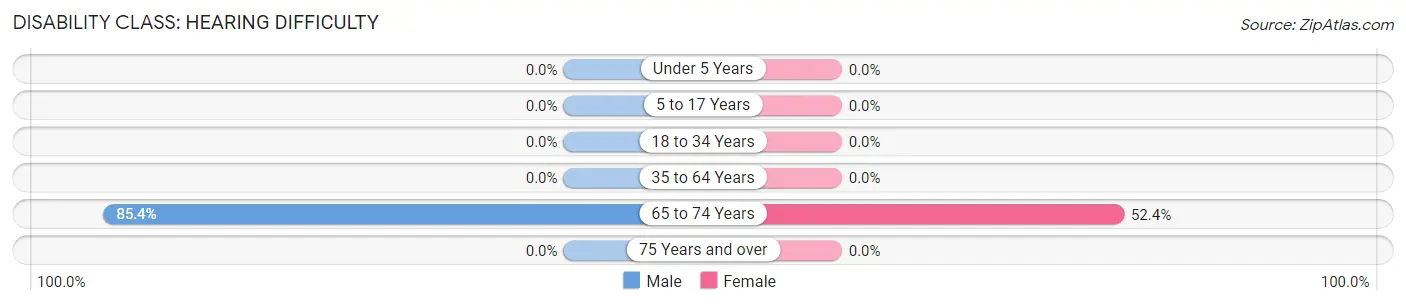
| Age Bracket | Male | Female |
| Under 5 Years | 0 (0.0%) | 0 (0.0%) |
| 5 to 17 Years | 0 (0.0%) | 0 (0.0%) |
| 18 to 34 Years | 0 (0.0%) | 0 (0.0%) |
| 35 to 64 Years | 0 (0.0%) | 0 (0.0%) |
| 65 to 74 Years | 35 (85.4%) | 11 (52.4%) |
| 75 Years and over | 0 (0.0%) | 0 (0.0%) |
Disability Class: Vision Difficulty
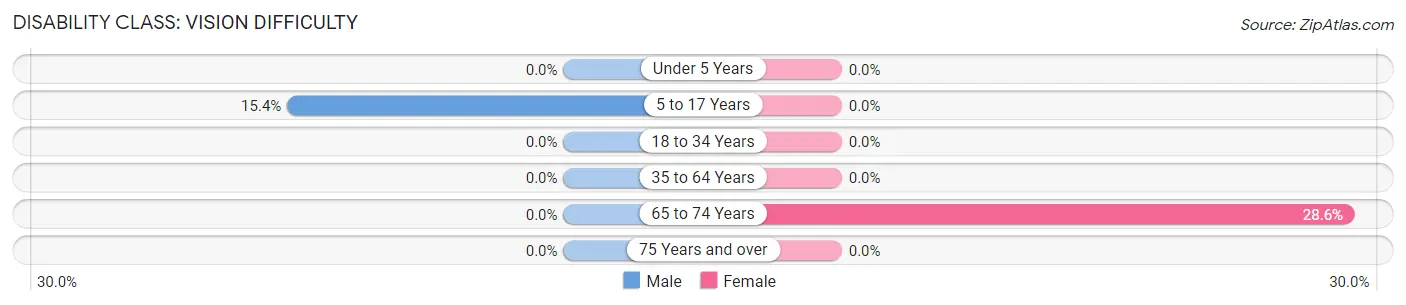
| Age Bracket | Male | Female |
| Under 5 Years | 0 (0.0%) | 0 (0.0%) |
| 5 to 17 Years | 6 (15.4%) | 0 (0.0%) |
| 18 to 34 Years | 0 (0.0%) | 0 (0.0%) |
| 35 to 64 Years | 0 (0.0%) | 0 (0.0%) |
| 65 to 74 Years | 0 (0.0%) | 6 (28.6%) |
| 75 Years and over | 0 (0.0%) | 0 (0.0%) |
Disability Class: Cognitive Difficulty
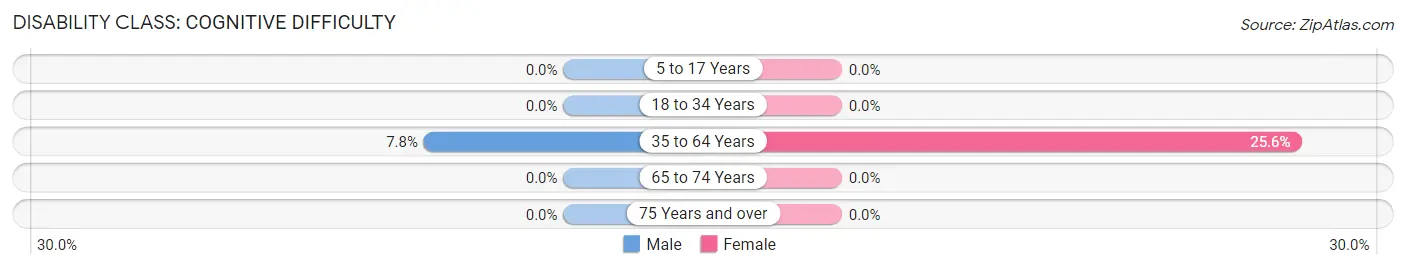
| Age Bracket | Male | Female |
| 5 to 17 Years | 0 (0.0%) | 0 (0.0%) |
| 18 to 34 Years | 0 (0.0%) | 0 (0.0%) |
| 35 to 64 Years | 8 (7.8%) | 10 (25.6%) |
| 65 to 74 Years | 0 (0.0%) | 0 (0.0%) |
| 75 Years and over | 0 (0.0%) | 0 (0.0%) |
Disability Class: Ambulatory Difficulty
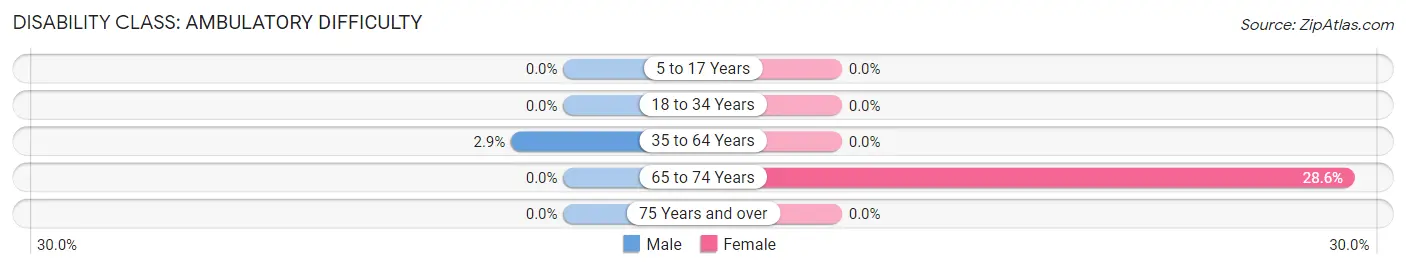
| Age Bracket | Male | Female |
| 5 to 17 Years | 0 (0.0%) | 0 (0.0%) |
| 18 to 34 Years | 0 (0.0%) | 0 (0.0%) |
| 35 to 64 Years | 3 (2.9%) | 0 (0.0%) |
| 65 to 74 Years | 0 (0.0%) | 6 (28.6%) |
| 75 Years and over | 0 (0.0%) | 0 (0.0%) |
Disability Class: Self-Care Difficulty
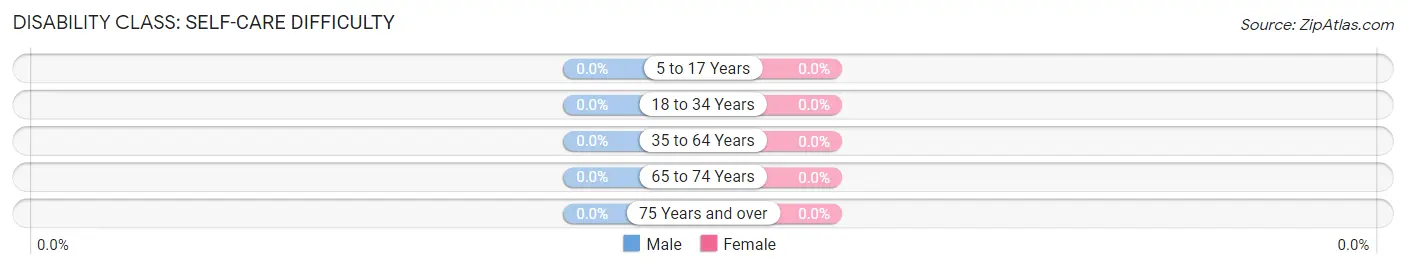
| Age Bracket | Male | Female |
| 5 to 17 Years | 0 (0.0%) | 0 (0.0%) |
| 18 to 34 Years | 0 (0.0%) | 0 (0.0%) |
| 35 to 64 Years | 0 (0.0%) | 0 (0.0%) |
| 65 to 74 Years | 0 (0.0%) | 0 (0.0%) |
| 75 Years and over | 0 (0.0%) | 0 (0.0%) |
Technology Access in Rosburg
Computing Device Access in Rosburg
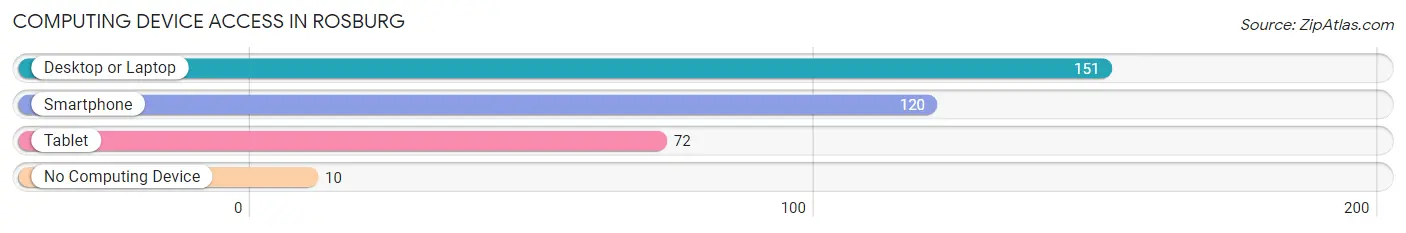
| Device Type | # Households | % Households |
| Desktop or Laptop | 151 | 93.8% |
| Smartphone | 120 | 74.5% |
| Tablet | 72 | 44.7% |
| No Computing Device | 10 | 6.2% |
| Total | 161 | 100.0% |
Internet Access in Rosburg
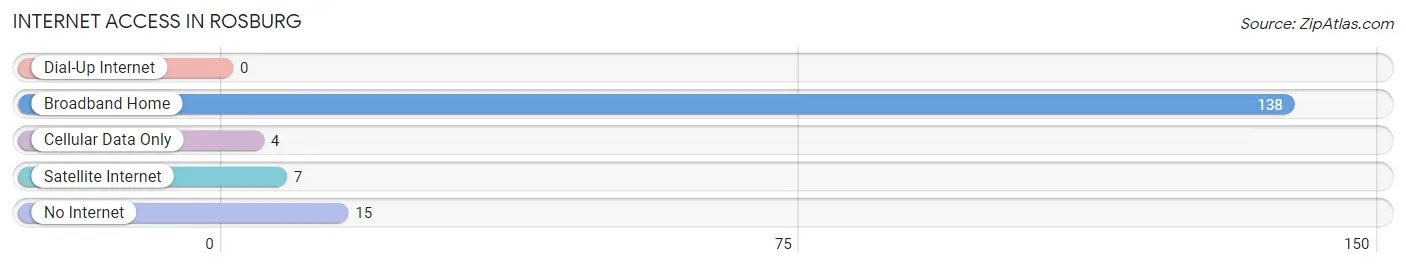
| Internet Type | # Households | % Households |
| Dial-Up Internet | 0 | 0.0% |
| Broadband Home | 138 | 85.7% |
| Cellular Data Only | 4 | 2.5% |
| Satellite Internet | 7 | 4.3% |
| No Internet | 15 | 9.3% |
| Total | 161 | 100.0% |
Rosburg Summary
Rosburg, Washington is a small unincorporated community located in Wahkiakum County, Washington. It is situated on the banks of the Columbia River, approximately 20 miles east of Astoria, Oregon. The population of Rosburg was estimated to be around 200 people in 2020.
History
Rosburg was first settled in the late 1800s by a group of Scandinavian immigrants. The town was named after the Rosburg family, who were among the first settlers. The Rosburgs were farmers and fishermen, and the town quickly became a hub for the local fishing industry. In the early 1900s, the town was home to a cannery, a fish-packing plant, and a salmon hatchery.
In the 1920s, the town began to experience a decline in its fishing industry. This was due to overfishing and the introduction of new fishing regulations. As a result, many of the town’s residents moved away in search of work.
In the 1950s, the town experienced a resurgence in its fishing industry. This was due to the introduction of new fishing regulations and the construction of a fish hatchery. The hatchery was built to help replenish the local fish population and to provide jobs for the town’s residents.
Geography
Rosburg is located in Wahkiakum County, Washington. It is situated on the banks of the Columbia River, approximately 20 miles east of Astoria, Oregon. The town is surrounded by lush forests and rolling hills. The climate in Rosburg is mild and temperate, with average temperatures ranging from the mid-50s to the mid-70s.
Economy
The economy of Rosburg is largely based on fishing and tourism. The town is home to a fish hatchery, which provides jobs for many of the town’s residents. The hatchery also helps to replenish the local fish population.
In addition to fishing, tourism is also an important part of the local economy. The town is home to several popular tourist attractions, including the Columbia River Maritime Museum and the Astoria Column.
Demographics
The population of Rosburg was estimated to be around 200 people in 2020. The town is predominantly white, with a small minority population. The median household income in Rosburg is $45,000, and the median home value is $150,000. The town has a low unemployment rate and a high rate of homeownership.
Common Questions
What is the Total Population of Rosburg?
Total Population of Rosburg is 429.
What is the Total Male Population of Rosburg?
Total Male Population of Rosburg is 252.
What is the Total Female Population of Rosburg?
Total Female Population of Rosburg is 177.
What is the Ratio of Males per 100 Females in Rosburg?
There are 142.37 Males per 100 Females in Rosburg.
What is the Ratio of Females per 100 Males in Rosburg?
There are 70.24 Females per 100 Males in Rosburg.
What is the Median Population Age in Rosburg?
Median Population Age in Rosburg is 35.9 Years.
What is the Average Family Size in Rosburg
Average Family Size in Rosburg is 3.2 People.
What is the Average Household Size in Rosburg
Average Household Size in Rosburg is 2.7 People.
What is Per Capita Income in Rosburg?
Per Capita income in Rosburg is $21,718.
What is the Median Family Income in Rosburg?
Median Family Income in Rosburg is $56,050.
What is the Median Household income in Rosburg?
Median Household Income in Rosburg is $54,776.
What is Inequality or Gini Index in Rosburg?
Inequality or Gini Index in Rosburg is 0.39.
How Large is the Labor Force in Rosburg?
There are 194 People in the Labor Forcein in Rosburg.
What is the Percentage of People in the Labor Force in Rosburg?
63.6% of People are in the Labor Force in Rosburg.
What is the Unemployment Rate in Rosburg?
Unemployment Rate in Rosburg is 9.8%.