Raft Island, WA
Raft Island Map
Raft Island Overview
451
TOTAL POPULATION
212
MALE POPULATION
239
FEMALE POPULATION
88.70
MALES / 100 FEMALES
112.74
FEMALES / 100 MALES
52.2
MEDIAN AGE
3.1
AVG FAMILY SIZE
2.1
AVG HOUSEHOLD SIZE
$87,791
PER CAPITA INCOME
$165,000
AVG FAMILY INCOME
$156,136
AVG HOUSEHOLD INCOME
0.51
INEQUALITY / GINI INDEX
266
LABOR FORCE [ PEOPLE ]
73.9%
PERCENT IN LABOR FORCE
4.9%
UNEMPLOYMENT RATE
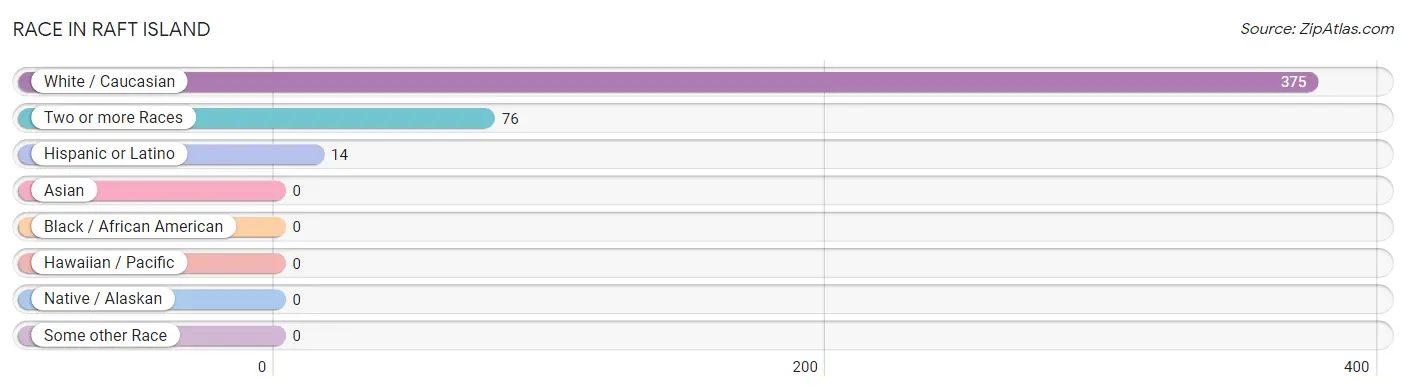
Race in Raft Island
The most populous races in Raft Island are White / Caucasian (375 | 83.2%), Two or more Races (76 | 16.9%), and Hispanic or Latino (14 | 3.1%).
| Race | # Population | % Population |
| Asian | 0 | 0.0% |
| Black / African American | 0 | 0.0% |
| Hawaiian / Pacific | 0 | 0.0% |
| Hispanic or Latino | 14 | 3.1% |
| Native / Alaskan | 0 | 0.0% |
| White / Caucasian | 375 | 83.2% |
| Two or more Races | 76 | 16.9% |
| Some other Race | 0 | 0.0% |
| Total | 451 | 100.0% |
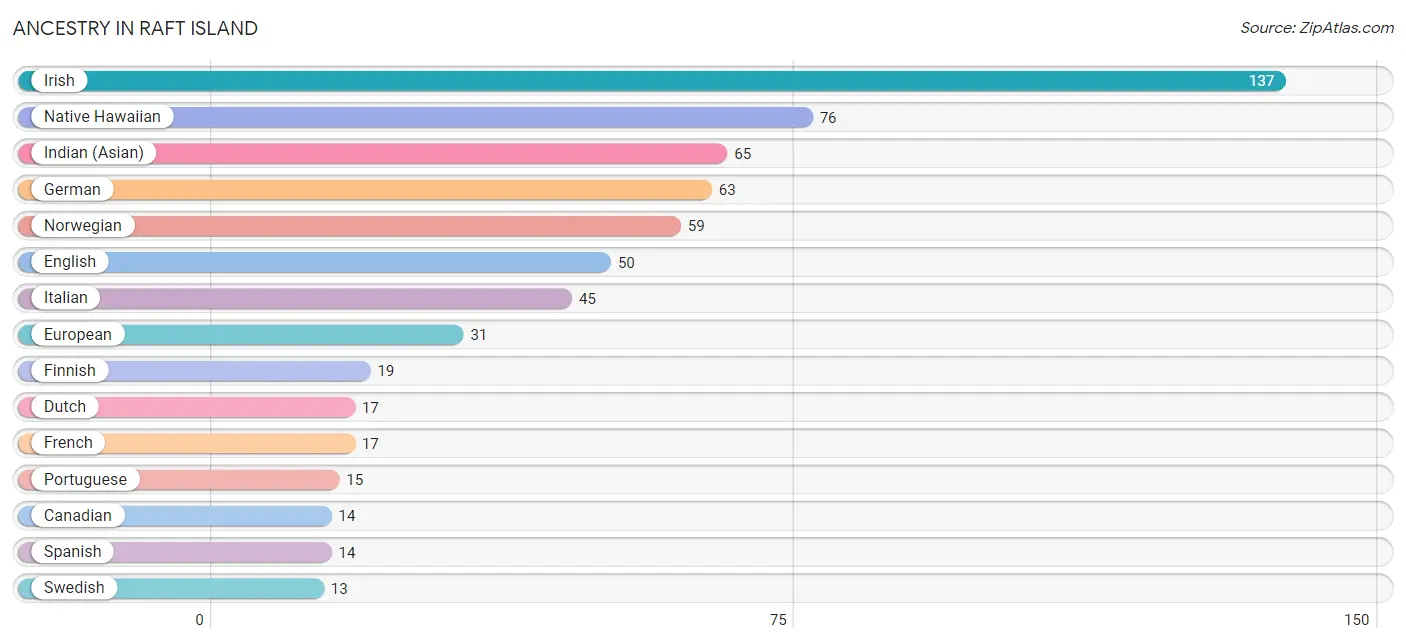
Ancestry in Raft Island
The most populous ancestries reported in Raft Island are Irish (137 | 30.4%), Native Hawaiian (76 | 16.9%), Indian (Asian) (65 | 14.4%), German (63 | 14.0%), and Norwegian (59 | 13.1%), together accounting for 88.7% of all Raft Island residents.
| Ancestry | # Population | % Population |
| Canadian | 14 | 3.1% |
| Croatian | 7 | 1.5% |
| Dutch | 17 | 3.8% |
| English | 50 | 11.1% |
| European | 31 | 6.9% |
| Finnish | 19 | 4.2% |
| French | 17 | 3.8% |
| German | 63 | 14.0% |
| Indian (Asian) | 65 | 14.4% |
| Irish | 137 | 30.4% |
| Italian | 45 | 10.0% |
| Native Hawaiian | 76 | 16.9% |
| Norwegian | 59 | 13.1% |
| Polish | 4 | 0.9% |
| Portuguese | 15 | 3.3% |
| Scottish | 9 | 2.0% |
| Spanish | 14 | 3.1% |
| Swedish | 13 | 2.9% | View All 18 Rows |
Immigrants in Raft Island
The most numerous immigrant groups reported in Raft Island came from , and Canada (10 | 2.2%), together accounting for 2.2% of all Raft Island residents.

| Immigration Origin | # Population | % Population |
| Canada | 10 | 2.2% | View All 1 Rows |
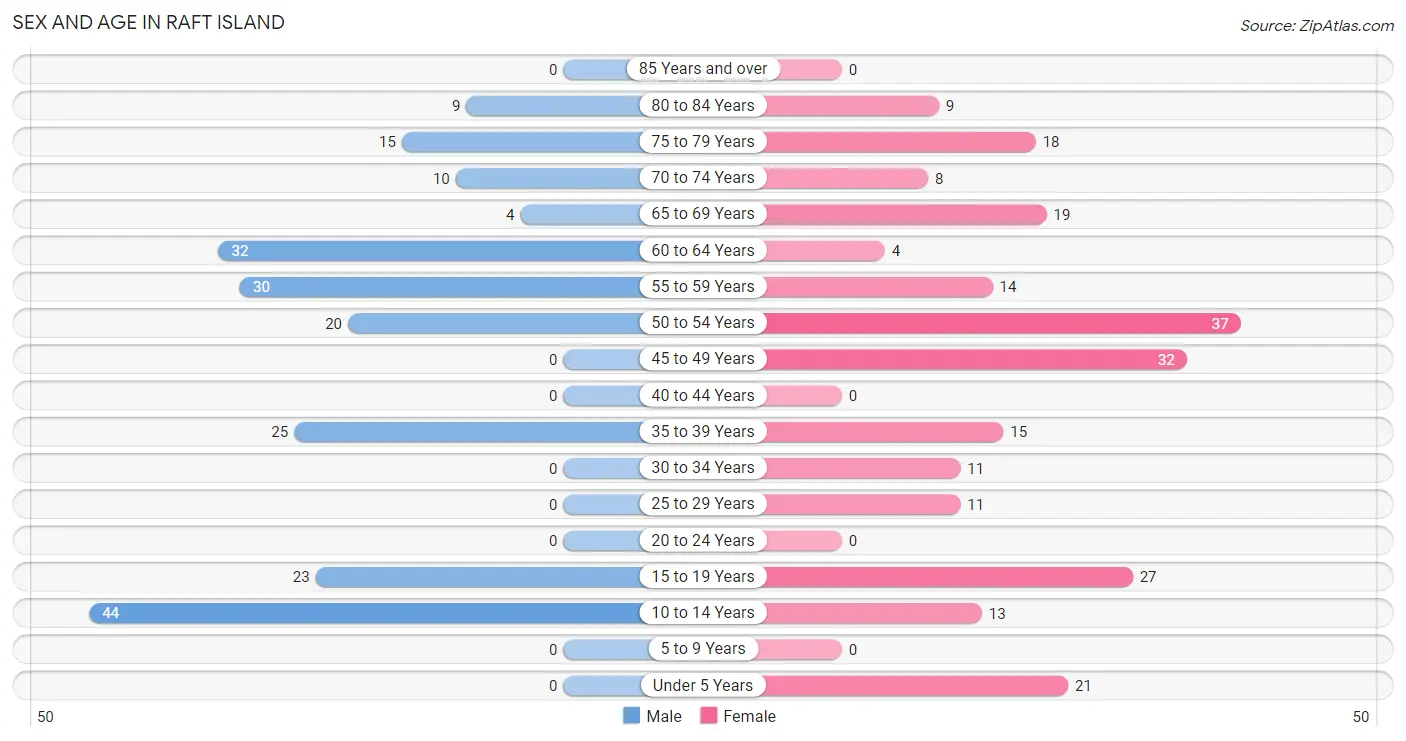
Sex and Age in Raft Island
Sex and Age in Raft Island
The most populous age groups in Raft Island are 10 to 14 Years (44 | 20.7%) for men and 50 to 54 Years (37 | 15.5%) for women.
| Age Bracket | Male | Female |
| Under 5 Years | 0 (0.0%) | 21 (8.8%) |
| 5 to 9 Years | 0 (0.0%) | 0 (0.0%) |
| 10 to 14 Years | 44 (20.7%) | 13 (5.4%) |
| 15 to 19 Years | 23 (10.8%) | 27 (11.3%) |
| 20 to 24 Years | 0 (0.0%) | 0 (0.0%) |
| 25 to 29 Years | 0 (0.0%) | 11 (4.6%) |
| 30 to 34 Years | 0 (0.0%) | 11 (4.6%) |
| 35 to 39 Years | 25 (11.8%) | 15 (6.3%) |
| 40 to 44 Years | 0 (0.0%) | 0 (0.0%) |
| 45 to 49 Years | 0 (0.0%) | 32 (13.4%) |
| 50 to 54 Years | 20 (9.4%) | 37 (15.5%) |
| 55 to 59 Years | 30 (14.1%) | 14 (5.9%) |
| 60 to 64 Years | 32 (15.1%) | 4 (1.7%) |
| 65 to 69 Years | 4 (1.9%) | 19 (8.0%) |
| 70 to 74 Years | 10 (4.7%) | 8 (3.4%) |
| 75 to 79 Years | 15 (7.1%) | 18 (7.5%) |
| 80 to 84 Years | 9 (4.3%) | 9 (3.8%) |
| 85 Years and over | 0 (0.0%) | 0 (0.0%) |
| Total | 212 (100.0%) | 239 (100.0%) |
Families and Households in Raft Island
Median Family Size in Raft Island
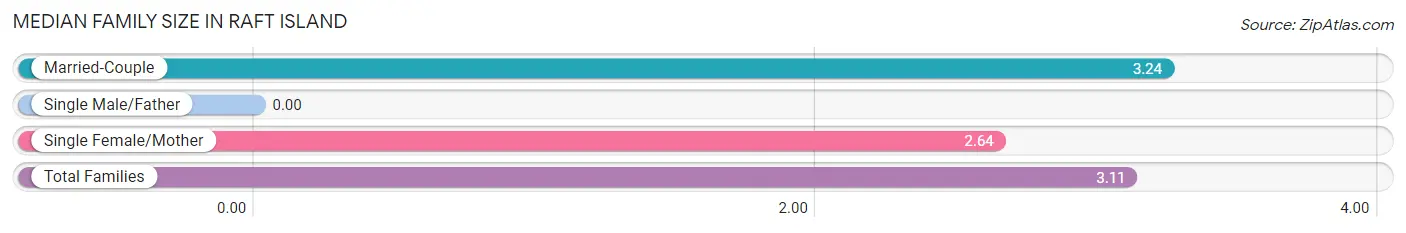
| Family Type | # Families | Family Size |
| Married-Couple | 78 (78.0%) | 3.24 |
| Single Male/Father | 0 (0.0%) | - |
| Single Female/Mother | 22 (22.0%) | 2.64 |
| Total Families | 100 (100.0%) | 3.11 |
Median Household Size in Raft Island
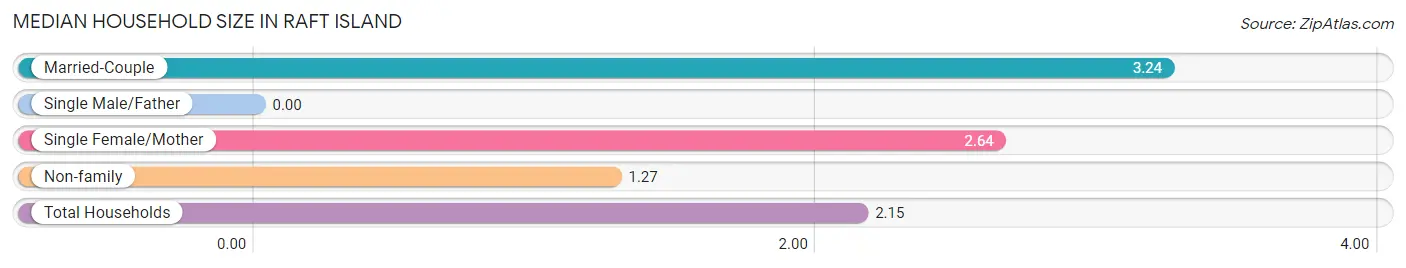
| Household Type | # Households | Household Size |
| Married-Couple | 78 (37.1%) | 3.24 |
| Single Male/Father | 0 (0.0%) | - |
| Single Female/Mother | 22 (10.5%) | 2.64 |
| Non-family | 110 (52.4%) | 1.27 |
| Total Households | 210 (100.0%) | 2.15 |
Household Size by Marriage Status in Raft Island
Out of a total of 210 households in Raft Island, 100 (47.6%) are family households, while 110 (52.4%) are nonfamily households. The most numerous type of family households are 2-person households, comprising 41, and the most common type of nonfamily households are 1-person households, comprising 90.
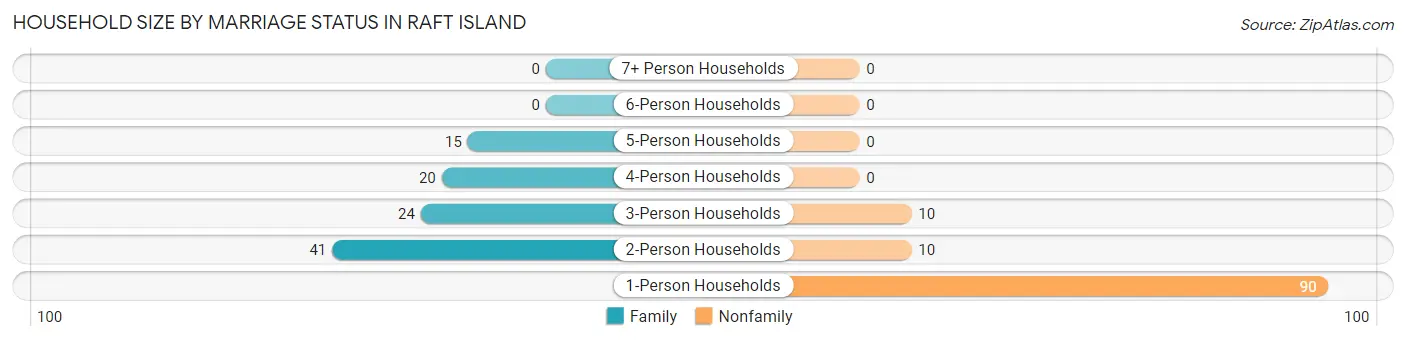
| Household Size | Family Households | Nonfamily Households |
| 1-Person Households | - | 90 (42.9%) |
| 2-Person Households | 41 (19.5%) | 10 (4.8%) |
| 3-Person Households | 24 (11.4%) | 10 (4.8%) |
| 4-Person Households | 20 (9.5%) | 0 (0.0%) |
| 5-Person Households | 15 (7.1%) | 0 (0.0%) |
| 6-Person Households | 0 (0.0%) | 0 (0.0%) |
| 7+ Person Households | 0 (0.0%) | 0 (0.0%) |
| Total | 100 (47.6%) | 110 (52.4%) |
Female Fertility in Raft Island
Fertility by Age in Raft Island
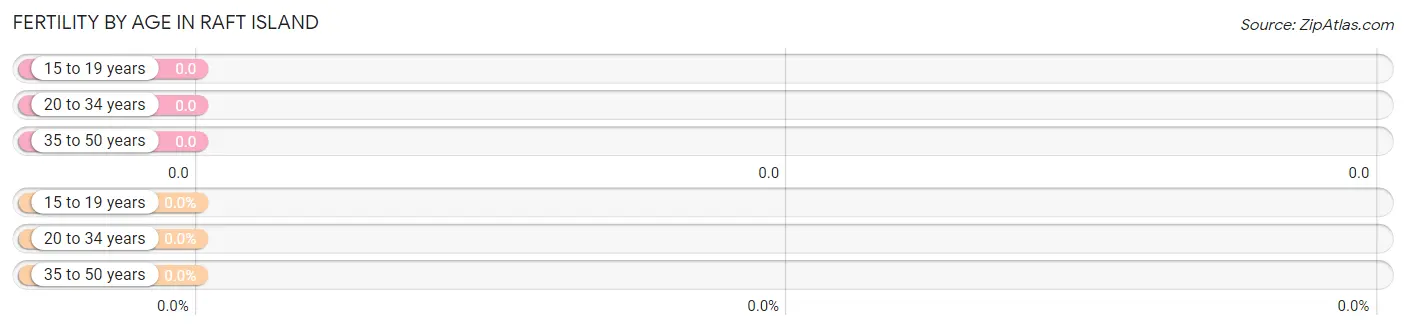
| Age Bracket | Women with Births | Births / 1,000 Women |
| 15 to 19 years | 0 (0.0%) | 0.0 |
| 20 to 34 years | 0 (0.0%) | 0.0 |
| 35 to 50 years | 0 (0.0%) | 0.0 |
| Total | 0 (0.0%) | 0.0 |
Fertility by Age by Marriage Status in Raft Island
| Age Bracket | Married | Unmarried |
| 15 to 19 years | 0 (0.0%) | 0 (0.0%) |
| 20 to 34 years | 0 (0.0%) | 0 (0.0%) |
| 35 to 50 years | 0 (0.0%) | 0 (0.0%) |
| Total | 0 (0.0%) | 0 (0.0%) |
Fertility by Education in Raft Island
| Educational Attainment | Women with Births | Births / 1,000 Women |
| Less than High School | 0 (0.0%) | 0.0 |
| High School Diploma | 0 (0.0%) | 0.0 |
| College or Associate's Degree | 0 (0.0%) | 0.0 |
| Bachelor's Degree | 0 (0.0%) | 0.0 |
| Graduate Degree | 0 (0.0%) | 0.0 |
| Total | 0 (0.0%) | 0.0 |
Fertility by Education by Marriage Status in Raft Island
| Educational Attainment | Married | Unmarried |
| Less than High School | 0 (0.0%) | 0 (0.0%) |
| High School Diploma | 0 (0.0%) | 0 (0.0%) |
| College or Associate's Degree | 0 (0.0%) | 0 (0.0%) |
| Bachelor's Degree | 0 (0.0%) | 0 (0.0%) |
| Graduate Degree | 0 (0.0%) | 0 (0.0%) |
| Total | 0 (0.0%) | 0 (0.0%) |
Income in Raft Island
Income Overview in Raft Island
Per Capita Income in Raft Island is $87,791, while median incomes of families and households are $165,000 and $156,136 respectively.
| Characteristic | Number | Measure |
| Per Capita Income | 451 | $87,791 |
| Median Family Income | 100 | $165,000 |
| Mean Family Income | 100 | $242,838 |
| Median Household Income | 210 | $156,136 |
| Mean Household Income | 210 | $195,002 |
| Income Deficit | 100 | $0 |
| Wage / Income Gap (%) | 451 | 0.00% |
| Wage / Income Gap ($) | 451 | 100.00¢ per $1 |
| Gini / Inequality Index | 451 | 0.51 |
Earnings by Sex in Raft Island
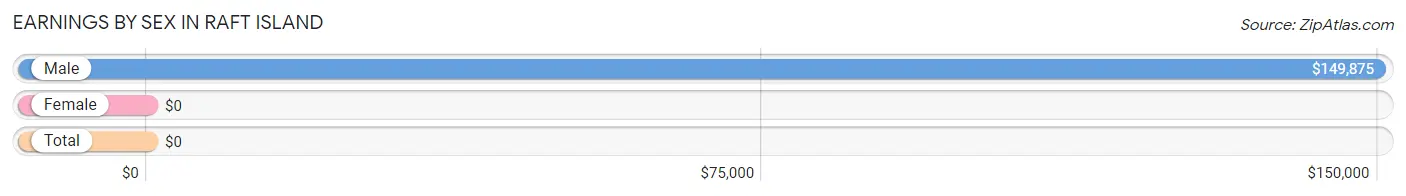
| Sex | Number | Average Earnings |
| Male | 121 (44.3%) | $149,875 |
| Female | 152 (55.7%) | $0 |
| Total | 273 (100.0%) | $0 |
Earnings by Sex by Income Bracket in Raft Island
The most common earnings brackets in Raft Island are $100,000+ for men (84 | 69.4%) and $100,000+ for women (42 | 27.6%).
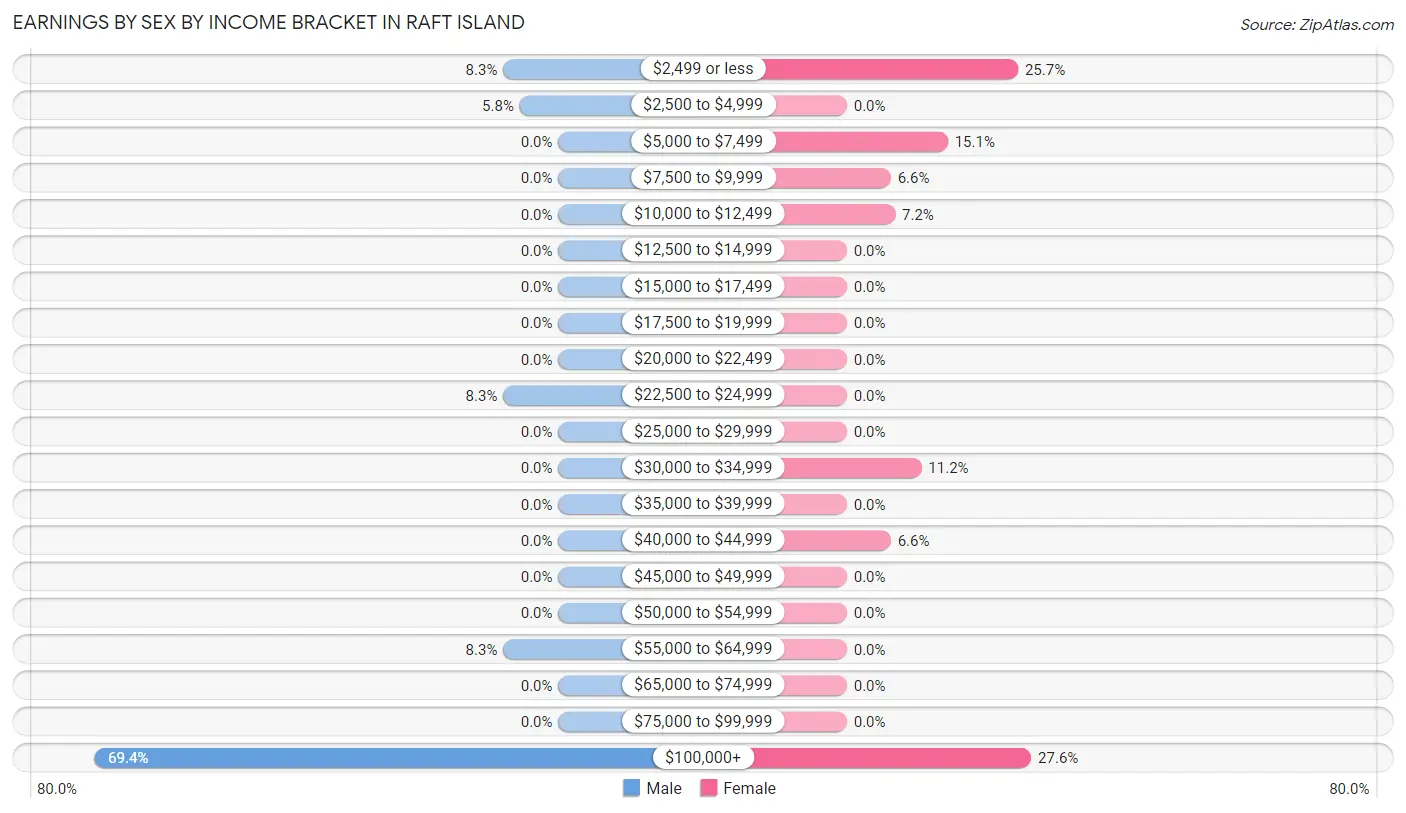
| Income | Male | Female |
| $2,499 or less | 10 (8.3%) | 39 (25.7%) |
| $2,500 to $4,999 | 7 (5.8%) | 0 (0.0%) |
| $5,000 to $7,499 | 0 (0.0%) | 23 (15.1%) |
| $7,500 to $9,999 | 0 (0.0%) | 10 (6.6%) |
| $10,000 to $12,499 | 0 (0.0%) | 11 (7.2%) |
| $12,500 to $14,999 | 0 (0.0%) | 0 (0.0%) |
| $15,000 to $17,499 | 0 (0.0%) | 0 (0.0%) |
| $17,500 to $19,999 | 0 (0.0%) | 0 (0.0%) |
| $20,000 to $22,499 | 0 (0.0%) | 0 (0.0%) |
| $22,500 to $24,999 | 10 (8.3%) | 0 (0.0%) |
| $25,000 to $29,999 | 0 (0.0%) | 0 (0.0%) |
| $30,000 to $34,999 | 0 (0.0%) | 17 (11.2%) |
| $35,000 to $39,999 | 0 (0.0%) | 0 (0.0%) |
| $40,000 to $44,999 | 0 (0.0%) | 10 (6.6%) |
| $45,000 to $49,999 | 0 (0.0%) | 0 (0.0%) |
| $50,000 to $54,999 | 0 (0.0%) | 0 (0.0%) |
| $55,000 to $64,999 | 10 (8.3%) | 0 (0.0%) |
| $65,000 to $74,999 | 0 (0.0%) | 0 (0.0%) |
| $75,000 to $99,999 | 0 (0.0%) | 0 (0.0%) |
| $100,000+ | 84 (69.4%) | 42 (27.6%) |
| Total | 121 (100.0%) | 152 (100.0%) |
Earnings by Sex by Educational Attainment in Raft Island
Average earnings in Raft Island are $149,875 for men and $33,456 for women, a difference of 77.7%. Men with an educational attainment of graduate degree enjoy the highest average annual earnings of $227,550, while those with bachelor's degree education earn the least with $154,205. Women with an educational attainment of bachelor's degree earn the most with the average annual earnings of $223,889, while those with high school diploma education have the smallest earnings of $33,676.
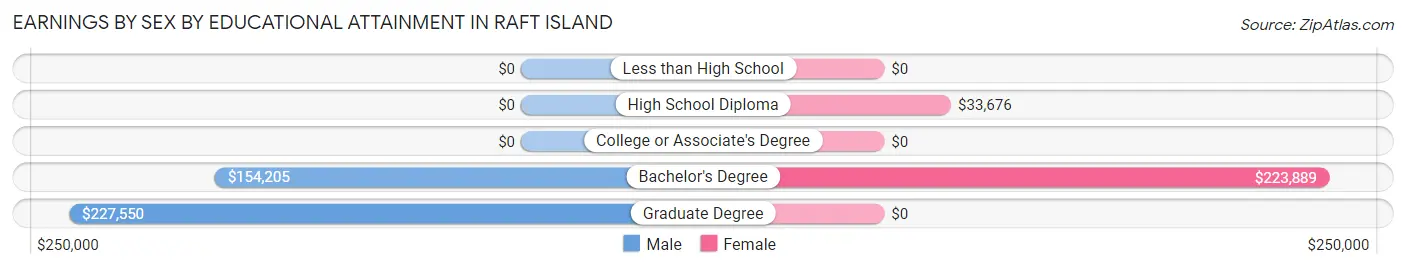
| Educational Attainment | Male Income | Female Income |
| Less than High School | - | - |
| High School Diploma | - | - |
| College or Associate's Degree | - | - |
| Bachelor's Degree | $154,205 | $223,889 |
| Graduate Degree | $227,550 | $0 |
| Total | $149,875 | $33,456 |
Family Income in Raft Island
Family Income Brackets in Raft Island
According to the Raft Island family income data, there are 40 families falling into the $200,000+ income range, which is the most common income bracket and makes up 40.0% of all families.
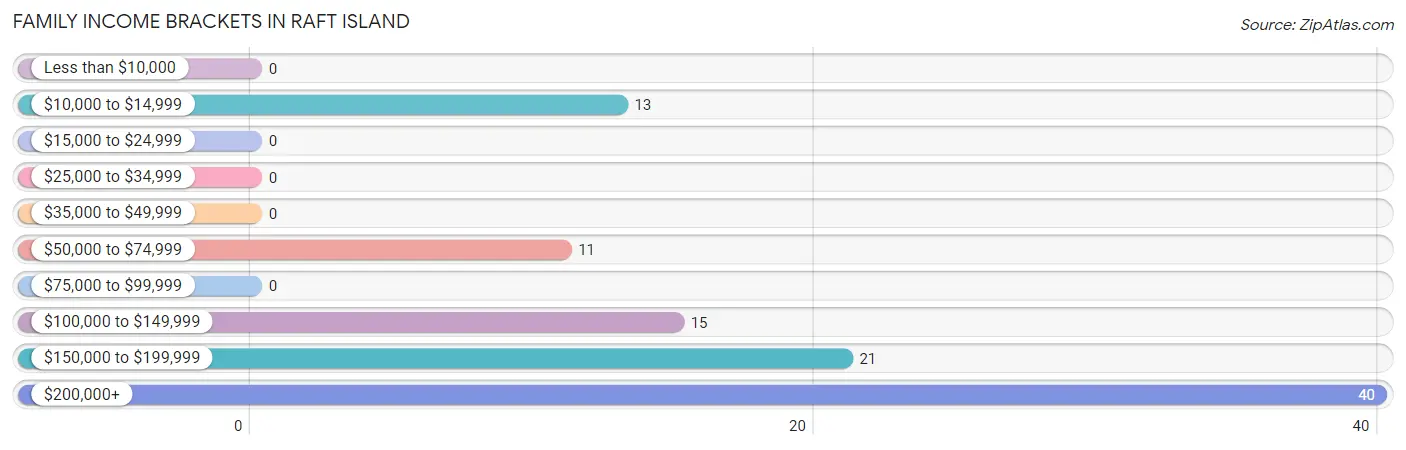
| Income Bracket | # Families | % Families |
| Less than $10,000 | 0 | 0.0% |
| $10,000 to $14,999 | 13 | 13.0% |
| $15,000 to $24,999 | 0 | 0.0% |
| $25,000 to $34,999 | 0 | 0.0% |
| $35,000 to $49,999 | 0 | 0.0% |
| $50,000 to $74,999 | 11 | 11.0% |
| $75,000 to $99,999 | 0 | 0.0% |
| $100,000 to $149,999 | 15 | 15.0% |
| $150,000 to $199,999 | 21 | 21.0% |
| $200,000+ | 40 | 40.0% |
Family Income by Famaliy Size in Raft Island
2-person families (41 | 41.0%) account for the highest median family income in Raft Island with $250,001 per family, while 2-person families (41 | 41.0%) have the highest median income of $125,000 per family member.
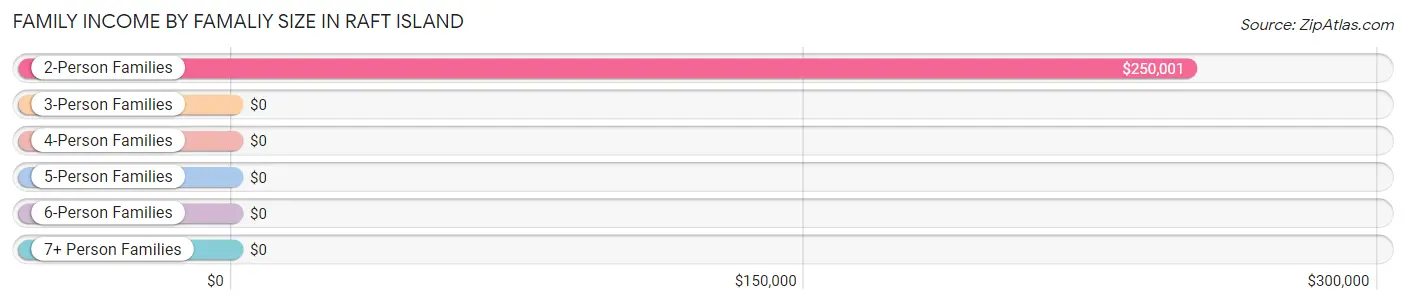
| Income Bracket | # Families | Median Income |
| 2-Person Families | 41 (41.0%) | $250,001 |
| 3-Person Families | 24 (24.0%) | $0 |
| 4-Person Families | 20 (20.0%) | $0 |
| 5-Person Families | 15 (15.0%) | $0 |
| 6-Person Families | 0 (0.0%) | $0 |
| 7+ Person Families | 0 (0.0%) | $0 |
| Total | 100 (100.0%) | $165,000 |
Family Income by Number of Earners in Raft Island
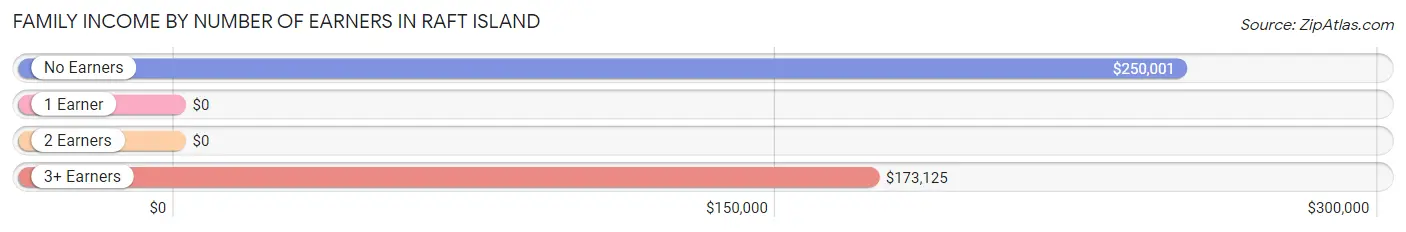
| Number of Earners | # Families | Median Income |
| No Earners | 27 (27.0%) | $250,001 |
| 1 Earner | 38 (38.0%) | $0 |
| 2 Earners | 0 (0.0%) | $0 |
| 3+ Earners | 35 (35.0%) | $173,125 |
| Total | 100 (100.0%) | $165,000 |
Household Income in Raft Island
Household Income Brackets in Raft Island
With 85 households falling in the category, the $200,000+ income range is the most frequent in Raft Island, accounting for 40.5% of all households.
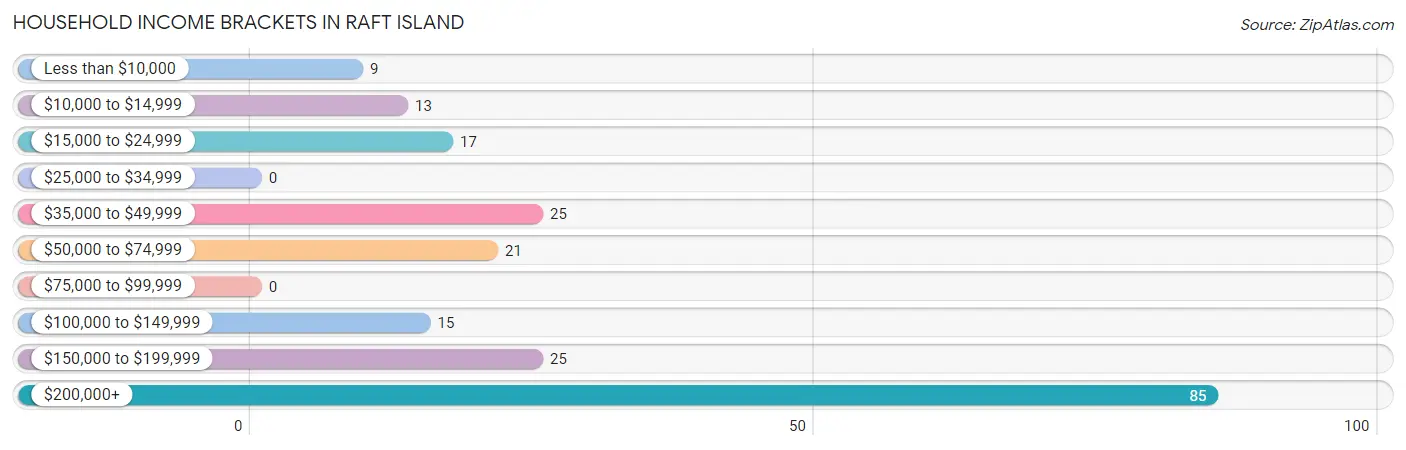
| Income Bracket | # Households | % Households |
| Less than $10,000 | 9 | 4.3% |
| $10,000 to $14,999 | 13 | 6.2% |
| $15,000 to $24,999 | 17 | 8.1% |
| $25,000 to $34,999 | 0 | 0.0% |
| $35,000 to $49,999 | 25 | 11.9% |
| $50,000 to $74,999 | 21 | 10.0% |
| $75,000 to $99,999 | 0 | 0.0% |
| $100,000 to $149,999 | 15 | 7.1% |
| $150,000 to $199,999 | 25 | 11.9% |
| $200,000+ | 85 | 40.5% |
Household Income by Householder Age in Raft Island
The median household income in Raft Island is $156,136, with the highest median household income of $206,000 found in the 45 to 64 years age bracket for the primary householder. A total of 130 households (61.9%) fall into this category.
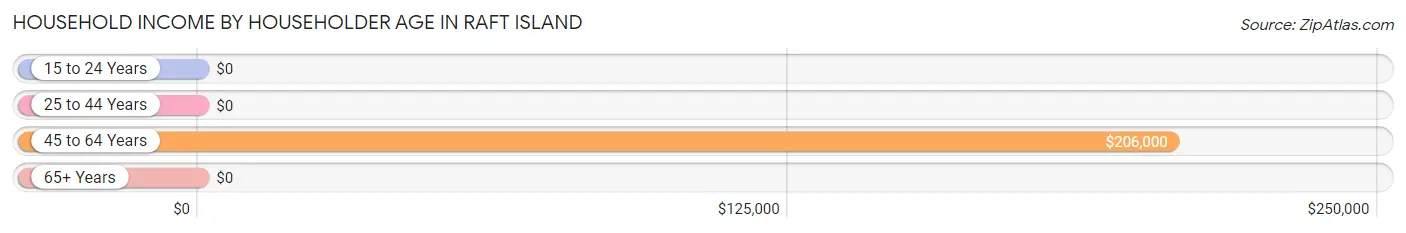
| Income Bracket | # Households | Median Income |
| 15 to 24 Years | 0 (0.0%) | $0 |
| 25 to 44 Years | 26 (12.4%) | $0 |
| 45 to 64 Years | 130 (61.9%) | $206,000 |
| 65+ Years | 54 (25.7%) | $0 |
| Total | 210 (100.0%) | $156,136 |
Poverty in Raft Island
Income Below Poverty by Sex and Age in Raft Island
With 6.1% poverty level for males and 18.8% for females among the residents of Raft Island, 15 year old males and 12 to 14 year old females are the most vulnerable to poverty, with 13 males (100.0%) and 13 females (100.0%) in their respective age groups living below the poverty level.
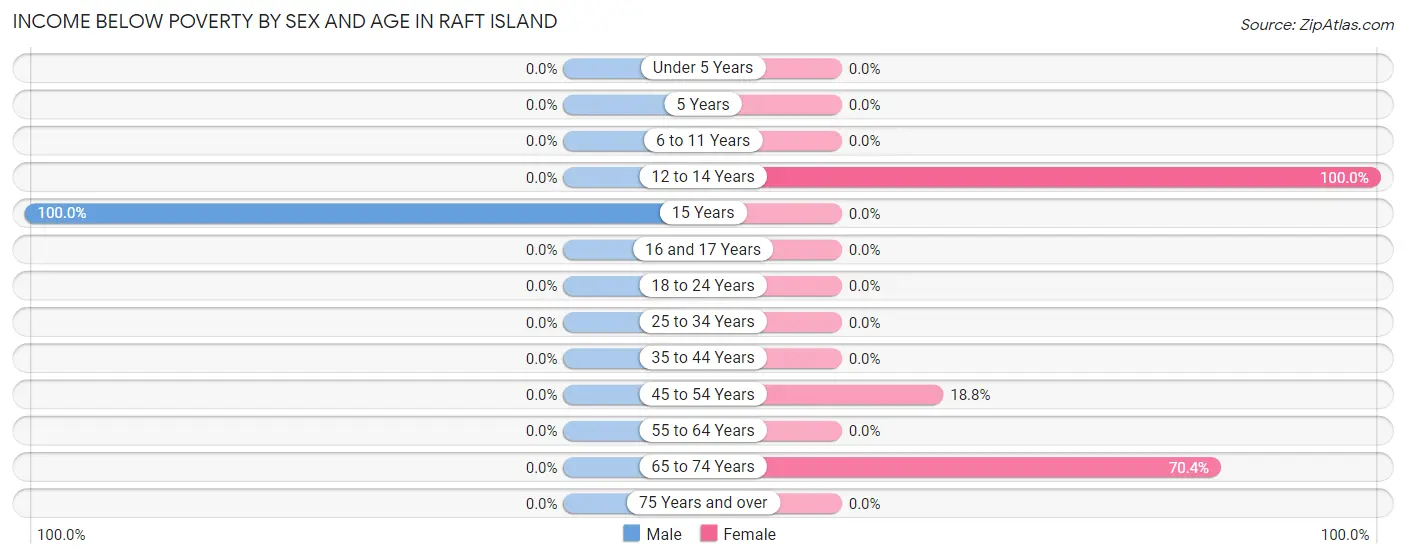
| Age Bracket | Male | Female |
| Under 5 Years | 0 (0.0%) | 0 (0.0%) |
| 5 Years | 0 (0.0%) | 0 (0.0%) |
| 6 to 11 Years | 0 (0.0%) | 0 (0.0%) |
| 12 to 14 Years | 0 (0.0%) | 13 (100.0%) |
| 15 Years | 13 (100.0%) | 0 (0.0%) |
| 16 and 17 Years | 0 (0.0%) | 0 (0.0%) |
| 18 to 24 Years | 0 (0.0%) | 0 (0.0%) |
| 25 to 34 Years | 0 (0.0%) | 0 (0.0%) |
| 35 to 44 Years | 0 (0.0%) | 0 (0.0%) |
| 45 to 54 Years | 0 (0.0%) | 13 (18.8%) |
| 55 to 64 Years | 0 (0.0%) | 0 (0.0%) |
| 65 to 74 Years | 0 (0.0%) | 19 (70.4%) |
| 75 Years and over | 0 (0.0%) | 0 (0.0%) |
| Total | 13 (6.1%) | 45 (18.8%) |
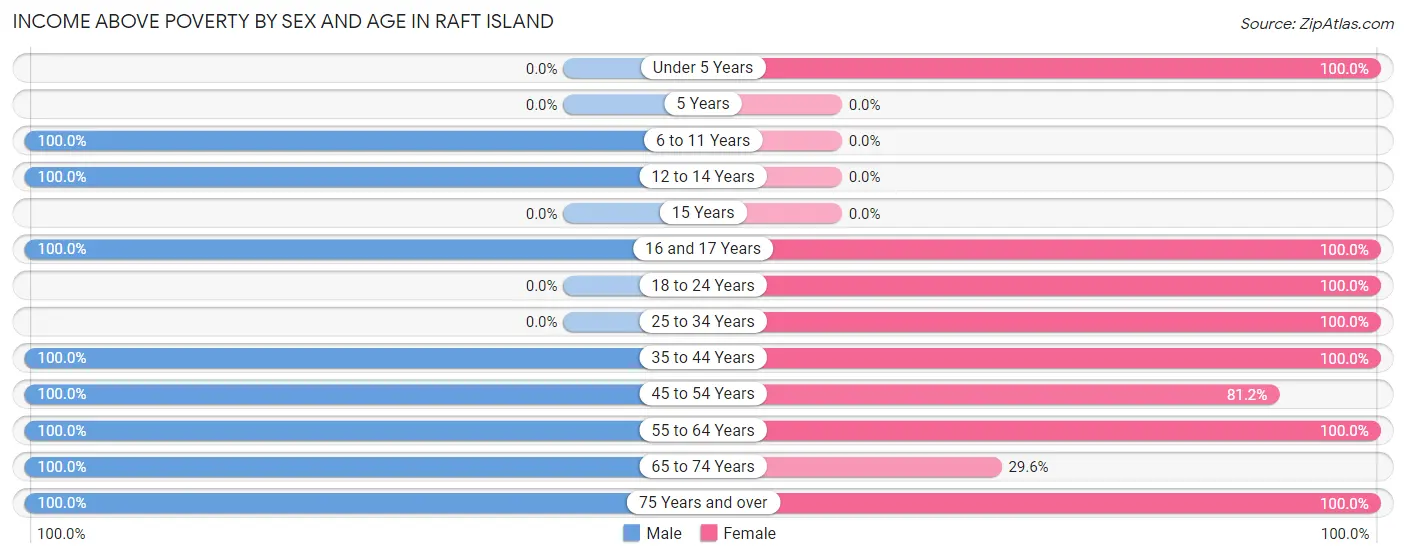
Income Above Poverty by Sex and Age in Raft Island
According to the poverty statistics in Raft Island, males aged 6 to 11 years and females aged under 5 years are the age groups that are most secure financially, with 100.0% of males and 100.0% of females in these age groups living above the poverty line.
| Age Bracket | Male | Female |
| Under 5 Years | 0 (0.0%) | 21 (100.0%) |
| 5 Years | 0 (0.0%) | 0 (0.0%) |
| 6 to 11 Years | 17 (100.0%) | 0 (0.0%) |
| 12 to 14 Years | 27 (100.0%) | 0 (0.0%) |
| 15 Years | 0 (0.0%) | 0 (0.0%) |
| 16 and 17 Years | 10 (100.0%) | 17 (100.0%) |
| 18 to 24 Years | 0 (0.0%) | 10 (100.0%) |
| 25 to 34 Years | 0 (0.0%) | 22 (100.0%) |
| 35 to 44 Years | 25 (100.0%) | 15 (100.0%) |
| 45 to 54 Years | 20 (100.0%) | 56 (81.2%) |
| 55 to 64 Years | 62 (100.0%) | 18 (100.0%) |
| 65 to 74 Years | 14 (100.0%) | 8 (29.6%) |
| 75 Years and over | 24 (100.0%) | 27 (100.0%) |
| Total | 199 (93.9%) | 194 (81.2%) |
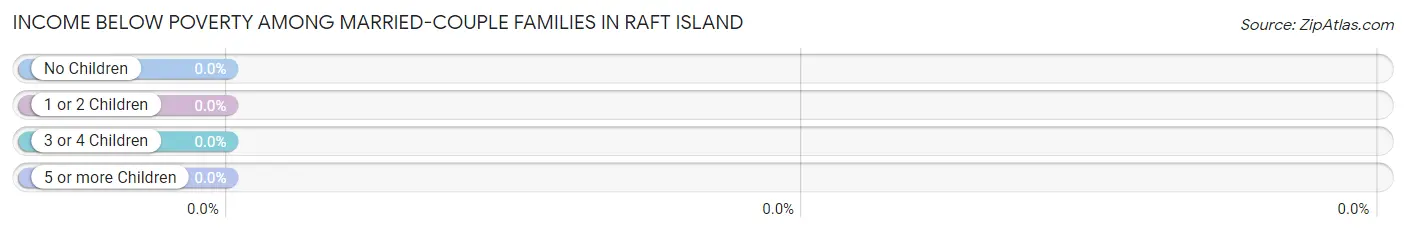
Income Below Poverty Among Married-Couple Families in Raft Island
| Children | Above Poverty | Below Poverty |
| No Children | 32 (100.0%) | 0 (0.0%) |
| 1 or 2 Children | 31 (100.0%) | 0 (0.0%) |
| 3 or 4 Children | 15 (100.0%) | 0 (0.0%) |
| 5 or more Children | 0 (0.0%) | 0 (0.0%) |
| Total | 78 (100.0%) | 0 (0.0%) |
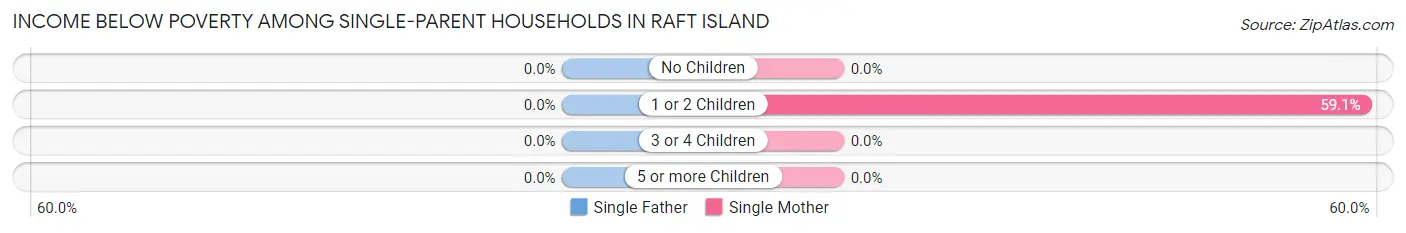
Income Below Poverty Among Single-Parent Households in Raft Island
| Children | Single Father | Single Mother |
| No Children | 0 (0.0%) | 0 (0.0%) |
| 1 or 2 Children | 0 (0.0%) | 13 (59.1%) |
| 3 or 4 Children | 0 (0.0%) | 0 (0.0%) |
| 5 or more Children | 0 (0.0%) | 0 (0.0%) |
| Total | 0 (0.0%) | 13 (59.1%) |
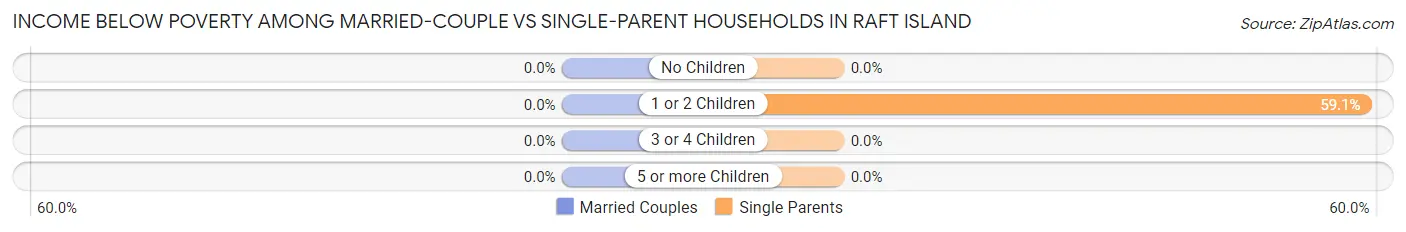
Income Below Poverty Among Married-Couple vs Single-Parent Households in Raft Island
| Children | Married-Couple Families | Single-Parent Households |
| No Children | 0 (0.0%) | 0 (0.0%) |
| 1 or 2 Children | 0 (0.0%) | 13 (59.1%) |
| 3 or 4 Children | 0 (0.0%) | 0 (0.0%) |
| 5 or more Children | 0 (0.0%) | 0 (0.0%) |
| Total | 0 (0.0%) | 13 (59.1%) |
Employment Characteristics in Raft Island
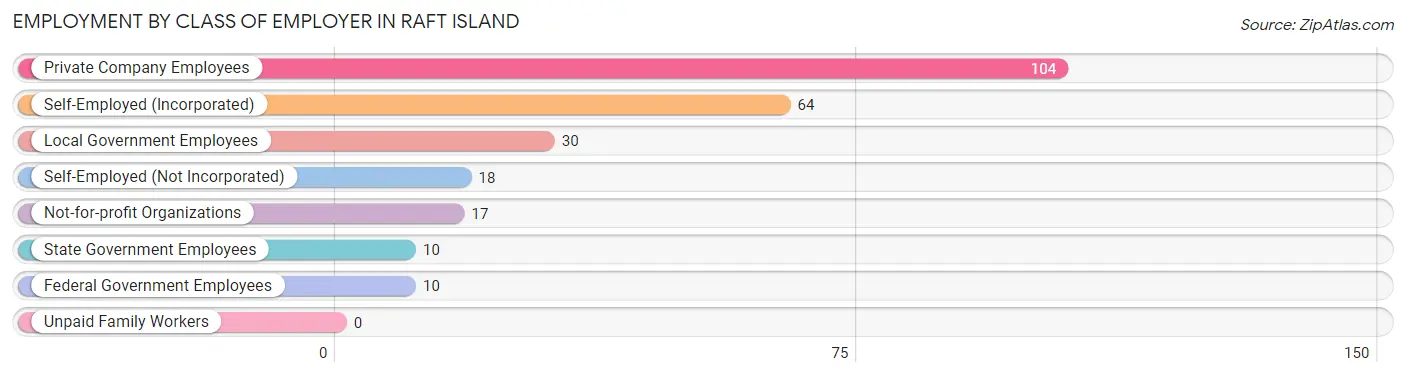
Employment by Class of Employer in Raft Island
Among the 253 employed individuals in Raft Island, private company employees (104 | 41.1%), self-employed (incorporated) (64 | 25.3%), and local government employees (30 | 11.9%) make up the most common classes of employment.
| Employer Class | # Employees | % Employees |
| Private Company Employees | 104 | 41.1% |
| Self-Employed (Incorporated) | 64 | 25.3% |
| Self-Employed (Not Incorporated) | 18 | 7.1% |
| Not-for-profit Organizations | 17 | 6.7% |
| Local Government Employees | 30 | 11.9% |
| State Government Employees | 10 | 4.0% |
| Federal Government Employees | 10 | 4.0% |
| Unpaid Family Workers | 0 | 0.0% |
| Total | 253 | 100.0% |
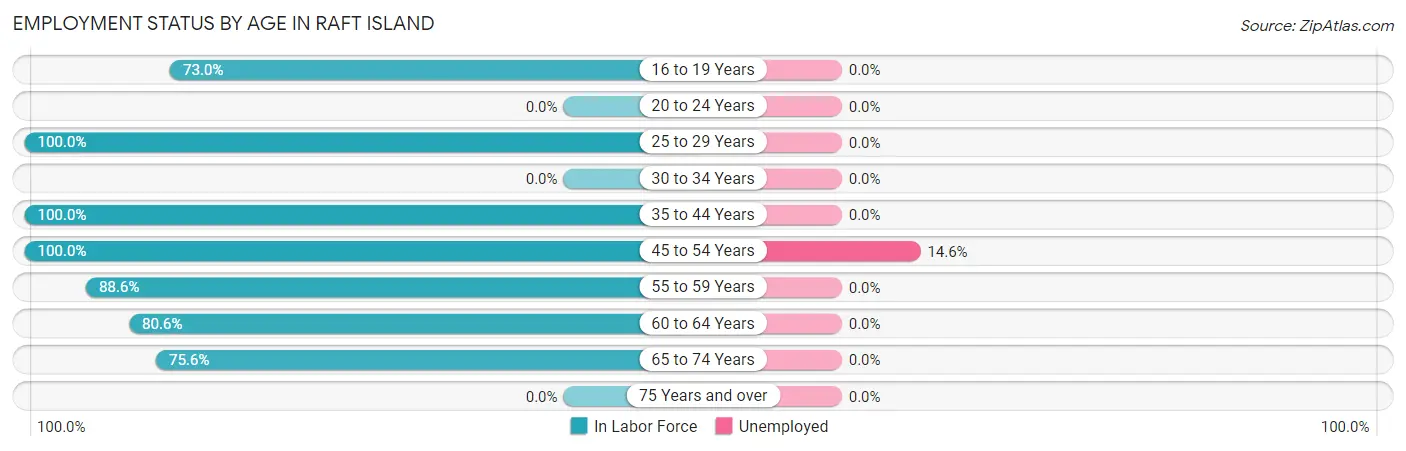
Employment Status by Age in Raft Island
According to the labor force statistics for Raft Island, out of the total population over 16 years of age (360), 73.9% or 266 individuals are in the labor force, with 4.9% or 13 of them unemployed. The age group with the highest labor force participation rate is 25 to 29 years, with 100.0% or 11 individuals in the labor force. Within the labor force, the 45 to 54 years age range has the highest percentage of unemployed individuals, with 14.6% or 13 of them being unemployed.
| Age Bracket | In Labor Force | Unemployed |
| 16 to 19 Years | 27 (73.0%) | 0 (0.0%) |
| 20 to 24 Years | 0 (0.0%) | 0 (0.0%) |
| 25 to 29 Years | 11 (100.0%) | 0 (0.0%) |
| 30 to 34 Years | 0 (0.0%) | 0 (0.0%) |
| 35 to 44 Years | 40 (100.0%) | 0 (0.0%) |
| 45 to 54 Years | 89 (100.0%) | 13 (14.6%) |
| 55 to 59 Years | 39 (88.6%) | 0 (0.0%) |
| 60 to 64 Years | 29 (80.6%) | 0 (0.0%) |
| 65 to 74 Years | 31 (75.6%) | 0 (0.0%) |
| 75 Years and over | 0 (0.0%) | 0 (0.0%) |
| Total | 266 (73.9%) | 13 (4.9%) |
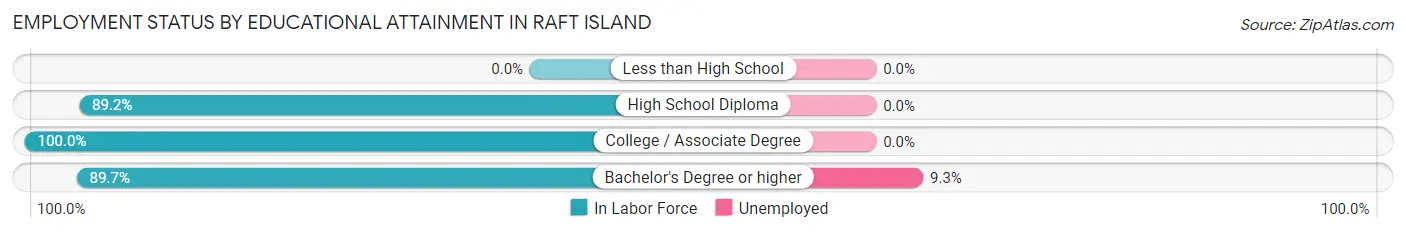
Employment Status by Educational Attainment in Raft Island
According to labor force statistics for Raft Island, 90.0% of individuals (208) out of the total population between 25 and 64 years of age (231) are in the labor force, with 6.3% or 13 of them being unemployed. The group with the highest labor force participation rate are those with the educational attainment of college / associate degree, with 100.0% or 10 individuals in the labor force. Within the labor force, individuals with bachelor's degree or higher education have the highest percentage of unemployment, with 9.3% or 13 of them being unemployed.
| Educational Attainment | In Labor Force | Unemployed |
| Less than High School | 0 (0.0%) | 0 (0.0%) |
| High School Diploma | 58 (89.2%) | 0 (0.0%) |
| College / Associate Degree | 10 (100.0%) | 0 (0.0%) |
| Bachelor's Degree or higher | 140 (89.7%) | 15 (9.3%) |
| Total | 208 (90.0%) | 15 (6.3%) |
Employment Occupations by Sex in Raft Island
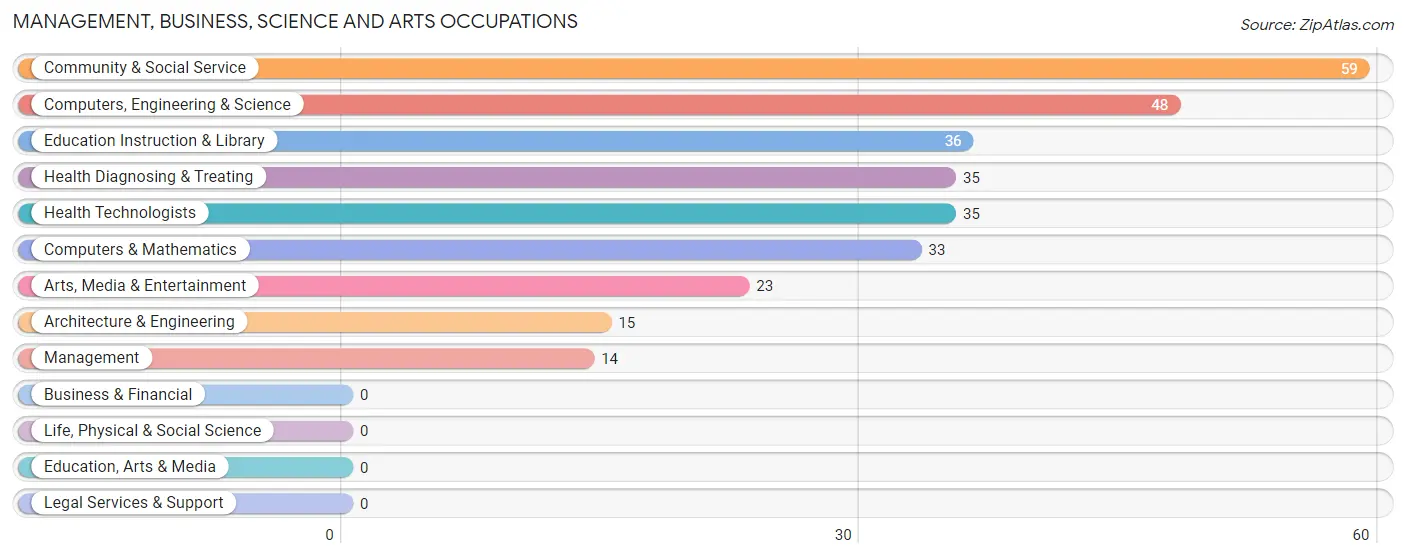
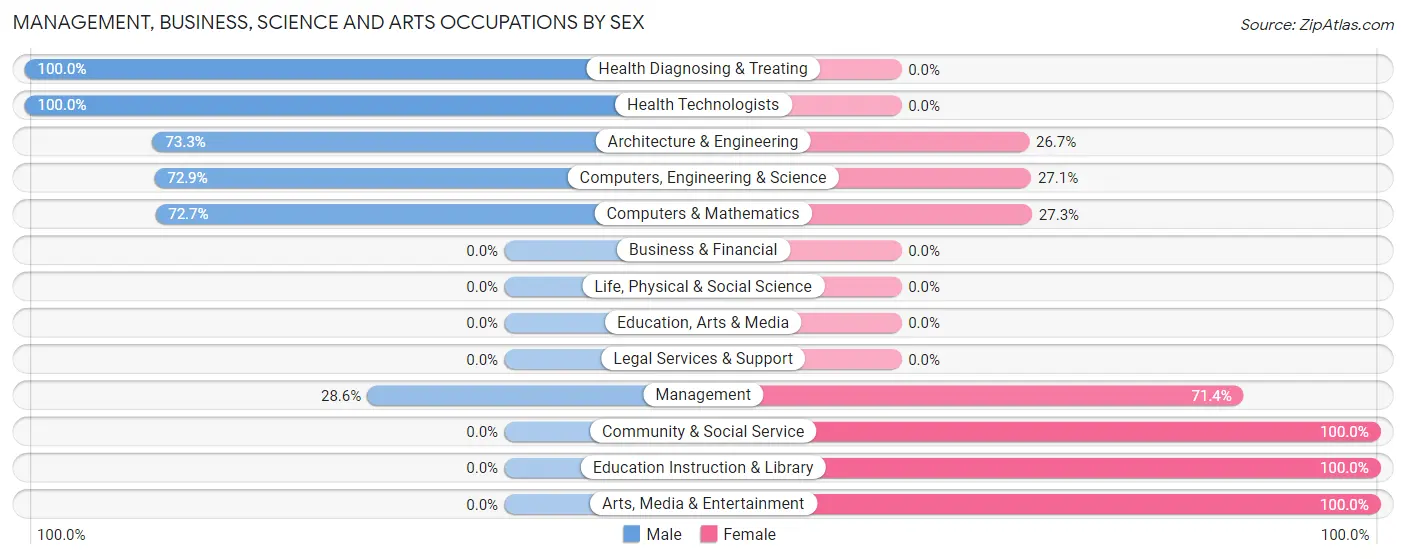
Management, Business, Science and Arts Occupations
The most common Management, Business, Science and Arts occupations in Raft Island are Community & Social Service (59 | 23.3%), Computers, Engineering & Science (48 | 19.0%), Education Instruction & Library (36 | 14.2%), Health Diagnosing & Treating (35 | 13.8%), and Health Technologists (35 | 13.8%).
Management, Business, Science and Arts Occupations by Sex
Within the Management, Business, Science and Arts occupations in Raft Island, the most male-oriented occupations are Health Diagnosing & Treating (100.0%), Health Technologists (100.0%), and Architecture & Engineering (73.3%), while the most female-oriented occupations are Community & Social Service (100.0%), Education Instruction & Library (100.0%), and Arts, Media & Entertainment (100.0%).
| Occupation | Male | Female |
| Management | 4 (28.6%) | 10 (71.4%) |
| Business & Financial | 0 (0.0%) | 0 (0.0%) |
| Computers, Engineering & Science | 35 (72.9%) | 13 (27.1%) |
| Computers & Mathematics | 24 (72.7%) | 9 (27.3%) |
| Architecture & Engineering | 11 (73.3%) | 4 (26.7%) |
| Life, Physical & Social Science | 0 (0.0%) | 0 (0.0%) |
| Community & Social Service | 0 (0.0%) | 59 (100.0%) |
| Education, Arts & Media | 0 (0.0%) | 0 (0.0%) |
| Legal Services & Support | 0 (0.0%) | 0 (0.0%) |
| Education Instruction & Library | 0 (0.0%) | 36 (100.0%) |
| Arts, Media & Entertainment | 0 (0.0%) | 23 (100.0%) |
| Health Diagnosing & Treating | 35 (100.0%) | 0 (0.0%) |
| Health Technologists | 35 (100.0%) | 0 (0.0%) |
| Total (Category) | 74 (47.4%) | 82 (52.6%) |
| Total (Overall) | 114 (45.1%) | 139 (54.9%) |
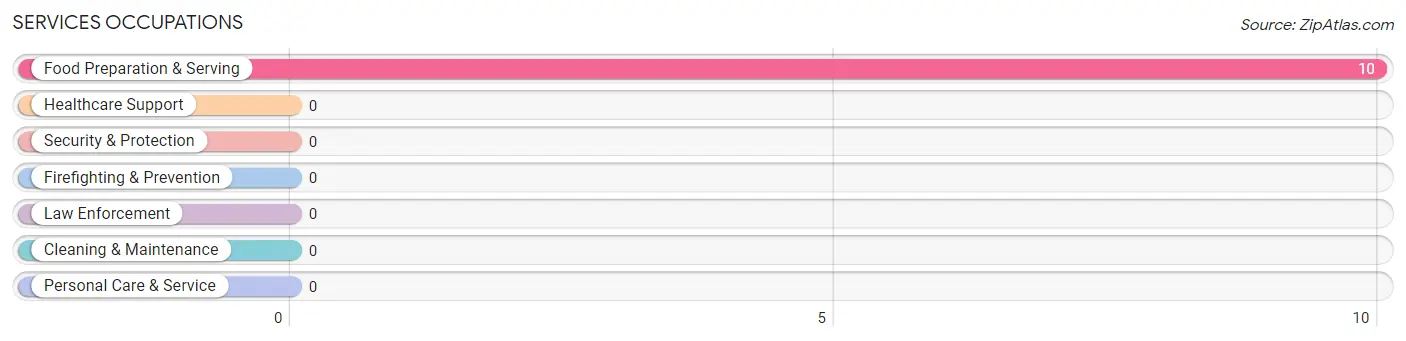
Services Occupations
The most common Services occupations in Raft Island are , and Food Preparation & Serving (10 | 4.0%).
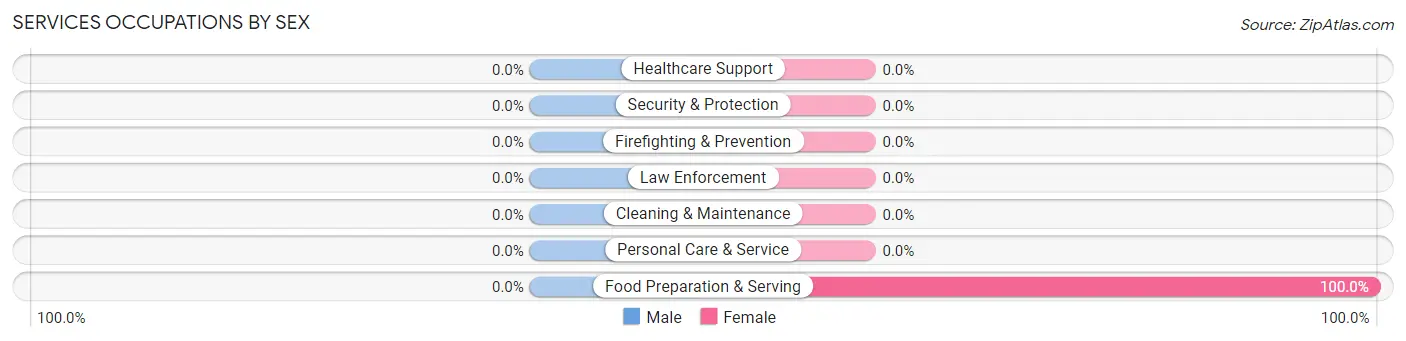
Services Occupations by Sex
| Occupation | Male | Female |
| Healthcare Support | 0 (0.0%) | 0 (0.0%) |
| Security & Protection | 0 (0.0%) | 0 (0.0%) |
| Firefighting & Prevention | 0 (0.0%) | 0 (0.0%) |
| Law Enforcement | 0 (0.0%) | 0 (0.0%) |
| Food Preparation & Serving | 0 (0.0%) | 10 (100.0%) |
| Cleaning & Maintenance | 0 (0.0%) | 0 (0.0%) |
| Personal Care & Service | 0 (0.0%) | 0 (0.0%) |
| Total (Category) | 0 (0.0%) | 10 (100.0%) |
| Total (Overall) | 114 (45.1%) | 139 (54.9%) |
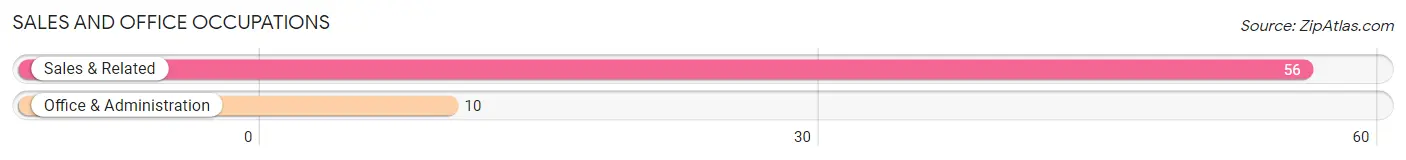
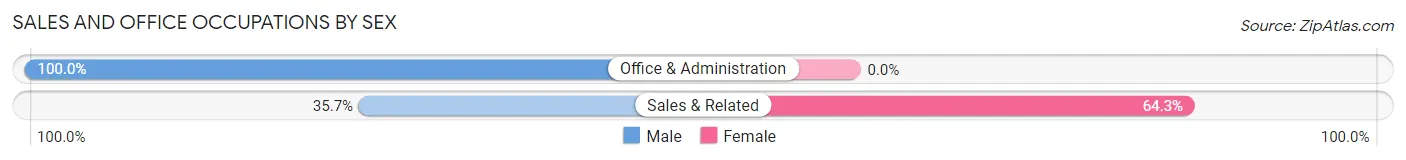
Sales and Office Occupations
The most common Sales and Office occupations in Raft Island are Sales & Related (56 | 22.1%), and Office & Administration (10 | 4.0%).
Sales and Office Occupations by Sex
| Occupation | Male | Female |
| Sales & Related | 20 (35.7%) | 36 (64.3%) |
| Office & Administration | 10 (100.0%) | 0 (0.0%) |
| Total (Category) | 30 (45.5%) | 36 (54.5%) |
| Total (Overall) | 114 (45.1%) | 139 (54.9%) |
Natural Resources, Construction and Maintenance Occupations
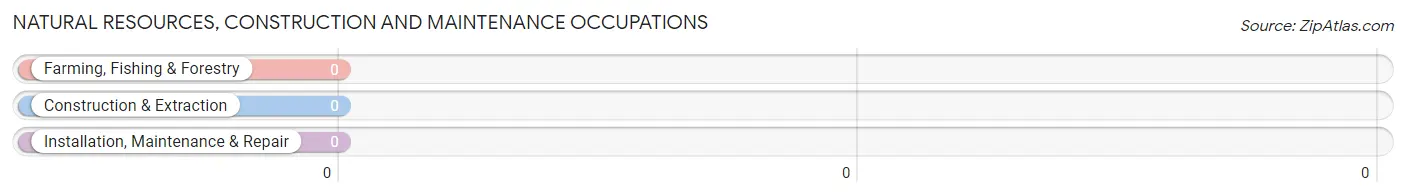
Natural Resources, Construction and Maintenance Occupations by Sex
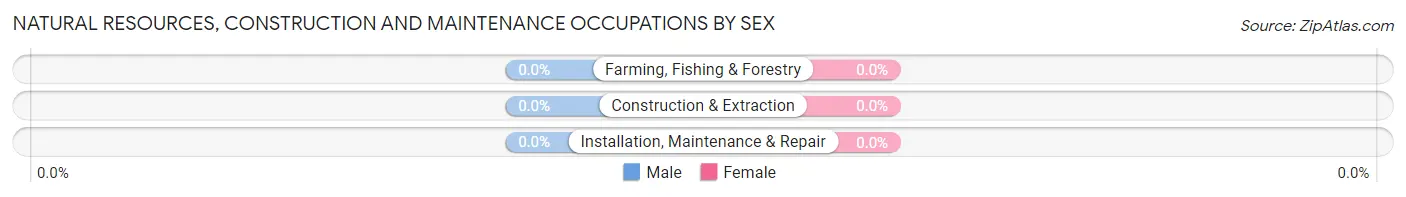
| Occupation | Male | Female |
| Farming, Fishing & Forestry | 0 (0.0%) | 0 (0.0%) |
| Construction & Extraction | 0 (0.0%) | 0 (0.0%) |
| Installation, Maintenance & Repair | 0 (0.0%) | 0 (0.0%) |
| Total (Category) | 0 (0.0%) | 0 (0.0%) |
| Total (Overall) | 114 (45.1%) | 139 (54.9%) |
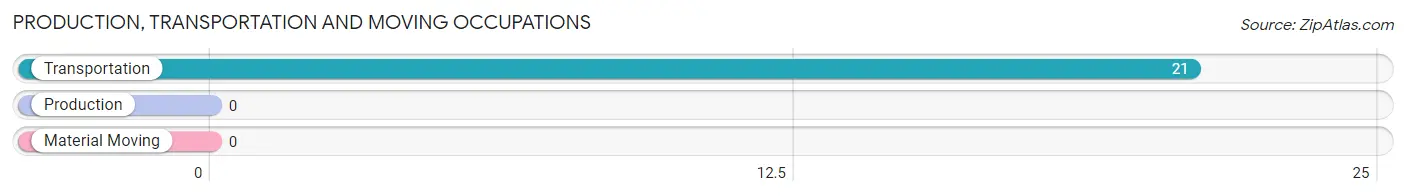
Production, Transportation and Moving Occupations
The most common Production, Transportation and Moving occupations in Raft Island are , and Transportation (21 | 8.3%).
Production, Transportation and Moving Occupations by Sex
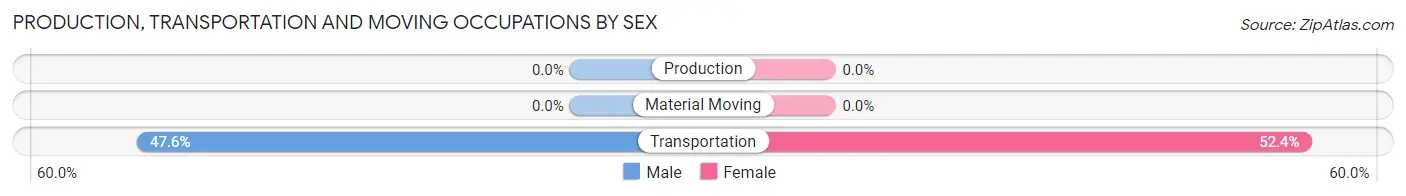
| Occupation | Male | Female |
| Production | 0 (0.0%) | 0 (0.0%) |
| Transportation | 10 (47.6%) | 11 (52.4%) |
| Material Moving | 0 (0.0%) | 0 (0.0%) |
| Total (Category) | 10 (47.6%) | 11 (52.4%) |
| Total (Overall) | 114 (45.1%) | 139 (54.9%) |
Employment Industries by Sex in Raft Island
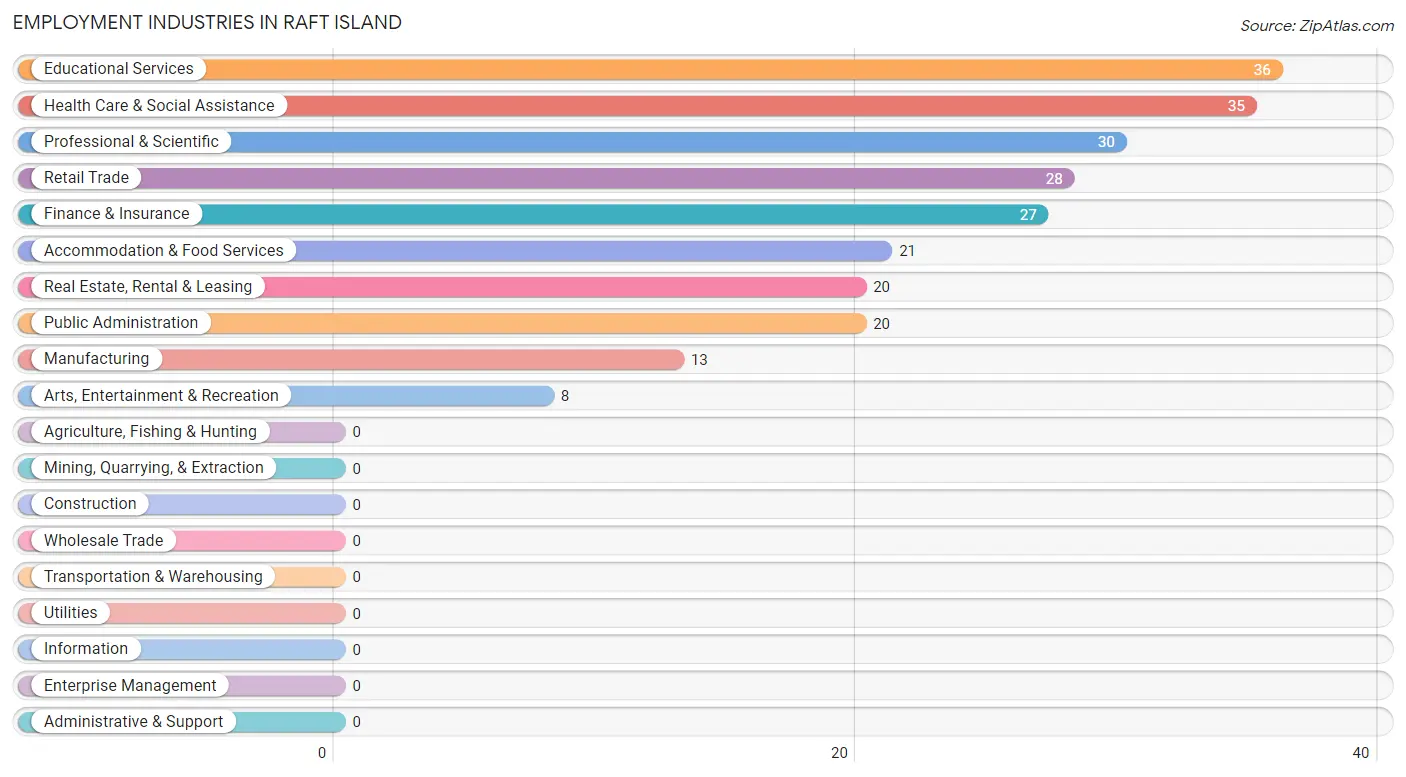
Employment Industries in Raft Island
The major employment industries in Raft Island include Educational Services (36 | 14.2%), Health Care & Social Assistance (35 | 13.8%), Professional & Scientific (30 | 11.9%), Retail Trade (28 | 11.1%), and Finance & Insurance (27 | 10.7%).
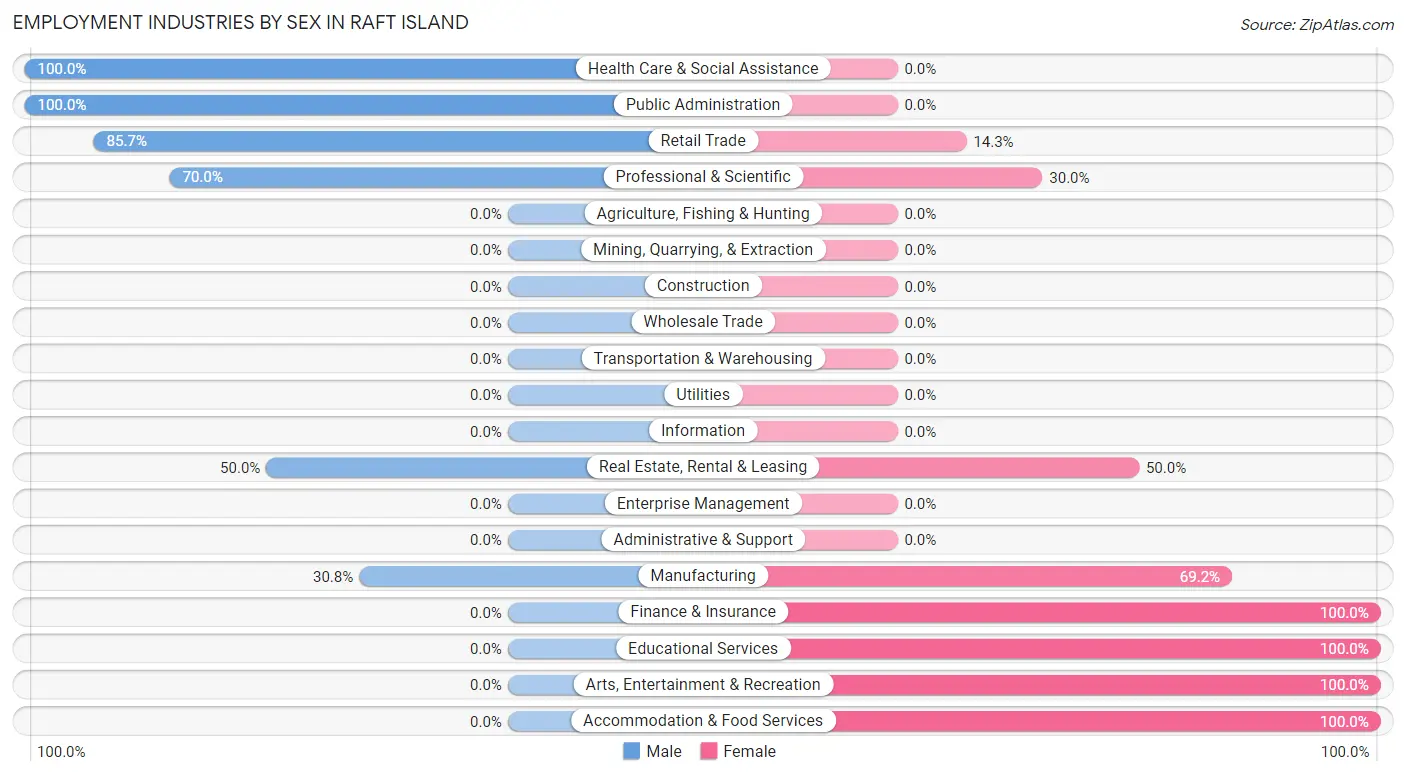
Employment Industries by Sex in Raft Island
The Raft Island industries that see more men than women are Health Care & Social Assistance (100.0%), Public Administration (100.0%), and Retail Trade (85.7%), whereas the industries that tend to have a higher number of women are Finance & Insurance (100.0%), Educational Services (100.0%), and Arts, Entertainment & Recreation (100.0%).
| Industry | Male | Female |
| Agriculture, Fishing & Hunting | 0 (0.0%) | 0 (0.0%) |
| Mining, Quarrying, & Extraction | 0 (0.0%) | 0 (0.0%) |
| Construction | 0 (0.0%) | 0 (0.0%) |
| Manufacturing | 4 (30.8%) | 9 (69.2%) |
| Wholesale Trade | 0 (0.0%) | 0 (0.0%) |
| Retail Trade | 24 (85.7%) | 4 (14.3%) |
| Transportation & Warehousing | 0 (0.0%) | 0 (0.0%) |
| Utilities | 0 (0.0%) | 0 (0.0%) |
| Information | 0 (0.0%) | 0 (0.0%) |
| Finance & Insurance | 0 (0.0%) | 27 (100.0%) |
| Real Estate, Rental & Leasing | 10 (50.0%) | 10 (50.0%) |
| Professional & Scientific | 21 (70.0%) | 9 (30.0%) |
| Enterprise Management | 0 (0.0%) | 0 (0.0%) |
| Administrative & Support | 0 (0.0%) | 0 (0.0%) |
| Educational Services | 0 (0.0%) | 36 (100.0%) |
| Health Care & Social Assistance | 35 (100.0%) | 0 (0.0%) |
| Arts, Entertainment & Recreation | 0 (0.0%) | 8 (100.0%) |
| Accommodation & Food Services | 0 (0.0%) | 21 (100.0%) |
| Public Administration | 20 (100.0%) | 0 (0.0%) |
| Total | 114 (45.1%) | 139 (54.9%) |
Education in Raft Island
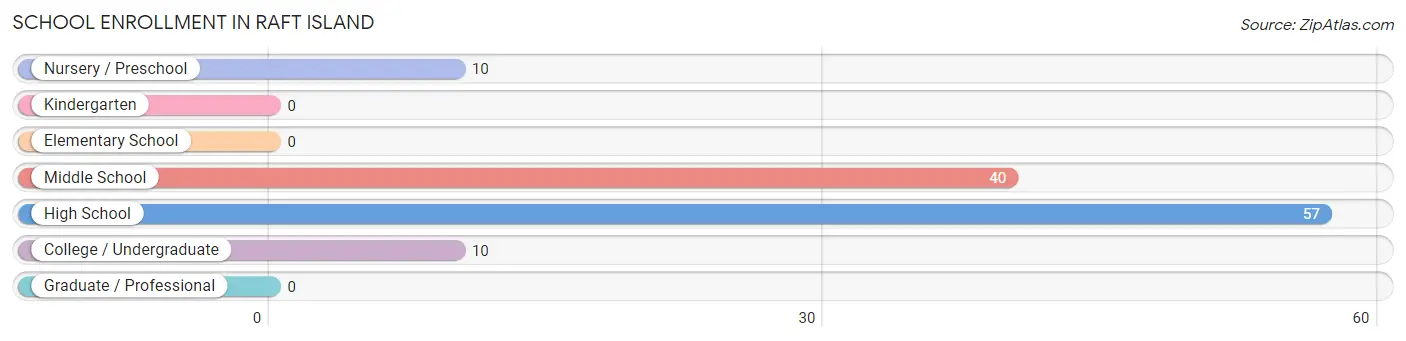
School Enrollment in Raft Island
The most common levels of schooling among the 117 students in Raft Island are high school (57 | 48.7%), middle school (40 | 34.2%), and nursery / preschool (10 | 8.6%).
| School Level | # Students | % Students |
| Nursery / Preschool | 10 | 8.6% |
| Kindergarten | 0 | 0.0% |
| Elementary School | 0 | 0.0% |
| Middle School | 40 | 34.2% |
| High School | 57 | 48.7% |
| College / Undergraduate | 10 | 8.6% |
| Graduate / Professional | 0 | 0.0% |
| Total | 117 | 100.0% |
School Enrollment by Age by Funding Source in Raft Island
Out of a total of 117 students who are enrolled in schools in Raft Island, 27 (23.1%) attend a private institution, while the remaining 90 (76.9%) are enrolled in public schools. The age group of 10 to 14 year olds has the highest likelihood of being enrolled in private schools, with 17 (29.8% in the age bracket) enrolled. Conversely, the age group of 3 to 4 year olds has the lowest likelihood of being enrolled in a private school, with 10 (100.0% in the age bracket) attending a public institution.
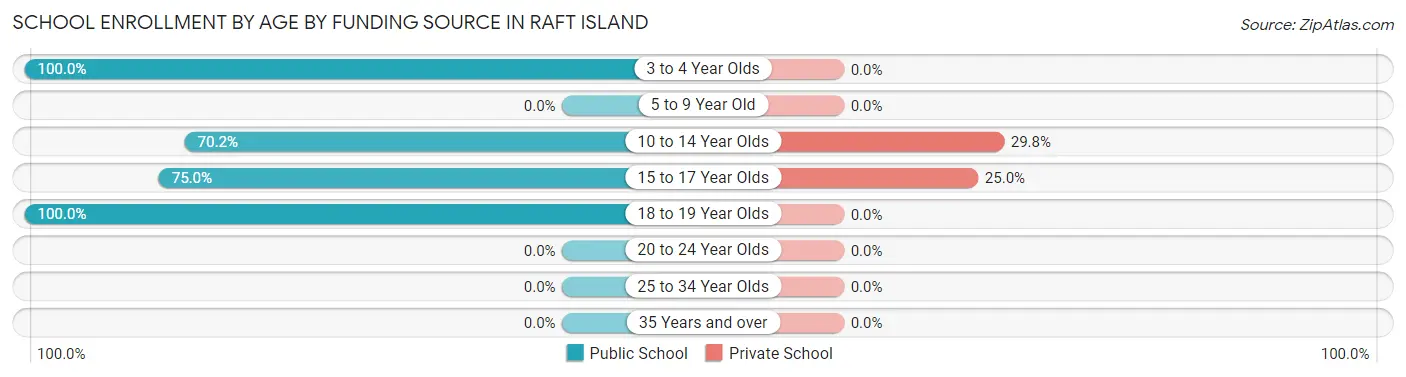
| Age Bracket | Public School | Private School |
| 3 to 4 Year Olds | 10 (100.0%) | 0 (0.0%) |
| 5 to 9 Year Old | 0 (0.0%) | 0 (0.0%) |
| 10 to 14 Year Olds | 40 (70.2%) | 17 (29.8%) |
| 15 to 17 Year Olds | 30 (75.0%) | 10 (25.0%) |
| 18 to 19 Year Olds | 10 (100.0%) | 0 (0.0%) |
| 20 to 24 Year Olds | 0 (0.0%) | 0 (0.0%) |
| 25 to 34 Year Olds | 0 (0.0%) | 0 (0.0%) |
| 35 Years and over | 0 (0.0%) | 0 (0.0%) |
| Total | 90 (76.9%) | 27 (23.1%) |
Educational Attainment by Field of Study in Raft Island
Bio, nature & agricultural (45 | 18.2%), education (44 | 17.8%), business (40 | 16.2%), psychology (25 | 10.1%), and communications (24 | 9.7%) are the most common fields of study among 247 individuals in Raft Island who have obtained a bachelor's degree or higher.
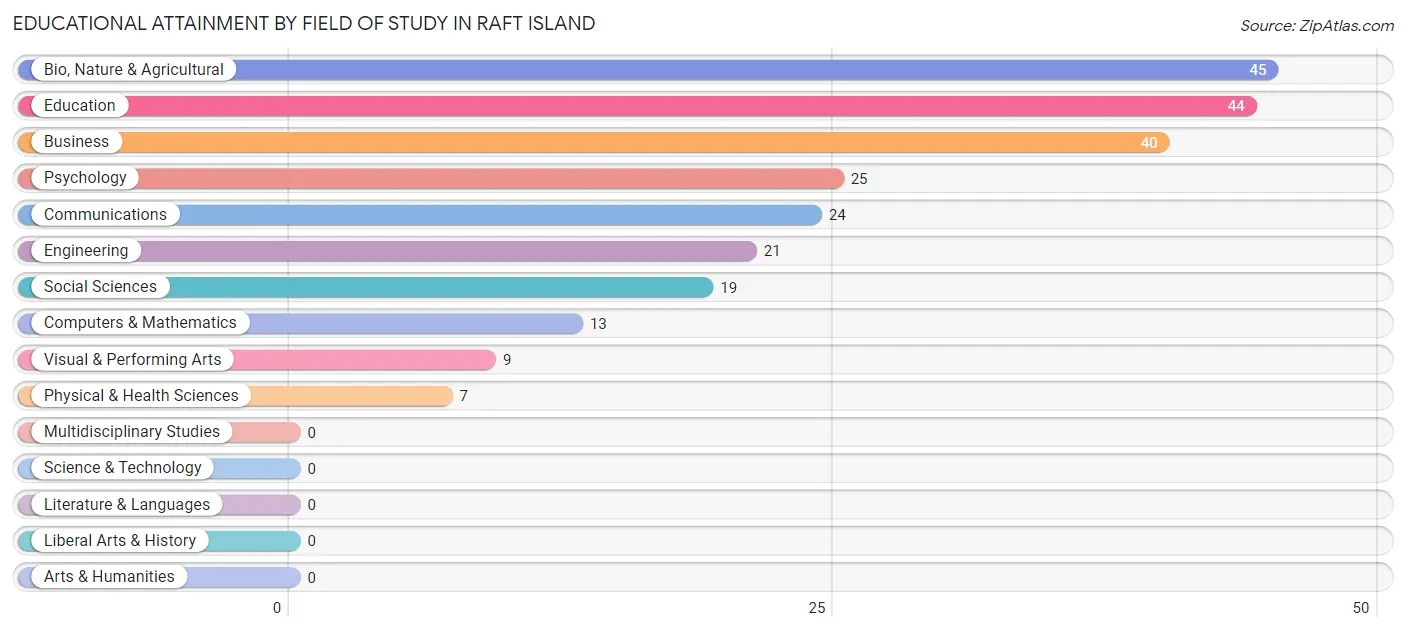
| Field of Study | # Graduates | % Graduates |
| Computers & Mathematics | 13 | 5.3% |
| Bio, Nature & Agricultural | 45 | 18.2% |
| Physical & Health Sciences | 7 | 2.8% |
| Psychology | 25 | 10.1% |
| Social Sciences | 19 | 7.7% |
| Engineering | 21 | 8.5% |
| Multidisciplinary Studies | 0 | 0.0% |
| Science & Technology | 0 | 0.0% |
| Business | 40 | 16.2% |
| Education | 44 | 17.8% |
| Literature & Languages | 0 | 0.0% |
| Liberal Arts & History | 0 | 0.0% |
| Visual & Performing Arts | 9 | 3.6% |
| Communications | 24 | 9.7% |
| Arts & Humanities | 0 | 0.0% |
| Total | 247 | 100.0% |
Transportation & Commute in Raft Island
Vehicle Availability by Sex in Raft Island
The most prevalent vehicle ownership categories in Raft Island are males with 4 vehicles (30, accounting for 26.3%) and females with 4 vehicles (50, making up 21.6%).
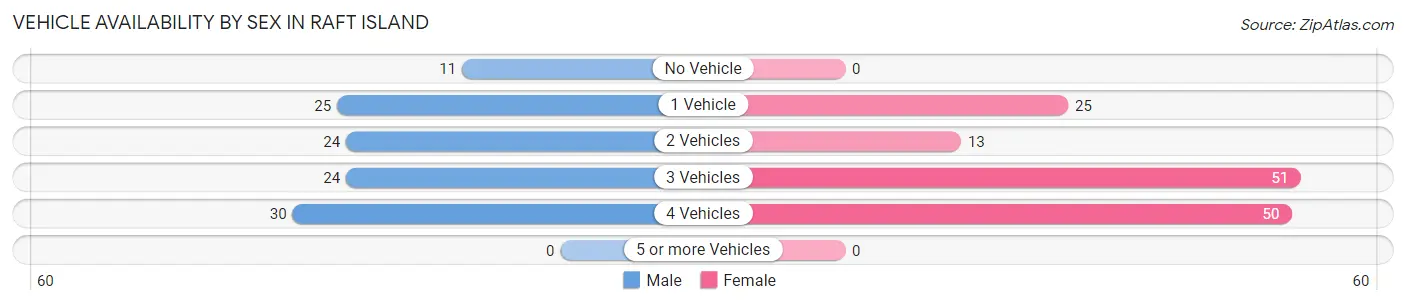
| Vehicles Available | Male | Female |
| No Vehicle | 11 (9.7%) | 0 (0.0%) |
| 1 Vehicle | 25 (21.9%) | 25 (18.0%) |
| 2 Vehicles | 24 (21.0%) | 13 (9.3%) |
| 3 Vehicles | 24 (21.0%) | 51 (36.7%) |
| 4 Vehicles | 30 (26.3%) | 50 (36.0%) |
| 5 or more Vehicles | 0 (0.0%) | 0 (0.0%) |
| Total | 114 (100.0%) | 139 (100.0%) |
Commute Time in Raft Island
The most frequently occuring commute durations in Raft Island are 10 to 14 minutes (67 commuters, 36.8%), 15 to 19 minutes (65 commuters, 35.7%), and 40 to 44 minutes (19 commuters, 10.4%).
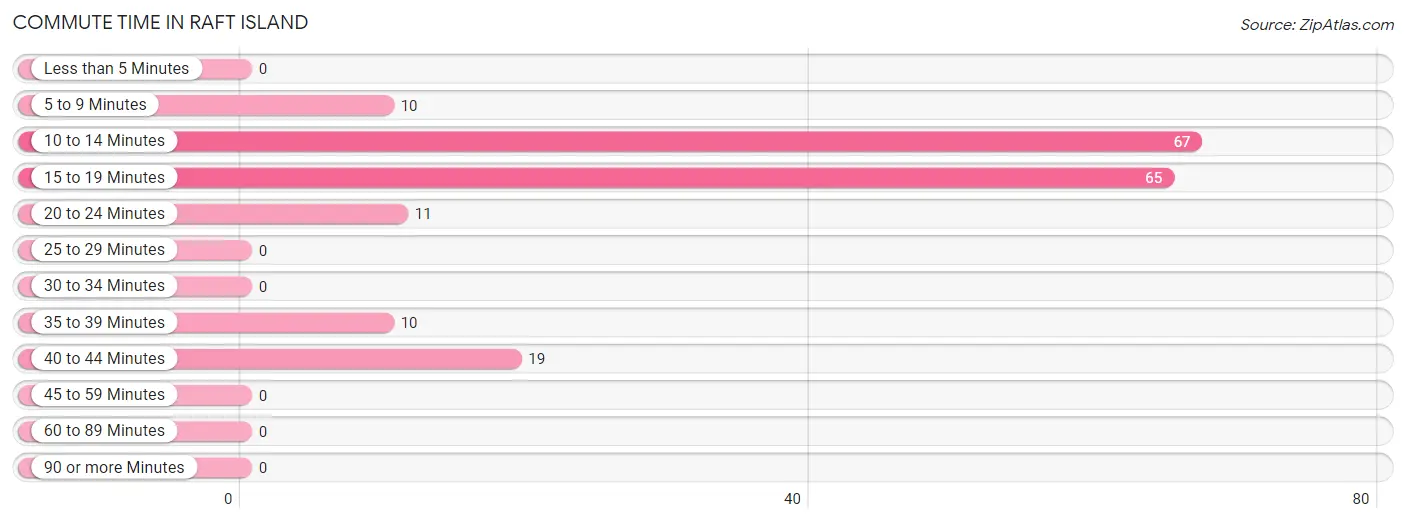
| Commute Time | # Commuters | % Commuters |
| Less than 5 Minutes | 0 | 0.0% |
| 5 to 9 Minutes | 10 | 5.5% |
| 10 to 14 Minutes | 67 | 36.8% |
| 15 to 19 Minutes | 65 | 35.7% |
| 20 to 24 Minutes | 11 | 6.0% |
| 25 to 29 Minutes | 0 | 0.0% |
| 30 to 34 Minutes | 0 | 0.0% |
| 35 to 39 Minutes | 10 | 5.5% |
| 40 to 44 Minutes | 19 | 10.4% |
| 45 to 59 Minutes | 0 | 0.0% |
| 60 to 89 Minutes | 0 | 0.0% |
| 90 or more Minutes | 0 | 0.0% |
Commute Time by Sex in Raft Island
The most common commute times in Raft Island are 15 to 19 minutes (45 commuters, 57.0%) for males and 10 to 14 minutes (53 commuters, 51.5%) for females.
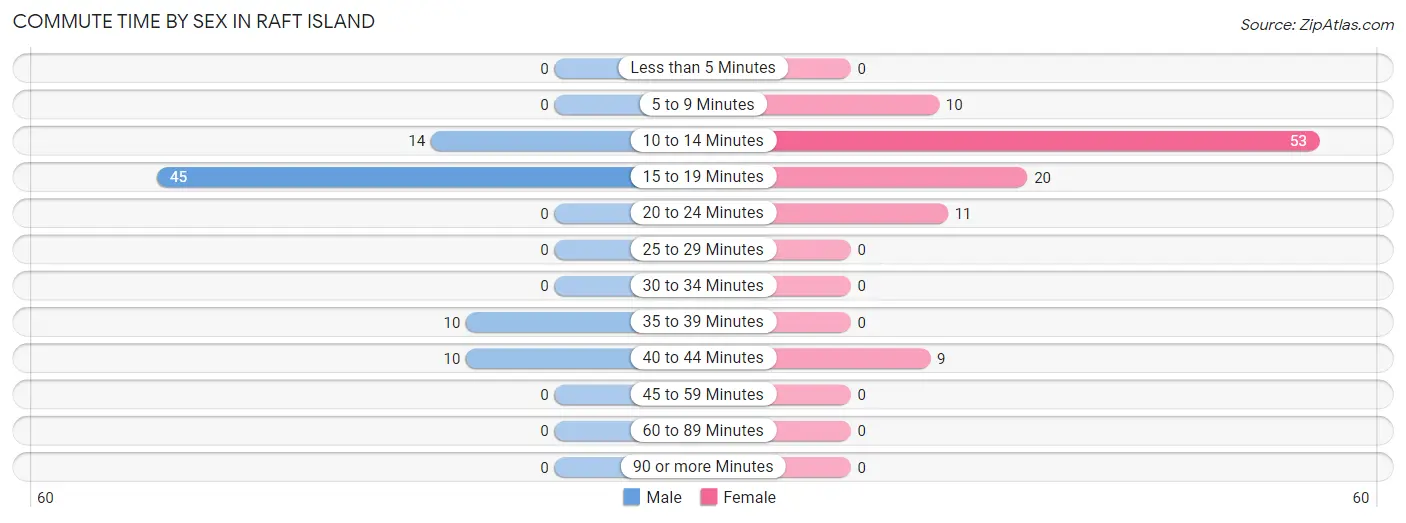
| Commute Time | Male | Female |
| Less than 5 Minutes | 0 (0.0%) | 0 (0.0%) |
| 5 to 9 Minutes | 0 (0.0%) | 10 (9.7%) |
| 10 to 14 Minutes | 14 (17.7%) | 53 (51.5%) |
| 15 to 19 Minutes | 45 (57.0%) | 20 (19.4%) |
| 20 to 24 Minutes | 0 (0.0%) | 11 (10.7%) |
| 25 to 29 Minutes | 0 (0.0%) | 0 (0.0%) |
| 30 to 34 Minutes | 0 (0.0%) | 0 (0.0%) |
| 35 to 39 Minutes | 10 (12.7%) | 0 (0.0%) |
| 40 to 44 Minutes | 10 (12.7%) | 9 (8.7%) |
| 45 to 59 Minutes | 0 (0.0%) | 0 (0.0%) |
| 60 to 89 Minutes | 0 (0.0%) | 0 (0.0%) |
| 90 or more Minutes | 0 (0.0%) | 0 (0.0%) |
Time of Departure to Work by Sex in Raft Island
The most frequent times of departure to work in Raft Island are 7:30 AM to 7:59 AM (25, 31.7%) for males and 8:00 AM to 8:29 AM (46, 44.7%) for females.
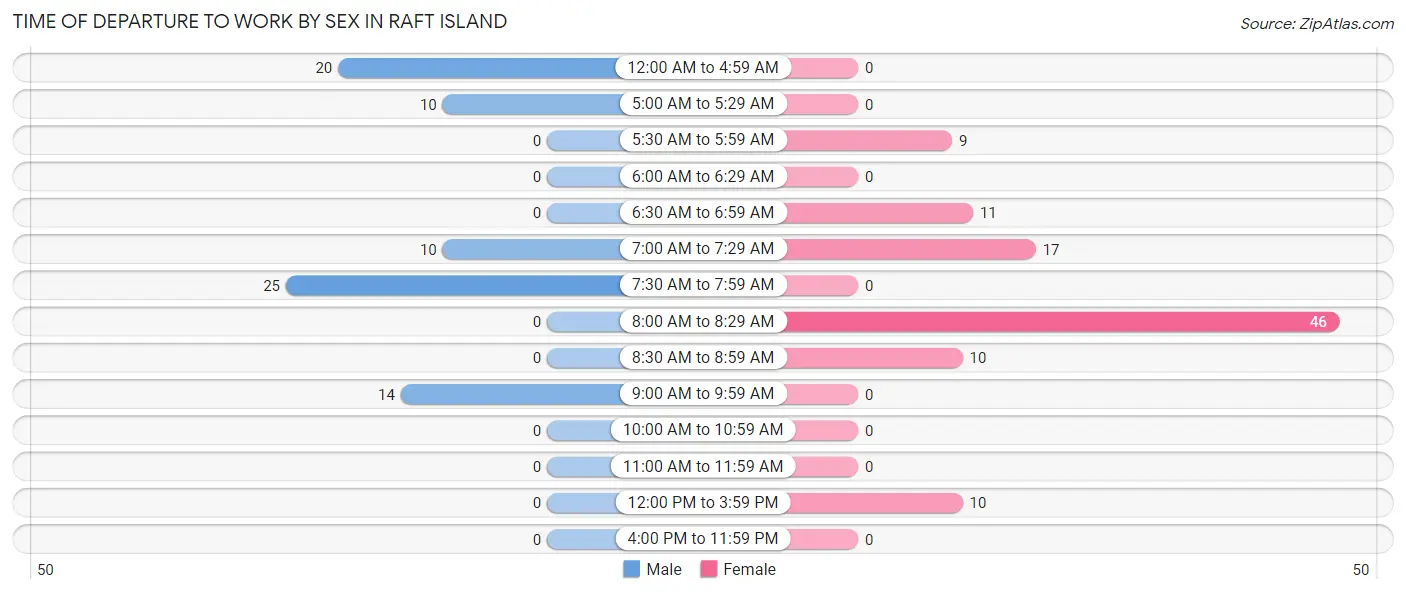
| Time of Departure | Male | Female |
| 12:00 AM to 4:59 AM | 20 (25.3%) | 0 (0.0%) |
| 5:00 AM to 5:29 AM | 10 (12.7%) | 0 (0.0%) |
| 5:30 AM to 5:59 AM | 0 (0.0%) | 9 (8.7%) |
| 6:00 AM to 6:29 AM | 0 (0.0%) | 0 (0.0%) |
| 6:30 AM to 6:59 AM | 0 (0.0%) | 11 (10.7%) |
| 7:00 AM to 7:29 AM | 10 (12.7%) | 17 (16.5%) |
| 7:30 AM to 7:59 AM | 25 (31.7%) | 0 (0.0%) |
| 8:00 AM to 8:29 AM | 0 (0.0%) | 46 (44.7%) |
| 8:30 AM to 8:59 AM | 0 (0.0%) | 10 (9.7%) |
| 9:00 AM to 9:59 AM | 14 (17.7%) | 0 (0.0%) |
| 10:00 AM to 10:59 AM | 0 (0.0%) | 0 (0.0%) |
| 11:00 AM to 11:59 AM | 0 (0.0%) | 0 (0.0%) |
| 12:00 PM to 3:59 PM | 0 (0.0%) | 10 (9.7%) |
| 4:00 PM to 11:59 PM | 0 (0.0%) | 0 (0.0%) |
| Total | 79 (100.0%) | 103 (100.0%) |
Housing Occupancy in Raft Island
Occupancy by Ownership in Raft Island
Of the total 210 dwellings in Raft Island, owner-occupied units account for 152 (72.4%), while renter-occupied units make up 58 (27.6%).
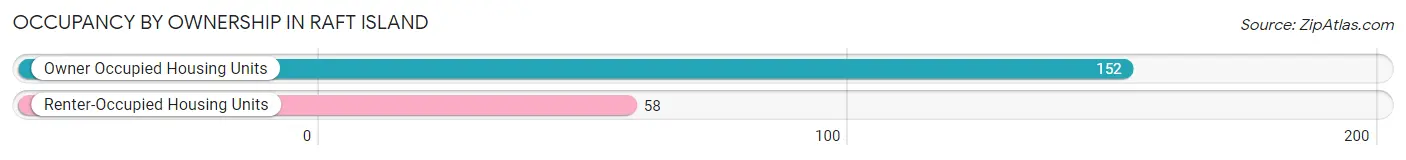
| Occupancy | # Housing Units | % Housing Units |
| Owner Occupied Housing Units | 152 | 72.4% |
| Renter-Occupied Housing Units | 58 | 27.6% |
| Total Occupied Housing Units | 210 | 100.0% |
Occupancy by Household Size in Raft Island
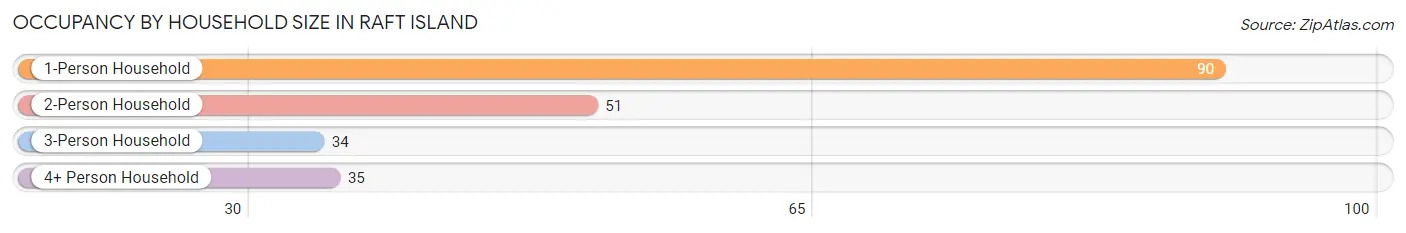
| Household Size | # Housing Units | % Housing Units |
| 1-Person Household | 90 | 42.9% |
| 2-Person Household | 51 | 24.3% |
| 3-Person Household | 34 | 16.2% |
| 4+ Person Household | 35 | 16.7% |
| Total Housing Units | 210 | 100.0% |
Occupancy by Ownership by Household Size in Raft Island
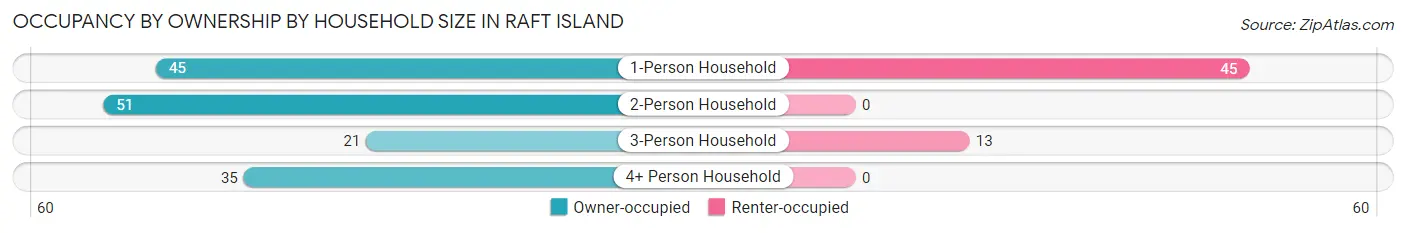
| Household Size | Owner-occupied | Renter-occupied |
| 1-Person Household | 45 (50.0%) | 45 (50.0%) |
| 2-Person Household | 51 (100.0%) | 0 (0.0%) |
| 3-Person Household | 21 (61.8%) | 13 (38.2%) |
| 4+ Person Household | 35 (100.0%) | 0 (0.0%) |
| Total Housing Units | 152 (72.4%) | 58 (27.6%) |
Occupancy by Educational Attainment in Raft Island
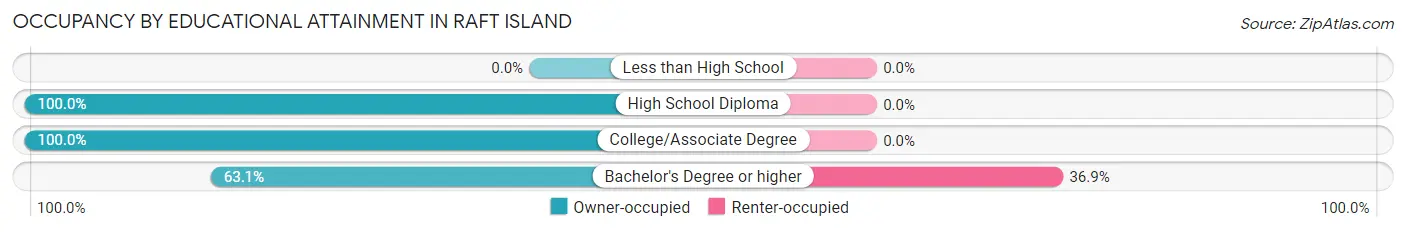
| Household Size | Owner-occupied | Renter-occupied |
| Less than High School | 0 (0.0%) | 0 (0.0%) |
| High School Diploma | 34 (100.0%) | 0 (0.0%) |
| College/Associate Degree | 19 (100.0%) | 0 (0.0%) |
| Bachelor's Degree or higher | 99 (63.1%) | 58 (36.9%) |
Occupancy by Age of Householder in Raft Island
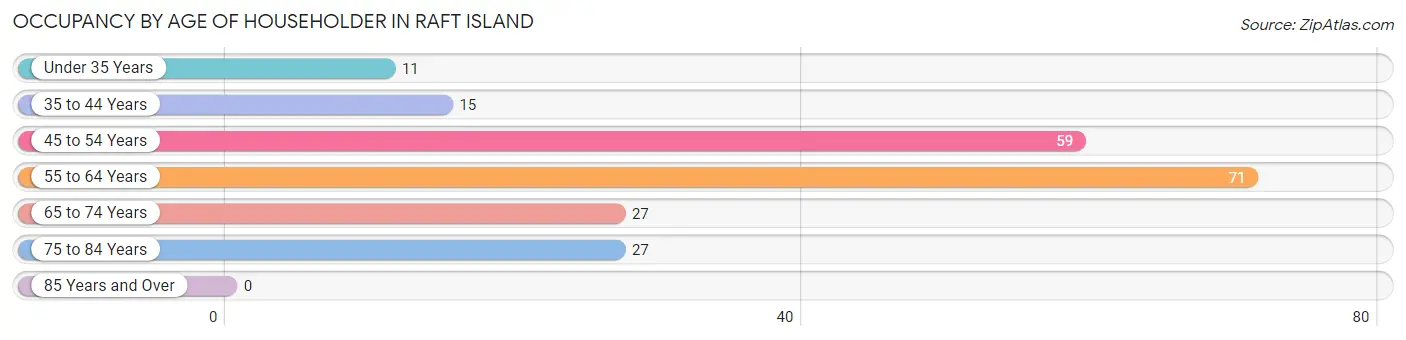
| Age Bracket | # Households | % Households |
| Under 35 Years | 11 | 5.2% |
| 35 to 44 Years | 15 | 7.1% |
| 45 to 54 Years | 59 | 28.1% |
| 55 to 64 Years | 71 | 33.8% |
| 65 to 74 Years | 27 | 12.9% |
| 75 to 84 Years | 27 | 12.9% |
| 85 Years and Over | 0 | 0.0% |
| Total | 210 | 100.0% |
Housing Finances in Raft Island
Median Income by Occupancy in Raft Island
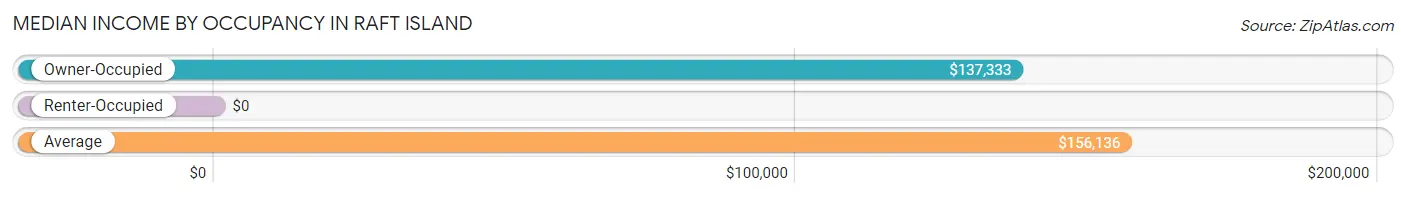
| Occupancy Type | # Households | Median Income |
| Owner-Occupied | 152 (72.4%) | $137,333 |
| Renter-Occupied | 58 (27.6%) | $0 |
| Average | 210 (100.0%) | $156,136 |
Occupancy by Householder Income Bracket in Raft Island
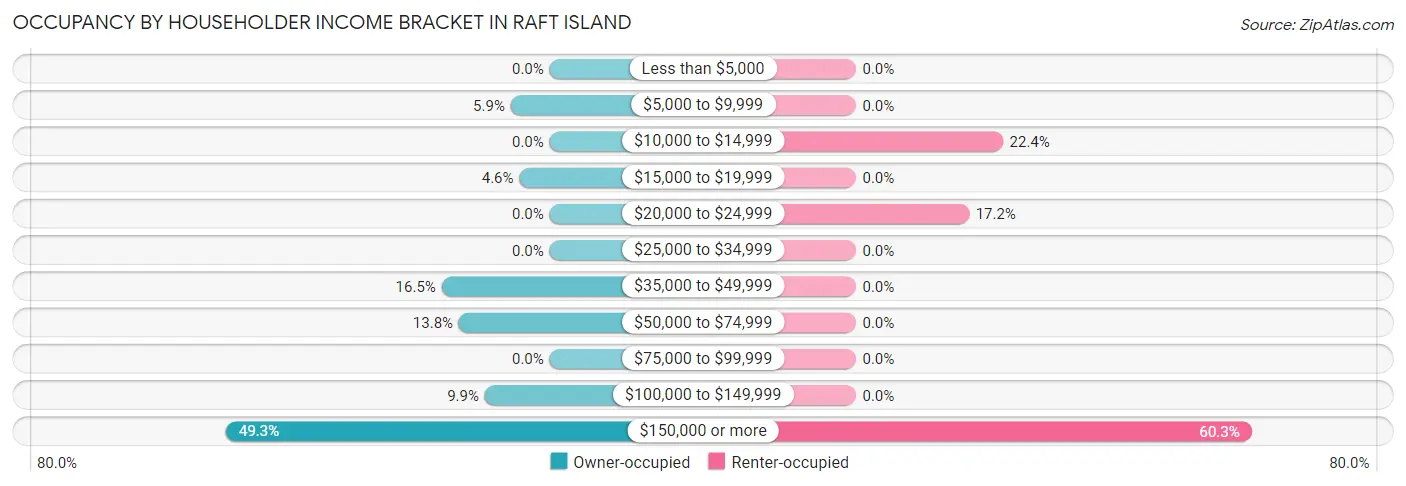
| Income Bracket | Owner-occupied | Renter-occupied |
| Less than $5,000 | 0 (0.0%) | 0 (0.0%) |
| $5,000 to $9,999 | 9 (5.9%) | 0 (0.0%) |
| $10,000 to $14,999 | 0 (0.0%) | 13 (22.4%) |
| $15,000 to $19,999 | 7 (4.6%) | 0 (0.0%) |
| $20,000 to $24,999 | 0 (0.0%) | 10 (17.2%) |
| $25,000 to $34,999 | 0 (0.0%) | 0 (0.0%) |
| $35,000 to $49,999 | 25 (16.5%) | 0 (0.0%) |
| $50,000 to $74,999 | 21 (13.8%) | 0 (0.0%) |
| $75,000 to $99,999 | 0 (0.0%) | 0 (0.0%) |
| $100,000 to $149,999 | 15 (9.9%) | 0 (0.0%) |
| $150,000 or more | 75 (49.3%) | 35 (60.3%) |
| Total | 152 (100.0%) | 58 (100.0%) |
Monthly Housing Cost Tiers in Raft Island
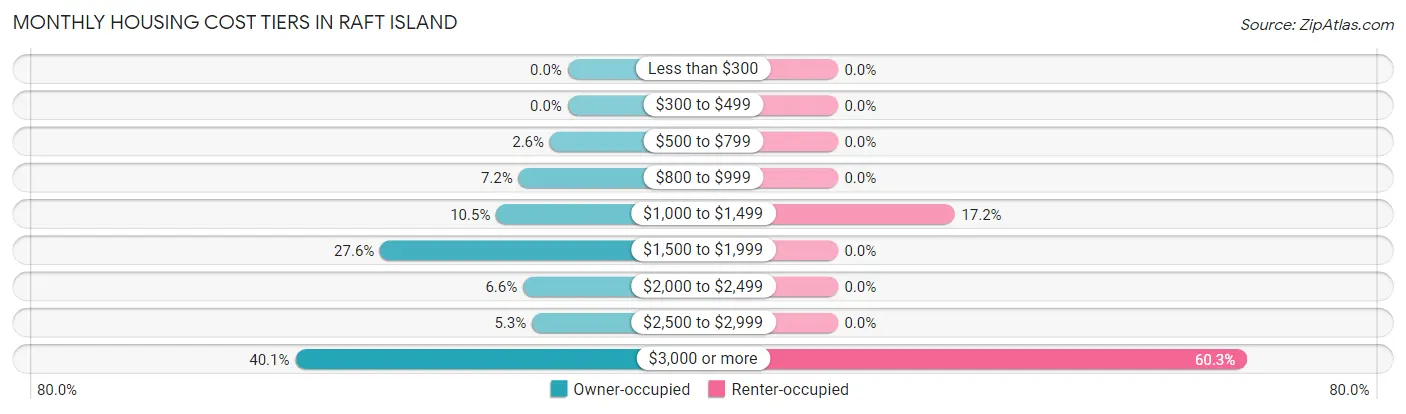
| Monthly Cost | Owner-occupied | Renter-occupied |
| Less than $300 | 0 (0.0%) | 0 (0.0%) |
| $300 to $499 | 0 (0.0%) | 0 (0.0%) |
| $500 to $799 | 4 (2.6%) | 0 (0.0%) |
| $800 to $999 | 11 (7.2%) | 0 (0.0%) |
| $1,000 to $1,499 | 16 (10.5%) | 10 (17.2%) |
| $1,500 to $1,999 | 42 (27.6%) | 0 (0.0%) |
| $2,000 to $2,499 | 10 (6.6%) | 0 (0.0%) |
| $2,500 to $2,999 | 8 (5.3%) | 0 (0.0%) |
| $3,000 or more | 61 (40.1%) | 35 (60.3%) |
| Total | 152 (100.0%) | 58 (100.0%) |
Physical Housing Characteristics in Raft Island
Housing Structures in Raft Island
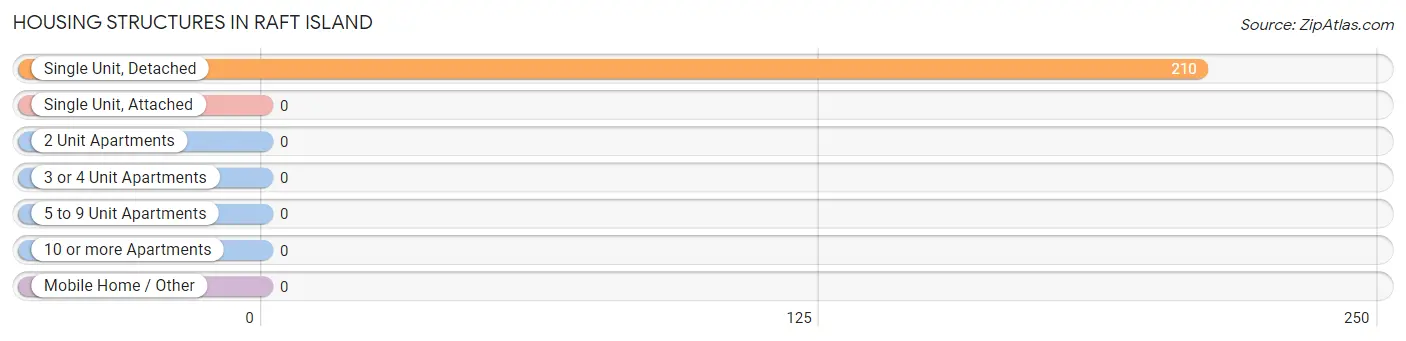
| Structure Type | # Housing Units | % Housing Units |
| Single Unit, Detached | 210 | 100.0% |
| Single Unit, Attached | 0 | 0.0% |
| 2 Unit Apartments | 0 | 0.0% |
| 3 or 4 Unit Apartments | 0 | 0.0% |
| 5 to 9 Unit Apartments | 0 | 0.0% |
| 10 or more Apartments | 0 | 0.0% |
| Mobile Home / Other | 0 | 0.0% |
| Total | 210 | 100.0% |
Housing Structures by Occupancy in Raft Island
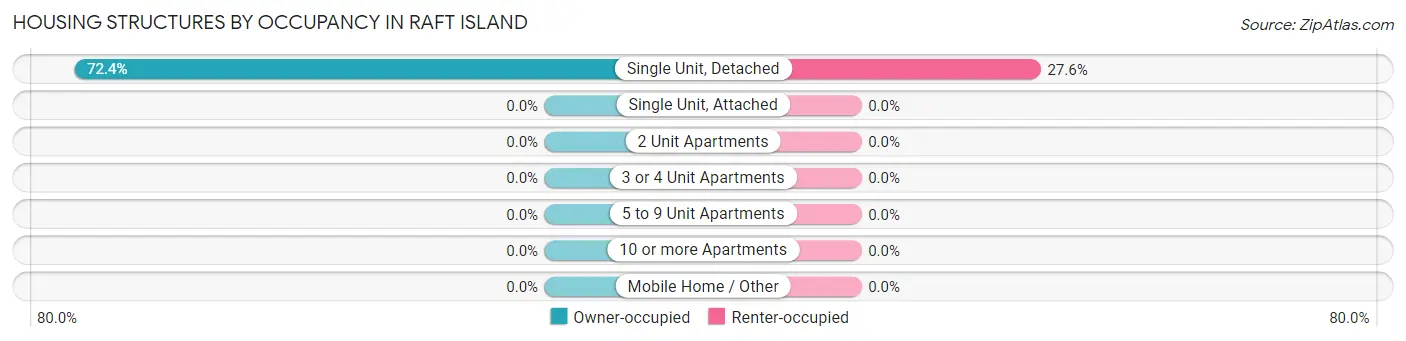
| Structure Type | Owner-occupied | Renter-occupied |
| Single Unit, Detached | 152 (72.4%) | 58 (27.6%) |
| Single Unit, Attached | 0 (0.0%) | 0 (0.0%) |
| 2 Unit Apartments | 0 (0.0%) | 0 (0.0%) |
| 3 or 4 Unit Apartments | 0 (0.0%) | 0 (0.0%) |
| 5 to 9 Unit Apartments | 0 (0.0%) | 0 (0.0%) |
| 10 or more Apartments | 0 (0.0%) | 0 (0.0%) |
| Mobile Home / Other | 0 (0.0%) | 0 (0.0%) |
| Total | 152 (72.4%) | 58 (27.6%) |
Housing Structures by Number of Rooms in Raft Island
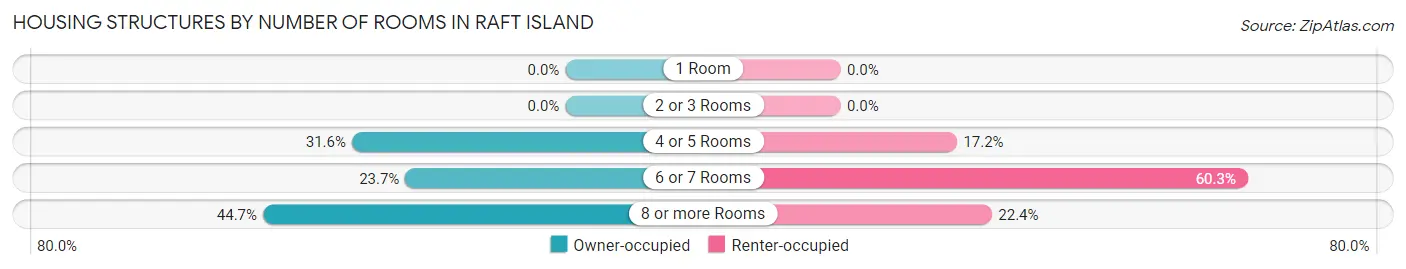
| Number of Rooms | Owner-occupied | Renter-occupied |
| 1 Room | 0 (0.0%) | 0 (0.0%) |
| 2 or 3 Rooms | 0 (0.0%) | 0 (0.0%) |
| 4 or 5 Rooms | 48 (31.6%) | 10 (17.2%) |
| 6 or 7 Rooms | 36 (23.7%) | 35 (60.3%) |
| 8 or more Rooms | 68 (44.7%) | 13 (22.4%) |
| Total | 152 (100.0%) | 58 (100.0%) |
Housing Structure by Heating Type in Raft Island
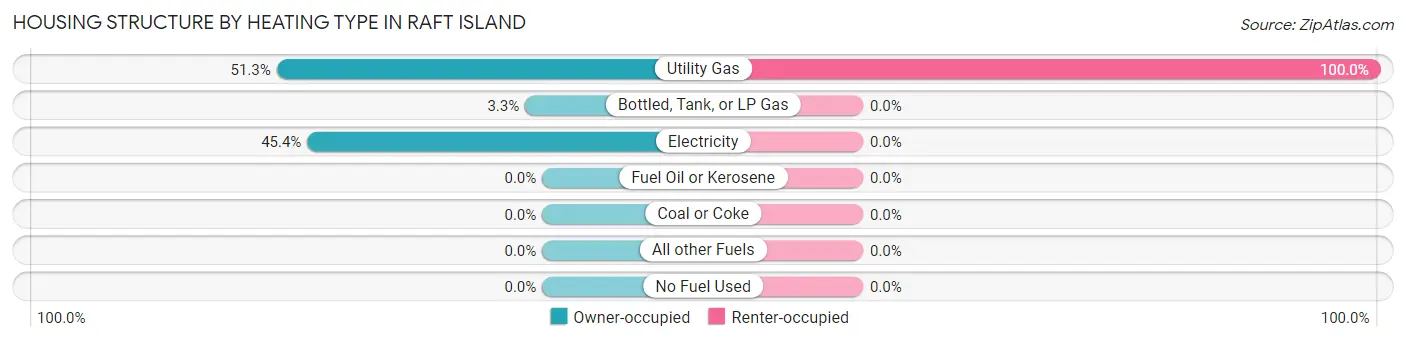
| Heating Type | Owner-occupied | Renter-occupied |
| Utility Gas | 78 (51.3%) | 58 (100.0%) |
| Bottled, Tank, or LP Gas | 5 (3.3%) | 0 (0.0%) |
| Electricity | 69 (45.4%) | 0 (0.0%) |
| Fuel Oil or Kerosene | 0 (0.0%) | 0 (0.0%) |
| Coal or Coke | 0 (0.0%) | 0 (0.0%) |
| All other Fuels | 0 (0.0%) | 0 (0.0%) |
| No Fuel Used | 0 (0.0%) | 0 (0.0%) |
| Total | 152 (100.0%) | 58 (100.0%) |
Household Vehicle Usage in Raft Island
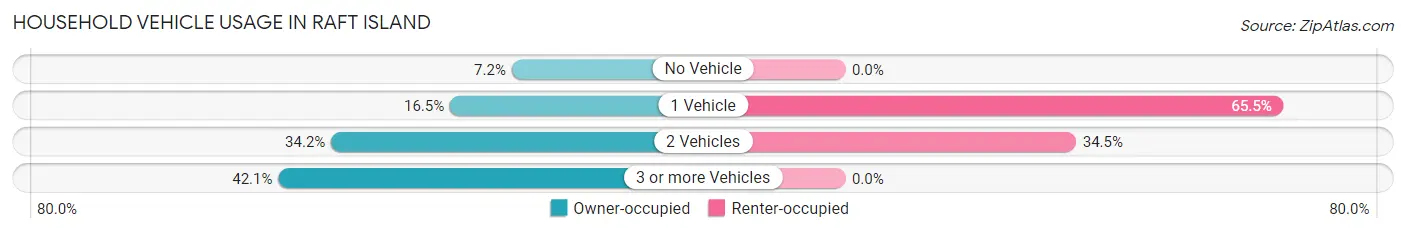
| Vehicles per Household | Owner-occupied | Renter-occupied |
| No Vehicle | 11 (7.2%) | 0 (0.0%) |
| 1 Vehicle | 25 (16.5%) | 38 (65.5%) |
| 2 Vehicles | 52 (34.2%) | 20 (34.5%) |
| 3 or more Vehicles | 64 (42.1%) | 0 (0.0%) |
| Total | 152 (100.0%) | 58 (100.0%) |
Real Estate & Mortgages in Raft Island
Real Estate and Mortgage Overview in Raft Island
| Characteristic | Without Mortgage | With Mortgage |
| Housing Units | 40 | 112 |
| Median Property Value | $1,222,200 | $722,200 |
| Median Household Income | $250,001 | $46 |
| Monthly Housing Costs | $1,231 | $61 |
| Real Estate Taxes | $8,981 | $0 |
Property Value by Mortgage Status in Raft Island
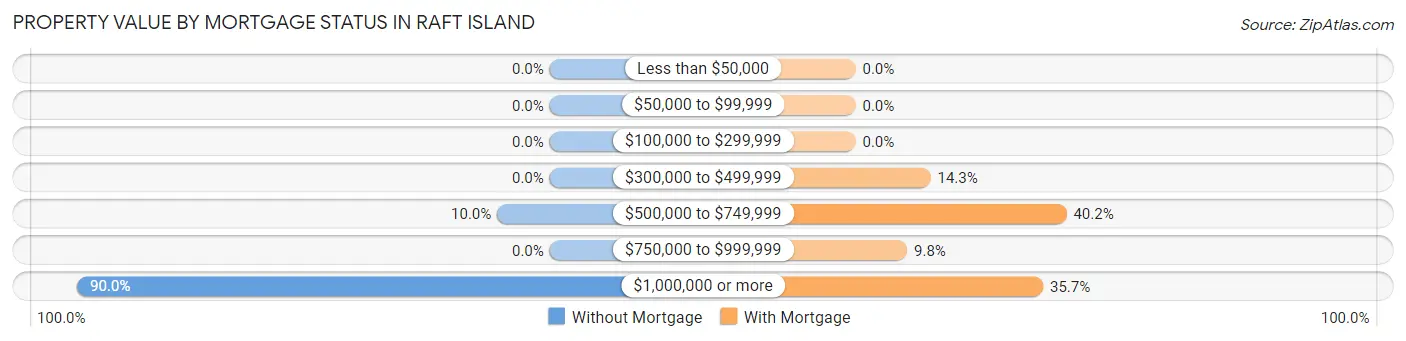
| Property Value | Without Mortgage | With Mortgage |
| Less than $50,000 | 0 (0.0%) | 0 (0.0%) |
| $50,000 to $99,999 | 0 (0.0%) | 0 (0.0%) |
| $100,000 to $299,999 | 0 (0.0%) | 0 (0.0%) |
| $300,000 to $499,999 | 0 (0.0%) | 16 (14.3%) |
| $500,000 to $749,999 | 4 (10.0%) | 45 (40.2%) |
| $750,000 to $999,999 | 0 (0.0%) | 11 (9.8%) |
| $1,000,000 or more | 36 (90.0%) | 40 (35.7%) |
| Total | 40 (100.0%) | 112 (100.0%) |
Household Income by Mortgage Status in Raft Island
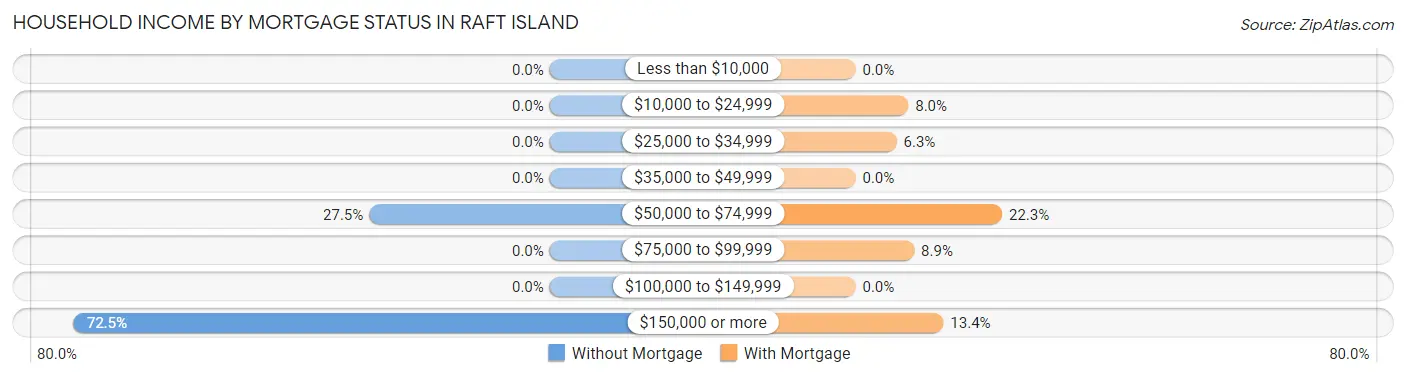
| Household Income | Without Mortgage | With Mortgage |
| Less than $10,000 | 0 (0.0%) | 0 (0.0%) |
| $10,000 to $24,999 | 0 (0.0%) | 9 (8.0%) |
| $25,000 to $34,999 | 0 (0.0%) | 7 (6.2%) |
| $35,000 to $49,999 | 0 (0.0%) | 0 (0.0%) |
| $50,000 to $74,999 | 11 (27.5%) | 25 (22.3%) |
| $75,000 to $99,999 | 0 (0.0%) | 10 (8.9%) |
| $100,000 to $149,999 | 0 (0.0%) | 0 (0.0%) |
| $150,000 or more | 29 (72.5%) | 15 (13.4%) |
| Total | 40 (100.0%) | 112 (100.0%) |
Property Value to Household Income Ratio in Raft Island
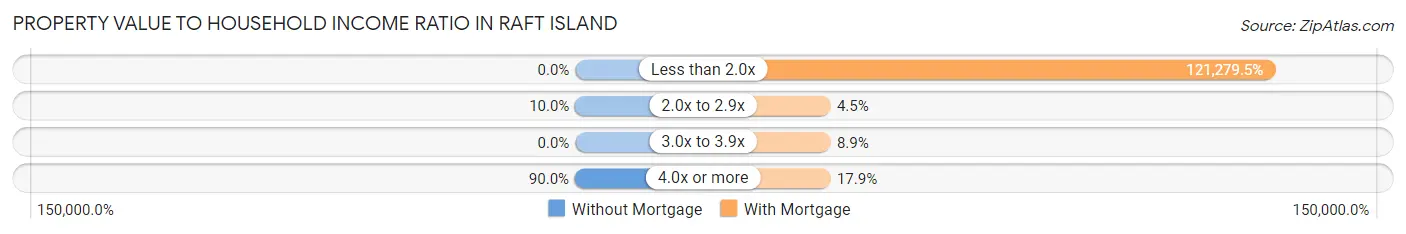
| Value-to-Income Ratio | Without Mortgage | With Mortgage |
| Less than 2.0x | 0 (0.0%) | 135,833 (121,279.5%) |
| 2.0x to 2.9x | 4 (10.0%) | 5 (4.5%) |
| 3.0x to 3.9x | 0 (0.0%) | 10 (8.9%) |
| 4.0x or more | 36 (90.0%) | 20 (17.9%) |
| Total | 40 (100.0%) | 112 (100.0%) |
Real Estate Taxes by Mortgage Status in Raft Island
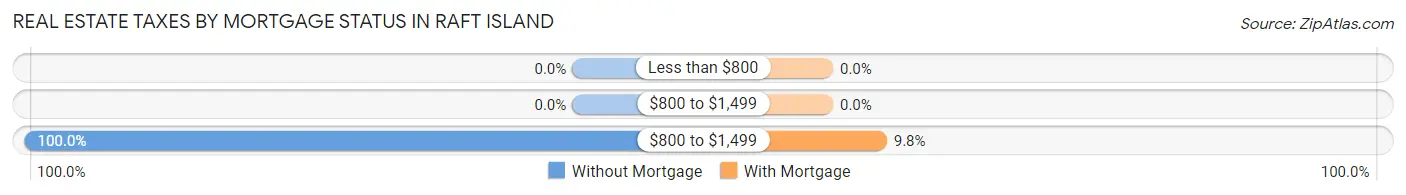
| Property Taxes | Without Mortgage | With Mortgage |
| Less than $800 | 0 (0.0%) | 0 (0.0%) |
| $800 to $1,499 | 0 (0.0%) | 0 (0.0%) |
| $800 to $1,499 | 40 (100.0%) | 11 (9.8%) |
| Total | 40 (100.0%) | 112 (100.0%) |
Health & Disability in Raft Island
Health Insurance Coverage by Age in Raft Island
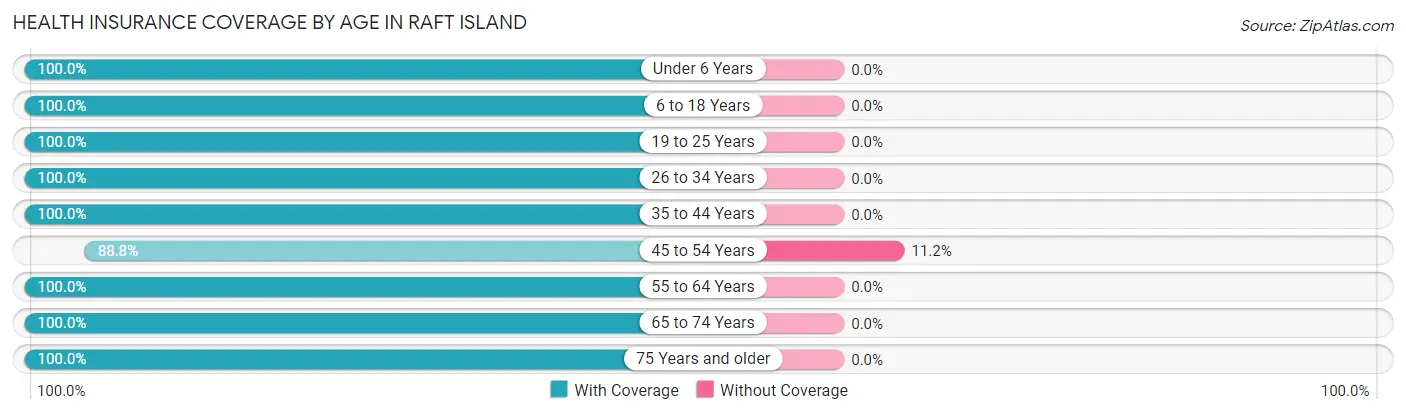
| Age Bracket | With Coverage | Without Coverage |
| Under 6 Years | 21 (100.0%) | 0 (0.0%) |
| 6 to 18 Years | 97 (100.0%) | 0 (0.0%) |
| 19 to 25 Years | 10 (100.0%) | 0 (0.0%) |
| 26 to 34 Years | 22 (100.0%) | 0 (0.0%) |
| 35 to 44 Years | 40 (100.0%) | 0 (0.0%) |
| 45 to 54 Years | 79 (88.8%) | 10 (11.2%) |
| 55 to 64 Years | 80 (100.0%) | 0 (0.0%) |
| 65 to 74 Years | 41 (100.0%) | 0 (0.0%) |
| 75 Years and older | 51 (100.0%) | 0 (0.0%) |
| Total | 441 (97.8%) | 10 (2.2%) |
Health Insurance Coverage by Citizenship Status in Raft Island
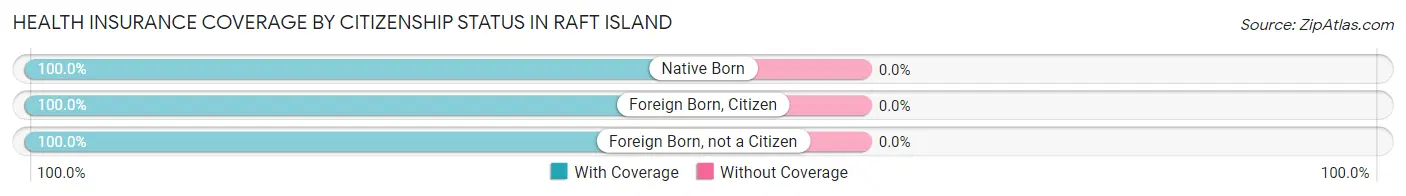
| Citizenship Status | With Coverage | Without Coverage |
| Native Born | 21 (100.0%) | 0 (0.0%) |
| Foreign Born, Citizen | 97 (100.0%) | 0 (0.0%) |
| Foreign Born, not a Citizen | 10 (100.0%) | 0 (0.0%) |
Health Insurance Coverage by Household Income in Raft Island
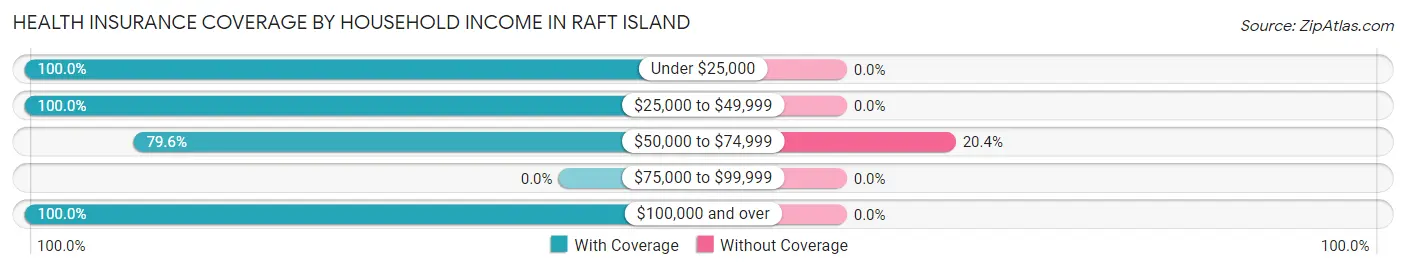
| Household Income | With Coverage | Without Coverage |
| Under $25,000 | 65 (100.0%) | 0 (0.0%) |
| $25,000 to $49,999 | 25 (100.0%) | 0 (0.0%) |
| $50,000 to $74,999 | 39 (79.6%) | 10 (20.4%) |
| $75,000 to $99,999 | 0 (0.0%) | 0 (0.0%) |
| $100,000 and over | 312 (100.0%) | 0 (0.0%) |
Public vs Private Health Insurance Coverage by Age in Raft Island
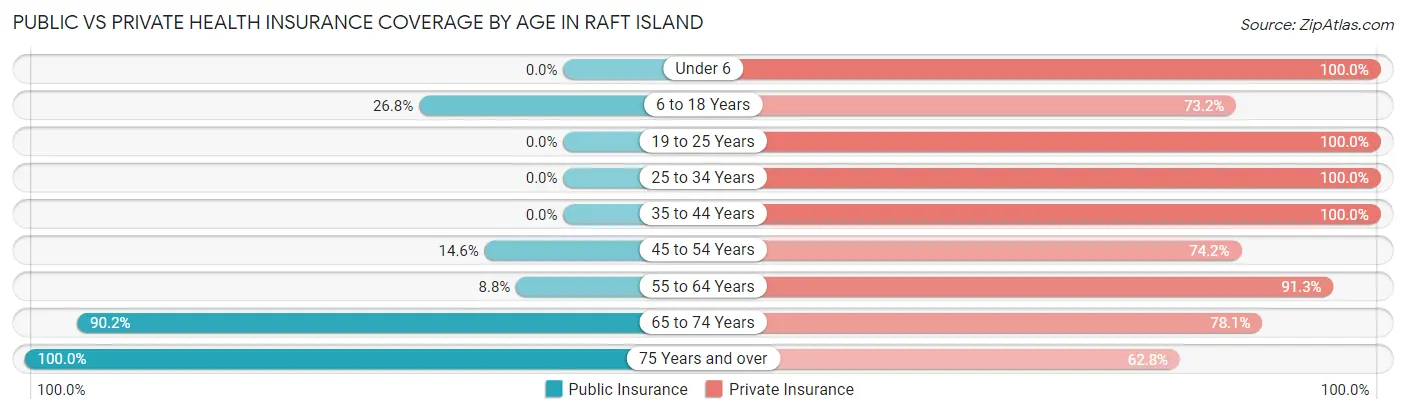
| Age Bracket | Public Insurance | Private Insurance |
| Under 6 | 0 (0.0%) | 21 (100.0%) |
| 6 to 18 Years | 26 (26.8%) | 71 (73.2%) |
| 19 to 25 Years | 0 (0.0%) | 10 (100.0%) |
| 25 to 34 Years | 0 (0.0%) | 22 (100.0%) |
| 35 to 44 Years | 0 (0.0%) | 40 (100.0%) |
| 45 to 54 Years | 13 (14.6%) | 66 (74.2%) |
| 55 to 64 Years | 7 (8.7%) | 73 (91.2%) |
| 65 to 74 Years | 37 (90.2%) | 32 (78.0%) |
| 75 Years and over | 51 (100.0%) | 32 (62.7%) |
| Total | 134 (29.7%) | 367 (81.4%) |
Disability Status by Sex by Age in Raft Island
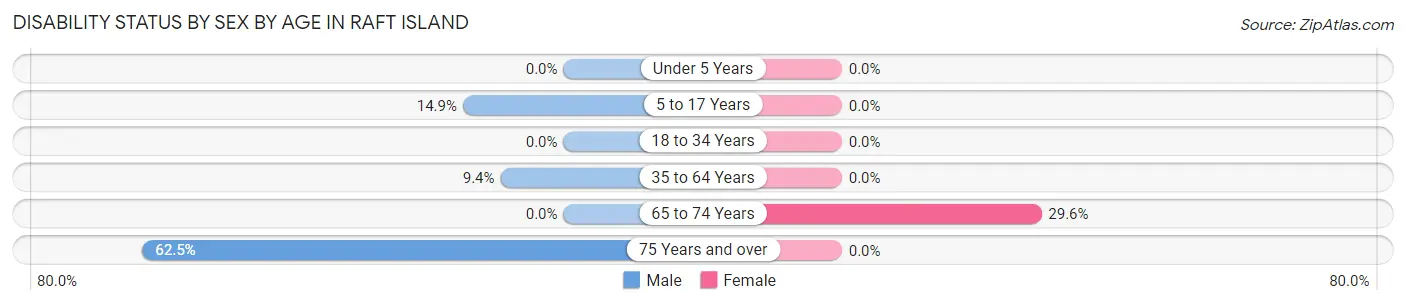
| Age Bracket | Male | Female |
| Under 5 Years | 0 (0.0%) | 0 (0.0%) |
| 5 to 17 Years | 10 (14.9%) | 0 (0.0%) |
| 18 to 34 Years | 0 (0.0%) | 0 (0.0%) |
| 35 to 64 Years | 10 (9.3%) | 0 (0.0%) |
| 65 to 74 Years | 0 (0.0%) | 8 (29.6%) |
| 75 Years and over | 15 (62.5%) | 0 (0.0%) |
Disability Class by Sex by Age in Raft Island
Disability Class: Hearing Difficulty
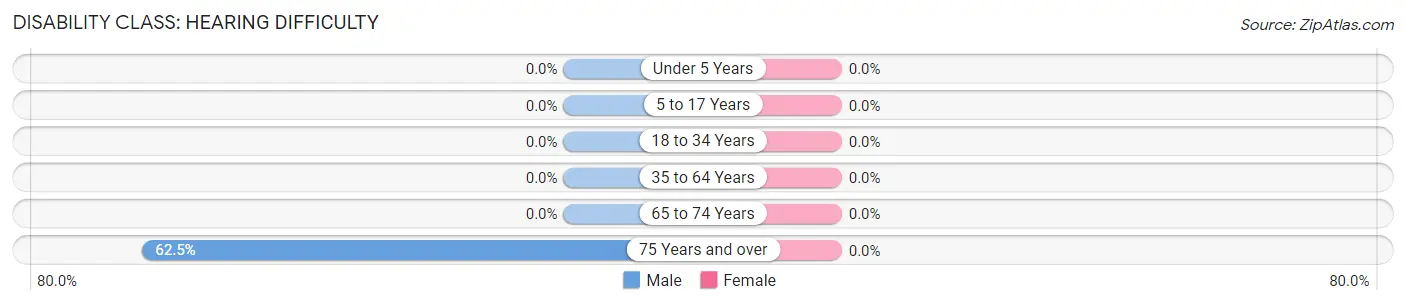
| Age Bracket | Male | Female |
| Under 5 Years | 0 (0.0%) | 0 (0.0%) |
| 5 to 17 Years | 0 (0.0%) | 0 (0.0%) |
| 18 to 34 Years | 0 (0.0%) | 0 (0.0%) |
| 35 to 64 Years | 0 (0.0%) | 0 (0.0%) |
| 65 to 74 Years | 0 (0.0%) | 0 (0.0%) |
| 75 Years and over | 15 (62.5%) | 0 (0.0%) |
Disability Class: Vision Difficulty
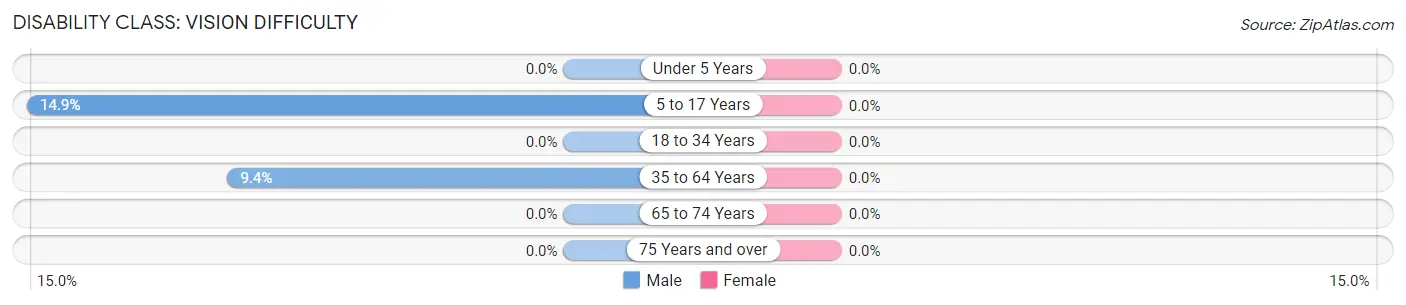
| Age Bracket | Male | Female |
| Under 5 Years | 0 (0.0%) | 0 (0.0%) |
| 5 to 17 Years | 10 (14.9%) | 0 (0.0%) |
| 18 to 34 Years | 0 (0.0%) | 0 (0.0%) |
| 35 to 64 Years | 10 (9.3%) | 0 (0.0%) |
| 65 to 74 Years | 0 (0.0%) | 0 (0.0%) |
| 75 Years and over | 0 (0.0%) | 0 (0.0%) |
Disability Class: Cognitive Difficulty
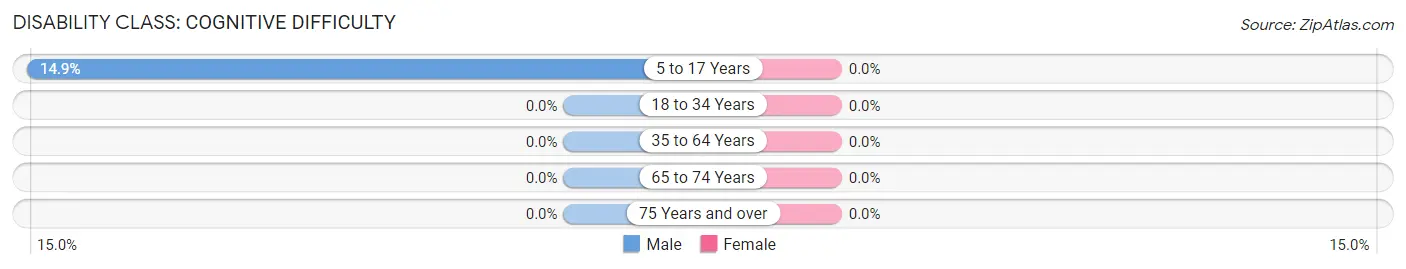
| Age Bracket | Male | Female |
| 5 to 17 Years | 10 (14.9%) | 0 (0.0%) |
| 18 to 34 Years | 0 (0.0%) | 0 (0.0%) |
| 35 to 64 Years | 0 (0.0%) | 0 (0.0%) |
| 65 to 74 Years | 0 (0.0%) | 0 (0.0%) |
| 75 Years and over | 0 (0.0%) | 0 (0.0%) |
Disability Class: Ambulatory Difficulty
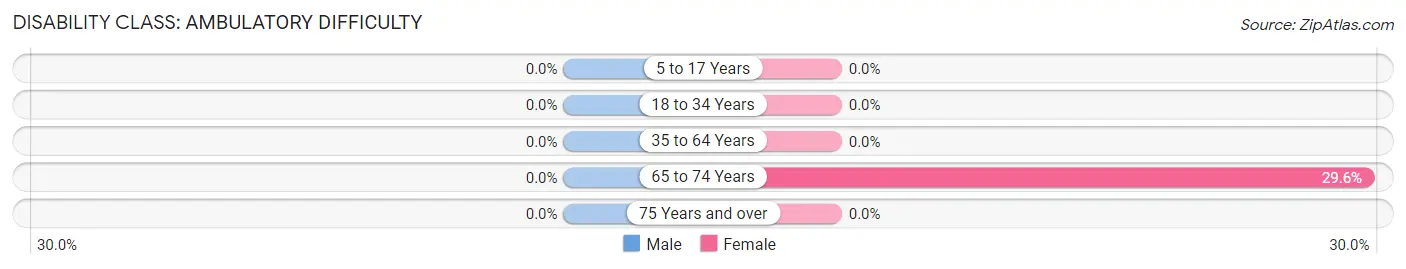
| Age Bracket | Male | Female |
| 5 to 17 Years | 0 (0.0%) | 0 (0.0%) |
| 18 to 34 Years | 0 (0.0%) | 0 (0.0%) |
| 35 to 64 Years | 0 (0.0%) | 0 (0.0%) |
| 65 to 74 Years | 0 (0.0%) | 8 (29.6%) |
| 75 Years and over | 0 (0.0%) | 0 (0.0%) |
Disability Class: Self-Care Difficulty
| Age Bracket | Male | Female |
| 5 to 17 Years | 0 (0.0%) | 0 (0.0%) |
| 18 to 34 Years | 0 (0.0%) | 0 (0.0%) |
| 35 to 64 Years | 0 (0.0%) | 0 (0.0%) |
| 65 to 74 Years | 0 (0.0%) | 0 (0.0%) |
| 75 Years and over | 0 (0.0%) | 0 (0.0%) |
Technology Access in Raft Island
Computing Device Access in Raft Island
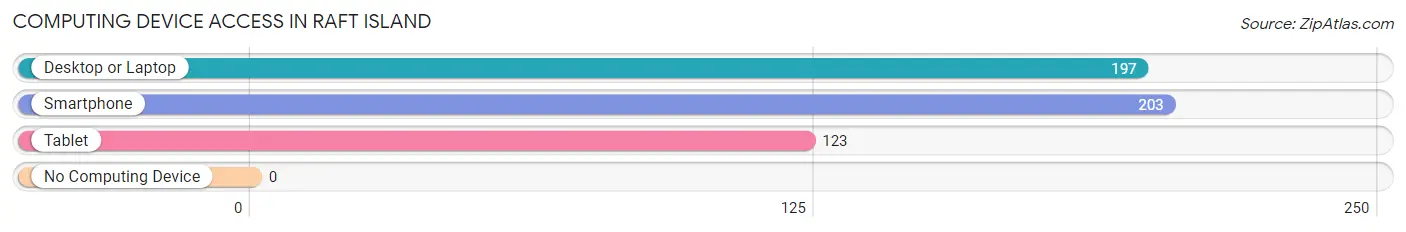
| Device Type | # Households | % Households |
| Desktop or Laptop | 197 | 93.8% |
| Smartphone | 203 | 96.7% |
| Tablet | 123 | 58.6% |
| No Computing Device | 0 | 0.0% |
| Total | 210 | 100.0% |
Internet Access in Raft Island
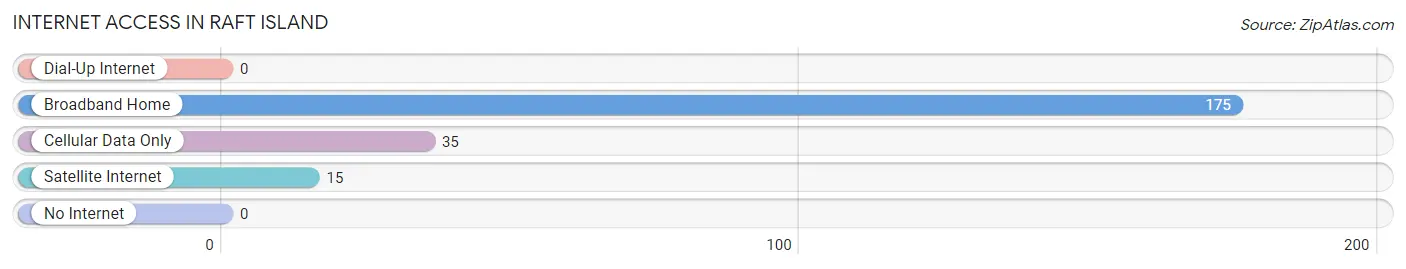
| Internet Type | # Households | % Households |
| Dial-Up Internet | 0 | 0.0% |
| Broadband Home | 175 | 83.3% |
| Cellular Data Only | 35 | 16.7% |
| Satellite Internet | 15 | 7.1% |
| No Internet | 0 | 0.0% |
| Total | 210 | 100.0% |
Raft Island Summary
Raft Island is a small island located in the Puget Sound of Washington State, USA. It is located in the Kitsap Peninsula, and is part of the Kitsap County. The island is approximately 1.5 miles long and 0.5 miles wide, and is home to a population of approximately 200 people.
History
Raft Island was first inhabited by the Suquamish Tribe, who lived on the island for thousands of years. The island was named after the Suquamish Chief, Raft, who lived on the island in the late 1800s. In the early 1900s, the island was purchased by a group of investors who wanted to develop the island into a resort. The resort was never built, and the island remained largely undeveloped until the 1950s.
In the 1950s, the island was purchased by a group of developers who wanted to build a resort on the island. The resort was built, and the island became a popular destination for tourists. The resort was eventually sold to a private owner, and the island has remained largely undeveloped since then.
Geography
Raft Island is located in the Puget Sound of Washington State, USA. It is located in the Kitsap Peninsula, and is part of the Kitsap County. The island is approximately 1.5 miles long and 0.5 miles wide, and is home to a population of approximately 200 people.
The island is mostly covered in forest, with some areas of open grassland. The island is surrounded by a number of small islands, including Blake Island, Bainbridge Island, and Vashon Island. The island is accessible by boat, and there is a small marina located on the island.
Economy
Raft Island has a small economy, with most of the island’s residents employed in the tourism industry. The island is home to a number of small businesses, including a marina, a restaurant, and a few small shops. The island also has a small fishing industry, with a number of local fishermen operating out of the island’s marina.
Demographics
Raft Island has a population of approximately 200 people. The majority of the island’s population is white, with a small minority of Native American and Hispanic residents. The island has a median household income of $50,000, and the median age of the island’s residents is 45. The island has a low crime rate, and is considered to be a safe place to live.
Common Questions
What is the Total Population of Raft Island?
Total Population of Raft Island is 451.
What is the Total Male Population of Raft Island?
Total Male Population of Raft Island is 212.
What is the Total Female Population of Raft Island?
Total Female Population of Raft Island is 239.
What is the Ratio of Males per 100 Females in Raft Island?
There are 88.70 Males per 100 Females in Raft Island.
What is the Ratio of Females per 100 Males in Raft Island?
There are 112.74 Females per 100 Males in Raft Island.
What is the Median Population Age in Raft Island?
Median Population Age in Raft Island is 52.2 Years.
What is the Average Family Size in Raft Island
Average Family Size in Raft Island is 3.1 People.
What is the Average Household Size in Raft Island
Average Household Size in Raft Island is 2.1 People.
What is Per Capita Income in Raft Island?
Per Capita income in Raft Island is $87,791.
What is the Median Family Income in Raft Island?
Median Family Income in Raft Island is $165,000.
What is the Median Household income in Raft Island?
Median Household Income in Raft Island is $156,136.
What is Inequality or Gini Index in Raft Island?
Inequality or Gini Index in Raft Island is 0.51.
How Large is the Labor Force in Raft Island?
There are 266 People in the Labor Forcein in Raft Island.
What is the Percentage of People in the Labor Force in Raft Island?
73.9% of People are in the Labor Force in Raft Island.
What is the Unemployment Rate in Raft Island?
Unemployment Rate in Raft Island is 4.9%.