Finley, WA
Finley Map
Finley Overview
5,848
TOTAL POPULATION
2,951
MALE POPULATION
2,897
FEMALE POPULATION
101.86
MALES / 100 FEMALES
98.17
FEMALES / 100 MALES
40.6
MEDIAN AGE
3.5
AVG FAMILY SIZE
3.2
AVG HOUSEHOLD SIZE
$28,828
PER CAPITA INCOME
$82,188
AVG FAMILY INCOME
$83,523
AVG HOUSEHOLD INCOME
35.3%
WAGE / INCOME GAP [ % ]
64.7¢/ $1
WAGE / INCOME GAP [ $ ]
$9,064
FAMILY INCOME DEFICIT
0.34
INEQUALITY / GINI INDEX
3,007
LABOR FORCE [ PEOPLE ]
62.3%
PERCENT IN LABOR FORCE
8.2%
UNEMPLOYMENT RATE
Race in Finley
The most populous races in Finley are White / Caucasian (4,582 | 78.3%), Hispanic or Latino (1,711 | 29.3%), and Two or more Races (704 | 12.0%).
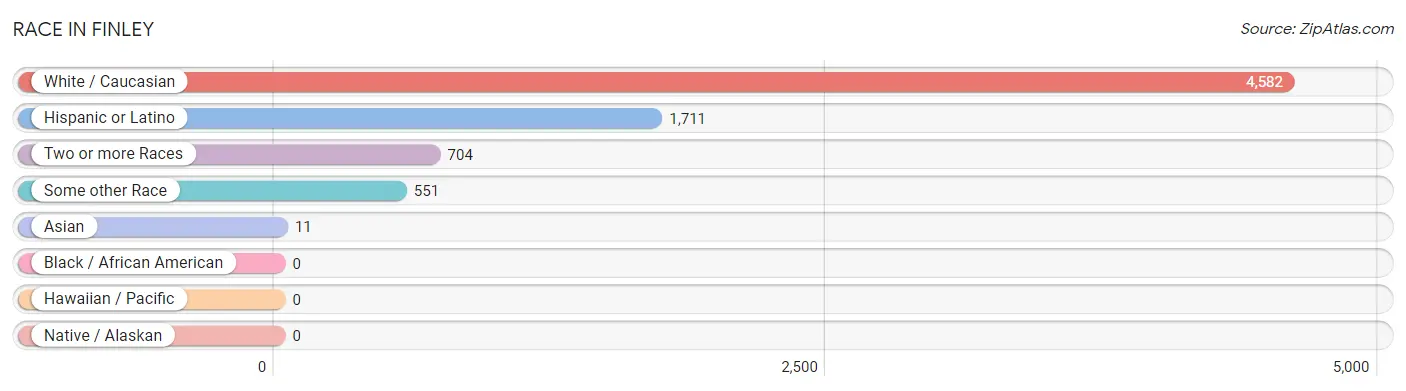
| Race | # Population | % Population |
| Asian | 11 | 0.2% |
| Black / African American | 0 | 0.0% |
| Hawaiian / Pacific | 0 | 0.0% |
| Hispanic or Latino | 1,711 | 29.3% |
| Native / Alaskan | 0 | 0.0% |
| White / Caucasian | 4,582 | 78.3% |
| Two or more Races | 704 | 12.0% |
| Some other Race | 551 | 9.4% |
| Total | 5,848 | 100.0% |
Ancestry in Finley
The most populous ancestries reported in Finley are Mexican (1,688 | 28.9%), German (1,304 | 22.3%), Irish (530 | 9.1%), English (412 | 7.0%), and French (376 | 6.4%), together accounting for 73.7% of all Finley residents.
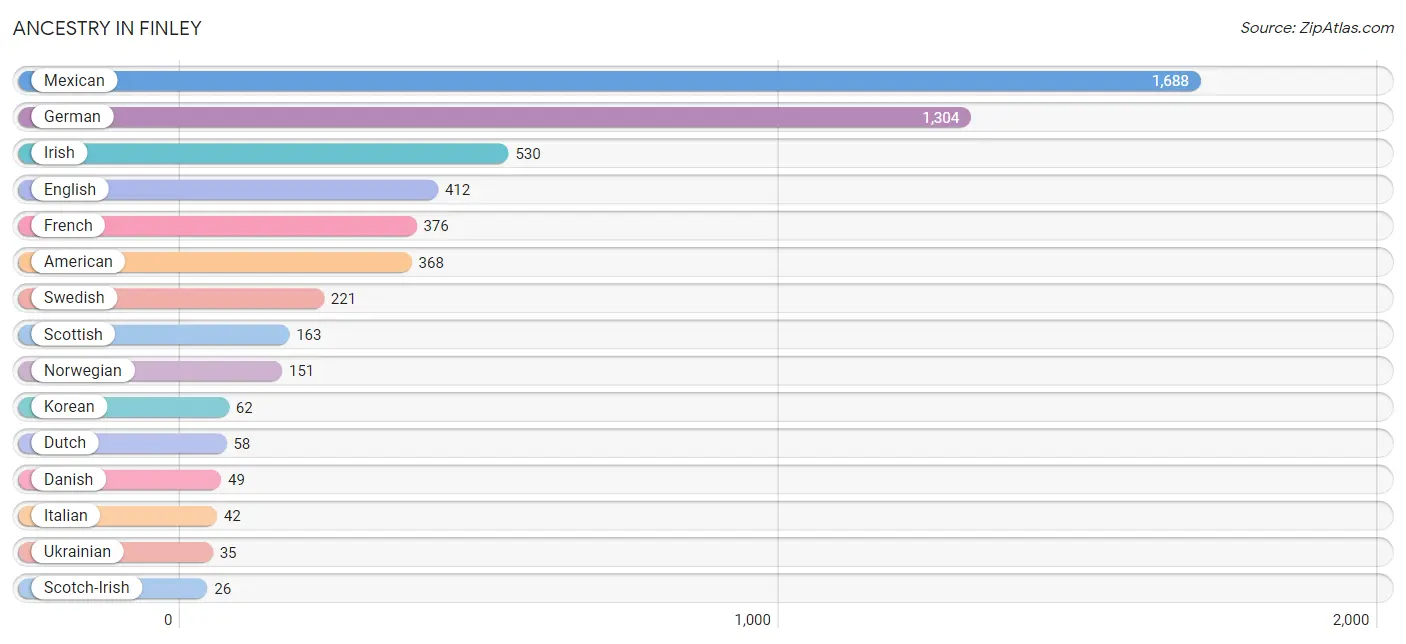
| Ancestry | # Population | % Population |
| American | 368 | 6.3% |
| British | 10 | 0.2% |
| Colombian | 23 | 0.4% |
| Czech | 24 | 0.4% |
| Danish | 49 | 0.8% |
| Dutch | 58 | 1.0% |
| English | 412 | 7.0% |
| European | 15 | 0.3% |
| French | 376 | 6.4% |
| French Canadian | 14 | 0.2% |
| German | 1,304 | 22.3% |
| Greek | 7 | 0.1% |
| Icelander | 18 | 0.3% |
| Indian (Asian) | 11 | 0.2% |
| Irish | 530 | 9.1% |
| Iroquois | 4 | 0.1% |
| Italian | 42 | 0.7% |
| Korean | 62 | 1.1% |
| Mexican | 1,688 | 28.9% |
| Norwegian | 151 | 2.6% |
| Polish | 12 | 0.2% |
| Scandinavian | 15 | 0.3% |
| Scotch-Irish | 26 | 0.4% |
| Scottish | 163 | 2.8% |
| South American | 23 | 0.4% |
| Swedish | 221 | 3.8% |
| Ukrainian | 35 | 0.6% |
| Welsh | 16 | 0.3% | View All 28 Rows |
Immigrants in Finley
The most numerous immigrant groups reported in Finley came from Latin America (730 | 12.5%), Central America (707 | 12.1%), Mexico (707 | 12.1%), Colombia (23 | 0.4%), and South America (23 | 0.4%), together accounting for 37.4% of all Finley residents.
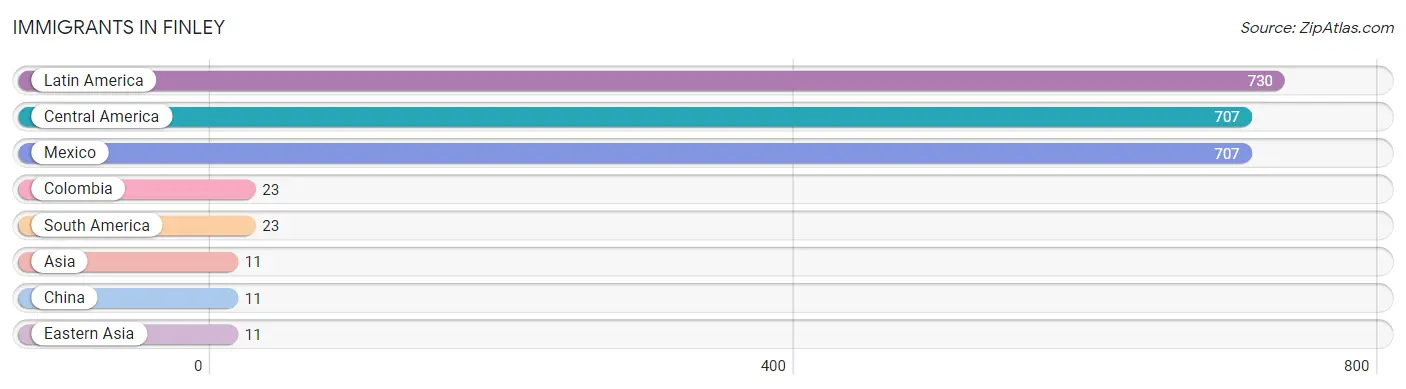
| Immigration Origin | # Population | % Population |
| Asia | 11 | 0.2% |
| Central America | 707 | 12.1% |
| China | 11 | 0.2% |
| Colombia | 23 | 0.4% |
| Eastern Asia | 11 | 0.2% |
| Latin America | 730 | 12.5% |
| Mexico | 707 | 12.1% |
| South America | 23 | 0.4% | View All 8 Rows |
Sex and Age in Finley
Sex and Age in Finley
The most populous age groups in Finley are 55 to 59 Years (661 | 22.4%) for men and 20 to 24 Years (363 | 12.5%) for women.
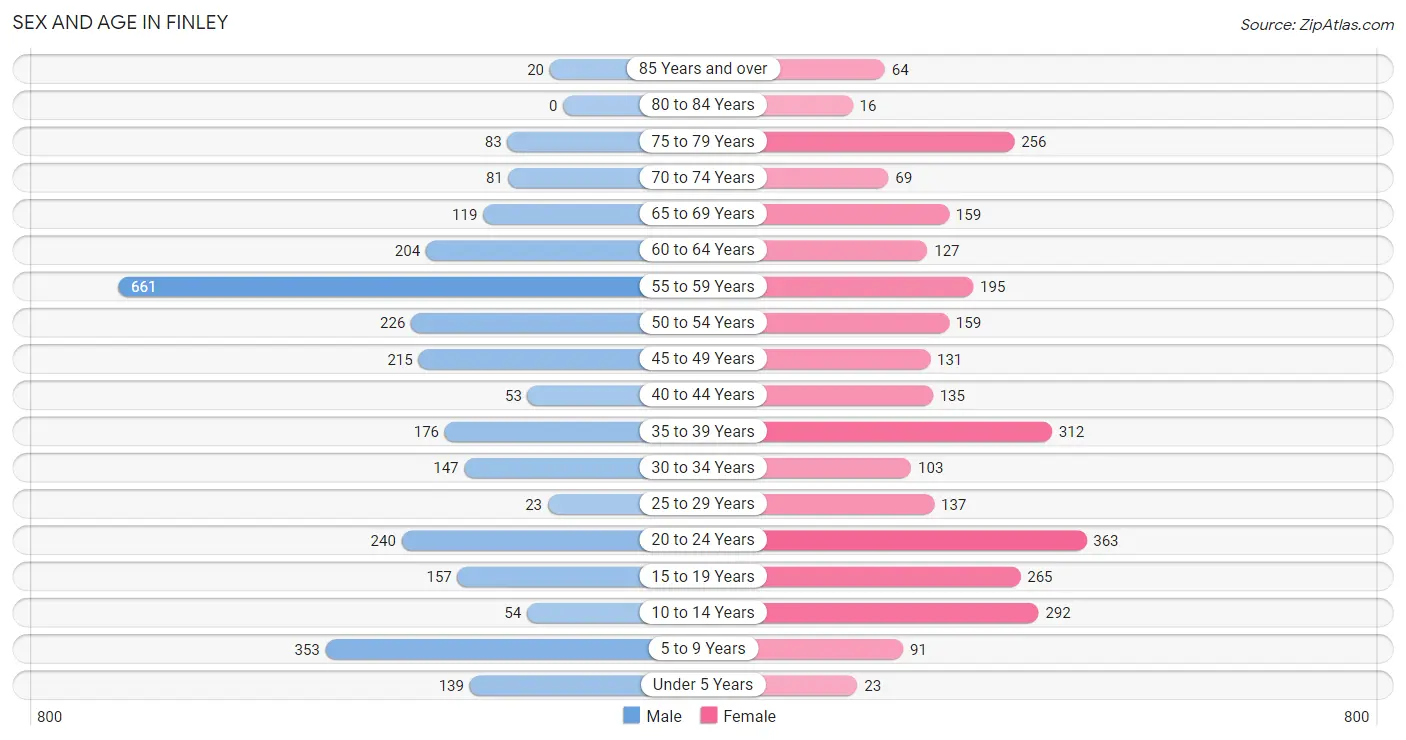
| Age Bracket | Male | Female |
| Under 5 Years | 139 (4.7%) | 23 (0.8%) |
| 5 to 9 Years | 353 (12.0%) | 91 (3.1%) |
| 10 to 14 Years | 54 (1.8%) | 292 (10.1%) |
| 15 to 19 Years | 157 (5.3%) | 265 (9.1%) |
| 20 to 24 Years | 240 (8.1%) | 363 (12.5%) |
| 25 to 29 Years | 23 (0.8%) | 137 (4.7%) |
| 30 to 34 Years | 147 (5.0%) | 103 (3.6%) |
| 35 to 39 Years | 176 (6.0%) | 312 (10.8%) |
| 40 to 44 Years | 53 (1.8%) | 135 (4.7%) |
| 45 to 49 Years | 215 (7.3%) | 131 (4.5%) |
| 50 to 54 Years | 226 (7.7%) | 159 (5.5%) |
| 55 to 59 Years | 661 (22.4%) | 195 (6.7%) |
| 60 to 64 Years | 204 (6.9%) | 127 (4.4%) |
| 65 to 69 Years | 119 (4.0%) | 159 (5.5%) |
| 70 to 74 Years | 81 (2.7%) | 69 (2.4%) |
| 75 to 79 Years | 83 (2.8%) | 256 (8.8%) |
| 80 to 84 Years | 0 (0.0%) | 16 (0.5%) |
| 85 Years and over | 20 (0.7%) | 64 (2.2%) |
| Total | 2,951 (100.0%) | 2,897 (100.0%) |
Families and Households in Finley
Median Family Size in Finley
The median family size in Finley is 3.49 persons per family, with married-couple families (842 | 59.6%) accounting for the largest median family size of 3.8 persons per family. On the other hand, single male/father families (161 | 11.4%) represent the smallest median family size with 2.28 persons per family.
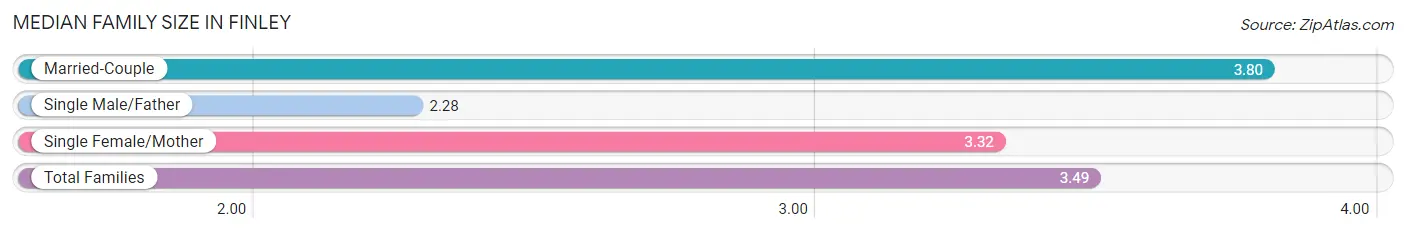
| Family Type | # Families | Family Size |
| Married-Couple | 842 (59.6%) | 3.80 |
| Single Male/Father | 161 (11.4%) | 2.28 |
| Single Female/Mother | 411 (29.1%) | 3.32 |
| Total Families | 1,414 (100.0%) | 3.49 |
Median Household Size in Finley
The median household size in Finley is 3.21 persons per household, with single female/mother households (411 | 22.6%) accounting for the largest median household size of 3.91 persons per household. non-family households (406 | 22.3%) represent the smallest median household size with 1.38 persons per household.
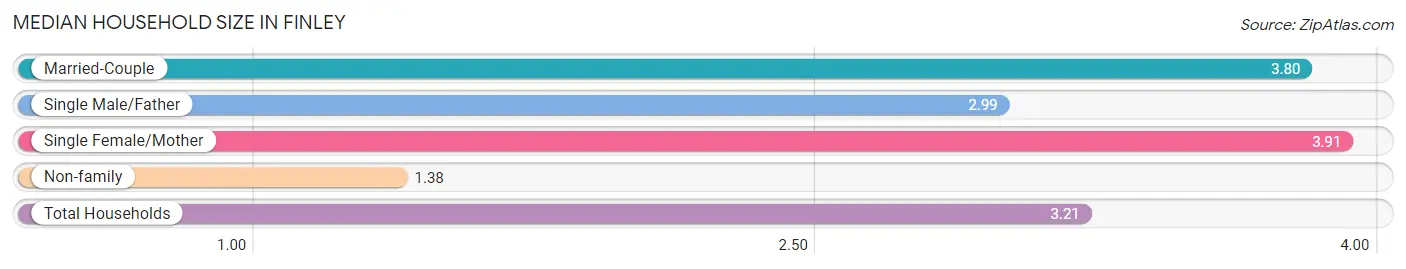
| Household Type | # Households | Household Size |
| Married-Couple | 842 (46.3%) | 3.80 |
| Single Male/Father | 161 (8.8%) | 2.99 |
| Single Female/Mother | 411 (22.6%) | 3.91 |
| Non-family | 406 (22.3%) | 1.38 |
| Total Households | 1,820 (100.0%) | 3.21 |
Household Size by Marriage Status in Finley
Out of a total of 1,820 households in Finley, 1,414 (77.7%) are family households, while 406 (22.3%) are nonfamily households. The most numerous type of family households are 2-person households, comprising 511, and the most common type of nonfamily households are 1-person households, comprising 335.
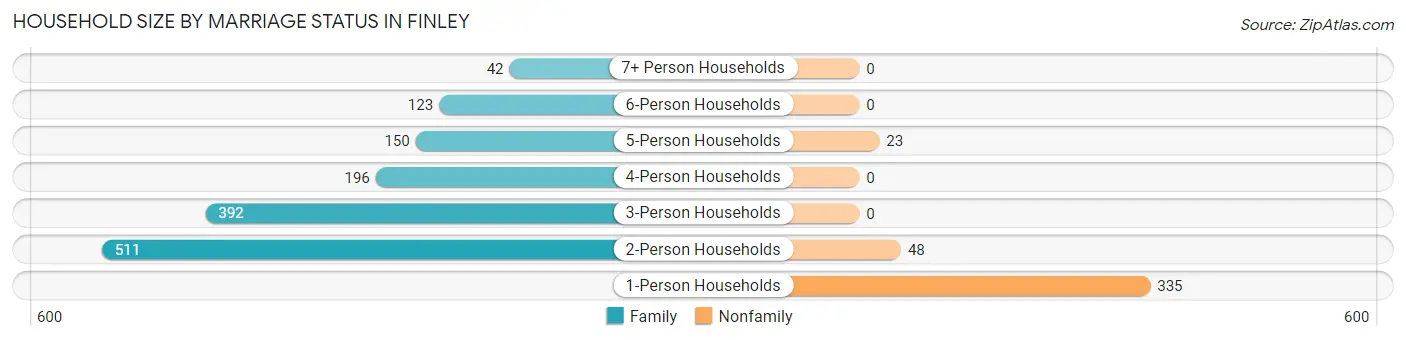
| Household Size | Family Households | Nonfamily Households |
| 1-Person Households | - | 335 (18.4%) |
| 2-Person Households | 511 (28.1%) | 48 (2.6%) |
| 3-Person Households | 392 (21.5%) | 0 (0.0%) |
| 4-Person Households | 196 (10.8%) | 0 (0.0%) |
| 5-Person Households | 150 (8.2%) | 23 (1.3%) |
| 6-Person Households | 123 (6.8%) | 0 (0.0%) |
| 7+ Person Households | 42 (2.3%) | 0 (0.0%) |
| Total | 1,414 (77.7%) | 406 (22.3%) |
Female Fertility in Finley
Fertility by Age in Finley
Average fertility rate in Finley is 40.0 births per 1,000 women. Women in the age bracket of 20 to 34 years have the highest fertility rate with 56.0 births per 1,000 women. Women in the age bracket of 20 to 34 years acount for 58.6% of all women with births.
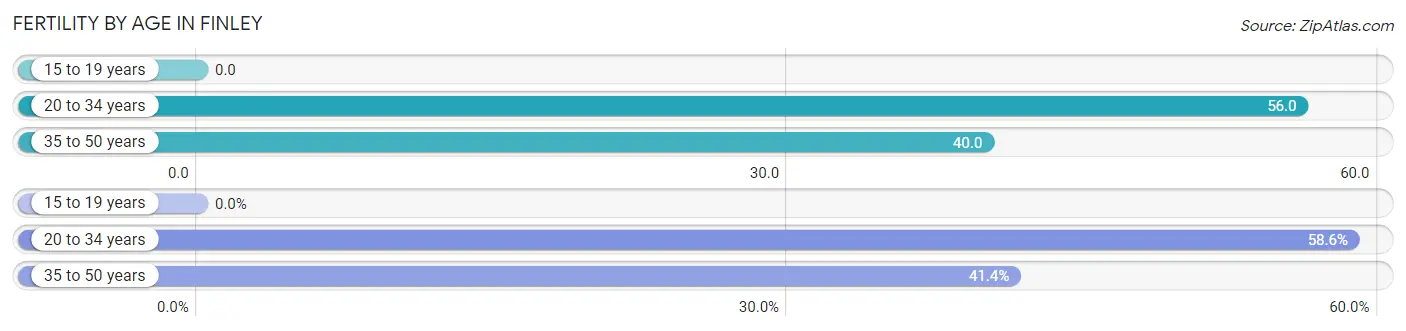
| Age Bracket | Women with Births | Births / 1,000 Women |
| 15 to 19 years | 0 (0.0%) | 0.0 |
| 20 to 34 years | 34 (58.6%) | 56.0 |
| 35 to 50 years | 24 (41.4%) | 40.0 |
| Total | 58 (100.0%) | 40.0 |
Fertility by Age by Marriage Status in Finley
58.6% of women with births (58) in Finley are married. The highest percentage of unmarried women with births falls into 35 to 50 years age bracket with 100.0% of them unmarried at the time of birth, while the lowest percentage of unmarried women with births belong to 20 to 34 years age bracket with 0.0% of them unmarried.
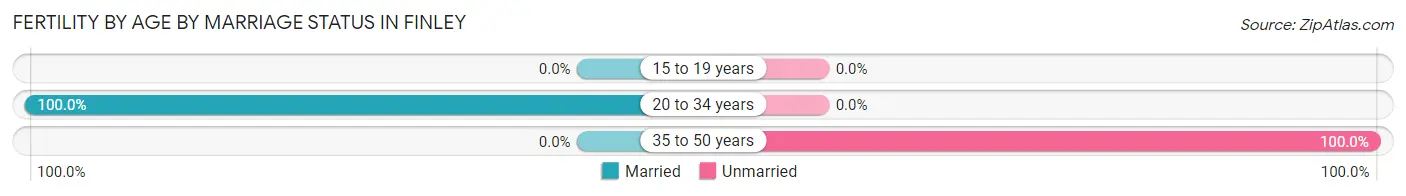
| Age Bracket | Married | Unmarried |
| 15 to 19 years | 0 (0.0%) | 0 (0.0%) |
| 20 to 34 years | 34 (100.0%) | 0 (0.0%) |
| 35 to 50 years | 0 (0.0%) | 24 (100.0%) |
| Total | 34 (58.6%) | 24 (41.4%) |
Fertility by Education in Finley
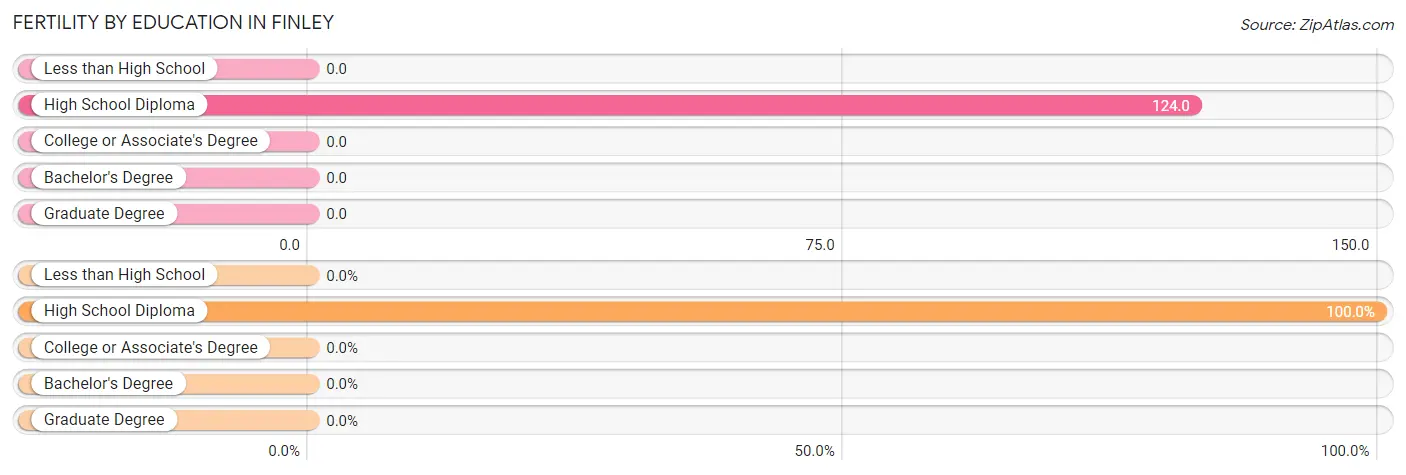
| Educational Attainment | Women with Births | Births / 1,000 Women |
| Less than High School | 0 (0.0%) | 0.0 |
| High School Diploma | 58 (100.0%) | 124.0 |
| College or Associate's Degree | 0 (0.0%) | 0.0 |
| Bachelor's Degree | 0 (0.0%) | 0.0 |
| Graduate Degree | 0 (0.0%) | 0.0 |
| Total | 58 (100.0%) | 40.0 |
Fertility by Education by Marriage Status in Finley
41.4% of women with births in Finley are unmarried. Women with the educational attainment of high school diploma are most likely to be married with 58.6% of them married at childbirth, while women with the educational attainment of high school diploma are least likely to be married with 41.4% of them unmarried at childbirth.
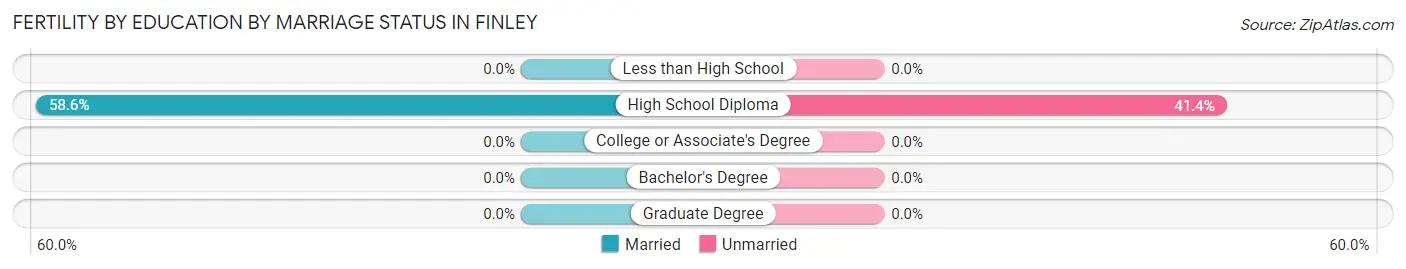
| Educational Attainment | Married | Unmarried |
| Less than High School | 0 (0.0%) | 0 (0.0%) |
| High School Diploma | 34 (58.6%) | 24 (41.4%) |
| College or Associate's Degree | 0 (0.0%) | 0 (0.0%) |
| Bachelor's Degree | 0 (0.0%) | 0 (0.0%) |
| Graduate Degree | 0 (0.0%) | 0 (0.0%) |
| Total | 34 (58.6%) | 24 (41.4%) |
Income in Finley
Income Overview in Finley
Per Capita Income in Finley is $28,828, while median incomes of families and households are $82,188 and $83,523 respectively.
| Characteristic | Number | Measure |
| Per Capita Income | 5,848 | $28,828 |
| Median Family Income | 1,414 | $82,188 |
| Mean Family Income | 1,414 | $84,263 |
| Median Household Income | 1,820 | $83,523 |
| Mean Household Income | 1,820 | $85,529 |
| Income Deficit | 1,414 | $9,064 |
| Wage / Income Gap (%) | 5,848 | 35.32% |
| Wage / Income Gap ($) | 5,848 | 64.68¢ per $1 |
| Gini / Inequality Index | 5,848 | 0.34 |
Earnings by Sex in Finley
Average Earnings in Finley are $28,957, $38,466 for men and $24,879 for women, a difference of 35.3%.
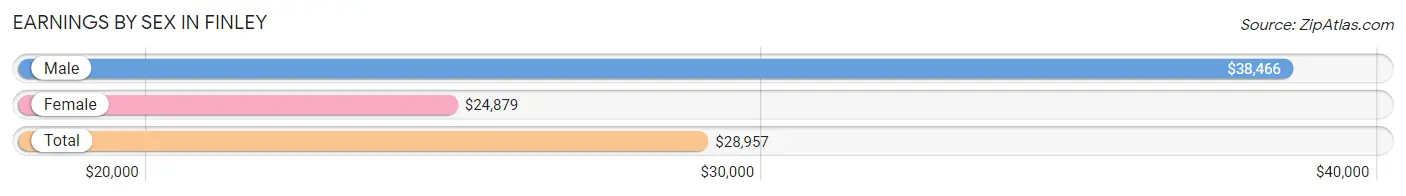
| Sex | Number | Average Earnings |
| Male | 1,507 (50.1%) | $38,466 |
| Female | 1,501 (49.9%) | $24,879 |
| Total | 3,008 (100.0%) | $28,957 |
Earnings by Sex by Income Bracket in Finley
The most common earnings brackets in Finley are $7,500 to $9,999 for men (230 | 15.3%) and $22,500 to $24,999 for women (259 | 17.3%).
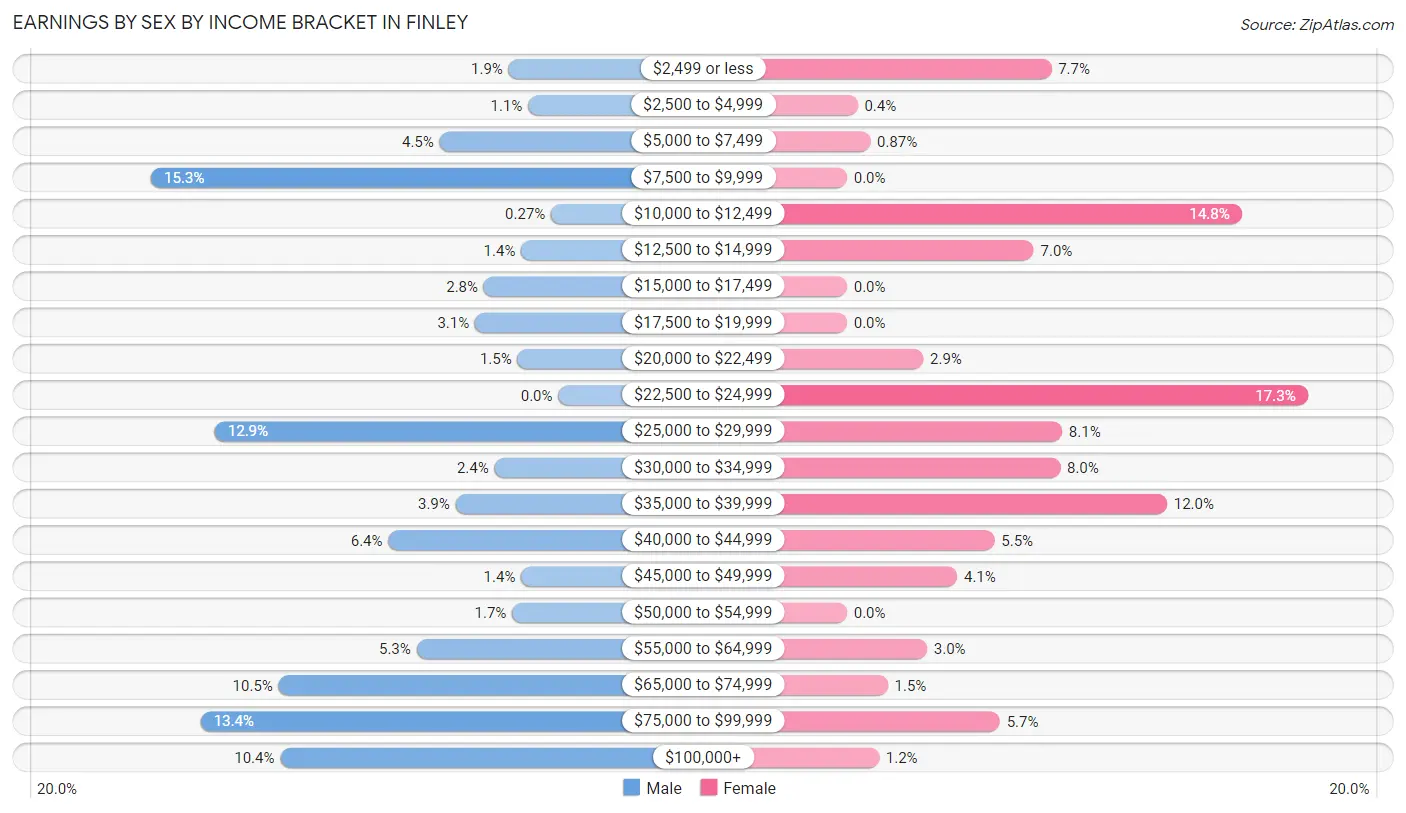
| Income | Male | Female |
| $2,499 or less | 28 (1.9%) | 115 (7.7%) |
| $2,500 to $4,999 | 17 (1.1%) | 6 (0.4%) |
| $5,000 to $7,499 | 67 (4.4%) | 13 (0.9%) |
| $7,500 to $9,999 | 230 (15.3%) | 0 (0.0%) |
| $10,000 to $12,499 | 4 (0.3%) | 222 (14.8%) |
| $12,500 to $14,999 | 21 (1.4%) | 105 (7.0%) |
| $15,000 to $17,499 | 42 (2.8%) | 0 (0.0%) |
| $17,500 to $19,999 | 47 (3.1%) | 0 (0.0%) |
| $20,000 to $22,499 | 23 (1.5%) | 43 (2.9%) |
| $22,500 to $24,999 | 0 (0.0%) | 259 (17.3%) |
| $25,000 to $29,999 | 194 (12.9%) | 121 (8.1%) |
| $30,000 to $34,999 | 36 (2.4%) | 120 (8.0%) |
| $35,000 to $39,999 | 58 (3.8%) | 180 (12.0%) |
| $40,000 to $44,999 | 96 (6.4%) | 83 (5.5%) |
| $45,000 to $49,999 | 21 (1.4%) | 62 (4.1%) |
| $50,000 to $54,999 | 26 (1.7%) | 0 (0.0%) |
| $55,000 to $64,999 | 80 (5.3%) | 45 (3.0%) |
| $65,000 to $74,999 | 158 (10.5%) | 23 (1.5%) |
| $75,000 to $99,999 | 202 (13.4%) | 86 (5.7%) |
| $100,000+ | 157 (10.4%) | 18 (1.2%) |
| Total | 1,507 (100.0%) | 1,501 (100.0%) |
Earnings by Sex by Educational Attainment in Finley
Average earnings in Finley are $41,283 for men and $26,846 for women, a difference of 35.0%. Men with an educational attainment of college or associate's degree enjoy the highest average annual earnings of $86,117, while those with high school diploma education earn the least with $26,232. Women with an educational attainment of bachelor's degree earn the most with the average annual earnings of $36,719, while those with less than high school education have the smallest earnings of $23,679.
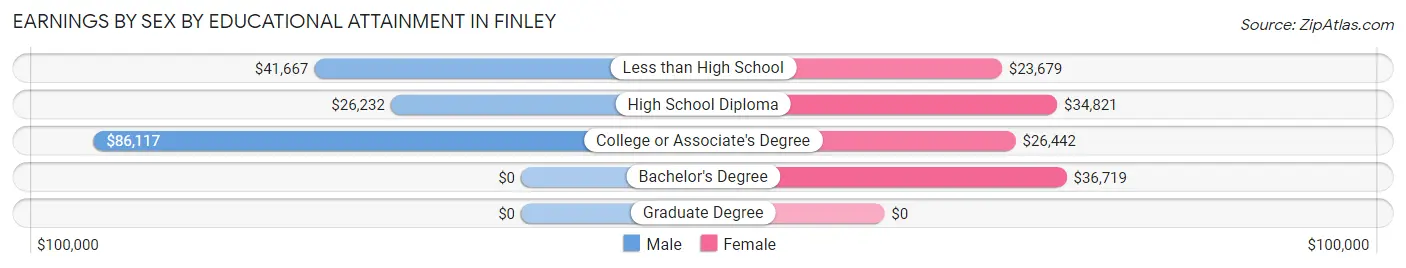
| Educational Attainment | Male Income | Female Income |
| Less than High School | $41,667 | $23,679 |
| High School Diploma | $26,232 | $34,821 |
| College or Associate's Degree | $86,117 | $26,442 |
| Bachelor's Degree | - | - |
| Graduate Degree | - | - |
| Total | $41,283 | $26,846 |
Family Income in Finley
Family Income Brackets in Finley
According to the Finley family income data, there are 383 families falling into the $100,000 to $149,999 income range, which is the most common income bracket and makes up 27.1% of all families. Conversely, the less than $10,000 income bracket is the least frequent group with only 11 families (0.8%) belonging to this category.
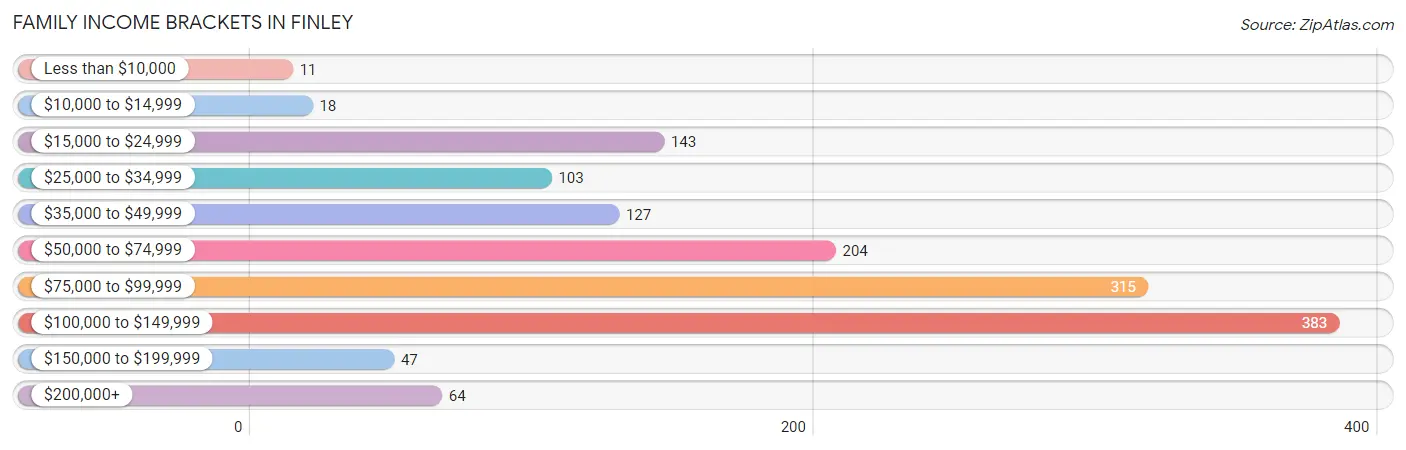
| Income Bracket | # Families | % Families |
| Less than $10,000 | 11 | 0.8% |
| $10,000 to $14,999 | 18 | 1.3% |
| $15,000 to $24,999 | 143 | 10.1% |
| $25,000 to $34,999 | 103 | 7.3% |
| $35,000 to $49,999 | 127 | 9.0% |
| $50,000 to $74,999 | 204 | 14.4% |
| $75,000 to $99,999 | 315 | 22.3% |
| $100,000 to $149,999 | 383 | 27.1% |
| $150,000 to $199,999 | 47 | 3.3% |
| $200,000+ | 64 | 4.5% |
Family Income by Famaliy Size in Finley
3-person families (300 | 21.2%) account for the highest median family income in Finley with $109,231 per family, while 3-person families (300 | 21.2%) have the highest median income of $36,410 per family member.
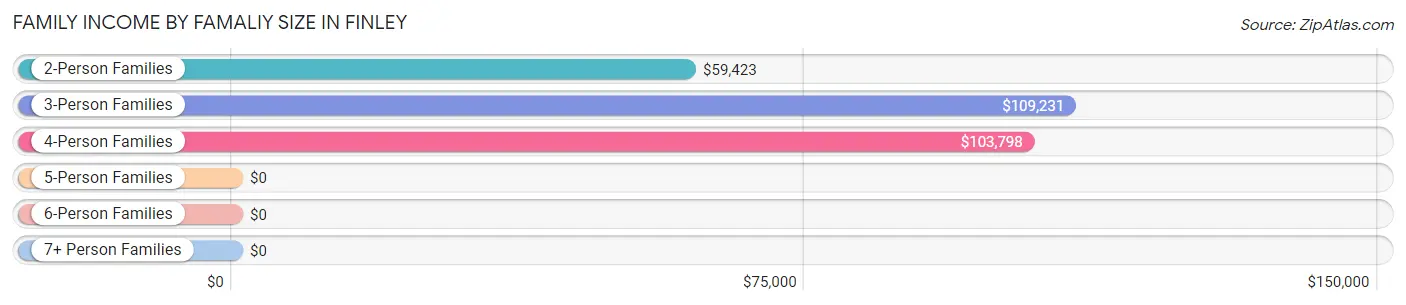
| Income Bracket | # Families | Median Income |
| 2-Person Families | 642 (45.4%) | $59,423 |
| 3-Person Families | 300 (21.2%) | $109,231 |
| 4-Person Families | 157 (11.1%) | $103,798 |
| 5-Person Families | 273 (19.3%) | $0 |
| 6-Person Families | 0 (0.0%) | $0 |
| 7+ Person Families | 42 (3.0%) | $0 |
| Total | 1,414 (100.0%) | $82,188 |
Family Income by Number of Earners in Finley
The median family income in Finley is $82,188, with families comprising 3+ earners (195) having the highest median family income of $116,883, while families with no earners (273) have the lowest median family income of $41,125, accounting for 13.8% and 19.3% of families, respectively.
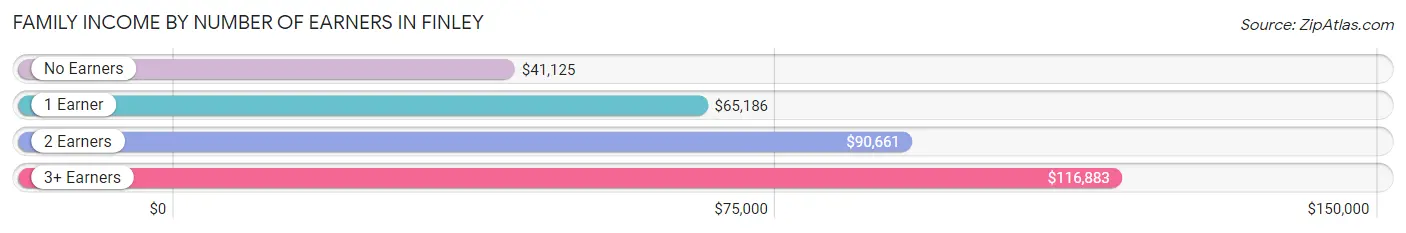
| Number of Earners | # Families | Median Income |
| No Earners | 273 (19.3%) | $41,125 |
| 1 Earner | 427 (30.2%) | $65,186 |
| 2 Earners | 519 (36.7%) | $90,661 |
| 3+ Earners | 195 (13.8%) | $116,883 |
| Total | 1,414 (100.0%) | $82,188 |
Household Income in Finley
Household Income Brackets in Finley
With 513 households falling in the category, the $100,000 to $149,999 income range is the most frequent in Finley, accounting for 28.2% of all households. In contrast, only 27 households (1.5%) fall into the less than $10,000 income bracket, making it the least populous group.
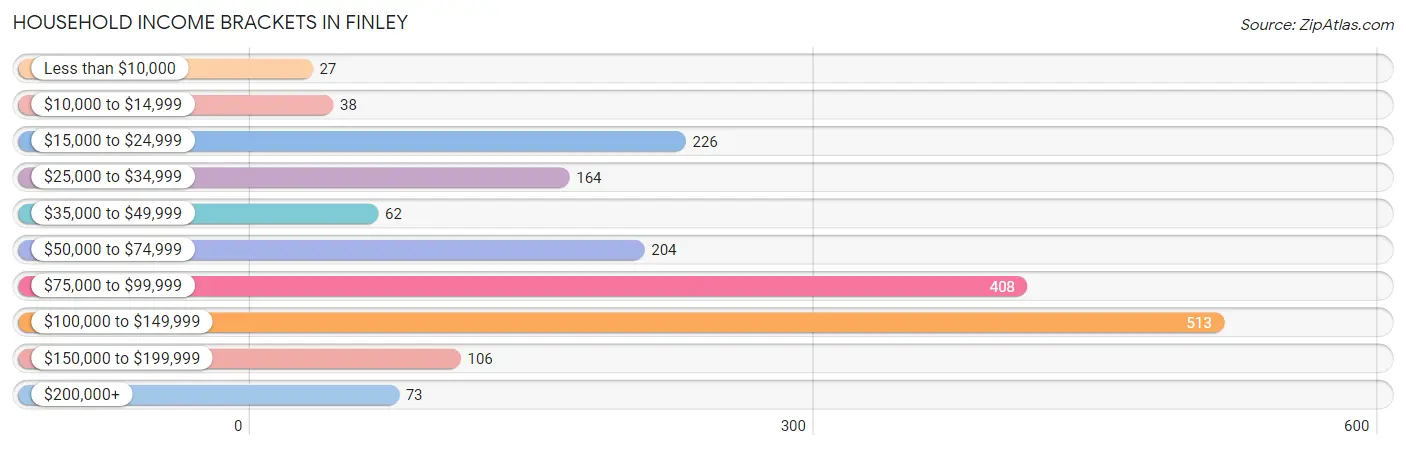
| Income Bracket | # Households | % Households |
| Less than $10,000 | 27 | 1.5% |
| $10,000 to $14,999 | 38 | 2.1% |
| $15,000 to $24,999 | 226 | 12.4% |
| $25,000 to $34,999 | 164 | 9.0% |
| $35,000 to $49,999 | 62 | 3.4% |
| $50,000 to $74,999 | 204 | 11.2% |
| $75,000 to $99,999 | 408 | 22.4% |
| $100,000 to $149,999 | 513 | 28.2% |
| $150,000 to $199,999 | 106 | 5.8% |
| $200,000+ | 73 | 4.0% |
Household Income by Householder Age in Finley
The median household income in Finley is $83,523, with the highest median household income of $103,654 found in the 25 to 44 years age bracket for the primary householder. A total of 364 households (20.0%) fall into this category. Meanwhile, the 15 to 24 years age bracket for the primary householder has the lowest median household income of $0, with 11 households (0.6%) in this group.

| Income Bracket | # Households | Median Income |
| 15 to 24 Years | 11 (0.6%) | $0 |
| 25 to 44 Years | 364 (20.0%) | $103,654 |
| 45 to 64 Years | 886 (48.7%) | $84,596 |
| 65+ Years | 559 (30.7%) | $66,168 |
| Total | 1,820 (100.0%) | $83,523 |
Poverty in Finley
Income Below Poverty by Sex and Age in Finley
With 8.7% poverty level for males and 8.5% for females among the residents of Finley, 5 year old males and 5 year old females are the most vulnerable to poverty, with 20 males (51.3%) and 48 females (100.0%) in their respective age groups living below the poverty level.
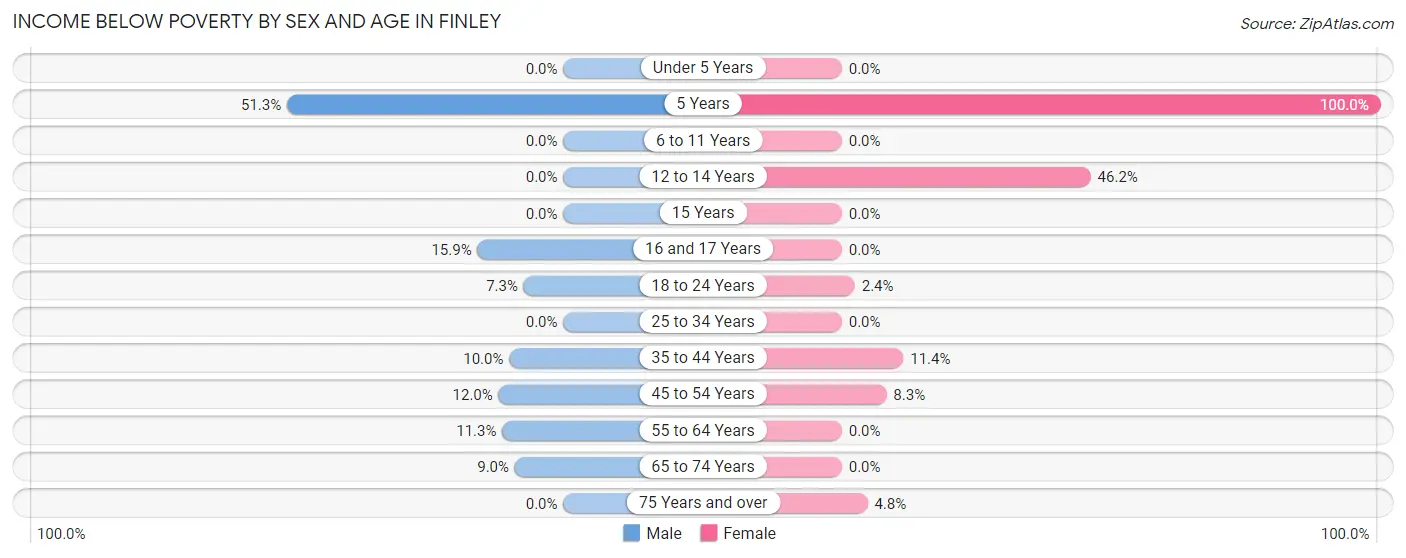
| Age Bracket | Male | Female |
| Under 5 Years | 0 (0.0%) | 0 (0.0%) |
| 5 Years | 20 (51.3%) | 48 (100.0%) |
| 6 to 11 Years | 0 (0.0%) | 0 (0.0%) |
| 12 to 14 Years | 0 (0.0%) | 97 (46.2%) |
| 15 Years | 0 (0.0%) | 0 (0.0%) |
| 16 and 17 Years | 22 (15.9%) | 0 (0.0%) |
| 18 to 24 Years | 19 (7.3%) | 11 (2.4%) |
| 25 to 34 Years | 0 (0.0%) | 0 (0.0%) |
| 35 to 44 Years | 23 (10.0%) | 51 (11.4%) |
| 45 to 54 Years | 53 (12.0%) | 24 (8.3%) |
| 55 to 64 Years | 98 (11.3%) | 0 (0.0%) |
| 65 to 74 Years | 18 (9.0%) | 0 (0.0%) |
| 75 Years and over | 0 (0.0%) | 16 (4.8%) |
| Total | 253 (8.7%) | 247 (8.5%) |
Income Above Poverty by Sex and Age in Finley
According to the poverty statistics in Finley, males aged under 5 years and females aged under 5 years are the age groups that are most secure financially, with 100.0% of males and 100.0% of females in these age groups living above the poverty line.
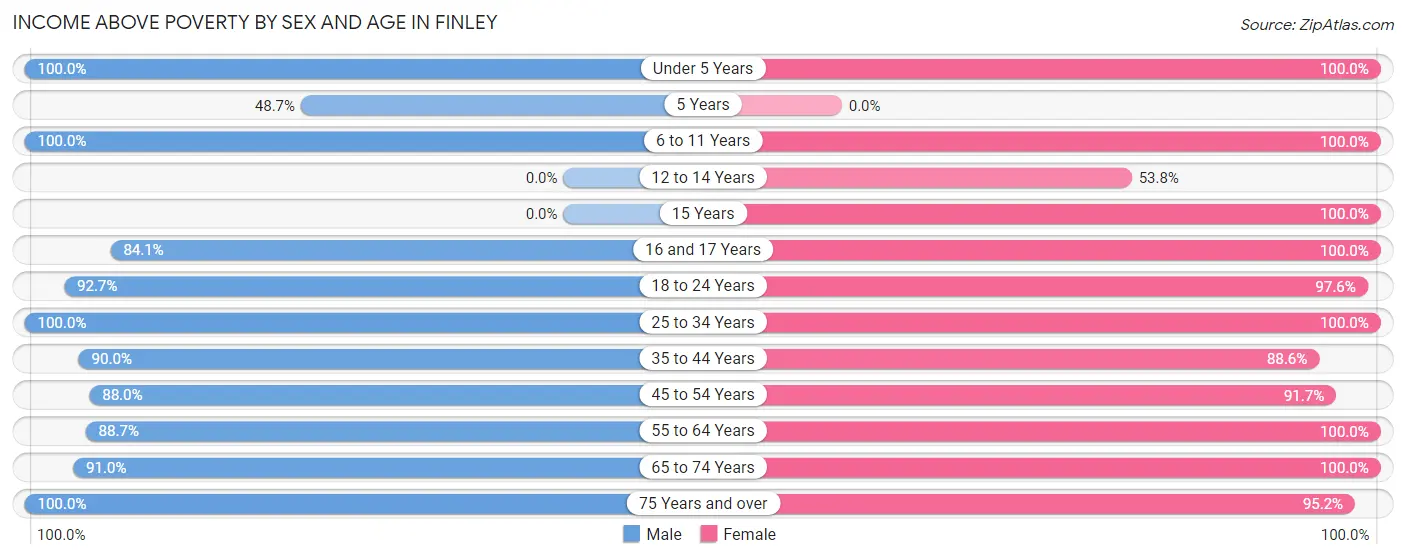
| Age Bracket | Male | Female |
| Under 5 Years | 119 (100.0%) | 23 (100.0%) |
| 5 Years | 19 (48.7%) | 0 (0.0%) |
| 6 to 11 Years | 346 (100.0%) | 125 (100.0%) |
| 12 to 14 Years | 0 (0.0%) | 113 (53.8%) |
| 15 Years | 0 (0.0%) | 69 (100.0%) |
| 16 and 17 Years | 116 (84.1%) | 102 (100.0%) |
| 18 to 24 Years | 240 (92.7%) | 446 (97.6%) |
| 25 to 34 Years | 170 (100.0%) | 240 (100.0%) |
| 35 to 44 Years | 206 (90.0%) | 396 (88.6%) |
| 45 to 54 Years | 388 (88.0%) | 266 (91.7%) |
| 55 to 64 Years | 767 (88.7%) | 322 (100.0%) |
| 65 to 74 Years | 182 (91.0%) | 228 (100.0%) |
| 75 Years and over | 103 (100.0%) | 320 (95.2%) |
| Total | 2,656 (91.3%) | 2,650 (91.5%) |
Income Below Poverty Among Married-Couple Families in Finley
The poverty statistics for married-couple families in Finley show that 9.9% or 83 of the total 842 families live below the poverty line. Families with 3 or 4 children have the highest poverty rate of 80.6%, comprising of 54 families. On the other hand, families with 5 or more children have the lowest poverty rate of 0.0%, which includes 0 families.
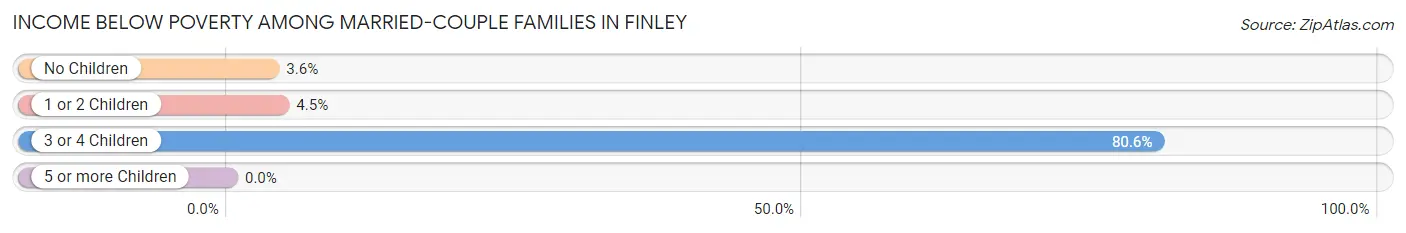
| Children | Above Poverty | Below Poverty |
| No Children | 482 (96.4%) | 18 (3.6%) |
| 1 or 2 Children | 235 (95.5%) | 11 (4.5%) |
| 3 or 4 Children | 13 (19.4%) | 54 (80.6%) |
| 5 or more Children | 29 (100.0%) | 0 (0.0%) |
| Total | 759 (90.1%) | 83 (9.9%) |
Income Below Poverty Among Single-Parent Households in Finley
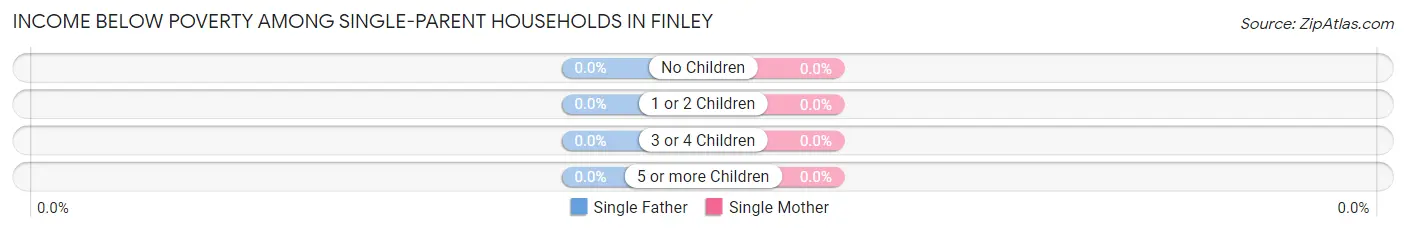
| Children | Single Father | Single Mother |
| No Children | 0 (0.0%) | 0 (0.0%) |
| 1 or 2 Children | 0 (0.0%) | 0 (0.0%) |
| 3 or 4 Children | 0 (0.0%) | 0 (0.0%) |
| 5 or more Children | 0 (0.0%) | 0 (0.0%) |
| Total | 0 (0.0%) | 0 (0.0%) |
Income Below Poverty Among Married-Couple vs Single-Parent Households in Finley
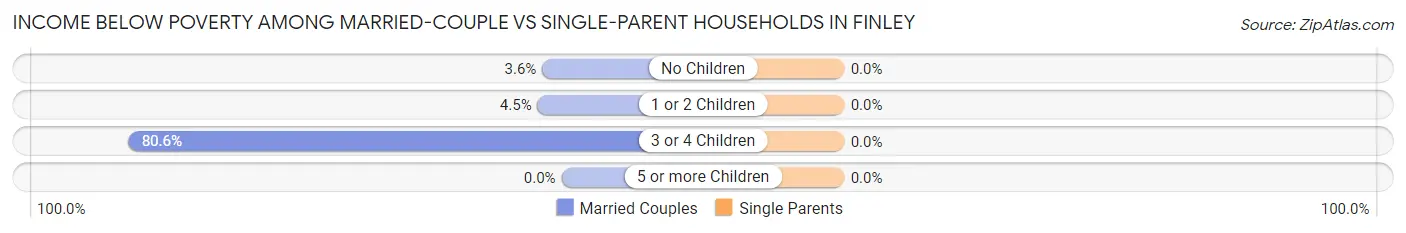
| Children | Married-Couple Families | Single-Parent Households |
| No Children | 18 (3.6%) | 0 (0.0%) |
| 1 or 2 Children | 11 (4.5%) | 0 (0.0%) |
| 3 or 4 Children | 54 (80.6%) | 0 (0.0%) |
| 5 or more Children | 0 (0.0%) | 0 (0.0%) |
| Total | 83 (9.9%) | 0 (0.0%) |
Employment Characteristics in Finley
Employment by Class of Employer in Finley
Among the 2,472 employed individuals in Finley, private company employees (1,458 | 59.0%), state government employees (314 | 12.7%), and local government employees (205 | 8.3%) make up the most common classes of employment.
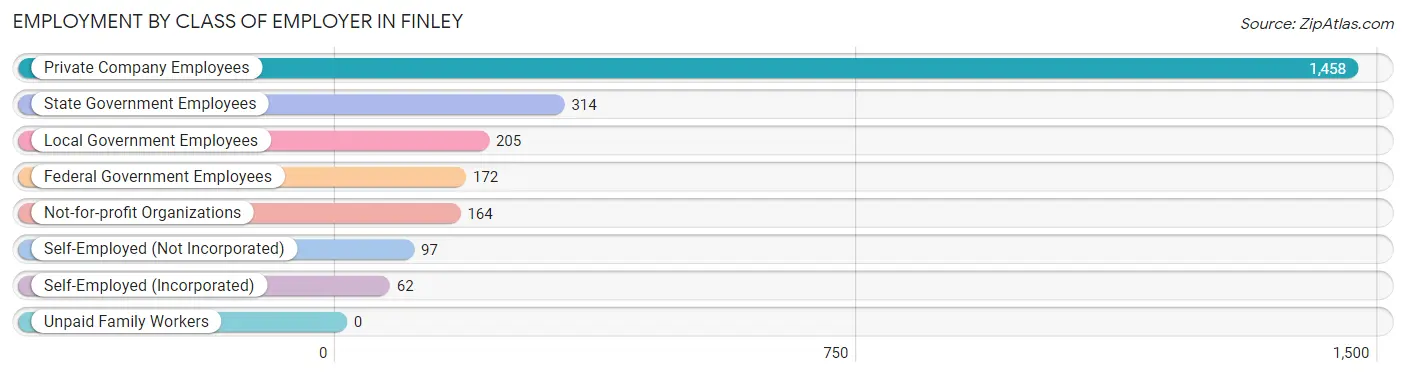
| Employer Class | # Employees | % Employees |
| Private Company Employees | 1,458 | 59.0% |
| Self-Employed (Incorporated) | 62 | 2.5% |
| Self-Employed (Not Incorporated) | 97 | 3.9% |
| Not-for-profit Organizations | 164 | 6.6% |
| Local Government Employees | 205 | 8.3% |
| State Government Employees | 314 | 12.7% |
| Federal Government Employees | 172 | 7.0% |
| Unpaid Family Workers | 0 | 0.0% |
| Total | 2,472 | 100.0% |
Employment Status by Age in Finley
According to the labor force statistics for Finley, out of the total population over 16 years of age (4,827), 62.3% or 3,007 individuals are in the labor force, with 8.2% or 247 of them unemployed. The age group with the highest labor force participation rate is 30 to 34 years, with 88.0% or 220 individuals in the labor force. Within the labor force, the 25 to 29 years age range has the highest percentage of unemployed individuals, with 59.3% or 83 of them being unemployed.
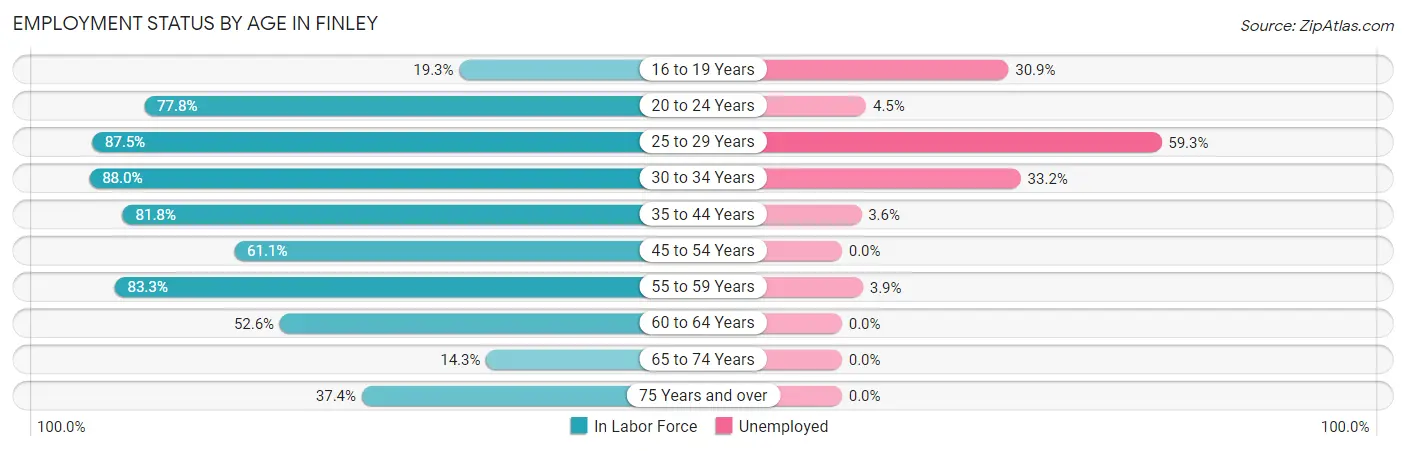
| Age Bracket | In Labor Force | Unemployed |
| 16 to 19 Years | 68 (19.3%) | 21 (30.9%) |
| 20 to 24 Years | 469 (77.8%) | 21 (4.5%) |
| 25 to 29 Years | 140 (87.5%) | 83 (59.3%) |
| 30 to 34 Years | 220 (88.0%) | 73 (33.2%) |
| 35 to 44 Years | 553 (81.8%) | 20 (3.6%) |
| 45 to 54 Years | 447 (61.1%) | 0 (0.0%) |
| 55 to 59 Years | 713 (83.3%) | 28 (3.9%) |
| 60 to 64 Years | 174 (52.6%) | 0 (0.0%) |
| 65 to 74 Years | 61 (14.3%) | 0 (0.0%) |
| 75 Years and over | 164 (37.4%) | 0 (0.0%) |
| Total | 3,007 (62.3%) | 247 (8.2%) |
Employment Status by Educational Attainment in Finley
According to labor force statistics for Finley, 74.8% of individuals (2,247) out of the total population between 25 and 64 years of age (3,004) are in the labor force, with 9.1% or 204 of them being unemployed. The group with the highest labor force participation rate are those with the educational attainment of bachelor's degree or higher, with 94.2% or 374 individuals in the labor force. Within the labor force, individuals with college / associate degree education have the highest percentage of unemployment, with 22.4% or 156 of them being unemployed.
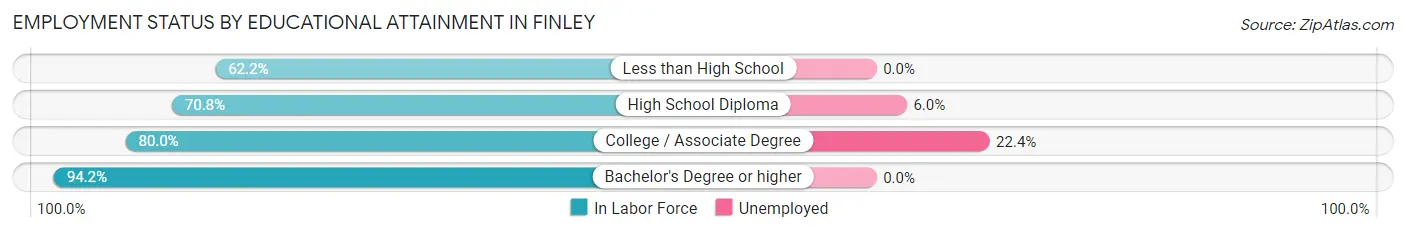
| Educational Attainment | In Labor Force | Unemployed |
| Less than High School | 378 (62.2%) | 0 (0.0%) |
| High School Diploma | 800 (70.8%) | 68 (6.0%) |
| College / Associate Degree | 695 (80.0%) | 195 (22.4%) |
| Bachelor's Degree or higher | 374 (94.2%) | 0 (0.0%) |
| Total | 2,247 (74.8%) | 273 (9.1%) |
Employment Occupations by Sex in Finley
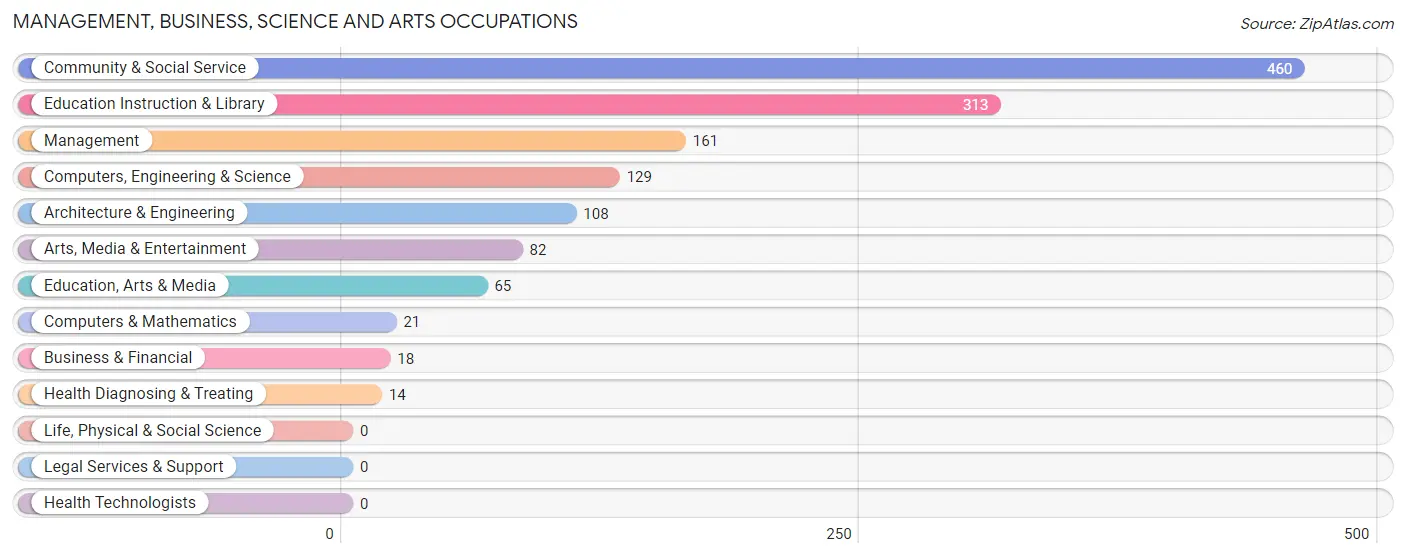
Management, Business, Science and Arts Occupations
The most common Management, Business, Science and Arts occupations in Finley are Community & Social Service (460 | 16.7%), Education Instruction & Library (313 | 11.3%), Management (161 | 5.8%), Computers, Engineering & Science (129 | 4.7%), and Architecture & Engineering (108 | 3.9%).
Management, Business, Science and Arts Occupations by Sex
Within the Management, Business, Science and Arts occupations in Finley, the most male-oriented occupations are Computers & Mathematics (100.0%), Health Diagnosing & Treating (100.0%), and Management (59.0%), while the most female-oriented occupations are Business & Financial (100.0%), Education, Arts & Media (100.0%), and Education Instruction & Library (94.3%).
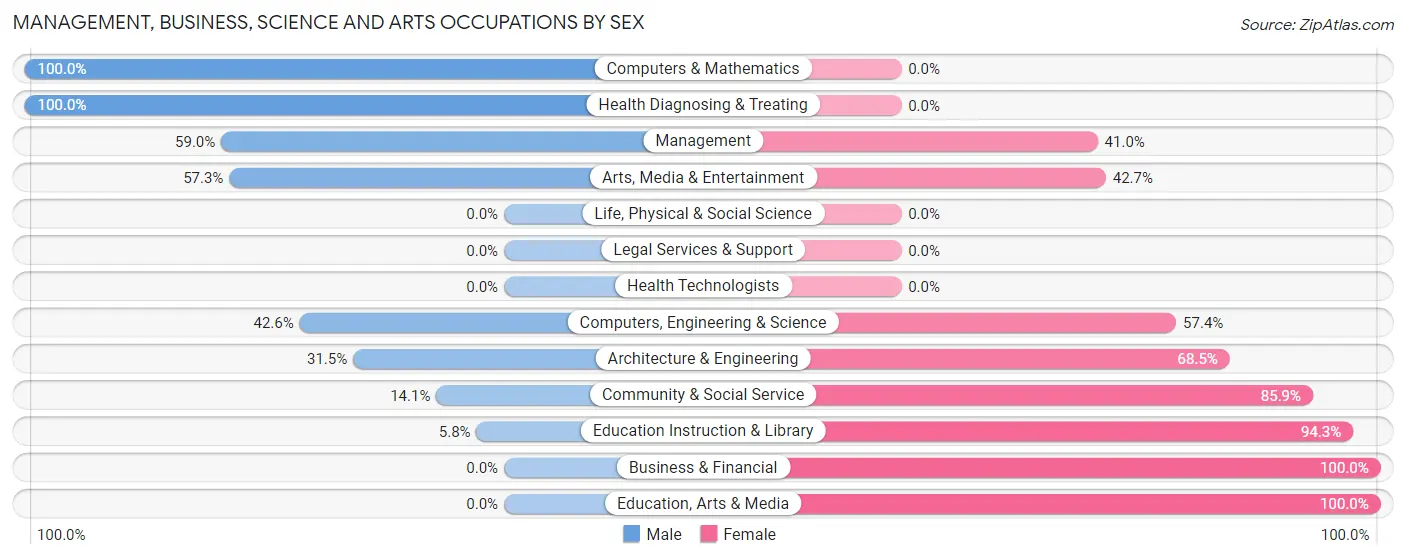
| Occupation | Male | Female |
| Management | 95 (59.0%) | 66 (41.0%) |
| Business & Financial | 0 (0.0%) | 18 (100.0%) |
| Computers, Engineering & Science | 55 (42.6%) | 74 (57.4%) |
| Computers & Mathematics | 21 (100.0%) | 0 (0.0%) |
| Architecture & Engineering | 34 (31.5%) | 74 (68.5%) |
| Life, Physical & Social Science | 0 (0.0%) | 0 (0.0%) |
| Community & Social Service | 65 (14.1%) | 395 (85.9%) |
| Education, Arts & Media | 0 (0.0%) | 65 (100.0%) |
| Legal Services & Support | 0 (0.0%) | 0 (0.0%) |
| Education Instruction & Library | 18 (5.8%) | 295 (94.3%) |
| Arts, Media & Entertainment | 47 (57.3%) | 35 (42.7%) |
| Health Diagnosing & Treating | 14 (100.0%) | 0 (0.0%) |
| Health Technologists | 0 (0.0%) | 0 (0.0%) |
| Total (Category) | 229 (29.3%) | 553 (70.7%) |
| Total (Overall) | 1,354 (49.0%) | 1,409 (51.0%) |
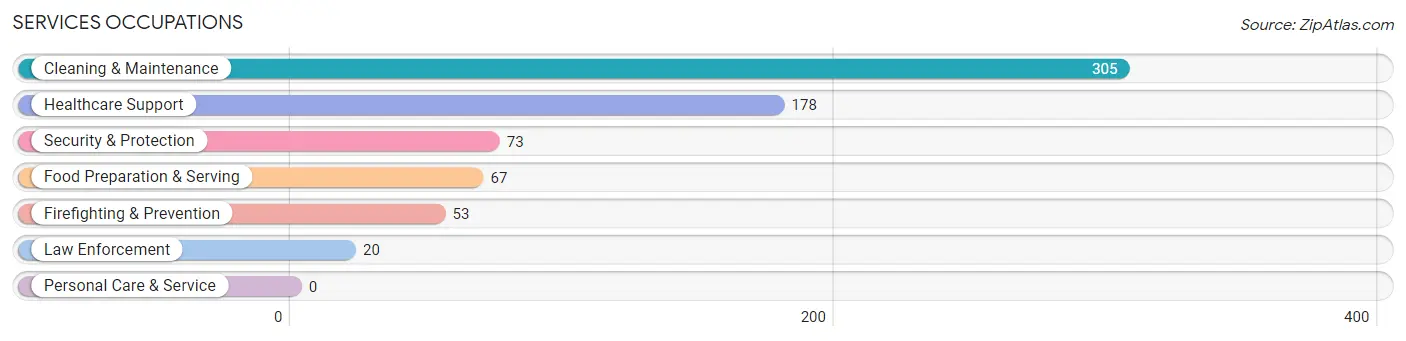
Services Occupations
The most common Services occupations in Finley are Cleaning & Maintenance (305 | 11.0%), Healthcare Support (178 | 6.4%), Security & Protection (73 | 2.6%), Food Preparation & Serving (67 | 2.4%), and Firefighting & Prevention (53 | 1.9%).
Services Occupations by Sex
Within the Services occupations in Finley, the most male-oriented occupations are Law Enforcement (100.0%), Security & Protection (65.7%), and Cleaning & Maintenance (63.9%), while the most female-oriented occupations are Food Preparation & Serving (100.0%), Healthcare Support (94.4%), and Firefighting & Prevention (47.2%).
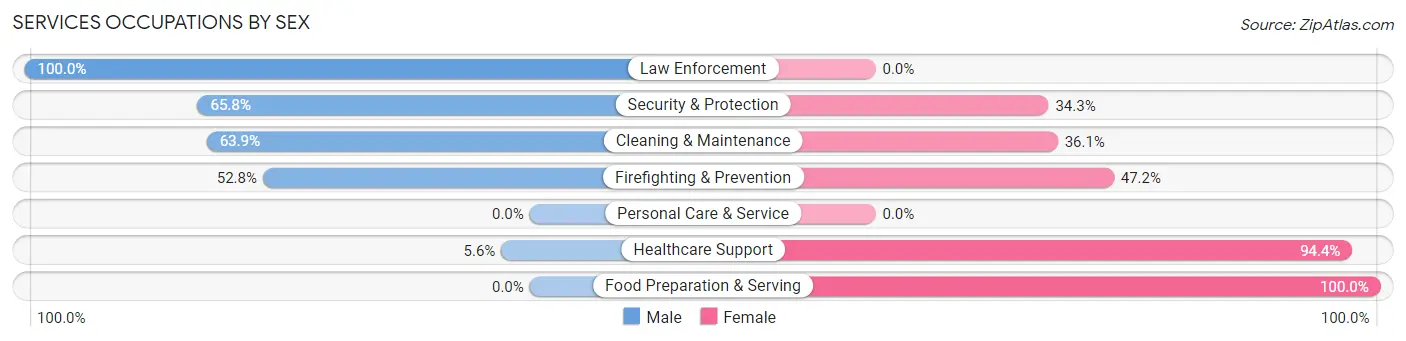
| Occupation | Male | Female |
| Healthcare Support | 10 (5.6%) | 168 (94.4%) |
| Security & Protection | 48 (65.7%) | 25 (34.3%) |
| Firefighting & Prevention | 28 (52.8%) | 25 (47.2%) |
| Law Enforcement | 20 (100.0%) | 0 (0.0%) |
| Food Preparation & Serving | 0 (0.0%) | 67 (100.0%) |
| Cleaning & Maintenance | 195 (63.9%) | 110 (36.1%) |
| Personal Care & Service | 0 (0.0%) | 0 (0.0%) |
| Total (Category) | 253 (40.6%) | 370 (59.4%) |
| Total (Overall) | 1,354 (49.0%) | 1,409 (51.0%) |
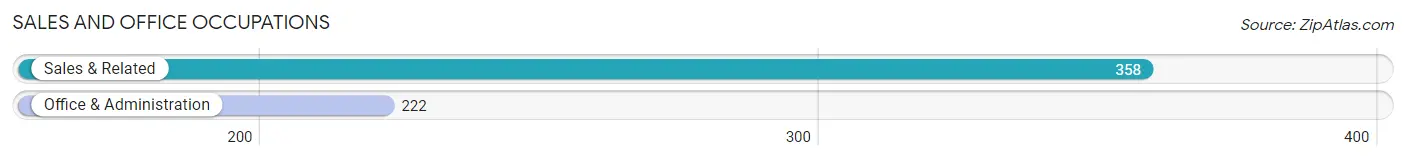
Sales and Office Occupations
The most common Sales and Office occupations in Finley are Sales & Related (358 | 13.0%), and Office & Administration (222 | 8.0%).
Sales and Office Occupations by Sex
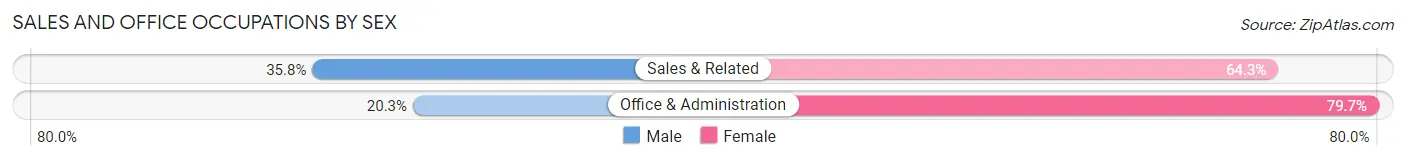
| Occupation | Male | Female |
| Sales & Related | 128 (35.7%) | 230 (64.2%) |
| Office & Administration | 45 (20.3%) | 177 (79.7%) |
| Total (Category) | 173 (29.8%) | 407 (70.2%) |
| Total (Overall) | 1,354 (49.0%) | 1,409 (51.0%) |
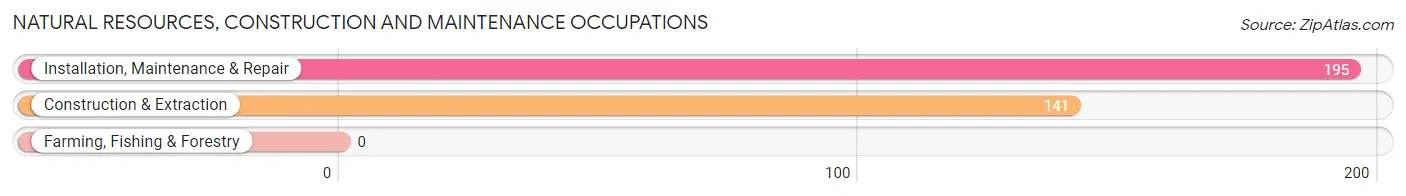
Natural Resources, Construction and Maintenance Occupations
The most common Natural Resources, Construction and Maintenance occupations in Finley are Installation, Maintenance & Repair (195 | 7.1%), and Construction & Extraction (141 | 5.1%).
Natural Resources, Construction and Maintenance Occupations by Sex
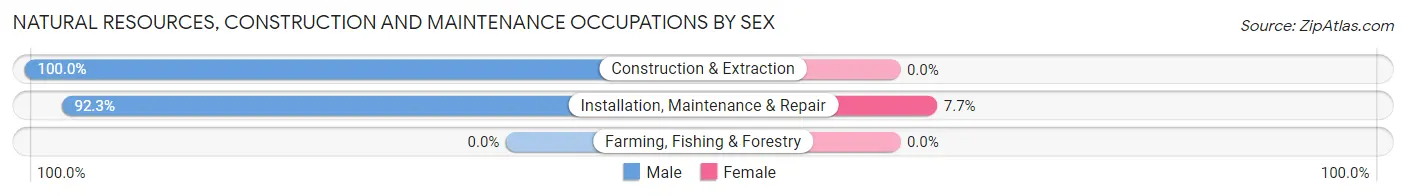
| Occupation | Male | Female |
| Farming, Fishing & Forestry | 0 (0.0%) | 0 (0.0%) |
| Construction & Extraction | 141 (100.0%) | 0 (0.0%) |
| Installation, Maintenance & Repair | 180 (92.3%) | 15 (7.7%) |
| Total (Category) | 321 (95.5%) | 15 (4.5%) |
| Total (Overall) | 1,354 (49.0%) | 1,409 (51.0%) |
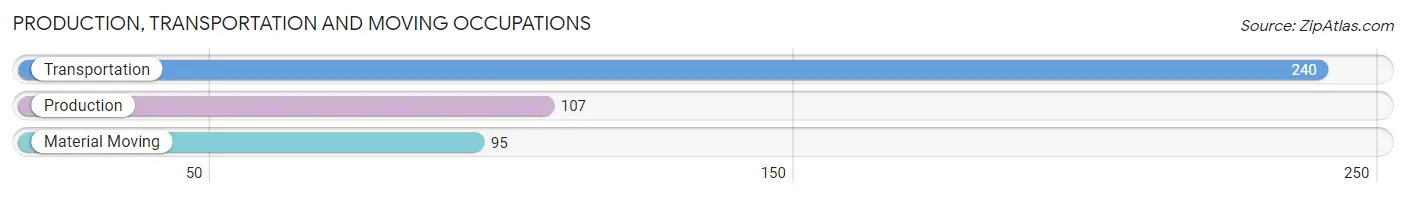
Production, Transportation and Moving Occupations
The most common Production, Transportation and Moving occupations in Finley are Transportation (240 | 8.7%), Production (107 | 3.9%), and Material Moving (95 | 3.4%).
Production, Transportation and Moving Occupations by Sex
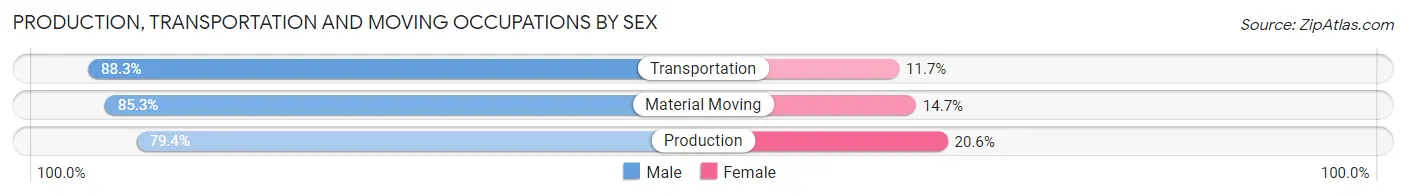
| Occupation | Male | Female |
| Production | 85 (79.4%) | 22 (20.6%) |
| Transportation | 212 (88.3%) | 28 (11.7%) |
| Material Moving | 81 (85.3%) | 14 (14.7%) |
| Total (Category) | 378 (85.5%) | 64 (14.5%) |
| Total (Overall) | 1,354 (49.0%) | 1,409 (51.0%) |
Employment Industries by Sex in Finley
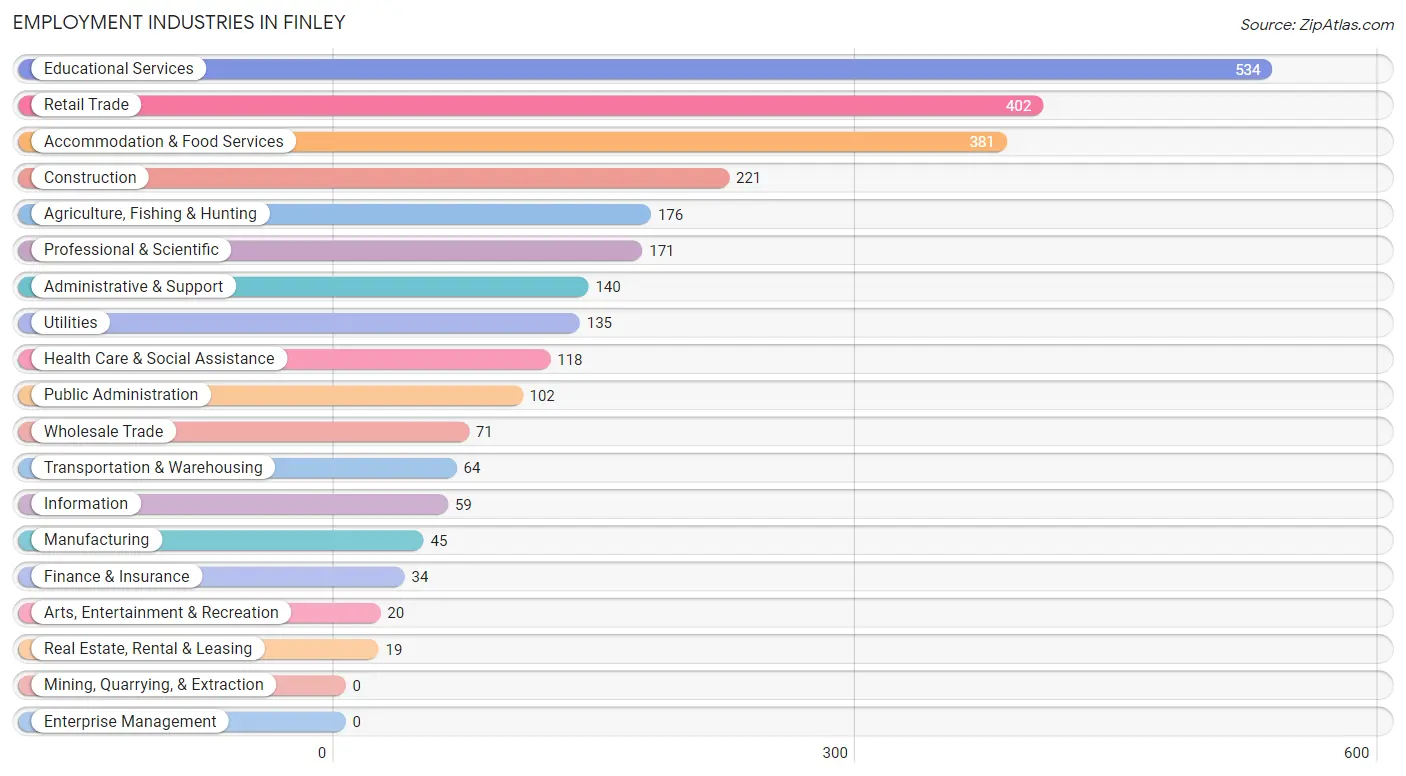
Employment Industries in Finley
The major employment industries in Finley include Educational Services (534 | 19.3%), Retail Trade (402 | 14.5%), Accommodation & Food Services (381 | 13.8%), Construction (221 | 8.0%), and Agriculture, Fishing & Hunting (176 | 6.4%).
Employment Industries by Sex in Finley
The Finley industries that see more men than women are Wholesale Trade (100.0%), Transportation & Warehousing (100.0%), and Information (100.0%), whereas the industries that tend to have a higher number of women are Educational Services (83.3%), Health Care & Social Assistance (79.7%), and Retail Trade (76.1%).
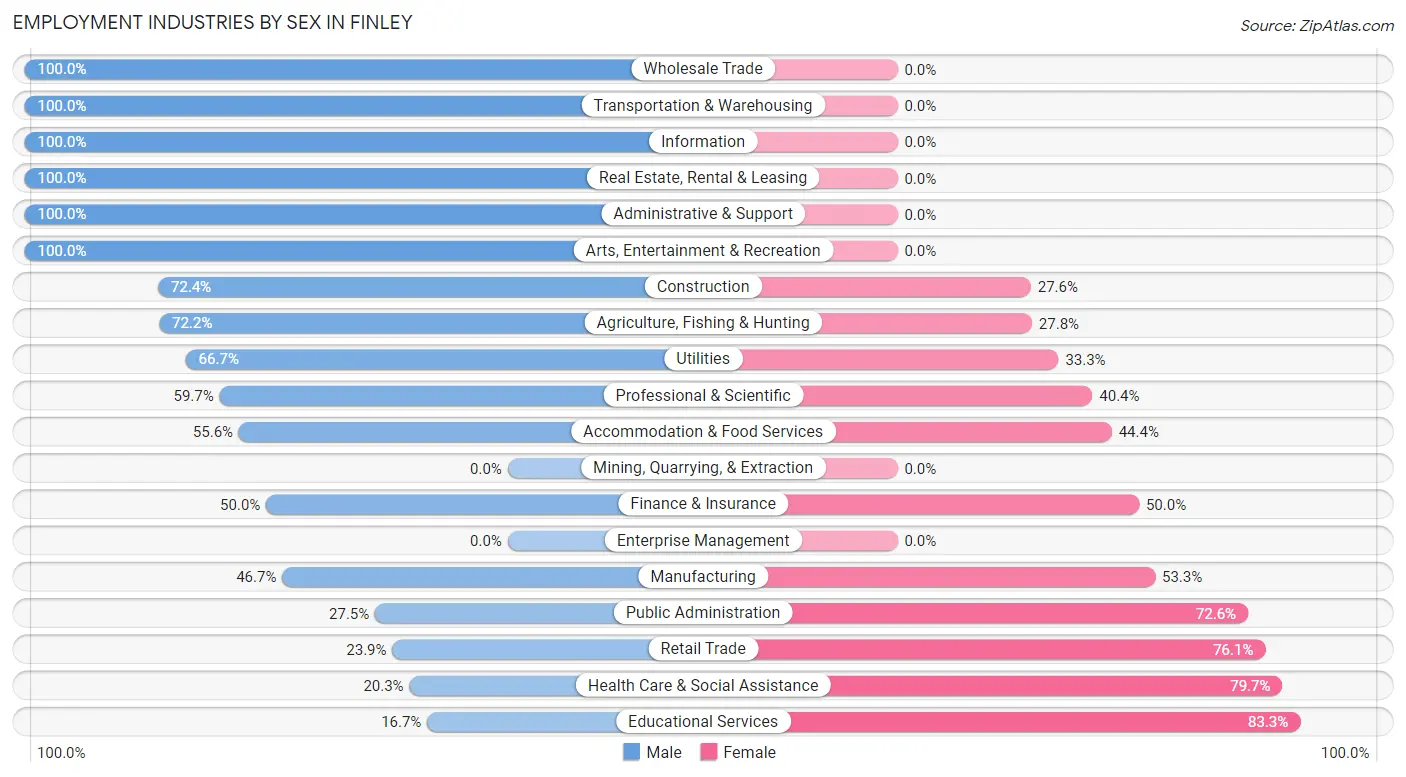
| Industry | Male | Female |
| Agriculture, Fishing & Hunting | 127 (72.2%) | 49 (27.8%) |
| Mining, Quarrying, & Extraction | 0 (0.0%) | 0 (0.0%) |
| Construction | 160 (72.4%) | 61 (27.6%) |
| Manufacturing | 21 (46.7%) | 24 (53.3%) |
| Wholesale Trade | 71 (100.0%) | 0 (0.0%) |
| Retail Trade | 96 (23.9%) | 306 (76.1%) |
| Transportation & Warehousing | 64 (100.0%) | 0 (0.0%) |
| Utilities | 90 (66.7%) | 45 (33.3%) |
| Information | 59 (100.0%) | 0 (0.0%) |
| Finance & Insurance | 17 (50.0%) | 17 (50.0%) |
| Real Estate, Rental & Leasing | 19 (100.0%) | 0 (0.0%) |
| Professional & Scientific | 102 (59.7%) | 69 (40.4%) |
| Enterprise Management | 0 (0.0%) | 0 (0.0%) |
| Administrative & Support | 140 (100.0%) | 0 (0.0%) |
| Educational Services | 89 (16.7%) | 445 (83.3%) |
| Health Care & Social Assistance | 24 (20.3%) | 94 (79.7%) |
| Arts, Entertainment & Recreation | 20 (100.0%) | 0 (0.0%) |
| Accommodation & Food Services | 212 (55.6%) | 169 (44.4%) |
| Public Administration | 28 (27.5%) | 74 (72.6%) |
| Total | 1,354 (49.0%) | 1,409 (51.0%) |
Education in Finley
School Enrollment in Finley
The most common levels of schooling among the 1,227 students in Finley are high school (375 | 30.6%), college / undergraduate (282 | 23.0%), and middle school (253 | 20.6%).
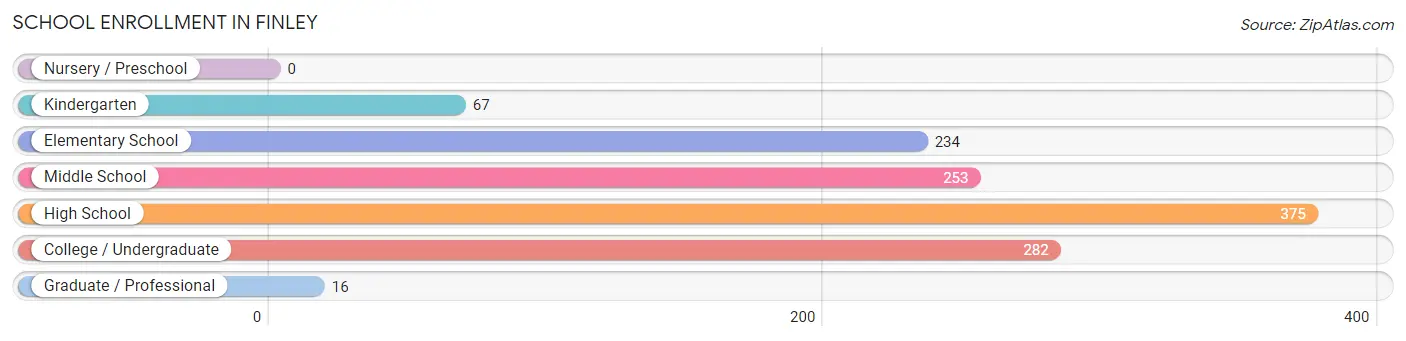
| School Level | # Students | % Students |
| Nursery / Preschool | 0 | 0.0% |
| Kindergarten | 67 | 5.5% |
| Elementary School | 234 | 19.1% |
| Middle School | 253 | 20.6% |
| High School | 375 | 30.6% |
| College / Undergraduate | 282 | 23.0% |
| Graduate / Professional | 16 | 1.3% |
| Total | 1,227 | 100.0% |
School Enrollment by Age by Funding Source in Finley
Out of a total of 1,227 students who are enrolled in schools in Finley, 29 (2.4%) attend a private institution, while the remaining 1,198 (97.6%) are enrolled in public schools. The age group of 20 to 24 year olds has the highest likelihood of being enrolled in private schools, with 16 (6.6% in the age bracket) enrolled. Conversely, the age group of 10 to 14 year olds has the lowest likelihood of being enrolled in a private school, with 253 (100.0% in the age bracket) attending a public institution.
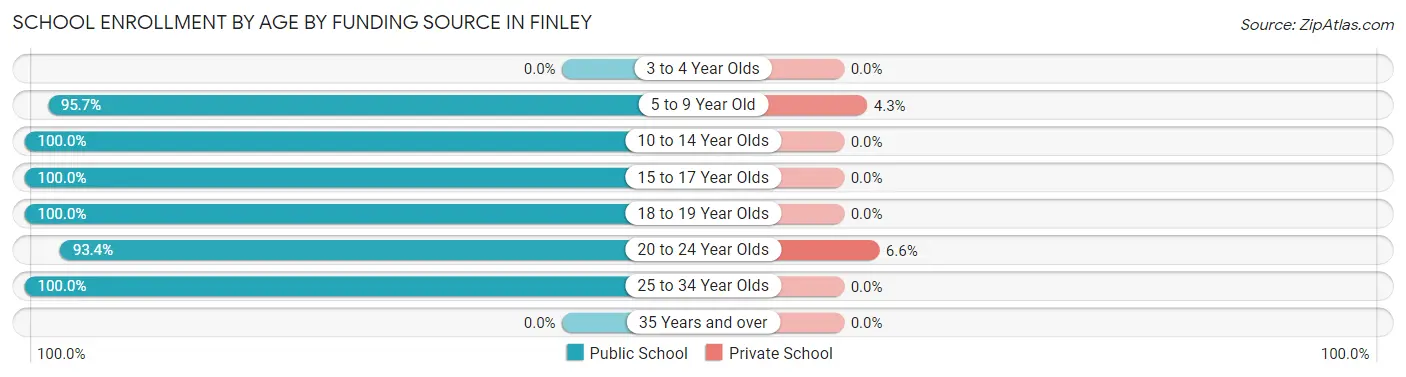
| Age Bracket | Public School | Private School |
| 3 to 4 Year Olds | 0 (0.0%) | 0 (0.0%) |
| 5 to 9 Year Old | 288 (95.7%) | 13 (4.3%) |
| 10 to 14 Year Olds | 253 (100.0%) | 0 (0.0%) |
| 15 to 17 Year Olds | 309 (100.0%) | 0 (0.0%) |
| 18 to 19 Year Olds | 94 (100.0%) | 0 (0.0%) |
| 20 to 24 Year Olds | 228 (93.4%) | 16 (6.6%) |
| 25 to 34 Year Olds | 26 (100.0%) | 0 (0.0%) |
| 35 Years and over | 0 (0.0%) | 0 (0.0%) |
| Total | 1,198 (97.6%) | 29 (2.4%) |
Educational Attainment by Field of Study in Finley
Education (122 | 20.7%), business (109 | 18.5%), social sciences (85 | 14.4%), engineering (66 | 11.2%), and arts & humanities (60 | 10.2%) are the most common fields of study among 590 individuals in Finley who have obtained a bachelor's degree or higher.
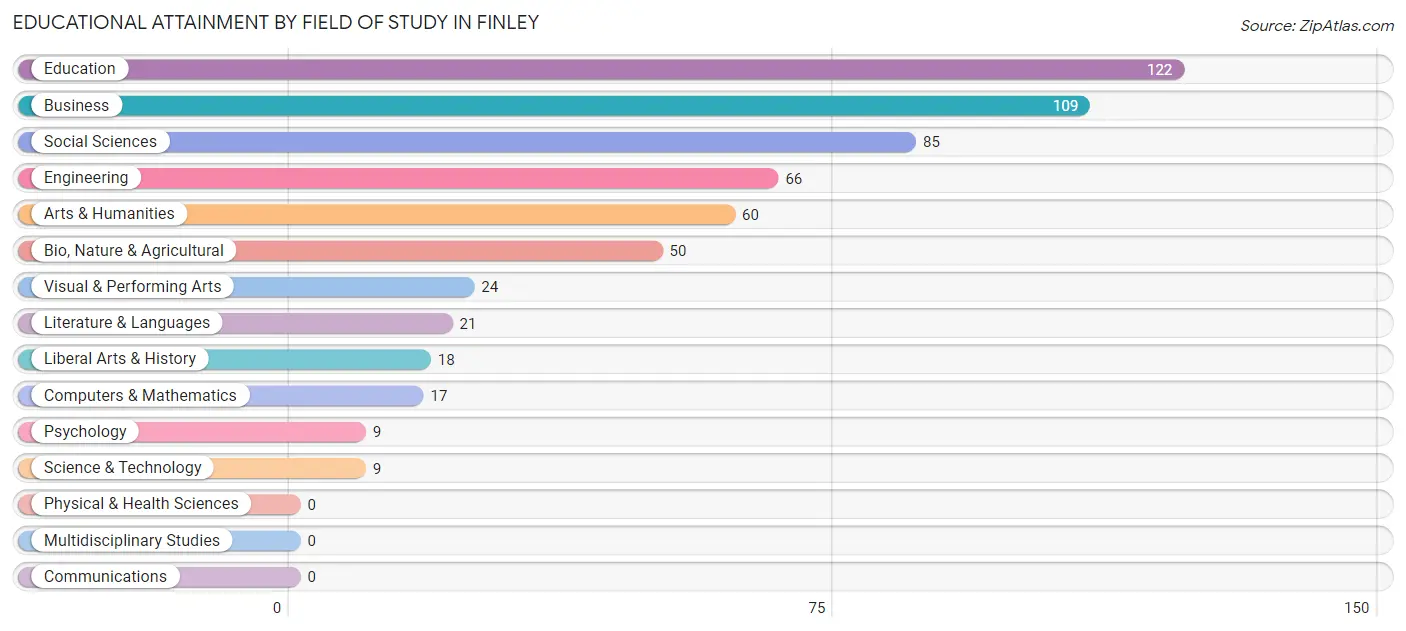
| Field of Study | # Graduates | % Graduates |
| Computers & Mathematics | 17 | 2.9% |
| Bio, Nature & Agricultural | 50 | 8.5% |
| Physical & Health Sciences | 0 | 0.0% |
| Psychology | 9 | 1.5% |
| Social Sciences | 85 | 14.4% |
| Engineering | 66 | 11.2% |
| Multidisciplinary Studies | 0 | 0.0% |
| Science & Technology | 9 | 1.5% |
| Business | 109 | 18.5% |
| Education | 122 | 20.7% |
| Literature & Languages | 21 | 3.6% |
| Liberal Arts & History | 18 | 3.0% |
| Visual & Performing Arts | 24 | 4.1% |
| Communications | 0 | 0.0% |
| Arts & Humanities | 60 | 10.2% |
| Total | 590 | 100.0% |
Transportation & Commute in Finley
Vehicle Availability by Sex in Finley
The most prevalent vehicle ownership categories in Finley are males with 3 vehicles (394, accounting for 34.5%) and females with 3 vehicles (406, making up 29.6%).
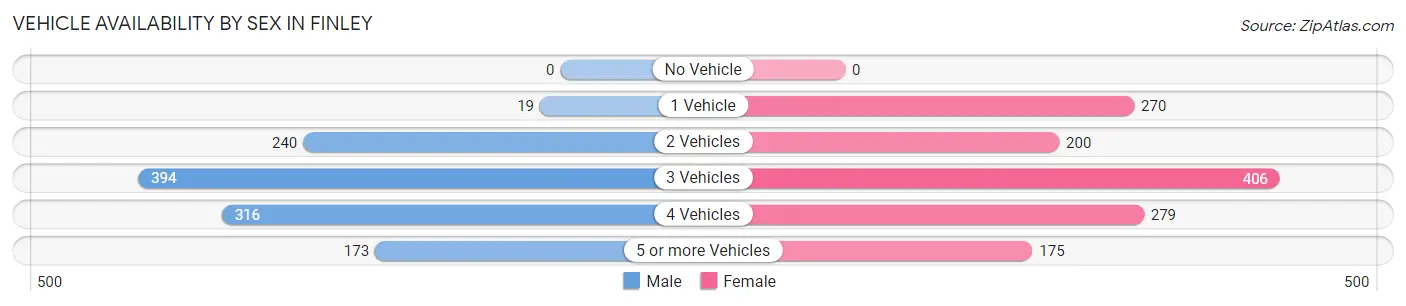
| Vehicles Available | Male | Female |
| No Vehicle | 0 (0.0%) | 0 (0.0%) |
| 1 Vehicle | 19 (1.7%) | 270 (20.3%) |
| 2 Vehicles | 240 (21.0%) | 200 (15.0%) |
| 3 Vehicles | 394 (34.5%) | 406 (30.5%) |
| 4 Vehicles | 316 (27.7%) | 279 (21.0%) |
| 5 or more Vehicles | 173 (15.1%) | 175 (13.2%) |
| Total | 1,142 (100.0%) | 1,330 (100.0%) |
Commute Time in Finley
The most frequently occuring commute durations in Finley are 30 to 34 minutes (453 commuters, 20.1%), 45 to 59 minutes (345 commuters, 15.3%), and 20 to 24 minutes (324 commuters, 14.3%).
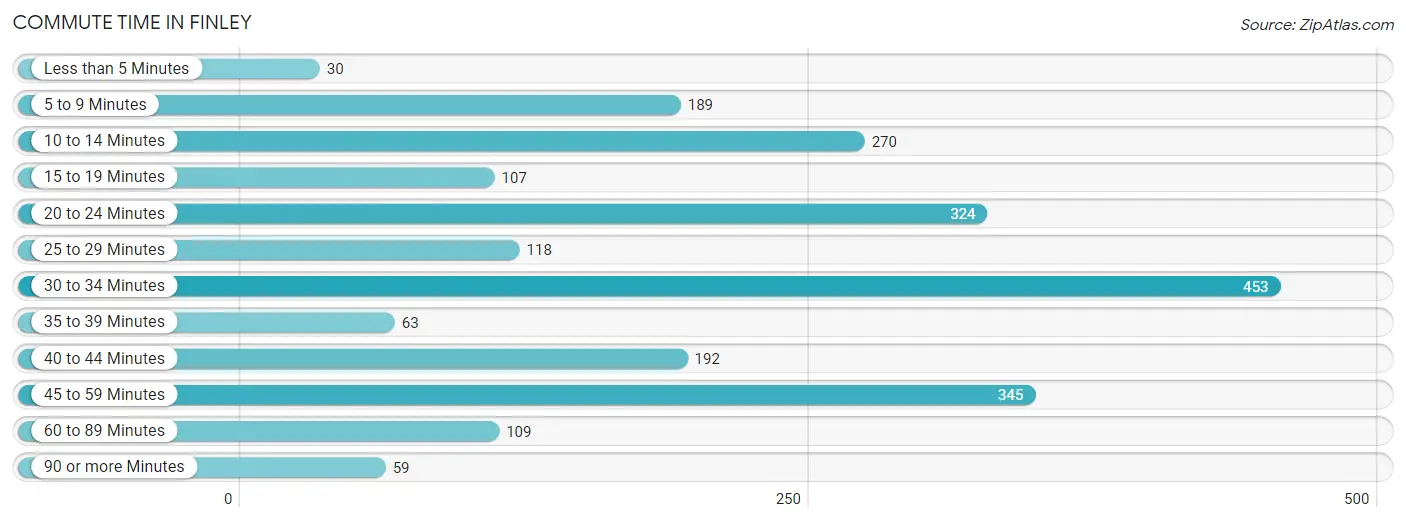
| Commute Time | # Commuters | % Commuters |
| Less than 5 Minutes | 30 | 1.3% |
| 5 to 9 Minutes | 189 | 8.4% |
| 10 to 14 Minutes | 270 | 11.9% |
| 15 to 19 Minutes | 107 | 4.7% |
| 20 to 24 Minutes | 324 | 14.3% |
| 25 to 29 Minutes | 118 | 5.2% |
| 30 to 34 Minutes | 453 | 20.1% |
| 35 to 39 Minutes | 63 | 2.8% |
| 40 to 44 Minutes | 192 | 8.5% |
| 45 to 59 Minutes | 345 | 15.3% |
| 60 to 89 Minutes | 109 | 4.8% |
| 90 or more Minutes | 59 | 2.6% |
Commute Time by Sex in Finley
The most common commute times in Finley are 30 to 34 minutes (204 commuters, 19.1%) for males and 30 to 34 minutes (249 commuters, 21.0%) for females.
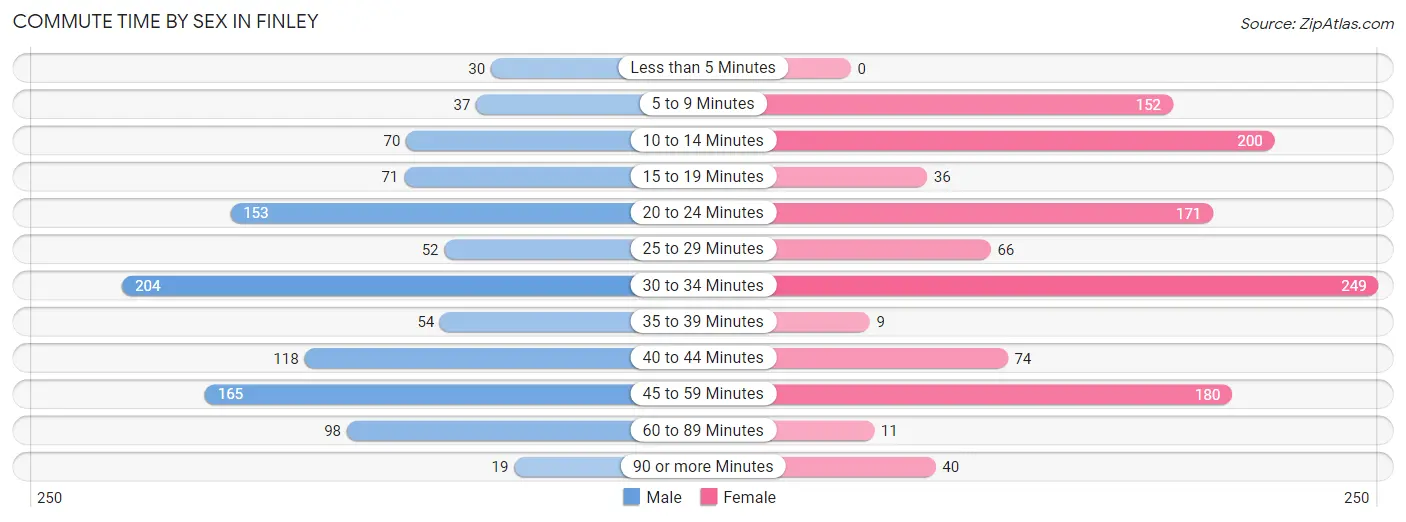
| Commute Time | Male | Female |
| Less than 5 Minutes | 30 (2.8%) | 0 (0.0%) |
| 5 to 9 Minutes | 37 (3.5%) | 152 (12.8%) |
| 10 to 14 Minutes | 70 (6.5%) | 200 (16.8%) |
| 15 to 19 Minutes | 71 (6.6%) | 36 (3.0%) |
| 20 to 24 Minutes | 153 (14.3%) | 171 (14.4%) |
| 25 to 29 Minutes | 52 (4.9%) | 66 (5.6%) |
| 30 to 34 Minutes | 204 (19.1%) | 249 (21.0%) |
| 35 to 39 Minutes | 54 (5.0%) | 9 (0.8%) |
| 40 to 44 Minutes | 118 (11.0%) | 74 (6.2%) |
| 45 to 59 Minutes | 165 (15.4%) | 180 (15.1%) |
| 60 to 89 Minutes | 98 (9.1%) | 11 (0.9%) |
| 90 or more Minutes | 19 (1.8%) | 40 (3.4%) |
Time of Departure to Work by Sex in Finley
The most frequent times of departure to work in Finley are 5:00 AM to 5:29 AM (330, 30.8%) for males and 4:00 PM to 11:59 PM (173, 14.6%) for females.
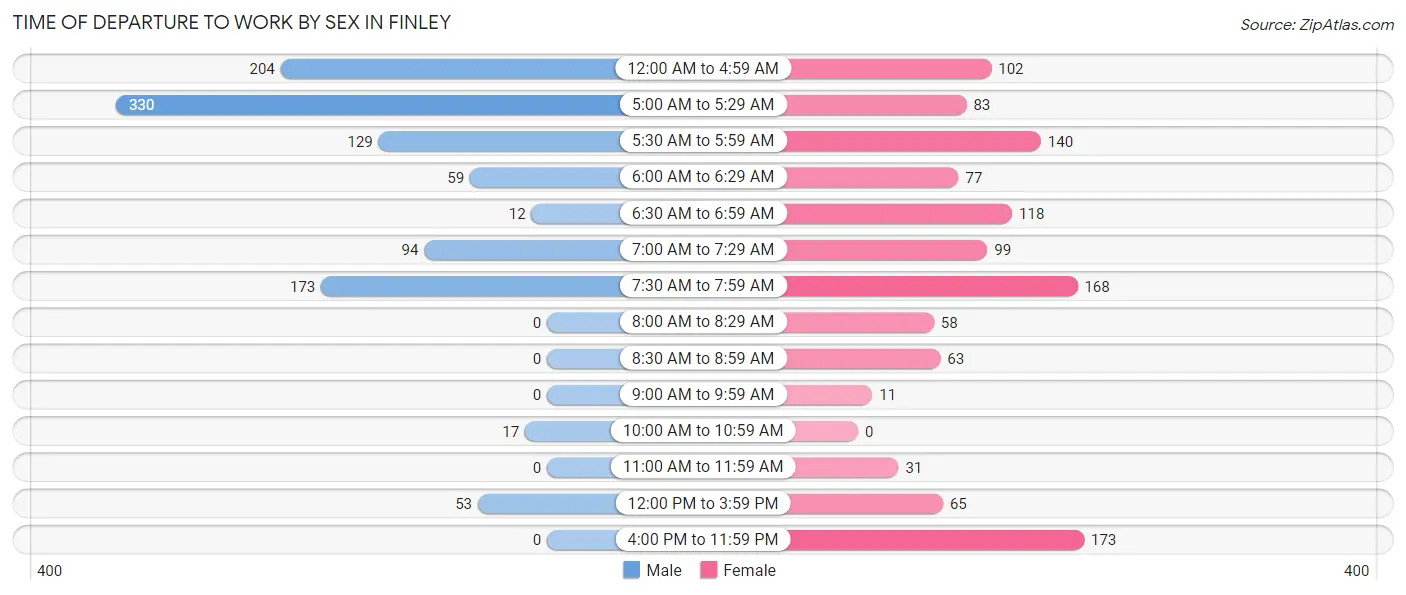
| Time of Departure | Male | Female |
| 12:00 AM to 4:59 AM | 204 (19.1%) | 102 (8.6%) |
| 5:00 AM to 5:29 AM | 330 (30.8%) | 83 (7.0%) |
| 5:30 AM to 5:59 AM | 129 (12.0%) | 140 (11.8%) |
| 6:00 AM to 6:29 AM | 59 (5.5%) | 77 (6.5%) |
| 6:30 AM to 6:59 AM | 12 (1.1%) | 118 (9.9%) |
| 7:00 AM to 7:29 AM | 94 (8.8%) | 99 (8.3%) |
| 7:30 AM to 7:59 AM | 173 (16.2%) | 168 (14.1%) |
| 8:00 AM to 8:29 AM | 0 (0.0%) | 58 (4.9%) |
| 8:30 AM to 8:59 AM | 0 (0.0%) | 63 (5.3%) |
| 9:00 AM to 9:59 AM | 0 (0.0%) | 11 (0.9%) |
| 10:00 AM to 10:59 AM | 17 (1.6%) | 0 (0.0%) |
| 11:00 AM to 11:59 AM | 0 (0.0%) | 31 (2.6%) |
| 12:00 PM to 3:59 PM | 53 (5.0%) | 65 (5.5%) |
| 4:00 PM to 11:59 PM | 0 (0.0%) | 173 (14.6%) |
| Total | 1,071 (100.0%) | 1,188 (100.0%) |
Housing Occupancy in Finley
Occupancy by Ownership in Finley
Of the total 1,820 dwellings in Finley, owner-occupied units account for 1,400 (76.9%), while renter-occupied units make up 420 (23.1%).
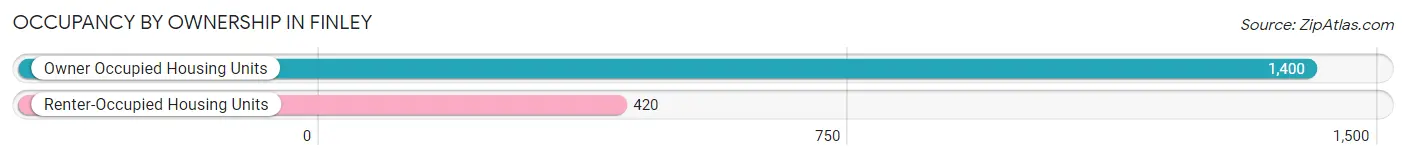
| Occupancy | # Housing Units | % Housing Units |
| Owner Occupied Housing Units | 1,400 | 76.9% |
| Renter-Occupied Housing Units | 420 | 23.1% |
| Total Occupied Housing Units | 1,820 | 100.0% |
Occupancy by Household Size in Finley
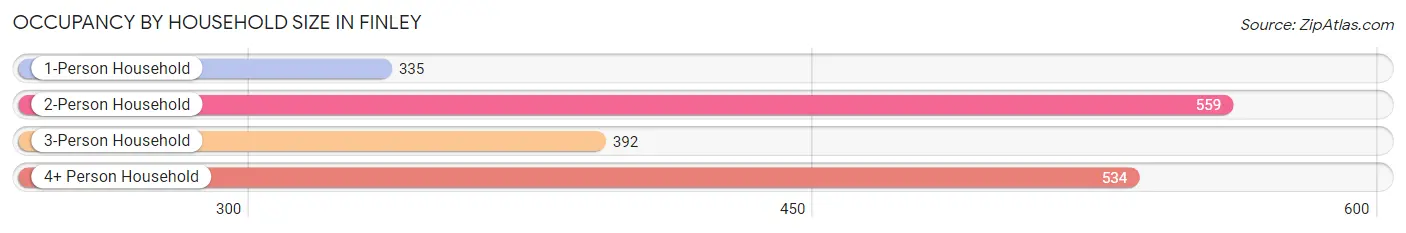
| Household Size | # Housing Units | % Housing Units |
| 1-Person Household | 335 | 18.4% |
| 2-Person Household | 559 | 30.7% |
| 3-Person Household | 392 | 21.5% |
| 4+ Person Household | 534 | 29.3% |
| Total Housing Units | 1,820 | 100.0% |
Occupancy by Ownership by Household Size in Finley
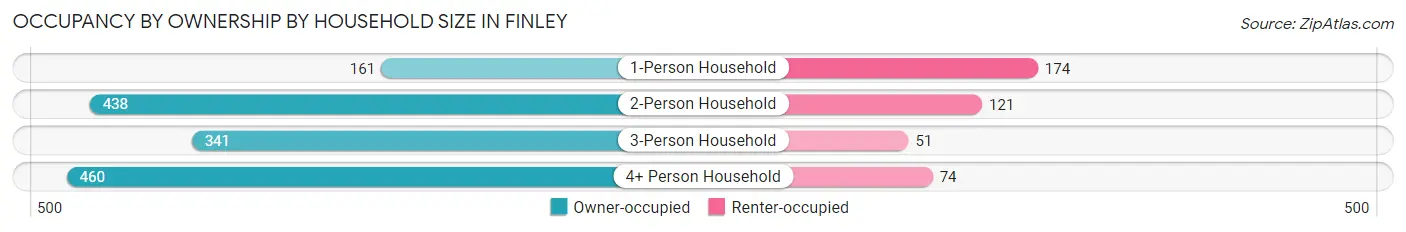
| Household Size | Owner-occupied | Renter-occupied |
| 1-Person Household | 161 (48.1%) | 174 (51.9%) |
| 2-Person Household | 438 (78.3%) | 121 (21.6%) |
| 3-Person Household | 341 (87.0%) | 51 (13.0%) |
| 4+ Person Household | 460 (86.1%) | 74 (13.9%) |
| Total Housing Units | 1,400 (76.9%) | 420 (23.1%) |
Occupancy by Educational Attainment in Finley
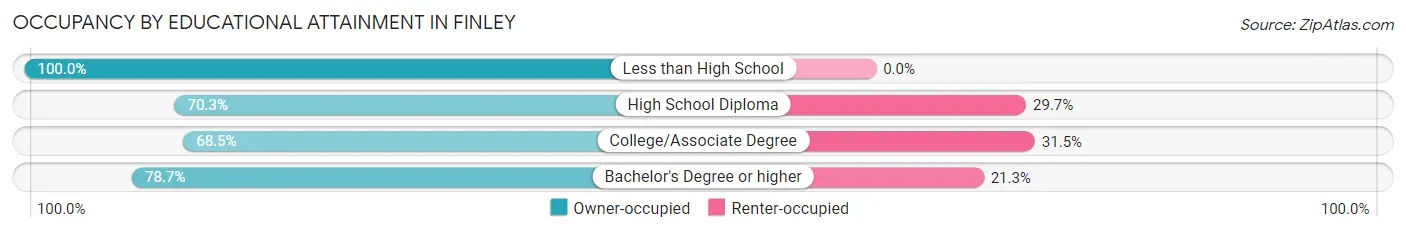
| Household Size | Owner-occupied | Renter-occupied |
| Less than High School | 371 (100.0%) | 0 (0.0%) |
| High School Diploma | 338 (70.3%) | 143 (29.7%) |
| College/Associate Degree | 477 (68.5%) | 219 (31.5%) |
| Bachelor's Degree or higher | 214 (78.7%) | 58 (21.3%) |
Occupancy by Age of Householder in Finley
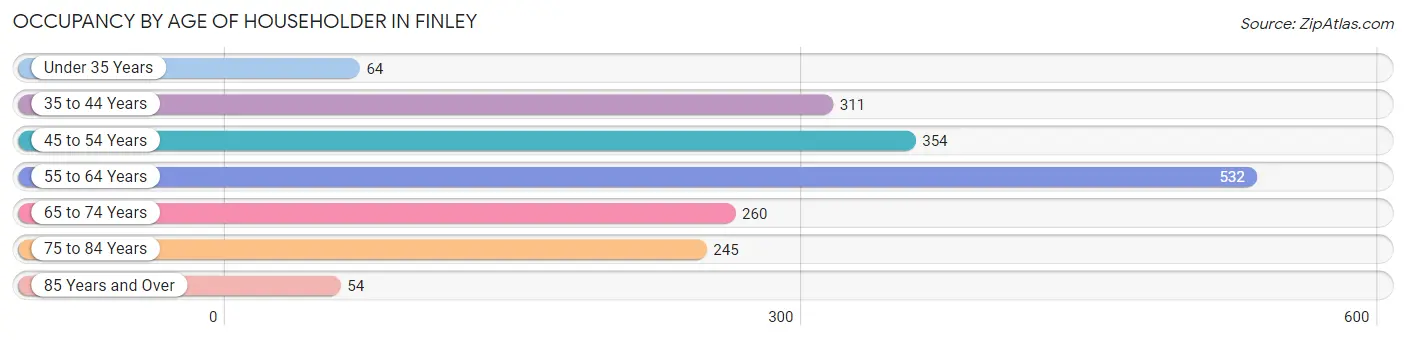
| Age Bracket | # Households | % Households |
| Under 35 Years | 64 | 3.5% |
| 35 to 44 Years | 311 | 17.1% |
| 45 to 54 Years | 354 | 19.5% |
| 55 to 64 Years | 532 | 29.2% |
| 65 to 74 Years | 260 | 14.3% |
| 75 to 84 Years | 245 | 13.5% |
| 85 Years and Over | 54 | 3.0% |
| Total | 1,820 | 100.0% |
Housing Finances in Finley
Median Income by Occupancy in Finley
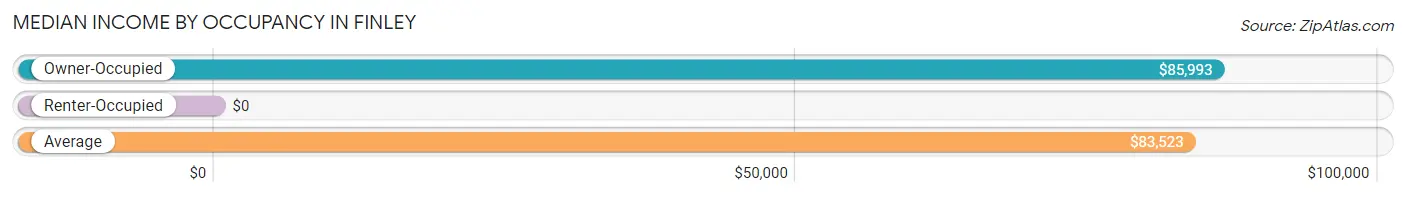
| Occupancy Type | # Households | Median Income |
| Owner-Occupied | 1,400 (76.9%) | $85,993 |
| Renter-Occupied | 420 (23.1%) | $0 |
| Average | 1,820 (100.0%) | $83,523 |
Occupancy by Householder Income Bracket in Finley
| Income Bracket | Owner-occupied | Renter-occupied |
| Less than $5,000 | 16 (1.1%) | 0 (0.0%) |
| $5,000 to $9,999 | 0 (0.0%) | 11 (2.6%) |
| $10,000 to $14,999 | 18 (1.3%) | 21 (5.0%) |
| $15,000 to $19,999 | 14 (1.0%) | 61 (14.5%) |
| $20,000 to $24,999 | 137 (9.8%) | 14 (3.3%) |
| $25,000 to $34,999 | 114 (8.1%) | 50 (11.9%) |
| $35,000 to $49,999 | 62 (4.4%) | 0 (0.0%) |
| $50,000 to $74,999 | 140 (10.0%) | 63 (15.0%) |
| $75,000 to $99,999 | 302 (21.6%) | 105 (25.0%) |
| $100,000 to $149,999 | 439 (31.4%) | 74 (17.6%) |
| $150,000 or more | 158 (11.3%) | 21 (5.0%) |
| Total | 1,400 (100.0%) | 420 (100.0%) |
Monthly Housing Cost Tiers in Finley
| Monthly Cost | Owner-occupied | Renter-occupied |
| Less than $300 | 60 (4.3%) | 0 (0.0%) |
| $300 to $499 | 291 (20.8%) | 0 (0.0%) |
| $500 to $799 | 398 (28.4%) | 74 (17.6%) |
| $800 to $999 | 133 (9.5%) | 19 (4.5%) |
| $1,000 to $1,499 | 216 (15.4%) | 167 (39.8%) |
| $1,500 to $1,999 | 84 (6.0%) | 107 (25.5%) |
| $2,000 to $2,499 | 164 (11.7%) | 0 (0.0%) |
| $2,500 to $2,999 | 10 (0.7%) | 0 (0.0%) |
| $3,000 or more | 44 (3.1%) | 0 (0.0%) |
| Total | 1,400 (100.0%) | 420 (100.0%) |
Physical Housing Characteristics in Finley
Housing Structures in Finley
| Structure Type | # Housing Units | % Housing Units |
| Single Unit, Detached | 672 | 36.9% |
| Single Unit, Attached | 21 | 1.1% |
| 2 Unit Apartments | 0 | 0.0% |
| 3 or 4 Unit Apartments | 0 | 0.0% |
| 5 to 9 Unit Apartments | 0 | 0.0% |
| 10 or more Apartments | 63 | 3.5% |
| Mobile Home / Other | 1,064 | 58.5% |
| Total | 1,820 | 100.0% |
Housing Structures by Occupancy in Finley
| Structure Type | Owner-occupied | Renter-occupied |
| Single Unit, Detached | 653 (97.2%) | 19 (2.8%) |
| Single Unit, Attached | 0 (0.0%) | 21 (100.0%) |
| 2 Unit Apartments | 0 (0.0%) | 0 (0.0%) |
| 3 or 4 Unit Apartments | 0 (0.0%) | 0 (0.0%) |
| 5 to 9 Unit Apartments | 0 (0.0%) | 0 (0.0%) |
| 10 or more Apartments | 0 (0.0%) | 63 (100.0%) |
| Mobile Home / Other | 747 (70.2%) | 317 (29.8%) |
| Total | 1,400 (76.9%) | 420 (23.1%) |
Housing Structures by Number of Rooms in Finley
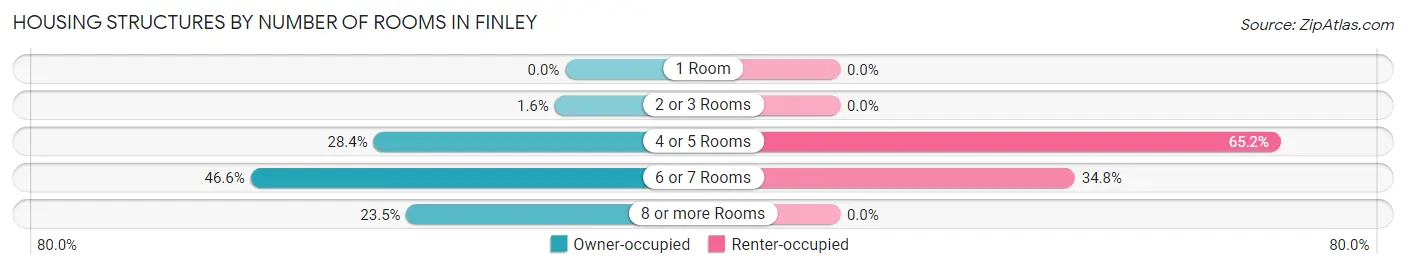
| Number of Rooms | Owner-occupied | Renter-occupied |
| 1 Room | 0 (0.0%) | 0 (0.0%) |
| 2 or 3 Rooms | 22 (1.6%) | 0 (0.0%) |
| 4 or 5 Rooms | 397 (28.4%) | 274 (65.2%) |
| 6 or 7 Rooms | 652 (46.6%) | 146 (34.8%) |
| 8 or more Rooms | 329 (23.5%) | 0 (0.0%) |
| Total | 1,400 (100.0%) | 420 (100.0%) |
Housing Structure by Heating Type in Finley
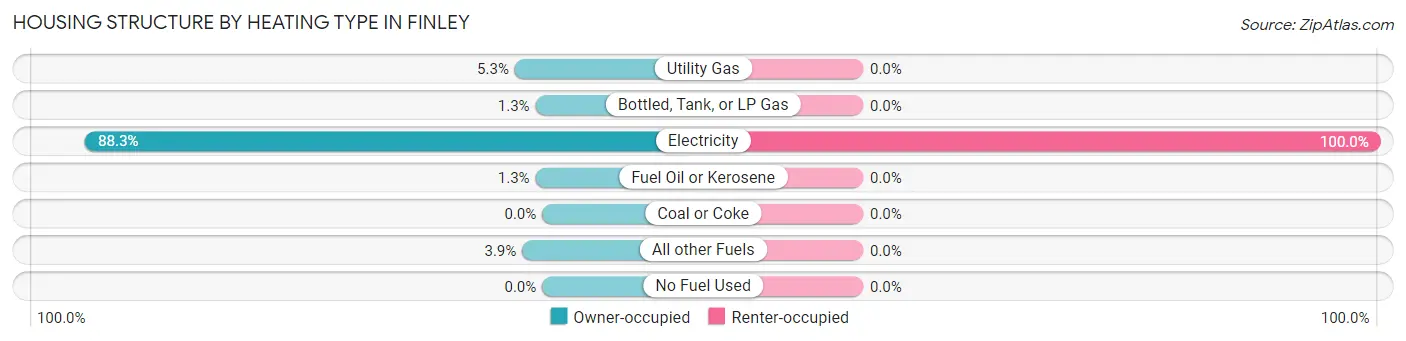
| Heating Type | Owner-occupied | Renter-occupied |
| Utility Gas | 74 (5.3%) | 0 (0.0%) |
| Bottled, Tank, or LP Gas | 18 (1.3%) | 0 (0.0%) |
| Electricity | 1,236 (88.3%) | 420 (100.0%) |
| Fuel Oil or Kerosene | 18 (1.3%) | 0 (0.0%) |
| Coal or Coke | 0 (0.0%) | 0 (0.0%) |
| All other Fuels | 54 (3.9%) | 0 (0.0%) |
| No Fuel Used | 0 (0.0%) | 0 (0.0%) |
| Total | 1,400 (100.0%) | 420 (100.0%) |
Household Vehicle Usage in Finley
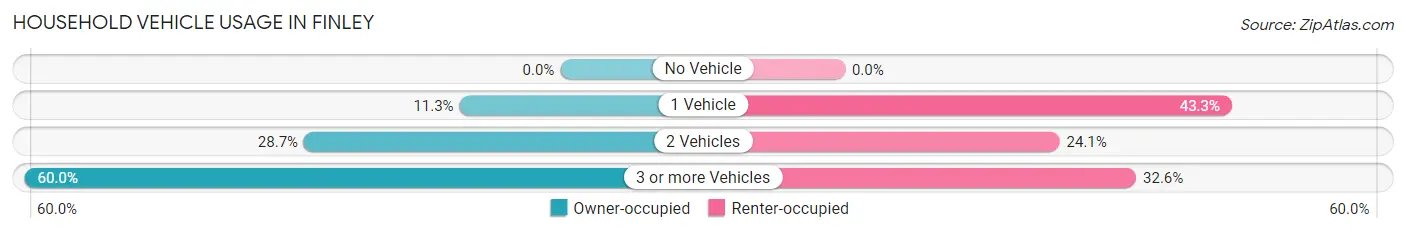
| Vehicles per Household | Owner-occupied | Renter-occupied |
| No Vehicle | 0 (0.0%) | 0 (0.0%) |
| 1 Vehicle | 158 (11.3%) | 182 (43.3%) |
| 2 Vehicles | 402 (28.7%) | 101 (24.0%) |
| 3 or more Vehicles | 840 (60.0%) | 137 (32.6%) |
| Total | 1,400 (100.0%) | 420 (100.0%) |
Real Estate & Mortgages in Finley
Real Estate and Mortgage Overview in Finley
| Characteristic | Without Mortgage | With Mortgage |
| Housing Units | 911 | 489 |
| Median Property Value | $253,700 | $330,400 |
| Median Household Income | $85,361 | $88 |
| Monthly Housing Costs | $595 | $44 |
| Real Estate Taxes | $2,765 | $55 |
Property Value by Mortgage Status in Finley
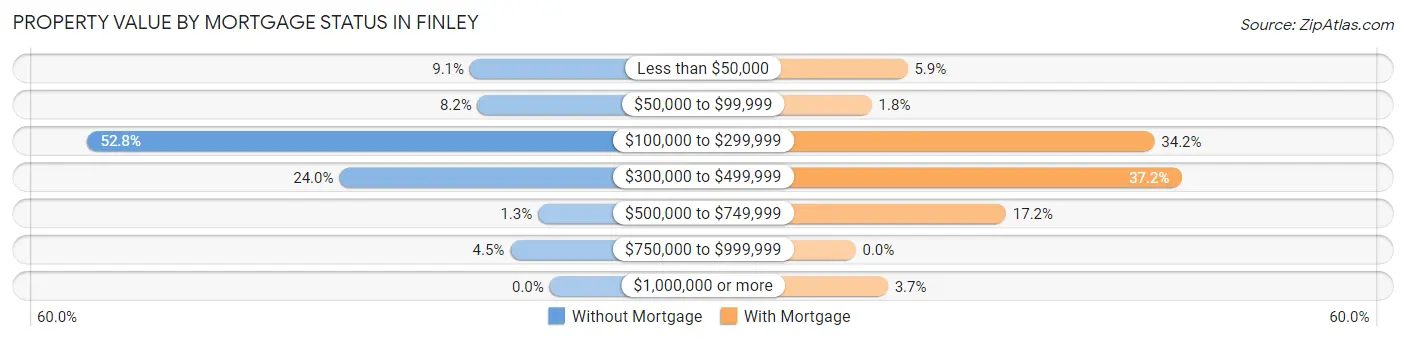
| Property Value | Without Mortgage | With Mortgage |
| Less than $50,000 | 83 (9.1%) | 29 (5.9%) |
| $50,000 to $99,999 | 75 (8.2%) | 9 (1.8%) |
| $100,000 to $299,999 | 481 (52.8%) | 167 (34.2%) |
| $300,000 to $499,999 | 219 (24.0%) | 182 (37.2%) |
| $500,000 to $749,999 | 12 (1.3%) | 84 (17.2%) |
| $750,000 to $999,999 | 41 (4.5%) | 0 (0.0%) |
| $1,000,000 or more | 0 (0.0%) | 18 (3.7%) |
| Total | 911 (100.0%) | 489 (100.0%) |
Household Income by Mortgage Status in Finley
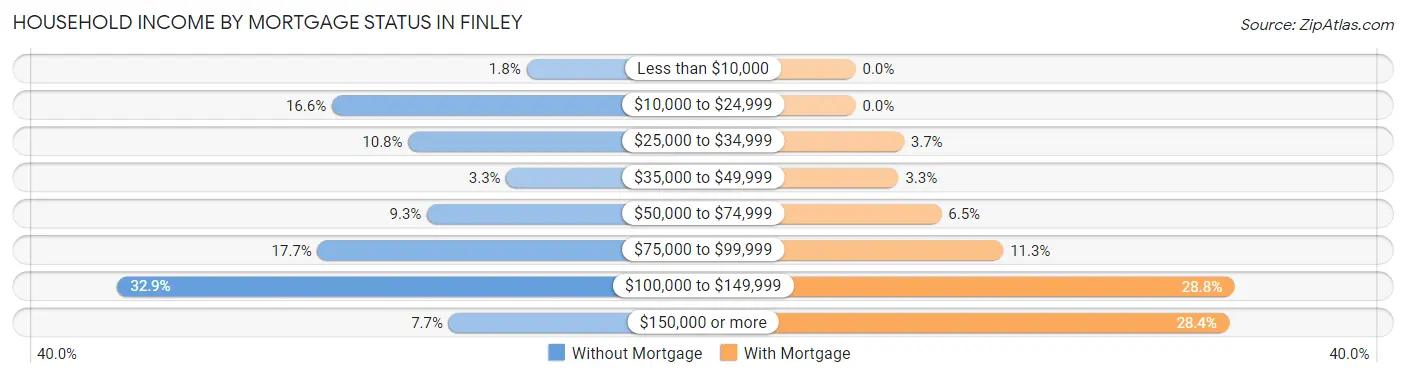
| Household Income | Without Mortgage | With Mortgage |
| Less than $10,000 | 16 (1.8%) | 0 (0.0%) |
| $10,000 to $24,999 | 151 (16.6%) | 0 (0.0%) |
| $25,000 to $34,999 | 98 (10.8%) | 18 (3.7%) |
| $35,000 to $49,999 | 30 (3.3%) | 16 (3.3%) |
| $50,000 to $74,999 | 85 (9.3%) | 32 (6.5%) |
| $75,000 to $99,999 | 161 (17.7%) | 55 (11.3%) |
| $100,000 to $149,999 | 300 (32.9%) | 141 (28.8%) |
| $150,000 or more | 70 (7.7%) | 139 (28.4%) |
| Total | 911 (100.0%) | 489 (100.0%) |
Property Value to Household Income Ratio in Finley
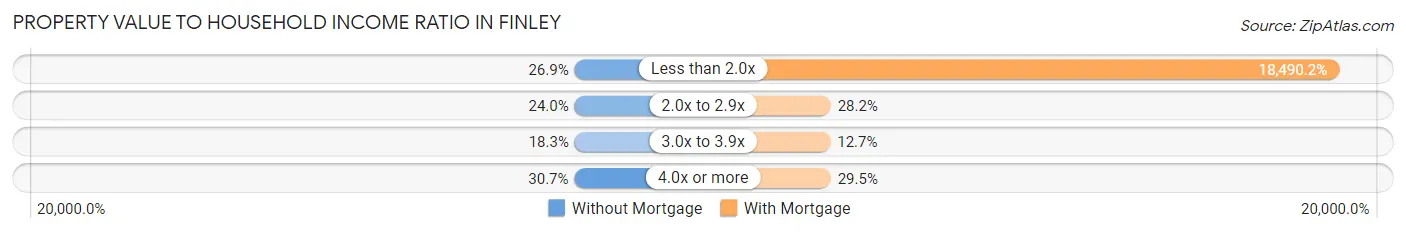
| Value-to-Income Ratio | Without Mortgage | With Mortgage |
| Less than 2.0x | 245 (26.9%) | 90,417 (18,490.2%) |
| 2.0x to 2.9x | 219 (24.0%) | 138 (28.2%) |
| 3.0x to 3.9x | 167 (18.3%) | 62 (12.7%) |
| 4.0x or more | 280 (30.7%) | 144 (29.4%) |
| Total | 911 (100.0%) | 489 (100.0%) |
Real Estate Taxes by Mortgage Status in Finley
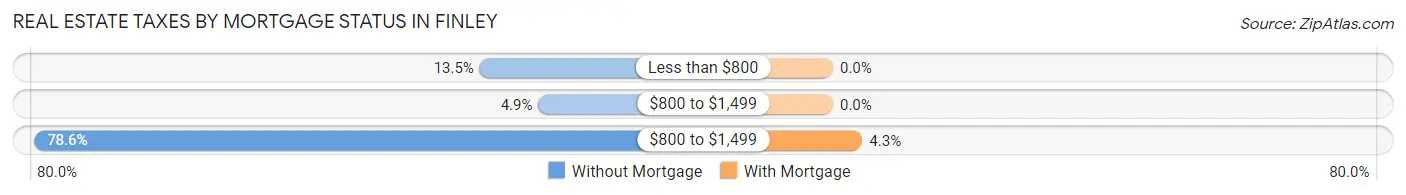
| Property Taxes | Without Mortgage | With Mortgage |
| Less than $800 | 123 (13.5%) | 0 (0.0%) |
| $800 to $1,499 | 45 (4.9%) | 0 (0.0%) |
| $800 to $1,499 | 716 (78.6%) | 21 (4.3%) |
| Total | 911 (100.0%) | 489 (100.0%) |
Health & Disability in Finley
Health Insurance Coverage by Age in Finley
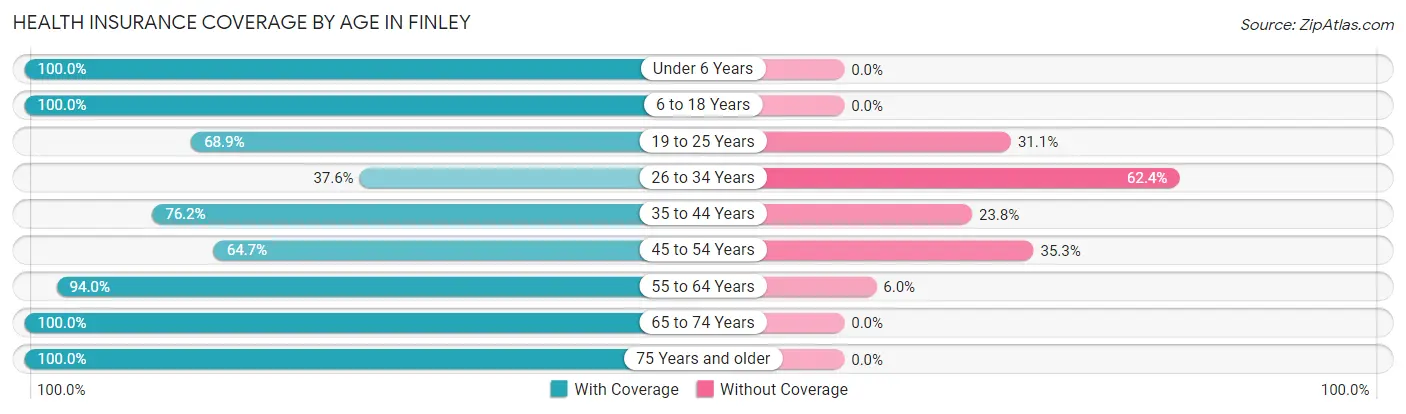
| Age Bracket | With Coverage | Without Coverage |
| Under 6 Years | 249 (100.0%) | 0 (0.0%) |
| 6 to 18 Years | 1,078 (100.0%) | 0 (0.0%) |
| 19 to 25 Years | 448 (68.9%) | 202 (31.1%) |
| 26 to 34 Years | 154 (37.6%) | 256 (62.4%) |
| 35 to 44 Years | 515 (76.2%) | 161 (23.8%) |
| 45 to 54 Years | 473 (64.7%) | 258 (35.3%) |
| 55 to 64 Years | 1,116 (94.0%) | 71 (6.0%) |
| 65 to 74 Years | 428 (100.0%) | 0 (0.0%) |
| 75 Years and older | 439 (100.0%) | 0 (0.0%) |
| Total | 4,900 (83.8%) | 948 (16.2%) |
Health Insurance Coverage by Citizenship Status in Finley
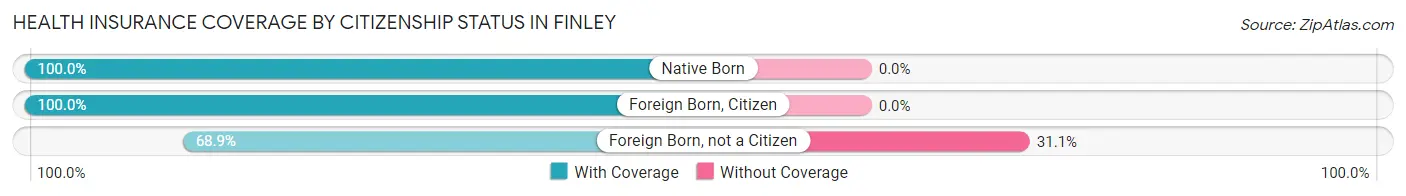
| Citizenship Status | With Coverage | Without Coverage |
| Native Born | 249 (100.0%) | 0 (0.0%) |
| Foreign Born, Citizen | 1,078 (100.0%) | 0 (0.0%) |
| Foreign Born, not a Citizen | 448 (68.9%) | 202 (31.1%) |
Health Insurance Coverage by Household Income in Finley
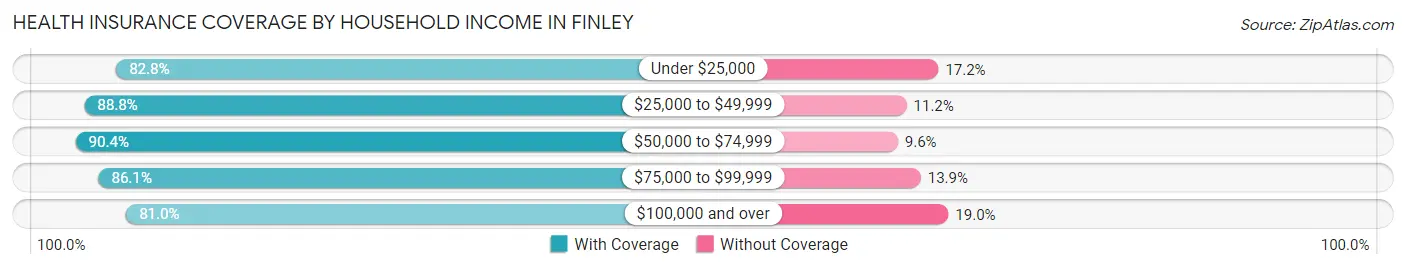
| Household Income | With Coverage | Without Coverage |
| Under $25,000 | 598 (82.8%) | 124 (17.2%) |
| $25,000 to $49,999 | 420 (88.8%) | 53 (11.2%) |
| $50,000 to $74,999 | 586 (90.4%) | 62 (9.6%) |
| $75,000 to $99,999 | 889 (86.1%) | 143 (13.9%) |
| $100,000 and over | 2,407 (81.0%) | 566 (19.0%) |
Public vs Private Health Insurance Coverage by Age in Finley
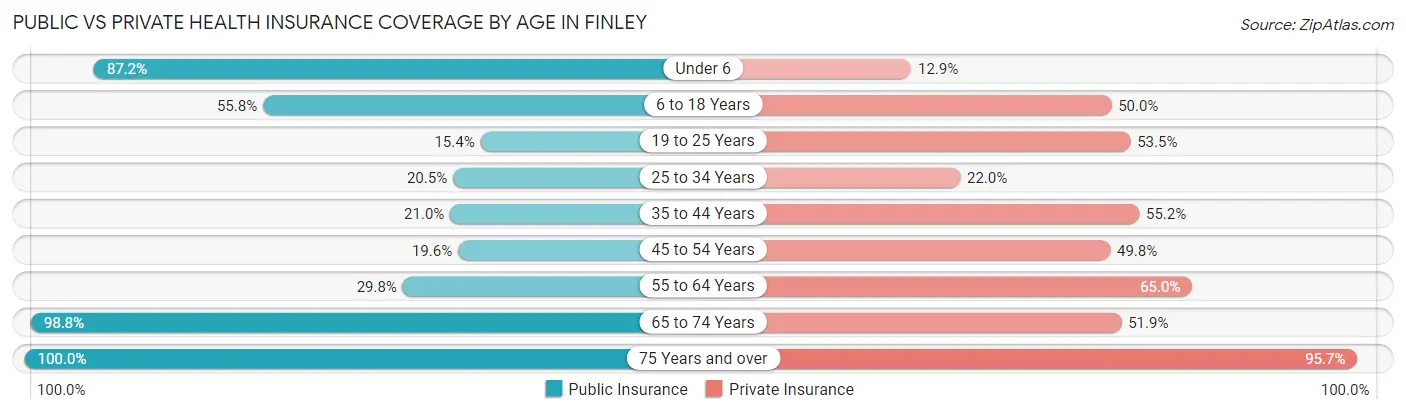
| Age Bracket | Public Insurance | Private Insurance |
| Under 6 | 217 (87.2%) | 32 (12.9%) |
| 6 to 18 Years | 601 (55.7%) | 539 (50.0%) |
| 19 to 25 Years | 100 (15.4%) | 348 (53.5%) |
| 25 to 34 Years | 84 (20.5%) | 90 (22.0%) |
| 35 to 44 Years | 142 (21.0%) | 373 (55.2%) |
| 45 to 54 Years | 143 (19.6%) | 364 (49.8%) |
| 55 to 64 Years | 354 (29.8%) | 772 (65.0%) |
| 65 to 74 Years | 423 (98.8%) | 222 (51.9%) |
| 75 Years and over | 439 (100.0%) | 420 (95.7%) |
| Total | 2,503 (42.8%) | 3,160 (54.0%) |
Disability Status by Sex by Age in Finley
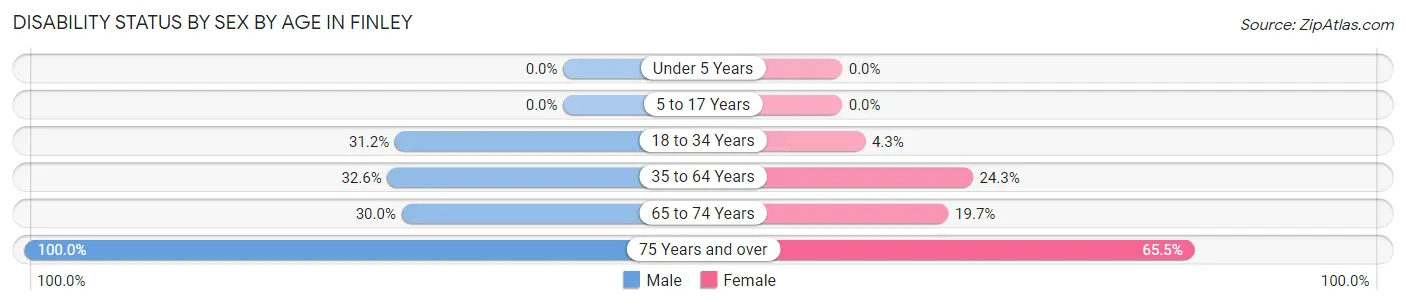
| Age Bracket | Male | Female |
| Under 5 Years | 0 (0.0%) | 0 (0.0%) |
| 5 to 17 Years | 0 (0.0%) | 0 (0.0%) |
| 18 to 34 Years | 134 (31.2%) | 30 (4.3%) |
| 35 to 64 Years | 501 (32.6%) | 257 (24.3%) |
| 65 to 74 Years | 60 (30.0%) | 45 (19.7%) |
| 75 Years and over | 103 (100.0%) | 220 (65.5%) |
Disability Class by Sex by Age in Finley
Disability Class: Hearing Difficulty
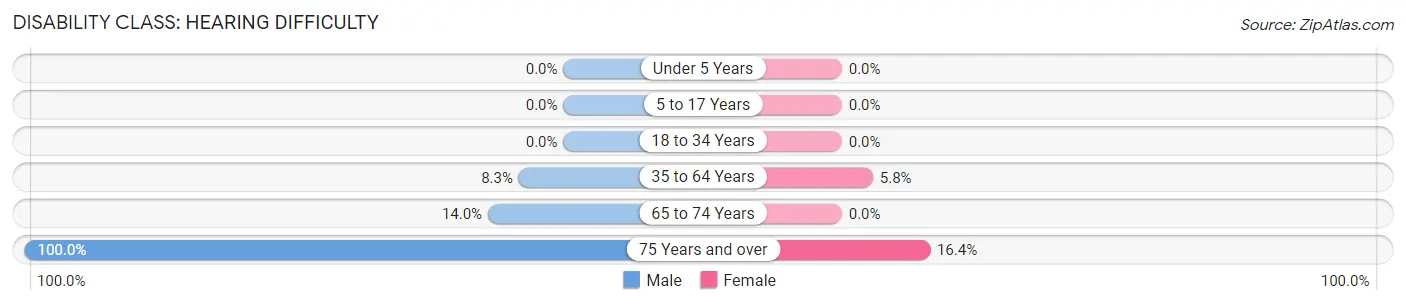
| Age Bracket | Male | Female |
| Under 5 Years | 0 (0.0%) | 0 (0.0%) |
| 5 to 17 Years | 0 (0.0%) | 0 (0.0%) |
| 18 to 34 Years | 0 (0.0%) | 0 (0.0%) |
| 35 to 64 Years | 127 (8.3%) | 61 (5.8%) |
| 65 to 74 Years | 28 (14.0%) | 0 (0.0%) |
| 75 Years and over | 103 (100.0%) | 55 (16.4%) |
Disability Class: Vision Difficulty
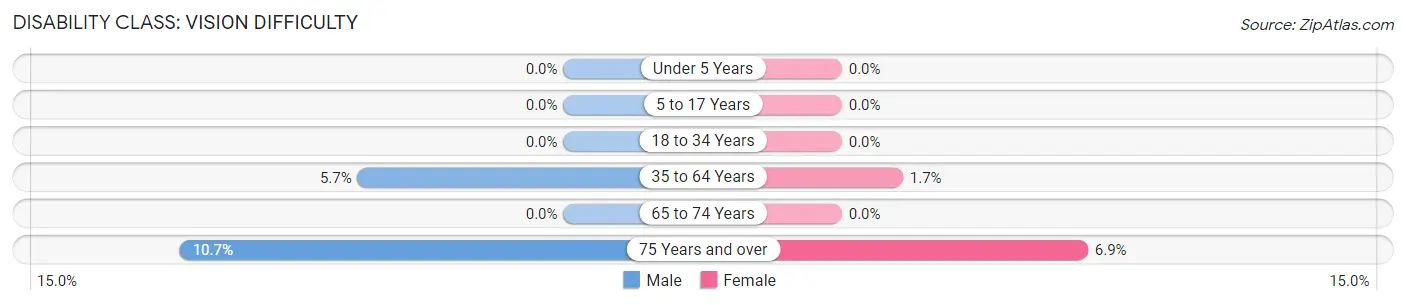
| Age Bracket | Male | Female |
| Under 5 Years | 0 (0.0%) | 0 (0.0%) |
| 5 to 17 Years | 0 (0.0%) | 0 (0.0%) |
| 18 to 34 Years | 0 (0.0%) | 0 (0.0%) |
| 35 to 64 Years | 88 (5.7%) | 18 (1.7%) |
| 65 to 74 Years | 0 (0.0%) | 0 (0.0%) |
| 75 Years and over | 11 (10.7%) | 23 (6.9%) |
Disability Class: Cognitive Difficulty
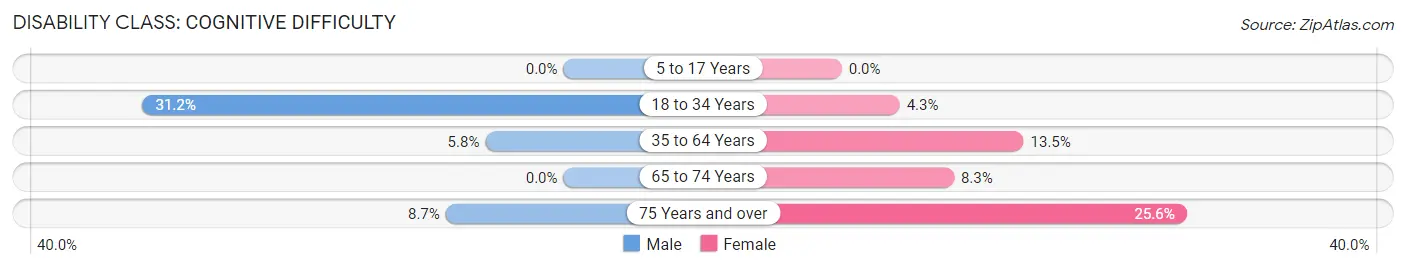
| Age Bracket | Male | Female |
| 5 to 17 Years | 0 (0.0%) | 0 (0.0%) |
| 18 to 34 Years | 134 (31.2%) | 30 (4.3%) |
| 35 to 64 Years | 89 (5.8%) | 143 (13.5%) |
| 65 to 74 Years | 0 (0.0%) | 19 (8.3%) |
| 75 Years and over | 9 (8.7%) | 86 (25.6%) |
Disability Class: Ambulatory Difficulty
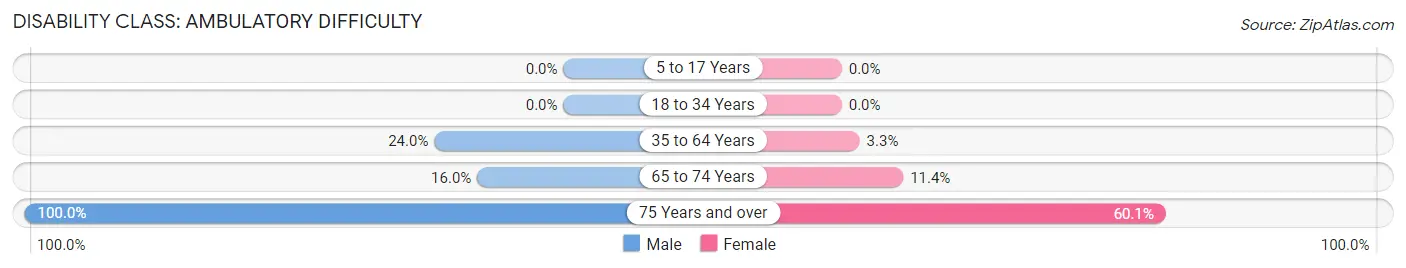
| Age Bracket | Male | Female |
| 5 to 17 Years | 0 (0.0%) | 0 (0.0%) |
| 18 to 34 Years | 0 (0.0%) | 0 (0.0%) |
| 35 to 64 Years | 368 (24.0%) | 35 (3.3%) |
| 65 to 74 Years | 32 (16.0%) | 26 (11.4%) |
| 75 Years and over | 103 (100.0%) | 202 (60.1%) |
Disability Class: Self-Care Difficulty
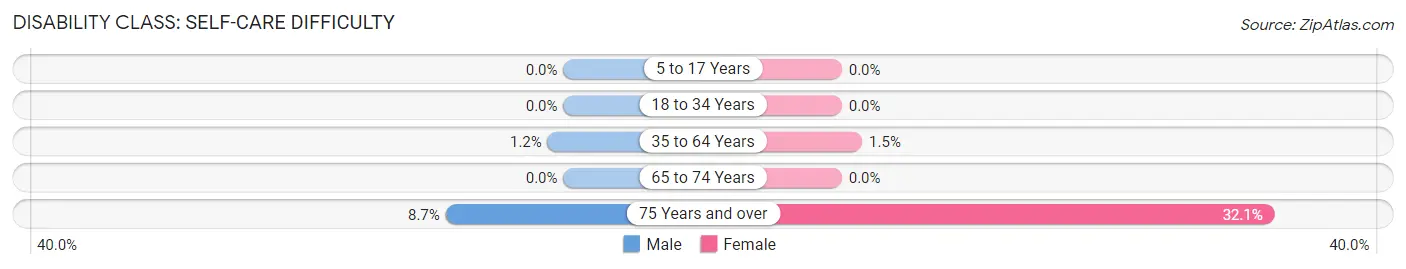
| Age Bracket | Male | Female |
| 5 to 17 Years | 0 (0.0%) | 0 (0.0%) |
| 18 to 34 Years | 0 (0.0%) | 0 (0.0%) |
| 35 to 64 Years | 18 (1.2%) | 16 (1.5%) |
| 65 to 74 Years | 0 (0.0%) | 0 (0.0%) |
| 75 Years and over | 9 (8.7%) | 108 (32.1%) |
Technology Access in Finley
Computing Device Access in Finley
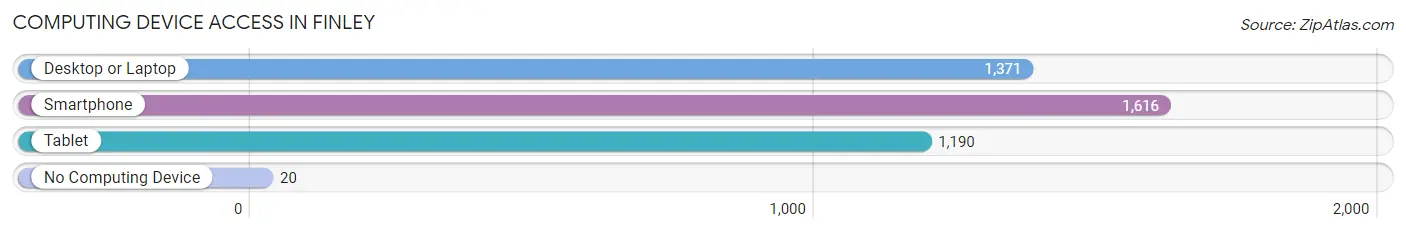
| Device Type | # Households | % Households |
| Desktop or Laptop | 1,371 | 75.3% |
| Smartphone | 1,616 | 88.8% |
| Tablet | 1,190 | 65.4% |
| No Computing Device | 20 | 1.1% |
| Total | 1,820 | 100.0% |
Internet Access in Finley
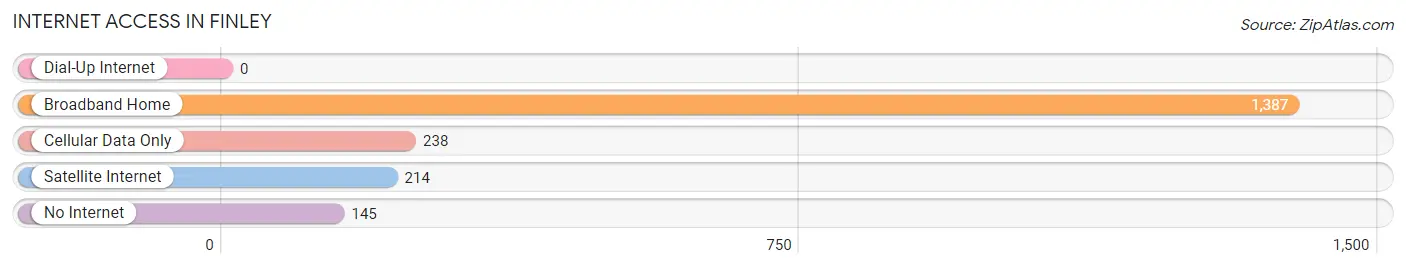
| Internet Type | # Households | % Households |
| Dial-Up Internet | 0 | 0.0% |
| Broadband Home | 1,387 | 76.2% |
| Cellular Data Only | 238 | 13.1% |
| Satellite Internet | 214 | 11.8% |
| No Internet | 145 | 8.0% |
| Total | 1,820 | 100.0% |
Finley Summary
Finley is a small town located in the state of Washington, United States. It is situated in the southeastern part of the state, in the county of Benton. The town has a population of approximately 1,500 people, and is located about 20 miles south of the city of Kennewick.
History
The area that is now Finley was first settled in the late 1800s by homesteaders. The town was originally known as Finley Station, and was named after the nearby Finley Creek. The town was officially incorporated in 1909, and the first post office was established in 1910.
In the early 1900s, Finley was a thriving agricultural community, with many farms and orchards in the area. The town was also home to a number of businesses, including a general store, a blacksmith shop, and a hotel.
In the 1950s, the town began to decline as many of the farms and orchards were abandoned. The population of Finley decreased significantly, and the town was eventually annexed by the city of Kennewick in the 1970s.
Geography
Finley is located in the southeastern part of Washington, in the county of Benton. The town is situated on the banks of the Columbia River, and is about 20 miles south of the city of Kennewick.
The terrain around Finley is mostly flat, with some rolling hills in the area. The climate is generally mild, with hot summers and cold winters.
Economy
The economy of Finley is largely based on agriculture. The town is home to several farms and orchards, which produce a variety of fruits and vegetables. The town is also home to a number of businesses, including a general store, a gas station, and a few restaurants.
Demographics
As of the 2010 census, the population of Finley was 1,500. The racial makeup of the town was 94.2% White, 0.7% African American, 0.7% Native American, 0.7% Asian, 0.7% from other races, and 2.7% from two or more races. Hispanic or Latino of any race were 3.3% of the population.
The median household income in Finley was $41,250, and the median family income was $45,625. The per capita income for the town was $18,945. About 11.2% of families and 13.3% of the population were below the poverty line, including 17.2% of those under age 18 and 8.3% of those age 65 or over.
Common Questions
What is the Total Population of Finley?
Total Population of Finley is 5,848.
What is the Total Male Population of Finley?
Total Male Population of Finley is 2,951.
What is the Total Female Population of Finley?
Total Female Population of Finley is 2,897.
What is the Ratio of Males per 100 Females in Finley?
There are 101.86 Males per 100 Females in Finley.
What is the Ratio of Females per 100 Males in Finley?
There are 98.17 Females per 100 Males in Finley.
What is the Median Population Age in Finley?
Median Population Age in Finley is 40.6 Years.
What is the Average Family Size in Finley
Average Family Size in Finley is 3.5 People.
What is the Average Household Size in Finley
Average Household Size in Finley is 3.2 People.
What is Per Capita Income in Finley?
Per Capita income in Finley is $28,828.
What is the Median Family Income in Finley?
Median Family Income in Finley is $82,188.
What is the Median Household income in Finley?
Median Household Income in Finley is $83,523.
What is Income or Wage Gap in Finley?
Income or Wage Gap in Finley is 35.3%.
Women in Finley earn 64.7 cents for every dollar earned by a man.
What is Family Income Deficit in Finley?
Family Income Deficit in Finley is $9,064.
Families that are below poverty line in Finley earn $9,064 less on average than the poverty threshold level.
What is Inequality or Gini Index in Finley?
Inequality or Gini Index in Finley is 0.34.
How Large is the Labor Force in Finley?
There are 3,007 People in the Labor Forcein in Finley.
What is the Percentage of People in the Labor Force in Finley?
62.3% of People are in the Labor Force in Finley.
What is the Unemployment Rate in Finley?
Unemployment Rate in Finley is 8.2%.