Cascade Valley, WA
Cascade Valley Map
Cascade Valley Overview
3,457
TOTAL POPULATION
1,806
MALE POPULATION
1,651
FEMALE POPULATION
109.39
MALES / 100 FEMALES
91.42
FEMALES / 100 MALES
46.2
MEDIAN AGE
2.7
AVG FAMILY SIZE
2.3
AVG HOUSEHOLD SIZE
$29,239
PER CAPITA INCOME
$59,164
AVG FAMILY INCOME
$49,050
AVG HOUSEHOLD INCOME
21.5%
WAGE / INCOME GAP [ % ]
78.5¢/ $1
WAGE / INCOME GAP [ $ ]
$12,703
FAMILY INCOME DEFICIT
0.41
INEQUALITY / GINI INDEX
2,211
LABOR FORCE [ PEOPLE ]
68.3%
PERCENT IN LABOR FORCE
12.8%
UNEMPLOYMENT RATE
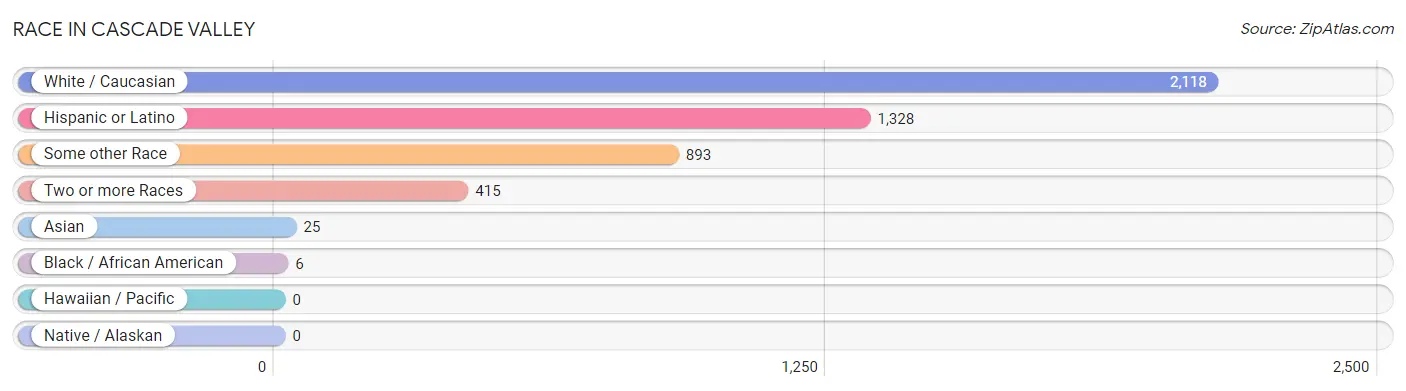
Race in Cascade Valley
The most populous races in Cascade Valley are White / Caucasian (2,118 | 61.3%), Hispanic or Latino (1,328 | 38.4%), and Some other Race (893 | 25.8%).
| Race | # Population | % Population |
| Asian | 25 | 0.7% |
| Black / African American | 6 | 0.2% |
| Hawaiian / Pacific | 0 | 0.0% |
| Hispanic or Latino | 1,328 | 38.4% |
| Native / Alaskan | 0 | 0.0% |
| White / Caucasian | 2,118 | 61.3% |
| Two or more Races | 415 | 12.0% |
| Some other Race | 893 | 25.8% |
| Total | 3,457 | 100.0% |
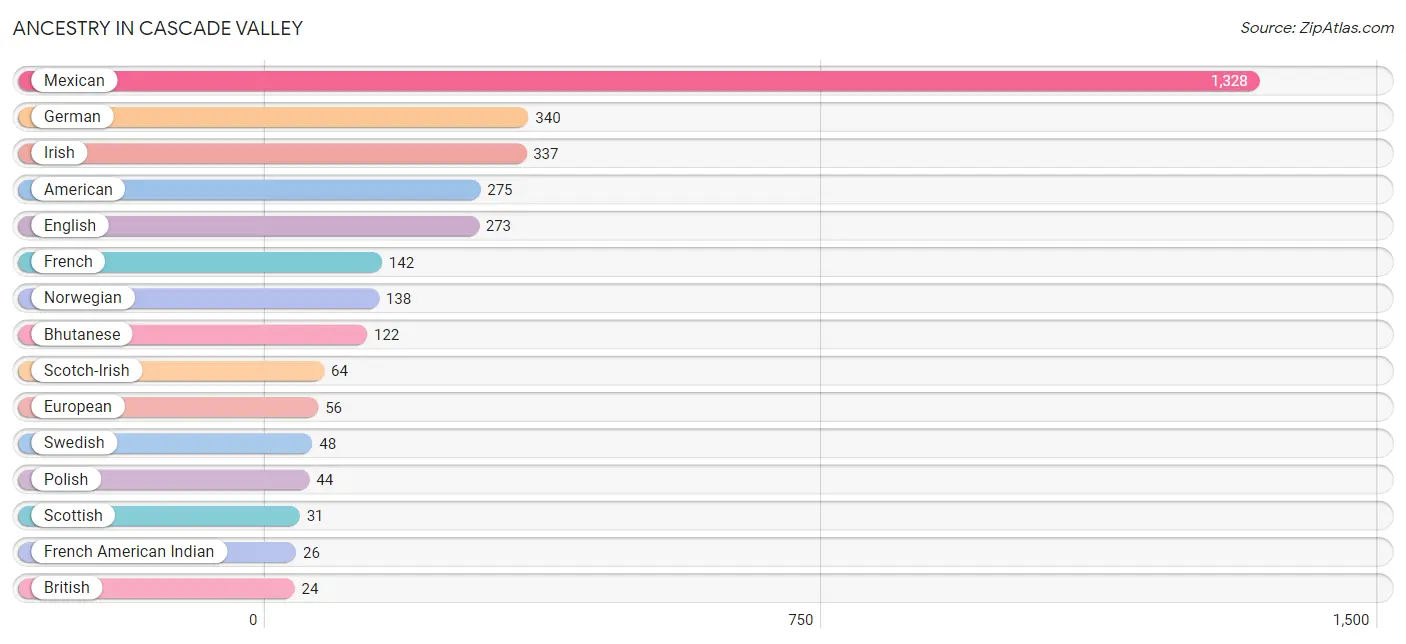
Ancestry in Cascade Valley
The most populous ancestries reported in Cascade Valley are Mexican (1,328 | 38.4%), German (340 | 9.8%), Irish (337 | 9.8%), American (275 | 8.0%), and English (273 | 7.9%), together accounting for 73.8% of all Cascade Valley residents.
| Ancestry | # Population | % Population |
| American | 275 | 8.0% |
| Bhutanese | 122 | 3.5% |
| British | 24 | 0.7% |
| Choctaw | 16 | 0.5% |
| Czechoslovakian | 9 | 0.3% |
| English | 273 | 7.9% |
| European | 56 | 1.6% |
| French | 142 | 4.1% |
| French American Indian | 26 | 0.7% |
| French Canadian | 10 | 0.3% |
| German | 340 | 9.8% |
| Irish | 337 | 9.8% |
| Italian | 24 | 0.7% |
| Mexican | 1,328 | 38.4% |
| Northern European | 21 | 0.6% |
| Norwegian | 138 | 4.0% |
| Polish | 44 | 1.3% |
| Scandinavian | 12 | 0.4% |
| Scotch-Irish | 64 | 1.8% |
| Scottish | 31 | 0.9% |
| Swedish | 48 | 1.4% |
| Ukrainian | 4 | 0.1% |
| Welsh | 22 | 0.6% | View All 23 Rows |
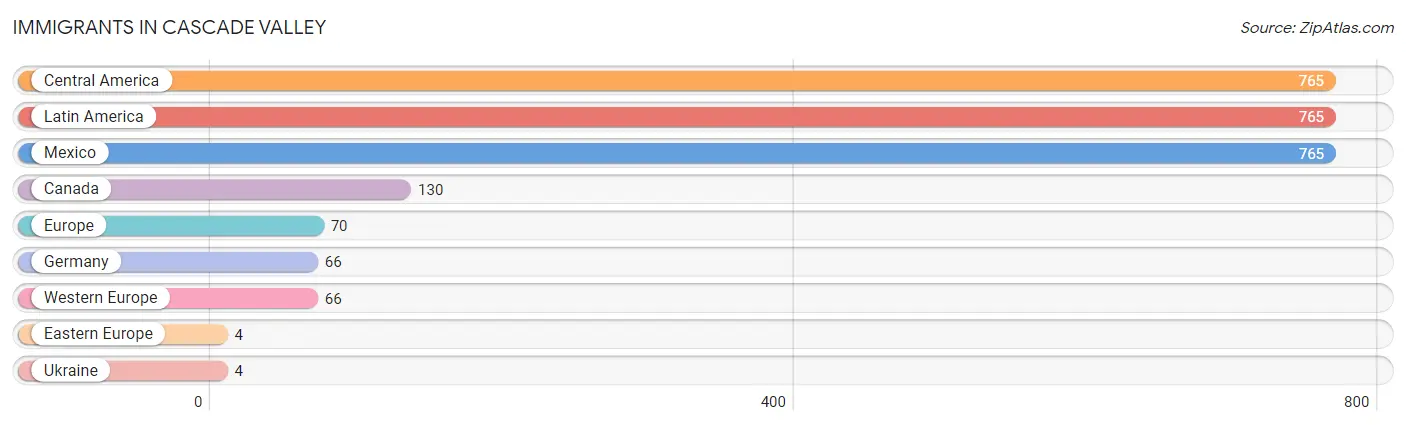
Immigrants in Cascade Valley
The most numerous immigrant groups reported in Cascade Valley came from Central America (765 | 22.1%), Latin America (765 | 22.1%), Mexico (765 | 22.1%), Canada (130 | 3.8%), and Europe (70 | 2.0%), together accounting for 72.2% of all Cascade Valley residents.
| Immigration Origin | # Population | % Population |
| Canada | 130 | 3.8% |
| Central America | 765 | 22.1% |
| Eastern Europe | 4 | 0.1% |
| Europe | 70 | 2.0% |
| Germany | 66 | 1.9% |
| Latin America | 765 | 22.1% |
| Mexico | 765 | 22.1% |
| Ukraine | 4 | 0.1% |
| Western Europe | 66 | 1.9% | View All 9 Rows |
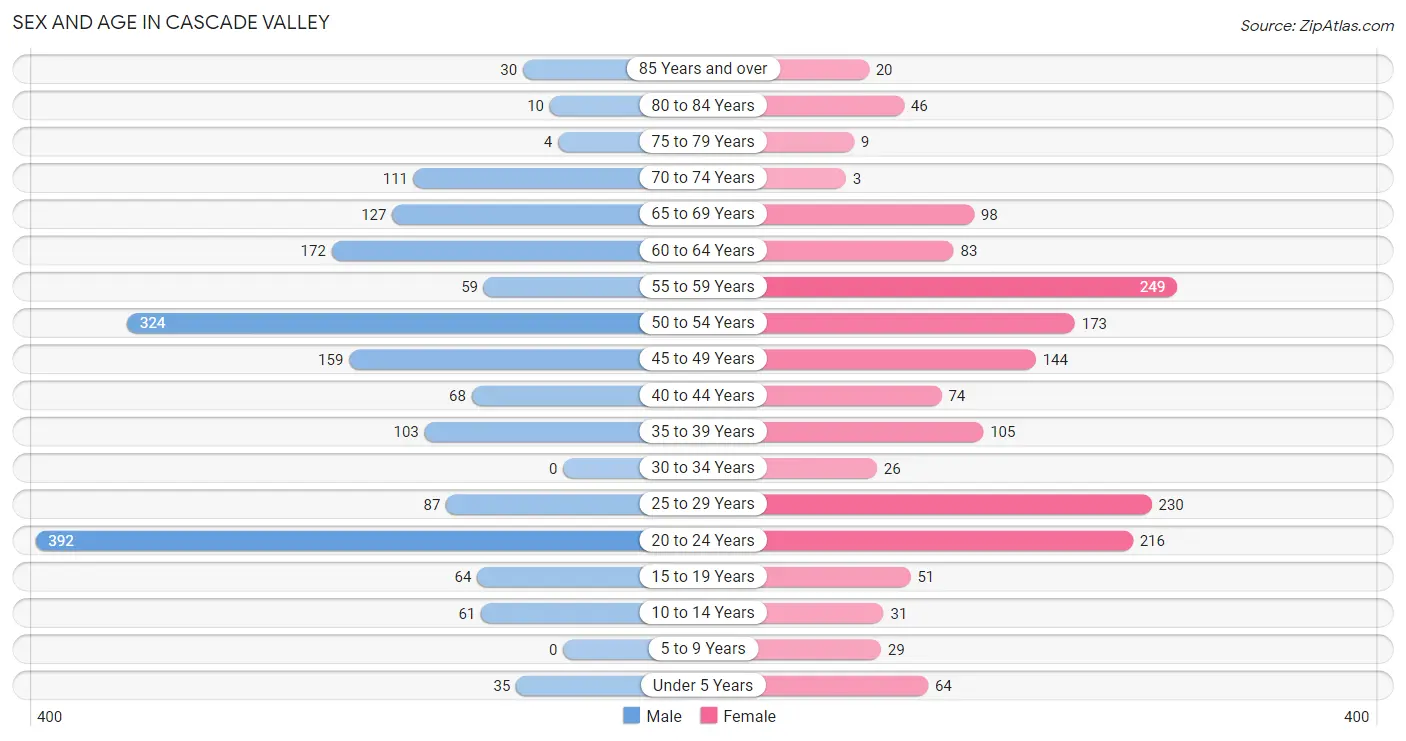
Sex and Age in Cascade Valley
Sex and Age in Cascade Valley
The most populous age groups in Cascade Valley are 20 to 24 Years (392 | 21.7%) for men and 55 to 59 Years (249 | 15.1%) for women.
| Age Bracket | Male | Female |
| Under 5 Years | 35 (1.9%) | 64 (3.9%) |
| 5 to 9 Years | 0 (0.0%) | 29 (1.8%) |
| 10 to 14 Years | 61 (3.4%) | 31 (1.9%) |
| 15 to 19 Years | 64 (3.5%) | 51 (3.1%) |
| 20 to 24 Years | 392 (21.7%) | 216 (13.1%) |
| 25 to 29 Years | 87 (4.8%) | 230 (13.9%) |
| 30 to 34 Years | 0 (0.0%) | 26 (1.6%) |
| 35 to 39 Years | 103 (5.7%) | 105 (6.4%) |
| 40 to 44 Years | 68 (3.8%) | 74 (4.5%) |
| 45 to 49 Years | 159 (8.8%) | 144 (8.7%) |
| 50 to 54 Years | 324 (17.9%) | 173 (10.5%) |
| 55 to 59 Years | 59 (3.3%) | 249 (15.1%) |
| 60 to 64 Years | 172 (9.5%) | 83 (5.0%) |
| 65 to 69 Years | 127 (7.0%) | 98 (5.9%) |
| 70 to 74 Years | 111 (6.1%) | 3 (0.2%) |
| 75 to 79 Years | 4 (0.2%) | 9 (0.5%) |
| 80 to 84 Years | 10 (0.5%) | 46 (2.8%) |
| 85 Years and over | 30 (1.7%) | 20 (1.2%) |
| Total | 1,806 (100.0%) | 1,651 (100.0%) |
Families and Households in Cascade Valley
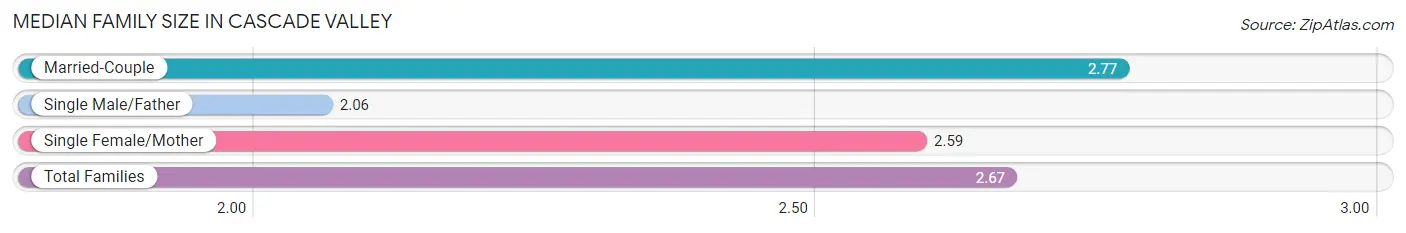
Median Family Size in Cascade Valley
The median family size in Cascade Valley is 2.67 persons per family, with married-couple families (639 | 68.3%) accounting for the largest median family size of 2.77 persons per family. On the other hand, single male/father families (82 | 8.8%) represent the smallest median family size with 2.06 persons per family.
| Family Type | # Families | Family Size |
| Married-Couple | 639 (68.3%) | 2.77 |
| Single Male/Father | 82 (8.8%) | 2.06 |
| Single Female/Mother | 214 (22.9%) | 2.59 |
| Total Families | 935 (100.0%) | 2.67 |
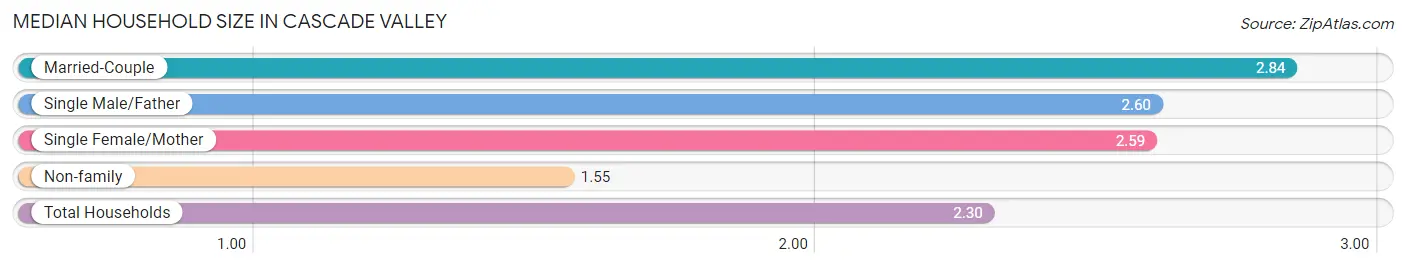
Median Household Size in Cascade Valley
The median household size in Cascade Valley is 2.30 persons per household, with married-couple households (639 | 42.6%) accounting for the largest median household size of 2.84 persons per household. non-family households (566 | 37.7%) represent the smallest median household size with 1.55 persons per household.
| Household Type | # Households | Household Size |
| Married-Couple | 639 (42.6%) | 2.84 |
| Single Male/Father | 82 (5.5%) | 2.60 |
| Single Female/Mother | 214 (14.3%) | 2.59 |
| Non-family | 566 (37.7%) | 1.55 |
| Total Households | 1,501 (100.0%) | 2.30 |
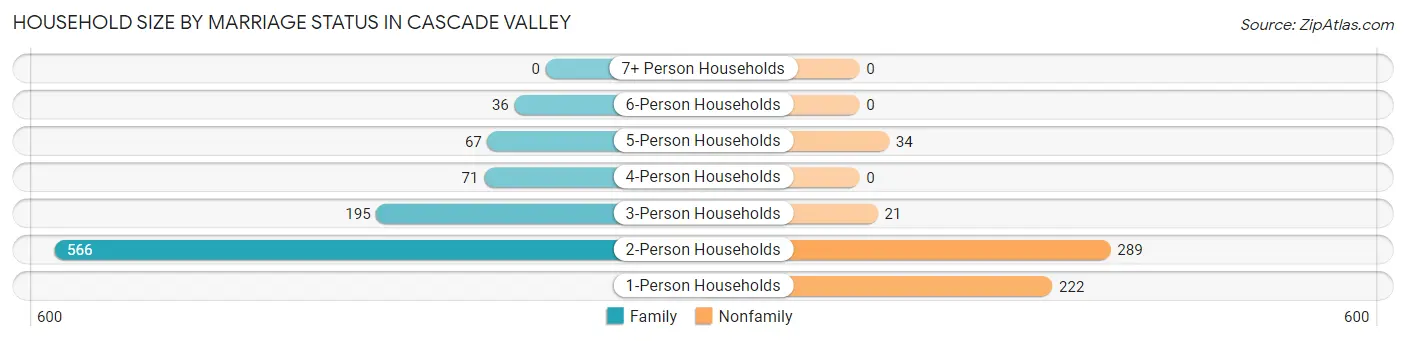
Household Size by Marriage Status in Cascade Valley
Out of a total of 1,501 households in Cascade Valley, 935 (62.3%) are family households, while 566 (37.7%) are nonfamily households. The most numerous type of family households are 2-person households, comprising 566, and the most common type of nonfamily households are 2-person households, comprising 289.
| Household Size | Family Households | Nonfamily Households |
| 1-Person Households | - | 222 (14.8%) |
| 2-Person Households | 566 (37.7%) | 289 (19.3%) |
| 3-Person Households | 195 (13.0%) | 21 (1.4%) |
| 4-Person Households | 71 (4.7%) | 0 (0.0%) |
| 5-Person Households | 67 (4.5%) | 34 (2.3%) |
| 6-Person Households | 36 (2.4%) | 0 (0.0%) |
| 7+ Person Households | 0 (0.0%) | 0 (0.0%) |
| Total | 935 (62.3%) | 566 (37.7%) |
Female Fertility in Cascade Valley
Fertility by Age in Cascade Valley
Average fertility rate in Cascade Valley is 50.0 births per 1,000 women. Women in the age bracket of 20 to 34 years have the highest fertility rate with 89.0 births per 1,000 women. Women in the age bracket of 20 to 34 years acount for 100.0% of all women with births.
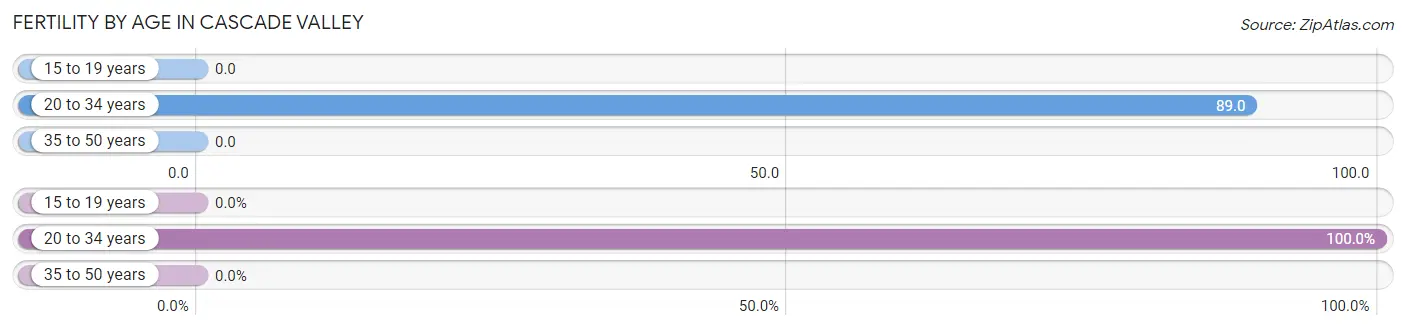
| Age Bracket | Women with Births | Births / 1,000 Women |
| 15 to 19 years | 0 (0.0%) | 0.0 |
| 20 to 34 years | 42 (100.0%) | 89.0 |
| 35 to 50 years | 0 (0.0%) | 0.0 |
| Total | 42 (100.0%) | 50.0 |
Fertility by Age by Marriage Status in Cascade Valley
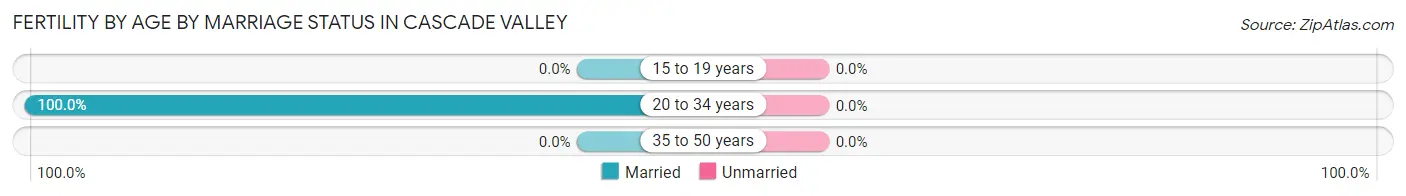
| Age Bracket | Married | Unmarried |
| 15 to 19 years | 0 (0.0%) | 0 (0.0%) |
| 20 to 34 years | 42 (100.0%) | 0 (0.0%) |
| 35 to 50 years | 0 (0.0%) | 0 (0.0%) |
| Total | 42 (100.0%) | 0 (0.0%) |
Fertility by Education in Cascade Valley
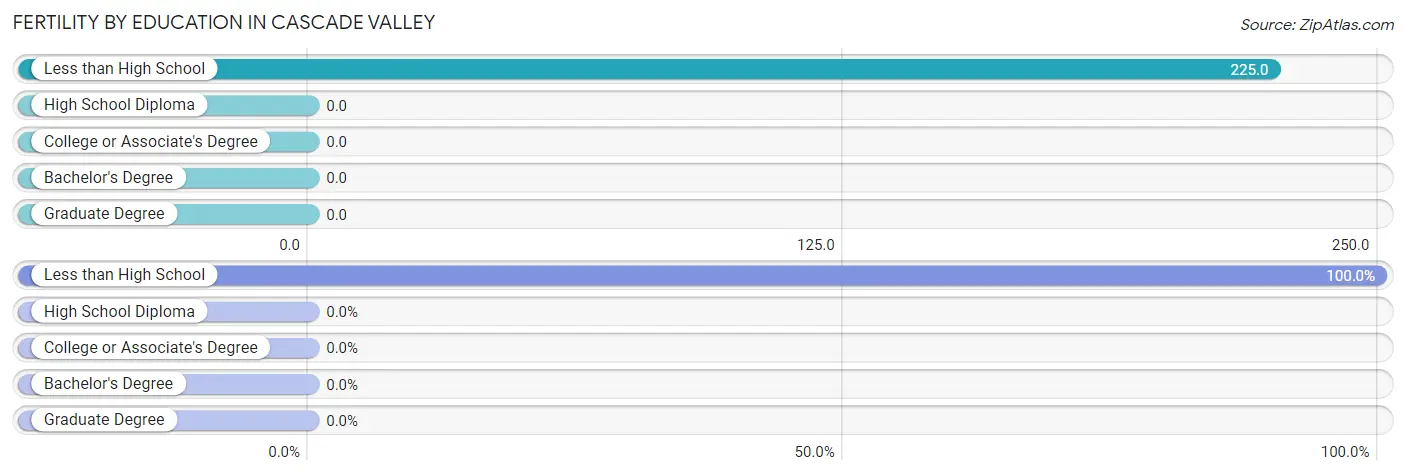
| Educational Attainment | Women with Births | Births / 1,000 Women |
| Less than High School | 42 (100.0%) | 225.0 |
| High School Diploma | 0 (0.0%) | 0.0 |
| College or Associate's Degree | 0 (0.0%) | 0.0 |
| Bachelor's Degree | 0 (0.0%) | 0.0 |
| Graduate Degree | 0 (0.0%) | 0.0 |
| Total | 42 (100.0%) | 50.0 |
Fertility by Education by Marriage Status in Cascade Valley
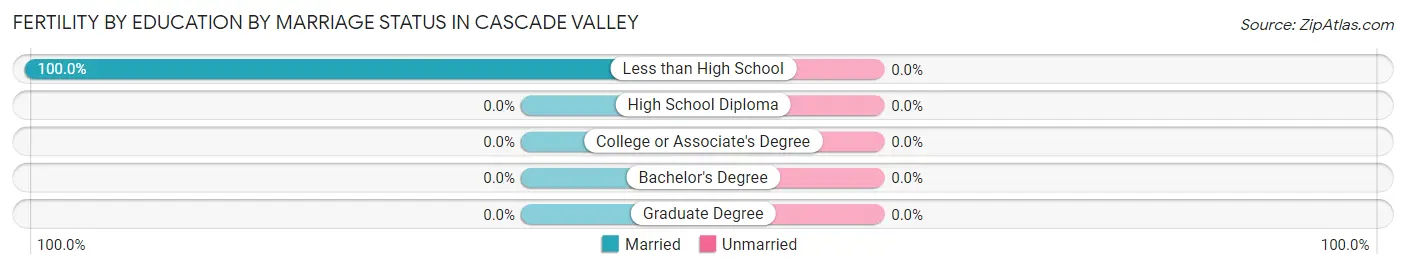
| Educational Attainment | Married | Unmarried |
| Less than High School | 42 (100.0%) | 0 (0.0%) |
| High School Diploma | 0 (0.0%) | 0 (0.0%) |
| College or Associate's Degree | 0 (0.0%) | 0 (0.0%) |
| Bachelor's Degree | 0 (0.0%) | 0 (0.0%) |
| Graduate Degree | 0 (0.0%) | 0 (0.0%) |
| Total | 42 (100.0%) | 0 (0.0%) |
Income in Cascade Valley
Income Overview in Cascade Valley
Per Capita Income in Cascade Valley is $29,239, while median incomes of families and households are $59,164 and $49,050 respectively.
| Characteristic | Number | Measure |
| Per Capita Income | 3,457 | $29,239 |
| Median Family Income | 935 | $59,164 |
| Mean Family Income | 935 | $72,214 |
| Median Household Income | 1,501 | $49,050 |
| Mean Household Income | 1,501 | $67,635 |
| Income Deficit | 935 | $12,703 |
| Wage / Income Gap (%) | 3,457 | 21.45% |
| Wage / Income Gap ($) | 3,457 | 78.55¢ per $1 |
| Gini / Inequality Index | 3,457 | 0.41 |
Earnings by Sex in Cascade Valley
Average Earnings in Cascade Valley are $34,268, $36,189 for men and $28,425 for women, a difference of 21.4%.
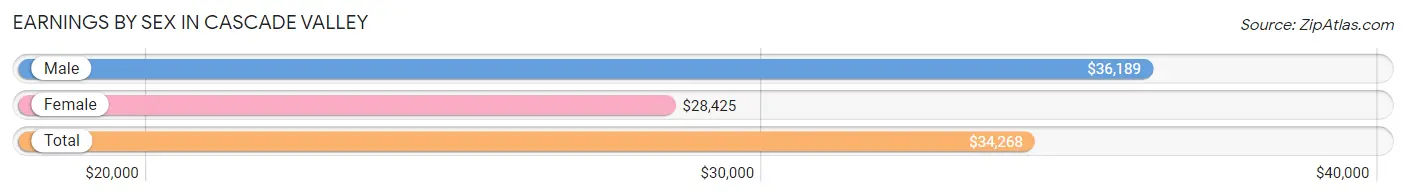
| Sex | Number | Average Earnings |
| Male | 1,295 (54.4%) | $36,189 |
| Female | 1,084 (45.6%) | $28,425 |
| Total | 2,379 (100.0%) | $34,268 |
Earnings by Sex by Income Bracket in Cascade Valley
The most common earnings brackets in Cascade Valley are $35,000 to $39,999 for men (356 | 27.5%) and $30,000 to $34,999 for women (234 | 21.6%).
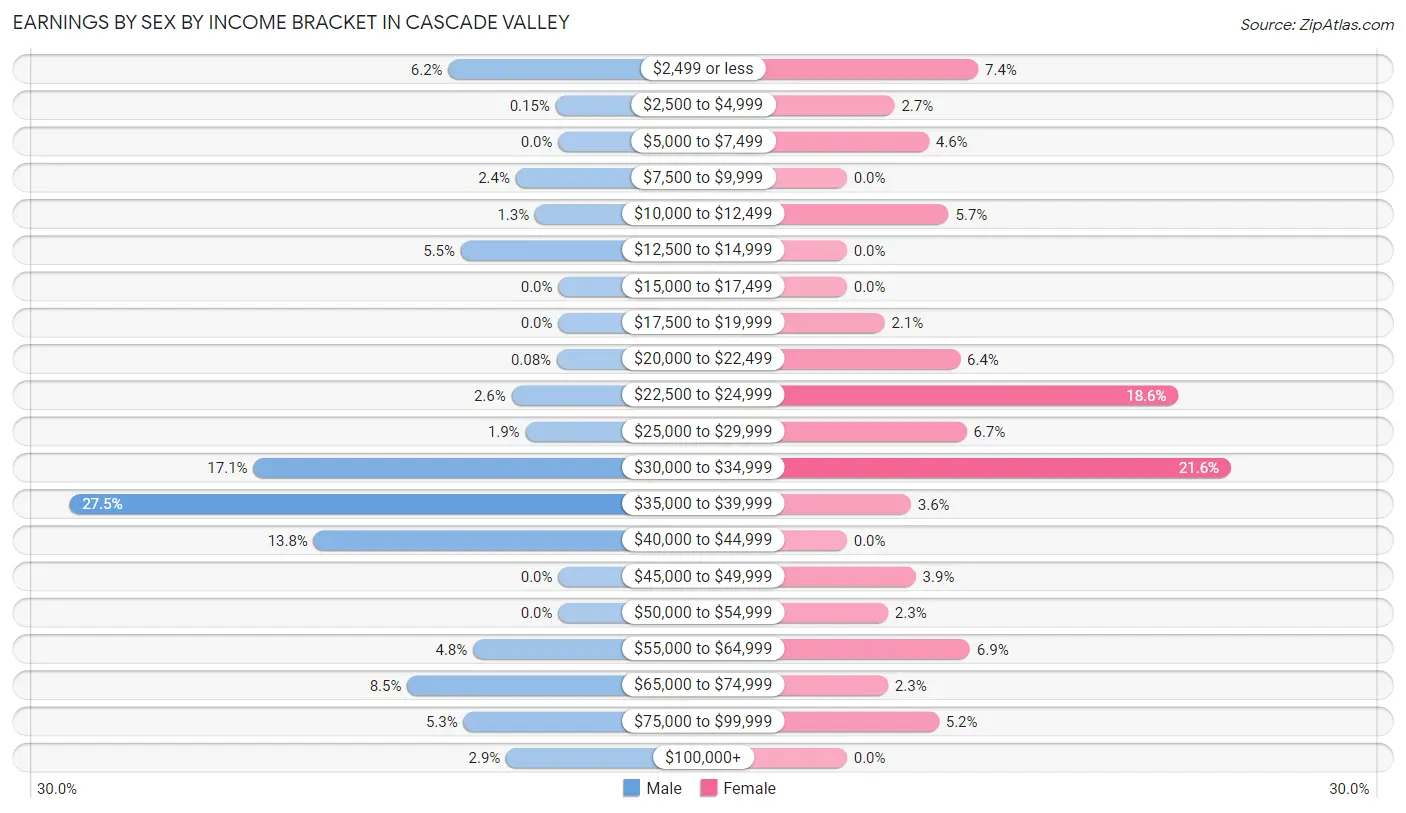
| Income | Male | Female |
| $2,499 or less | 80 (6.2%) | 80 (7.4%) |
| $2,500 to $4,999 | 2 (0.2%) | 29 (2.7%) |
| $5,000 to $7,499 | 0 (0.0%) | 50 (4.6%) |
| $7,500 to $9,999 | 31 (2.4%) | 0 (0.0%) |
| $10,000 to $12,499 | 17 (1.3%) | 62 (5.7%) |
| $12,500 to $14,999 | 71 (5.5%) | 0 (0.0%) |
| $15,000 to $17,499 | 0 (0.0%) | 0 (0.0%) |
| $17,500 to $19,999 | 0 (0.0%) | 23 (2.1%) |
| $20,000 to $22,499 | 1 (0.1%) | 69 (6.4%) |
| $22,500 to $24,999 | 34 (2.6%) | 202 (18.6%) |
| $25,000 to $29,999 | 24 (1.8%) | 73 (6.7%) |
| $30,000 to $34,999 | 222 (17.1%) | 234 (21.6%) |
| $35,000 to $39,999 | 356 (27.5%) | 39 (3.6%) |
| $40,000 to $44,999 | 178 (13.8%) | 0 (0.0%) |
| $45,000 to $49,999 | 0 (0.0%) | 42 (3.9%) |
| $50,000 to $54,999 | 0 (0.0%) | 25 (2.3%) |
| $55,000 to $64,999 | 62 (4.8%) | 75 (6.9%) |
| $65,000 to $74,999 | 110 (8.5%) | 25 (2.3%) |
| $75,000 to $99,999 | 69 (5.3%) | 56 (5.2%) |
| $100,000+ | 38 (2.9%) | 0 (0.0%) |
| Total | 1,295 (100.0%) | 1,084 (100.0%) |
Earnings by Sex by Educational Attainment in Cascade Valley
Average earnings in Cascade Valley are $38,125 for men and $29,127 for women, a difference of 23.6%. Men with an educational attainment of high school diploma enjoy the highest average annual earnings of $62,292, while those with college or associate's degree education earn the least with $35,433. Women with an educational attainment of bachelor's degree earn the most with the average annual earnings of $74,200, while those with college or associate's degree education have the smallest earnings of $24,865.
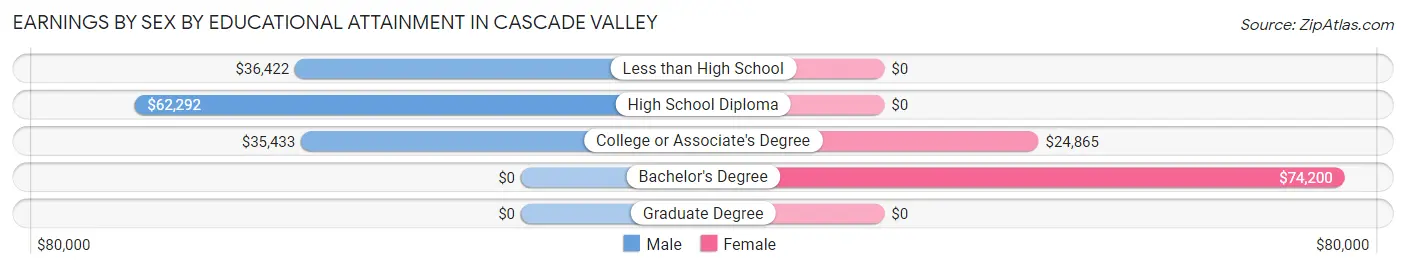
| Educational Attainment | Male Income | Female Income |
| Less than High School | $36,422 | $0 |
| High School Diploma | $62,292 | $0 |
| College or Associate's Degree | $35,433 | $24,865 |
| Bachelor's Degree | - | - |
| Graduate Degree | - | - |
| Total | $38,125 | $29,127 |
Family Income in Cascade Valley
Family Income Brackets in Cascade Valley
According to the Cascade Valley family income data, there are 284 families falling into the $50,000 to $74,999 income range, which is the most common income bracket and makes up 30.4% of all families. Conversely, the $150,000 to $199,999 income bracket is the least frequent group with only 8 families (0.9%) belonging to this category.
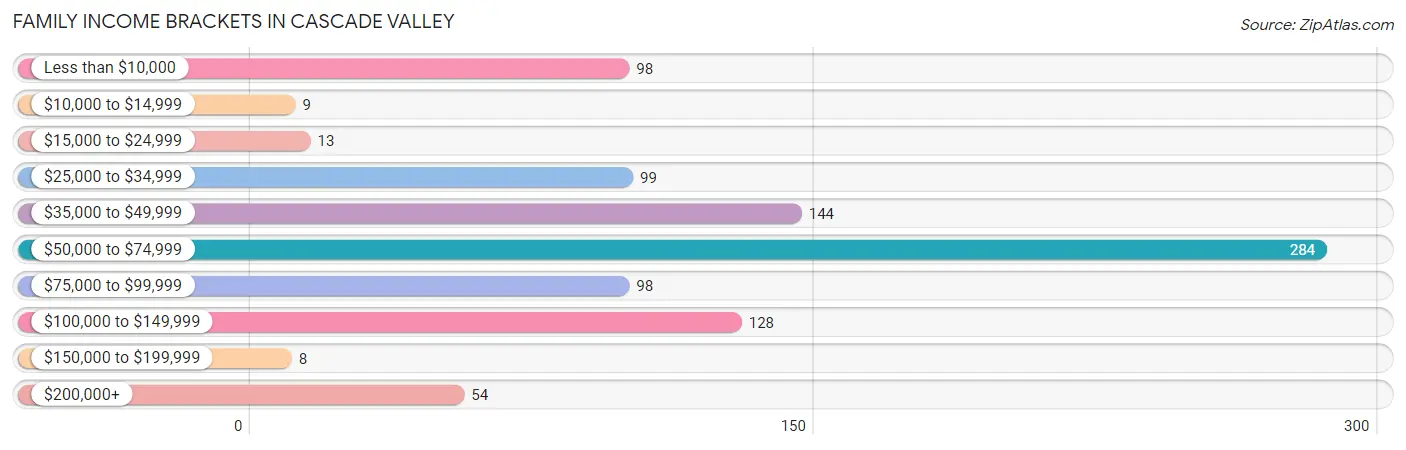
| Income Bracket | # Families | % Families |
| Less than $10,000 | 98 | 10.5% |
| $10,000 to $14,999 | 9 | 1.0% |
| $15,000 to $24,999 | 13 | 1.4% |
| $25,000 to $34,999 | 99 | 10.6% |
| $35,000 to $49,999 | 144 | 15.4% |
| $50,000 to $74,999 | 284 | 30.4% |
| $75,000 to $99,999 | 98 | 10.5% |
| $100,000 to $149,999 | 128 | 13.7% |
| $150,000 to $199,999 | 8 | 0.9% |
| $200,000+ | 54 | 5.8% |
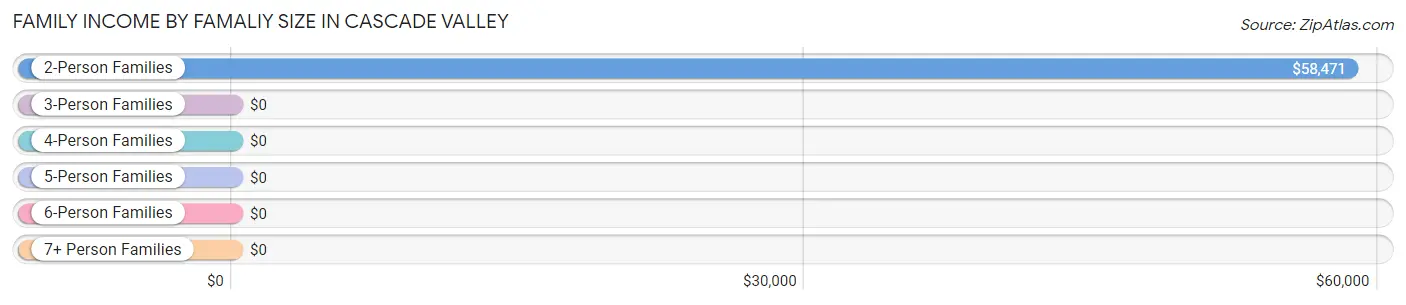
Family Income by Famaliy Size in Cascade Valley
2-person families (626 | 66.9%) account for the highest median family income in Cascade Valley with $58,471 per family, while 2-person families (626 | 66.9%) have the highest median income of $29,236 per family member.
| Income Bracket | # Families | Median Income |
| 2-Person Families | 626 (66.9%) | $58,471 |
| 3-Person Families | 135 (14.4%) | $0 |
| 4-Person Families | 71 (7.6%) | $0 |
| 5-Person Families | 103 (11.0%) | $0 |
| 6-Person Families | 0 (0.0%) | $0 |
| 7+ Person Families | 0 (0.0%) | $0 |
| Total | 935 (100.0%) | $59,164 |
Family Income by Number of Earners in Cascade Valley
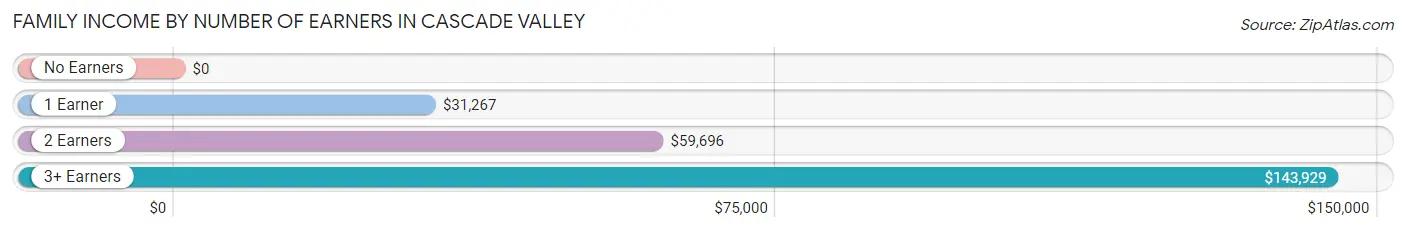
| Number of Earners | # Families | Median Income |
| No Earners | 64 (6.8%) | $0 |
| 1 Earner | 289 (30.9%) | $31,267 |
| 2 Earners | 470 (50.3%) | $59,696 |
| 3+ Earners | 112 (12.0%) | $143,929 |
| Total | 935 (100.0%) | $59,164 |
Household Income in Cascade Valley
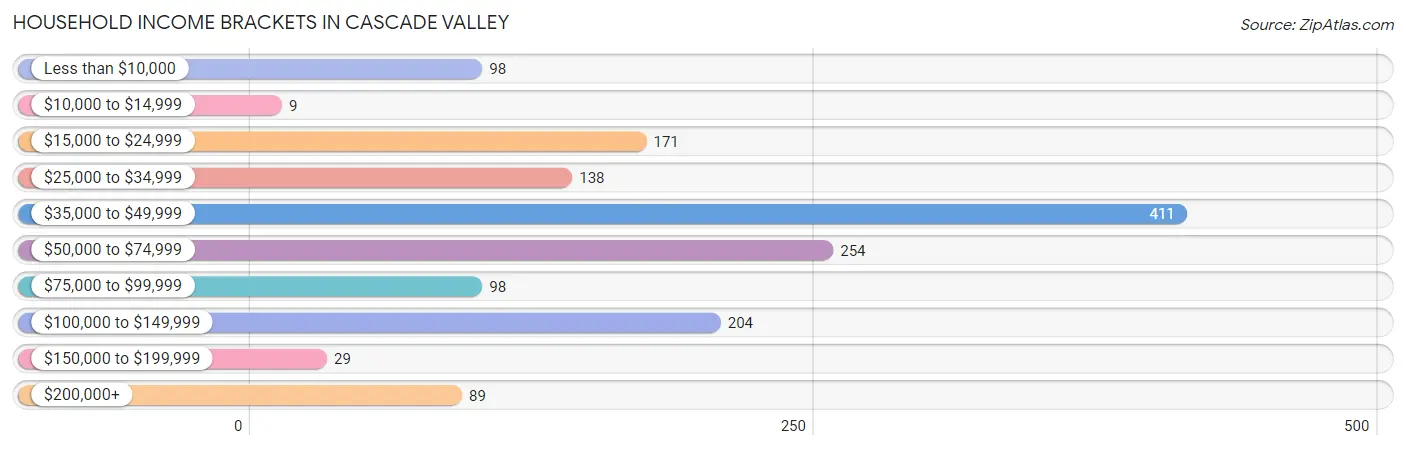
Household Income Brackets in Cascade Valley
With 411 households falling in the category, the $35,000 to $49,999 income range is the most frequent in Cascade Valley, accounting for 27.4% of all households. In contrast, only 9 households (0.6%) fall into the $10,000 to $14,999 income bracket, making it the least populous group.
| Income Bracket | # Households | % Households |
| Less than $10,000 | 98 | 6.5% |
| $10,000 to $14,999 | 9 | 0.6% |
| $15,000 to $24,999 | 171 | 11.4% |
| $25,000 to $34,999 | 138 | 9.2% |
| $35,000 to $49,999 | 411 | 27.4% |
| $50,000 to $74,999 | 254 | 16.9% |
| $75,000 to $99,999 | 98 | 6.5% |
| $100,000 to $149,999 | 204 | 13.6% |
| $150,000 to $199,999 | 29 | 1.9% |
| $200,000+ | 89 | 5.9% |
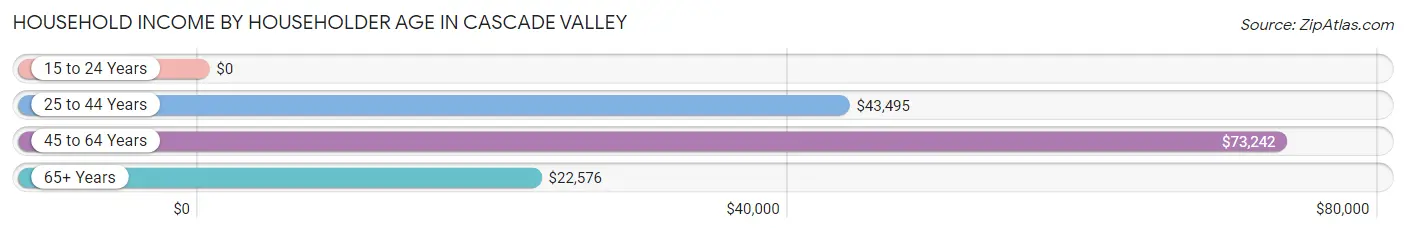
Household Income by Householder Age in Cascade Valley
The median household income in Cascade Valley is $49,050, with the highest median household income of $73,242 found in the 45 to 64 years age bracket for the primary householder. A total of 575 households (38.3%) fall into this category. Meanwhile, the 15 to 24 years age bracket for the primary householder has the lowest median household income of $0, with 226 households (15.1%) in this group.
| Income Bracket | # Households | Median Income |
| 15 to 24 Years | 226 (15.1%) | $0 |
| 25 to 44 Years | 338 (22.5%) | $43,495 |
| 45 to 64 Years | 575 (38.3%) | $73,242 |
| 65+ Years | 362 (24.1%) | $22,576 |
| Total | 1,501 (100.0%) | $49,050 |
Poverty in Cascade Valley
Income Below Poverty by Sex and Age in Cascade Valley
With 14.9% poverty level for males and 13.1% for females among the residents of Cascade Valley, 65 to 74 year old males and 25 to 34 year old females are the most vulnerable to poverty, with 111 males (46.6%) and 94 females (36.7%) in their respective age groups living below the poverty level.
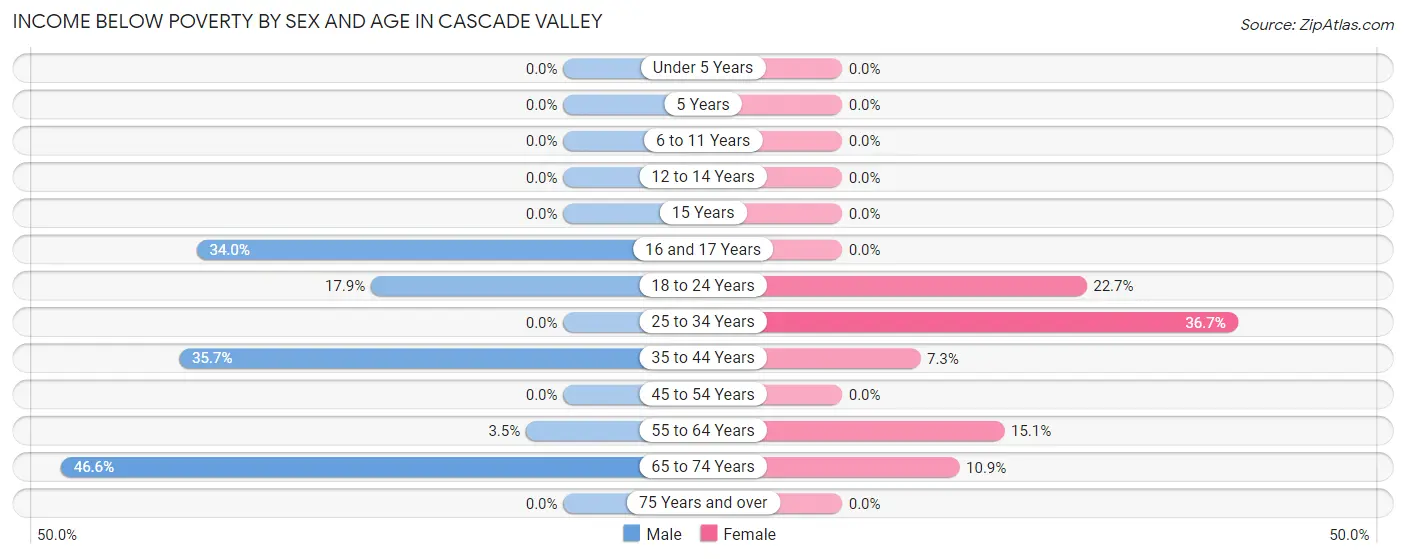
| Age Bracket | Male | Female |
| Under 5 Years | 0 (0.0%) | 0 (0.0%) |
| 5 Years | 0 (0.0%) | 0 (0.0%) |
| 6 to 11 Years | 0 (0.0%) | 0 (0.0%) |
| 12 to 14 Years | 0 (0.0%) | 0 (0.0%) |
| 15 Years | 0 (0.0%) | 0 (0.0%) |
| 16 and 17 Years | 16 (34.0%) | 0 (0.0%) |
| 18 to 24 Years | 73 (17.8%) | 49 (22.7%) |
| 25 to 34 Years | 0 (0.0%) | 94 (36.7%) |
| 35 to 44 Years | 61 (35.7%) | 13 (7.3%) |
| 45 to 54 Years | 0 (0.0%) | 0 (0.0%) |
| 55 to 64 Years | 8 (3.5%) | 50 (15.1%) |
| 65 to 74 Years | 111 (46.6%) | 11 (10.9%) |
| 75 Years and over | 0 (0.0%) | 0 (0.0%) |
| Total | 269 (14.9%) | 217 (13.1%) |
Income Above Poverty by Sex and Age in Cascade Valley
According to the poverty statistics in Cascade Valley, males aged under 5 years and females aged under 5 years are the age groups that are most secure financially, with 100.0% of males and 100.0% of females in these age groups living above the poverty line.
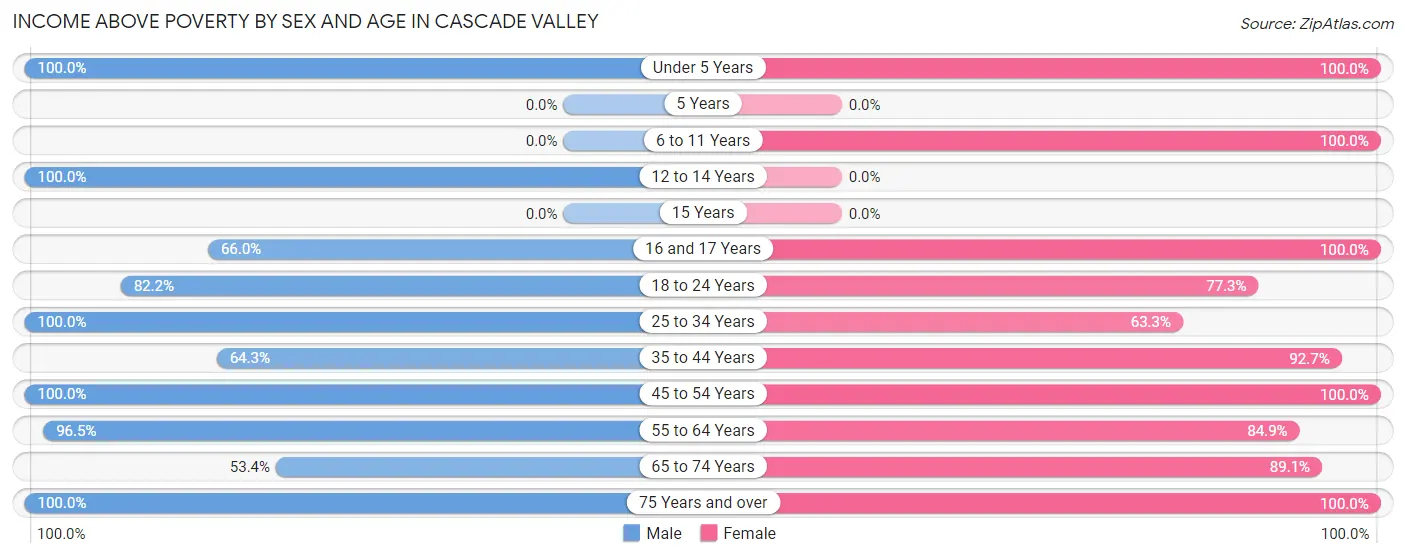
| Age Bracket | Male | Female |
| Under 5 Years | 35 (100.0%) | 64 (100.0%) |
| 5 Years | 0 (0.0%) | 0 (0.0%) |
| 6 to 11 Years | 0 (0.0%) | 60 (100.0%) |
| 12 to 14 Years | 61 (100.0%) | 0 (0.0%) |
| 15 Years | 0 (0.0%) | 0 (0.0%) |
| 16 and 17 Years | 31 (66.0%) | 51 (100.0%) |
| 18 to 24 Years | 336 (82.2%) | 167 (77.3%) |
| 25 to 34 Years | 87 (100.0%) | 162 (63.3%) |
| 35 to 44 Years | 110 (64.3%) | 166 (92.7%) |
| 45 to 54 Years | 483 (100.0%) | 317 (100.0%) |
| 55 to 64 Years | 223 (96.5%) | 282 (84.9%) |
| 65 to 74 Years | 127 (53.4%) | 90 (89.1%) |
| 75 Years and over | 44 (100.0%) | 75 (100.0%) |
| Total | 1,537 (85.1%) | 1,434 (86.9%) |
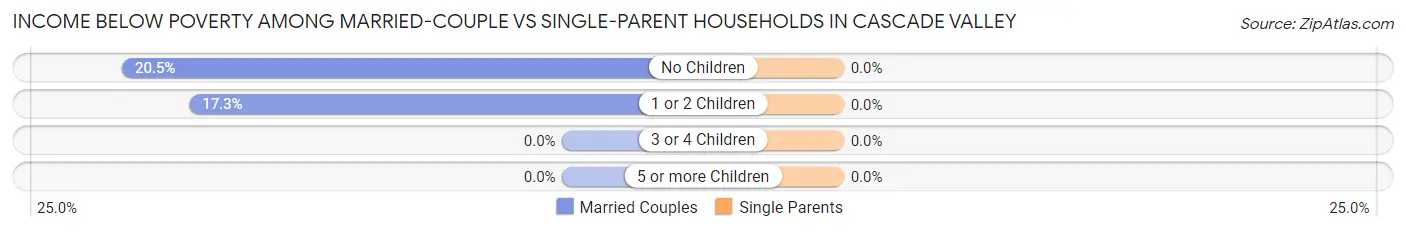
Income Below Poverty Among Married-Couple Families in Cascade Valley
The poverty statistics for married-couple families in Cascade Valley show that 18.8% or 120 of the total 639 families live below the poverty line. Families with no children have the highest poverty rate of 20.5%, comprising of 107 families. On the other hand, families with 3 or 4 children have the lowest poverty rate of 0.0%, which includes 0 families.
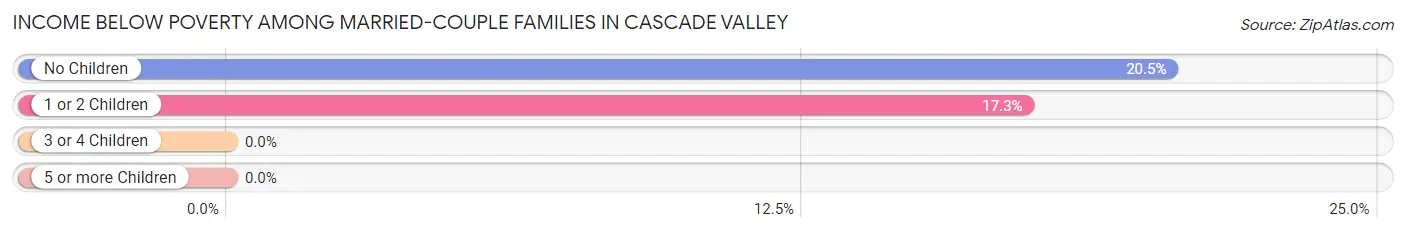
| Children | Above Poverty | Below Poverty |
| No Children | 416 (79.5%) | 107 (20.5%) |
| 1 or 2 Children | 62 (82.7%) | 13 (17.3%) |
| 3 or 4 Children | 41 (100.0%) | 0 (0.0%) |
| 5 or more Children | 0 (0.0%) | 0 (0.0%) |
| Total | 519 (81.2%) | 120 (18.8%) |
Income Below Poverty Among Single-Parent Households in Cascade Valley
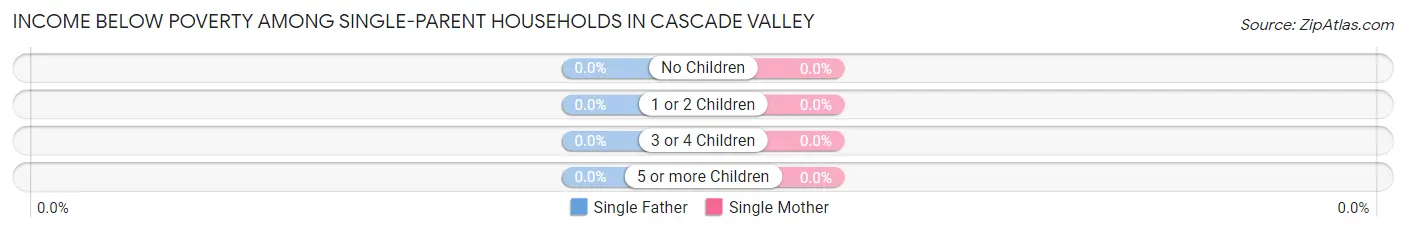
| Children | Single Father | Single Mother |
| No Children | 0 (0.0%) | 0 (0.0%) |
| 1 or 2 Children | 0 (0.0%) | 0 (0.0%) |
| 3 or 4 Children | 0 (0.0%) | 0 (0.0%) |
| 5 or more Children | 0 (0.0%) | 0 (0.0%) |
| Total | 0 (0.0%) | 0 (0.0%) |
Income Below Poverty Among Married-Couple vs Single-Parent Households in Cascade Valley
| Children | Married-Couple Families | Single-Parent Households |
| No Children | 107 (20.5%) | 0 (0.0%) |
| 1 or 2 Children | 13 (17.3%) | 0 (0.0%) |
| 3 or 4 Children | 0 (0.0%) | 0 (0.0%) |
| 5 or more Children | 0 (0.0%) | 0 (0.0%) |
| Total | 120 (18.8%) | 0 (0.0%) |
Employment Characteristics in Cascade Valley
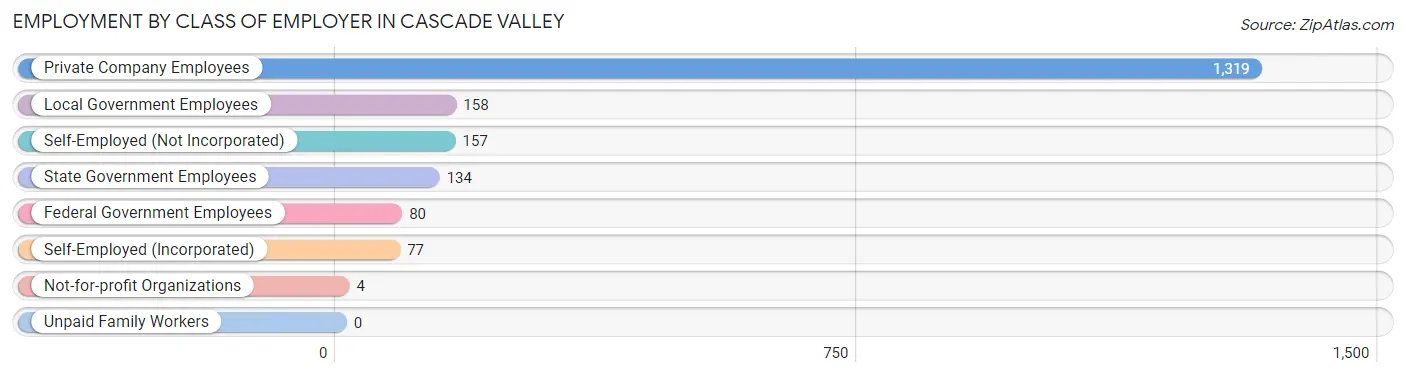
Employment by Class of Employer in Cascade Valley
Among the 1,929 employed individuals in Cascade Valley, private company employees (1,319 | 68.4%), local government employees (158 | 8.2%), and self-employed (not incorporated) (157 | 8.1%) make up the most common classes of employment.
| Employer Class | # Employees | % Employees |
| Private Company Employees | 1,319 | 68.4% |
| Self-Employed (Incorporated) | 77 | 4.0% |
| Self-Employed (Not Incorporated) | 157 | 8.1% |
| Not-for-profit Organizations | 4 | 0.2% |
| Local Government Employees | 158 | 8.2% |
| State Government Employees | 134 | 7.0% |
| Federal Government Employees | 80 | 4.2% |
| Unpaid Family Workers | 0 | 0.0% |
| Total | 1,929 | 100.0% |
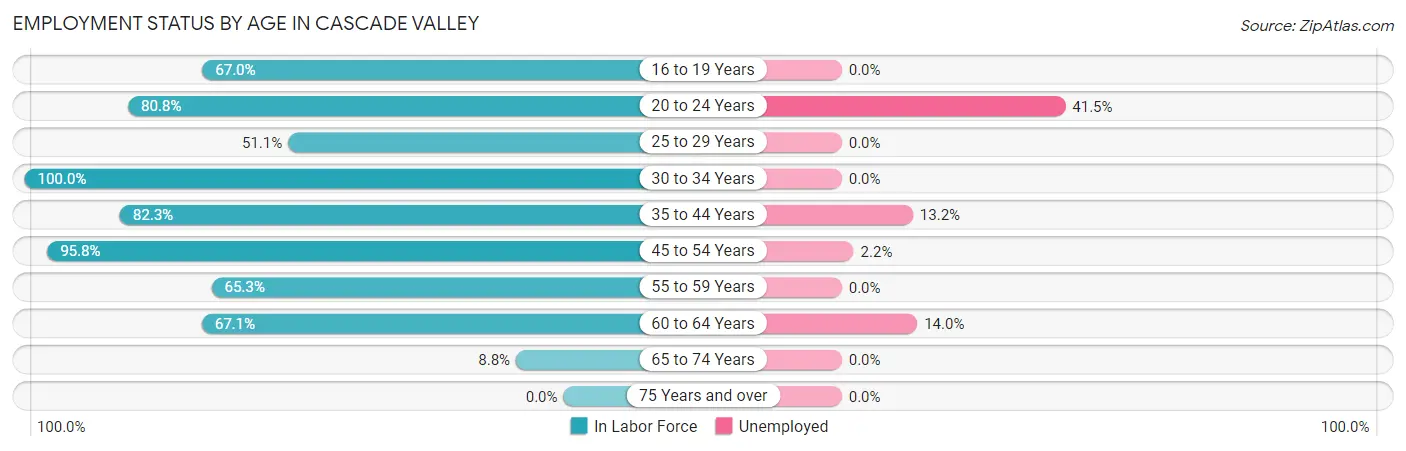
Employment Status by Age in Cascade Valley
According to the labor force statistics for Cascade Valley, out of the total population over 16 years of age (3,237), 68.3% or 2,211 individuals are in the labor force, with 12.8% or 283 of them unemployed. The age group with the highest labor force participation rate is 30 to 34 years, with 100.0% or 26 individuals in the labor force. Within the labor force, the 20 to 24 years age range has the highest percentage of unemployed individuals, with 41.5% or 204 of them being unemployed.
| Age Bracket | In Labor Force | Unemployed |
| 16 to 19 Years | 77 (67.0%) | 0 (0.0%) |
| 20 to 24 Years | 491 (80.8%) | 204 (41.5%) |
| 25 to 29 Years | 162 (51.1%) | 0 (0.0%) |
| 30 to 34 Years | 26 (100.0%) | 0 (0.0%) |
| 35 to 44 Years | 288 (82.3%) | 38 (13.2%) |
| 45 to 54 Years | 766 (95.8%) | 17 (2.2%) |
| 55 to 59 Years | 201 (65.3%) | 0 (0.0%) |
| 60 to 64 Years | 171 (67.1%) | 24 (14.0%) |
| 65 to 74 Years | 30 (8.8%) | 0 (0.0%) |
| 75 Years and over | 0 (0.0%) | 0 (0.0%) |
| Total | 2,211 (68.3%) | 283 (12.8%) |
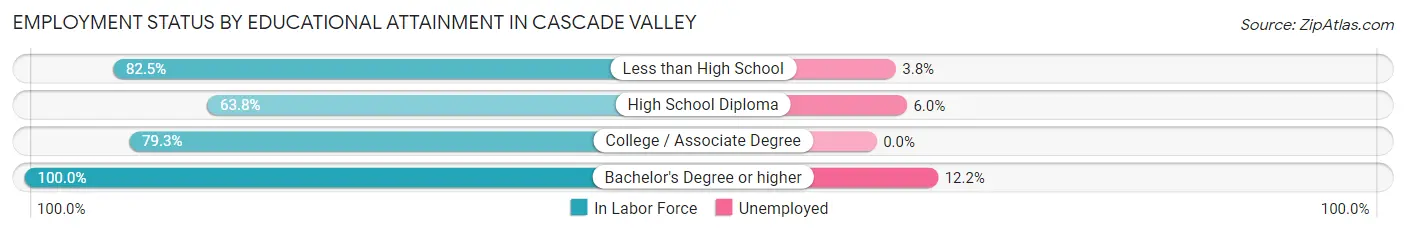
Employment Status by Educational Attainment in Cascade Valley
According to labor force statistics for Cascade Valley, 78.5% of individuals (1,614) out of the total population between 25 and 64 years of age (2,056) are in the labor force, with 4.9% or 79 of them being unemployed. The group with the highest labor force participation rate are those with the educational attainment of bachelor's degree or higher, with 100.0% or 311 individuals in the labor force. Within the labor force, individuals with bachelor's degree or higher education have the highest percentage of unemployment, with 12.2% or 38 of them being unemployed.
| Educational Attainment | In Labor Force | Unemployed |
| Less than High School | 442 (82.5%) | 20 (3.8%) |
| High School Diploma | 402 (63.8%) | 38 (6.0%) |
| College / Associate Degree | 459 (79.3%) | 0 (0.0%) |
| Bachelor's Degree or higher | 311 (100.0%) | 38 (12.2%) |
| Total | 1,614 (78.5%) | 101 (4.9%) |
Employment Occupations by Sex in Cascade Valley
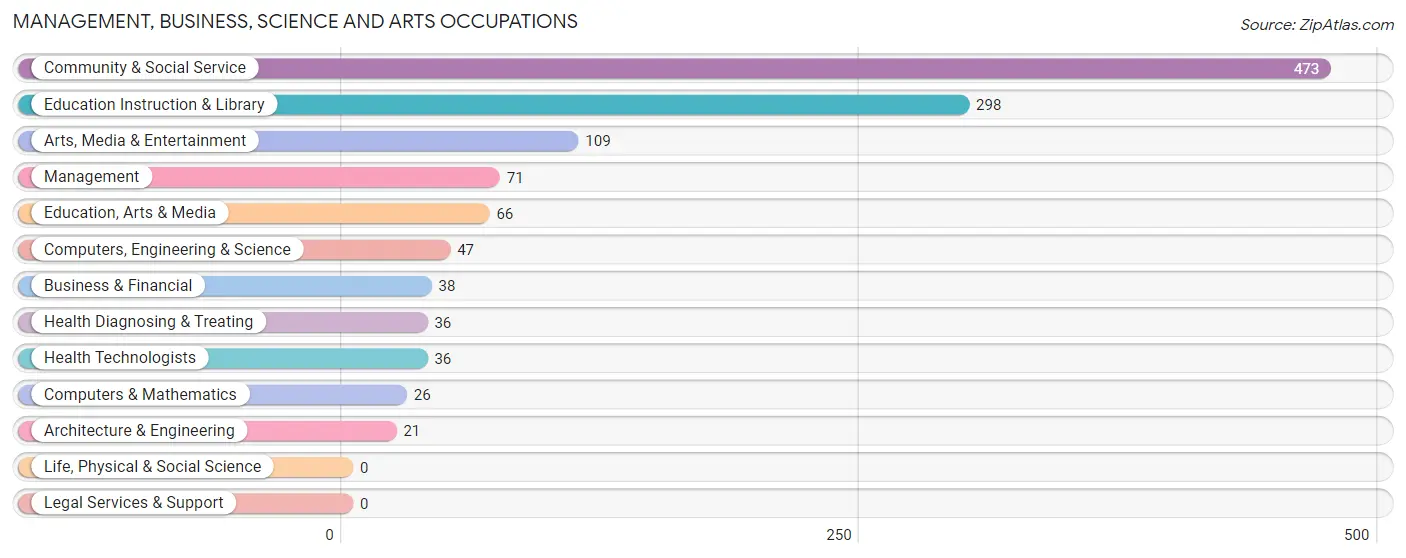
Management, Business, Science and Arts Occupations
The most common Management, Business, Science and Arts occupations in Cascade Valley are Community & Social Service (473 | 24.5%), Education Instruction & Library (298 | 15.4%), Arts, Media & Entertainment (109 | 5.7%), Management (71 | 3.7%), and Education, Arts & Media (66 | 3.4%).
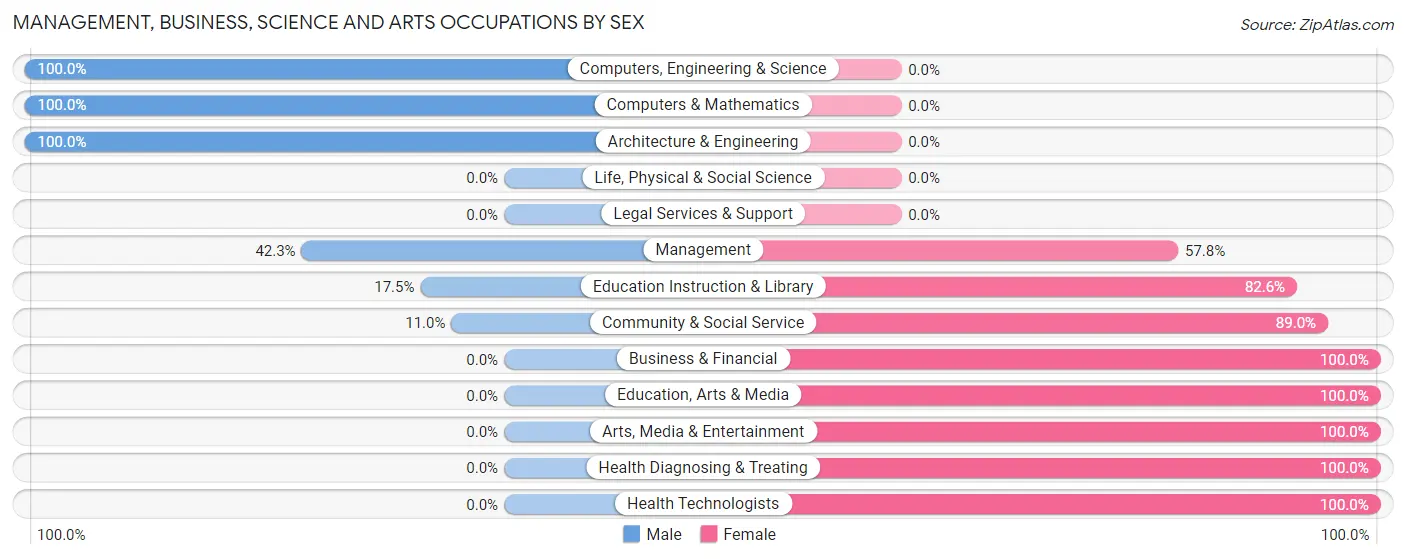
Management, Business, Science and Arts Occupations by Sex
Within the Management, Business, Science and Arts occupations in Cascade Valley, the most male-oriented occupations are Computers, Engineering & Science (100.0%), Computers & Mathematics (100.0%), and Architecture & Engineering (100.0%), while the most female-oriented occupations are Business & Financial (100.0%), Education, Arts & Media (100.0%), and Arts, Media & Entertainment (100.0%).
| Occupation | Male | Female |
| Management | 30 (42.2%) | 41 (57.8%) |
| Business & Financial | 0 (0.0%) | 38 (100.0%) |
| Computers, Engineering & Science | 47 (100.0%) | 0 (0.0%) |
| Computers & Mathematics | 26 (100.0%) | 0 (0.0%) |
| Architecture & Engineering | 21 (100.0%) | 0 (0.0%) |
| Life, Physical & Social Science | 0 (0.0%) | 0 (0.0%) |
| Community & Social Service | 52 (11.0%) | 421 (89.0%) |
| Education, Arts & Media | 0 (0.0%) | 66 (100.0%) |
| Legal Services & Support | 0 (0.0%) | 0 (0.0%) |
| Education Instruction & Library | 52 (17.4%) | 246 (82.6%) |
| Arts, Media & Entertainment | 0 (0.0%) | 109 (100.0%) |
| Health Diagnosing & Treating | 0 (0.0%) | 36 (100.0%) |
| Health Technologists | 0 (0.0%) | 36 (100.0%) |
| Total (Category) | 129 (19.4%) | 536 (80.6%) |
| Total (Overall) | 970 (50.3%) | 959 (49.7%) |
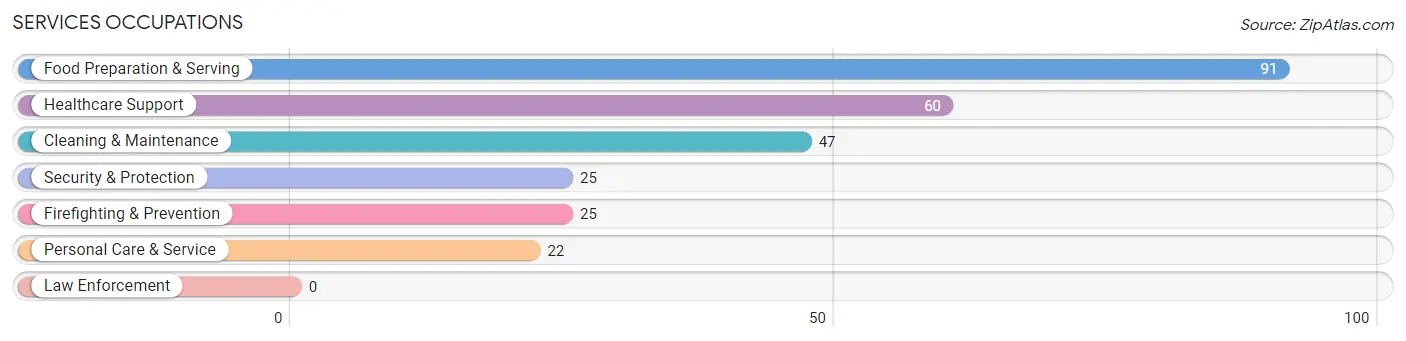
Services Occupations
The most common Services occupations in Cascade Valley are Food Preparation & Serving (91 | 4.7%), Healthcare Support (60 | 3.1%), Cleaning & Maintenance (47 | 2.4%), Security & Protection (25 | 1.3%), and Firefighting & Prevention (25 | 1.3%).
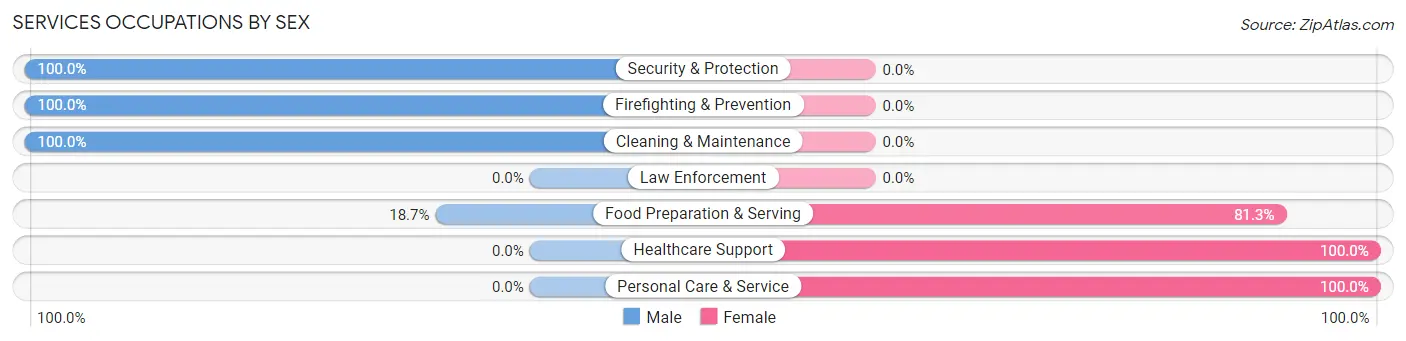
Services Occupations by Sex
Within the Services occupations in Cascade Valley, the most male-oriented occupations are Security & Protection (100.0%), Firefighting & Prevention (100.0%), and Cleaning & Maintenance (100.0%), while the most female-oriented occupations are Healthcare Support (100.0%), Personal Care & Service (100.0%), and Food Preparation & Serving (81.3%).
| Occupation | Male | Female |
| Healthcare Support | 0 (0.0%) | 60 (100.0%) |
| Security & Protection | 25 (100.0%) | 0 (0.0%) |
| Firefighting & Prevention | 25 (100.0%) | 0 (0.0%) |
| Law Enforcement | 0 (0.0%) | 0 (0.0%) |
| Food Preparation & Serving | 17 (18.7%) | 74 (81.3%) |
| Cleaning & Maintenance | 47 (100.0%) | 0 (0.0%) |
| Personal Care & Service | 0 (0.0%) | 22 (100.0%) |
| Total (Category) | 89 (36.3%) | 156 (63.7%) |
| Total (Overall) | 970 (50.3%) | 959 (49.7%) |
Sales and Office Occupations
The most common Sales and Office occupations in Cascade Valley are Office & Administration (159 | 8.2%), and Sales & Related (79 | 4.1%).
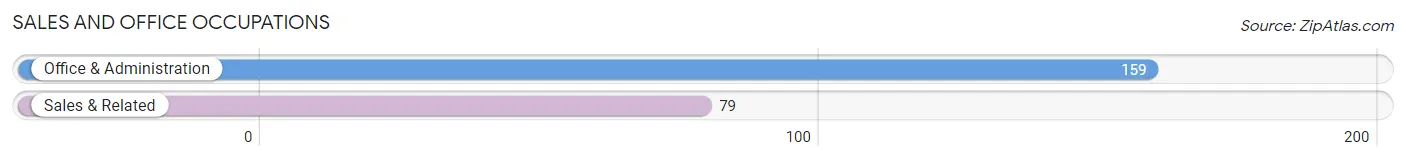
Sales and Office Occupations by Sex

| Occupation | Male | Female |
| Sales & Related | 79 (100.0%) | 0 (0.0%) |
| Office & Administration | 0 (0.0%) | 159 (100.0%) |
| Total (Category) | 79 (33.2%) | 159 (66.8%) |
| Total (Overall) | 970 (50.3%) | 959 (49.7%) |
Natural Resources, Construction and Maintenance Occupations
The most common Natural Resources, Construction and Maintenance occupations in Cascade Valley are Farming, Fishing & Forestry (359 | 18.6%), and Construction & Extraction (98 | 5.1%).
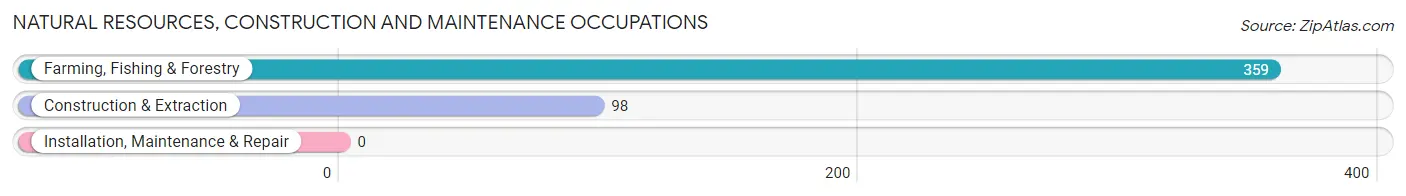
Natural Resources, Construction and Maintenance Occupations by Sex
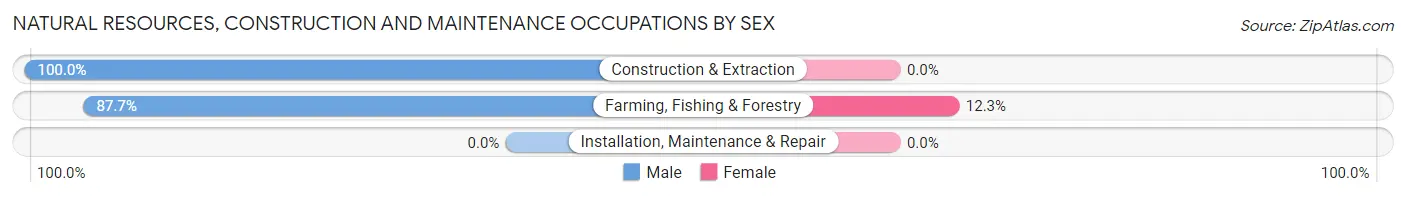
| Occupation | Male | Female |
| Farming, Fishing & Forestry | 315 (87.7%) | 44 (12.3%) |
| Construction & Extraction | 98 (100.0%) | 0 (0.0%) |
| Installation, Maintenance & Repair | 0 (0.0%) | 0 (0.0%) |
| Total (Category) | 413 (90.4%) | 44 (9.6%) |
| Total (Overall) | 970 (50.3%) | 959 (49.7%) |
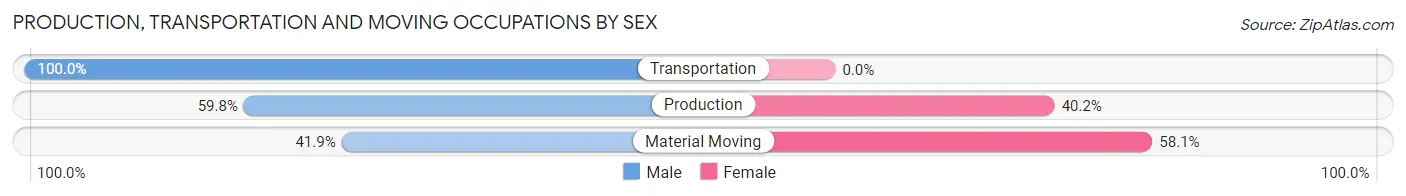
Production, Transportation and Moving Occupations
The most common Production, Transportation and Moving occupations in Cascade Valley are Transportation (184 | 9.5%), Production (97 | 5.0%), and Material Moving (43 | 2.2%).
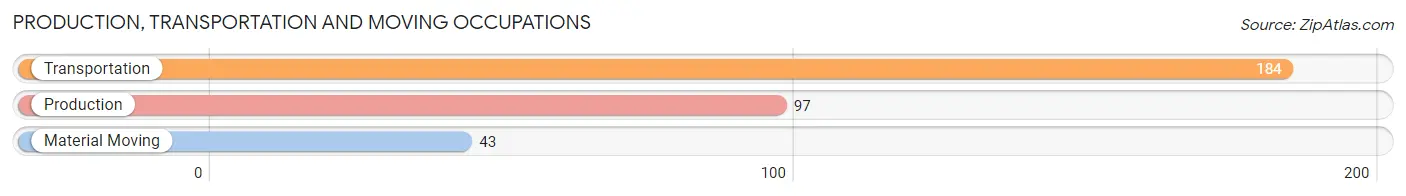
Production, Transportation and Moving Occupations by Sex
| Occupation | Male | Female |
| Production | 58 (59.8%) | 39 (40.2%) |
| Transportation | 184 (100.0%) | 0 (0.0%) |
| Material Moving | 18 (41.9%) | 25 (58.1%) |
| Total (Category) | 260 (80.2%) | 64 (19.8%) |
| Total (Overall) | 970 (50.3%) | 959 (49.7%) |
Employment Industries by Sex in Cascade Valley
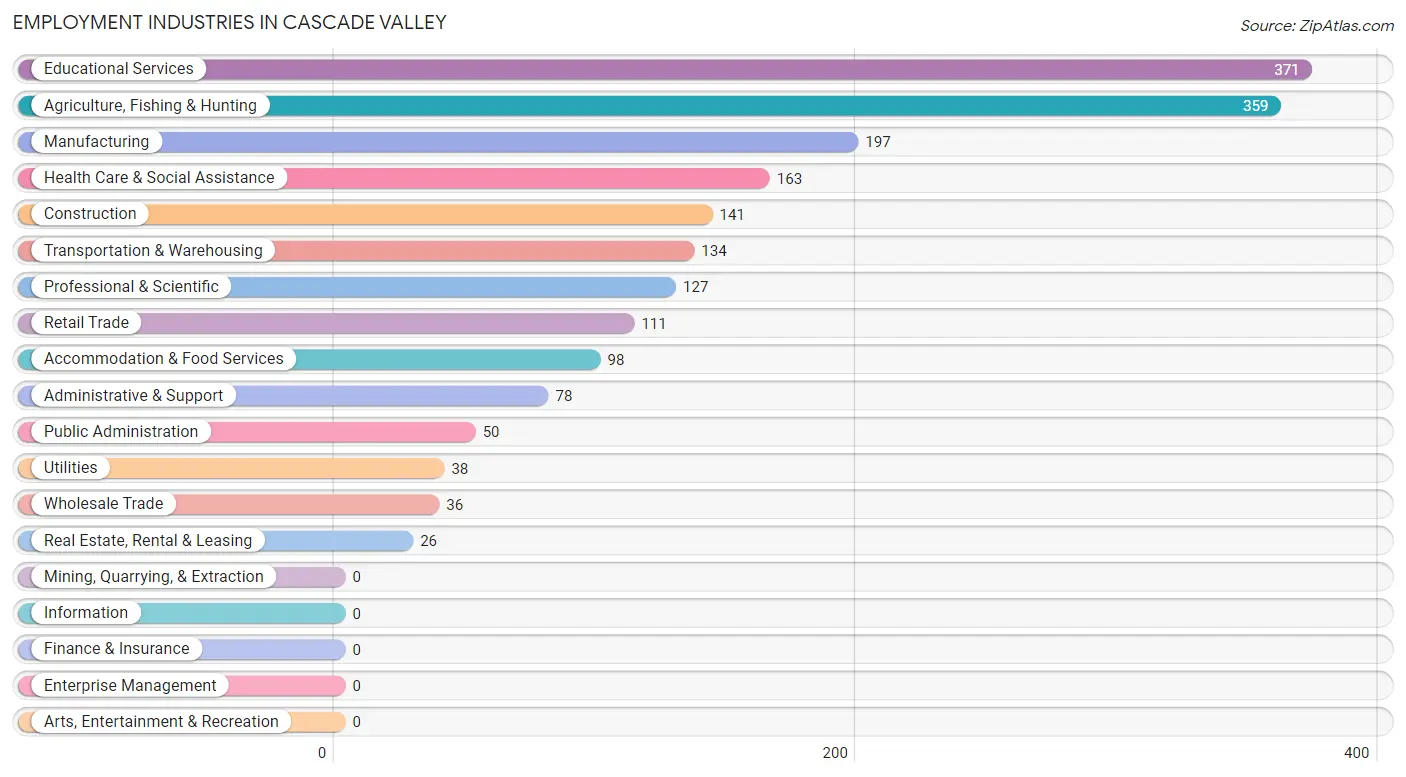
Employment Industries in Cascade Valley
The major employment industries in Cascade Valley include Educational Services (371 | 19.2%), Agriculture, Fishing & Hunting (359 | 18.6%), Manufacturing (197 | 10.2%), Health Care & Social Assistance (163 | 8.5%), and Construction (141 | 7.3%).
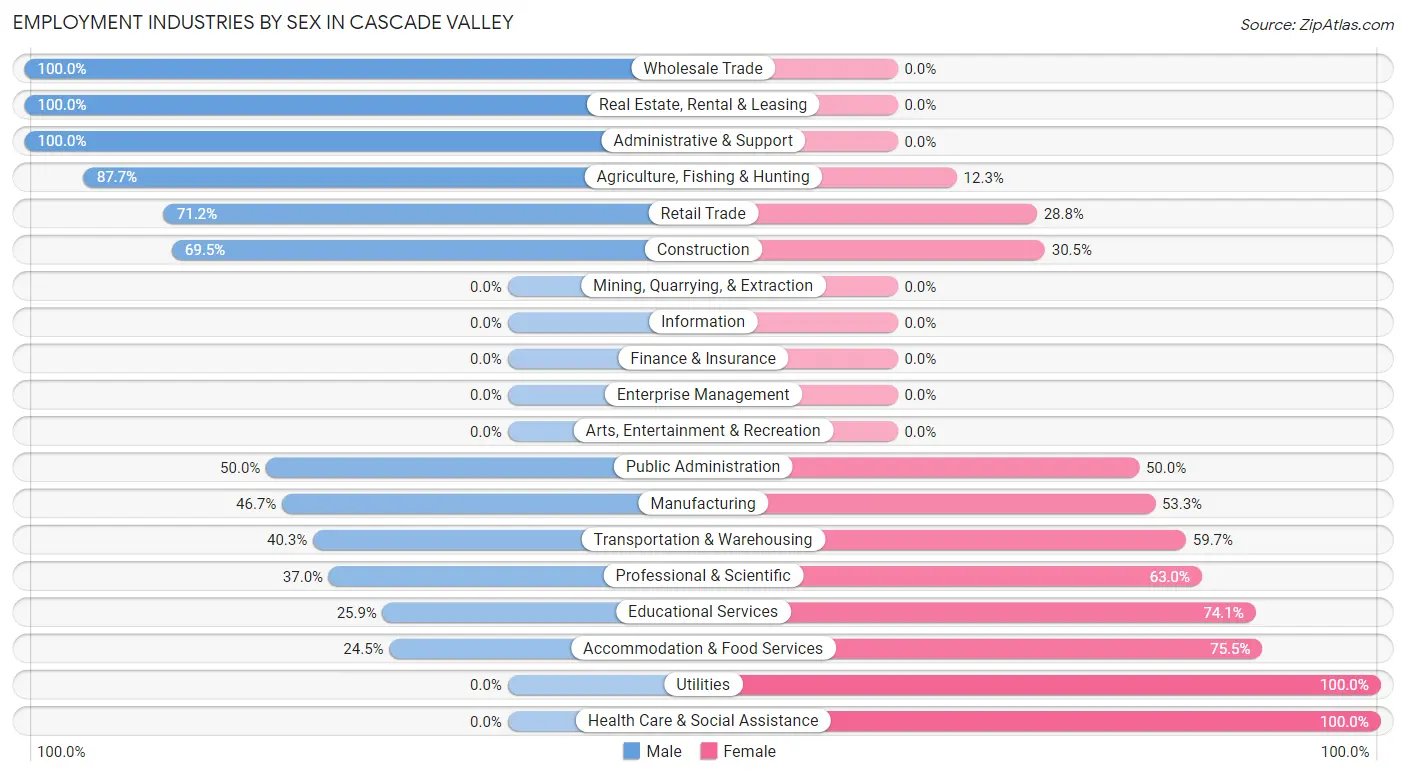
Employment Industries by Sex in Cascade Valley
The Cascade Valley industries that see more men than women are Wholesale Trade (100.0%), Real Estate, Rental & Leasing (100.0%), and Administrative & Support (100.0%), whereas the industries that tend to have a higher number of women are Utilities (100.0%), Health Care & Social Assistance (100.0%), and Accommodation & Food Services (75.5%).
| Industry | Male | Female |
| Agriculture, Fishing & Hunting | 315 (87.7%) | 44 (12.3%) |
| Mining, Quarrying, & Extraction | 0 (0.0%) | 0 (0.0%) |
| Construction | 98 (69.5%) | 43 (30.5%) |
| Manufacturing | 92 (46.7%) | 105 (53.3%) |
| Wholesale Trade | 36 (100.0%) | 0 (0.0%) |
| Retail Trade | 79 (71.2%) | 32 (28.8%) |
| Transportation & Warehousing | 54 (40.3%) | 80 (59.7%) |
| Utilities | 0 (0.0%) | 38 (100.0%) |
| Information | 0 (0.0%) | 0 (0.0%) |
| Finance & Insurance | 0 (0.0%) | 0 (0.0%) |
| Real Estate, Rental & Leasing | 26 (100.0%) | 0 (0.0%) |
| Professional & Scientific | 47 (37.0%) | 80 (63.0%) |
| Enterprise Management | 0 (0.0%) | 0 (0.0%) |
| Administrative & Support | 78 (100.0%) | 0 (0.0%) |
| Educational Services | 96 (25.9%) | 275 (74.1%) |
| Health Care & Social Assistance | 0 (0.0%) | 163 (100.0%) |
| Arts, Entertainment & Recreation | 0 (0.0%) | 0 (0.0%) |
| Accommodation & Food Services | 24 (24.5%) | 74 (75.5%) |
| Public Administration | 25 (50.0%) | 25 (50.0%) |
| Total | 970 (50.3%) | 959 (49.7%) |
Education in Cascade Valley
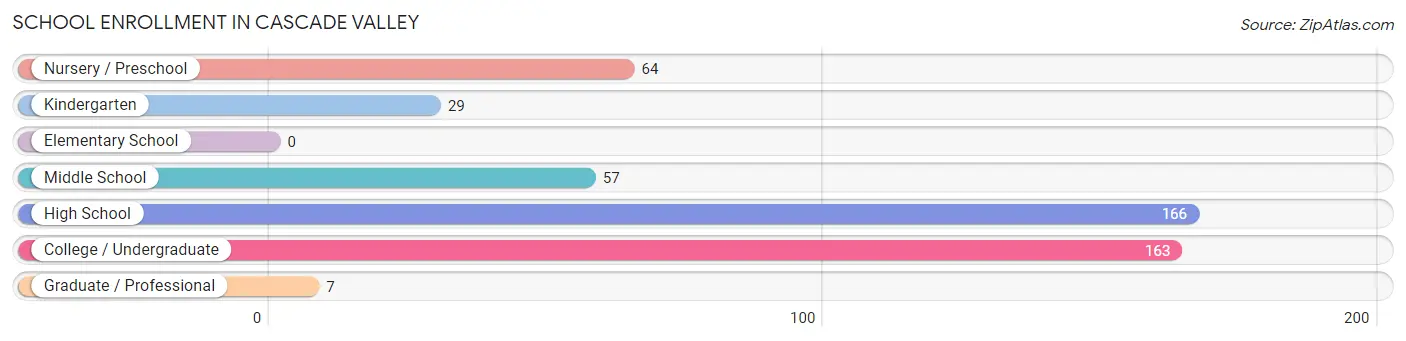
School Enrollment in Cascade Valley
The most common levels of schooling among the 486 students in Cascade Valley are high school (166 | 34.2%), college / undergraduate (163 | 33.5%), and nursery / preschool (64 | 13.2%).
| School Level | # Students | % Students |
| Nursery / Preschool | 64 | 13.2% |
| Kindergarten | 29 | 6.0% |
| Elementary School | 0 | 0.0% |
| Middle School | 57 | 11.7% |
| High School | 166 | 34.2% |
| College / Undergraduate | 163 | 33.5% |
| Graduate / Professional | 7 | 1.4% |
| Total | 486 | 100.0% |
School Enrollment by Age by Funding Source in Cascade Valley
Out of a total of 486 students who are enrolled in schools in Cascade Valley, 16 (3.3%) attend a private institution, while the remaining 470 (96.7%) are enrolled in public schools. The age group of 15 to 17 year olds has the highest likelihood of being enrolled in private schools, with 16 (16.3% in the age bracket) enrolled. Conversely, the age group of 3 to 4 year olds has the lowest likelihood of being enrolled in a private school, with 64 (100.0% in the age bracket) attending a public institution.
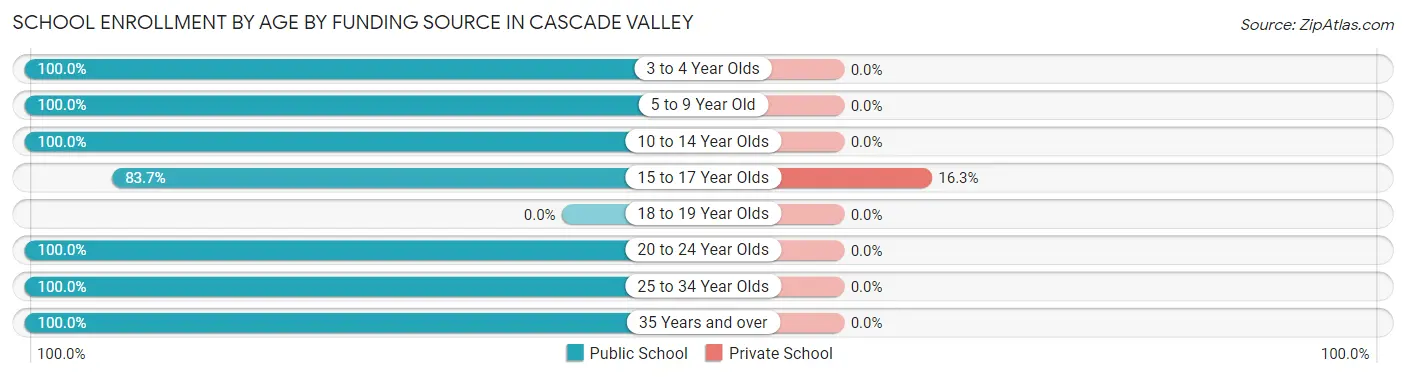
| Age Bracket | Public School | Private School |
| 3 to 4 Year Olds | 64 (100.0%) | 0 (0.0%) |
| 5 to 9 Year Old | 29 (100.0%) | 0 (0.0%) |
| 10 to 14 Year Olds | 92 (100.0%) | 0 (0.0%) |
| 15 to 17 Year Olds | 82 (83.7%) | 16 (16.3%) |
| 18 to 19 Year Olds | 0 (0.0%) | 0 (0.0%) |
| 20 to 24 Year Olds | 135 (100.0%) | 0 (0.0%) |
| 25 to 34 Year Olds | 61 (100.0%) | 0 (0.0%) |
| 35 Years and over | 7 (100.0%) | 0 (0.0%) |
| Total | 470 (96.7%) | 16 (3.3%) |
Educational Attainment by Field of Study in Cascade Valley
Education (78 | 19.4%), arts & humanities (72 | 17.9%), liberal arts & history (69 | 17.2%), psychology (50 | 12.4%), and social sciences (47 | 11.7%) are the most common fields of study among 402 individuals in Cascade Valley who have obtained a bachelor's degree or higher.
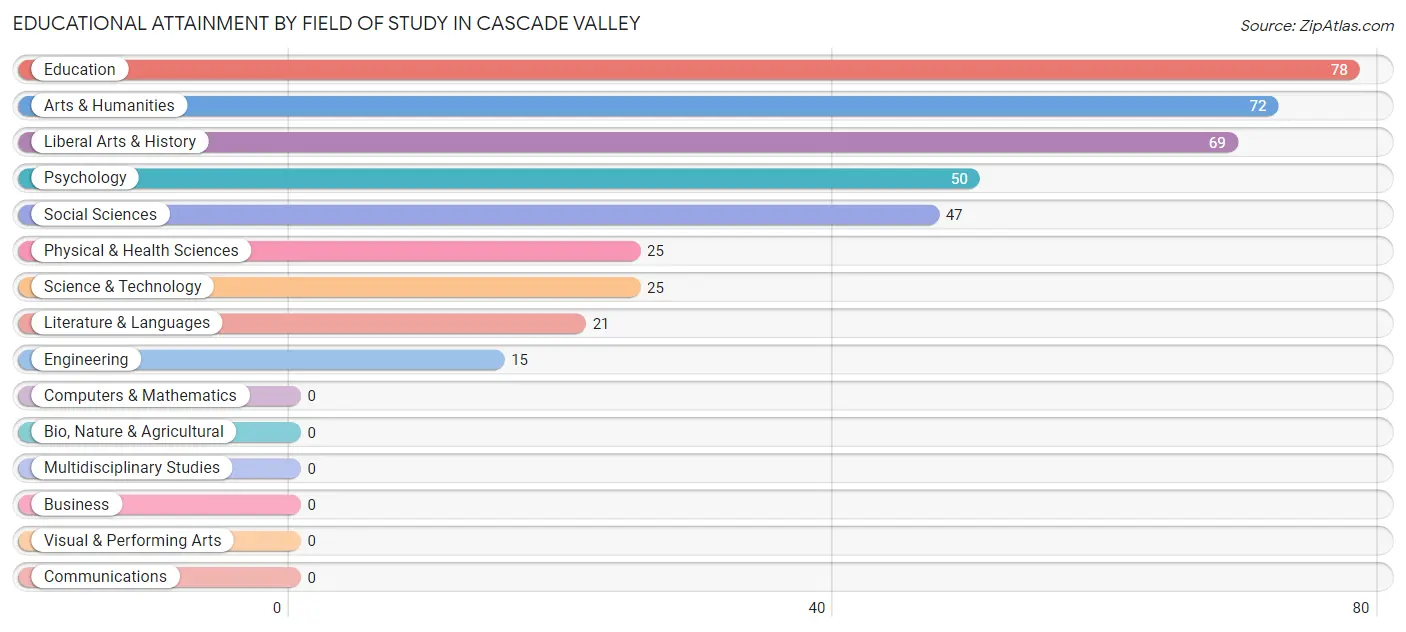
| Field of Study | # Graduates | % Graduates |
| Computers & Mathematics | 0 | 0.0% |
| Bio, Nature & Agricultural | 0 | 0.0% |
| Physical & Health Sciences | 25 | 6.2% |
| Psychology | 50 | 12.4% |
| Social Sciences | 47 | 11.7% |
| Engineering | 15 | 3.7% |
| Multidisciplinary Studies | 0 | 0.0% |
| Science & Technology | 25 | 6.2% |
| Business | 0 | 0.0% |
| Education | 78 | 19.4% |
| Literature & Languages | 21 | 5.2% |
| Liberal Arts & History | 69 | 17.2% |
| Visual & Performing Arts | 0 | 0.0% |
| Communications | 0 | 0.0% |
| Arts & Humanities | 72 | 17.9% |
| Total | 402 | 100.0% |
Transportation & Commute in Cascade Valley
Vehicle Availability by Sex in Cascade Valley
The most prevalent vehicle ownership categories in Cascade Valley are males with 2 vehicles (391, accounting for 40.4%) and females with 2 vehicles (373, making up 40.8%).
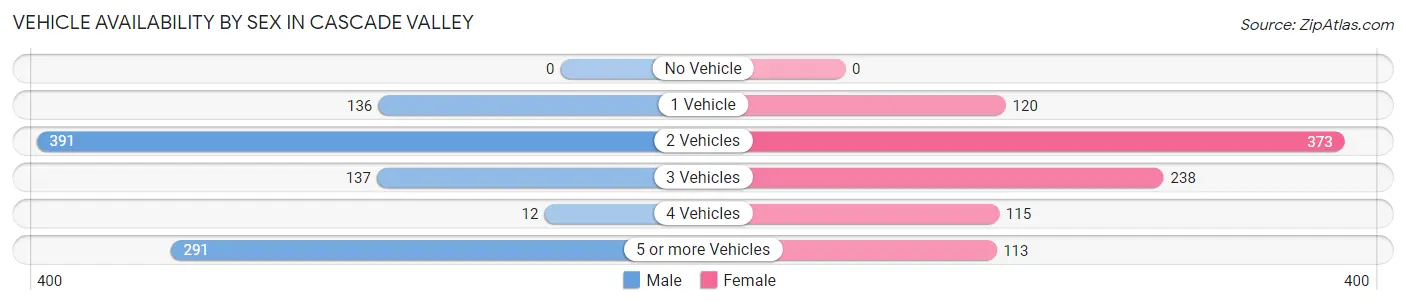
| Vehicles Available | Male | Female |
| No Vehicle | 0 (0.0%) | 0 (0.0%) |
| 1 Vehicle | 136 (14.1%) | 120 (12.5%) |
| 2 Vehicles | 391 (40.4%) | 373 (38.9%) |
| 3 Vehicles | 137 (14.2%) | 238 (24.8%) |
| 4 Vehicles | 12 (1.2%) | 115 (12.0%) |
| 5 or more Vehicles | 291 (30.1%) | 113 (11.8%) |
| Total | 967 (100.0%) | 959 (100.0%) |
Commute Time in Cascade Valley
The most frequently occuring commute durations in Cascade Valley are 30 to 34 minutes (397 commuters, 23.1%), 15 to 19 minutes (385 commuters, 22.4%), and 10 to 14 minutes (331 commuters, 19.3%).
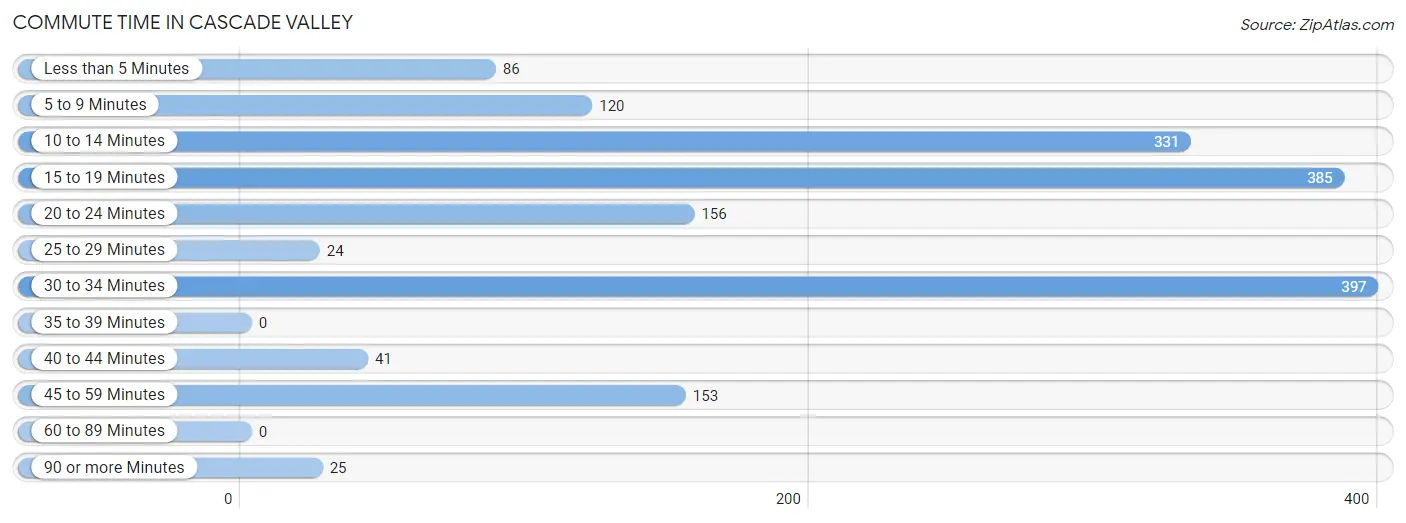
| Commute Time | # Commuters | % Commuters |
| Less than 5 Minutes | 86 | 5.0% |
| 5 to 9 Minutes | 120 | 7.0% |
| 10 to 14 Minutes | 331 | 19.3% |
| 15 to 19 Minutes | 385 | 22.4% |
| 20 to 24 Minutes | 156 | 9.1% |
| 25 to 29 Minutes | 24 | 1.4% |
| 30 to 34 Minutes | 397 | 23.1% |
| 35 to 39 Minutes | 0 | 0.0% |
| 40 to 44 Minutes | 41 | 2.4% |
| 45 to 59 Minutes | 153 | 8.9% |
| 60 to 89 Minutes | 0 | 0.0% |
| 90 or more Minutes | 25 | 1.5% |
Commute Time by Sex in Cascade Valley
The most common commute times in Cascade Valley are 30 to 34 minutes (283 commuters, 29.4%) for males and 10 to 14 minutes (207 commuters, 27.4%) for females.
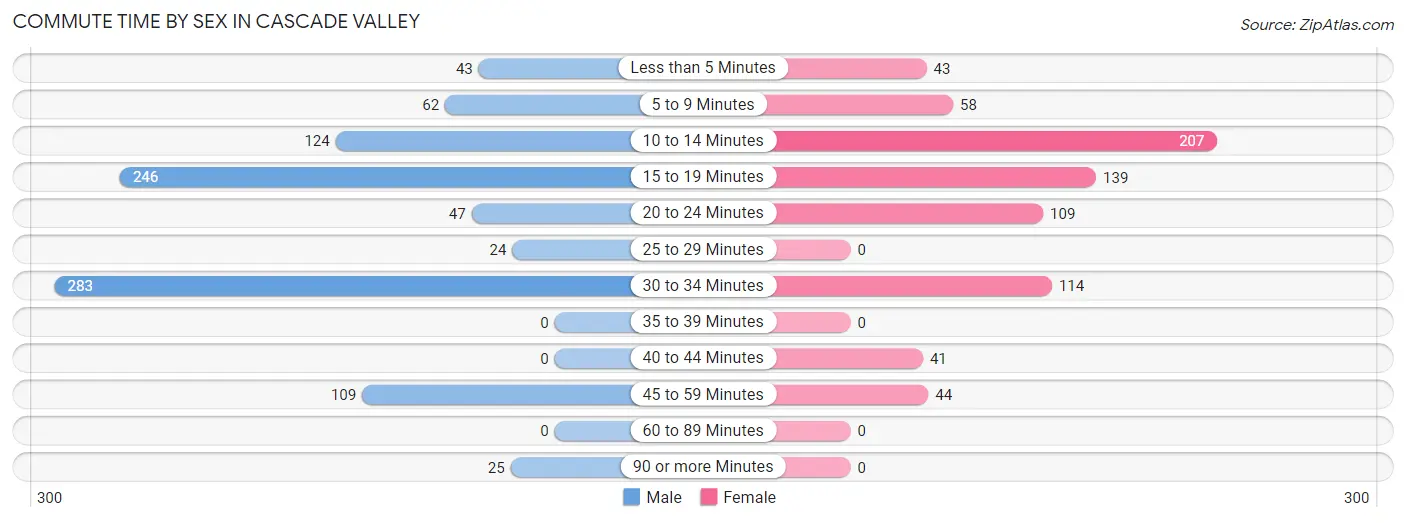
| Commute Time | Male | Female |
| Less than 5 Minutes | 43 (4.5%) | 43 (5.7%) |
| 5 to 9 Minutes | 62 (6.4%) | 58 (7.7%) |
| 10 to 14 Minutes | 124 (12.9%) | 207 (27.4%) |
| 15 to 19 Minutes | 246 (25.6%) | 139 (18.4%) |
| 20 to 24 Minutes | 47 (4.9%) | 109 (14.4%) |
| 25 to 29 Minutes | 24 (2.5%) | 0 (0.0%) |
| 30 to 34 Minutes | 283 (29.4%) | 114 (15.1%) |
| 35 to 39 Minutes | 0 (0.0%) | 0 (0.0%) |
| 40 to 44 Minutes | 0 (0.0%) | 41 (5.4%) |
| 45 to 59 Minutes | 109 (11.3%) | 44 (5.8%) |
| 60 to 89 Minutes | 0 (0.0%) | 0 (0.0%) |
| 90 or more Minutes | 25 (2.6%) | 0 (0.0%) |
Time of Departure to Work by Sex in Cascade Valley
The most frequent times of departure to work in Cascade Valley are 6:00 AM to 6:29 AM (334, 34.7%) for males and 9:00 AM to 9:59 AM (162, 21.5%) for females.
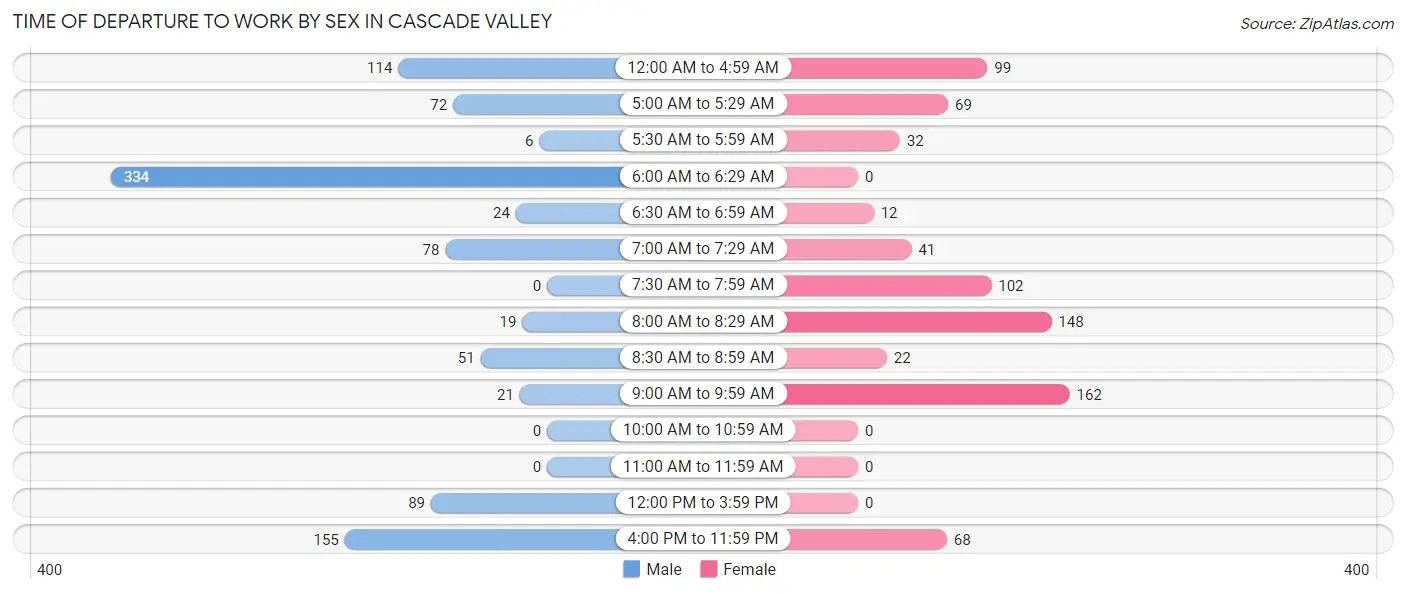
| Time of Departure | Male | Female |
| 12:00 AM to 4:59 AM | 114 (11.8%) | 99 (13.1%) |
| 5:00 AM to 5:29 AM | 72 (7.5%) | 69 (9.1%) |
| 5:30 AM to 5:59 AM | 6 (0.6%) | 32 (4.2%) |
| 6:00 AM to 6:29 AM | 334 (34.7%) | 0 (0.0%) |
| 6:30 AM to 6:59 AM | 24 (2.5%) | 12 (1.6%) |
| 7:00 AM to 7:29 AM | 78 (8.1%) | 41 (5.4%) |
| 7:30 AM to 7:59 AM | 0 (0.0%) | 102 (13.5%) |
| 8:00 AM to 8:29 AM | 19 (2.0%) | 148 (19.6%) |
| 8:30 AM to 8:59 AM | 51 (5.3%) | 22 (2.9%) |
| 9:00 AM to 9:59 AM | 21 (2.2%) | 162 (21.5%) |
| 10:00 AM to 10:59 AM | 0 (0.0%) | 0 (0.0%) |
| 11:00 AM to 11:59 AM | 0 (0.0%) | 0 (0.0%) |
| 12:00 PM to 3:59 PM | 89 (9.2%) | 0 (0.0%) |
| 4:00 PM to 11:59 PM | 155 (16.1%) | 68 (9.0%) |
| Total | 963 (100.0%) | 755 (100.0%) |
Housing Occupancy in Cascade Valley
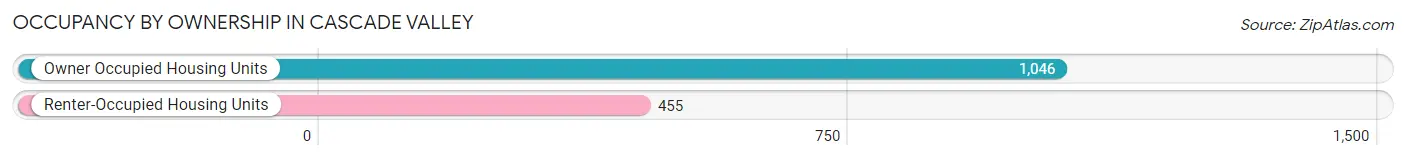
Occupancy by Ownership in Cascade Valley
Of the total 1,501 dwellings in Cascade Valley, owner-occupied units account for 1,046 (69.7%), while renter-occupied units make up 455 (30.3%).
| Occupancy | # Housing Units | % Housing Units |
| Owner Occupied Housing Units | 1,046 | 69.7% |
| Renter-Occupied Housing Units | 455 | 30.3% |
| Total Occupied Housing Units | 1,501 | 100.0% |
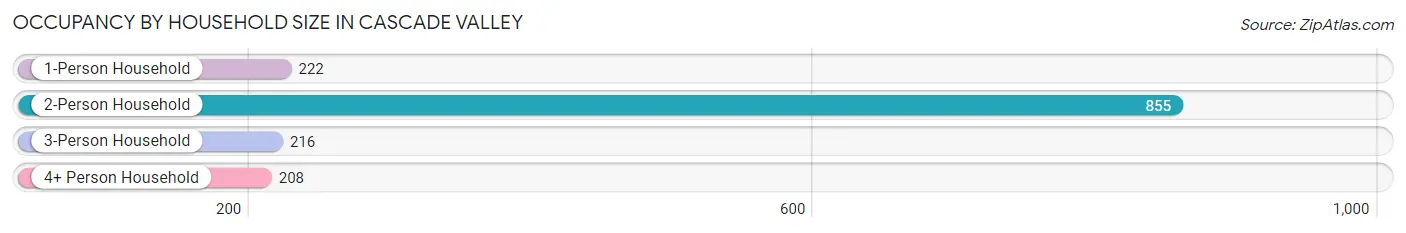
Occupancy by Household Size in Cascade Valley
| Household Size | # Housing Units | % Housing Units |
| 1-Person Household | 222 | 14.8% |
| 2-Person Household | 855 | 57.0% |
| 3-Person Household | 216 | 14.4% |
| 4+ Person Household | 208 | 13.9% |
| Total Housing Units | 1,501 | 100.0% |
Occupancy by Ownership by Household Size in Cascade Valley
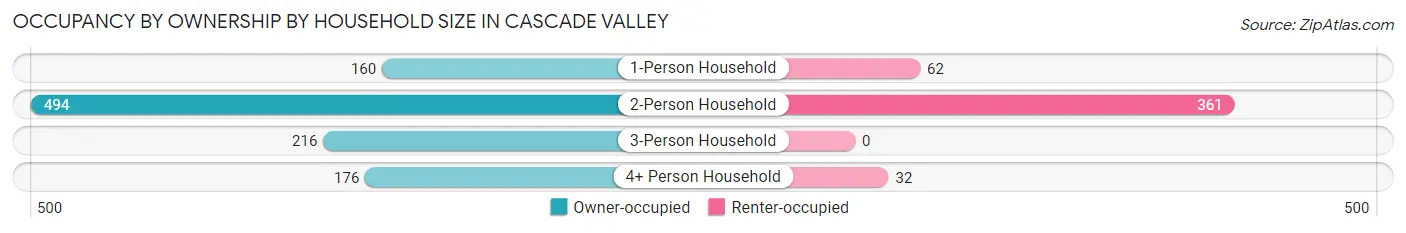
| Household Size | Owner-occupied | Renter-occupied |
| 1-Person Household | 160 (72.1%) | 62 (27.9%) |
| 2-Person Household | 494 (57.8%) | 361 (42.2%) |
| 3-Person Household | 216 (100.0%) | 0 (0.0%) |
| 4+ Person Household | 176 (84.6%) | 32 (15.4%) |
| Total Housing Units | 1,046 (69.7%) | 455 (30.3%) |
Occupancy by Educational Attainment in Cascade Valley
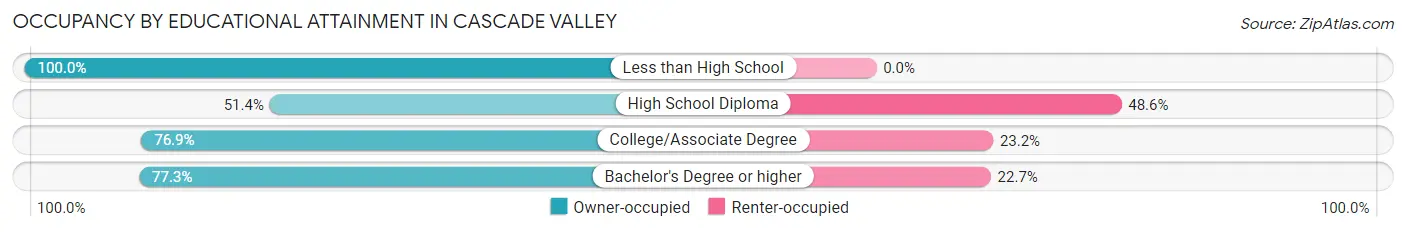
| Household Size | Owner-occupied | Renter-occupied |
| Less than High School | 200 (100.0%) | 0 (0.0%) |
| High School Diploma | 312 (51.4%) | 295 (48.6%) |
| College/Associate Degree | 425 (76.8%) | 128 (23.2%) |
| Bachelor's Degree or higher | 109 (77.3%) | 32 (22.7%) |
Occupancy by Age of Householder in Cascade Valley
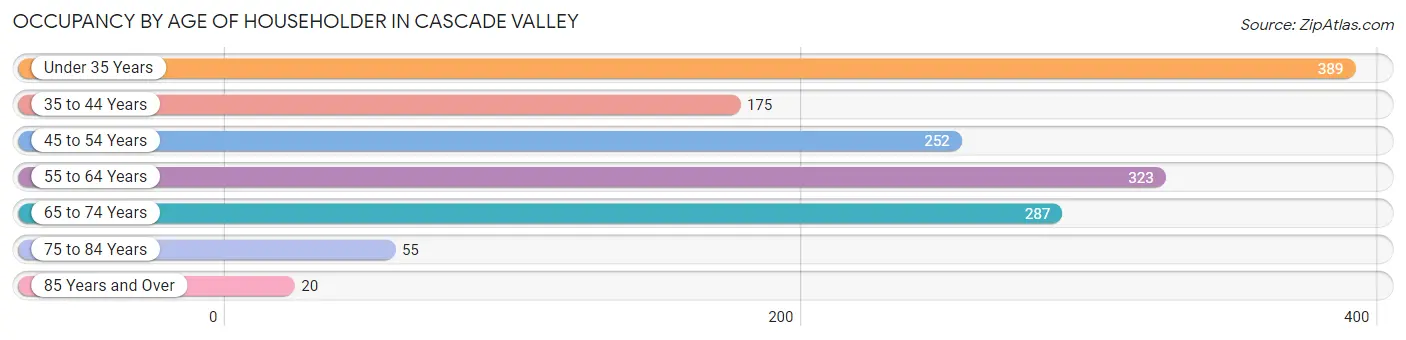
| Age Bracket | # Households | % Households |
| Under 35 Years | 389 | 25.9% |
| 35 to 44 Years | 175 | 11.7% |
| 45 to 54 Years | 252 | 16.8% |
| 55 to 64 Years | 323 | 21.5% |
| 65 to 74 Years | 287 | 19.1% |
| 75 to 84 Years | 55 | 3.7% |
| 85 Years and Over | 20 | 1.3% |
| Total | 1,501 | 100.0% |
Housing Finances in Cascade Valley
Median Income by Occupancy in Cascade Valley
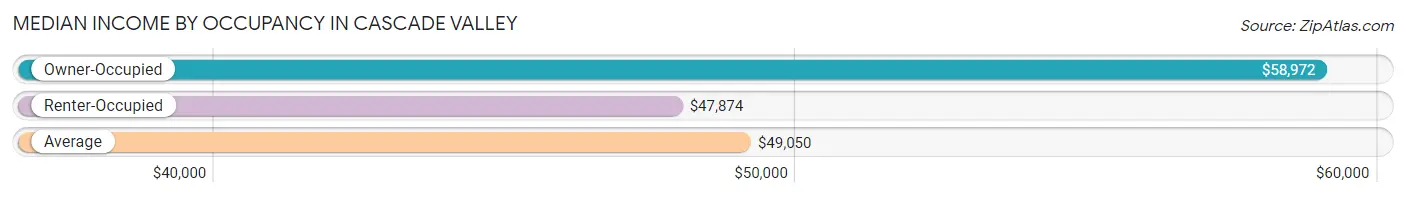
| Occupancy Type | # Households | Median Income |
| Owner-Occupied | 1,046 (69.7%) | $58,972 |
| Renter-Occupied | 455 (30.3%) | $47,874 |
| Average | 1,501 (100.0%) | $49,050 |
Occupancy by Householder Income Bracket in Cascade Valley
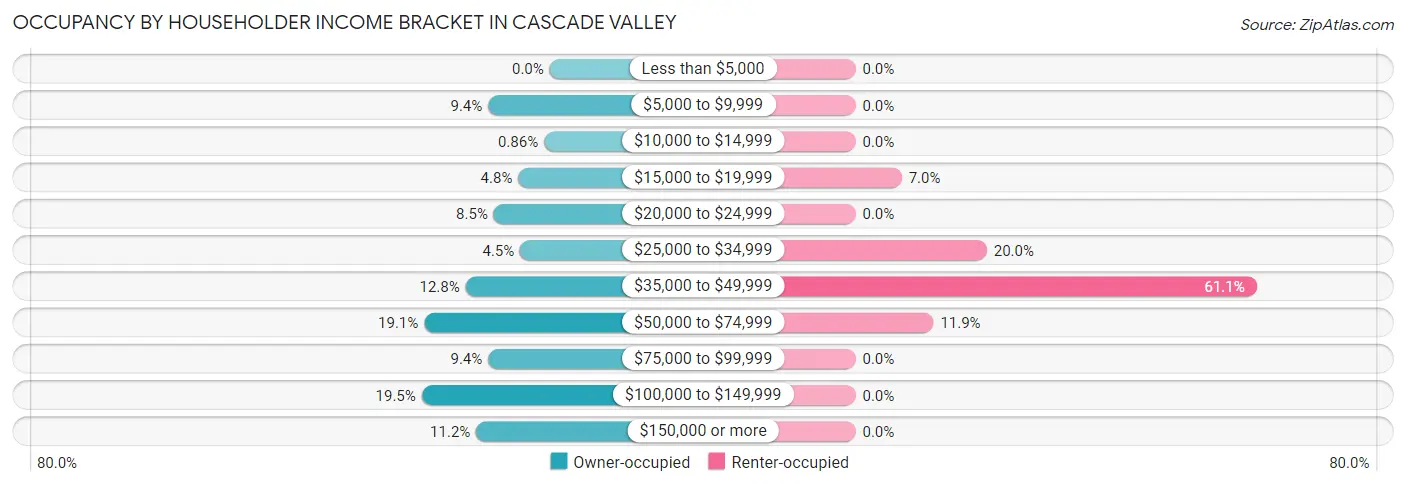
| Income Bracket | Owner-occupied | Renter-occupied |
| Less than $5,000 | 0 (0.0%) | 0 (0.0%) |
| $5,000 to $9,999 | 98 (9.4%) | 0 (0.0%) |
| $10,000 to $14,999 | 9 (0.9%) | 0 (0.0%) |
| $15,000 to $19,999 | 50 (4.8%) | 32 (7.0%) |
| $20,000 to $24,999 | 89 (8.5%) | 0 (0.0%) |
| $25,000 to $34,999 | 47 (4.5%) | 91 (20.0%) |
| $35,000 to $49,999 | 134 (12.8%) | 278 (61.1%) |
| $50,000 to $74,999 | 200 (19.1%) | 54 (11.9%) |
| $75,000 to $99,999 | 98 (9.4%) | 0 (0.0%) |
| $100,000 to $149,999 | 204 (19.5%) | 0 (0.0%) |
| $150,000 or more | 117 (11.2%) | 0 (0.0%) |
| Total | 1,046 (100.0%) | 455 (100.0%) |
Monthly Housing Cost Tiers in Cascade Valley
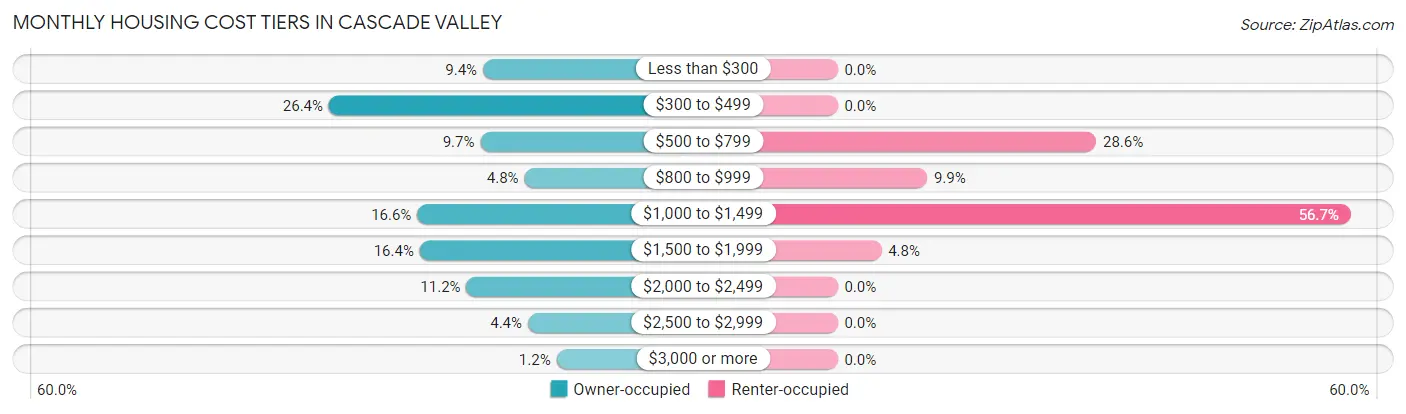
| Monthly Cost | Owner-occupied | Renter-occupied |
| Less than $300 | 98 (9.4%) | 0 (0.0%) |
| $300 to $499 | 276 (26.4%) | 0 (0.0%) |
| $500 to $799 | 101 (9.7%) | 130 (28.6%) |
| $800 to $999 | 50 (4.8%) | 45 (9.9%) |
| $1,000 to $1,499 | 174 (16.6%) | 258 (56.7%) |
| $1,500 to $1,999 | 171 (16.4%) | 22 (4.8%) |
| $2,000 to $2,499 | 117 (11.2%) | 0 (0.0%) |
| $2,500 to $2,999 | 46 (4.4%) | 0 (0.0%) |
| $3,000 or more | 13 (1.2%) | 0 (0.0%) |
| Total | 1,046 (100.0%) | 455 (100.0%) |
Physical Housing Characteristics in Cascade Valley
Housing Structures in Cascade Valley
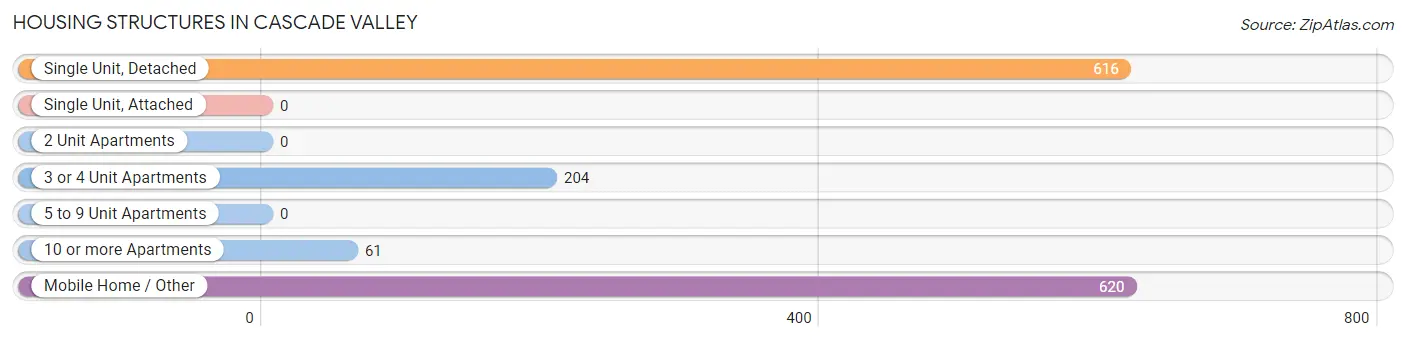
| Structure Type | # Housing Units | % Housing Units |
| Single Unit, Detached | 616 | 41.0% |
| Single Unit, Attached | 0 | 0.0% |
| 2 Unit Apartments | 0 | 0.0% |
| 3 or 4 Unit Apartments | 204 | 13.6% |
| 5 to 9 Unit Apartments | 0 | 0.0% |
| 10 or more Apartments | 61 | 4.1% |
| Mobile Home / Other | 620 | 41.3% |
| Total | 1,501 | 100.0% |
Housing Structures by Occupancy in Cascade Valley
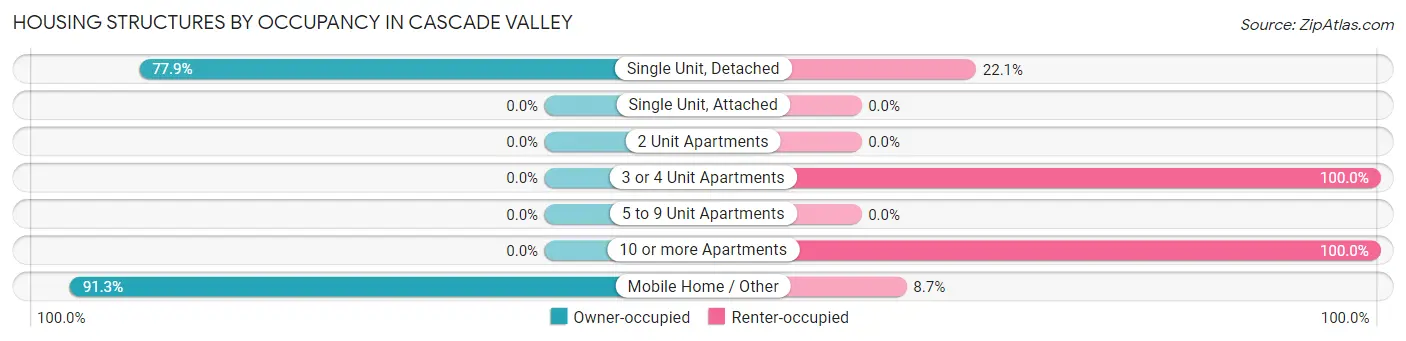
| Structure Type | Owner-occupied | Renter-occupied |
| Single Unit, Detached | 480 (77.9%) | 136 (22.1%) |
| Single Unit, Attached | 0 (0.0%) | 0 (0.0%) |
| 2 Unit Apartments | 0 (0.0%) | 0 (0.0%) |
| 3 or 4 Unit Apartments | 0 (0.0%) | 204 (100.0%) |
| 5 to 9 Unit Apartments | 0 (0.0%) | 0 (0.0%) |
| 10 or more Apartments | 0 (0.0%) | 61 (100.0%) |
| Mobile Home / Other | 566 (91.3%) | 54 (8.7%) |
| Total | 1,046 (69.7%) | 455 (30.3%) |
Housing Structures by Number of Rooms in Cascade Valley
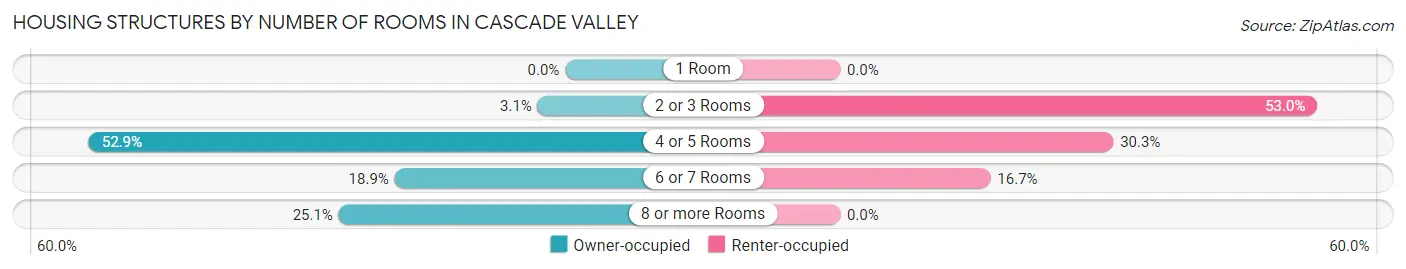
| Number of Rooms | Owner-occupied | Renter-occupied |
| 1 Room | 0 (0.0%) | 0 (0.0%) |
| 2 or 3 Rooms | 32 (3.1%) | 241 (53.0%) |
| 4 or 5 Rooms | 553 (52.9%) | 138 (30.3%) |
| 6 or 7 Rooms | 198 (18.9%) | 76 (16.7%) |
| 8 or more Rooms | 263 (25.1%) | 0 (0.0%) |
| Total | 1,046 (100.0%) | 455 (100.0%) |
Housing Structure by Heating Type in Cascade Valley
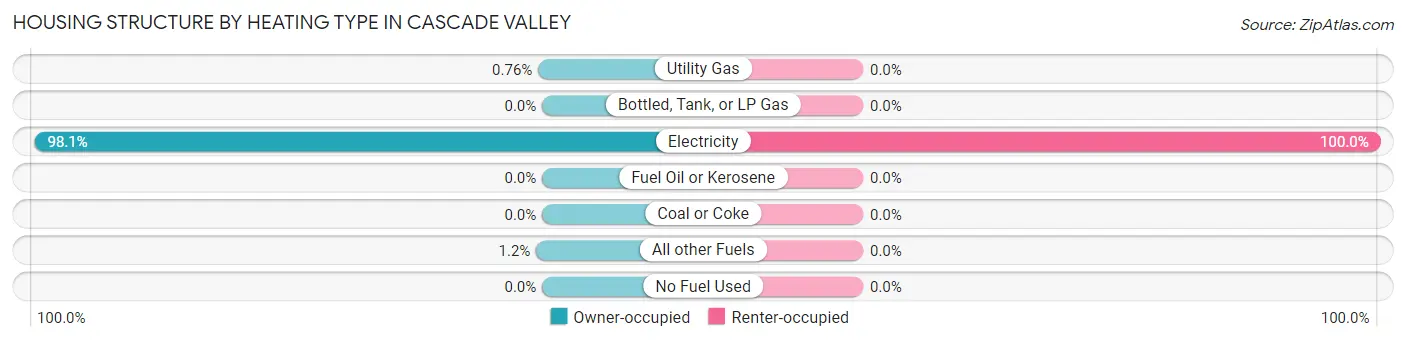
| Heating Type | Owner-occupied | Renter-occupied |
| Utility Gas | 8 (0.8%) | 0 (0.0%) |
| Bottled, Tank, or LP Gas | 0 (0.0%) | 0 (0.0%) |
| Electricity | 1,026 (98.1%) | 455 (100.0%) |
| Fuel Oil or Kerosene | 0 (0.0%) | 0 (0.0%) |
| Coal or Coke | 0 (0.0%) | 0 (0.0%) |
| All other Fuels | 12 (1.1%) | 0 (0.0%) |
| No Fuel Used | 0 (0.0%) | 0 (0.0%) |
| Total | 1,046 (100.0%) | 455 (100.0%) |
Household Vehicle Usage in Cascade Valley
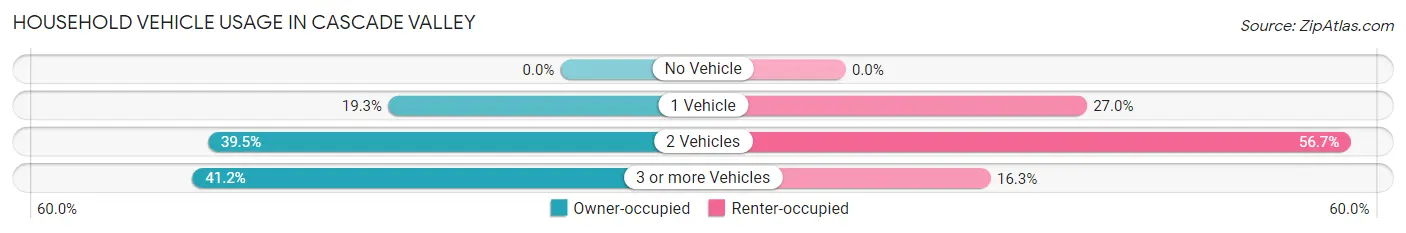
| Vehicles per Household | Owner-occupied | Renter-occupied |
| No Vehicle | 0 (0.0%) | 0 (0.0%) |
| 1 Vehicle | 202 (19.3%) | 123 (27.0%) |
| 2 Vehicles | 413 (39.5%) | 258 (56.7%) |
| 3 or more Vehicles | 431 (41.2%) | 74 (16.3%) |
| Total | 1,046 (100.0%) | 455 (100.0%) |
Real Estate & Mortgages in Cascade Valley
Real Estate and Mortgage Overview in Cascade Valley
| Characteristic | Without Mortgage | With Mortgage |
| Housing Units | 573 | 473 |
| Median Property Value | - | - |
| Median Household Income | - | - |
| Monthly Housing Costs | $458 | $13 |
| Real Estate Taxes | $498 | $80 |
Property Value by Mortgage Status in Cascade Valley
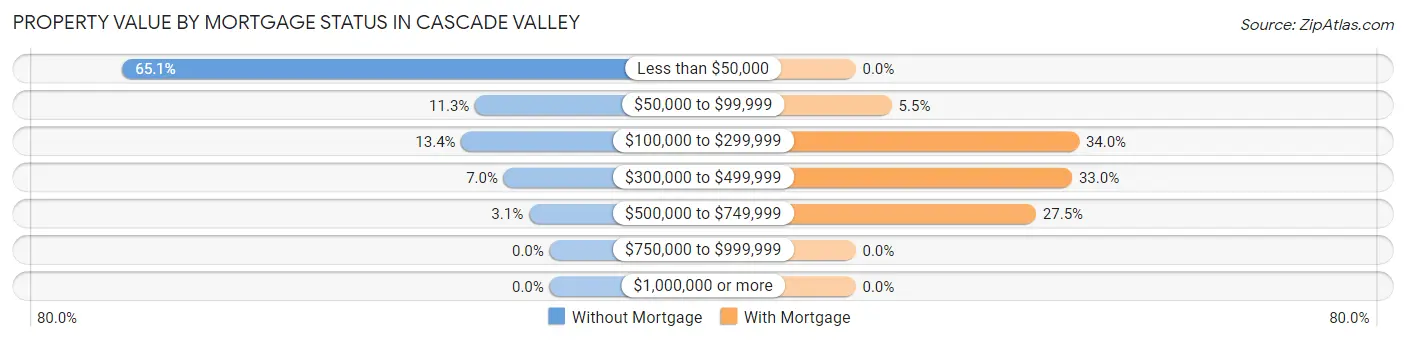
| Property Value | Without Mortgage | With Mortgage |
| Less than $50,000 | 373 (65.1%) | 0 (0.0%) |
| $50,000 to $99,999 | 65 (11.3%) | 26 (5.5%) |
| $100,000 to $299,999 | 77 (13.4%) | 161 (34.0%) |
| $300,000 to $499,999 | 40 (7.0%) | 156 (33.0%) |
| $500,000 to $749,999 | 18 (3.1%) | 130 (27.5%) |
| $750,000 to $999,999 | 0 (0.0%) | 0 (0.0%) |
| $1,000,000 or more | 0 (0.0%) | 0 (0.0%) |
| Total | 573 (100.0%) | 473 (100.0%) |
Household Income by Mortgage Status in Cascade Valley
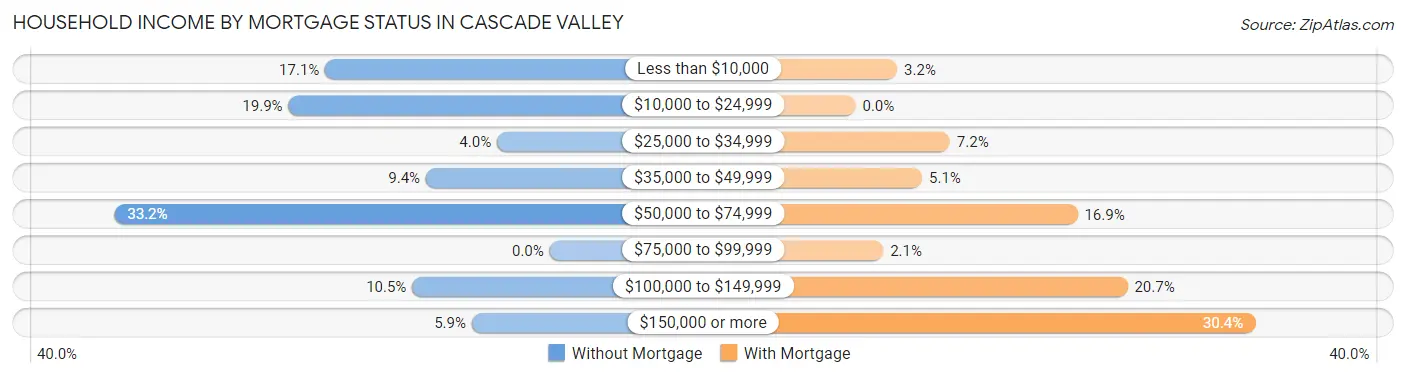
| Household Income | Without Mortgage | With Mortgage |
| Less than $10,000 | 98 (17.1%) | 15 (3.2%) |
| $10,000 to $24,999 | 114 (19.9%) | 0 (0.0%) |
| $25,000 to $34,999 | 23 (4.0%) | 34 (7.2%) |
| $35,000 to $49,999 | 54 (9.4%) | 24 (5.1%) |
| $50,000 to $74,999 | 190 (33.2%) | 80 (16.9%) |
| $75,000 to $99,999 | 0 (0.0%) | 10 (2.1%) |
| $100,000 to $149,999 | 60 (10.5%) | 98 (20.7%) |
| $150,000 or more | 34 (5.9%) | 144 (30.4%) |
| Total | 573 (100.0%) | 473 (100.0%) |
Property Value to Household Income Ratio in Cascade Valley
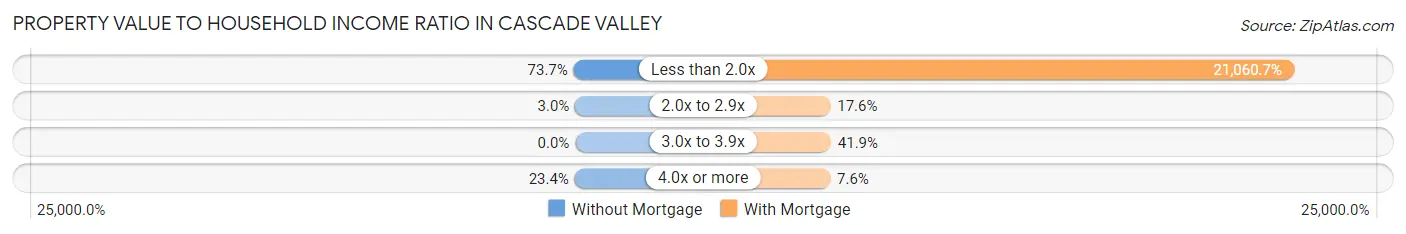
| Value-to-Income Ratio | Without Mortgage | With Mortgage |
| Less than 2.0x | 422 (73.7%) | 99,617 (21,060.7%) |
| 2.0x to 2.9x | 17 (3.0%) | 83 (17.5%) |
| 3.0x to 3.9x | 0 (0.0%) | 198 (41.9%) |
| 4.0x or more | 134 (23.4%) | 36 (7.6%) |
| Total | 573 (100.0%) | 473 (100.0%) |
Real Estate Taxes by Mortgage Status in Cascade Valley
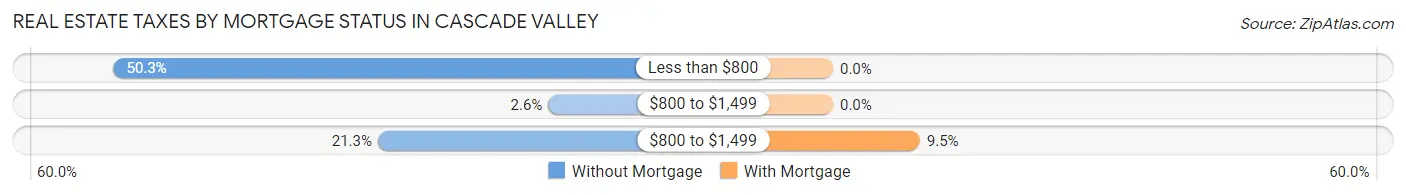
| Property Taxes | Without Mortgage | With Mortgage |
| Less than $800 | 288 (50.3%) | 0 (0.0%) |
| $800 to $1,499 | 15 (2.6%) | 0 (0.0%) |
| $800 to $1,499 | 122 (21.3%) | 45 (9.5%) |
| Total | 573 (100.0%) | 473 (100.0%) |
Health & Disability in Cascade Valley
Health Insurance Coverage by Age in Cascade Valley
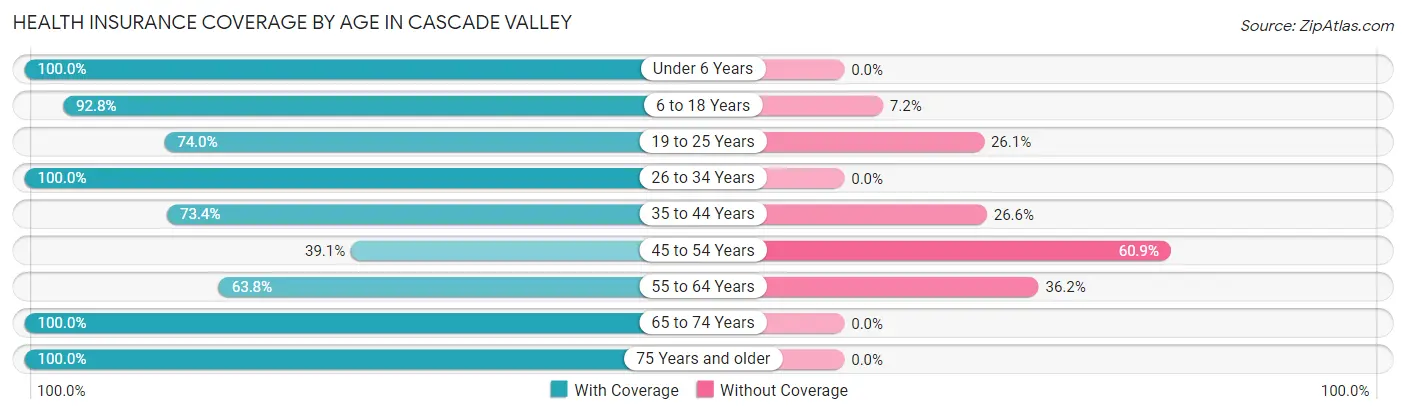
| Age Bracket | With Coverage | Without Coverage |
| Under 6 Years | 99 (100.0%) | 0 (0.0%) |
| 6 to 18 Years | 219 (92.8%) | 17 (7.2%) |
| 19 to 25 Years | 565 (74.0%) | 199 (26.1%) |
| 26 to 34 Years | 187 (100.0%) | 0 (0.0%) |
| 35 to 44 Years | 257 (73.4%) | 93 (26.6%) |
| 45 to 54 Years | 313 (39.1%) | 487 (60.9%) |
| 55 to 64 Years | 359 (63.8%) | 204 (36.2%) |
| 65 to 74 Years | 339 (100.0%) | 0 (0.0%) |
| 75 Years and older | 119 (100.0%) | 0 (0.0%) |
| Total | 2,457 (71.1%) | 1,000 (28.9%) |
Health Insurance Coverage by Citizenship Status in Cascade Valley
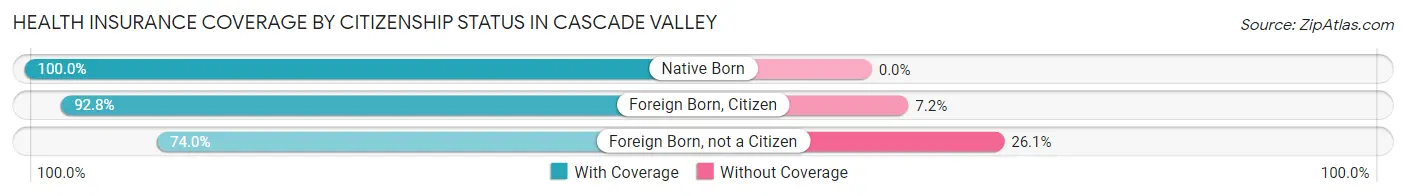
| Citizenship Status | With Coverage | Without Coverage |
| Native Born | 99 (100.0%) | 0 (0.0%) |
| Foreign Born, Citizen | 219 (92.8%) | 17 (7.2%) |
| Foreign Born, not a Citizen | 565 (74.0%) | 199 (26.1%) |
Health Insurance Coverage by Household Income in Cascade Valley
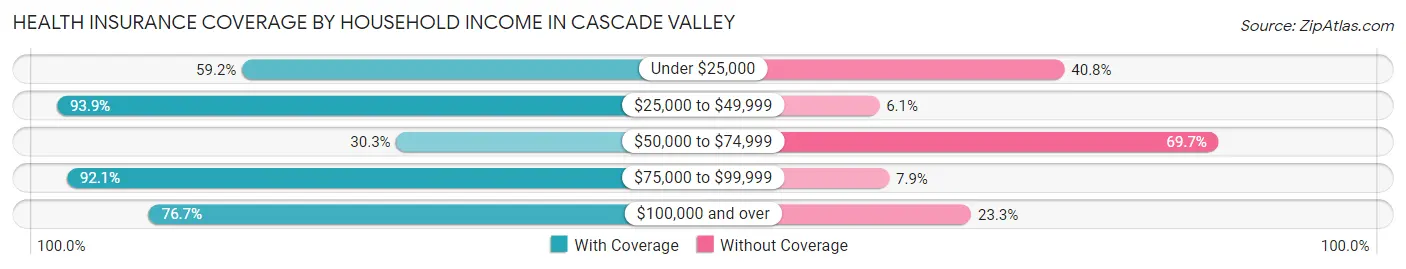
| Household Income | With Coverage | Without Coverage |
| Under $25,000 | 279 (59.2%) | 192 (40.8%) |
| $25,000 to $49,999 | 836 (93.9%) | 54 (6.1%) |
| $50,000 to $74,999 | 203 (30.3%) | 466 (69.7%) |
| $75,000 to $99,999 | 279 (92.1%) | 24 (7.9%) |
| $100,000 and over | 860 (76.7%) | 261 (23.3%) |
Public vs Private Health Insurance Coverage by Age in Cascade Valley
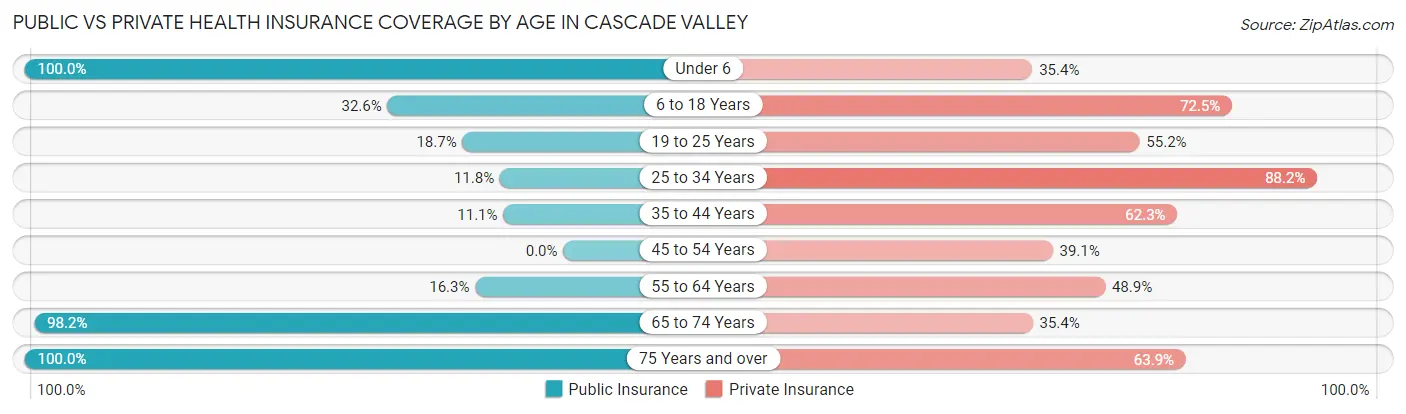
| Age Bracket | Public Insurance | Private Insurance |
| Under 6 | 99 (100.0%) | 35 (35.3%) |
| 6 to 18 Years | 77 (32.6%) | 171 (72.5%) |
| 19 to 25 Years | 143 (18.7%) | 422 (55.2%) |
| 25 to 34 Years | 22 (11.8%) | 165 (88.2%) |
| 35 to 44 Years | 39 (11.1%) | 218 (62.3%) |
| 45 to 54 Years | 0 (0.0%) | 313 (39.1%) |
| 55 to 64 Years | 92 (16.3%) | 275 (48.8%) |
| 65 to 74 Years | 333 (98.2%) | 120 (35.4%) |
| 75 Years and over | 119 (100.0%) | 76 (63.9%) |
| Total | 924 (26.7%) | 1,795 (51.9%) |
Disability Status by Sex by Age in Cascade Valley
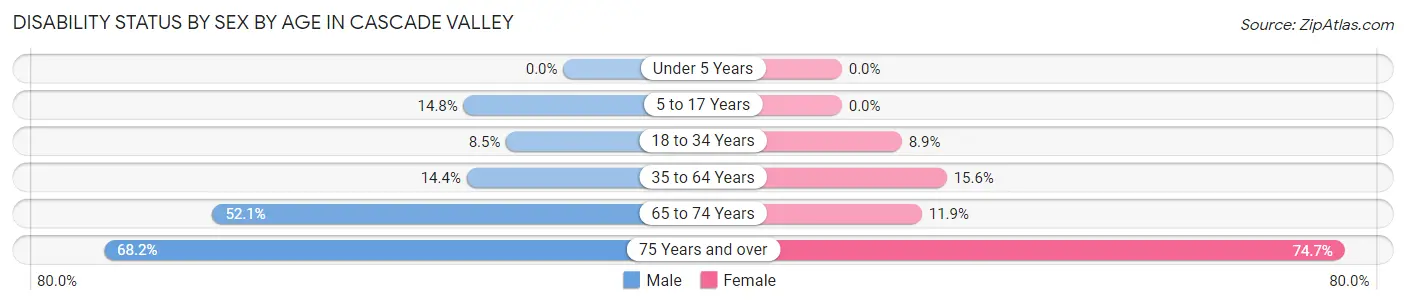
| Age Bracket | Male | Female |
| Under 5 Years | 0 (0.0%) | 0 (0.0%) |
| 5 to 17 Years | 16 (14.8%) | 0 (0.0%) |
| 18 to 34 Years | 42 (8.5%) | 42 (8.9%) |
| 35 to 64 Years | 127 (14.3%) | 129 (15.6%) |
| 65 to 74 Years | 124 (52.1%) | 12 (11.9%) |
| 75 Years and over | 30 (68.2%) | 56 (74.7%) |
Disability Class by Sex by Age in Cascade Valley
Disability Class: Hearing Difficulty
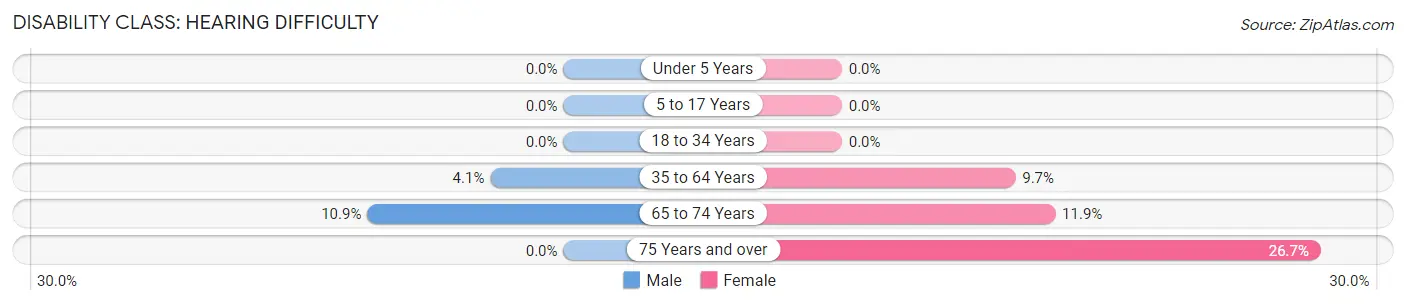
| Age Bracket | Male | Female |
| Under 5 Years | 0 (0.0%) | 0 (0.0%) |
| 5 to 17 Years | 0 (0.0%) | 0 (0.0%) |
| 18 to 34 Years | 0 (0.0%) | 0 (0.0%) |
| 35 to 64 Years | 36 (4.1%) | 80 (9.7%) |
| 65 to 74 Years | 26 (10.9%) | 12 (11.9%) |
| 75 Years and over | 0 (0.0%) | 20 (26.7%) |
Disability Class: Vision Difficulty
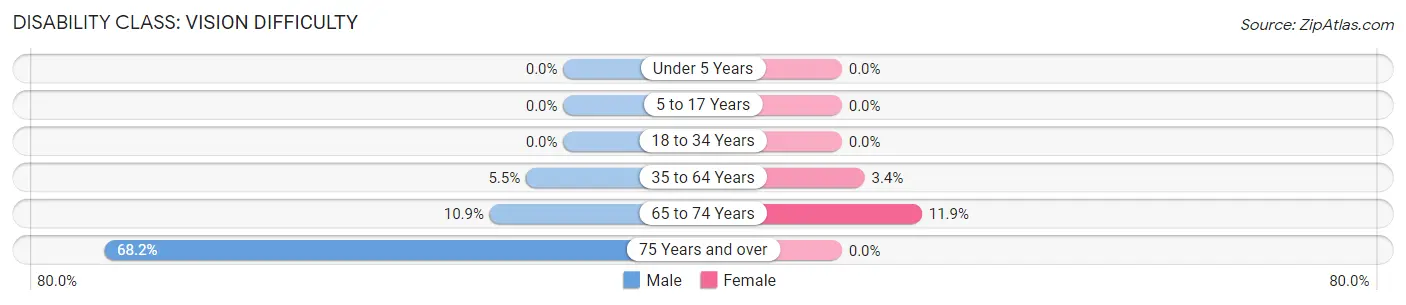
| Age Bracket | Male | Female |
| Under 5 Years | 0 (0.0%) | 0 (0.0%) |
| 5 to 17 Years | 0 (0.0%) | 0 (0.0%) |
| 18 to 34 Years | 0 (0.0%) | 0 (0.0%) |
| 35 to 64 Years | 49 (5.5%) | 28 (3.4%) |
| 65 to 74 Years | 26 (10.9%) | 12 (11.9%) |
| 75 Years and over | 30 (68.2%) | 0 (0.0%) |
Disability Class: Cognitive Difficulty
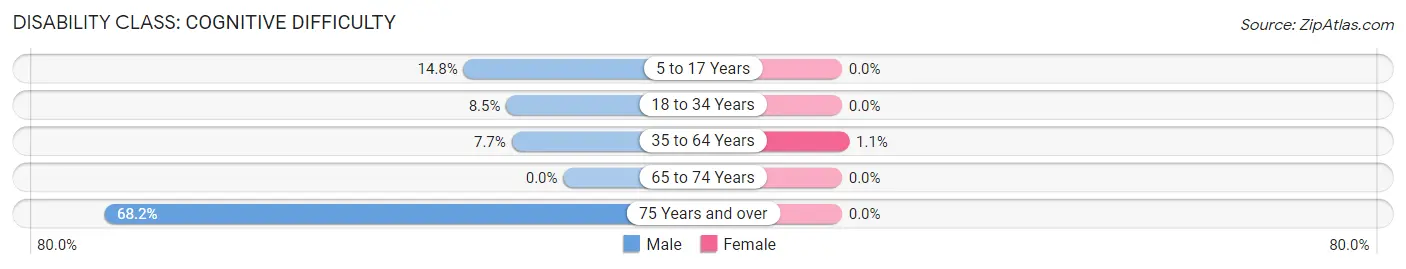
| Age Bracket | Male | Female |
| 5 to 17 Years | 16 (14.8%) | 0 (0.0%) |
| 18 to 34 Years | 42 (8.5%) | 0 (0.0%) |
| 35 to 64 Years | 68 (7.7%) | 9 (1.1%) |
| 65 to 74 Years | 0 (0.0%) | 0 (0.0%) |
| 75 Years and over | 30 (68.2%) | 0 (0.0%) |
Disability Class: Ambulatory Difficulty
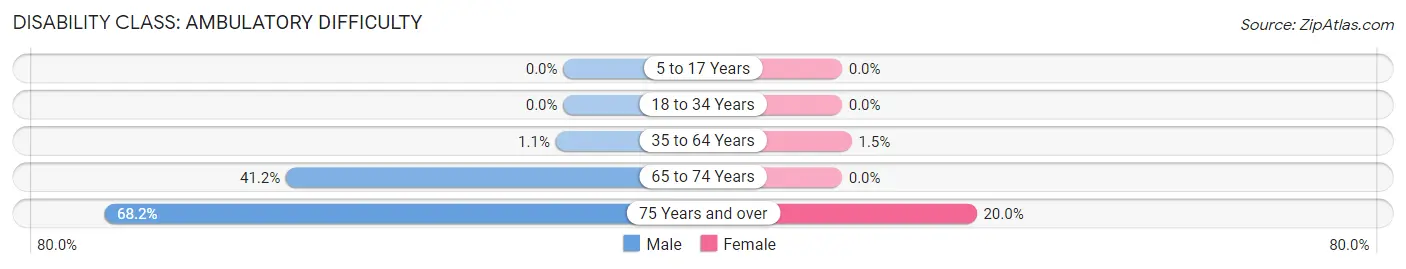
| Age Bracket | Male | Female |
| 5 to 17 Years | 0 (0.0%) | 0 (0.0%) |
| 18 to 34 Years | 0 (0.0%) | 0 (0.0%) |
| 35 to 64 Years | 10 (1.1%) | 12 (1.5%) |
| 65 to 74 Years | 98 (41.2%) | 0 (0.0%) |
| 75 Years and over | 30 (68.2%) | 15 (20.0%) |
Disability Class: Self-Care Difficulty
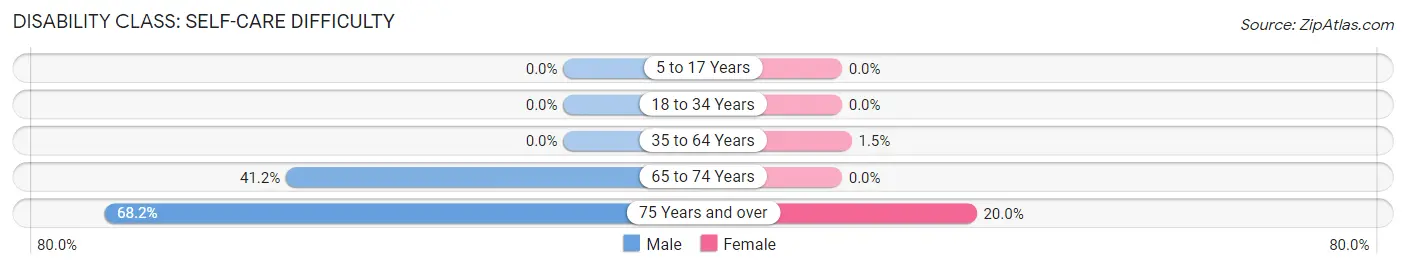
| Age Bracket | Male | Female |
| 5 to 17 Years | 0 (0.0%) | 0 (0.0%) |
| 18 to 34 Years | 0 (0.0%) | 0 (0.0%) |
| 35 to 64 Years | 0 (0.0%) | 12 (1.5%) |
| 65 to 74 Years | 98 (41.2%) | 0 (0.0%) |
| 75 Years and over | 30 (68.2%) | 15 (20.0%) |
Technology Access in Cascade Valley
Computing Device Access in Cascade Valley
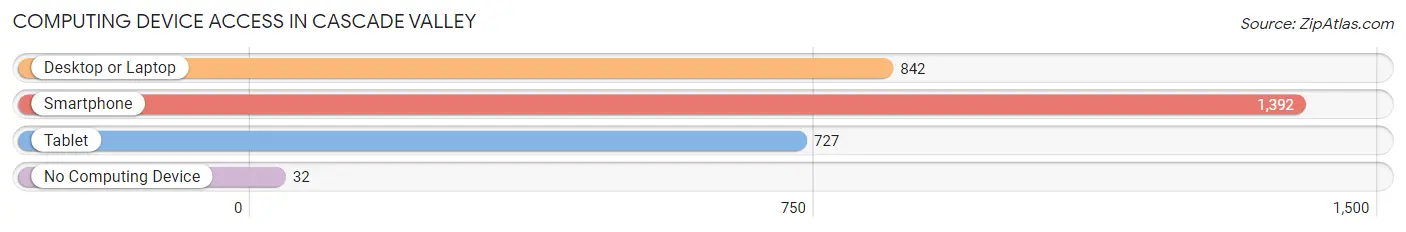
| Device Type | # Households | % Households |
| Desktop or Laptop | 842 | 56.1% |
| Smartphone | 1,392 | 92.7% |
| Tablet | 727 | 48.4% |
| No Computing Device | 32 | 2.1% |
| Total | 1,501 | 100.0% |
Internet Access in Cascade Valley
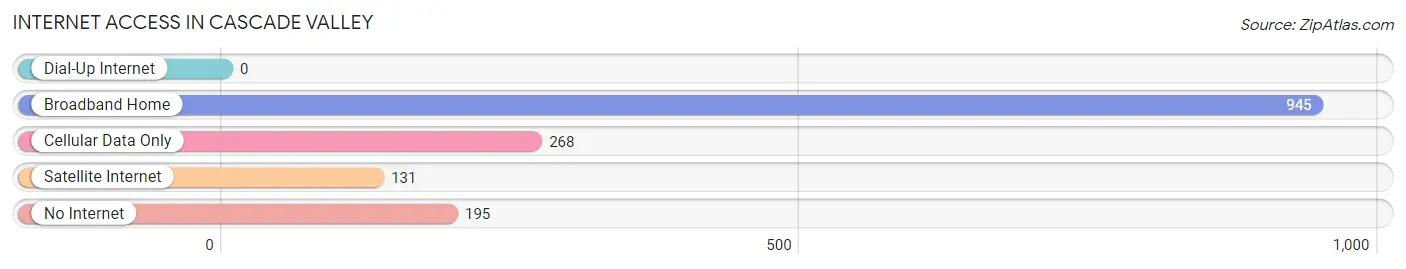
| Internet Type | # Households | % Households |
| Dial-Up Internet | 0 | 0.0% |
| Broadband Home | 945 | 63.0% |
| Cellular Data Only | 268 | 17.8% |
| Satellite Internet | 131 | 8.7% |
| No Internet | 195 | 13.0% |
| Total | 1,501 | 100.0% |
Cascade Valley Summary
Cascade Valley is a small town located in the Cascade Mountains of Washington State. It is situated in the foothills of the Cascade Range, approximately 30 miles east of Seattle. The town is surrounded by lush forests, rolling hills, and the majestic Cascade Mountains. The population of Cascade Valley is approximately 2,000 people, and the town is known for its small-town charm and friendly atmosphere.
Geography
Cascade Valley is located in the foothills of the Cascade Mountains, approximately 30 miles east of Seattle. The town is situated at an elevation of 1,000 feet, and is surrounded by lush forests, rolling hills, and the majestic Cascade Mountains. The town is located in the Snohomish County, and is part of the Seattle-Tacoma-Bellevue metropolitan area. The town is located near the Cascade River, which is a tributary of the Snoqualmie River.
The climate in Cascade Valley is mild and temperate, with warm summers and cool winters. The average annual temperature is around 50 degrees Fahrenheit, and the average annual precipitation is around 40 inches. The town is located in a temperate rainforest, and receives an average of 200 inches of rain per year.
Economy
Cascade Valley is a small town with a diverse economy. The town is home to a variety of businesses, including retail stores, restaurants, and professional services. The town is also home to a number of small manufacturing companies, which produce a variety of products, including furniture, clothing, and electronics.
The town is also home to a number of tourist attractions, including the Cascade Valley Museum, the Cascade Valley Historical Society, and the Cascade Valley Nature Center. The town is also home to a number of outdoor recreation opportunities, including hiking, camping, fishing, and skiing.
Demographics
As of the 2010 census, the population of Cascade Valley was 2,000 people. The town is predominantly white, with a population that is approximately 90% white. The town also has a small Hispanic population, which makes up approximately 5% of the population. The median household income in Cascade Valley is approximately $50,000, and the median home value is approximately $200,000.
Conclusion
Cascade Valley is a small town located in the Cascade Mountains of Washington State. The town is known for its small-town charm and friendly atmosphere, and is home to a variety of businesses, tourist attractions, and outdoor recreation opportunities. The population of Cascade Valley is predominantly white, with a small Hispanic population, and the median household income is approximately $50,000. Cascade Valley is a great place to live, work, and play, and is a great example of a small town in the Pacific Northwest.
Common Questions
What is the Total Population of Cascade Valley?
Total Population of Cascade Valley is 3,457.
What is the Total Male Population of Cascade Valley?
Total Male Population of Cascade Valley is 1,806.
What is the Total Female Population of Cascade Valley?
Total Female Population of Cascade Valley is 1,651.
What is the Ratio of Males per 100 Females in Cascade Valley?
There are 109.39 Males per 100 Females in Cascade Valley.
What is the Ratio of Females per 100 Males in Cascade Valley?
There are 91.42 Females per 100 Males in Cascade Valley.
What is the Median Population Age in Cascade Valley?
Median Population Age in Cascade Valley is 46.2 Years.
What is the Average Family Size in Cascade Valley
Average Family Size in Cascade Valley is 2.7 People.
What is the Average Household Size in Cascade Valley
Average Household Size in Cascade Valley is 2.3 People.
What is Per Capita Income in Cascade Valley?
Per Capita income in Cascade Valley is $29,239.
What is the Median Family Income in Cascade Valley?
Median Family Income in Cascade Valley is $59,164.
What is the Median Household income in Cascade Valley?
Median Household Income in Cascade Valley is $49,050.
What is Income or Wage Gap in Cascade Valley?
Income or Wage Gap in Cascade Valley is 21.5%.
Women in Cascade Valley earn 78.5 cents for every dollar earned by a man.
What is Family Income Deficit in Cascade Valley?
Family Income Deficit in Cascade Valley is $12,703.
Families that are below poverty line in Cascade Valley earn $12,703 less on average than the poverty threshold level.
What is Inequality or Gini Index in Cascade Valley?
Inequality or Gini Index in Cascade Valley is 0.41.
How Large is the Labor Force in Cascade Valley?
There are 2,211 People in the Labor Forcein in Cascade Valley.
What is the Percentage of People in the Labor Force in Cascade Valley?
68.3% of People are in the Labor Force in Cascade Valley.
What is the Unemployment Rate in Cascade Valley?
Unemployment Rate in Cascade Valley is 12.8%.