Wahkiakum County, WA
Wahkiakum County Map
Wahkiakum County Overview
4,476
TOTAL POPULATION
2,276
MALE POPULATION
2,200
FEMALE POPULATION
103.45
MALES / 100 FEMALES
96.66
FEMALES / 100 MALES
56.3
MEDIAN AGE
2.7
AVG FAMILY SIZE
2.3
AVG HOUSEHOLD SIZE
$31,643
PER CAPITA INCOME
$68,382
AVG FAMILY INCOME
$59,167
AVG HOUSEHOLD INCOME
64.7%
WAGE / INCOME GAP [ % ]
35.3¢/ $1
WAGE / INCOME GAP [ $ ]
0.43
INEQUALITY / GINI INDEX
1,606
LABOR FORCE [ PEOPLE ]
42.8%
PERCENT IN LABOR FORCE
3.2%
UNEMPLOYMENT RATE
Wahkiakum County Area Codes
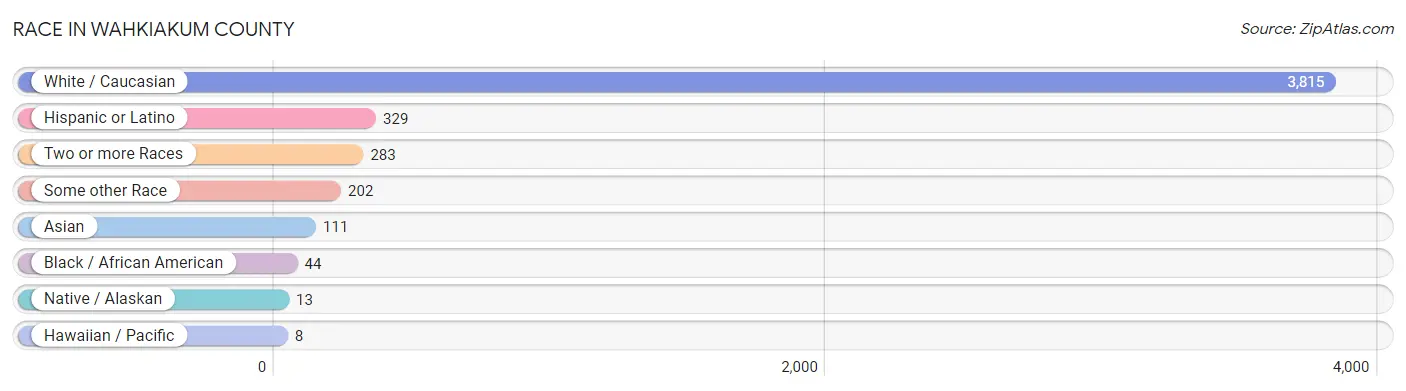
Race in Wahkiakum County
The most populous races in Wahkiakum County are White / Caucasian (3,815 | 85.2%), Hispanic or Latino (329 | 7.3%), and Two or more Races (283 | 6.3%).
| Race | # Population | % Population |
| Asian | 111 | 2.5% |
| Black / African American | 44 | 1.0% |
| Hawaiian / Pacific | 8 | 0.2% |
| Hispanic or Latino | 329 | 7.3% |
| Native / Alaskan | 13 | 0.3% |
| White / Caucasian | 3,815 | 85.2% |
| Two or more Races | 283 | 6.3% |
| Some other Race | 202 | 4.5% |
| Total | 4,476 | 100.0% |
Ancestry in Wahkiakum County
The most populous ancestries reported in Wahkiakum County are English (709 | 15.8%), German (532 | 11.9%), Irish (415 | 9.3%), American (313 | 7.0%), and Norwegian (259 | 5.8%), together accounting for 49.8% of all Wahkiakum County residents.

| Ancestry | # Population | % Population |
| American | 313 | 7.0% |
| Apache | 9 | 0.2% |
| Austrian | 4 | 0.1% |
| Bhutanese | 17 | 0.4% |
| Blackfeet | 12 | 0.3% |
| British | 28 | 0.6% |
| Burmese | 29 | 0.6% |
| Cherokee | 56 | 1.3% |
| Chippewa | 5 | 0.1% |
| Creek | 37 | 0.8% |
| Cuban | 56 | 1.3% |
| Czech | 10 | 0.2% |
| Danish | 11 | 0.3% |
| Dutch | 58 | 1.3% |
| Eastern European | 6 | 0.1% |
| English | 709 | 15.8% |
| Ethiopian | 14 | 0.3% |
| European | 81 | 1.8% |
| Finnish | 149 | 3.3% |
| French | 180 | 4.0% |
| French Canadian | 22 | 0.5% |
| German | 532 | 11.9% |
| Greek | 10 | 0.2% |
| Indian (Asian) | 88 | 2.0% |
| Irish | 415 | 9.3% |
| Italian | 120 | 2.7% |
| Korean | 26 | 0.6% |
| Mexican | 77 | 1.7% |
| Native Hawaiian | 52 | 1.2% |
| Northern European | 14 | 0.3% |
| Norwegian | 259 | 5.8% |
| Osage | 6 | 0.1% |
| Polish | 56 | 1.3% |
| Portuguese | 7 | 0.2% |
| Puerto Rican | 3 | 0.1% |
| Russian | 27 | 0.6% |
| Scandinavian | 101 | 2.3% |
| Scotch-Irish | 51 | 1.1% |
| Scottish | 160 | 3.6% |
| Seminole | 11 | 0.3% |
| Shoshone | 19 | 0.4% |
| South American | 150 | 3.4% |
| Spaniard | 43 | 1.0% |
| Subsaharan African | 14 | 0.3% |
| Swedish | 201 | 4.5% |
| Swiss | 45 | 1.0% |
| Venezuelan | 150 | 3.4% |
| Welsh | 109 | 2.4% | View All 48 Rows |
Immigrants in Wahkiakum County
The most numerous immigrant groups reported in Wahkiakum County came from Europe (63 | 1.4%), Asia (59 | 1.3%), Central America (57 | 1.3%), Latin America (57 | 1.3%), and Mexico (57 | 1.3%), together accounting for 6.5% of all Wahkiakum County residents.

| Immigration Origin | # Population | % Population |
| Africa | 14 | 0.3% |
| Asia | 59 | 1.3% |
| Canada | 4 | 0.1% |
| Central America | 57 | 1.3% |
| China | 7 | 0.2% |
| Eastern Africa | 14 | 0.3% |
| Eastern Asia | 49 | 1.1% |
| Ethiopia | 14 | 0.3% |
| Europe | 63 | 1.4% |
| Japan | 17 | 0.4% |
| Korea | 25 | 0.6% |
| Latin America | 57 | 1.3% |
| Mexico | 57 | 1.3% |
| Netherlands | 22 | 0.5% |
| Northern Europe | 41 | 0.9% |
| Norway | 5 | 0.1% |
| Philippines | 10 | 0.2% |
| Scotland | 2 | 0.0% |
| South Eastern Asia | 10 | 0.2% |
| Western Europe | 22 | 0.5% | View All 20 Rows |
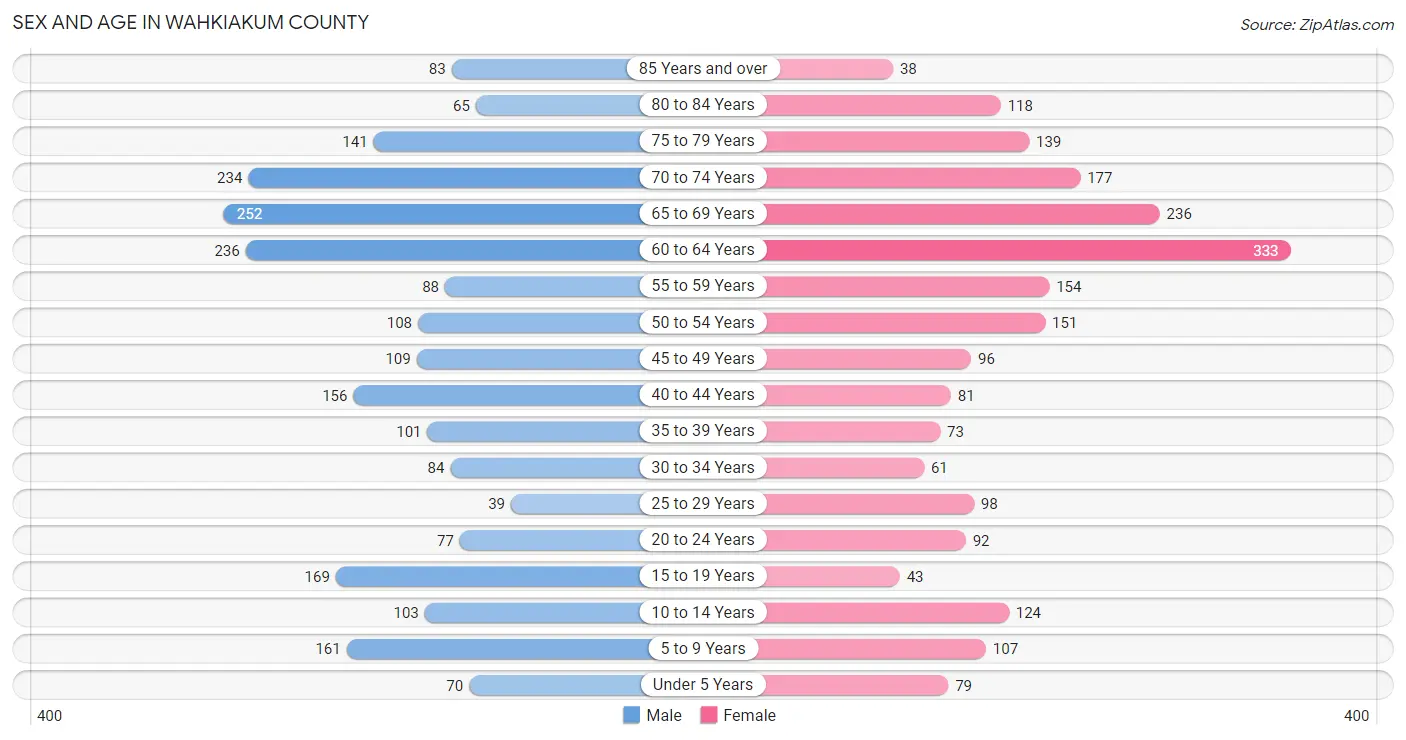
Sex and Age in Wahkiakum County
Sex and Age in Wahkiakum County
The most populous age groups in Wahkiakum County are 65 to 69 Years (252 | 11.1%) for men and 60 to 64 Years (333 | 15.1%) for women.
| Age Bracket | Male | Female |
| Under 5 Years | 70 (3.1%) | 79 (3.6%) |
| 5 to 9 Years | 161 (7.1%) | 107 (4.9%) |
| 10 to 14 Years | 103 (4.5%) | 124 (5.6%) |
| 15 to 19 Years | 169 (7.4%) | 43 (1.9%) |
| 20 to 24 Years | 77 (3.4%) | 92 (4.2%) |
| 25 to 29 Years | 39 (1.7%) | 98 (4.4%) |
| 30 to 34 Years | 84 (3.7%) | 61 (2.8%) |
| 35 to 39 Years | 101 (4.4%) | 73 (3.3%) |
| 40 to 44 Years | 156 (6.9%) | 81 (3.7%) |
| 45 to 49 Years | 109 (4.8%) | 96 (4.4%) |
| 50 to 54 Years | 108 (4.8%) | 151 (6.9%) |
| 55 to 59 Years | 88 (3.9%) | 154 (7.0%) |
| 60 to 64 Years | 236 (10.4%) | 333 (15.1%) |
| 65 to 69 Years | 252 (11.1%) | 236 (10.7%) |
| 70 to 74 Years | 234 (10.3%) | 177 (8.1%) |
| 75 to 79 Years | 141 (6.2%) | 139 (6.3%) |
| 80 to 84 Years | 65 (2.9%) | 118 (5.4%) |
| 85 Years and over | 83 (3.6%) | 38 (1.7%) |
| Total | 2,276 (100.0%) | 2,200 (100.0%) |
Families and Households in Wahkiakum County
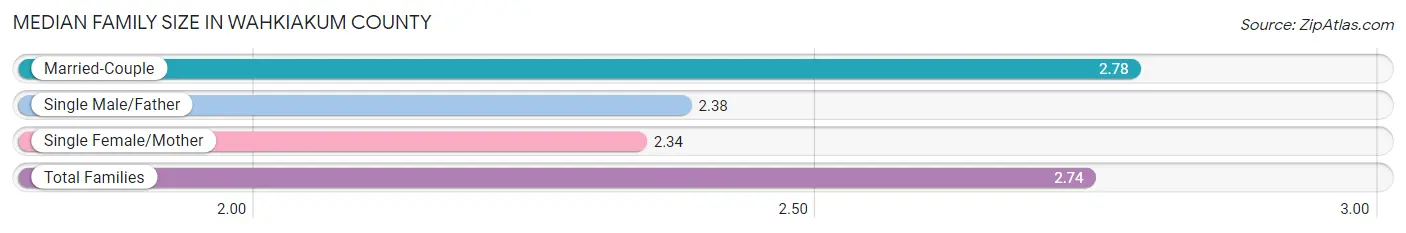
Median Family Size in Wahkiakum County
The median family size in Wahkiakum County is 2.74 persons per family, with married-couple families (1,185 | 89.9%) accounting for the largest median family size of 2.78 persons per family. On the other hand, single female/mother families (77 | 5.8%) represent the smallest median family size with 2.34 persons per family.
| Family Type | # Families | Family Size |
| Married-Couple | 1,185 (89.9%) | 2.78 |
| Single Male/Father | 56 (4.3%) | 2.38 |
| Single Female/Mother | 77 (5.8%) | 2.34 |
| Total Families | 1,318 (100.0%) | 2.74 |
Median Household Size in Wahkiakum County
The median household size in Wahkiakum County is 2.27 persons per household, with single male/father households (56 | 2.9%) accounting for the largest median household size of 3.45 persons per household. non-family households (636 | 32.6%) represent the smallest median household size with 1.13 persons per household.
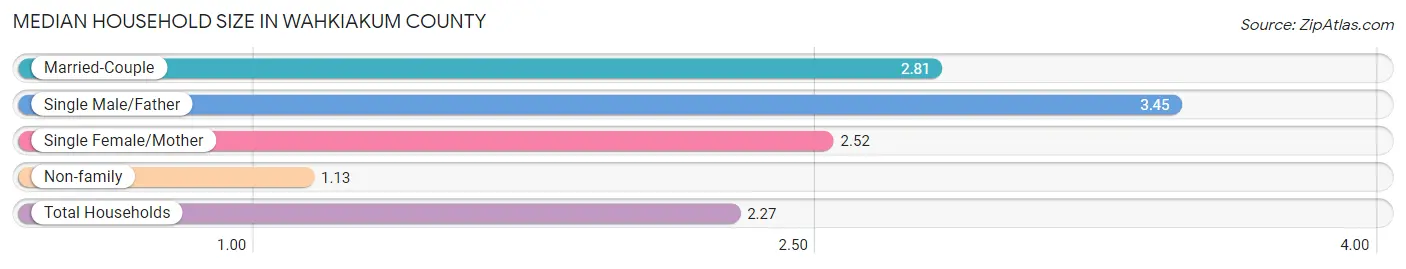
| Household Type | # Households | Household Size |
| Married-Couple | 1,185 (60.6%) | 2.81 |
| Single Male/Father | 56 (2.9%) | 3.45 |
| Single Female/Mother | 77 (3.9%) | 2.52 |
| Non-family | 636 (32.6%) | 1.13 |
| Total Households | 1,954 (100.0%) | 2.27 |
Household Size by Marriage Status in Wahkiakum County
Out of a total of 1,954 households in Wahkiakum County, 1,318 (67.4%) are family households, while 636 (32.6%) are nonfamily households. The most numerous type of family households are 2-person households, comprising 740, and the most common type of nonfamily households are 1-person households, comprising 532.
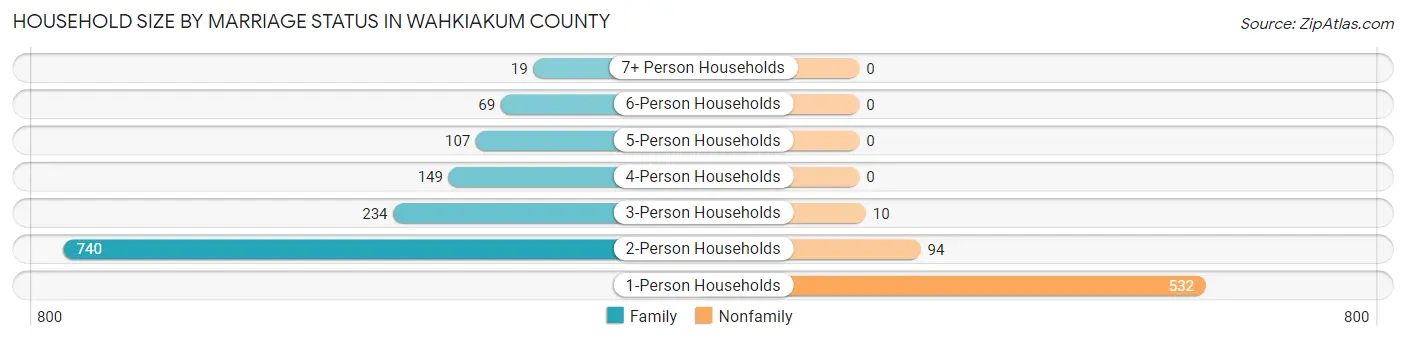
| Household Size | Family Households | Nonfamily Households |
| 1-Person Households | - | 532 (27.2%) |
| 2-Person Households | 740 (37.9%) | 94 (4.8%) |
| 3-Person Households | 234 (12.0%) | 10 (0.5%) |
| 4-Person Households | 149 (7.6%) | 0 (0.0%) |
| 5-Person Households | 107 (5.5%) | 0 (0.0%) |
| 6-Person Households | 69 (3.5%) | 0 (0.0%) |
| 7+ Person Households | 19 (1.0%) | 0 (0.0%) |
| Total | 1,318 (67.4%) | 636 (32.6%) |
Female Fertility in Wahkiakum County
Fertility by Age in Wahkiakum County
Average fertility rate in Wahkiakum County is 99.0 births per 1,000 women. Women in the age bracket of 20 to 34 years have the highest fertility rate with 211.0 births per 1,000 women. Women in the age bracket of 20 to 34 years acount for 96.4% of all women with births.
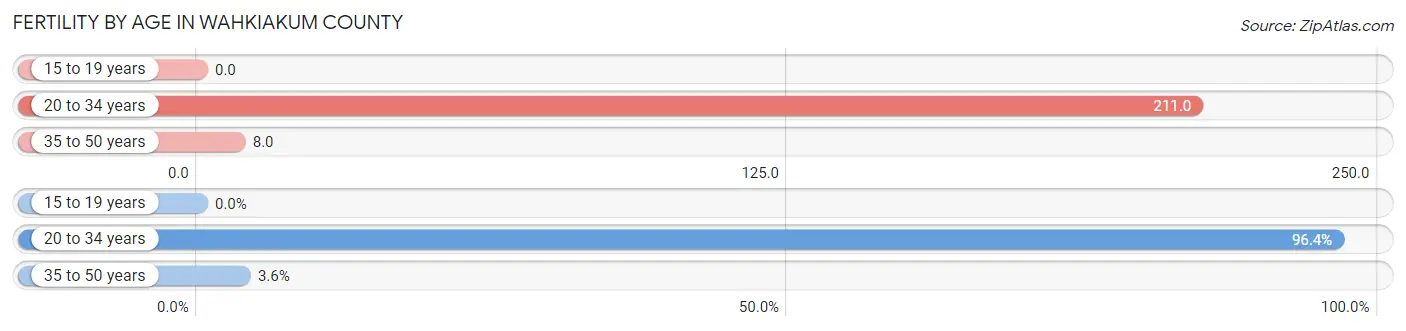
| Age Bracket | Women with Births | Births / 1,000 Women |
| 15 to 19 years | 0 (0.0%) | 0.0 |
| 20 to 34 years | 53 (96.4%) | 211.0 |
| 35 to 50 years | 2 (3.6%) | 8.0 |
| Total | 55 (100.0%) | 99.0 |
Fertility by Age by Marriage Status in Wahkiakum County
96.4% of women with births (55) in Wahkiakum County are married. The highest percentage of unmarried women with births falls into 35 to 50 years age bracket with 100.0% of them unmarried at the time of birth, while the lowest percentage of unmarried women with births belong to 20 to 34 years age bracket with 0.0% of them unmarried.

| Age Bracket | Married | Unmarried |
| 15 to 19 years | 0 (0.0%) | 0 (0.0%) |
| 20 to 34 years | 53 (100.0%) | 0 (0.0%) |
| 35 to 50 years | 0 (0.0%) | 2 (100.0%) |
| Total | 53 (96.4%) | 2 (3.6%) |
Fertility by Education in Wahkiakum County
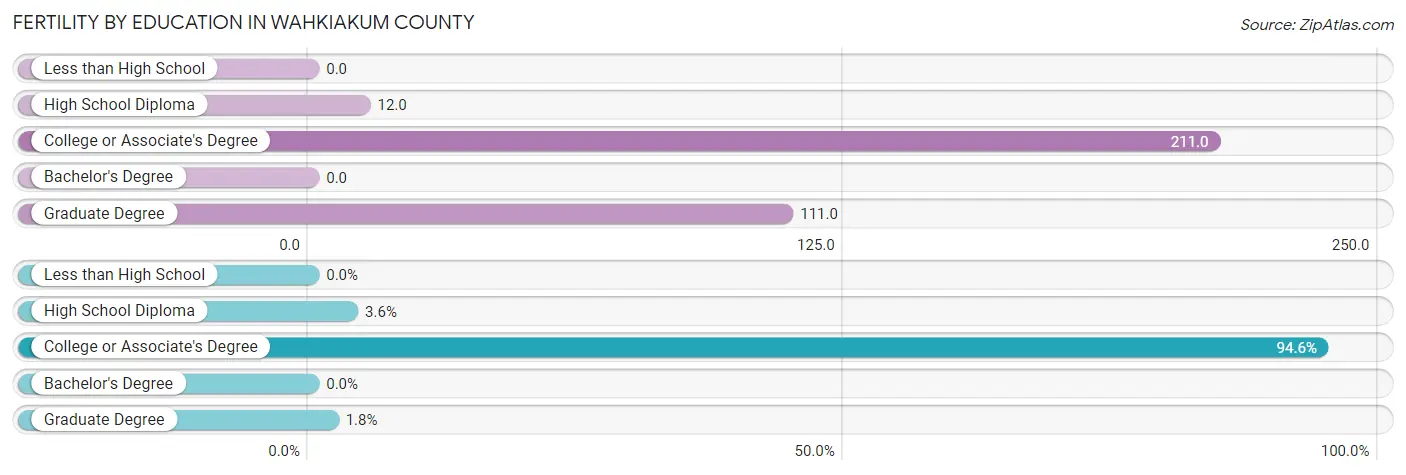
| Educational Attainment | Women with Births | Births / 1,000 Women |
| Less than High School | 0 (0.0%) | 0.0 |
| High School Diploma | 2 (3.6%) | 12.0 |
| College or Associate's Degree | 52 (94.6%) | 211.0 |
| Bachelor's Degree | 0 (0.0%) | 0.0 |
| Graduate Degree | 1 (1.8%) | 111.0 |
| Total | 55 (100.0%) | 99.0 |
Fertility by Education by Marriage Status in Wahkiakum County
3.6% of women with births in Wahkiakum County are unmarried. Women with the educational attainment of college or associate's degree are most likely to be married with 100.0% of them married at childbirth, while women with the educational attainment of high school diploma are least likely to be married with 100.0% of them unmarried at childbirth.

| Educational Attainment | Married | Unmarried |
| Less than High School | 0 (0.0%) | 0 (0.0%) |
| High School Diploma | 0 (0.0%) | 2 (100.0%) |
| College or Associate's Degree | 52 (100.0%) | 0 (0.0%) |
| Bachelor's Degree | 0 (0.0%) | 0 (0.0%) |
| Graduate Degree | 1 (100.0%) | 0 (0.0%) |
| Total | 53 (96.4%) | 2 (3.6%) |
Income in Wahkiakum County
Income Overview in Wahkiakum County
Per Capita Income in Wahkiakum County is $31,643, while median incomes of families and households are $68,382 and $59,167 respectively.
| Characteristic | Number | Measure |
| Per Capita Income | 4,476 | $31,643 |
| Median Family Income | 1,318 | $68,382 |
| Mean Family Income | 1,318 | $81,488 |
| Median Household Income | 1,954 | $59,167 |
| Mean Household Income | 1,954 | $73,542 |
| Income Deficit | 1,318 | $0 |
| Wage / Income Gap (%) | 4,476 | 64.70% |
| Wage / Income Gap ($) | 4,476 | 35.30¢ per $1 |
| Gini / Inequality Index | 4,476 | 0.43 |
Earnings by Sex in Wahkiakum County
Average Earnings in Wahkiakum County are $29,726, $41,185 for men and $14,537 for women, a difference of 64.7%.
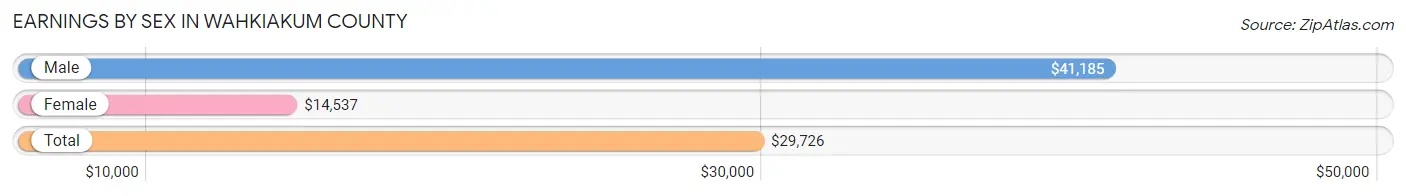
| Sex | Number | Average Earnings |
| Male | 1,023 (56.3%) | $41,185 |
| Female | 794 (43.7%) | $14,537 |
| Total | 1,817 (100.0%) | $29,726 |
Earnings by Sex by Income Bracket in Wahkiakum County
The most common earnings brackets in Wahkiakum County are $55,000 to $64,999 for men (117 | 11.4%) and $25,000 to $29,999 for women (118 | 14.9%).

| Income | Male | Female |
| $2,499 or less | 72 (7.0%) | 115 (14.5%) |
| $2,500 to $4,999 | 65 (6.4%) | 40 (5.0%) |
| $5,000 to $7,499 | 26 (2.5%) | 17 (2.1%) |
| $7,500 to $9,999 | 27 (2.6%) | 117 (14.7%) |
| $10,000 to $12,499 | 32 (3.1%) | 86 (10.8%) |
| $12,500 to $14,999 | 18 (1.8%) | 27 (3.4%) |
| $15,000 to $17,499 | 4 (0.4%) | 14 (1.8%) |
| $17,500 to $19,999 | 0 (0.0%) | 13 (1.6%) |
| $20,000 to $22,499 | 20 (2.0%) | 6 (0.8%) |
| $22,500 to $24,999 | 60 (5.9%) | 4 (0.5%) |
| $25,000 to $29,999 | 40 (3.9%) | 118 (14.9%) |
| $30,000 to $34,999 | 100 (9.8%) | 46 (5.8%) |
| $35,000 to $39,999 | 20 (2.0%) | 10 (1.3%) |
| $40,000 to $44,999 | 71 (6.9%) | 46 (5.8%) |
| $45,000 to $49,999 | 42 (4.1%) | 6 (0.8%) |
| $50,000 to $54,999 | 20 (2.0%) | 16 (2.0%) |
| $55,000 to $64,999 | 117 (11.4%) | 31 (3.9%) |
| $65,000 to $74,999 | 84 (8.2%) | 17 (2.1%) |
| $75,000 to $99,999 | 117 (11.4%) | 31 (3.9%) |
| $100,000+ | 88 (8.6%) | 34 (4.3%) |
| Total | 1,023 (100.0%) | 794 (100.0%) |
Earnings by Sex by Educational Attainment in Wahkiakum County
Average earnings in Wahkiakum County are $47,143 for men and $18,269 for women, a difference of 61.3%. Men with an educational attainment of bachelor's degree enjoy the highest average annual earnings of $74,464, while those with less than high school education earn the least with $23,953. Women with an educational attainment of high school diploma earn the most with the average annual earnings of $19,423, while those with high school diploma education have the smallest earnings of $19,423.
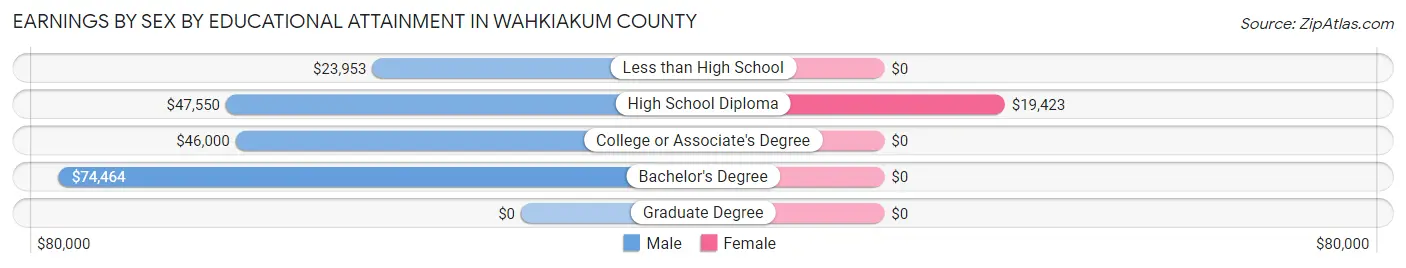
| Educational Attainment | Male Income | Female Income |
| Less than High School | $23,953 | $0 |
| High School Diploma | $47,550 | $19,423 |
| College or Associate's Degree | $46,000 | $0 |
| Bachelor's Degree | $74,464 | $0 |
| Graduate Degree | - | - |
| Total | $47,143 | $18,269 |
Family Income in Wahkiakum County
Family Income Brackets in Wahkiakum County
According to the Wahkiakum County family income data, there are 362 families falling into the $50,000 to $74,999 income range, which is the most common income bracket and makes up 27.5% of all families. Conversely, the $10,000 to $14,999 income bracket is the least frequent group with only 28 families (2.1%) belonging to this category.
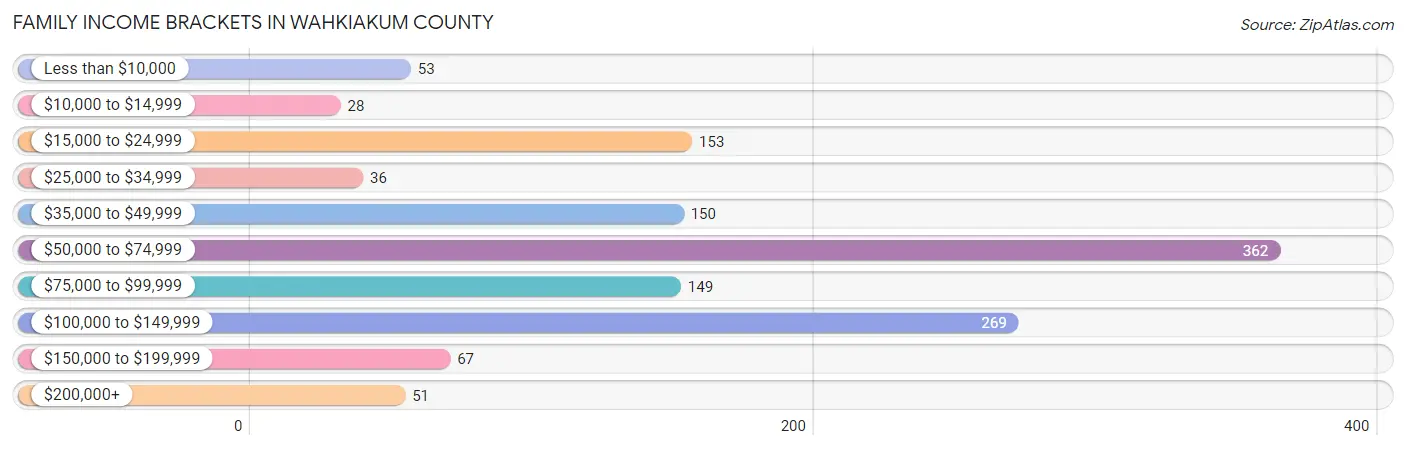
| Income Bracket | # Families | % Families |
| Less than $10,000 | 53 | 4.0% |
| $10,000 to $14,999 | 28 | 2.1% |
| $15,000 to $24,999 | 153 | 11.6% |
| $25,000 to $34,999 | 36 | 2.7% |
| $35,000 to $49,999 | 150 | 11.4% |
| $50,000 to $74,999 | 362 | 27.5% |
| $75,000 to $99,999 | 149 | 11.3% |
| $100,000 to $149,999 | 269 | 20.4% |
| $150,000 to $199,999 | 67 | 5.1% |
| $200,000+ | 51 | 3.9% |
Family Income by Famaliy Size in Wahkiakum County
4-person families (123 | 9.3%) account for the highest median family income in Wahkiakum County with $89,712 per family, while 2-person families (784 | 59.5%) have the highest median income of $35,268 per family member.

| Income Bracket | # Families | Median Income |
| 2-Person Families | 784 (59.5%) | $70,536 |
| 3-Person Families | 226 (17.2%) | $0 |
| 4-Person Families | 123 (9.3%) | $89,712 |
| 5-Person Families | 105 (8.0%) | $55,417 |
| 6-Person Families | 61 (4.6%) | $68,073 |
| 7+ Person Families | 19 (1.4%) | $0 |
| Total | 1,318 (100.0%) | $68,382 |
Family Income by Number of Earners in Wahkiakum County
The median family income in Wahkiakum County is $68,382, with families comprising 2 earners (326) having the highest median family income of $94,054, while families with no earners (528) have the lowest median family income of $55,865, accounting for 24.7% and 40.1% of families, respectively.
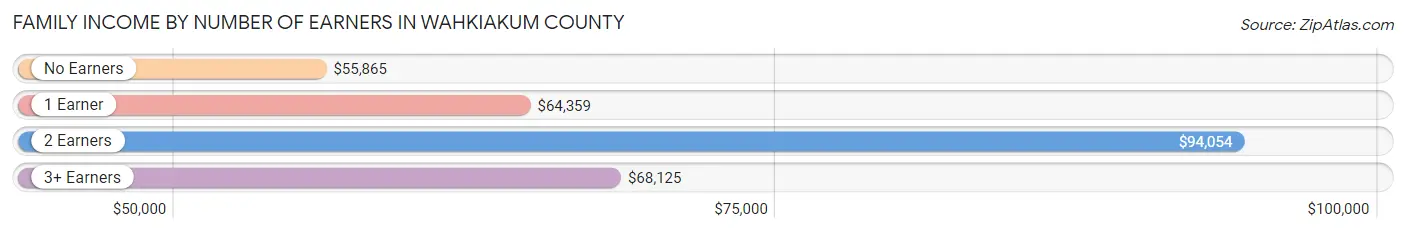
| Number of Earners | # Families | Median Income |
| No Earners | 528 (40.1%) | $55,865 |
| 1 Earner | 374 (28.4%) | $64,359 |
| 2 Earners | 326 (24.7%) | $94,054 |
| 3+ Earners | 90 (6.8%) | $68,125 |
| Total | 1,318 (100.0%) | $68,382 |
Household Income in Wahkiakum County
Household Income Brackets in Wahkiakum County
With 479 households falling in the category, the $50,000 to $74,999 income range is the most frequent in Wahkiakum County, accounting for 24.5% of all households. In contrast, only 70 households (3.6%) fall into the $10,000 to $14,999 income bracket, making it the least populous group.
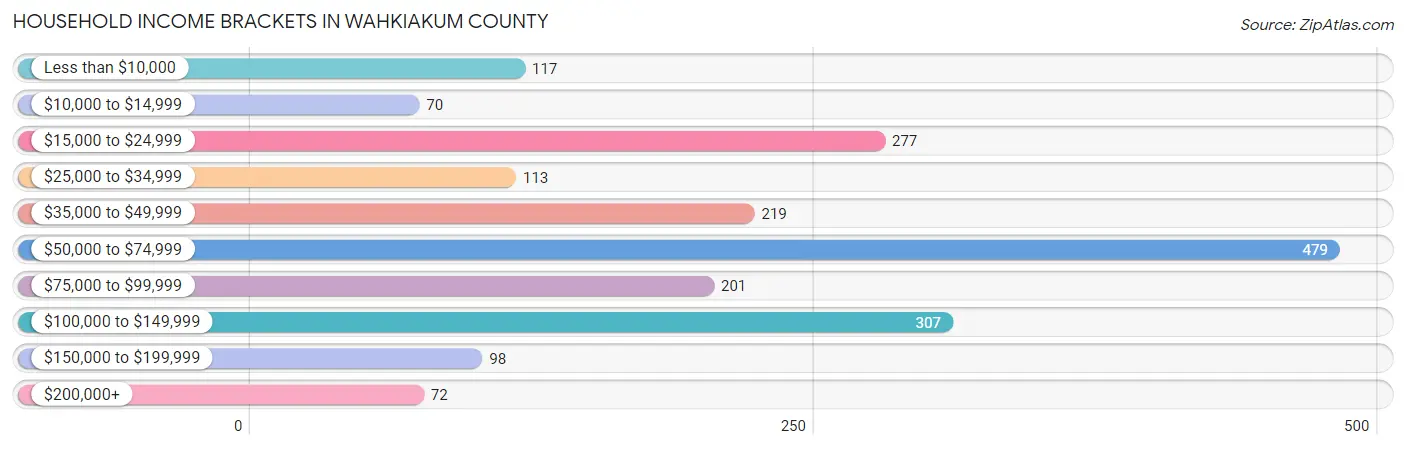
| Income Bracket | # Households | % Households |
| Less than $10,000 | 117 | 6.0% |
| $10,000 to $14,999 | 70 | 3.6% |
| $15,000 to $24,999 | 277 | 14.2% |
| $25,000 to $34,999 | 113 | 5.8% |
| $35,000 to $49,999 | 219 | 11.2% |
| $50,000 to $74,999 | 479 | 24.5% |
| $75,000 to $99,999 | 201 | 10.3% |
| $100,000 to $149,999 | 307 | 15.7% |
| $150,000 to $199,999 | 98 | 5.0% |
| $200,000+ | 72 | 3.7% |
Household Income by Householder Age in Wahkiakum County
The median household income in Wahkiakum County is $59,167, with the highest median household income of $68,598 found in the 25 to 44 years age bracket for the primary householder. A total of 346 households (17.7%) fall into this category. Meanwhile, the 15 to 24 years age bracket for the primary householder has the lowest median household income of $0, with 17 households (0.9%) in this group.
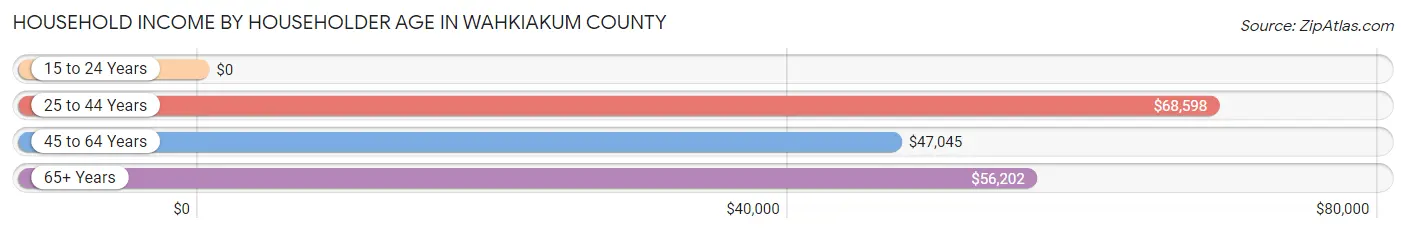
| Income Bracket | # Households | Median Income |
| 15 to 24 Years | 17 (0.9%) | $0 |
| 25 to 44 Years | 346 (17.7%) | $68,598 |
| 45 to 64 Years | 686 (35.1%) | $47,045 |
| 65+ Years | 905 (46.3%) | $56,202 |
| Total | 1,954 (100.0%) | $59,167 |
Poverty in Wahkiakum County
Income Below Poverty by Sex and Age in Wahkiakum County
With 13.2% poverty level for males and 14.3% for females among the residents of Wahkiakum County, 16 and 17 year old males and 16 and 17 year old females are the most vulnerable to poverty, with 21 males (77.8%) and 8 females (42.1%) in their respective age groups living below the poverty level.
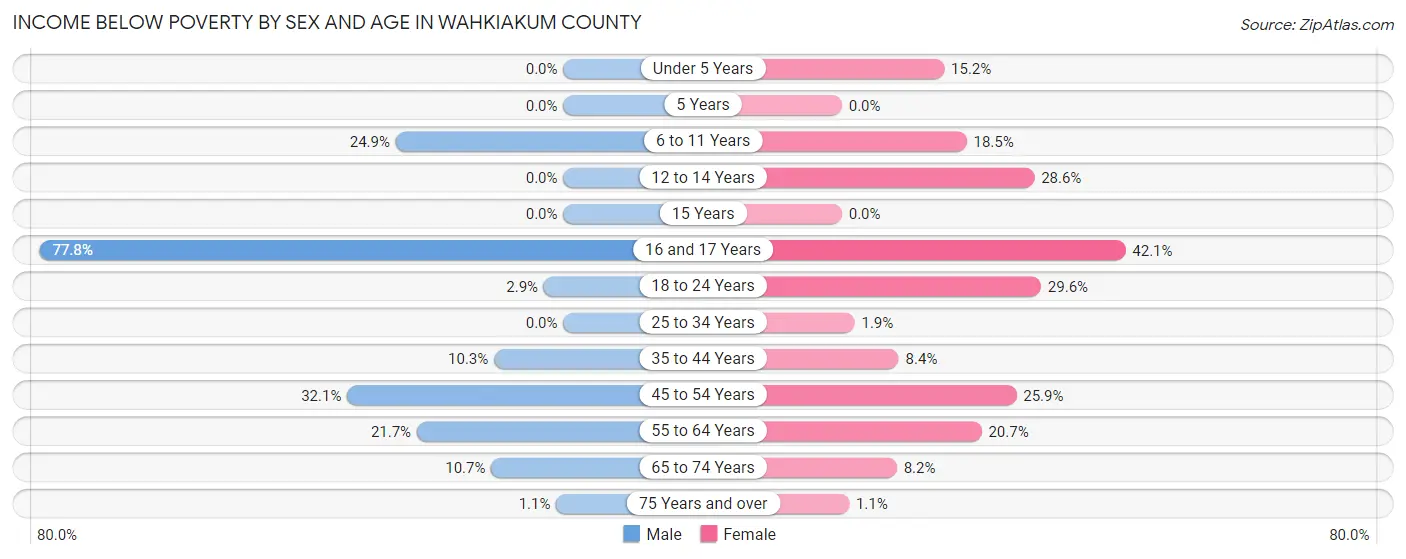
| Age Bracket | Male | Female |
| Under 5 Years | 0 (0.0%) | 12 (15.2%) |
| 5 Years | 0 (0.0%) | 0 (0.0%) |
| 6 to 11 Years | 52 (24.9%) | 25 (18.5%) |
| 12 to 14 Years | 0 (0.0%) | 16 (28.6%) |
| 15 Years | 0 (0.0%) | 0 (0.0%) |
| 16 and 17 Years | 21 (77.8%) | 8 (42.1%) |
| 18 to 24 Years | 4 (2.9%) | 34 (29.6%) |
| 25 to 34 Years | 0 (0.0%) | 3 (1.9%) |
| 35 to 44 Years | 26 (10.3%) | 13 (8.4%) |
| 45 to 54 Years | 69 (32.1%) | 64 (25.9%) |
| 55 to 64 Years | 70 (21.7%) | 101 (20.7%) |
| 65 to 74 Years | 52 (10.7%) | 33 (8.2%) |
| 75 Years and over | 3 (1.1%) | 3 (1.1%) |
| Total | 297 (13.2%) | 312 (14.3%) |
Income Above Poverty by Sex and Age in Wahkiakum County
According to the poverty statistics in Wahkiakum County, males aged under 5 years and females aged 5 years are the age groups that are most secure financially, with 100.0% of males and 100.0% of females in these age groups living above the poverty line.
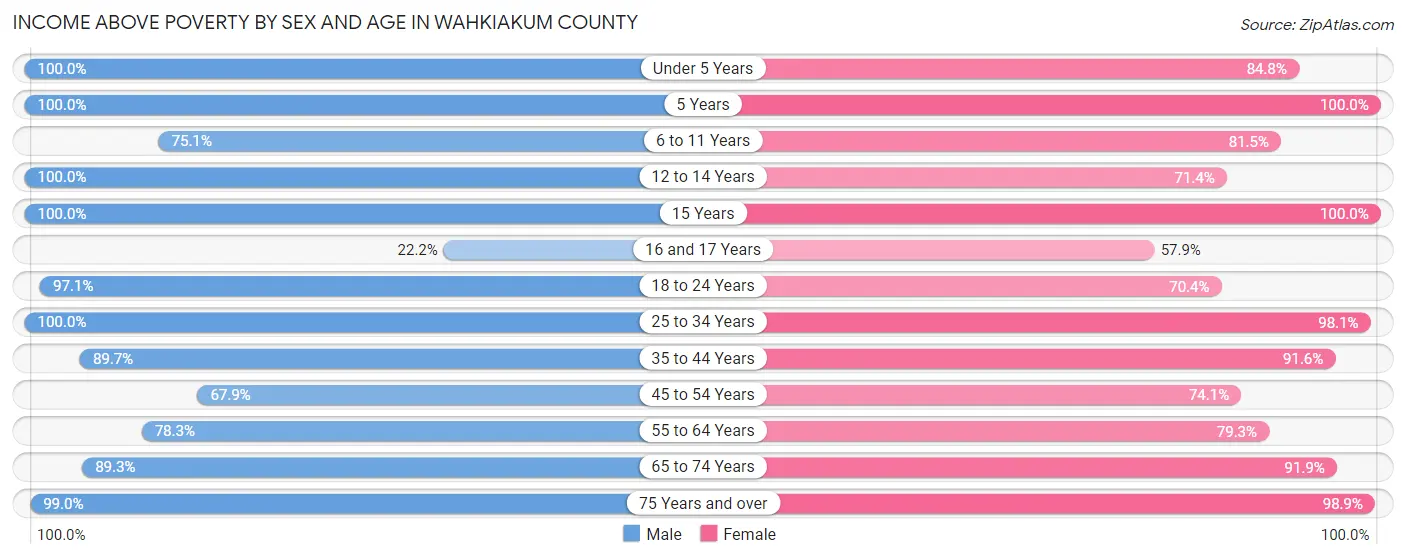
| Age Bracket | Male | Female |
| Under 5 Years | 66 (100.0%) | 67 (84.8%) |
| 5 Years | 33 (100.0%) | 40 (100.0%) |
| 6 to 11 Years | 157 (75.1%) | 110 (81.5%) |
| 12 to 14 Years | 22 (100.0%) | 40 (71.4%) |
| 15 Years | 79 (100.0%) | 1 (100.0%) |
| 16 and 17 Years | 6 (22.2%) | 11 (57.9%) |
| 18 to 24 Years | 135 (97.1%) | 81 (70.4%) |
| 25 to 34 Years | 120 (100.0%) | 156 (98.1%) |
| 35 to 44 Years | 227 (89.7%) | 141 (91.6%) |
| 45 to 54 Years | 146 (67.9%) | 183 (74.1%) |
| 55 to 64 Years | 252 (78.3%) | 386 (79.3%) |
| 65 to 74 Years | 434 (89.3%) | 372 (91.8%) |
| 75 Years and over | 284 (99.0%) | 278 (98.9%) |
| Total | 1,961 (86.9%) | 1,866 (85.7%) |
Income Below Poverty Among Married-Couple Families in Wahkiakum County
The poverty statistics for married-couple families in Wahkiakum County show that 10.9% or 129 of the total 1,185 families live below the poverty line. Families with no children have the highest poverty rate of 11.1%, comprising of 82 families. On the other hand, families with 5 or more children have the lowest poverty rate of 0.0%, which includes 0 families.
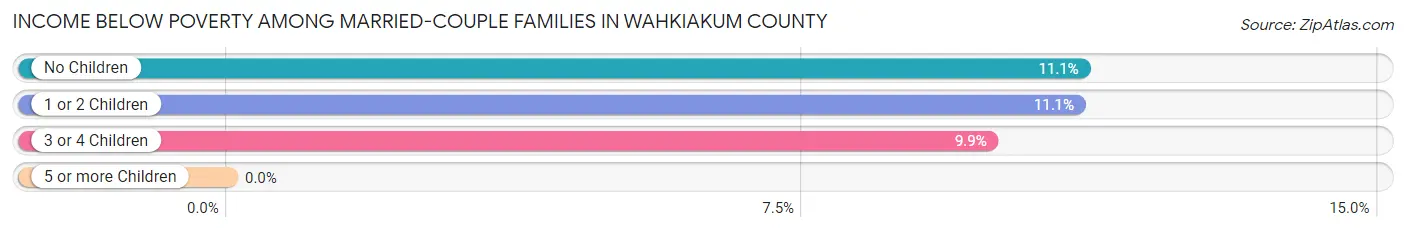
| Children | Above Poverty | Below Poverty |
| No Children | 655 (88.9%) | 82 (11.1%) |
| 1 or 2 Children | 265 (88.9%) | 33 (11.1%) |
| 3 or 4 Children | 127 (90.1%) | 14 (9.9%) |
| 5 or more Children | 9 (100.0%) | 0 (0.0%) |
| Total | 1,056 (89.1%) | 129 (10.9%) |
Income Below Poverty Among Single-Parent Households in Wahkiakum County
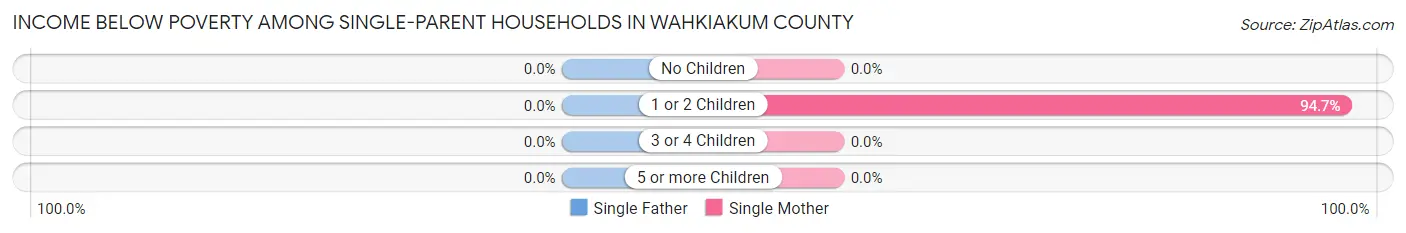
| Children | Single Father | Single Mother |
| No Children | 0 (0.0%) | 0 (0.0%) |
| 1 or 2 Children | 0 (0.0%) | 18 (94.7%) |
| 3 or 4 Children | 0 (0.0%) | 0 (0.0%) |
| 5 or more Children | 0 (0.0%) | 0 (0.0%) |
| Total | 0 (0.0%) | 18 (23.4%) |
Income Below Poverty Among Married-Couple vs Single-Parent Households in Wahkiakum County
The poverty data for Wahkiakum County shows that 129 of the married-couple family households (10.9%) and 18 of the single-parent households (13.5%) are living below the poverty level. Within the married-couple family households, those with no children have the highest poverty rate, with 82 households (11.1%) falling below the poverty line. Among the single-parent households, those with 1 or 2 children have the highest poverty rate, with 18 household (78.3%) living below poverty.
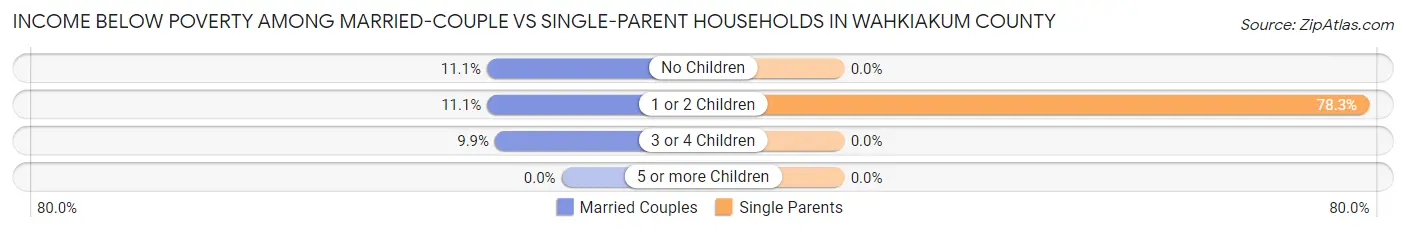
| Children | Married-Couple Families | Single-Parent Households |
| No Children | 82 (11.1%) | 0 (0.0%) |
| 1 or 2 Children | 33 (11.1%) | 18 (78.3%) |
| 3 or 4 Children | 14 (9.9%) | 0 (0.0%) |
| 5 or more Children | 0 (0.0%) | 0 (0.0%) |
| Total | 129 (10.9%) | 18 (13.5%) |
Employment Characteristics in Wahkiakum County
Employment by Class of Employer in Wahkiakum County
Among the 1,550 employed individuals in Wahkiakum County, private company employees (847 | 54.6%), local government employees (208 | 13.4%), and not-for-profit organizations (178 | 11.5%) make up the most common classes of employment.
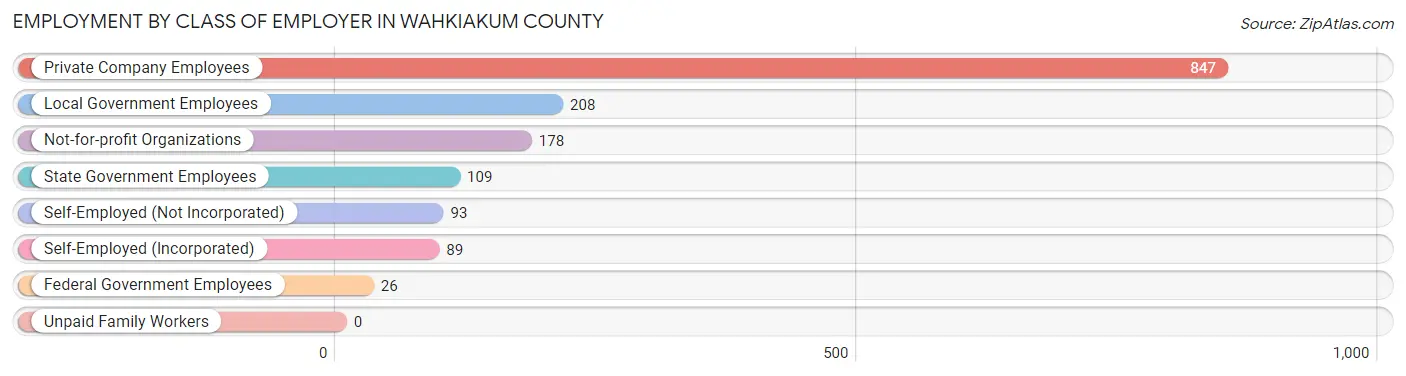
| Employer Class | # Employees | % Employees |
| Private Company Employees | 847 | 54.6% |
| Self-Employed (Incorporated) | 89 | 5.7% |
| Self-Employed (Not Incorporated) | 93 | 6.0% |
| Not-for-profit Organizations | 178 | 11.5% |
| Local Government Employees | 208 | 13.4% |
| State Government Employees | 109 | 7.0% |
| Federal Government Employees | 26 | 1.7% |
| Unpaid Family Workers | 0 | 0.0% |
| Total | 1,550 | 100.0% |
Employment Status by Age in Wahkiakum County
According to the labor force statistics for Wahkiakum County, out of the total population over 16 years of age (3,752), 42.8% or 1,606 individuals are in the labor force, with 3.2% or 51 of them unemployed. The age group with the highest labor force participation rate is 35 to 44 years, with 81.8% or 336 individuals in the labor force. Within the labor force, the 25 to 29 years age range has the highest percentage of unemployed individuals, with 7.5% or 8 of them being unemployed.
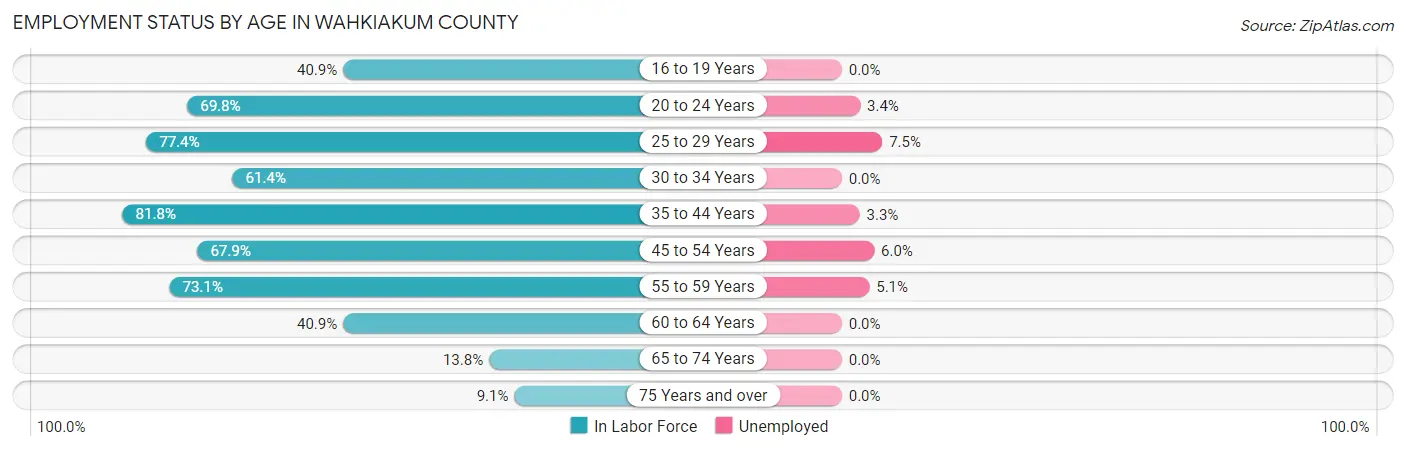
| Age Bracket | In Labor Force | Unemployed |
| 16 to 19 Years | 54 (40.9%) | 0 (0.0%) |
| 20 to 24 Years | 118 (69.8%) | 4 (3.4%) |
| 25 to 29 Years | 106 (77.4%) | 8 (7.5%) |
| 30 to 34 Years | 89 (61.4%) | 0 (0.0%) |
| 35 to 44 Years | 336 (81.8%) | 11 (3.3%) |
| 45 to 54 Years | 315 (67.9%) | 19 (6.0%) |
| 55 to 59 Years | 177 (73.1%) | 9 (5.1%) |
| 60 to 64 Years | 233 (40.9%) | 0 (0.0%) |
| 65 to 74 Years | 124 (13.8%) | 0 (0.0%) |
| 75 Years and over | 53 (9.1%) | 0 (0.0%) |
| Total | 1,606 (42.8%) | 51 (3.2%) |
Employment Status by Educational Attainment in Wahkiakum County
According to labor force statistics for Wahkiakum County, 63.8% of individuals (1,256) out of the total population between 25 and 64 years of age (1,968) are in the labor force, with 3.7% or 46 of them being unemployed. The group with the highest labor force participation rate are those with the educational attainment of less than high school, with 77.9% or 176 individuals in the labor force. Within the labor force, individuals with less than high school education have the highest percentage of unemployment, with 10.8% or 19 of them being unemployed.

| Educational Attainment | In Labor Force | Unemployed |
| Less than High School | 176 (77.9%) | 24 (10.8%) |
| High School Diploma | 440 (67.9%) | 6 (0.9%) |
| College / Associate Degree | 449 (55.3%) | 43 (5.3%) |
| Bachelor's Degree or higher | 191 (67.7%) | 0 (0.0%) |
| Total | 1,256 (63.8%) | 73 (3.7%) |
Employment Occupations by Sex in Wahkiakum County
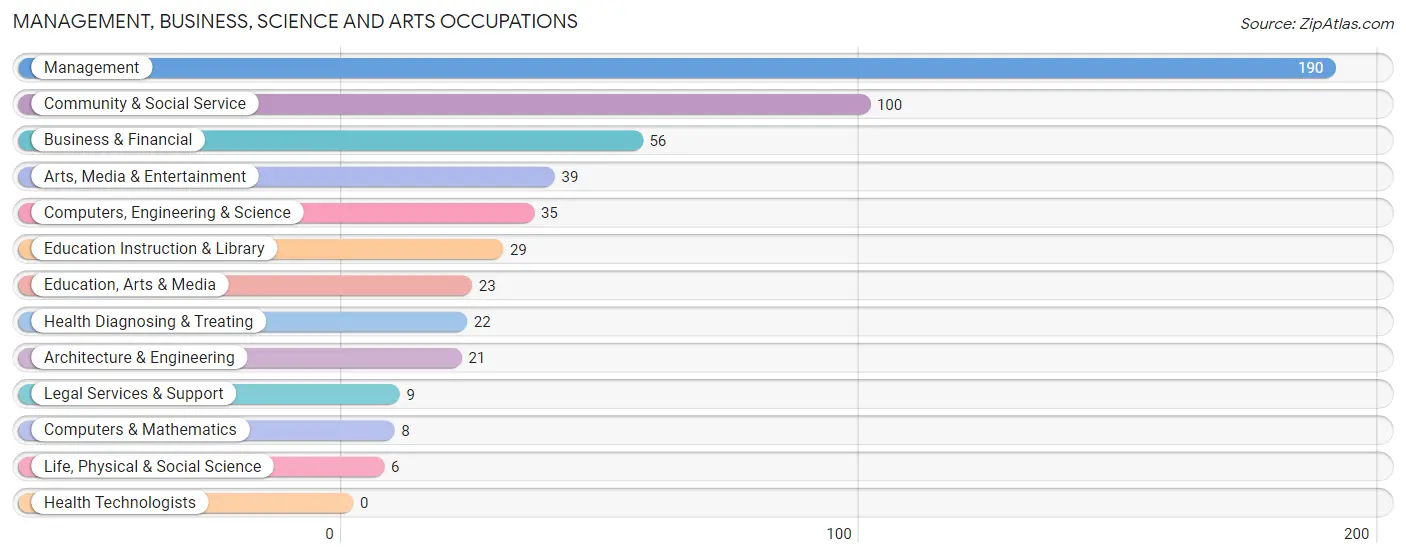
Management, Business, Science and Arts Occupations
The most common Management, Business, Science and Arts occupations in Wahkiakum County are Management (190 | 12.2%), Community & Social Service (100 | 6.4%), Business & Financial (56 | 3.6%), Arts, Media & Entertainment (39 | 2.5%), and Computers, Engineering & Science (35 | 2.2%).
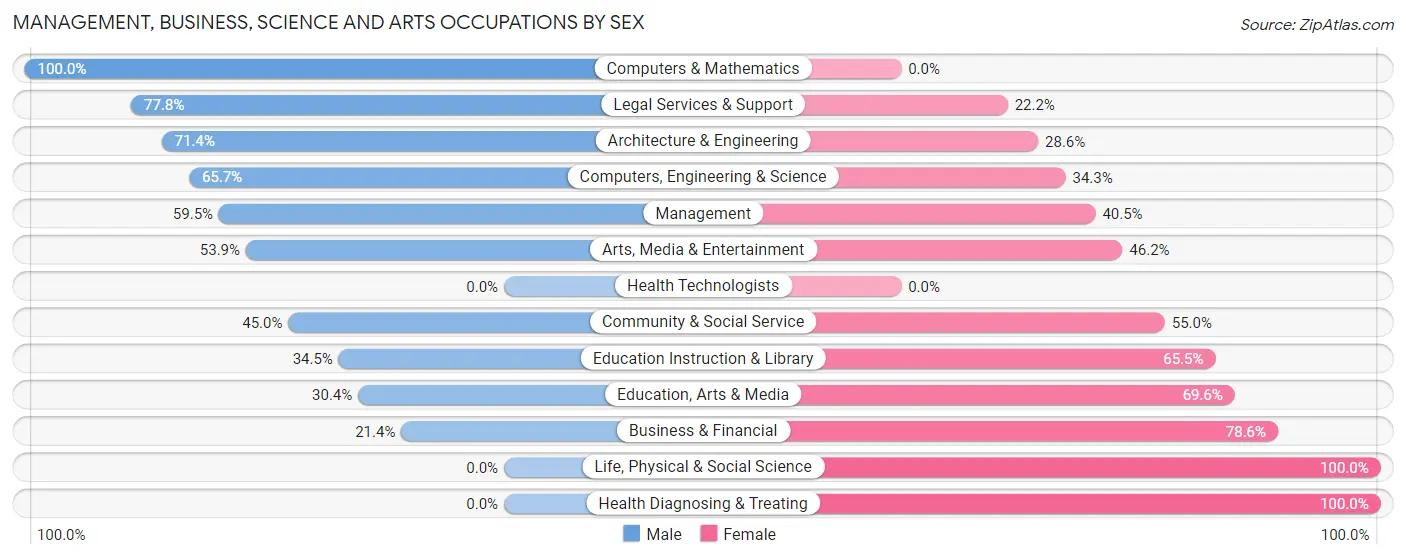
Management, Business, Science and Arts Occupations by Sex
Within the Management, Business, Science and Arts occupations in Wahkiakum County, the most male-oriented occupations are Computers & Mathematics (100.0%), Legal Services & Support (77.8%), and Architecture & Engineering (71.4%), while the most female-oriented occupations are Life, Physical & Social Science (100.0%), Health Diagnosing & Treating (100.0%), and Business & Financial (78.6%).
| Occupation | Male | Female |
| Management | 113 (59.5%) | 77 (40.5%) |
| Business & Financial | 12 (21.4%) | 44 (78.6%) |
| Computers, Engineering & Science | 23 (65.7%) | 12 (34.3%) |
| Computers & Mathematics | 8 (100.0%) | 0 (0.0%) |
| Architecture & Engineering | 15 (71.4%) | 6 (28.6%) |
| Life, Physical & Social Science | 0 (0.0%) | 6 (100.0%) |
| Community & Social Service | 45 (45.0%) | 55 (55.0%) |
| Education, Arts & Media | 7 (30.4%) | 16 (69.6%) |
| Legal Services & Support | 7 (77.8%) | 2 (22.2%) |
| Education Instruction & Library | 10 (34.5%) | 19 (65.5%) |
| Arts, Media & Entertainment | 21 (53.8%) | 18 (46.2%) |
| Health Diagnosing & Treating | 0 (0.0%) | 22 (100.0%) |
| Health Technologists | 0 (0.0%) | 0 (0.0%) |
| Total (Category) | 193 (47.9%) | 210 (52.1%) |
| Total (Overall) | 852 (54.8%) | 702 (45.2%) |
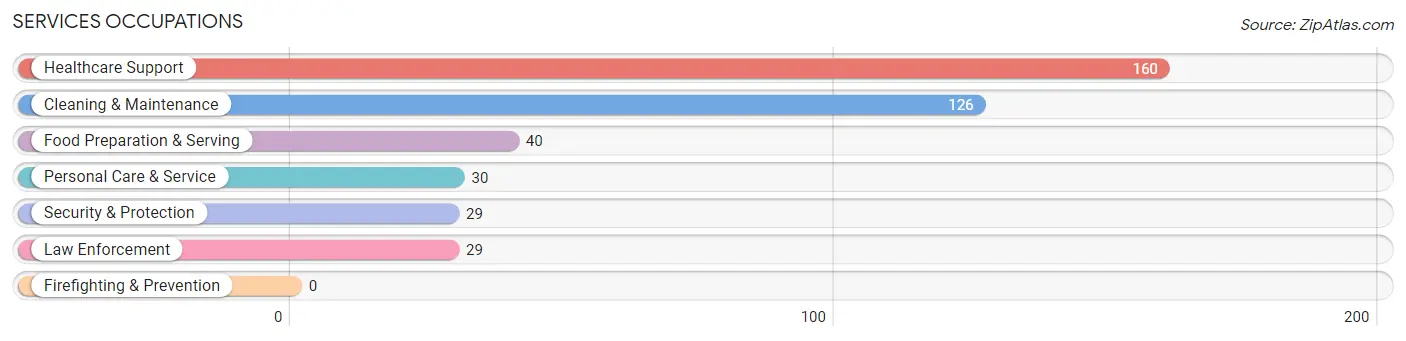
Services Occupations
The most common Services occupations in Wahkiakum County are Healthcare Support (160 | 10.3%), Cleaning & Maintenance (126 | 8.1%), Food Preparation & Serving (40 | 2.6%), Personal Care & Service (30 | 1.9%), and Security & Protection (29 | 1.9%).
Services Occupations by Sex
Within the Services occupations in Wahkiakum County, the most male-oriented occupations are Security & Protection (100.0%), Law Enforcement (100.0%), and Personal Care & Service (80.0%), while the most female-oriented occupations are Food Preparation & Serving (92.5%), Healthcare Support (72.5%), and Cleaning & Maintenance (42.1%).

| Occupation | Male | Female |
| Healthcare Support | 44 (27.5%) | 116 (72.5%) |
| Security & Protection | 29 (100.0%) | 0 (0.0%) |
| Firefighting & Prevention | 0 (0.0%) | 0 (0.0%) |
| Law Enforcement | 29 (100.0%) | 0 (0.0%) |
| Food Preparation & Serving | 3 (7.5%) | 37 (92.5%) |
| Cleaning & Maintenance | 73 (57.9%) | 53 (42.1%) |
| Personal Care & Service | 24 (80.0%) | 6 (20.0%) |
| Total (Category) | 173 (44.9%) | 212 (55.1%) |
| Total (Overall) | 852 (54.8%) | 702 (45.2%) |
Sales and Office Occupations
The most common Sales and Office occupations in Wahkiakum County are Office & Administration (172 | 11.1%), and Sales & Related (118 | 7.6%).

Sales and Office Occupations by Sex

| Occupation | Male | Female |
| Sales & Related | 89 (75.4%) | 29 (24.6%) |
| Office & Administration | 27 (15.7%) | 145 (84.3%) |
| Total (Category) | 116 (40.0%) | 174 (60.0%) |
| Total (Overall) | 852 (54.8%) | 702 (45.2%) |
Natural Resources, Construction and Maintenance Occupations
The most common Natural Resources, Construction and Maintenance occupations in Wahkiakum County are Construction & Extraction (194 | 12.5%), Farming, Fishing & Forestry (50 | 3.2%), and Installation, Maintenance & Repair (27 | 1.7%).
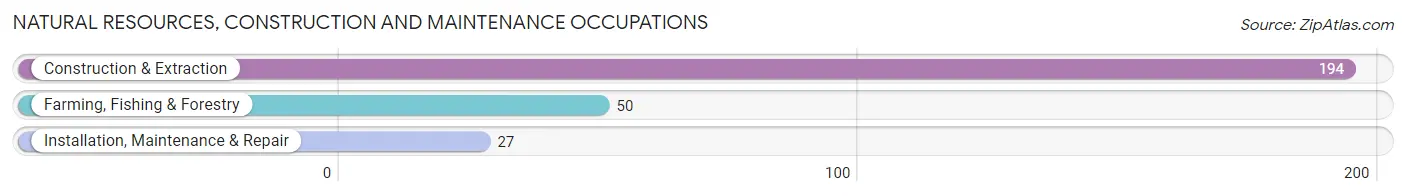
Natural Resources, Construction and Maintenance Occupations by Sex
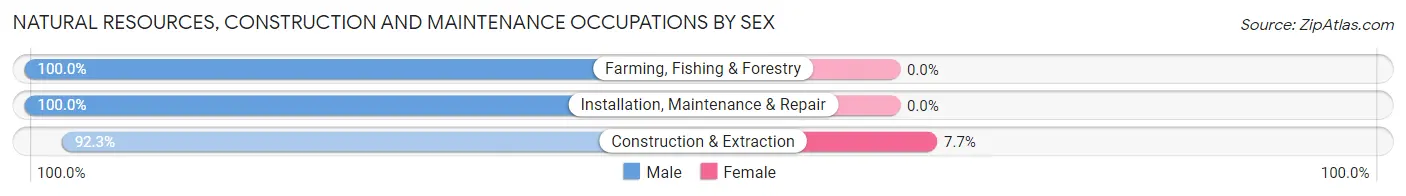
| Occupation | Male | Female |
| Farming, Fishing & Forestry | 50 (100.0%) | 0 (0.0%) |
| Construction & Extraction | 179 (92.3%) | 15 (7.7%) |
| Installation, Maintenance & Repair | 27 (100.0%) | 0 (0.0%) |
| Total (Category) | 256 (94.5%) | 15 (5.5%) |
| Total (Overall) | 852 (54.8%) | 702 (45.2%) |
Production, Transportation and Moving Occupations
The most common Production, Transportation and Moving occupations in Wahkiakum County are Material Moving (87 | 5.6%), Production (65 | 4.2%), and Transportation (53 | 3.4%).
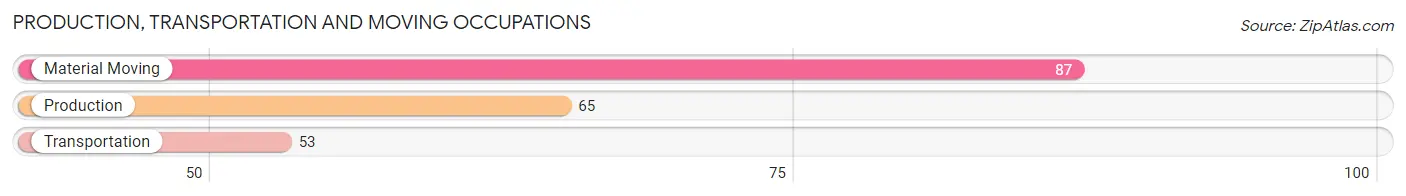
Production, Transportation and Moving Occupations by Sex
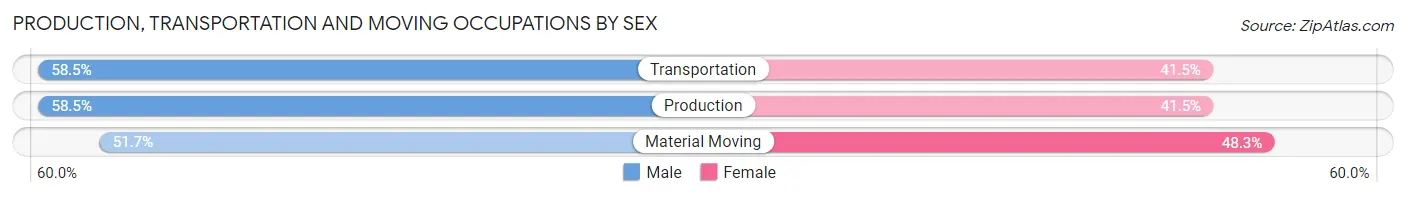
| Occupation | Male | Female |
| Production | 38 (58.5%) | 27 (41.5%) |
| Transportation | 31 (58.5%) | 22 (41.5%) |
| Material Moving | 45 (51.7%) | 42 (48.3%) |
| Total (Category) | 114 (55.6%) | 91 (44.4%) |
| Total (Overall) | 852 (54.8%) | 702 (45.2%) |
Employment Industries by Sex in Wahkiakum County
Employment Industries in Wahkiakum County
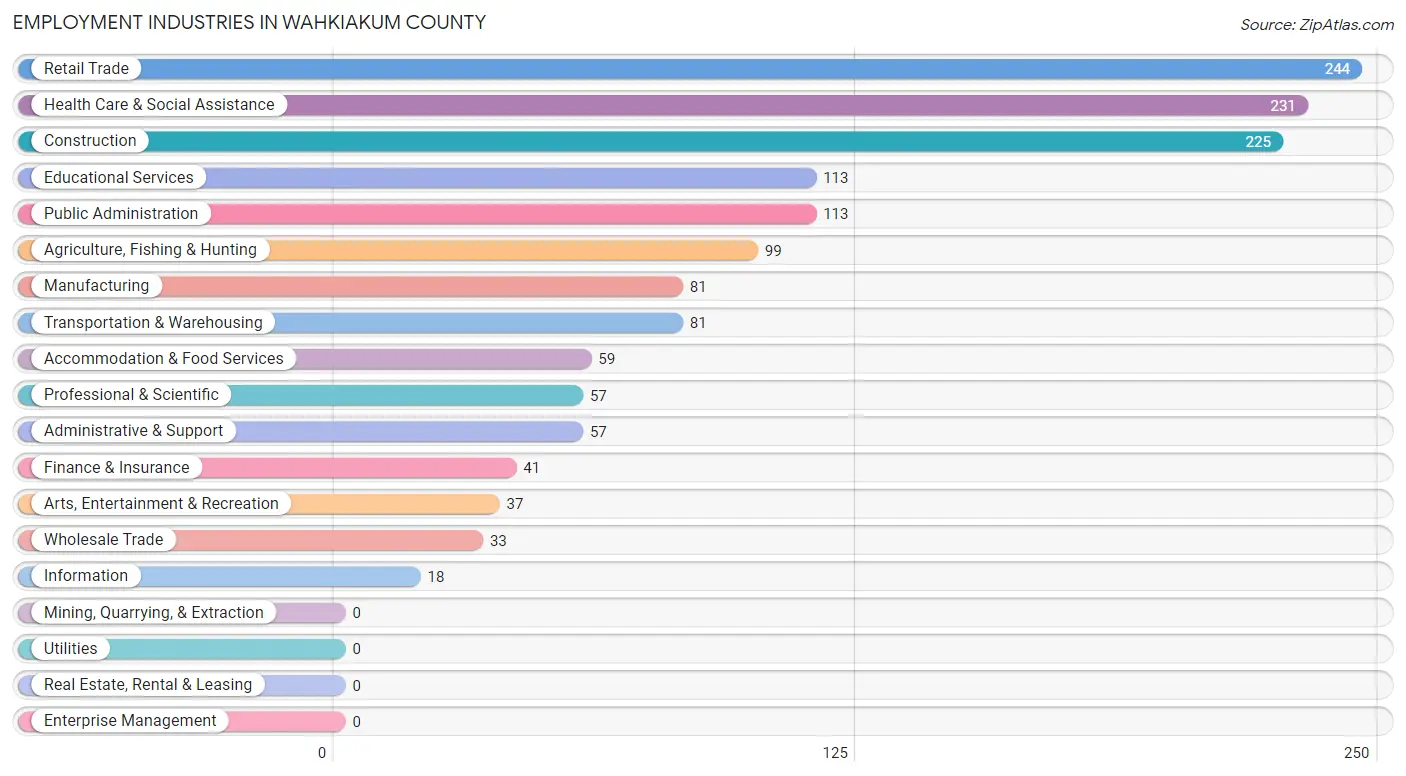
The major employment industries in Wahkiakum County include Retail Trade (244 | 15.7%), Health Care & Social Assistance (231 | 14.9%), Construction (225 | 14.5%), Educational Services (113 | 7.3%), and Public Administration (113 | 7.3%).
Employment Industries by Sex in Wahkiakum County
The Wahkiakum County industries that see more men than women are Arts, Entertainment & Recreation (100.0%), Wholesale Trade (84.9%), and Agriculture, Fishing & Hunting (83.8%), whereas the industries that tend to have a higher number of women are Finance & Insurance (100.0%), Accommodation & Food Services (93.2%), and Educational Services (71.7%).
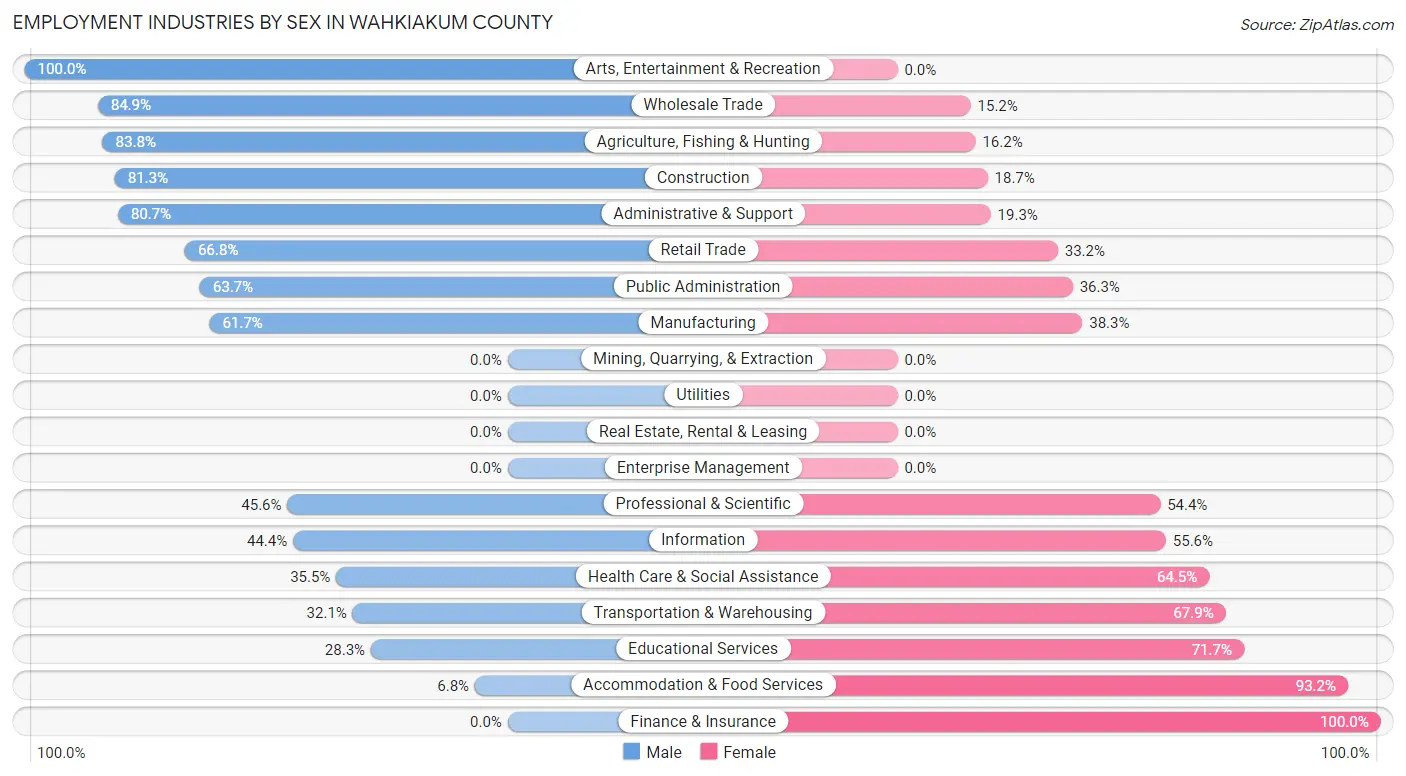
| Industry | Male | Female |
| Agriculture, Fishing & Hunting | 83 (83.8%) | 16 (16.2%) |
| Mining, Quarrying, & Extraction | 0 (0.0%) | 0 (0.0%) |
| Construction | 183 (81.3%) | 42 (18.7%) |
| Manufacturing | 50 (61.7%) | 31 (38.3%) |
| Wholesale Trade | 28 (84.9%) | 5 (15.1%) |
| Retail Trade | 163 (66.8%) | 81 (33.2%) |
| Transportation & Warehousing | 26 (32.1%) | 55 (67.9%) |
| Utilities | 0 (0.0%) | 0 (0.0%) |
| Information | 8 (44.4%) | 10 (55.6%) |
| Finance & Insurance | 0 (0.0%) | 41 (100.0%) |
| Real Estate, Rental & Leasing | 0 (0.0%) | 0 (0.0%) |
| Professional & Scientific | 26 (45.6%) | 31 (54.4%) |
| Enterprise Management | 0 (0.0%) | 0 (0.0%) |
| Administrative & Support | 46 (80.7%) | 11 (19.3%) |
| Educational Services | 32 (28.3%) | 81 (71.7%) |
| Health Care & Social Assistance | 82 (35.5%) | 149 (64.5%) |
| Arts, Entertainment & Recreation | 37 (100.0%) | 0 (0.0%) |
| Accommodation & Food Services | 4 (6.8%) | 55 (93.2%) |
| Public Administration | 72 (63.7%) | 41 (36.3%) |
| Total | 852 (54.8%) | 702 (45.2%) |
Education in Wahkiakum County
School Enrollment in Wahkiakum County
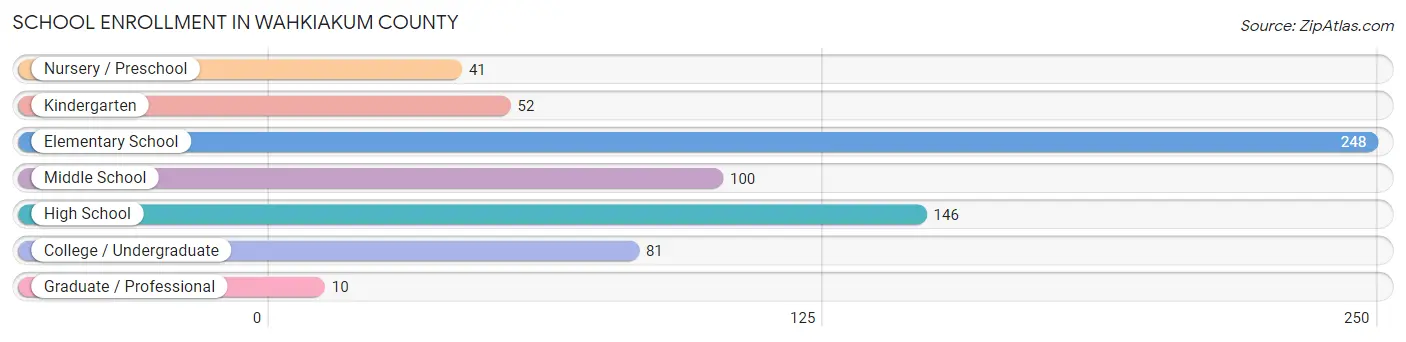
The most common levels of schooling among the 678 students in Wahkiakum County are elementary school (248 | 36.6%), high school (146 | 21.5%), and middle school (100 | 14.7%).
| School Level | # Students | % Students |
| Nursery / Preschool | 41 | 6.0% |
| Kindergarten | 52 | 7.7% |
| Elementary School | 248 | 36.6% |
| Middle School | 100 | 14.7% |
| High School | 146 | 21.5% |
| College / Undergraduate | 81 | 11.9% |
| Graduate / Professional | 10 | 1.5% |
| Total | 678 | 100.0% |
School Enrollment by Age by Funding Source in Wahkiakum County
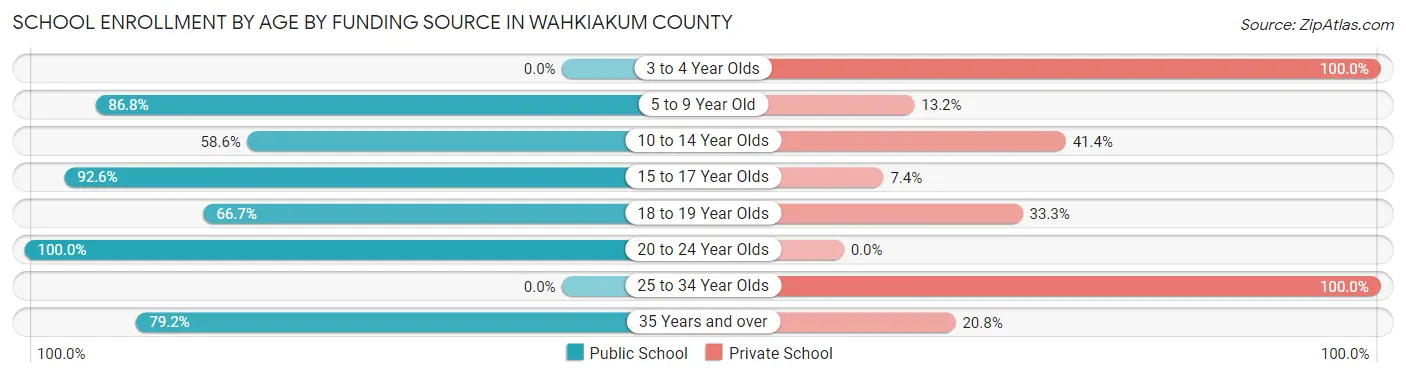
Out of a total of 678 students who are enrolled in schools in Wahkiakum County, 181 (26.7%) attend a private institution, while the remaining 497 (73.3%) are enrolled in public schools. The age group of 3 to 4 year olds has the highest likelihood of being enrolled in private schools, with 23 (100.0% in the age bracket) enrolled. Conversely, the age group of 20 to 24 year olds has the lowest likelihood of being enrolled in a private school, with 8 (100.0% in the age bracket) attending a public institution.
| Age Bracket | Public School | Private School |
| 3 to 4 Year Olds | 0 (0.0%) | 23 (100.0%) |
| 5 to 9 Year Old | 211 (86.8%) | 32 (13.2%) |
| 10 to 14 Year Olds | 112 (58.6%) | 79 (41.4%) |
| 15 to 17 Year Olds | 100 (92.6%) | 8 (7.4%) |
| 18 to 19 Year Olds | 28 (66.7%) | 14 (33.3%) |
| 20 to 24 Year Olds | 8 (100.0%) | 0 (0.0%) |
| 25 to 34 Year Olds | 0 (0.0%) | 15 (100.0%) |
| 35 Years and over | 38 (79.2%) | 10 (20.8%) |
| Total | 497 (73.3%) | 181 (26.7%) |
Educational Attainment by Field of Study in Wahkiakum County
Science & technology (181 | 21.9%), education (156 | 18.9%), bio, nature & agricultural (86 | 10.4%), business (64 | 7.7%), and social sciences (62 | 7.5%) are the most common fields of study among 827 individuals in Wahkiakum County who have obtained a bachelor's degree or higher.
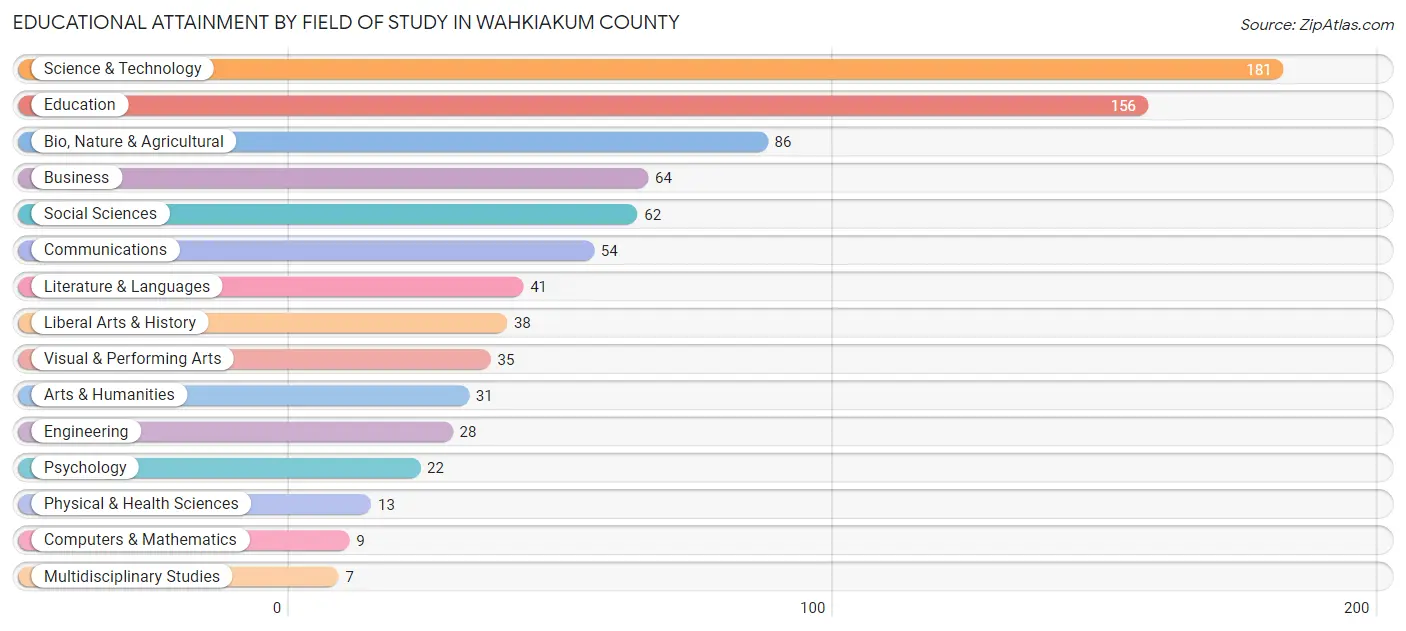
| Field of Study | # Graduates | % Graduates |
| Computers & Mathematics | 9 | 1.1% |
| Bio, Nature & Agricultural | 86 | 10.4% |
| Physical & Health Sciences | 13 | 1.6% |
| Psychology | 22 | 2.7% |
| Social Sciences | 62 | 7.5% |
| Engineering | 28 | 3.4% |
| Multidisciplinary Studies | 7 | 0.9% |
| Science & Technology | 181 | 21.9% |
| Business | 64 | 7.7% |
| Education | 156 | 18.9% |
| Literature & Languages | 41 | 5.0% |
| Liberal Arts & History | 38 | 4.6% |
| Visual & Performing Arts | 35 | 4.2% |
| Communications | 54 | 6.5% |
| Arts & Humanities | 31 | 3.7% |
| Total | 827 | 100.0% |
Transportation & Commute in Wahkiakum County
Vehicle Availability by Sex in Wahkiakum County
The most prevalent vehicle ownership categories in Wahkiakum County are males with 2 vehicles (226, accounting for 26.6%) and females with 2 vehicles (241, making up 32.5%).

| Vehicles Available | Male | Female |
| No Vehicle | 22 (2.6%) | 7 (1.0%) |
| 1 Vehicle | 128 (15.1%) | 117 (16.8%) |
| 2 Vehicles | 226 (26.6%) | 241 (34.6%) |
| 3 Vehicles | 203 (23.9%) | 124 (17.8%) |
| 4 Vehicles | 115 (13.6%) | 56 (8.1%) |
| 5 or more Vehicles | 155 (18.3%) | 151 (21.7%) |
| Total | 849 (100.0%) | 696 (100.0%) |
Commute Time in Wahkiakum County
The most frequently occuring commute durations in Wahkiakum County are less than 5 minutes (215 commuters, 15.5%), 45 to 59 minutes (214 commuters, 15.5%), and 30 to 34 minutes (169 commuters, 12.2%).
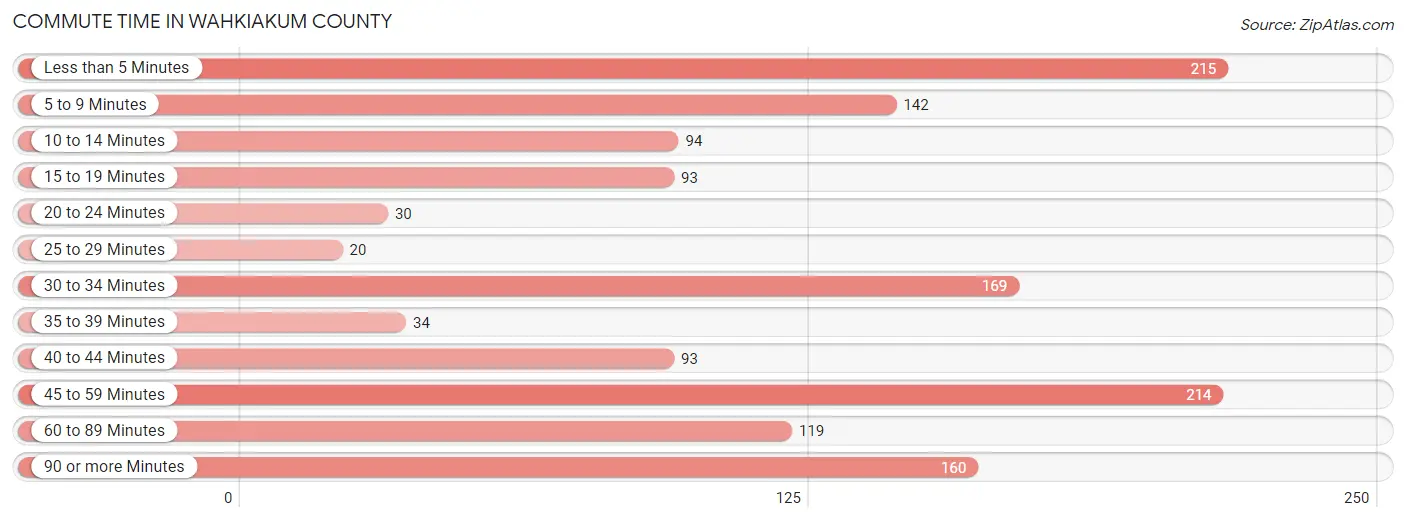
| Commute Time | # Commuters | % Commuters |
| Less than 5 Minutes | 215 | 15.5% |
| 5 to 9 Minutes | 142 | 10.3% |
| 10 to 14 Minutes | 94 | 6.8% |
| 15 to 19 Minutes | 93 | 6.7% |
| 20 to 24 Minutes | 30 | 2.2% |
| 25 to 29 Minutes | 20 | 1.5% |
| 30 to 34 Minutes | 169 | 12.2% |
| 35 to 39 Minutes | 34 | 2.5% |
| 40 to 44 Minutes | 93 | 6.7% |
| 45 to 59 Minutes | 214 | 15.5% |
| 60 to 89 Minutes | 119 | 8.6% |
| 90 or more Minutes | 160 | 11.6% |
Commute Time by Sex in Wahkiakum County
The most common commute times in Wahkiakum County are less than 5 minutes (138 commuters, 18.7%) for males and 45 to 59 minutes (92 commuters, 14.2%) for females.
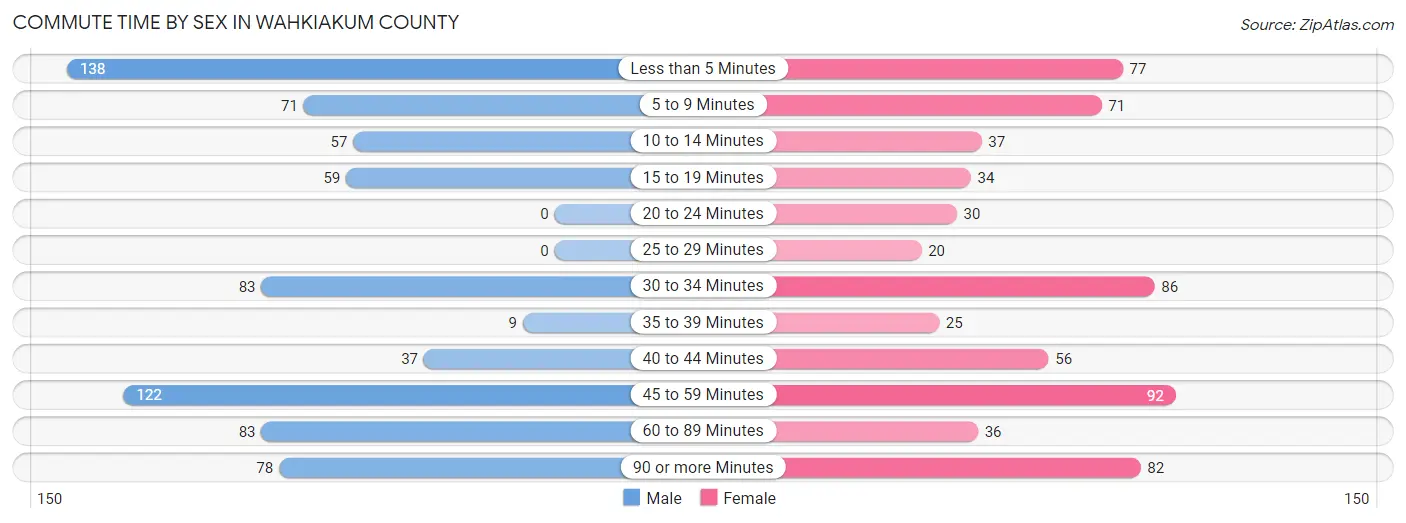
| Commute Time | Male | Female |
| Less than 5 Minutes | 138 (18.7%) | 77 (11.9%) |
| 5 to 9 Minutes | 71 (9.6%) | 71 (11.0%) |
| 10 to 14 Minutes | 57 (7.7%) | 37 (5.7%) |
| 15 to 19 Minutes | 59 (8.0%) | 34 (5.3%) |
| 20 to 24 Minutes | 0 (0.0%) | 30 (4.6%) |
| 25 to 29 Minutes | 0 (0.0%) | 20 (3.1%) |
| 30 to 34 Minutes | 83 (11.3%) | 86 (13.3%) |
| 35 to 39 Minutes | 9 (1.2%) | 25 (3.9%) |
| 40 to 44 Minutes | 37 (5.0%) | 56 (8.7%) |
| 45 to 59 Minutes | 122 (16.6%) | 92 (14.2%) |
| 60 to 89 Minutes | 83 (11.3%) | 36 (5.6%) |
| 90 or more Minutes | 78 (10.6%) | 82 (12.7%) |
Time of Departure to Work by Sex in Wahkiakum County
The most frequent times of departure to work in Wahkiakum County are 6:30 AM to 6:59 AM (165, 22.4%) for males and 7:30 AM to 7:59 AM (105, 16.3%) for females.
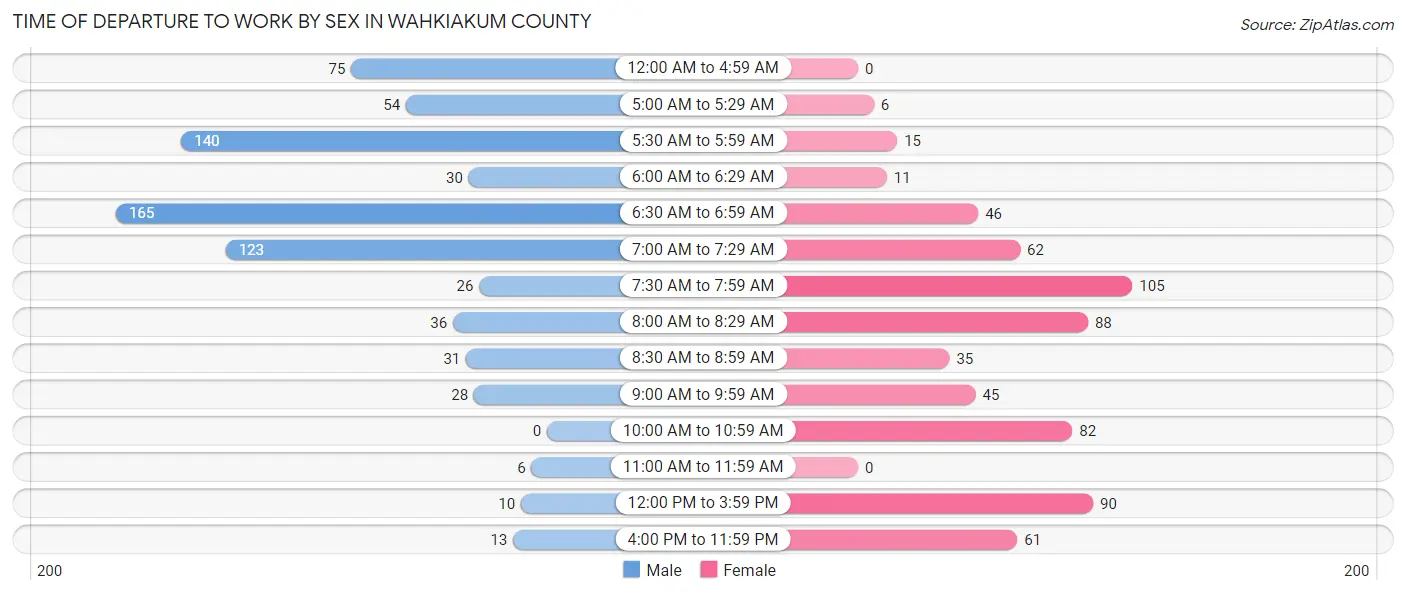
| Time of Departure | Male | Female |
| 12:00 AM to 4:59 AM | 75 (10.2%) | 0 (0.0%) |
| 5:00 AM to 5:29 AM | 54 (7.3%) | 6 (0.9%) |
| 5:30 AM to 5:59 AM | 140 (19.0%) | 15 (2.3%) |
| 6:00 AM to 6:29 AM | 30 (4.1%) | 11 (1.7%) |
| 6:30 AM to 6:59 AM | 165 (22.4%) | 46 (7.1%) |
| 7:00 AM to 7:29 AM | 123 (16.7%) | 62 (9.6%) |
| 7:30 AM to 7:59 AM | 26 (3.5%) | 105 (16.3%) |
| 8:00 AM to 8:29 AM | 36 (4.9%) | 88 (13.6%) |
| 8:30 AM to 8:59 AM | 31 (4.2%) | 35 (5.4%) |
| 9:00 AM to 9:59 AM | 28 (3.8%) | 45 (7.0%) |
| 10:00 AM to 10:59 AM | 0 (0.0%) | 82 (12.7%) |
| 11:00 AM to 11:59 AM | 6 (0.8%) | 0 (0.0%) |
| 12:00 PM to 3:59 PM | 10 (1.4%) | 90 (13.9%) |
| 4:00 PM to 11:59 PM | 13 (1.8%) | 61 (9.4%) |
| Total | 737 (100.0%) | 646 (100.0%) |
Housing Occupancy in Wahkiakum County
Occupancy by Ownership in Wahkiakum County
Of the total 1,954 dwellings in Wahkiakum County, owner-occupied units account for 1,666 (85.3%), while renter-occupied units make up 288 (14.7%).
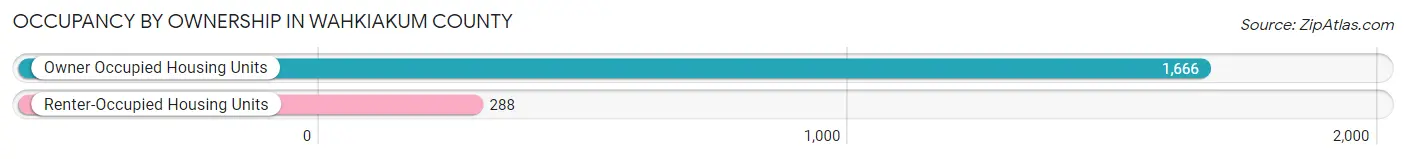
| Occupancy | # Housing Units | % Housing Units |
| Owner Occupied Housing Units | 1,666 | 85.3% |
| Renter-Occupied Housing Units | 288 | 14.7% |
| Total Occupied Housing Units | 1,954 | 100.0% |
Occupancy by Household Size in Wahkiakum County
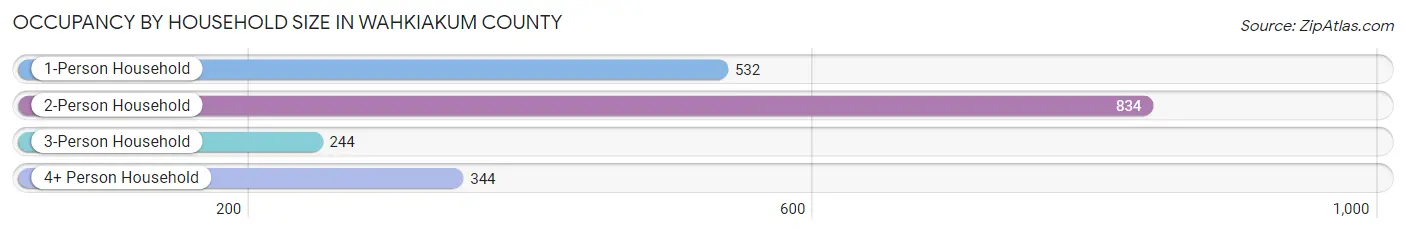
| Household Size | # Housing Units | % Housing Units |
| 1-Person Household | 532 | 27.2% |
| 2-Person Household | 834 | 42.7% |
| 3-Person Household | 244 | 12.5% |
| 4+ Person Household | 344 | 17.6% |
| Total Housing Units | 1,954 | 100.0% |
Occupancy by Ownership by Household Size in Wahkiakum County
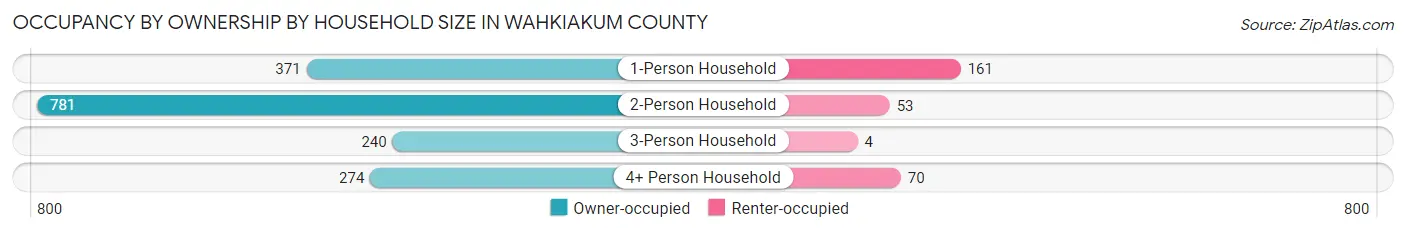
| Household Size | Owner-occupied | Renter-occupied |
| 1-Person Household | 371 (69.7%) | 161 (30.3%) |
| 2-Person Household | 781 (93.6%) | 53 (6.4%) |
| 3-Person Household | 240 (98.4%) | 4 (1.6%) |
| 4+ Person Household | 274 (79.6%) | 70 (20.3%) |
| Total Housing Units | 1,666 (85.3%) | 288 (14.7%) |
Occupancy by Educational Attainment in Wahkiakum County
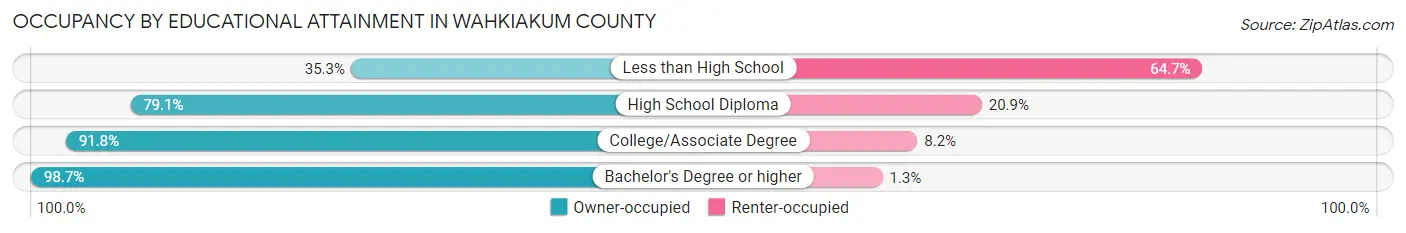
| Household Size | Owner-occupied | Renter-occupied |
| Less than High School | 65 (35.3%) | 119 (64.7%) |
| High School Diploma | 355 (79.1%) | 94 (20.9%) |
| College/Associate Degree | 776 (91.8%) | 69 (8.2%) |
| Bachelor's Degree or higher | 470 (98.7%) | 6 (1.3%) |
Occupancy by Age of Householder in Wahkiakum County
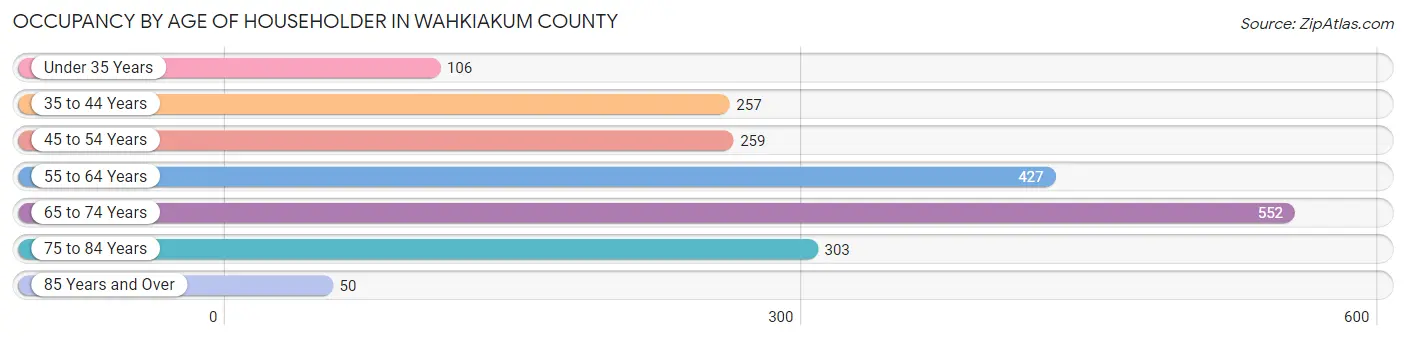
| Age Bracket | # Households | % Households |
| Under 35 Years | 106 | 5.4% |
| 35 to 44 Years | 257 | 13.2% |
| 45 to 54 Years | 259 | 13.3% |
| 55 to 64 Years | 427 | 21.8% |
| 65 to 74 Years | 552 | 28.2% |
| 75 to 84 Years | 303 | 15.5% |
| 85 Years and Over | 50 | 2.6% |
| Total | 1,954 | 100.0% |
Housing Finances in Wahkiakum County
Median Income by Occupancy in Wahkiakum County
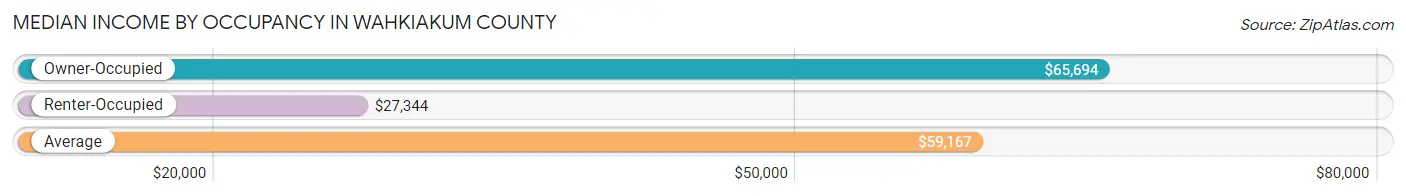
| Occupancy Type | # Households | Median Income |
| Owner-Occupied | 1,666 (85.3%) | $65,694 |
| Renter-Occupied | 288 (14.7%) | $27,344 |
| Average | 1,954 (100.0%) | $59,167 |
Occupancy by Householder Income Bracket in Wahkiakum County
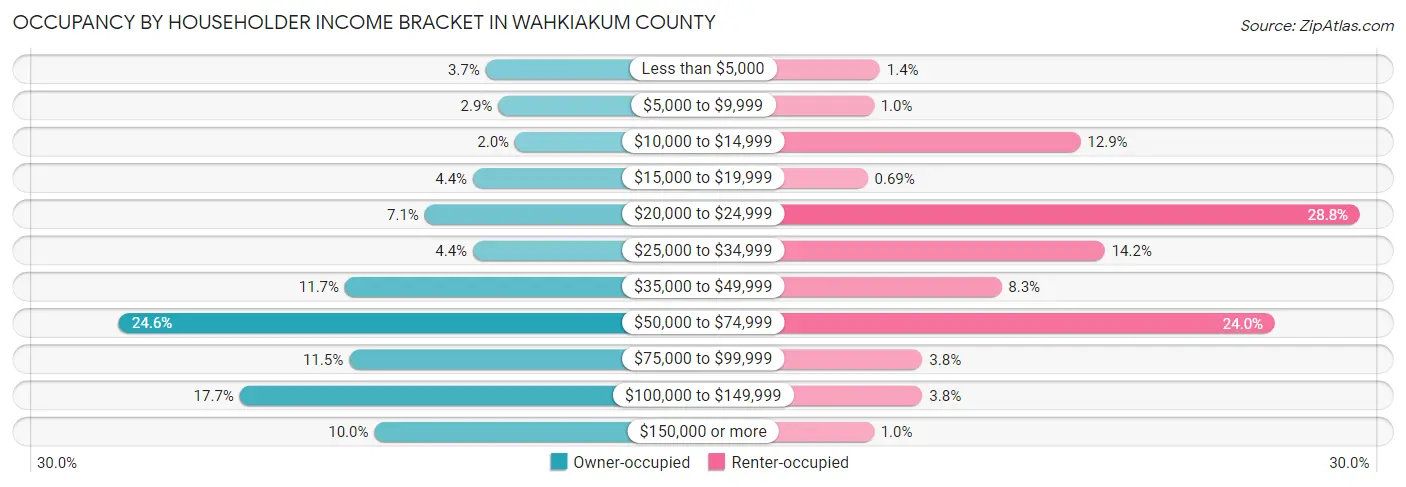
| Income Bracket | Owner-occupied | Renter-occupied |
| Less than $5,000 | 61 (3.7%) | 4 (1.4%) |
| $5,000 to $9,999 | 49 (2.9%) | 3 (1.0%) |
| $10,000 to $14,999 | 33 (2.0%) | 37 (12.9%) |
| $15,000 to $19,999 | 73 (4.4%) | 2 (0.7%) |
| $20,000 to $24,999 | 119 (7.1%) | 83 (28.8%) |
| $25,000 to $34,999 | 73 (4.4%) | 41 (14.2%) |
| $35,000 to $49,999 | 195 (11.7%) | 24 (8.3%) |
| $50,000 to $74,999 | 410 (24.6%) | 69 (24.0%) |
| $75,000 to $99,999 | 191 (11.5%) | 11 (3.8%) |
| $100,000 to $149,999 | 295 (17.7%) | 11 (3.8%) |
| $150,000 or more | 167 (10.0%) | 3 (1.0%) |
| Total | 1,666 (100.0%) | 288 (100.0%) |
Monthly Housing Cost Tiers in Wahkiakum County
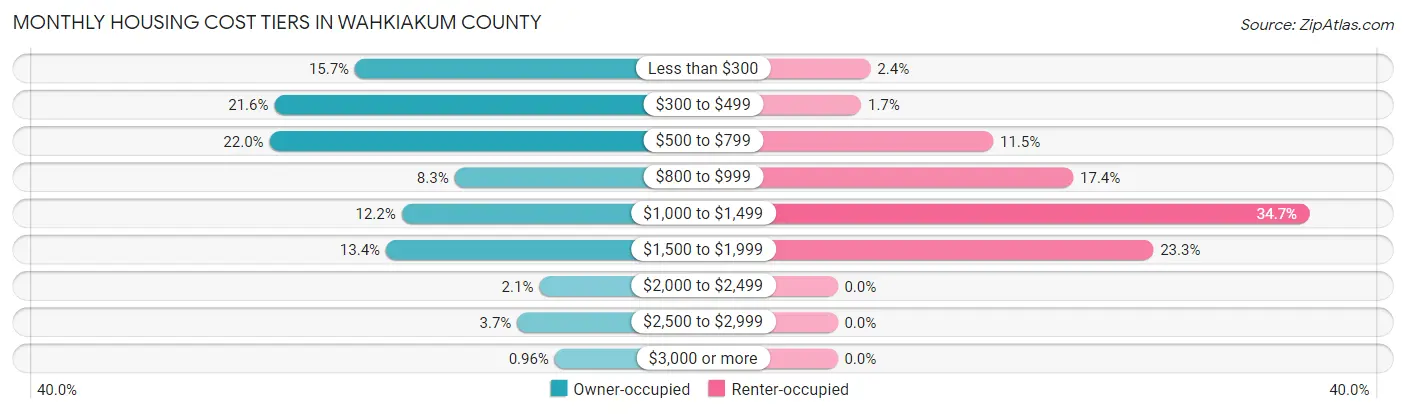
| Monthly Cost | Owner-occupied | Renter-occupied |
| Less than $300 | 261 (15.7%) | 7 (2.4%) |
| $300 to $499 | 360 (21.6%) | 5 (1.7%) |
| $500 to $799 | 366 (22.0%) | 33 (11.5%) |
| $800 to $999 | 139 (8.3%) | 50 (17.4%) |
| $1,000 to $1,499 | 204 (12.2%) | 100 (34.7%) |
| $1,500 to $1,999 | 223 (13.4%) | 67 (23.3%) |
| $2,000 to $2,499 | 35 (2.1%) | 0 (0.0%) |
| $2,500 to $2,999 | 62 (3.7%) | 0 (0.0%) |
| $3,000 or more | 16 (1.0%) | 0 (0.0%) |
| Total | 1,666 (100.0%) | 288 (100.0%) |
Physical Housing Characteristics in Wahkiakum County
Housing Structures in Wahkiakum County
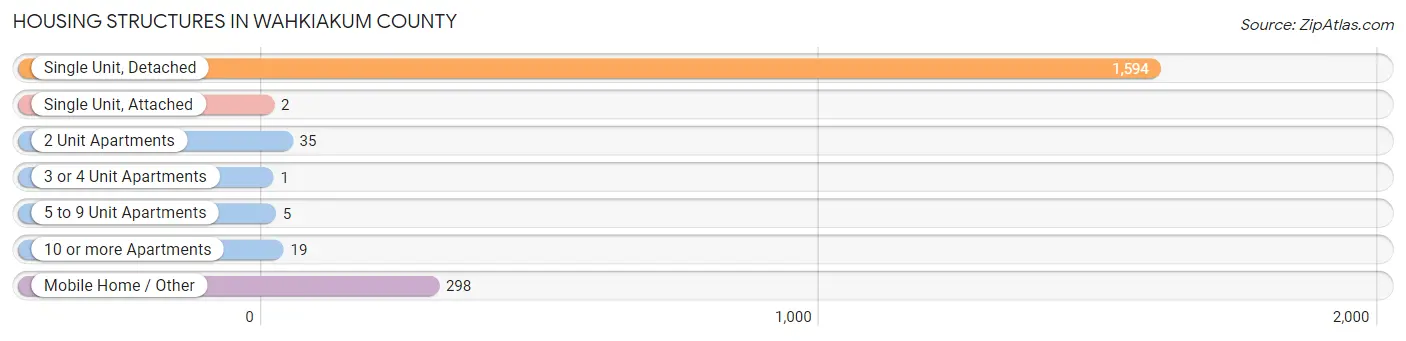
| Structure Type | # Housing Units | % Housing Units |
| Single Unit, Detached | 1,594 | 81.6% |
| Single Unit, Attached | 2 | 0.1% |
| 2 Unit Apartments | 35 | 1.8% |
| 3 or 4 Unit Apartments | 1 | 0.1% |
| 5 to 9 Unit Apartments | 5 | 0.3% |
| 10 or more Apartments | 19 | 1.0% |
| Mobile Home / Other | 298 | 15.2% |
| Total | 1,954 | 100.0% |
Housing Structures by Occupancy in Wahkiakum County
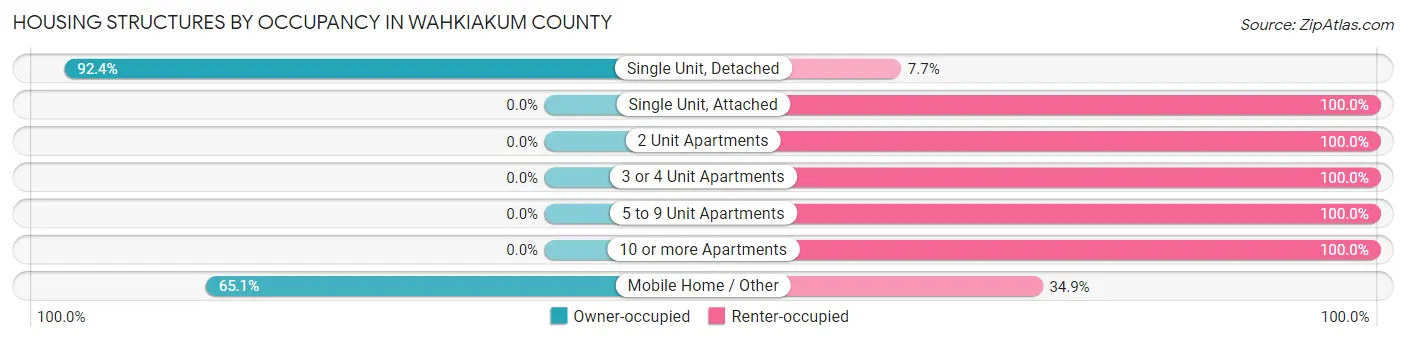
| Structure Type | Owner-occupied | Renter-occupied |
| Single Unit, Detached | 1,472 (92.3%) | 122 (7.6%) |
| Single Unit, Attached | 0 (0.0%) | 2 (100.0%) |
| 2 Unit Apartments | 0 (0.0%) | 35 (100.0%) |
| 3 or 4 Unit Apartments | 0 (0.0%) | 1 (100.0%) |
| 5 to 9 Unit Apartments | 0 (0.0%) | 5 (100.0%) |
| 10 or more Apartments | 0 (0.0%) | 19 (100.0%) |
| Mobile Home / Other | 194 (65.1%) | 104 (34.9%) |
| Total | 1,666 (85.3%) | 288 (14.7%) |
Housing Structures by Number of Rooms in Wahkiakum County
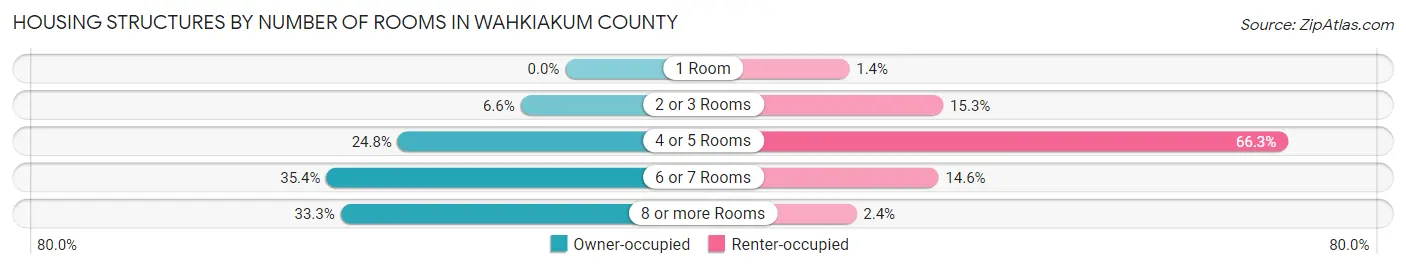
| Number of Rooms | Owner-occupied | Renter-occupied |
| 1 Room | 0 (0.0%) | 4 (1.4%) |
| 2 or 3 Rooms | 110 (6.6%) | 44 (15.3%) |
| 4 or 5 Rooms | 413 (24.8%) | 191 (66.3%) |
| 6 or 7 Rooms | 589 (35.3%) | 42 (14.6%) |
| 8 or more Rooms | 554 (33.3%) | 7 (2.4%) |
| Total | 1,666 (100.0%) | 288 (100.0%) |
Housing Structure by Heating Type in Wahkiakum County

| Heating Type | Owner-occupied | Renter-occupied |
| Utility Gas | 16 (1.0%) | 0 (0.0%) |
| Bottled, Tank, or LP Gas | 60 (3.6%) | 13 (4.5%) |
| Electricity | 1,175 (70.5%) | 192 (66.7%) |
| Fuel Oil or Kerosene | 52 (3.1%) | 0 (0.0%) |
| Coal or Coke | 57 (3.4%) | 0 (0.0%) |
| All other Fuels | 273 (16.4%) | 74 (25.7%) |
| No Fuel Used | 33 (2.0%) | 9 (3.1%) |
| Total | 1,666 (100.0%) | 288 (100.0%) |
Household Vehicle Usage in Wahkiakum County

| Vehicles per Household | Owner-occupied | Renter-occupied |
| No Vehicle | 23 (1.4%) | 44 (15.3%) |
| 1 Vehicle | 370 (22.2%) | 142 (49.3%) |
| 2 Vehicles | 763 (45.8%) | 36 (12.5%) |
| 3 or more Vehicles | 510 (30.6%) | 66 (22.9%) |
| Total | 1,666 (100.0%) | 288 (100.0%) |
Real Estate & Mortgages in Wahkiakum County
Real Estate and Mortgage Overview in Wahkiakum County
| Characteristic | Without Mortgage | With Mortgage |
| Housing Units | 1,116 | 550 |
| Median Property Value | $292,100 | $343,400 |
| Median Household Income | $63,776 | $53 |
| Monthly Housing Costs | $477 | $16 |
| Real Estate Taxes | $1,960 | $0 |
Property Value by Mortgage Status in Wahkiakum County

| Property Value | Without Mortgage | With Mortgage |
| Less than $50,000 | 118 (10.6%) | 3 (0.5%) |
| $50,000 to $99,999 | 35 (3.1%) | 24 (4.4%) |
| $100,000 to $299,999 | 418 (37.5%) | 179 (32.6%) |
| $300,000 to $499,999 | 330 (29.6%) | 224 (40.7%) |
| $500,000 to $749,999 | 160 (14.3%) | 74 (13.5%) |
| $750,000 to $999,999 | 35 (3.1%) | 14 (2.5%) |
| $1,000,000 or more | 20 (1.8%) | 32 (5.8%) |
| Total | 1,116 (100.0%) | 550 (100.0%) |
Household Income by Mortgage Status in Wahkiakum County
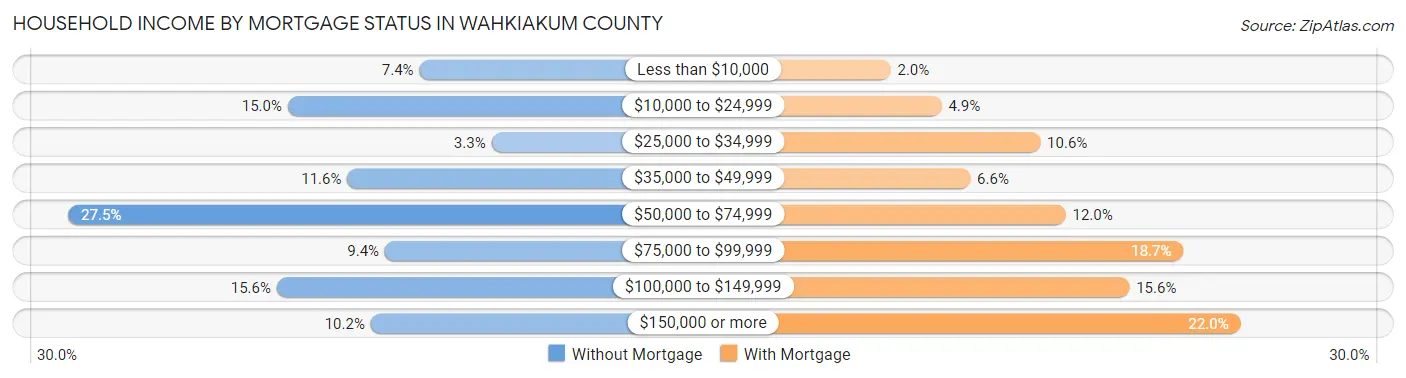
| Household Income | Without Mortgage | With Mortgage |
| Less than $10,000 | 83 (7.4%) | 11 (2.0%) |
| $10,000 to $24,999 | 167 (15.0%) | 27 (4.9%) |
| $25,000 to $34,999 | 37 (3.3%) | 58 (10.5%) |
| $35,000 to $49,999 | 129 (11.6%) | 36 (6.6%) |
| $50,000 to $74,999 | 307 (27.5%) | 66 (12.0%) |
| $75,000 to $99,999 | 105 (9.4%) | 103 (18.7%) |
| $100,000 to $149,999 | 174 (15.6%) | 86 (15.6%) |
| $150,000 or more | 114 (10.2%) | 121 (22.0%) |
| Total | 1,116 (100.0%) | 550 (100.0%) |
Property Value to Household Income Ratio in Wahkiakum County
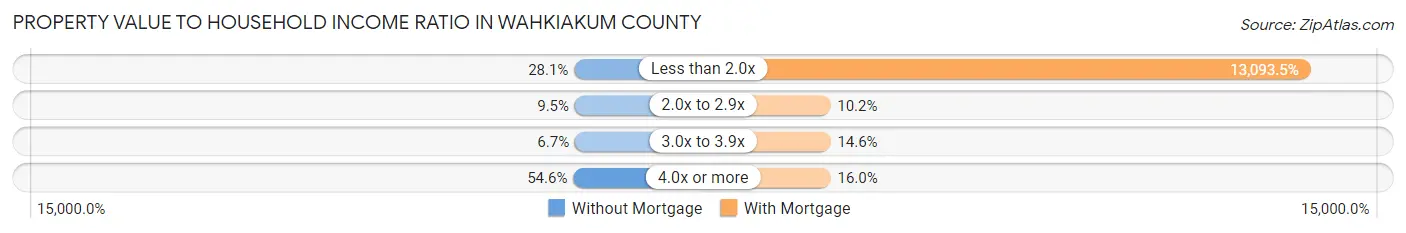
| Value-to-Income Ratio | Without Mortgage | With Mortgage |
| Less than 2.0x | 313 (28.1%) | 72,014 (13,093.5%) |
| 2.0x to 2.9x | 106 (9.5%) | 56 (10.2%) |
| 3.0x to 3.9x | 75 (6.7%) | 80 (14.5%) |
| 4.0x or more | 609 (54.6%) | 88 (16.0%) |
| Total | 1,116 (100.0%) | 550 (100.0%) |
Real Estate Taxes by Mortgage Status in Wahkiakum County
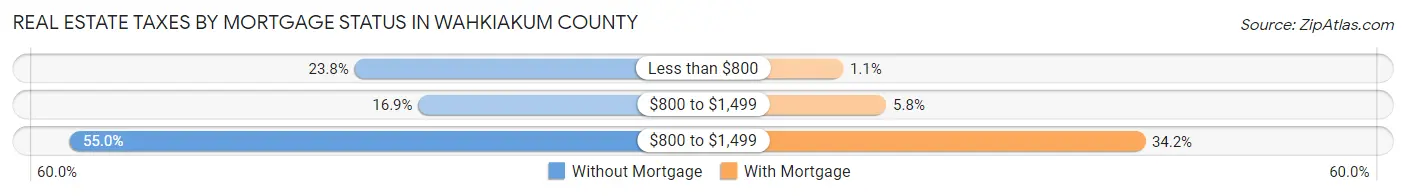
| Property Taxes | Without Mortgage | With Mortgage |
| Less than $800 | 266 (23.8%) | 6 (1.1%) |
| $800 to $1,499 | 188 (16.9%) | 32 (5.8%) |
| $800 to $1,499 | 614 (55.0%) | 188 (34.2%) |
| Total | 1,116 (100.0%) | 550 (100.0%) |
Health & Disability in Wahkiakum County
Health Insurance Coverage by Age in Wahkiakum County
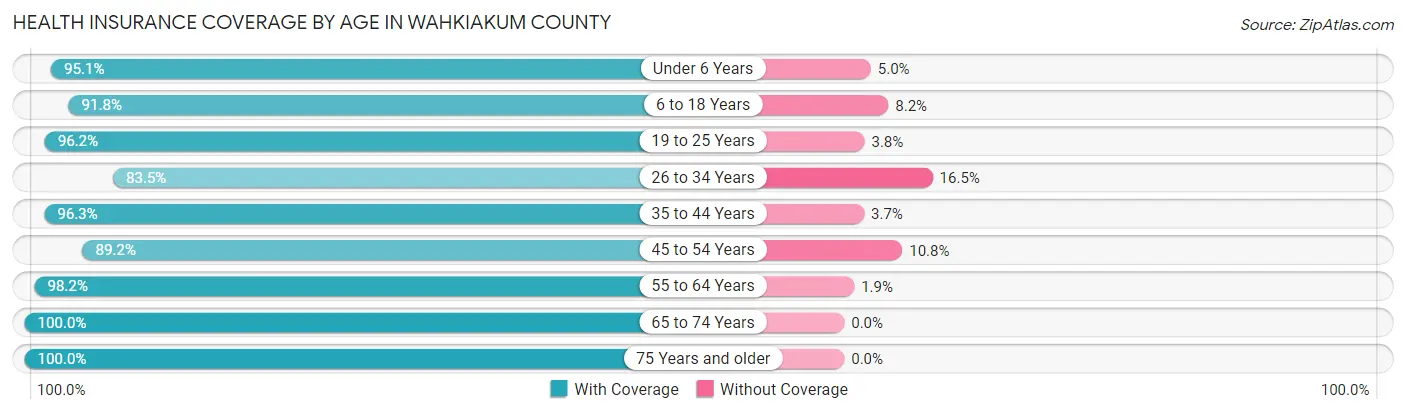
| Age Bracket | With Coverage | Without Coverage |
| Under 6 Years | 211 (95.1%) | 11 (5.0%) |
| 6 to 18 Years | 547 (91.8%) | 49 (8.2%) |
| 19 to 25 Years | 204 (96.2%) | 8 (3.8%) |
| 26 to 34 Years | 228 (83.5%) | 45 (16.5%) |
| 35 to 44 Years | 392 (96.3%) | 15 (3.7%) |
| 45 to 54 Years | 412 (89.2%) | 50 (10.8%) |
| 55 to 64 Years | 794 (98.2%) | 15 (1.8%) |
| 65 to 74 Years | 891 (100.0%) | 0 (0.0%) |
| 75 Years and older | 568 (100.0%) | 0 (0.0%) |
| Total | 4,247 (95.7%) | 193 (4.3%) |
Health Insurance Coverage by Citizenship Status in Wahkiakum County
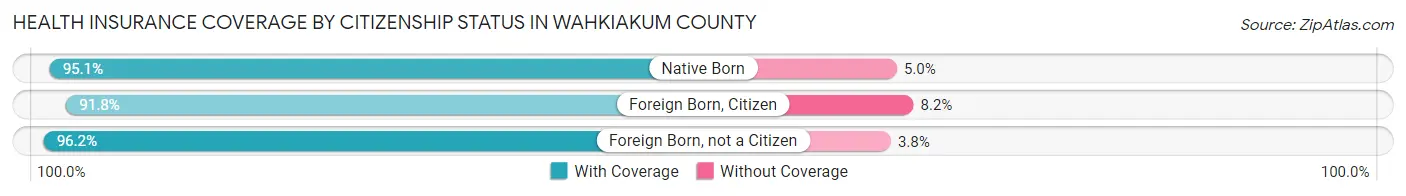
| Citizenship Status | With Coverage | Without Coverage |
| Native Born | 211 (95.1%) | 11 (5.0%) |
| Foreign Born, Citizen | 547 (91.8%) | 49 (8.2%) |
| Foreign Born, not a Citizen | 204 (96.2%) | 8 (3.8%) |
Health Insurance Coverage by Household Income in Wahkiakum County
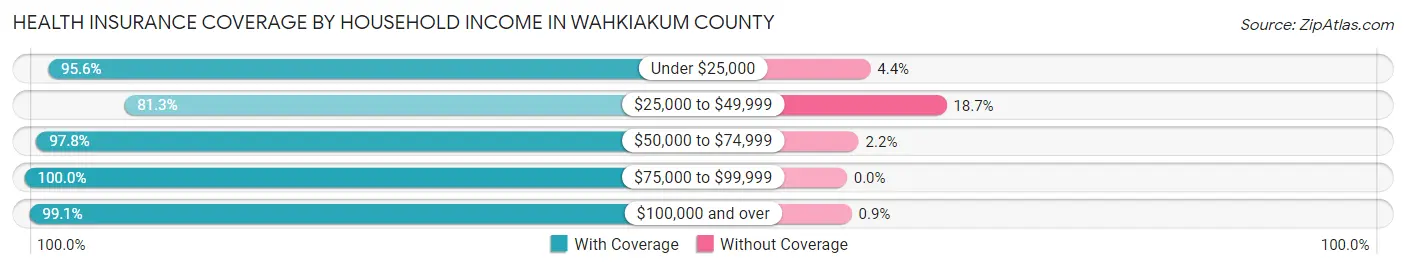
| Household Income | With Coverage | Without Coverage |
| Under $25,000 | 778 (95.6%) | 36 (4.4%) |
| $25,000 to $49,999 | 514 (81.3%) | 118 (18.7%) |
| $50,000 to $74,999 | 1,235 (97.8%) | 28 (2.2%) |
| $75,000 to $99,999 | 500 (100.0%) | 0 (0.0%) |
| $100,000 and over | 1,210 (99.1%) | 11 (0.9%) |
Public vs Private Health Insurance Coverage by Age in Wahkiakum County
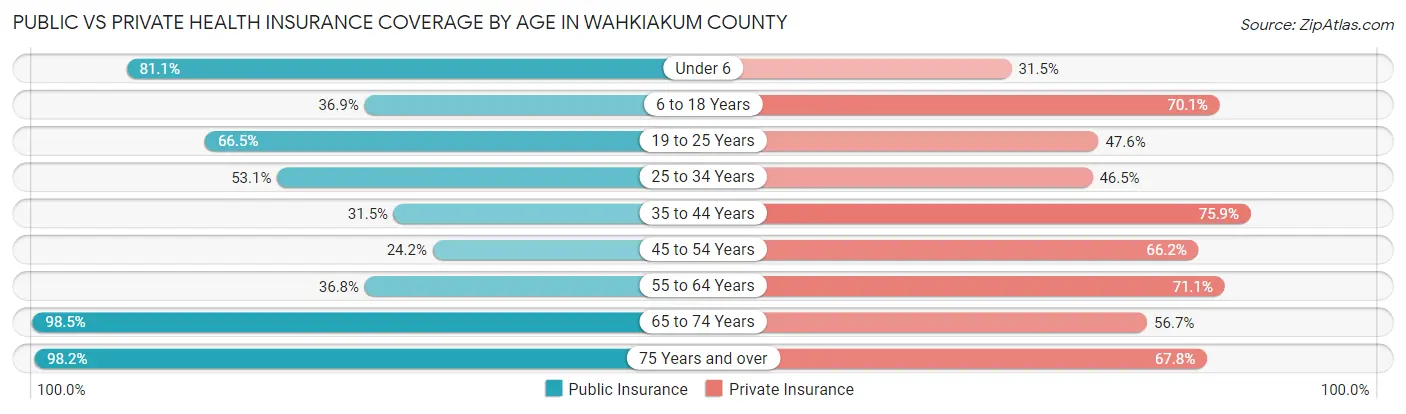
| Age Bracket | Public Insurance | Private Insurance |
| Under 6 | 180 (81.1%) | 70 (31.5%) |
| 6 to 18 Years | 220 (36.9%) | 418 (70.1%) |
| 19 to 25 Years | 141 (66.5%) | 101 (47.6%) |
| 25 to 34 Years | 145 (53.1%) | 127 (46.5%) |
| 35 to 44 Years | 128 (31.5%) | 309 (75.9%) |
| 45 to 54 Years | 112 (24.2%) | 306 (66.2%) |
| 55 to 64 Years | 298 (36.8%) | 575 (71.1%) |
| 65 to 74 Years | 878 (98.5%) | 505 (56.7%) |
| 75 Years and over | 558 (98.2%) | 385 (67.8%) |
| Total | 2,660 (59.9%) | 2,796 (63.0%) |
Disability Status by Sex by Age in Wahkiakum County
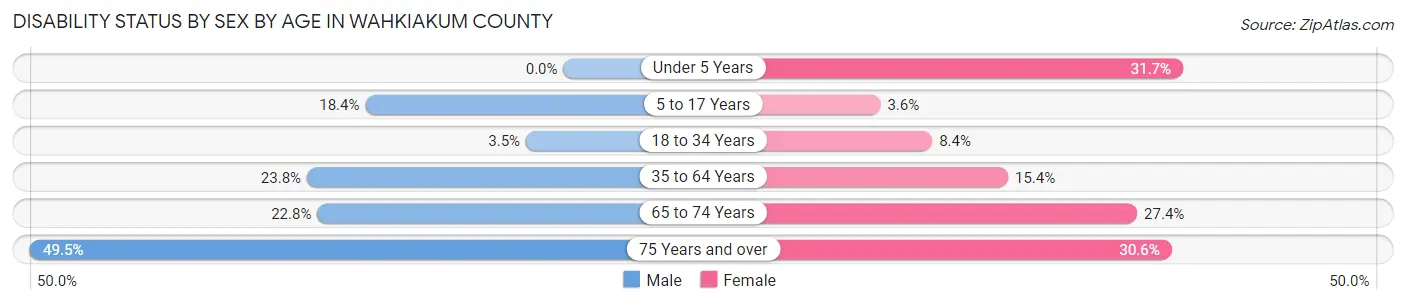
| Age Bracket | Male | Female |
| Under 5 Years | 0 (0.0%) | 25 (31.7%) |
| 5 to 17 Years | 68 (18.4%) | 9 (3.6%) |
| 18 to 34 Years | 9 (3.5%) | 23 (8.4%) |
| 35 to 64 Years | 188 (23.8%) | 137 (15.4%) |
| 65 to 74 Years | 111 (22.8%) | 111 (27.4%) |
| 75 Years and over | 142 (49.5%) | 86 (30.6%) |
Disability Class by Sex by Age in Wahkiakum County
Disability Class: Hearing Difficulty
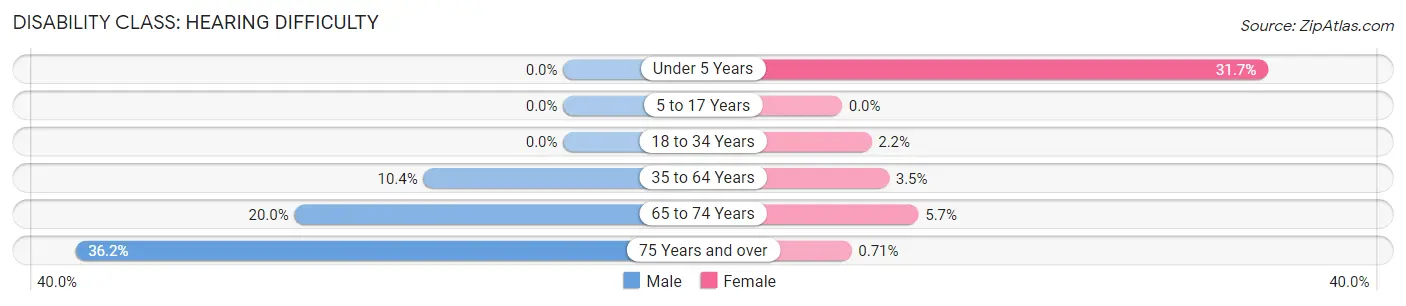
| Age Bracket | Male | Female |
| Under 5 Years | 0 (0.0%) | 25 (31.7%) |
| 5 to 17 Years | 0 (0.0%) | 0 (0.0%) |
| 18 to 34 Years | 0 (0.0%) | 6 (2.2%) |
| 35 to 64 Years | 82 (10.4%) | 31 (3.5%) |
| 65 to 74 Years | 97 (20.0%) | 23 (5.7%) |
| 75 Years and over | 104 (36.2%) | 2 (0.7%) |
Disability Class: Vision Difficulty
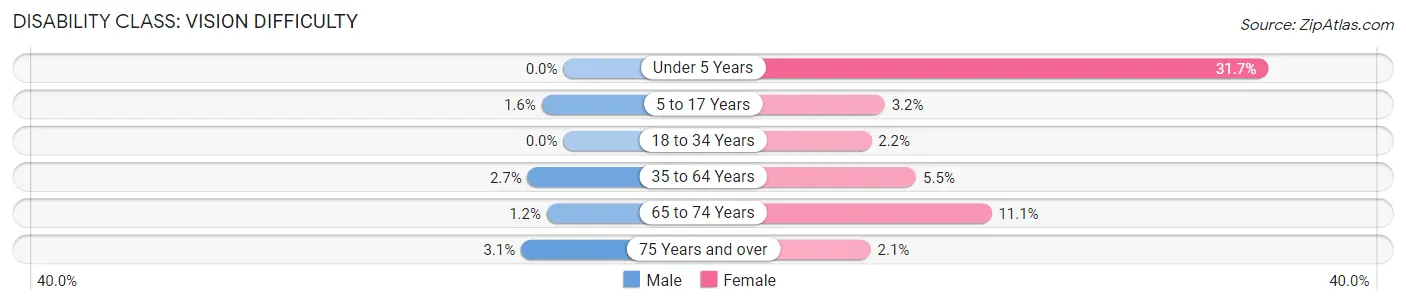
| Age Bracket | Male | Female |
| Under 5 Years | 0 (0.0%) | 25 (31.7%) |
| 5 to 17 Years | 6 (1.6%) | 8 (3.2%) |
| 18 to 34 Years | 0 (0.0%) | 6 (2.2%) |
| 35 to 64 Years | 21 (2.7%) | 49 (5.5%) |
| 65 to 74 Years | 6 (1.2%) | 45 (11.1%) |
| 75 Years and over | 9 (3.1%) | 6 (2.1%) |
Disability Class: Cognitive Difficulty
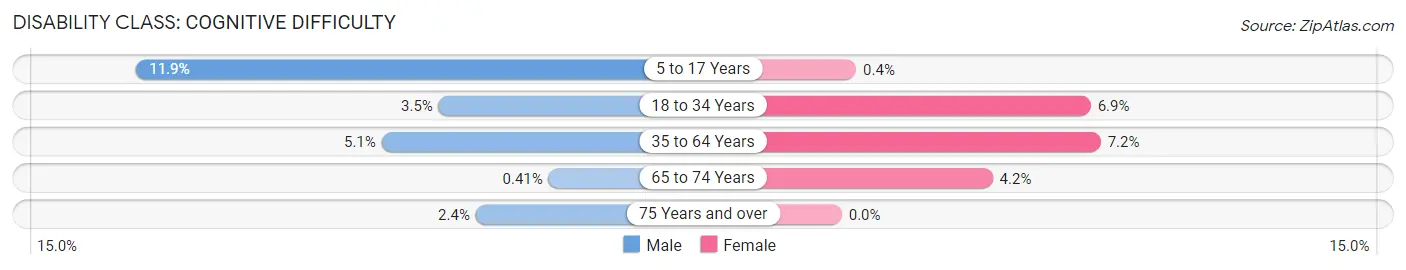
| Age Bracket | Male | Female |
| 5 to 17 Years | 44 (11.9%) | 1 (0.4%) |
| 18 to 34 Years | 9 (3.5%) | 19 (6.9%) |
| 35 to 64 Years | 40 (5.1%) | 64 (7.2%) |
| 65 to 74 Years | 2 (0.4%) | 17 (4.2%) |
| 75 Years and over | 7 (2.4%) | 0 (0.0%) |
Disability Class: Ambulatory Difficulty
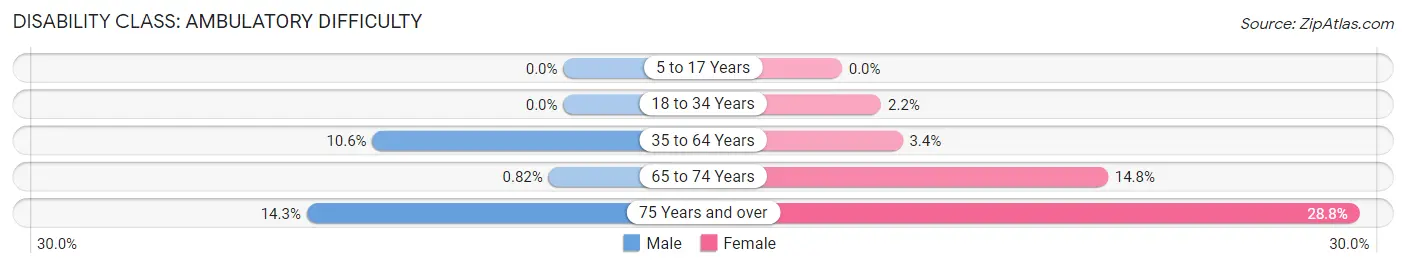
| Age Bracket | Male | Female |
| 5 to 17 Years | 0 (0.0%) | 0 (0.0%) |
| 18 to 34 Years | 0 (0.0%) | 6 (2.2%) |
| 35 to 64 Years | 84 (10.6%) | 30 (3.4%) |
| 65 to 74 Years | 4 (0.8%) | 60 (14.8%) |
| 75 Years and over | 41 (14.3%) | 81 (28.8%) |
Disability Class: Self-Care Difficulty

| Age Bracket | Male | Female |
| 5 to 17 Years | 41 (11.1%) | 0 (0.0%) |
| 18 to 34 Years | 0 (0.0%) | 7 (2.5%) |
| 35 to 64 Years | 30 (3.8%) | 28 (3.2%) |
| 65 to 74 Years | 0 (0.0%) | 4 (1.0%) |
| 75 Years and over | 8 (2.8%) | 47 (16.7%) |
Technology Access in Wahkiakum County
Computing Device Access in Wahkiakum County

| Device Type | # Households | % Households |
| Desktop or Laptop | 1,603 | 82.0% |
| Smartphone | 1,540 | 78.8% |
| Tablet | 1,239 | 63.4% |
| No Computing Device | 84 | 4.3% |
| Total | 1,954 | 100.0% |
Internet Access in Wahkiakum County
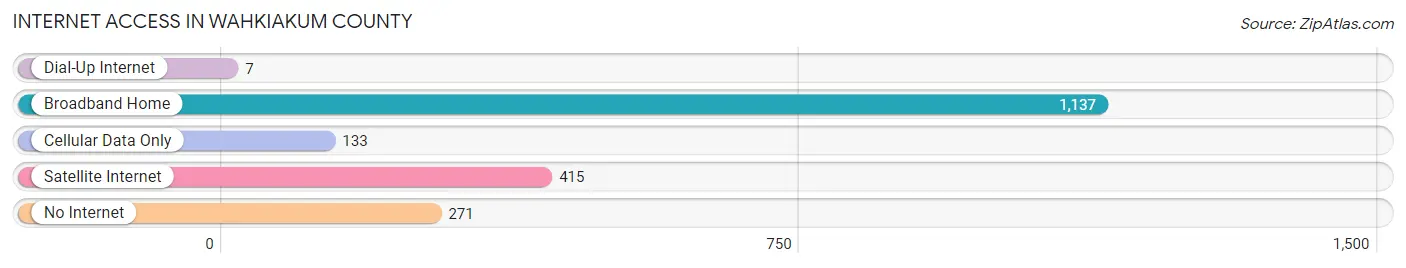
| Internet Type | # Households | % Households |
| Dial-Up Internet | 7 | 0.4% |
| Broadband Home | 1,137 | 58.2% |
| Cellular Data Only | 133 | 6.8% |
| Satellite Internet | 415 | 21.2% |
| No Internet | 271 | 13.9% |
| Total | 1,954 | 100.0% |
Wahkiakum County Summary
Wahkiakum County is located in the southwestern corner of Washington State, along the Columbia River. It is bordered by Pacific County to the north, Cowlitz County to the east, and Oregon to the south. The county seat is Cathlamet, and the county is home to approximately 4,000 people.
History
The area that is now Wahkiakum County was originally inhabited by the Chinook and Clatsop tribes. The first European settlers arrived in the area in the early 1800s, and the county was officially established in 1854. The county was named after Chief Wahkiakum of the Chinook tribe.
In the late 1800s, the county was home to several lumber mills, which provided employment for many of the residents. The county also had a thriving fishing industry, and the Columbia River was a major transportation route for goods and people.
Geography
Wahkiakum County is located in the southwestern corner of Washington State, along the Columbia River. It is bordered by Pacific County to the north, Cowlitz County to the east, and Oregon to the south. The county is mostly rural, with a few small towns and villages scattered throughout. The county is home to several state parks, including Julia Butler Hansen Refuge, Fort Columbia State Park, and Cathlamet State Park.
The county is home to several rivers, including the Columbia, Willapa, and Grays Rivers. The county is also home to several lakes, including Deep River Lake, Lake Sacajawea, and Lake Mayfield.
Economy
The economy of Wahkiakum County is largely based on agriculture and fishing. The county is home to several farms, which produce a variety of crops, including wheat, hay, and vegetables. The county is also home to several fishing operations, which harvest salmon, steelhead, and other fish from the Columbia River.
The county is also home to several timber operations, which harvest timber from the county’s forests. The county is also home to several small businesses, including restaurants, retail stores, and other services.
Demographics
As of the 2010 census, the population of Wahkiakum County was 4,000. The population is largely white (90.2%), with small percentages of Native American (2.2%), Asian (1.2%), and African American (0.7%) residents. The median household income is $41,000, and the median age is 44.
Conclusion
Wahkiakum County is a rural county located in the southwestern corner of Washington State, along the Columbia River. The county is home to approximately 4,000 people, and the economy is largely based on agriculture and fishing. The county is home to several state parks, rivers, and lakes, and is a popular destination for outdoor recreation.
Common Questions
What is the Total Population of Wahkiakum County?
Total Population of Wahkiakum County is 4,476.
What is the Total Male Population of Wahkiakum County?
Total Male Population of Wahkiakum County is 2,276.
What is the Total Female Population of Wahkiakum County?
Total Female Population of Wahkiakum County is 2,200.
What is the Ratio of Males per 100 Females in Wahkiakum County?
There are 103.45 Males per 100 Females in Wahkiakum County.
What is the Ratio of Females per 100 Males in Wahkiakum County?
There are 96.66 Females per 100 Males in Wahkiakum County.
What is the Median Population Age in Wahkiakum County?
Median Population Age in Wahkiakum County is 56.3 Years.
What is the Average Family Size in Wahkiakum County
Average Family Size in Wahkiakum County is 2.7 People.
What is the Average Household Size in Wahkiakum County
Average Household Size in Wahkiakum County is 2.3 People.
What is Per Capita Income in Wahkiakum County?
Per Capita income in Wahkiakum County is $31,643.
What is the Median Family Income in Wahkiakum County?
Median Family Income in Wahkiakum County is $68,382.
What is the Median Household income in Wahkiakum County?
Median Household Income in Wahkiakum County is $59,167.
What is Income or Wage Gap in Wahkiakum County?
Income or Wage Gap in Wahkiakum County is 64.7%.
Women in Wahkiakum County earn 35.3 cents for every dollar earned by a man.
What is Inequality or Gini Index in Wahkiakum County?
Inequality or Gini Index in Wahkiakum County is 0.43.
How Large is the Labor Force in Wahkiakum County?
There are 1,606 People in the Labor Forcein in Wahkiakum County.
What is the Percentage of People in the Labor Force in Wahkiakum County?
42.8% of People are in the Labor Force in Wahkiakum County.
What is the Unemployment Rate in Wahkiakum County?
Unemployment Rate in Wahkiakum County is 3.2%.