Thurston County, WA
Thurston County Overview
294,272
TOTAL POPULATION
145,124
MALE POPULATION
149,148
FEMALE POPULATION
97.30
MALES / 100 FEMALES
102.77
FEMALES / 100 MALES
39.5
MEDIAN AGE
3.0
AVG FAMILY SIZE
2.5
AVG HOUSEHOLD SIZE
$42,306
PER CAPITA INCOME
$106,190
AVG FAMILY INCOME
$88,895
AVG HOUSEHOLD INCOME
27.5%
WAGE / INCOME GAP [ % ]
72.5¢/ $1
WAGE / INCOME GAP [ $ ]
$11,937
FAMILY INCOME DEFICIT
0.41
INEQUALITY / GINI INDEX
148,493
LABOR FORCE [ PEOPLE ]
62.0%
PERCENT IN LABOR FORCE
5.5%
UNEMPLOYMENT RATE
Thurston County Area Codes
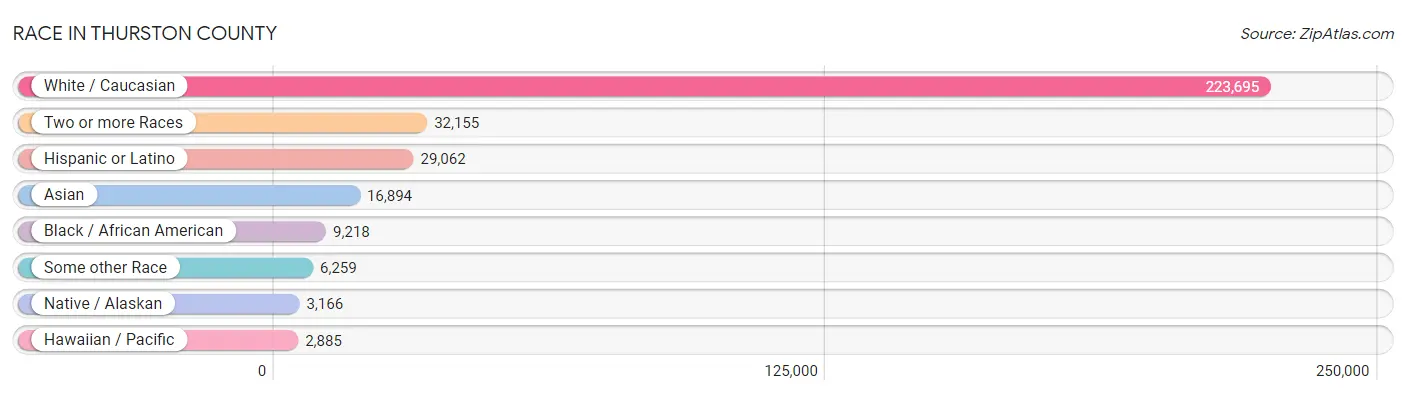
Race in Thurston County
The most populous races in Thurston County are White / Caucasian (223,695 | 76.0%), Two or more Races (32,155 | 10.9%), and Hispanic or Latino (29,062 | 9.9%).
| Race | # Population | % Population |
| Asian | 16,894 | 5.7% |
| Black / African American | 9,218 | 3.1% |
| Hawaiian / Pacific | 2,885 | 1.0% |
| Hispanic or Latino | 29,062 | 9.9% |
| Native / Alaskan | 3,166 | 1.1% |
| White / Caucasian | 223,695 | 76.0% |
| Two or more Races | 32,155 | 10.9% |
| Some other Race | 6,259 | 2.1% |
| Total | 294,272 | 100.0% |
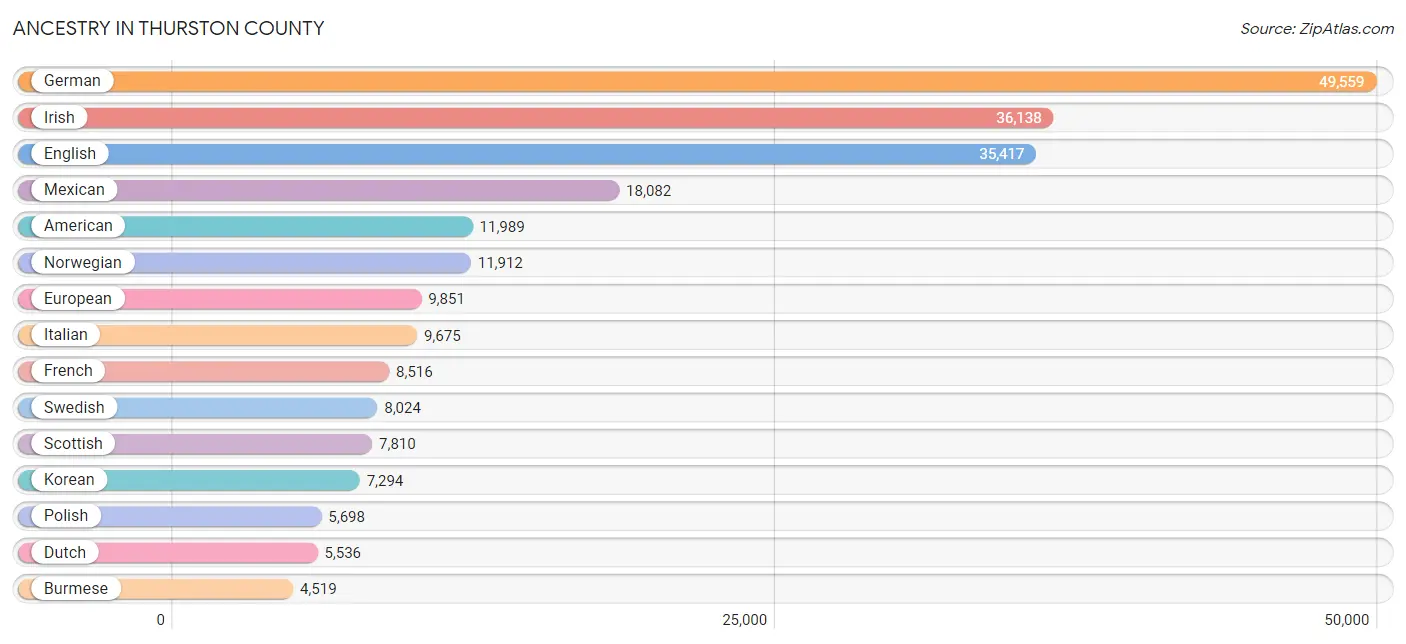
Ancestry in Thurston County
The most populous ancestries reported in Thurston County are German (49,559 | 16.8%), Irish (36,138 | 12.3%), English (35,417 | 12.0%), Mexican (18,082 | 6.1%), and American (11,989 | 4.1%), together accounting for 51.4% of all Thurston County residents.
| Ancestry | # Population | % Population |
| Afghan | 203 | 0.1% |
| African | 1,511 | 0.5% |
| Alaska Native | 28 | 0.0% |
| Alaskan Athabascan | 224 | 0.1% |
| Albanian | 64 | 0.0% |
| Aleut | 171 | 0.1% |
| Alsatian | 18 | 0.0% |
| American | 11,989 | 4.1% |
| Apache | 38 | 0.0% |
| Arab | 1,523 | 0.5% |
| Argentinean | 10 | 0.0% |
| Armenian | 132 | 0.0% |
| Assyrian / Chaldean / Syriac | 4 | 0.0% |
| Australian | 399 | 0.1% |
| Austrian | 771 | 0.3% |
| Bangladeshi | 47 | 0.0% |
| Barbadian | 8 | 0.0% |
| Basque | 69 | 0.0% |
| Belgian | 263 | 0.1% |
| Bhutanese | 3,627 | 1.2% |
| Blackfeet | 467 | 0.2% |
| Bolivian | 98 | 0.0% |
| Brazilian | 219 | 0.1% |
| British | 3,135 | 1.1% |
| British West Indian | 163 | 0.1% |
| Bulgarian | 26 | 0.0% |
| Burmese | 4,519 | 1.5% |
| Cajun | 64 | 0.0% |
| Canadian | 705 | 0.2% |
| Celtic | 104 | 0.0% |
| Central American | 2,323 | 0.8% |
| Central American Indian | 114 | 0.0% |
| Cherokee | 1,366 | 0.5% |
| Cheyenne | 34 | 0.0% |
| Chickasaw | 170 | 0.1% |
| Chilean | 264 | 0.1% |
| Chinese | 3 | 0.0% |
| Chippewa | 118 | 0.0% |
| Choctaw | 127 | 0.0% |
| Colombian | 423 | 0.1% |
| Colville | 102 | 0.0% |
| Comanche | 54 | 0.0% |
| Costa Rican | 10 | 0.0% |
| Cree | 57 | 0.0% |
| Creek | 108 | 0.0% |
| Croatian | 420 | 0.1% |
| Cuban | 437 | 0.2% |
| Czech | 839 | 0.3% |
| Czechoslovakian | 353 | 0.1% |
| Danish | 2,192 | 0.7% |
| Delaware | 12 | 0.0% |
| Dominican | 314 | 0.1% |
| Dutch | 5,536 | 1.9% |
| Eastern European | 897 | 0.3% |
| Ecuadorian | 108 | 0.0% |
| Egyptian | 45 | 0.0% |
| English | 35,417 | 12.0% |
| Estonian | 19 | 0.0% |
| Ethiopian | 57 | 0.0% |
| European | 9,851 | 3.4% |
| Fijian | 4 | 0.0% |
| Filipino | 224 | 0.1% |
| Finnish | 2,308 | 0.8% |
| French | 8,516 | 2.9% |
| French American Indian | 102 | 0.0% |
| French Canadian | 1,582 | 0.5% |
| German | 49,559 | 16.8% |
| German Russian | 54 | 0.0% |
| Greek | 969 | 0.3% |
| Guamanian / Chamorro | 1,788 | 0.6% |
| Guatemalan | 440 | 0.2% |
| Guyanese | 25 | 0.0% |
| Haitian | 537 | 0.2% |
| Honduran | 489 | 0.2% |
| Hungarian | 695 | 0.2% |
| Icelander | 120 | 0.0% |
| Indian (Asian) | 3,248 | 1.1% |
| Inupiat | 132 | 0.0% |
| Iranian | 193 | 0.1% |
| Iraqi | 140 | 0.1% |
| Irish | 36,138 | 12.3% |
| Iroquois | 151 | 0.1% |
| Israeli | 16 | 0.0% |
| Italian | 9,675 | 3.3% |
| Jamaican | 158 | 0.1% |
| Japanese | 1,268 | 0.4% |
| Jordanian | 282 | 0.1% |
| Kenyan | 67 | 0.0% |
| Korean | 7,294 | 2.5% |
| Laotian | 73 | 0.0% |
| Latvian | 103 | 0.0% |
| Lebanese | 228 | 0.1% |
| Liberian | 9 | 0.0% |
| Lithuanian | 440 | 0.2% |
| Lumbee | 175 | 0.1% |
| Luxembourger | 132 | 0.0% |
| Malaysian | 116 | 0.0% |
| Marshallese | 4 | 0.0% |
| Menominee | 41 | 0.0% |
| Mexican | 18,082 | 6.1% |
| Mexican American Indian | 286 | 0.1% |
| Mongolian | 75 | 0.0% |
| Moroccan | 60 | 0.0% |
| Native Hawaiian | 1,564 | 0.5% |
| Navajo | 133 | 0.1% |
| Nicaraguan | 77 | 0.0% |
| Nigerian | 180 | 0.1% |
| Northern European | 2,195 | 0.7% |
| Norwegian | 11,912 | 4.1% |
| Okinawan | 190 | 0.1% |
| Osage | 24 | 0.0% |
| Pakistani | 567 | 0.2% |
| Panamanian | 551 | 0.2% |
| Pennsylvania German | 328 | 0.1% |
| Peruvian | 225 | 0.1% |
| Polish | 5,698 | 1.9% |
| Portuguese | 770 | 0.3% |
| Potawatomi | 46 | 0.0% |
| Pueblo | 2 | 0.0% |
| Puerto Rican | 3,596 | 1.2% |
| Puget Sound Salish | 1,154 | 0.4% |
| Romanian | 471 | 0.2% |
| Russian | 1,639 | 0.6% |
| Salvadoran | 627 | 0.2% |
| Samoan | 1,159 | 0.4% |
| Scandinavian | 3,546 | 1.2% |
| Scotch-Irish | 3,156 | 1.1% |
| Scottish | 7,810 | 2.6% |
| Seminole | 14 | 0.0% |
| Serbian | 37 | 0.0% |
| Shoshone | 21 | 0.0% |
| Sioux | 390 | 0.1% |
| Slavic | 152 | 0.1% |
| Slovak | 279 | 0.1% |
| Slovene | 119 | 0.0% |
| South African | 98 | 0.0% |
| South American | 1,336 | 0.4% |
| Spaniard | 1,204 | 0.4% |
| Spanish | 965 | 0.3% |
| Sri Lankan | 4,393 | 1.5% |
| Subsaharan African | 2,034 | 0.7% |
| Sudanese | 35 | 0.0% |
| Swedish | 8,024 | 2.7% |
| Swiss | 998 | 0.3% |
| Syrian | 100 | 0.0% |
| Thai | 1,467 | 0.5% |
| Tlingit-Haida | 151 | 0.1% |
| Trinidadian and Tobagonian | 124 | 0.0% |
| Tsimshian | 10 | 0.0% |
| Turkish | 240 | 0.1% |
| Ukrainian | 901 | 0.3% |
| Uruguayan | 11 | 0.0% |
| Venezuelan | 197 | 0.1% |
| Welsh | 2,353 | 0.8% |
| West Indian | 223 | 0.1% |
| Yakama | 99 | 0.0% |
| Yaqui | 88 | 0.0% |
| Yugoslavian | 38 | 0.0% |
| Yup'ik | 38 | 0.0% | View All 159 Rows |
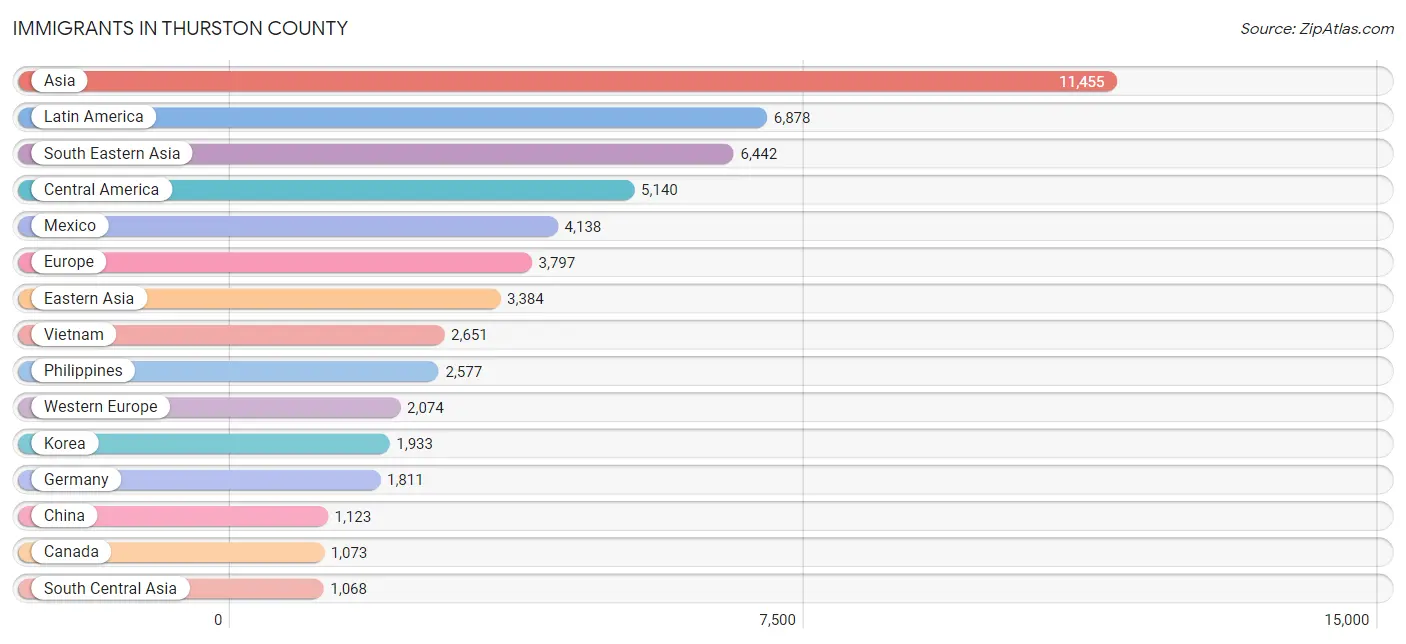
Immigrants in Thurston County
The most numerous immigrant groups reported in Thurston County came from Asia (11,455 | 3.9%), Latin America (6,878 | 2.3%), South Eastern Asia (6,442 | 2.2%), Central America (5,140 | 1.8%), and Mexico (4,138 | 1.4%), together accounting for 11.6% of all Thurston County residents.
| Immigration Origin | # Population | % Population |
| Afghanistan | 73 | 0.0% |
| Africa | 647 | 0.2% |
| Argentina | 10 | 0.0% |
| Asia | 11,455 | 3.9% |
| Australia | 254 | 0.1% |
| Austria | 19 | 0.0% |
| Azores | 3 | 0.0% |
| Barbados | 8 | 0.0% |
| Belarus | 6 | 0.0% |
| Belgium | 27 | 0.0% |
| Bolivia | 115 | 0.0% |
| Brazil | 195 | 0.1% |
| Bulgaria | 10 | 0.0% |
| Cambodia | 540 | 0.2% |
| Canada | 1,073 | 0.4% |
| Caribbean | 833 | 0.3% |
| Central America | 5,140 | 1.8% |
| Chile | 41 | 0.0% |
| China | 1,123 | 0.4% |
| Colombia | 81 | 0.0% |
| Costa Rica | 10 | 0.0% |
| Cuba | 149 | 0.1% |
| Czechoslovakia | 31 | 0.0% |
| Denmark | 30 | 0.0% |
| Dominica | 10 | 0.0% |
| Eastern Africa | 262 | 0.1% |
| Eastern Asia | 3,384 | 1.1% |
| Eastern Europe | 820 | 0.3% |
| Ecuador | 49 | 0.0% |
| Egypt | 19 | 0.0% |
| El Salvador | 278 | 0.1% |
| England | 308 | 0.1% |
| Ethiopia | 143 | 0.1% |
| Europe | 3,797 | 1.3% |
| Fiji | 1 | 0.0% |
| France | 110 | 0.0% |
| Germany | 1,811 | 0.6% |
| Ghana | 144 | 0.1% |
| Grenada | 28 | 0.0% |
| Guatemala | 144 | 0.1% |
| Guyana | 18 | 0.0% |
| Haiti | 340 | 0.1% |
| Honduras | 252 | 0.1% |
| Hong Kong | 45 | 0.0% |
| Hungary | 52 | 0.0% |
| India | 595 | 0.2% |
| Indonesia | 47 | 0.0% |
| Iran | 88 | 0.0% |
| Iraq | 321 | 0.1% |
| Ireland | 58 | 0.0% |
| Israel | 19 | 0.0% |
| Italy | 69 | 0.0% |
| Jamaica | 107 | 0.0% |
| Japan | 328 | 0.1% |
| Kenya | 82 | 0.0% |
| Korea | 1,933 | 0.7% |
| Laos | 91 | 0.0% |
| Latin America | 6,878 | 2.3% |
| Latvia | 59 | 0.0% |
| Liberia | 14 | 0.0% |
| Lithuania | 9 | 0.0% |
| Malaysia | 61 | 0.0% |
| Mexico | 4,138 | 1.4% |
| Micronesia | 21 | 0.0% |
| Middle Africa | 3 | 0.0% |
| Moldova | 2 | 0.0% |
| Nepal | 230 | 0.1% |
| Netherlands | 62 | 0.0% |
| Nigeria | 21 | 0.0% |
| Northern Africa | 86 | 0.0% |
| Northern Europe | 777 | 0.3% |
| Oceania | 812 | 0.3% |
| Pakistan | 59 | 0.0% |
| Panama | 318 | 0.1% |
| Peru | 228 | 0.1% |
| Philippines | 2,577 | 0.9% |
| Poland | 226 | 0.1% |
| Portugal | 5 | 0.0% |
| Romania | 196 | 0.1% |
| Russia | 145 | 0.1% |
| Saudi Arabia | 95 | 0.0% |
| Scotland | 107 | 0.0% |
| Singapore | 88 | 0.0% |
| Somalia | 37 | 0.0% |
| South Africa | 79 | 0.0% |
| South America | 905 | 0.3% |
| South Central Asia | 1,068 | 0.4% |
| South Eastern Asia | 6,442 | 2.2% |
| Southern Europe | 126 | 0.0% |
| Spain | 52 | 0.0% |
| Sri Lanka | 23 | 0.0% |
| Sudan | 43 | 0.0% |
| Sweden | 17 | 0.0% |
| Switzerland | 45 | 0.0% |
| Syria | 43 | 0.0% |
| Taiwan | 137 | 0.1% |
| Thailand | 387 | 0.1% |
| Trinidad and Tobago | 117 | 0.0% |
| Turkey | 83 | 0.0% |
| Ukraine | 75 | 0.0% |
| Uruguay | 11 | 0.0% |
| Venezuela | 157 | 0.1% |
| Vietnam | 2,651 | 0.9% |
| Western Africa | 217 | 0.1% |
| Western Asia | 561 | 0.2% |
| Western Europe | 2,074 | 0.7% | View All 106 Rows |
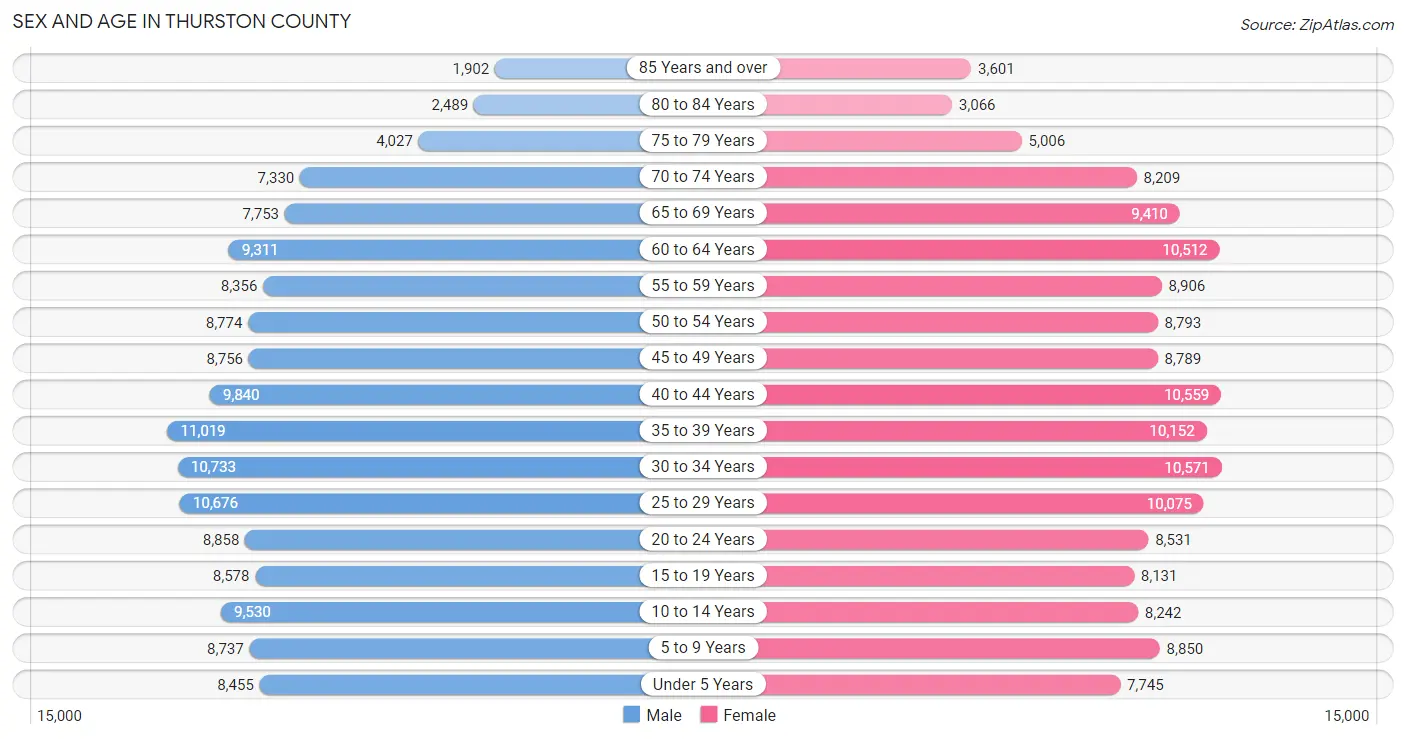
Sex and Age in Thurston County
Sex and Age in Thurston County
The most populous age groups in Thurston County are 35 to 39 Years (11,019 | 7.6%) for men and 30 to 34 Years (10,571 | 7.1%) for women.
| Age Bracket | Male | Female |
| Under 5 Years | 8,455 (5.8%) | 7,745 (5.2%) |
| 5 to 9 Years | 8,737 (6.0%) | 8,850 (5.9%) |
| 10 to 14 Years | 9,530 (6.6%) | 8,242 (5.5%) |
| 15 to 19 Years | 8,578 (5.9%) | 8,131 (5.4%) |
| 20 to 24 Years | 8,858 (6.1%) | 8,531 (5.7%) |
| 25 to 29 Years | 10,676 (7.4%) | 10,075 (6.8%) |
| 30 to 34 Years | 10,733 (7.4%) | 10,571 (7.1%) |
| 35 to 39 Years | 11,019 (7.6%) | 10,152 (6.8%) |
| 40 to 44 Years | 9,840 (6.8%) | 10,559 (7.1%) |
| 45 to 49 Years | 8,756 (6.0%) | 8,789 (5.9%) |
| 50 to 54 Years | 8,774 (6.0%) | 8,793 (5.9%) |
| 55 to 59 Years | 8,356 (5.8%) | 8,906 (6.0%) |
| 60 to 64 Years | 9,311 (6.4%) | 10,512 (7.0%) |
| 65 to 69 Years | 7,753 (5.3%) | 9,410 (6.3%) |
| 70 to 74 Years | 7,330 (5.1%) | 8,209 (5.5%) |
| 75 to 79 Years | 4,027 (2.8%) | 5,006 (3.4%) |
| 80 to 84 Years | 2,489 (1.7%) | 3,066 (2.1%) |
| 85 Years and over | 1,902 (1.3%) | 3,601 (2.4%) |
| Total | 145,124 (100.0%) | 149,148 (100.0%) |
Families and Households in Thurston County
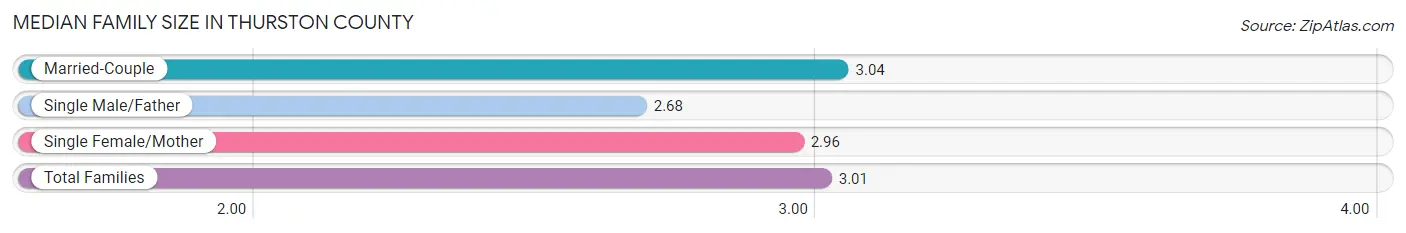
Median Family Size in Thurston County
The median family size in Thurston County is 3.01 persons per family, with married-couple families (59,073 | 77.7%) accounting for the largest median family size of 3.04 persons per family. On the other hand, single male/father families (5,315 | 7.0%) represent the smallest median family size with 2.68 persons per family.
| Family Type | # Families | Family Size |
| Married-Couple | 59,073 (77.7%) | 3.04 |
| Single Male/Father | 5,315 (7.0%) | 2.68 |
| Single Female/Mother | 11,681 (15.4%) | 2.96 |
| Total Families | 76,069 (100.0%) | 3.01 |
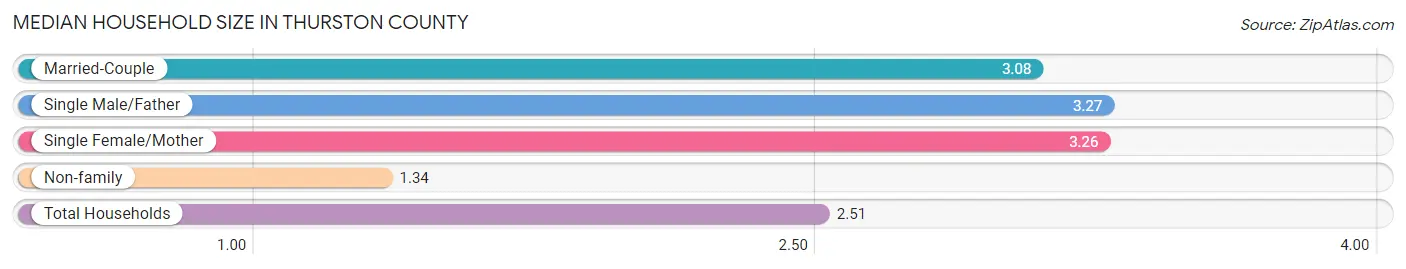
Median Household Size in Thurston County
The median household size in Thurston County is 2.51 persons per household, with single male/father households (5,315 | 4.6%) accounting for the largest median household size of 3.27 persons per household. non-family households (39,626 | 34.3%) represent the smallest median household size with 1.34 persons per household.
| Household Type | # Households | Household Size |
| Married-Couple | 59,073 (51.1%) | 3.08 |
| Single Male/Father | 5,315 (4.6%) | 3.27 |
| Single Female/Mother | 11,681 (10.1%) | 3.26 |
| Non-family | 39,626 (34.3%) | 1.34 |
| Total Households | 115,695 (100.0%) | 2.51 |
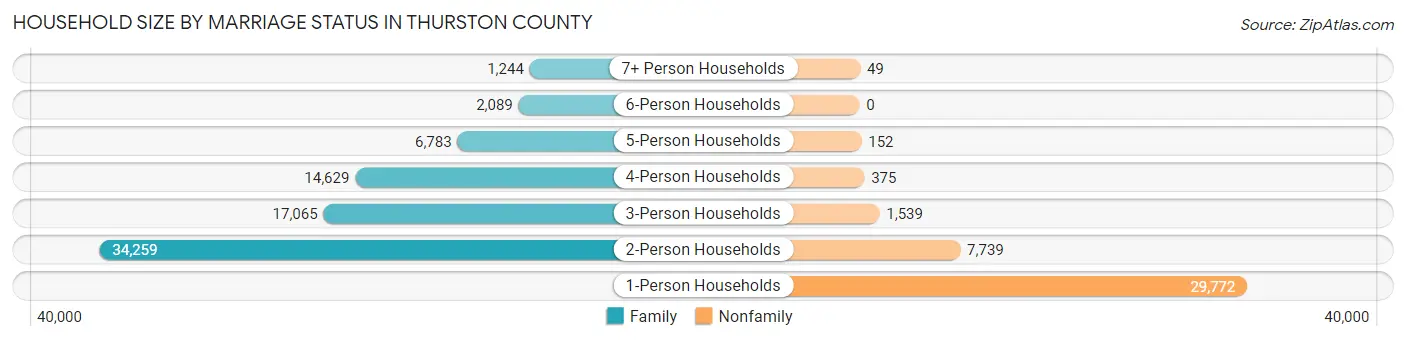
Household Size by Marriage Status in Thurston County
Out of a total of 115,695 households in Thurston County, 76,069 (65.7%) are family households, while 39,626 (34.3%) are nonfamily households. The most numerous type of family households are 2-person households, comprising 34,259, and the most common type of nonfamily households are 1-person households, comprising 29,772.
| Household Size | Family Households | Nonfamily Households |
| 1-Person Households | - | 29,772 (25.7%) |
| 2-Person Households | 34,259 (29.6%) | 7,739 (6.7%) |
| 3-Person Households | 17,065 (14.7%) | 1,539 (1.3%) |
| 4-Person Households | 14,629 (12.6%) | 375 (0.3%) |
| 5-Person Households | 6,783 (5.9%) | 152 (0.1%) |
| 6-Person Households | 2,089 (1.8%) | 0 (0.0%) |
| 7+ Person Households | 1,244 (1.1%) | 49 (0.0%) |
| Total | 76,069 (65.7%) | 39,626 (34.3%) |
Female Fertility in Thurston County
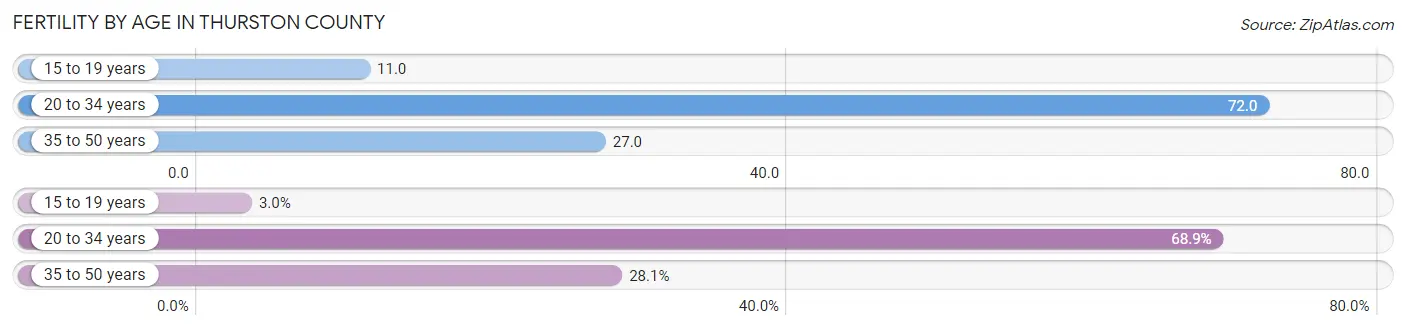
Fertility by Age in Thurston County
Average fertility rate in Thurston County is 45.0 births per 1,000 women. Women in the age bracket of 20 to 34 years have the highest fertility rate with 72.0 births per 1,000 women. Women in the age bracket of 20 to 34 years acount for 68.9% of all women with births.
| Age Bracket | Women with Births | Births / 1,000 Women |
| 15 to 19 years | 91 (3.0%) | 11.0 |
| 20 to 34 years | 2,106 (68.9%) | 72.0 |
| 35 to 50 years | 859 (28.1%) | 27.0 |
| Total | 3,056 (100.0%) | 45.0 |
Fertility by Age by Marriage Status in Thurston County
68.2% of women with births (3,056) in Thurston County are married. The highest percentage of unmarried women with births falls into 15 to 19 years age bracket with 100.0% of them unmarried at the time of birth, while the lowest percentage of unmarried women with births belong to 35 to 50 years age bracket with 17.0% of them unmarried.
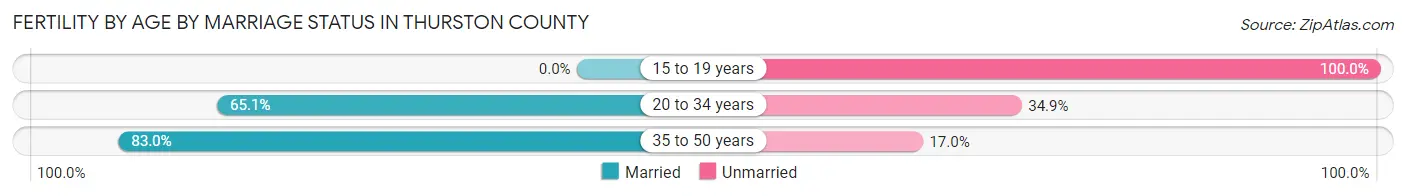
| Age Bracket | Married | Unmarried |
| 15 to 19 years | 0 (0.0%) | 91 (100.0%) |
| 20 to 34 years | 1,371 (65.1%) | 735 (34.9%) |
| 35 to 50 years | 713 (83.0%) | 146 (17.0%) |
| Total | 2,084 (68.2%) | 972 (31.8%) |
Fertility by Education in Thurston County
Average fertility rate in Thurston County is 45.0 births per 1,000 women. Women with the education attainment of high school diploma have the highest fertility rate of 80.0 births per 1,000 women, while women with the education attainment of less than high school have the lowest fertility at 9.0 births per 1,000 women. Women with the education attainment of college or associate's degree represent 36.0% of all women with births.
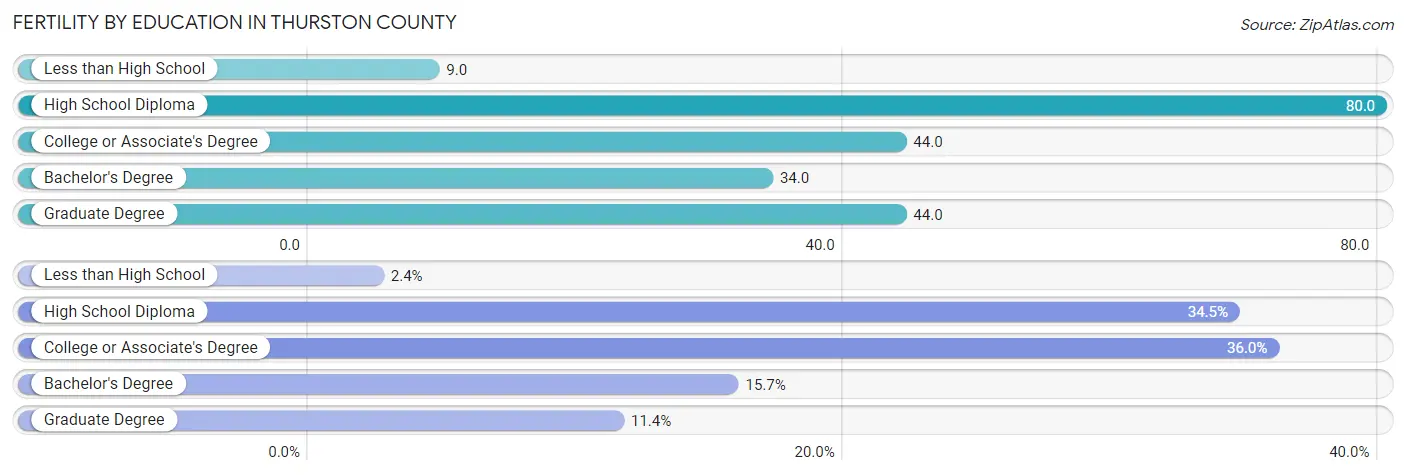
| Educational Attainment | Women with Births | Births / 1,000 Women |
| Less than High School | 74 (2.4%) | 9.0 |
| High School Diploma | 1,054 (34.5%) | 80.0 |
| College or Associate's Degree | 1,099 (36.0%) | 44.0 |
| Bachelor's Degree | 480 (15.7%) | 34.0 |
| Graduate Degree | 349 (11.4%) | 44.0 |
| Total | 3,056 (100.0%) | 45.0 |
Fertility by Education by Marriage Status in Thurston County
31.8% of women with births in Thurston County are unmarried. Women with the educational attainment of graduate degree are most likely to be married with 95.7% of them married at childbirth, while women with the educational attainment of less than high school are least likely to be married with 100.0% of them unmarried at childbirth.
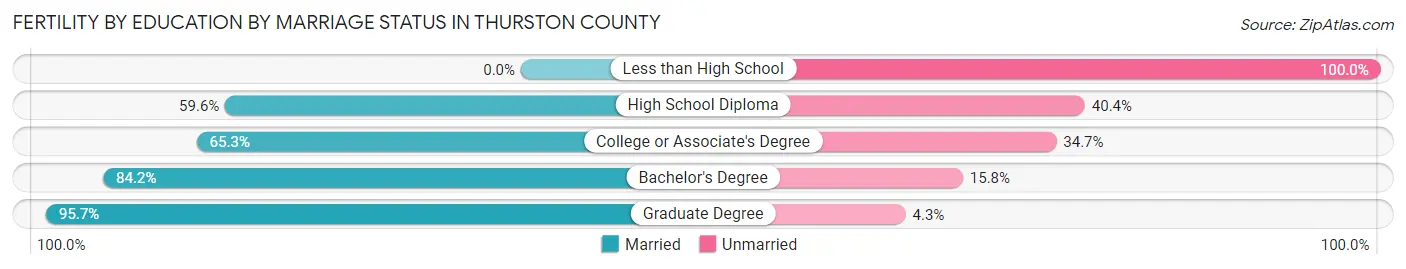
| Educational Attainment | Married | Unmarried |
| Less than High School | 0 (0.0%) | 74 (100.0%) |
| High School Diploma | 628 (59.6%) | 426 (40.4%) |
| College or Associate's Degree | 718 (65.3%) | 381 (34.7%) |
| Bachelor's Degree | 404 (84.2%) | 76 (15.8%) |
| Graduate Degree | 334 (95.7%) | 15 (4.3%) |
| Total | 2,084 (68.2%) | 972 (31.8%) |
Income in Thurston County
Income Overview in Thurston County
Per Capita Income in Thurston County is $42,306, while median incomes of families and households are $106,190 and $88,895 respectively.
| Characteristic | Number | Measure |
| Per Capita Income | 294,272 | $42,306 |
| Median Family Income | 76,069 | $106,190 |
| Mean Family Income | 76,069 | $122,117 |
| Median Household Income | 115,695 | $88,895 |
| Mean Household Income | 115,695 | $105,913 |
| Income Deficit | 76,069 | $11,937 |
| Wage / Income Gap (%) | 294,272 | 27.48% |
| Wage / Income Gap ($) | 294,272 | 72.52¢ per $1 |
| Gini / Inequality Index | 294,272 | 0.41 |
Earnings by Sex in Thurston County
Average Earnings in Thurston County are $47,622, $55,374 for men and $40,158 for women, a difference of 27.5%.
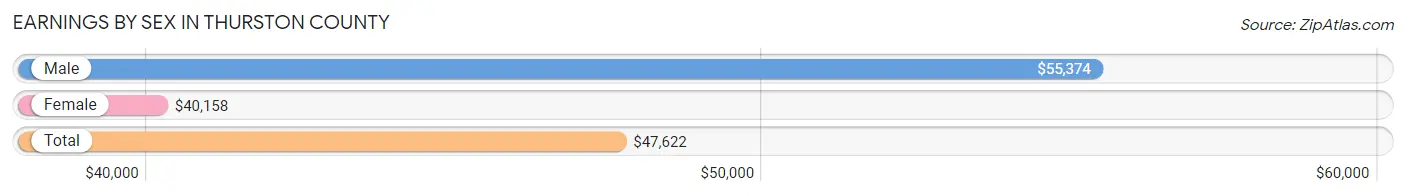
| Sex | Number | Average Earnings |
| Male | 81,789 (52.7%) | $55,374 |
| Female | 73,414 (47.3%) | $40,158 |
| Total | 155,203 (100.0%) | $47,622 |
Earnings by Sex by Income Bracket in Thurston County
The most common earnings brackets in Thurston County are $100,000+ for men (17,160 | 21.0%) and $75,000 to $99,999 for women (8,252 | 11.2%).
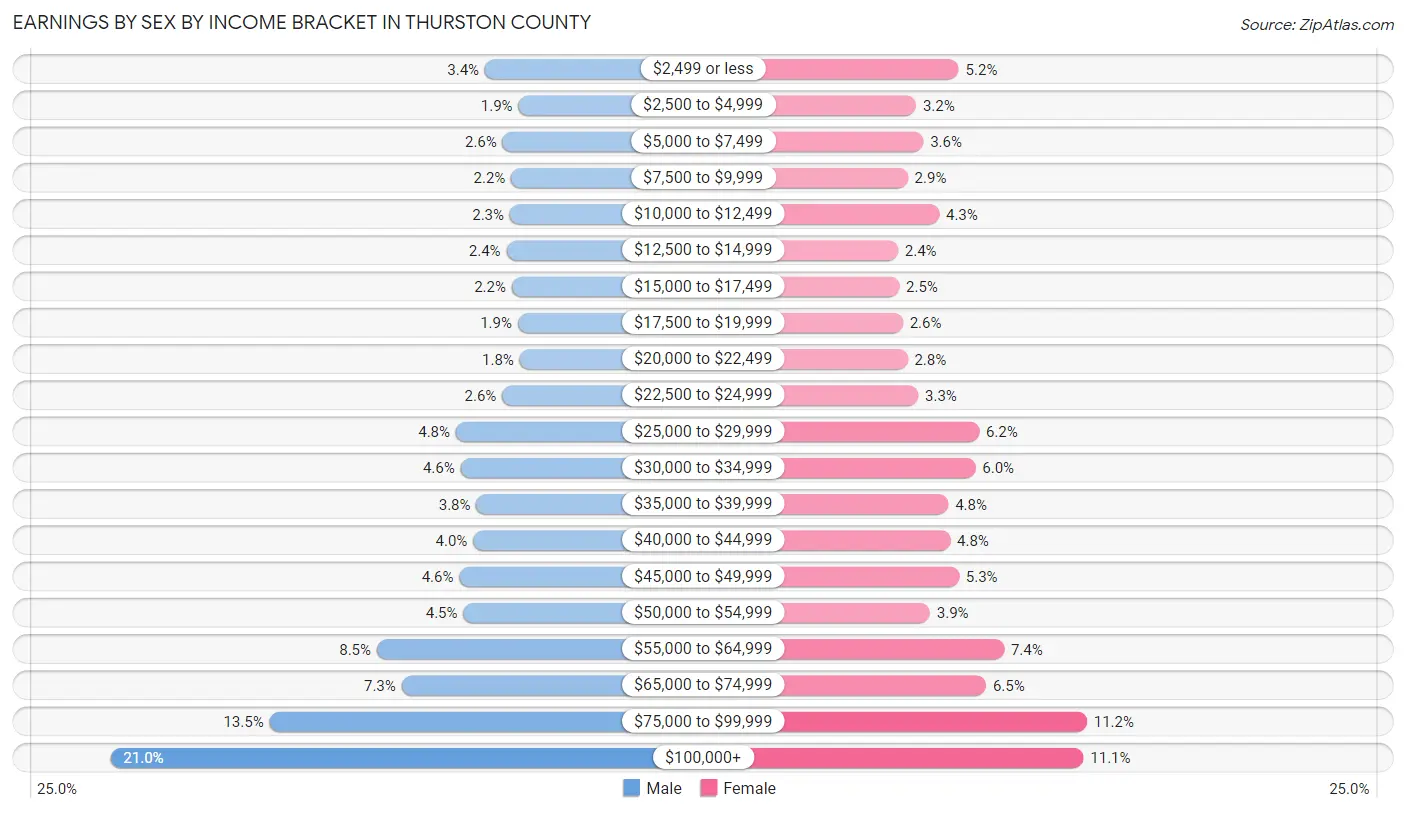
| Income | Male | Female |
| $2,499 or less | 2,814 (3.4%) | 3,844 (5.2%) |
| $2,500 to $4,999 | 1,529 (1.9%) | 2,375 (3.2%) |
| $5,000 to $7,499 | 2,133 (2.6%) | 2,627 (3.6%) |
| $7,500 to $9,999 | 1,811 (2.2%) | 2,094 (2.9%) |
| $10,000 to $12,499 | 1,853 (2.3%) | 3,170 (4.3%) |
| $12,500 to $14,999 | 1,984 (2.4%) | 1,752 (2.4%) |
| $15,000 to $17,499 | 1,786 (2.2%) | 1,796 (2.5%) |
| $17,500 to $19,999 | 1,550 (1.9%) | 1,925 (2.6%) |
| $20,000 to $22,499 | 1,484 (1.8%) | 2,086 (2.8%) |
| $22,500 to $24,999 | 2,151 (2.6%) | 2,451 (3.3%) |
| $25,000 to $29,999 | 3,927 (4.8%) | 4,545 (6.2%) |
| $30,000 to $34,999 | 3,749 (4.6%) | 4,423 (6.0%) |
| $35,000 to $39,999 | 3,144 (3.8%) | 3,487 (4.8%) |
| $40,000 to $44,999 | 3,267 (4.0%) | 3,551 (4.8%) |
| $45,000 to $49,999 | 3,795 (4.6%) | 3,851 (5.2%) |
| $50,000 to $54,999 | 3,639 (4.4%) | 2,856 (3.9%) |
| $55,000 to $64,999 | 6,948 (8.5%) | 5,406 (7.4%) |
| $65,000 to $74,999 | 6,000 (7.3%) | 4,790 (6.5%) |
| $75,000 to $99,999 | 11,065 (13.5%) | 8,252 (11.2%) |
| $100,000+ | 17,160 (21.0%) | 8,133 (11.1%) |
| Total | 81,789 (100.0%) | 73,414 (100.0%) |
Earnings by Sex by Educational Attainment in Thurston County
Average earnings in Thurston County are $61,754 for men and $45,978 for women, a difference of 25.6%. Men with an educational attainment of graduate degree enjoy the highest average annual earnings of $97,547, while those with less than high school education earn the least with $43,455. Women with an educational attainment of graduate degree earn the most with the average annual earnings of $81,092, while those with less than high school education have the smallest earnings of $23,903.
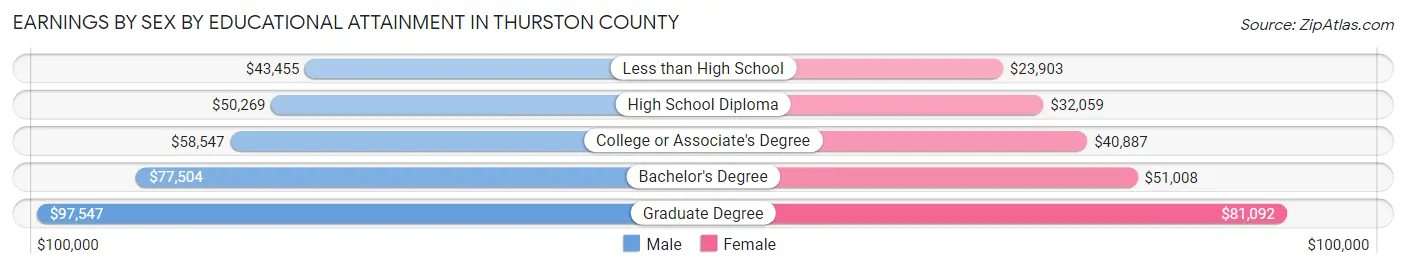
| Educational Attainment | Male Income | Female Income |
| Less than High School | $43,455 | $23,903 |
| High School Diploma | $50,269 | $32,059 |
| College or Associate's Degree | $58,547 | $40,887 |
| Bachelor's Degree | $77,504 | $51,008 |
| Graduate Degree | $97,547 | $81,092 |
| Total | $61,754 | $45,978 |
Family Income in Thurston County
Family Income Brackets in Thurston County
According to the Thurston County family income data, there are 20,767 families falling into the $100,000 to $149,999 income range, which is the most common income bracket and makes up 27.3% of all families. Conversely, the $10,000 to $14,999 income bracket is the least frequent group with only 913 families (1.2%) belonging to this category.
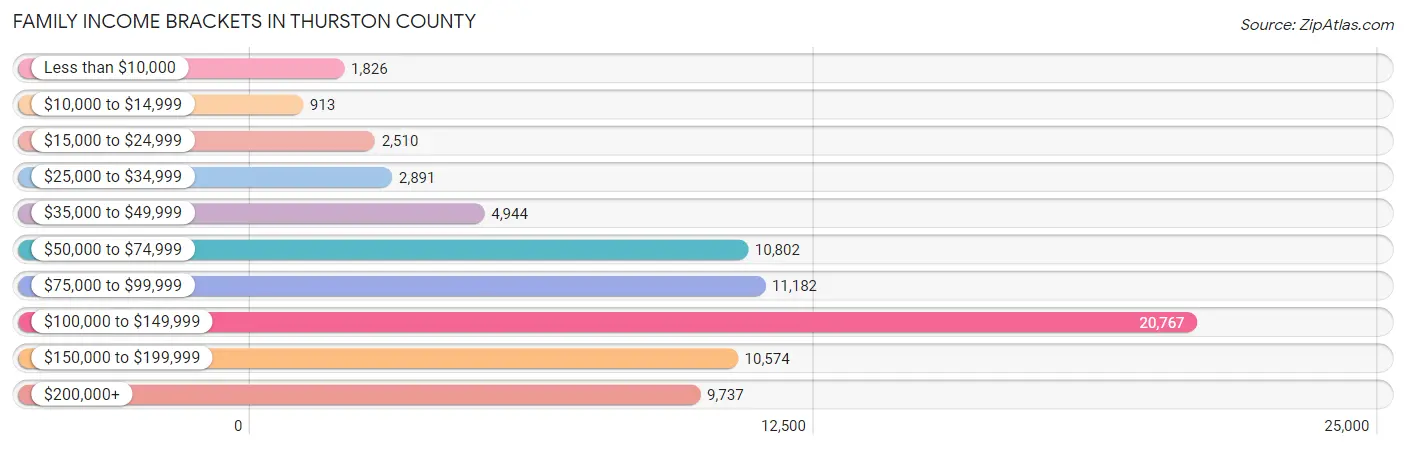
| Income Bracket | # Families | % Families |
| Less than $10,000 | 1,826 | 2.4% |
| $10,000 to $14,999 | 913 | 1.2% |
| $15,000 to $24,999 | 2,510 | 3.3% |
| $25,000 to $34,999 | 2,891 | 3.8% |
| $35,000 to $49,999 | 4,944 | 6.5% |
| $50,000 to $74,999 | 10,802 | 14.2% |
| $75,000 to $99,999 | 11,182 | 14.7% |
| $100,000 to $149,999 | 20,767 | 27.3% |
| $150,000 to $199,999 | 10,574 | 13.9% |
| $200,000+ | 9,737 | 12.8% |
Family Income by Famaliy Size in Thurston County
7+ person families (851 | 1.1%) account for the highest median family income in Thurston County with $133,903 per family, while 2-person families (37,126 | 48.8%) have the highest median income of $48,988 per family member.
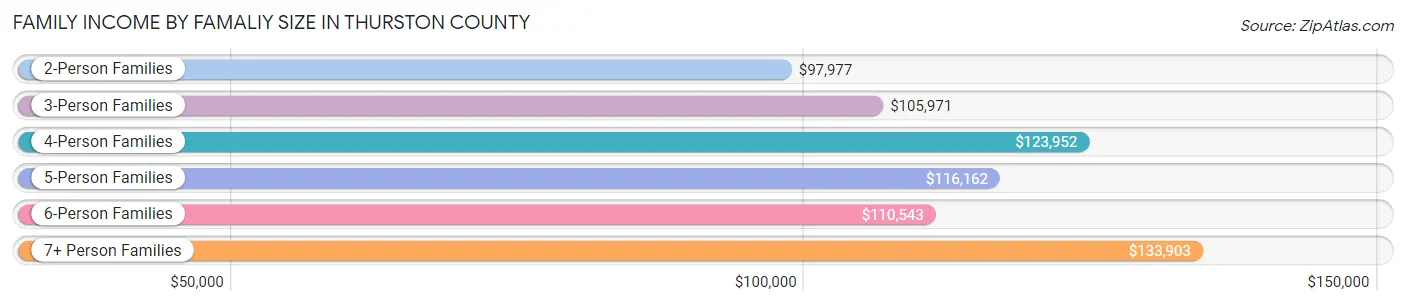
| Income Bracket | # Families | Median Income |
| 2-Person Families | 37,126 (48.8%) | $97,977 |
| 3-Person Families | 16,863 (22.2%) | $105,971 |
| 4-Person Families | 13,599 (17.9%) | $123,952 |
| 5-Person Families | 5,735 (7.5%) | $116,162 |
| 6-Person Families | 1,895 (2.5%) | $110,543 |
| 7+ Person Families | 851 (1.1%) | $133,903 |
| Total | 76,069 (100.0%) | $106,190 |
Family Income by Number of Earners in Thurston County
The median family income in Thurston County is $106,190, with families comprising 3+ earners (7,551) having the highest median family income of $154,595, while families with no earners (12,915) have the lowest median family income of $70,599, accounting for 9.9% and 17.0% of families, respectively.
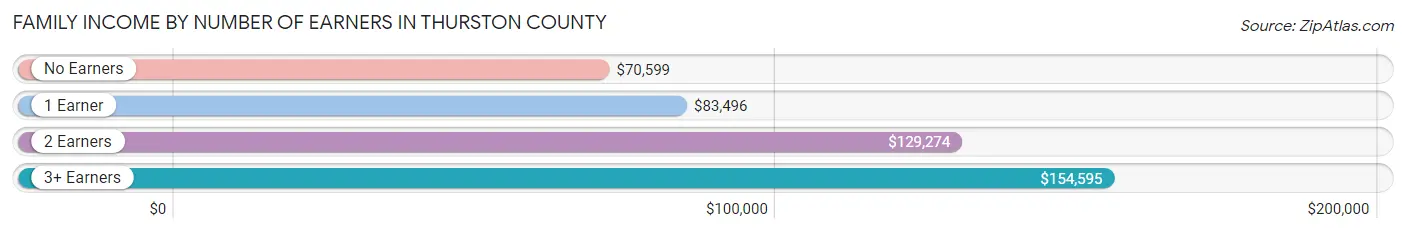
| Number of Earners | # Families | Median Income |
| No Earners | 12,915 (17.0%) | $70,599 |
| 1 Earner | 25,252 (33.2%) | $83,496 |
| 2 Earners | 30,351 (39.9%) | $129,274 |
| 3+ Earners | 7,551 (9.9%) | $154,595 |
| Total | 76,069 (100.0%) | $106,190 |
Household Income in Thurston County
Household Income Brackets in Thurston County
With 26,031 households falling in the category, the $100,000 to $149,999 income range is the most frequent in Thurston County, accounting for 22.5% of all households. In contrast, only 2,661 households (2.3%) fall into the $10,000 to $14,999 income bracket, making it the least populous group.
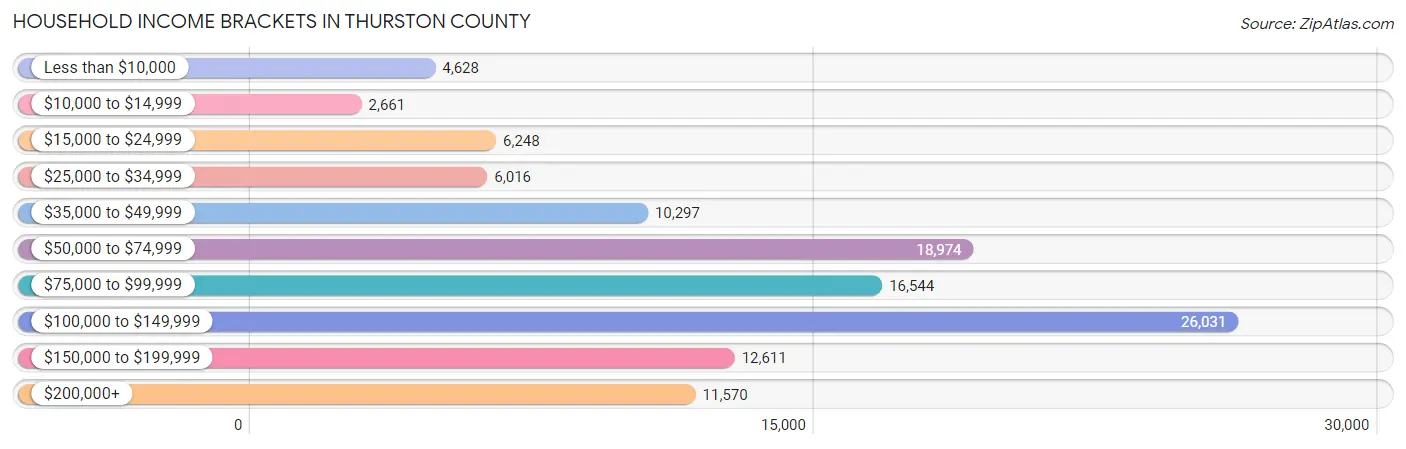
| Income Bracket | # Households | % Households |
| Less than $10,000 | 4,628 | 4.0% |
| $10,000 to $14,999 | 2,661 | 2.3% |
| $15,000 to $24,999 | 6,248 | 5.4% |
| $25,000 to $34,999 | 6,016 | 5.2% |
| $35,000 to $49,999 | 10,297 | 8.9% |
| $50,000 to $74,999 | 18,974 | 16.4% |
| $75,000 to $99,999 | 16,544 | 14.3% |
| $100,000 to $149,999 | 26,031 | 22.5% |
| $150,000 to $199,999 | 12,611 | 10.9% |
| $200,000+ | 11,570 | 10.0% |
Household Income by Householder Age in Thurston County
The median household income in Thurston County is $88,895, with the highest median household income of $110,490 found in the 45 to 64 years age bracket for the primary householder. A total of 40,279 households (34.8%) fall into this category. Meanwhile, the 15 to 24 years age bracket for the primary householder has the lowest median household income of $53,595, with 4,615 households (4.0%) in this group.
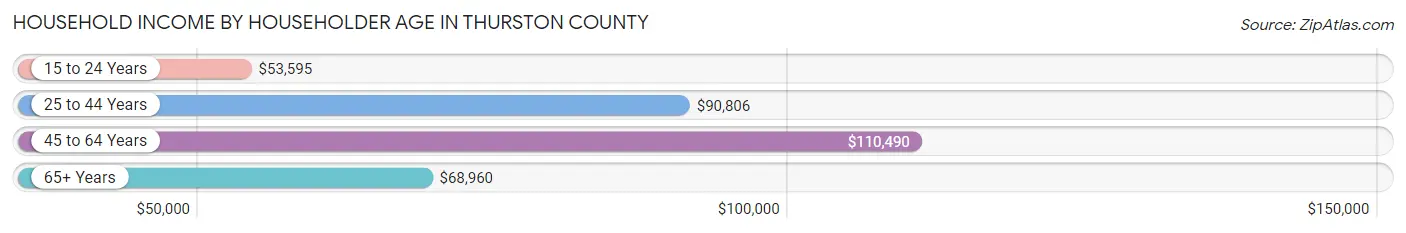
| Income Bracket | # Households | Median Income |
| 15 to 24 Years | 4,615 (4.0%) | $53,595 |
| 25 to 44 Years | 39,059 (33.8%) | $90,806 |
| 45 to 64 Years | 40,279 (34.8%) | $110,490 |
| 65+ Years | 31,742 (27.4%) | $68,960 |
| Total | 115,695 (100.0%) | $88,895 |
Poverty in Thurston County
Income Below Poverty by Sex and Age in Thurston County
With 8.4% poverty level for males and 10.2% for females among the residents of Thurston County, 6 to 11 year old males and 18 to 24 year old females are the most vulnerable to poverty, with 1,297 males (12.6%) and 2,022 females (18.1%) in their respective age groups living below the poverty level.
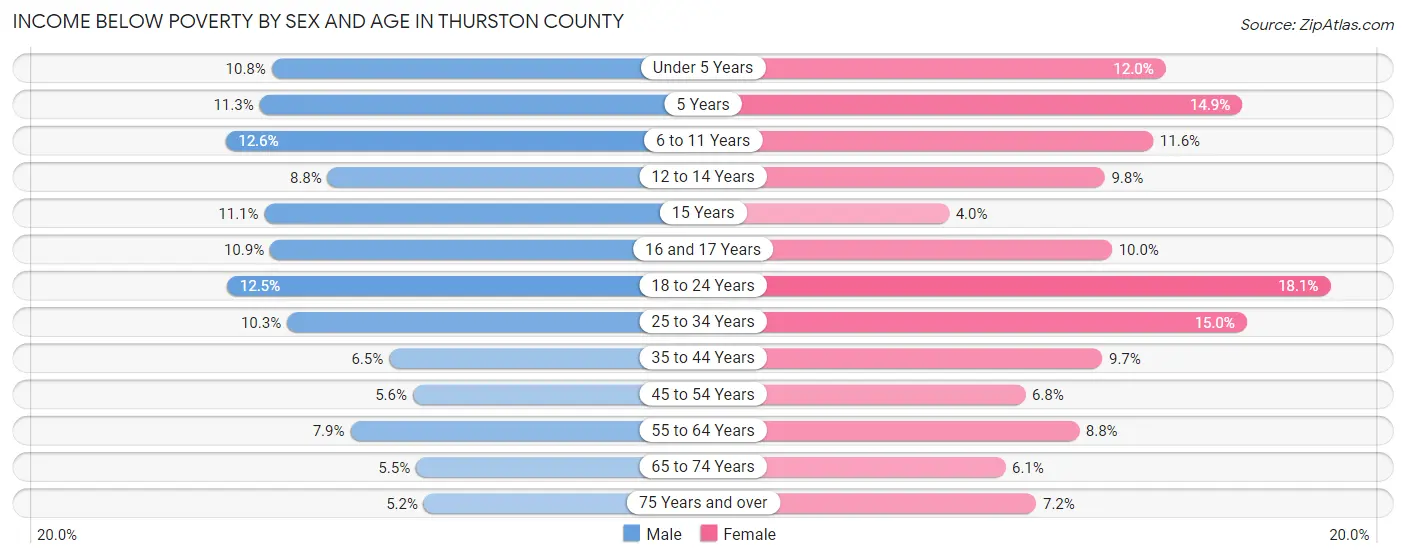
| Age Bracket | Male | Female |
| Under 5 Years | 894 (10.8%) | 890 (12.0%) |
| 5 Years | 171 (11.3%) | 309 (14.9%) |
| 6 to 11 Years | 1,297 (12.6%) | 1,123 (11.6%) |
| 12 to 14 Years | 534 (8.7%) | 481 (9.8%) |
| 15 Years | 173 (11.1%) | 65 (4.0%) |
| 16 and 17 Years | 410 (10.9%) | 343 (10.0%) |
| 18 to 24 Years | 1,455 (12.5%) | 2,022 (18.1%) |
| 25 to 34 Years | 2,166 (10.3%) | 3,099 (15.0%) |
| 35 to 44 Years | 1,326 (6.5%) | 1,999 (9.7%) |
| 45 to 54 Years | 975 (5.6%) | 1,195 (6.8%) |
| 55 to 64 Years | 1,393 (7.9%) | 1,703 (8.8%) |
| 65 to 74 Years | 824 (5.5%) | 1,058 (6.1%) |
| 75 Years and over | 422 (5.2%) | 815 (7.2%) |
| Total | 12,040 (8.4%) | 15,102 (10.2%) |
Income Above Poverty by Sex and Age in Thurston County
According to the poverty statistics in Thurston County, males aged 75 years and over and females aged 15 years are the age groups that are most secure financially, with 94.8% of males and 96.0% of females in these age groups living above the poverty line.
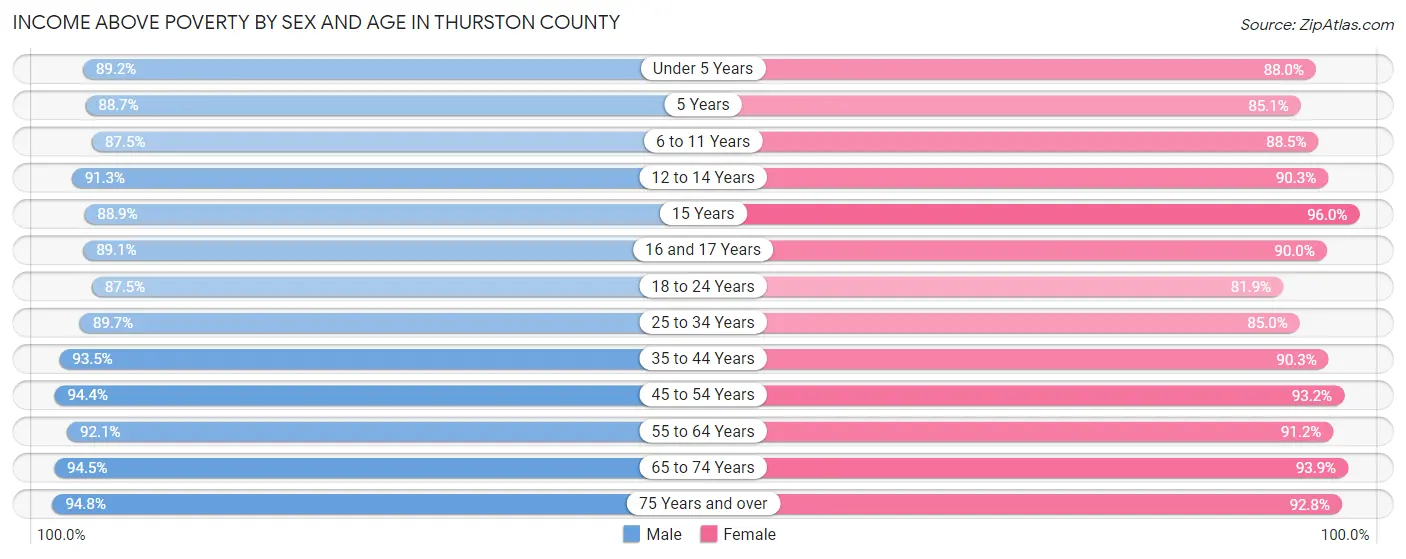
| Age Bracket | Male | Female |
| Under 5 Years | 7,364 (89.2%) | 6,514 (88.0%) |
| 5 Years | 1,345 (88.7%) | 1,770 (85.1%) |
| 6 to 11 Years | 9,039 (87.5%) | 8,603 (88.4%) |
| 12 to 14 Years | 5,566 (91.2%) | 4,451 (90.2%) |
| 15 Years | 1,385 (88.9%) | 1,571 (96.0%) |
| 16 and 17 Years | 3,354 (89.1%) | 3,081 (90.0%) |
| 18 to 24 Years | 10,198 (87.5%) | 9,128 (81.9%) |
| 25 to 34 Years | 18,948 (89.7%) | 17,515 (85.0%) |
| 35 to 44 Years | 19,163 (93.5%) | 18,691 (90.3%) |
| 45 to 54 Years | 16,469 (94.4%) | 16,376 (93.2%) |
| 55 to 64 Years | 16,218 (92.1%) | 17,653 (91.2%) |
| 65 to 74 Years | 14,247 (94.5%) | 16,392 (93.9%) |
| 75 Years and over | 7,718 (94.8%) | 10,495 (92.8%) |
| Total | 131,014 (91.6%) | 132,240 (89.7%) |
Income Below Poverty Among Married-Couple Families in Thurston County
The poverty statistics for married-couple families in Thurston County show that 3.2% or 1,891 of the total 59,073 families live below the poverty line. Families with 5 or more children have the highest poverty rate of 18.8%, comprising of 64 families. On the other hand, families with no children have the lowest poverty rate of 2.5%, which includes 908 families.
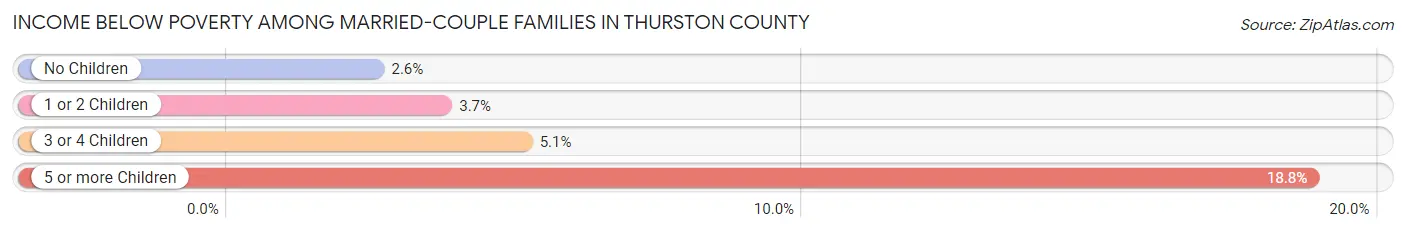
| Children | Above Poverty | Below Poverty |
| No Children | 34,723 (97.5%) | 908 (2.5%) |
| 1 or 2 Children | 18,314 (96.3%) | 710 (3.7%) |
| 3 or 4 Children | 3,869 (94.9%) | 209 (5.1%) |
| 5 or more Children | 276 (81.2%) | 64 (18.8%) |
| Total | 57,182 (96.8%) | 1,891 (3.2%) |
Income Below Poverty Among Single-Parent Households in Thurston County
According to the poverty data in Thurston County, 11.2% or 594 single-father households and 18.1% or 2,113 single-mother households are living below the poverty line. Among single-father households, those with 3 or 4 children have the highest poverty rate, with 143 households (30.7%) experiencing poverty. Likewise, among single-mother households, those with 3 or 4 children have the highest poverty rate, with 558 households (50.2%) falling below the poverty line.
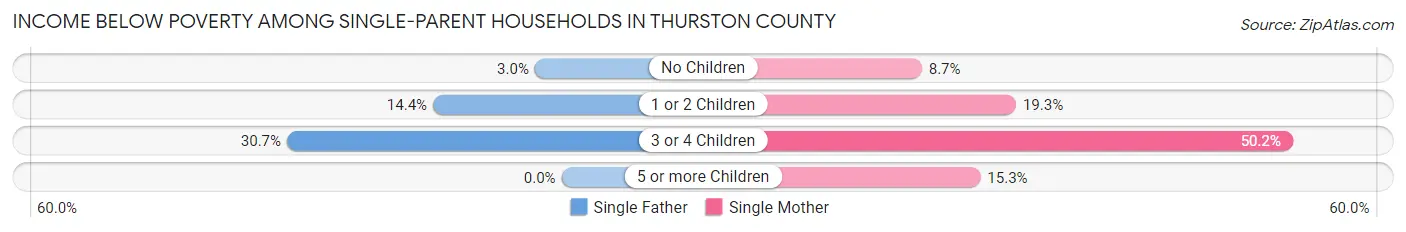
| Children | Single Father | Single Mother |
| No Children | 64 (3.0%) | 396 (8.7%) |
| 1 or 2 Children | 387 (14.4%) | 1,148 (19.3%) |
| 3 or 4 Children | 143 (30.7%) | 558 (50.2%) |
| 5 or more Children | 0 (0.0%) | 11 (15.3%) |
| Total | 594 (11.2%) | 2,113 (18.1%) |
Income Below Poverty Among Married-Couple vs Single-Parent Households in Thurston County
The poverty data for Thurston County shows that 1,891 of the married-couple family households (3.2%) and 2,707 of the single-parent households (15.9%) are living below the poverty level. Within the married-couple family households, those with 5 or more children have the highest poverty rate, with 64 households (18.8%) falling below the poverty line. Among the single-parent households, those with 3 or 4 children have the highest poverty rate, with 701 household (44.4%) living below poverty.
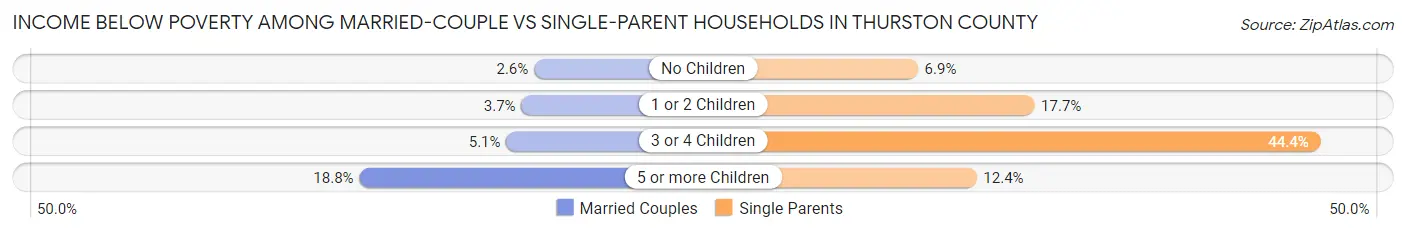
| Children | Married-Couple Families | Single-Parent Households |
| No Children | 908 (2.5%) | 460 (6.9%) |
| 1 or 2 Children | 710 (3.7%) | 1,535 (17.7%) |
| 3 or 4 Children | 209 (5.1%) | 701 (44.4%) |
| 5 or more Children | 64 (18.8%) | 11 (12.4%) |
| Total | 1,891 (3.2%) | 2,707 (15.9%) |
Employment Characteristics in Thurston County
Employment by Class of Employer in Thurston County
Among the 137,214 employed individuals in Thurston County, private company employees (70,834 | 51.6%), state government employees (22,299 | 16.3%), and federal government employees (11,554 | 8.4%) make up the most common classes of employment.
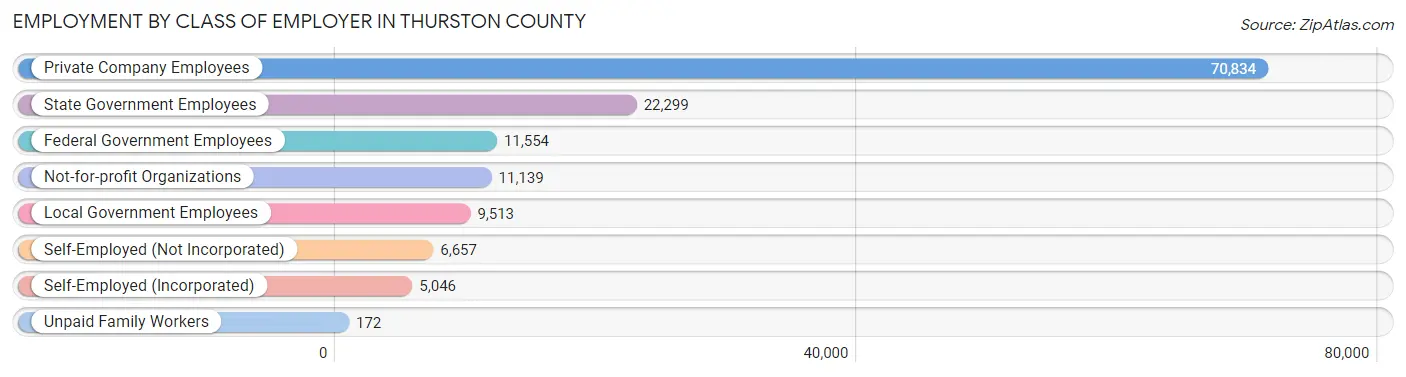
| Employer Class | # Employees | % Employees |
| Private Company Employees | 70,834 | 51.6% |
| Self-Employed (Incorporated) | 5,046 | 3.7% |
| Self-Employed (Not Incorporated) | 6,657 | 4.9% |
| Not-for-profit Organizations | 11,139 | 8.1% |
| Local Government Employees | 9,513 | 6.9% |
| State Government Employees | 22,299 | 16.3% |
| Federal Government Employees | 11,554 | 8.4% |
| Unpaid Family Workers | 172 | 0.1% |
| Total | 137,214 | 100.0% |
Employment Status by Age in Thurston County
According to the labor force statistics for Thurston County, out of the total population over 16 years of age (239,505), 62.0% or 148,493 individuals are in the labor force, with 5.5% or 8,167 of them unemployed. The age group with the highest labor force participation rate is 25 to 29 years, with 83.4% or 17,306 individuals in the labor force. Within the labor force, the 16 to 19 years age range has the highest percentage of unemployed individuals, with 17.2% or 845 of them being unemployed.
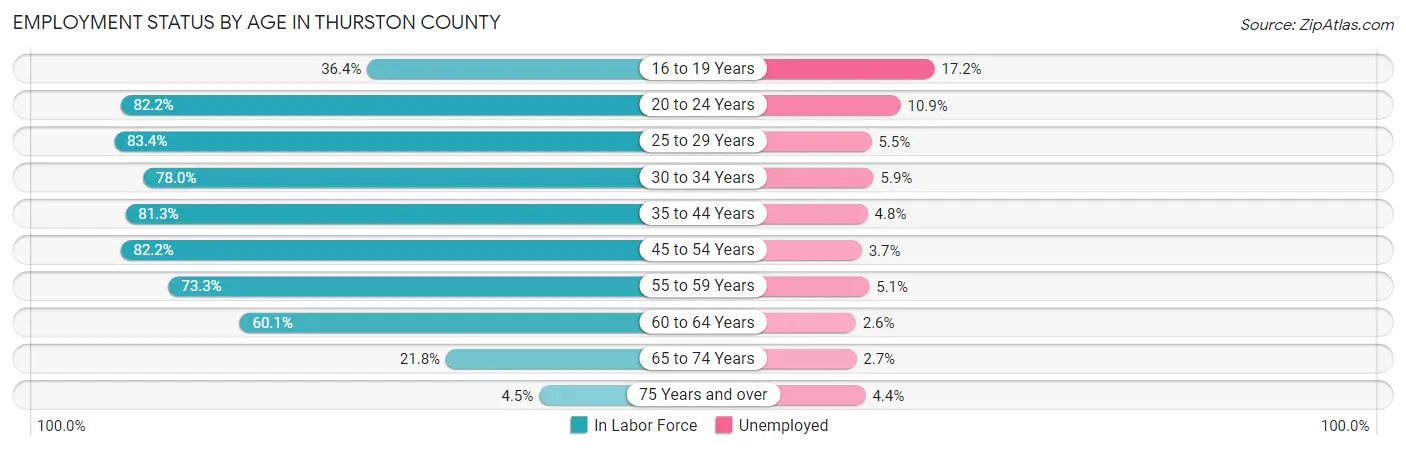
| Age Bracket | In Labor Force | Unemployed |
| 16 to 19 Years | 4,914 (36.4%) | 845 (17.2%) |
| 20 to 24 Years | 14,294 (82.2%) | 1,558 (10.9%) |
| 25 to 29 Years | 17,306 (83.4%) | 952 (5.5%) |
| 30 to 34 Years | 16,617 (78.0%) | 980 (5.9%) |
| 35 to 44 Years | 33,796 (81.3%) | 1,622 (4.8%) |
| 45 to 54 Years | 28,862 (82.2%) | 1,068 (3.7%) |
| 55 to 59 Years | 12,653 (73.3%) | 645 (5.1%) |
| 60 to 64 Years | 11,914 (60.1%) | 310 (2.6%) |
| 65 to 74 Years | 7,129 (21.8%) | 192 (2.7%) |
| 75 Years and over | 904 (4.5%) | 40 (4.4%) |
| Total | 148,493 (62.0%) | 8,167 (5.5%) |
Employment Status by Educational Attainment in Thurston County
According to labor force statistics for Thurston County, 77.8% of individuals (121,230) out of the total population between 25 and 64 years of age (155,822) are in the labor force, with 4.6% or 5,577 of them being unemployed. The group with the highest labor force participation rate are those with the educational attainment of bachelor's degree or higher, with 85.5% or 48,281 individuals in the labor force. Within the labor force, individuals with less than high school education have the highest percentage of unemployment, with 7.0% or 401 of them being unemployed.
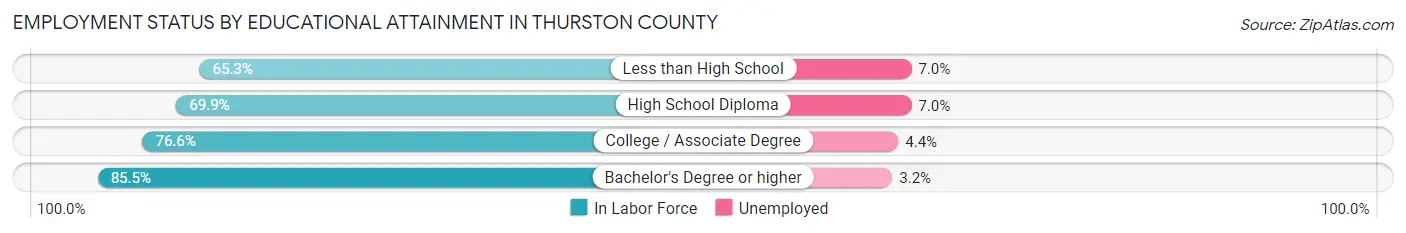
| Educational Attainment | In Labor Force | Unemployed |
| Less than High School | 5,734 (65.3%) | 615 (7.0%) |
| High School Diploma | 23,434 (69.9%) | 2,347 (7.0%) |
| College / Associate Degree | 43,698 (76.6%) | 2,510 (4.4%) |
| Bachelor's Degree or higher | 48,281 (85.5%) | 1,807 (3.2%) |
| Total | 121,230 (77.8%) | 7,168 (4.6%) |
Employment Occupations by Sex in Thurston County
Management, Business, Science and Arts Occupations
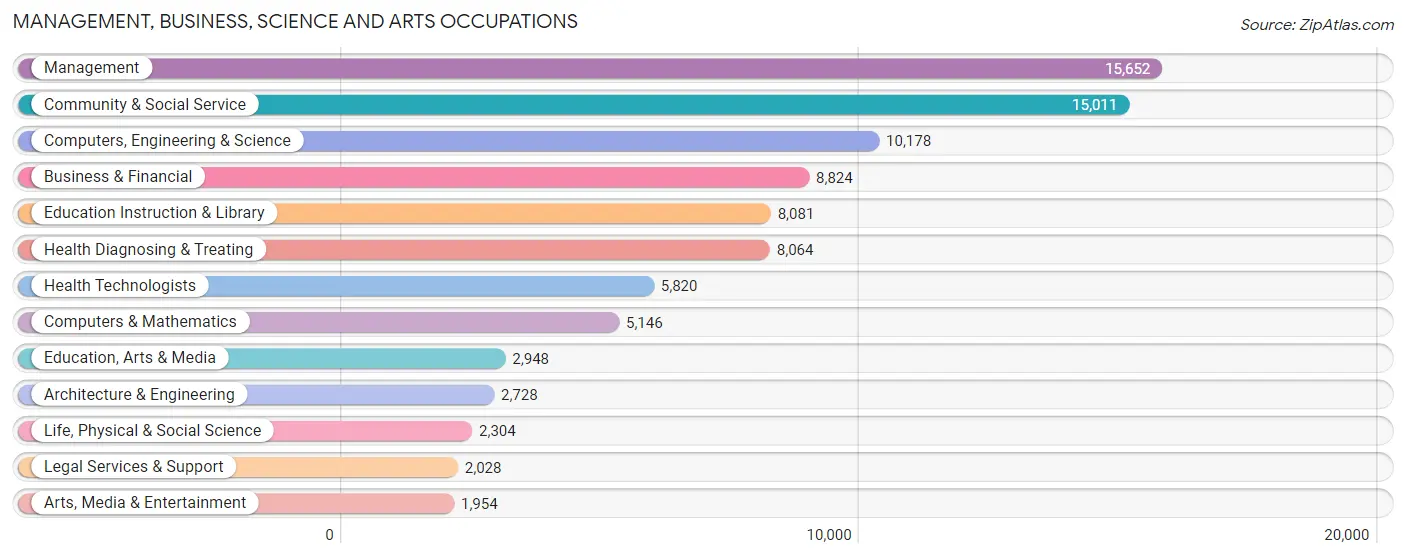
The most common Management, Business, Science and Arts occupations in Thurston County are Management (15,652 | 11.6%), Community & Social Service (15,011 | 11.2%), Computers, Engineering & Science (10,178 | 7.6%), Business & Financial (8,824 | 6.6%), and Education Instruction & Library (8,081 | 6.0%).
Management, Business, Science and Arts Occupations by Sex
Within the Management, Business, Science and Arts occupations in Thurston County, the most male-oriented occupations are Architecture & Engineering (82.0%), Computers & Mathematics (73.4%), and Computers, Engineering & Science (70.9%), while the most female-oriented occupations are Education Instruction & Library (75.5%), Health Diagnosing & Treating (68.5%), and Community & Social Service (67.2%).
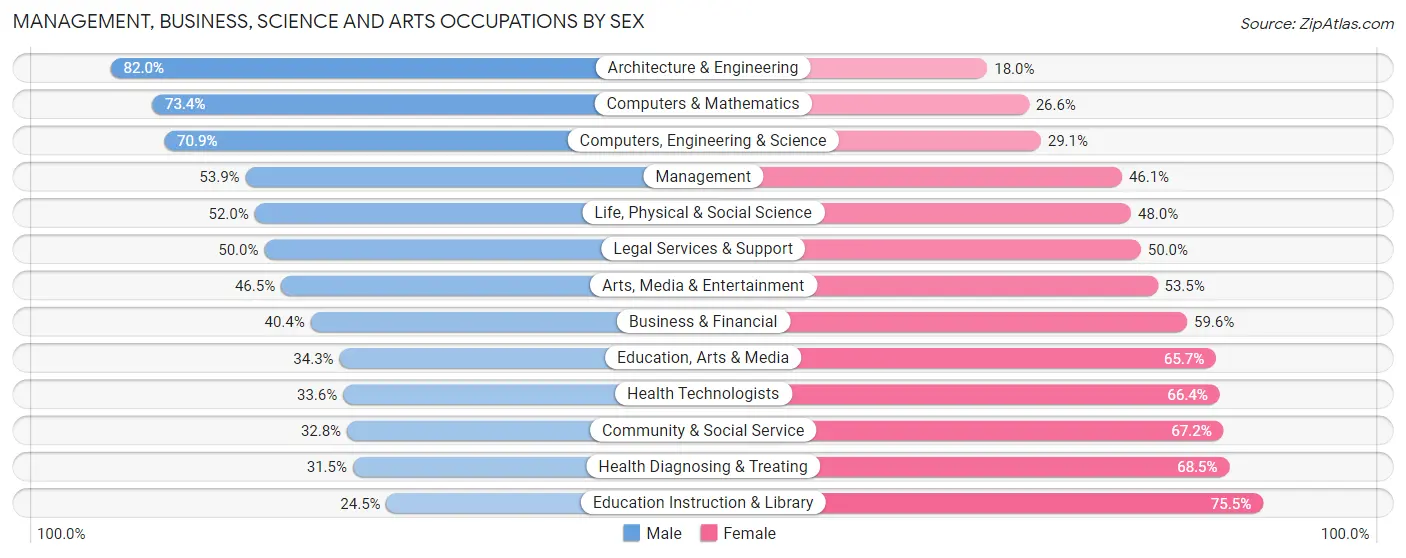
| Occupation | Male | Female |
| Management | 8,442 (53.9%) | 7,210 (46.1%) |
| Business & Financial | 3,561 (40.4%) | 5,263 (59.6%) |
| Computers, Engineering & Science | 7,214 (70.9%) | 2,964 (29.1%) |
| Computers & Mathematics | 3,777 (73.4%) | 1,369 (26.6%) |
| Architecture & Engineering | 2,238 (82.0%) | 490 (18.0%) |
| Life, Physical & Social Science | 1,199 (52.0%) | 1,105 (48.0%) |
| Community & Social Service | 4,917 (32.8%) | 10,094 (67.2%) |
| Education, Arts & Media | 1,012 (34.3%) | 1,936 (65.7%) |
| Legal Services & Support | 1,014 (50.0%) | 1,014 (50.0%) |
| Education Instruction & Library | 1,982 (24.5%) | 6,099 (75.5%) |
| Arts, Media & Entertainment | 909 (46.5%) | 1,045 (53.5%) |
| Health Diagnosing & Treating | 2,543 (31.5%) | 5,521 (68.5%) |
| Health Technologists | 1,954 (33.6%) | 3,866 (66.4%) |
| Total (Category) | 26,677 (46.2%) | 31,052 (53.8%) |
| Total (Overall) | 69,276 (51.5%) | 65,346 (48.5%) |
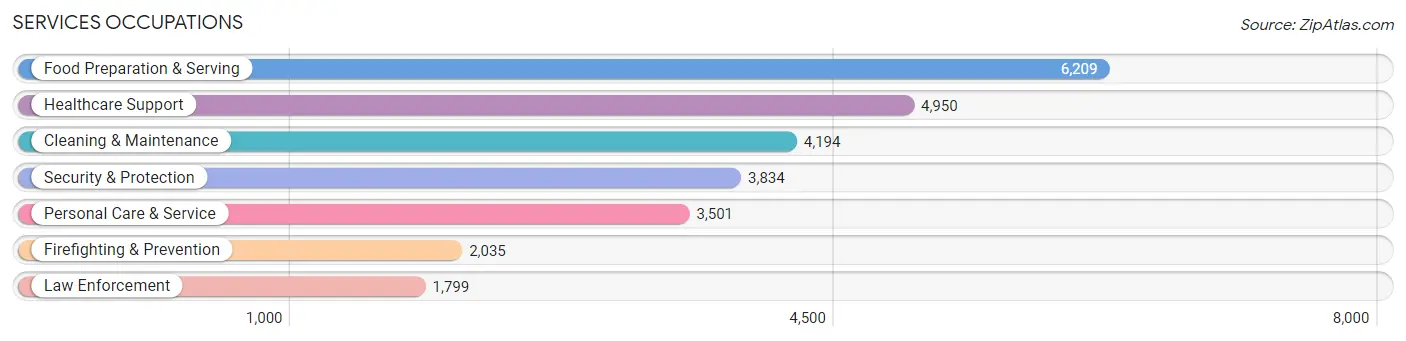
Services Occupations
The most common Services occupations in Thurston County are Food Preparation & Serving (6,209 | 4.6%), Healthcare Support (4,950 | 3.7%), Cleaning & Maintenance (4,194 | 3.1%), Security & Protection (3,834 | 2.9%), and Personal Care & Service (3,501 | 2.6%).
Services Occupations by Sex
Within the Services occupations in Thurston County, the most male-oriented occupations are Law Enforcement (88.9%), Security & Protection (82.7%), and Firefighting & Prevention (77.1%), while the most female-oriented occupations are Healthcare Support (85.2%), Personal Care & Service (79.3%), and Food Preparation & Serving (59.8%).
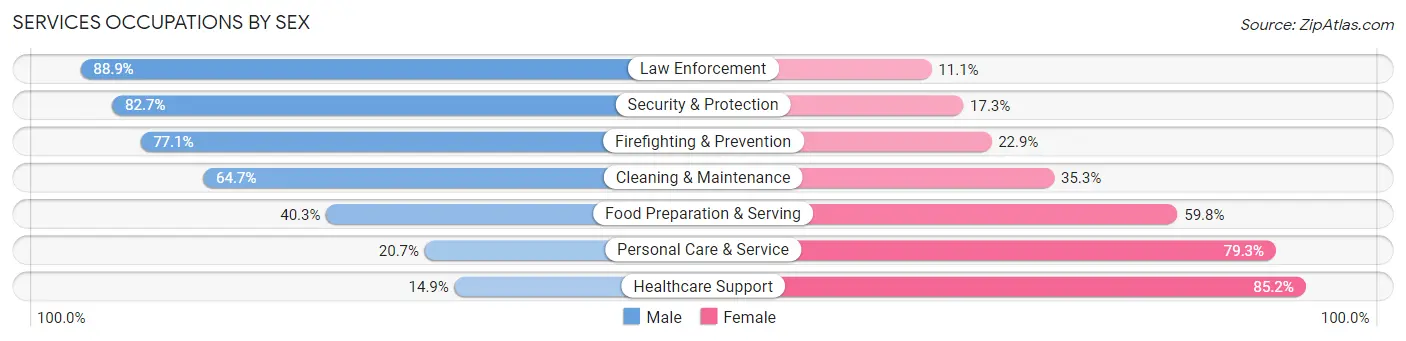
| Occupation | Male | Female |
| Healthcare Support | 735 (14.8%) | 4,215 (85.2%) |
| Security & Protection | 3,169 (82.7%) | 665 (17.3%) |
| Firefighting & Prevention | 1,569 (77.1%) | 466 (22.9%) |
| Law Enforcement | 1,600 (88.9%) | 199 (11.1%) |
| Food Preparation & Serving | 2,499 (40.3%) | 3,710 (59.8%) |
| Cleaning & Maintenance | 2,712 (64.7%) | 1,482 (35.3%) |
| Personal Care & Service | 726 (20.7%) | 2,775 (79.3%) |
| Total (Category) | 9,841 (43.4%) | 12,847 (56.6%) |
| Total (Overall) | 69,276 (51.5%) | 65,346 (48.5%) |
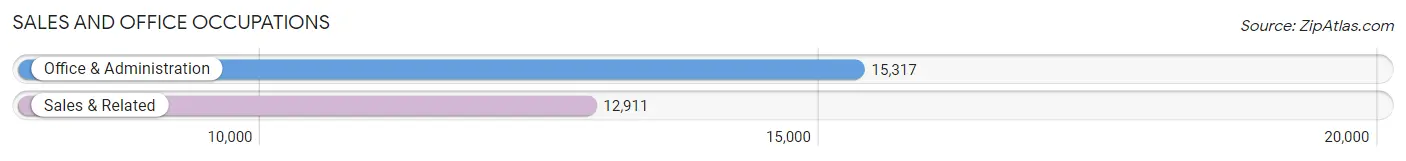
Sales and Office Occupations
The most common Sales and Office occupations in Thurston County are Office & Administration (15,317 | 11.4%), and Sales & Related (12,911 | 9.6%).
Sales and Office Occupations by Sex
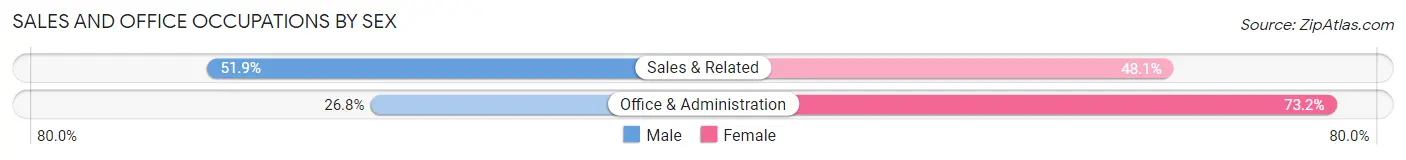
| Occupation | Male | Female |
| Sales & Related | 6,696 (51.9%) | 6,215 (48.1%) |
| Office & Administration | 4,106 (26.8%) | 11,211 (73.2%) |
| Total (Category) | 10,802 (38.3%) | 17,426 (61.7%) |
| Total (Overall) | 69,276 (51.5%) | 65,346 (48.5%) |
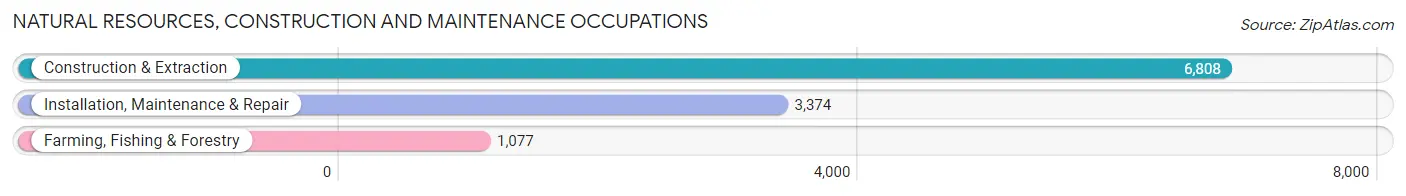
Natural Resources, Construction and Maintenance Occupations
The most common Natural Resources, Construction and Maintenance occupations in Thurston County are Construction & Extraction (6,808 | 5.1%), Installation, Maintenance & Repair (3,374 | 2.5%), and Farming, Fishing & Forestry (1,077 | 0.8%).
Natural Resources, Construction and Maintenance Occupations by Sex
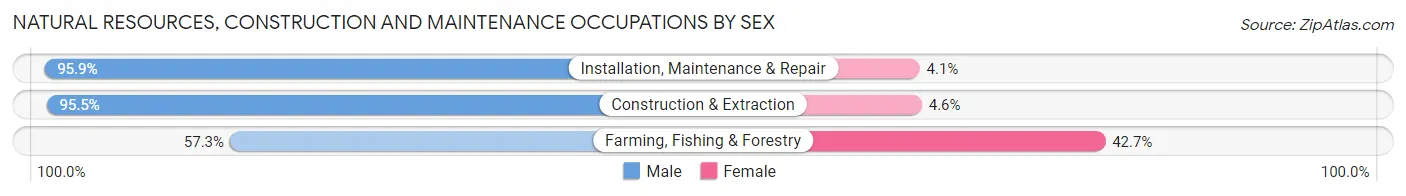
| Occupation | Male | Female |
| Farming, Fishing & Forestry | 617 (57.3%) | 460 (42.7%) |
| Construction & Extraction | 6,498 (95.5%) | 310 (4.5%) |
| Installation, Maintenance & Repair | 3,236 (95.9%) | 138 (4.1%) |
| Total (Category) | 10,351 (91.9%) | 908 (8.1%) |
| Total (Overall) | 69,276 (51.5%) | 65,346 (48.5%) |
Production, Transportation and Moving Occupations
The most common Production, Transportation and Moving occupations in Thurston County are Material Moving (5,877 | 4.4%), Transportation (4,546 | 3.4%), and Production (4,295 | 3.2%).
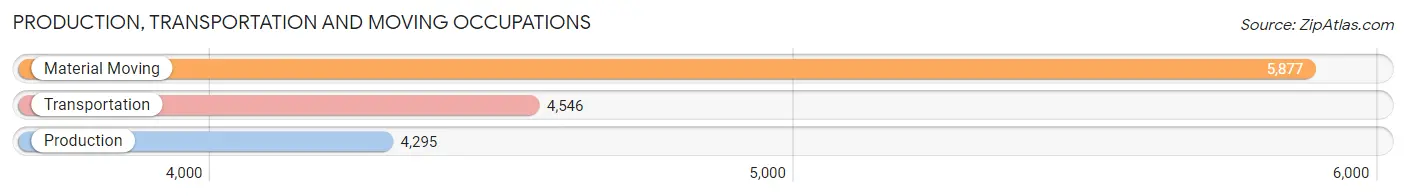
Production, Transportation and Moving Occupations by Sex
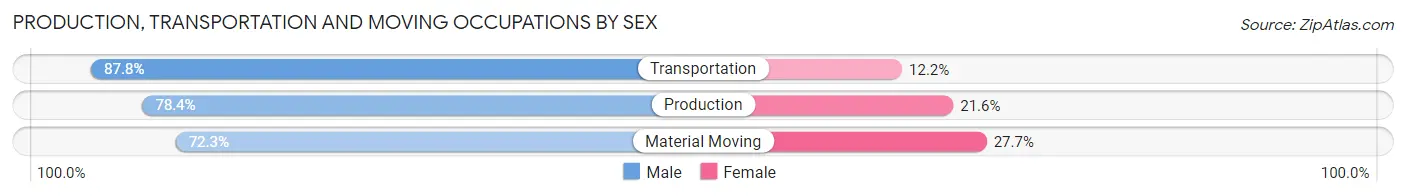
| Occupation | Male | Female |
| Production | 3,367 (78.4%) | 928 (21.6%) |
| Transportation | 3,991 (87.8%) | 555 (12.2%) |
| Material Moving | 4,247 (72.3%) | 1,630 (27.7%) |
| Total (Category) | 11,605 (78.8%) | 3,113 (21.1%) |
| Total (Overall) | 69,276 (51.5%) | 65,346 (48.5%) |
Employment Industries by Sex in Thurston County
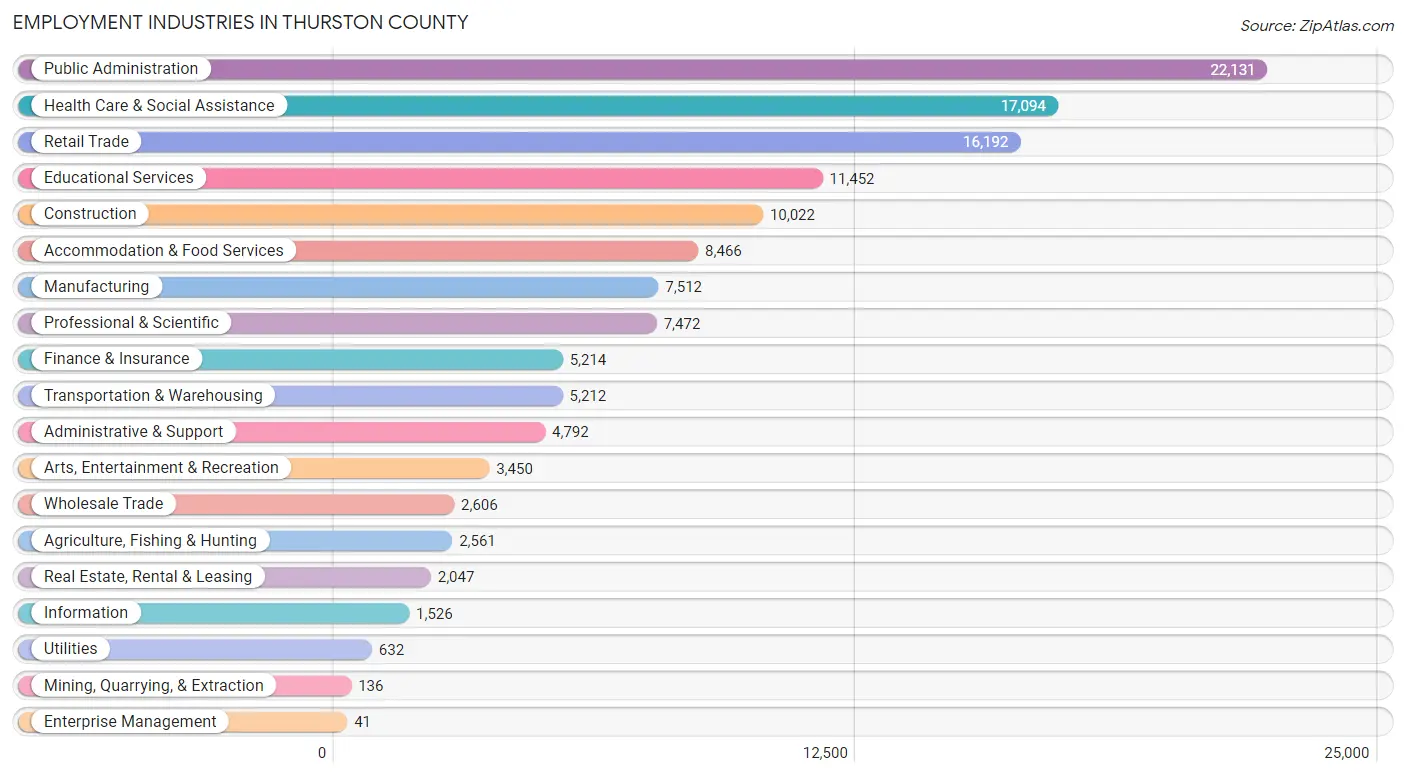
Employment Industries in Thurston County
The major employment industries in Thurston County include Public Administration (22,131 | 16.4%), Health Care & Social Assistance (17,094 | 12.7%), Retail Trade (16,192 | 12.0%), Educational Services (11,452 | 8.5%), and Construction (10,022 | 7.4%).
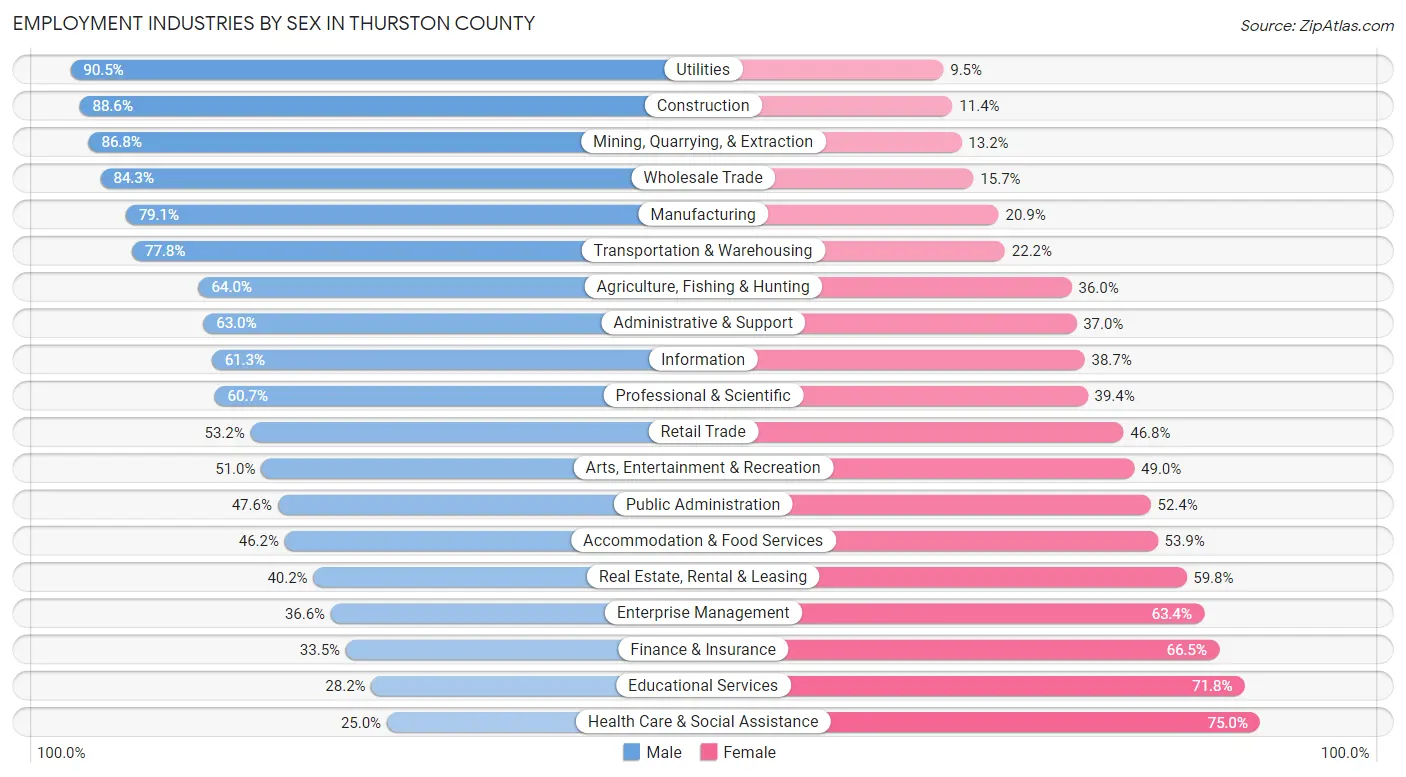
Employment Industries by Sex in Thurston County
The Thurston County industries that see more men than women are Utilities (90.5%), Construction (88.6%), and Mining, Quarrying, & Extraction (86.8%), whereas the industries that tend to have a higher number of women are Health Care & Social Assistance (75.0%), Educational Services (71.8%), and Finance & Insurance (66.5%).
| Industry | Male | Female |
| Agriculture, Fishing & Hunting | 1,638 (64.0%) | 923 (36.0%) |
| Mining, Quarrying, & Extraction | 118 (86.8%) | 18 (13.2%) |
| Construction | 8,881 (88.6%) | 1,141 (11.4%) |
| Manufacturing | 5,940 (79.1%) | 1,572 (20.9%) |
| Wholesale Trade | 2,196 (84.3%) | 410 (15.7%) |
| Retail Trade | 8,621 (53.2%) | 7,571 (46.8%) |
| Transportation & Warehousing | 4,053 (77.8%) | 1,159 (22.2%) |
| Utilities | 572 (90.5%) | 60 (9.5%) |
| Information | 935 (61.3%) | 591 (38.7%) |
| Finance & Insurance | 1,746 (33.5%) | 3,468 (66.5%) |
| Real Estate, Rental & Leasing | 823 (40.2%) | 1,224 (59.8%) |
| Professional & Scientific | 4,532 (60.7%) | 2,940 (39.4%) |
| Enterprise Management | 15 (36.6%) | 26 (63.4%) |
| Administrative & Support | 3,019 (63.0%) | 1,773 (37.0%) |
| Educational Services | 3,231 (28.2%) | 8,221 (71.8%) |
| Health Care & Social Assistance | 4,273 (25.0%) | 12,821 (75.0%) |
| Arts, Entertainment & Recreation | 1,760 (51.0%) | 1,690 (49.0%) |
| Accommodation & Food Services | 3,907 (46.2%) | 4,559 (53.8%) |
| Public Administration | 10,536 (47.6%) | 11,595 (52.4%) |
| Total | 69,276 (51.5%) | 65,346 (48.5%) |
Education in Thurston County
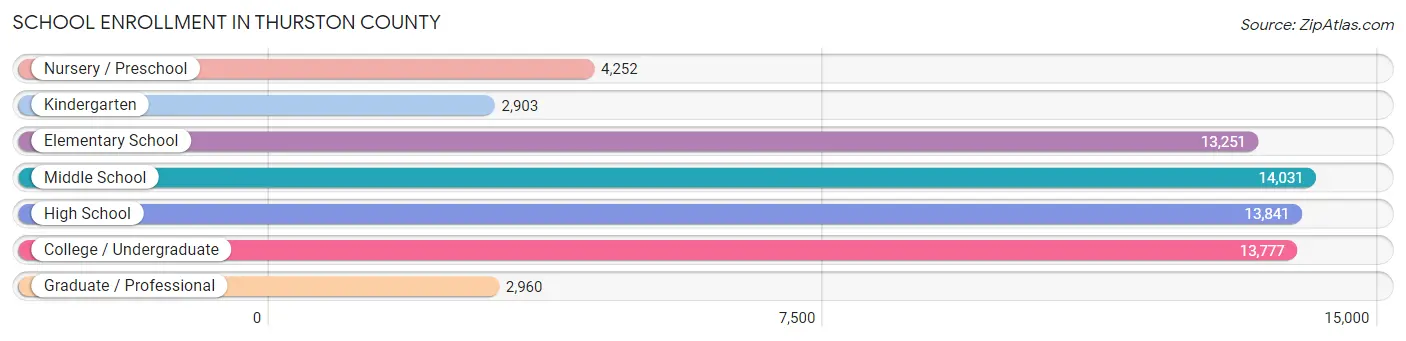
School Enrollment in Thurston County
The most common levels of schooling among the 65,015 students in Thurston County are middle school (14,031 | 21.6%), high school (13,841 | 21.3%), and college / undergraduate (13,777 | 21.2%).
| School Level | # Students | % Students |
| Nursery / Preschool | 4,252 | 6.5% |
| Kindergarten | 2,903 | 4.5% |
| Elementary School | 13,251 | 20.4% |
| Middle School | 14,031 | 21.6% |
| High School | 13,841 | 21.3% |
| College / Undergraduate | 13,777 | 21.2% |
| Graduate / Professional | 2,960 | 4.5% |
| Total | 65,015 | 100.0% |
School Enrollment by Age by Funding Source in Thurston County
Out of a total of 65,015 students who are enrolled in schools in Thurston County, 10,662 (16.4%) attend a private institution, while the remaining 54,353 (83.6%) are enrolled in public schools. The age group of 3 to 4 year olds has the highest likelihood of being enrolled in private schools, with 1,718 (59.5% in the age bracket) enrolled. Conversely, the age group of 15 to 17 year olds has the lowest likelihood of being enrolled in a private school, with 9,297 (93.5% in the age bracket) attending a public institution.
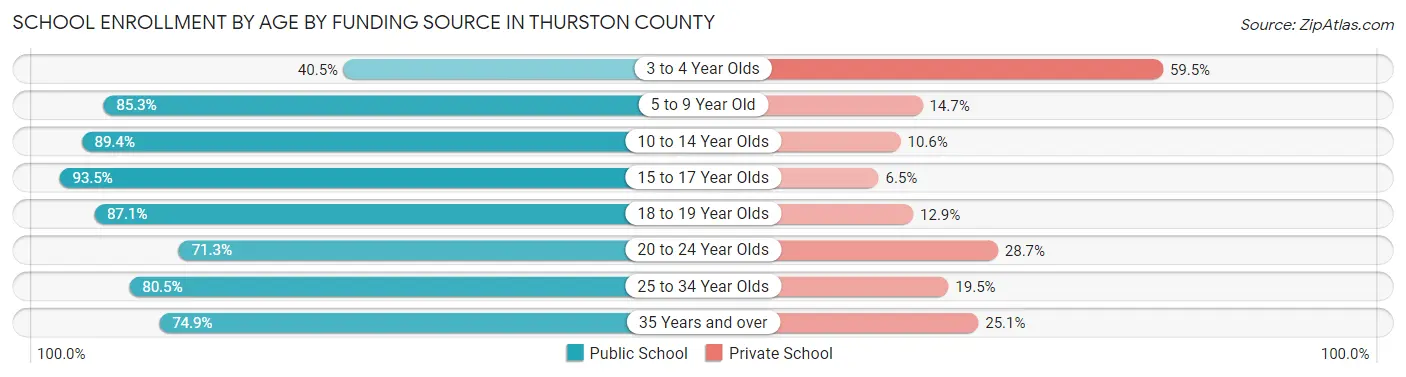
| Age Bracket | Public School | Private School |
| 3 to 4 Year Olds | 1,171 (40.5%) | 1,718 (59.5%) |
| 5 to 9 Year Old | 13,633 (85.3%) | 2,346 (14.7%) |
| 10 to 14 Year Olds | 15,623 (89.4%) | 1,855 (10.6%) |
| 15 to 17 Year Olds | 9,297 (93.5%) | 646 (6.5%) |
| 18 to 19 Year Olds | 3,503 (87.1%) | 520 (12.9%) |
| 20 to 24 Year Olds | 3,361 (71.3%) | 1,354 (28.7%) |
| 25 to 34 Year Olds | 3,842 (80.5%) | 931 (19.5%) |
| 35 Years and over | 3,907 (74.9%) | 1,308 (25.1%) |
| Total | 54,353 (83.6%) | 10,662 (16.4%) |
Educational Attainment by Field of Study in Thurston County
Business (12,124 | 14.6%), education (8,592 | 10.3%), science & technology (8,020 | 9.6%), social sciences (7,791 | 9.4%), and bio, nature & agricultural (7,318 | 8.8%) are the most common fields of study among 83,181 individuals in Thurston County who have obtained a bachelor's degree or higher.
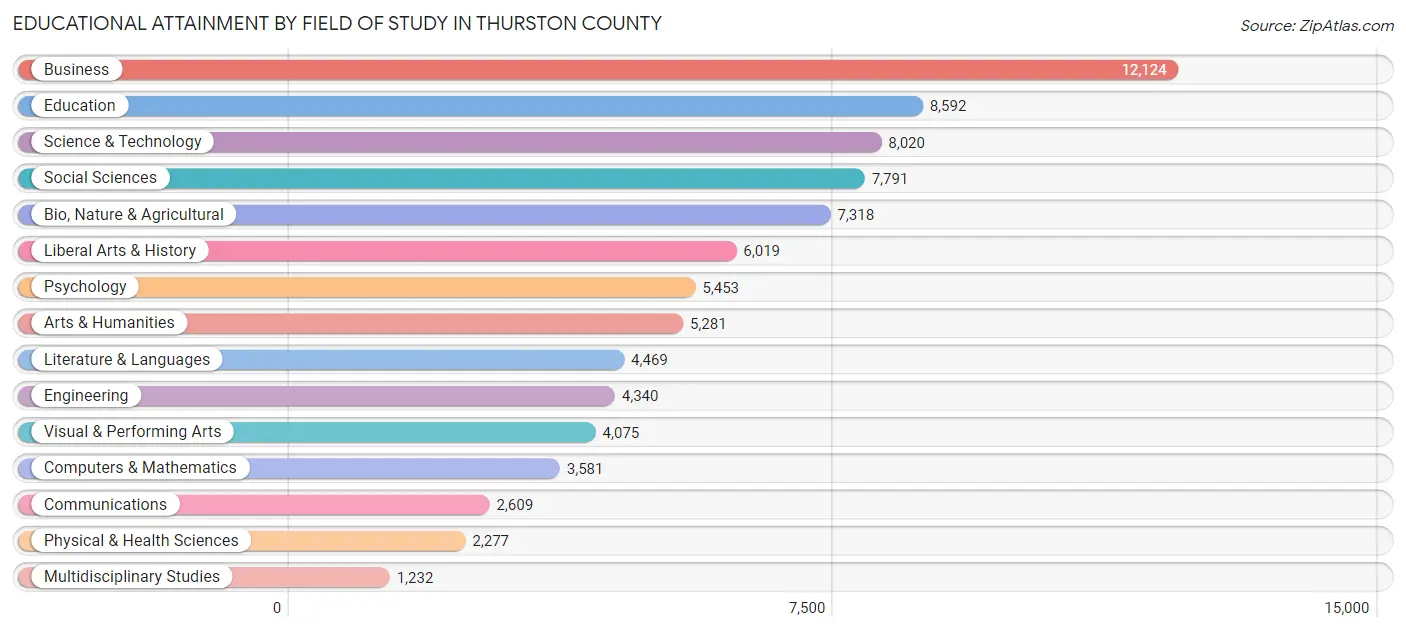
| Field of Study | # Graduates | % Graduates |
| Computers & Mathematics | 3,581 | 4.3% |
| Bio, Nature & Agricultural | 7,318 | 8.8% |
| Physical & Health Sciences | 2,277 | 2.7% |
| Psychology | 5,453 | 6.6% |
| Social Sciences | 7,791 | 9.4% |
| Engineering | 4,340 | 5.2% |
| Multidisciplinary Studies | 1,232 | 1.5% |
| Science & Technology | 8,020 | 9.6% |
| Business | 12,124 | 14.6% |
| Education | 8,592 | 10.3% |
| Literature & Languages | 4,469 | 5.4% |
| Liberal Arts & History | 6,019 | 7.2% |
| Visual & Performing Arts | 4,075 | 4.9% |
| Communications | 2,609 | 3.1% |
| Arts & Humanities | 5,281 | 6.4% |
| Total | 83,181 | 100.0% |
Transportation & Commute in Thurston County
Vehicle Availability by Sex in Thurston County
The most prevalent vehicle ownership categories in Thurston County are males with 2 vehicles (28,150, accounting for 38.7%) and females with 2 vehicles (24,639, making up 44.0%).
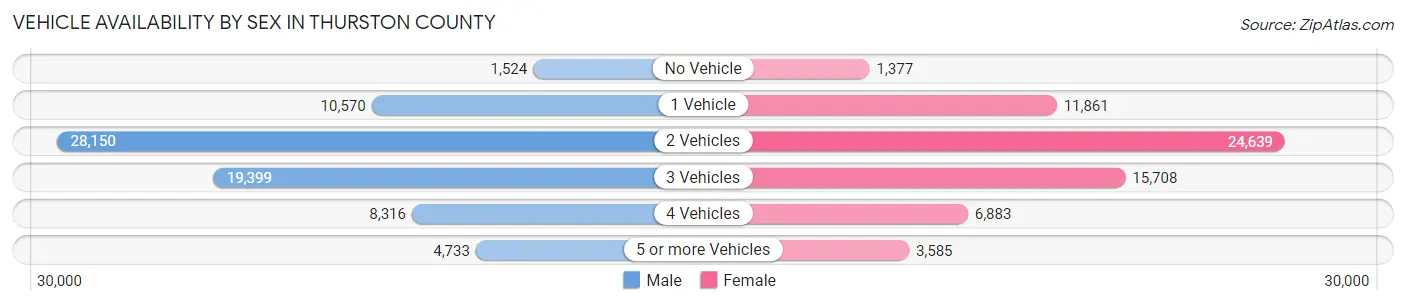
| Vehicles Available | Male | Female |
| No Vehicle | 1,524 (2.1%) | 1,377 (2.1%) |
| 1 Vehicle | 10,570 (14.5%) | 11,861 (18.5%) |
| 2 Vehicles | 28,150 (38.7%) | 24,639 (38.5%) |
| 3 Vehicles | 19,399 (26.7%) | 15,708 (24.5%) |
| 4 Vehicles | 8,316 (11.4%) | 6,883 (10.7%) |
| 5 or more Vehicles | 4,733 (6.5%) | 3,585 (5.6%) |
| Total | 72,692 (100.0%) | 64,053 (100.0%) |
Commute Time in Thurston County
The most frequently occuring commute durations in Thurston County are 15 to 19 minutes (19,627 commuters, 16.7%), 20 to 24 minutes (17,107 commuters, 14.6%), and 10 to 14 minutes (15,260 commuters, 13.0%).
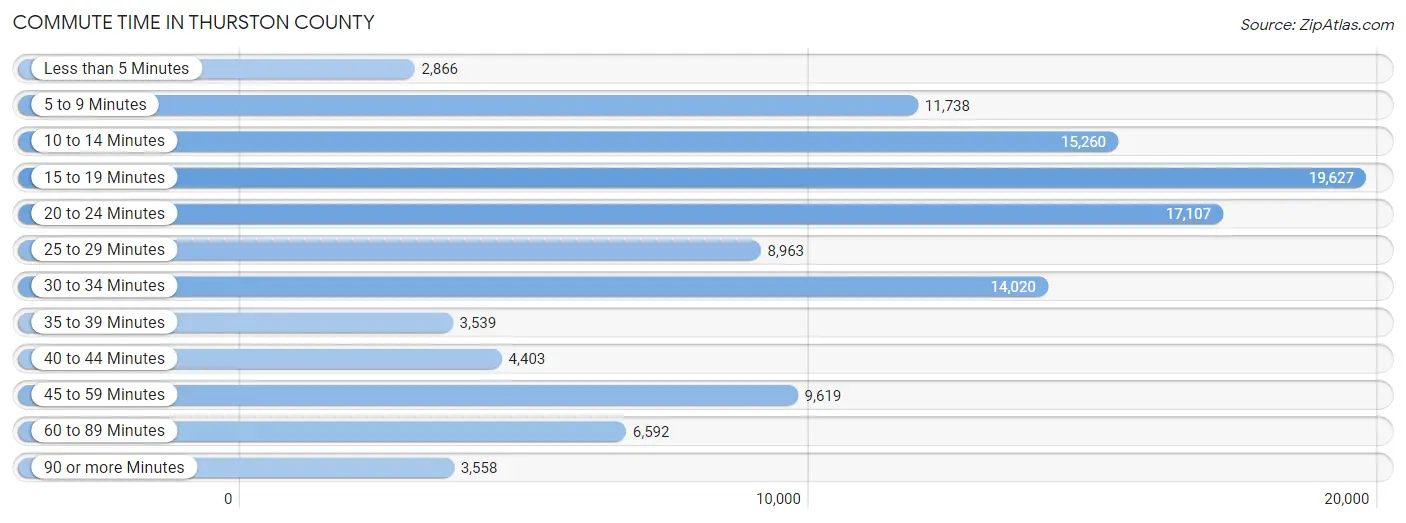
| Commute Time | # Commuters | % Commuters |
| Less than 5 Minutes | 2,866 | 2.4% |
| 5 to 9 Minutes | 11,738 | 10.0% |
| 10 to 14 Minutes | 15,260 | 13.0% |
| 15 to 19 Minutes | 19,627 | 16.7% |
| 20 to 24 Minutes | 17,107 | 14.6% |
| 25 to 29 Minutes | 8,963 | 7.6% |
| 30 to 34 Minutes | 14,020 | 11.9% |
| 35 to 39 Minutes | 3,539 | 3.0% |
| 40 to 44 Minutes | 4,403 | 3.7% |
| 45 to 59 Minutes | 9,619 | 8.2% |
| 60 to 89 Minutes | 6,592 | 5.6% |
| 90 or more Minutes | 3,558 | 3.0% |
Commute Time by Sex in Thurston County
The most common commute times in Thurston County are 15 to 19 minutes (9,747 commuters, 15.2%) for males and 15 to 19 minutes (9,880 commuters, 18.5%) for females.
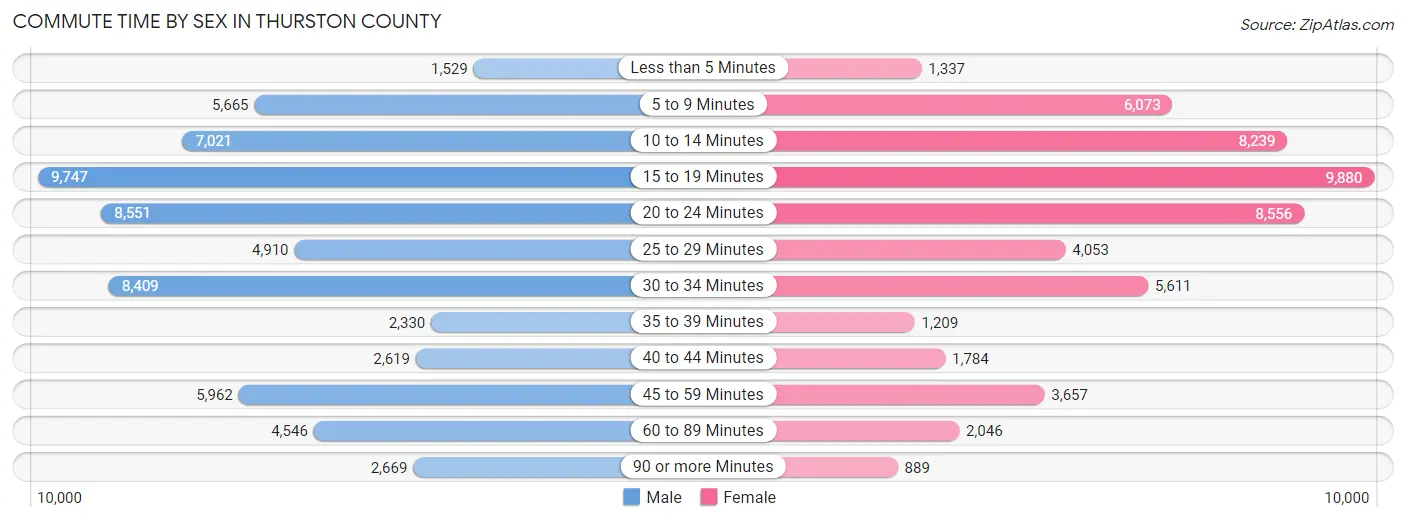
| Commute Time | Male | Female |
| Less than 5 Minutes | 1,529 (2.4%) | 1,337 (2.5%) |
| 5 to 9 Minutes | 5,665 (8.9%) | 6,073 (11.4%) |
| 10 to 14 Minutes | 7,021 (11.0%) | 8,239 (15.4%) |
| 15 to 19 Minutes | 9,747 (15.2%) | 9,880 (18.5%) |
| 20 to 24 Minutes | 8,551 (13.4%) | 8,556 (16.0%) |
| 25 to 29 Minutes | 4,910 (7.7%) | 4,053 (7.6%) |
| 30 to 34 Minutes | 8,409 (13.2%) | 5,611 (10.5%) |
| 35 to 39 Minutes | 2,330 (3.6%) | 1,209 (2.3%) |
| 40 to 44 Minutes | 2,619 (4.1%) | 1,784 (3.3%) |
| 45 to 59 Minutes | 5,962 (9.3%) | 3,657 (6.9%) |
| 60 to 89 Minutes | 4,546 (7.1%) | 2,046 (3.8%) |
| 90 or more Minutes | 2,669 (4.2%) | 889 (1.7%) |
Time of Departure to Work by Sex in Thurston County
The most frequent times of departure to work in Thurston County are 7:00 AM to 7:29 AM (8,300, 13.0%) for males and 7:00 AM to 7:29 AM (8,187, 15.3%) for females.
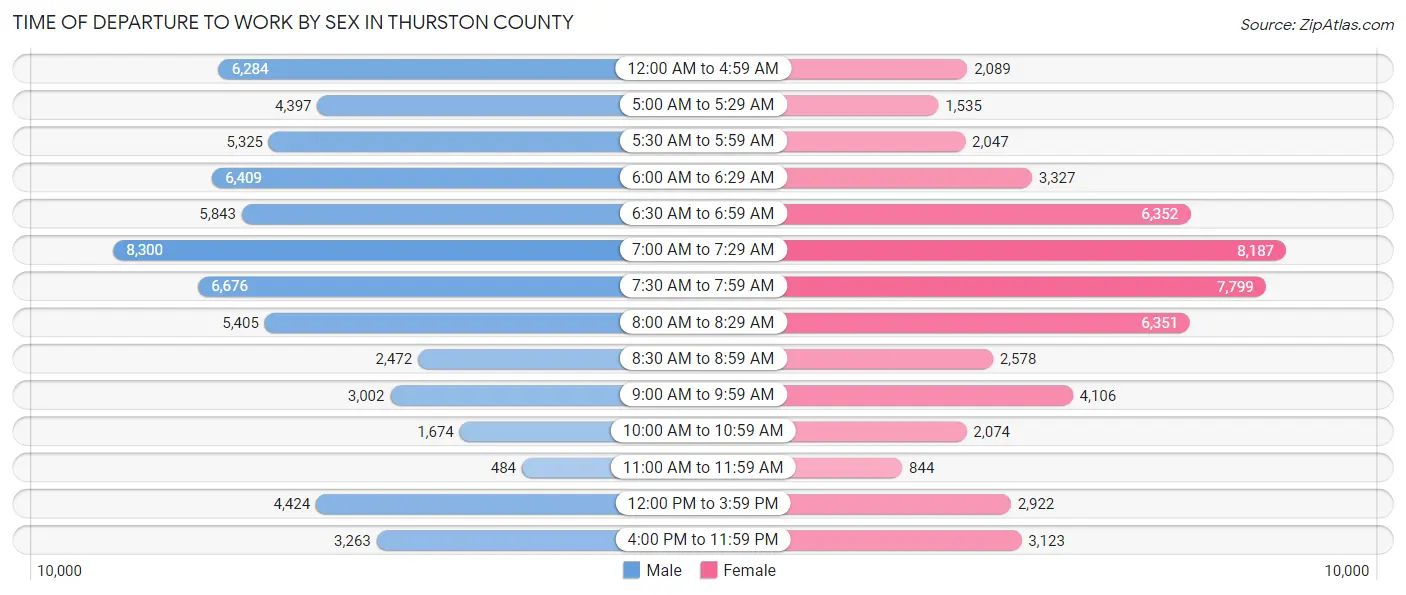
| Time of Departure | Male | Female |
| 12:00 AM to 4:59 AM | 6,284 (9.8%) | 2,089 (3.9%) |
| 5:00 AM to 5:29 AM | 4,397 (6.9%) | 1,535 (2.9%) |
| 5:30 AM to 5:59 AM | 5,325 (8.3%) | 2,047 (3.8%) |
| 6:00 AM to 6:29 AM | 6,409 (10.0%) | 3,327 (6.2%) |
| 6:30 AM to 6:59 AM | 5,843 (9.1%) | 6,352 (11.9%) |
| 7:00 AM to 7:29 AM | 8,300 (13.0%) | 8,187 (15.3%) |
| 7:30 AM to 7:59 AM | 6,676 (10.4%) | 7,799 (14.6%) |
| 8:00 AM to 8:29 AM | 5,405 (8.5%) | 6,351 (11.9%) |
| 8:30 AM to 8:59 AM | 2,472 (3.9%) | 2,578 (4.8%) |
| 9:00 AM to 9:59 AM | 3,002 (4.7%) | 4,106 (7.7%) |
| 10:00 AM to 10:59 AM | 1,674 (2.6%) | 2,074 (3.9%) |
| 11:00 AM to 11:59 AM | 484 (0.8%) | 844 (1.6%) |
| 12:00 PM to 3:59 PM | 4,424 (6.9%) | 2,922 (5.5%) |
| 4:00 PM to 11:59 PM | 3,263 (5.1%) | 3,123 (5.9%) |
| Total | 63,958 (100.0%) | 53,334 (100.0%) |
Housing Occupancy in Thurston County
Occupancy by Ownership in Thurston County
Of the total 115,695 dwellings in Thurston County, owner-occupied units account for 77,830 (67.3%), while renter-occupied units make up 37,865 (32.7%).
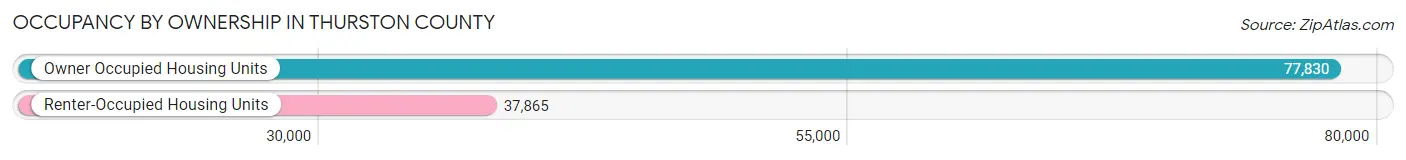
| Occupancy | # Housing Units | % Housing Units |
| Owner Occupied Housing Units | 77,830 | 67.3% |
| Renter-Occupied Housing Units | 37,865 | 32.7% |
| Total Occupied Housing Units | 115,695 | 100.0% |
Occupancy by Household Size in Thurston County
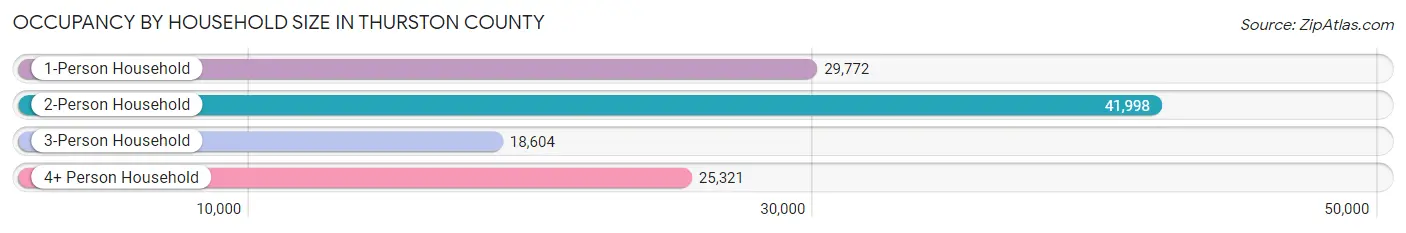
| Household Size | # Housing Units | % Housing Units |
| 1-Person Household | 29,772 | 25.7% |
| 2-Person Household | 41,998 | 36.3% |
| 3-Person Household | 18,604 | 16.1% |
| 4+ Person Household | 25,321 | 21.9% |
| Total Housing Units | 115,695 | 100.0% |
Occupancy by Ownership by Household Size in Thurston County
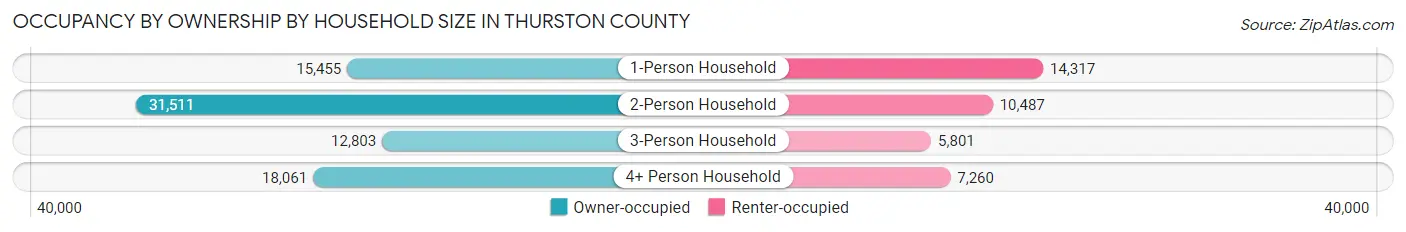
| Household Size | Owner-occupied | Renter-occupied |
| 1-Person Household | 15,455 (51.9%) | 14,317 (48.1%) |
| 2-Person Household | 31,511 (75.0%) | 10,487 (25.0%) |
| 3-Person Household | 12,803 (68.8%) | 5,801 (31.2%) |
| 4+ Person Household | 18,061 (71.3%) | 7,260 (28.7%) |
| Total Housing Units | 77,830 (67.3%) | 37,865 (32.7%) |
Occupancy by Educational Attainment in Thurston County
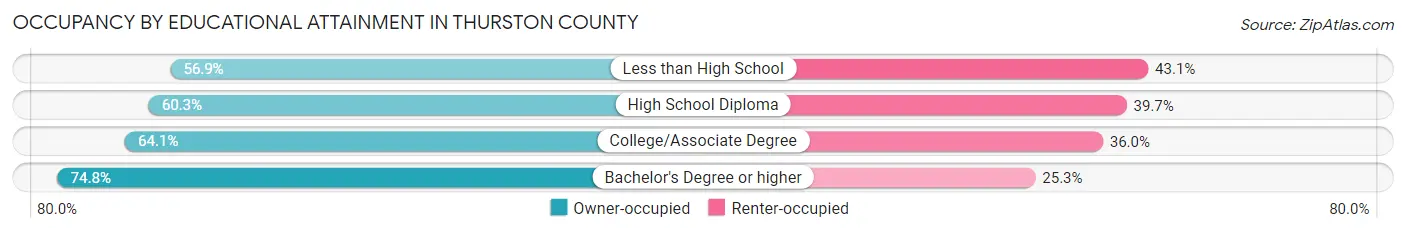
| Household Size | Owner-occupied | Renter-occupied |
| Less than High School | 2,707 (56.9%) | 2,054 (43.1%) |
| High School Diploma | 12,640 (60.3%) | 8,324 (39.7%) |
| College/Associate Degree | 28,544 (64.0%) | 16,021 (35.9%) |
| Bachelor's Degree or higher | 33,939 (74.8%) | 11,466 (25.3%) |
Occupancy by Age of Householder in Thurston County
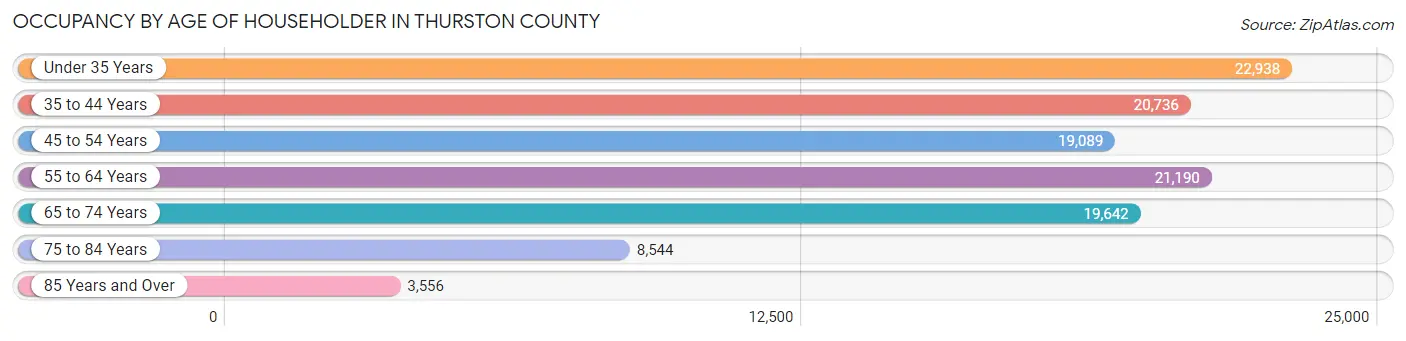
| Age Bracket | # Households | % Households |
| Under 35 Years | 22,938 | 19.8% |
| 35 to 44 Years | 20,736 | 17.9% |
| 45 to 54 Years | 19,089 | 16.5% |
| 55 to 64 Years | 21,190 | 18.3% |
| 65 to 74 Years | 19,642 | 17.0% |
| 75 to 84 Years | 8,544 | 7.4% |
| 85 Years and Over | 3,556 | 3.1% |
| Total | 115,695 | 100.0% |
Housing Finances in Thurston County
Median Income by Occupancy in Thurston County
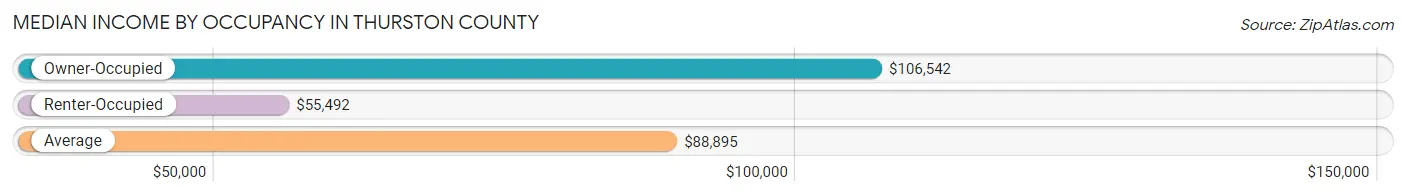
| Occupancy Type | # Households | Median Income |
| Owner-Occupied | 77,830 (67.3%) | $106,542 |
| Renter-Occupied | 37,865 (32.7%) | $55,492 |
| Average | 115,695 (100.0%) | $88,895 |
Occupancy by Householder Income Bracket in Thurston County
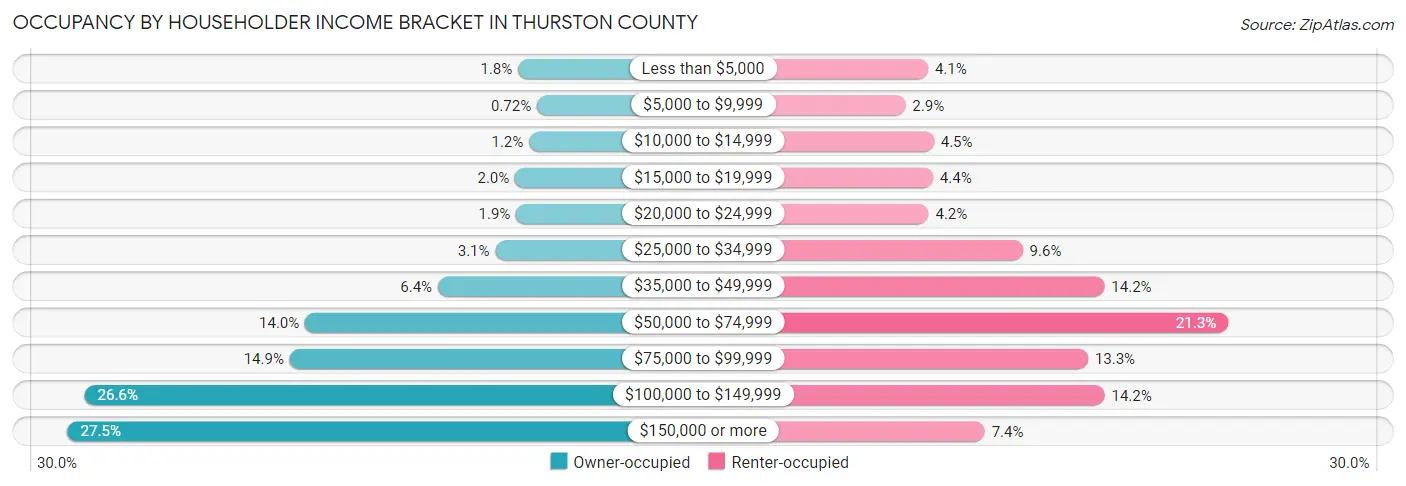
| Income Bracket | Owner-occupied | Renter-occupied |
| Less than $5,000 | 1,403 (1.8%) | 1,569 (4.1%) |
| $5,000 to $9,999 | 562 (0.7%) | 1,080 (2.9%) |
| $10,000 to $14,999 | 913 (1.2%) | 1,692 (4.5%) |
| $15,000 to $19,999 | 1,535 (2.0%) | 1,672 (4.4%) |
| $20,000 to $24,999 | 1,486 (1.9%) | 1,578 (4.2%) |
| $25,000 to $34,999 | 2,414 (3.1%) | 3,618 (9.6%) |
| $35,000 to $49,999 | 4,967 (6.4%) | 5,385 (14.2%) |
| $50,000 to $74,999 | 10,871 (14.0%) | 8,062 (21.3%) |
| $75,000 to $99,999 | 11,560 (14.8%) | 5,027 (13.3%) |
| $100,000 to $149,999 | 20,682 (26.6%) | 5,389 (14.2%) |
| $150,000 or more | 21,437 (27.5%) | 2,793 (7.4%) |
| Total | 77,830 (100.0%) | 37,865 (100.0%) |
Monthly Housing Cost Tiers in Thurston County
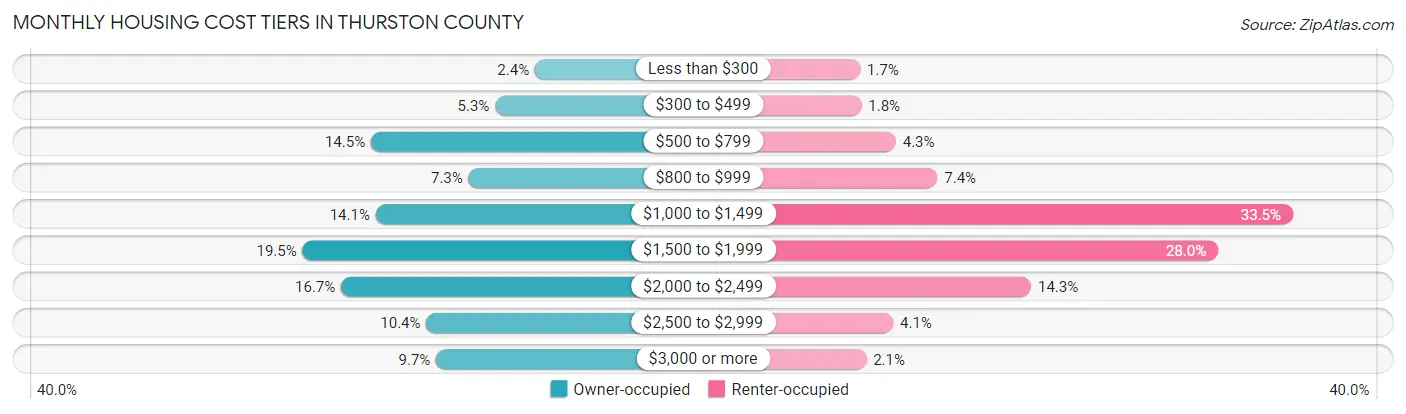
| Monthly Cost | Owner-occupied | Renter-occupied |
| Less than $300 | 1,876 (2.4%) | 631 (1.7%) |
| $300 to $499 | 4,153 (5.3%) | 667 (1.8%) |
| $500 to $799 | 11,279 (14.5%) | 1,628 (4.3%) |
| $800 to $999 | 5,684 (7.3%) | 2,785 (7.4%) |
| $1,000 to $1,499 | 11,004 (14.1%) | 12,699 (33.5%) |
| $1,500 to $1,999 | 15,199 (19.5%) | 10,614 (28.0%) |
| $2,000 to $2,499 | 12,989 (16.7%) | 5,399 (14.3%) |
| $2,500 to $2,999 | 8,103 (10.4%) | 1,554 (4.1%) |
| $3,000 or more | 7,543 (9.7%) | 801 (2.1%) |
| Total | 77,830 (100.0%) | 37,865 (100.0%) |
Physical Housing Characteristics in Thurston County
Housing Structures in Thurston County
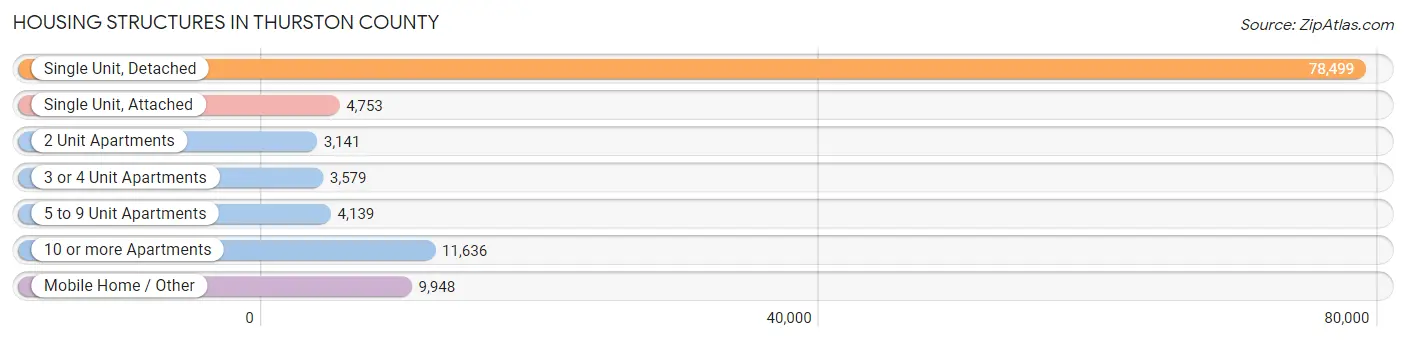
| Structure Type | # Housing Units | % Housing Units |
| Single Unit, Detached | 78,499 | 67.8% |
| Single Unit, Attached | 4,753 | 4.1% |
| 2 Unit Apartments | 3,141 | 2.7% |
| 3 or 4 Unit Apartments | 3,579 | 3.1% |
| 5 to 9 Unit Apartments | 4,139 | 3.6% |
| 10 or more Apartments | 11,636 | 10.1% |
| Mobile Home / Other | 9,948 | 8.6% |
| Total | 115,695 | 100.0% |
Housing Structures by Occupancy in Thurston County
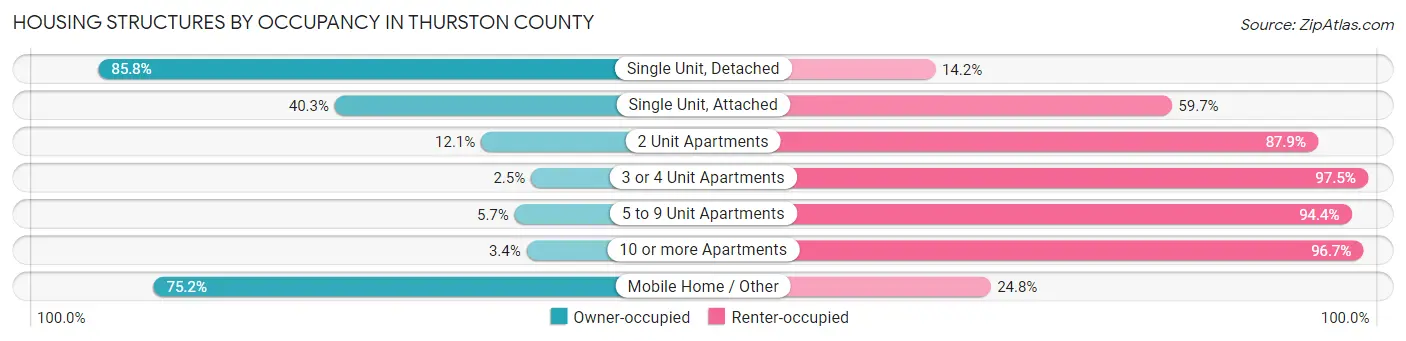
| Structure Type | Owner-occupied | Renter-occupied |
| Single Unit, Detached | 67,346 (85.8%) | 11,153 (14.2%) |
| Single Unit, Attached | 1,914 (40.3%) | 2,839 (59.7%) |
| 2 Unit Apartments | 380 (12.1%) | 2,761 (87.9%) |
| 3 or 4 Unit Apartments | 89 (2.5%) | 3,490 (97.5%) |
| 5 to 9 Unit Apartments | 234 (5.7%) | 3,905 (94.4%) |
| 10 or more Apartments | 390 (3.4%) | 11,246 (96.7%) |
| Mobile Home / Other | 7,477 (75.2%) | 2,471 (24.8%) |
| Total | 77,830 (67.3%) | 37,865 (32.7%) |
Housing Structures by Number of Rooms in Thurston County
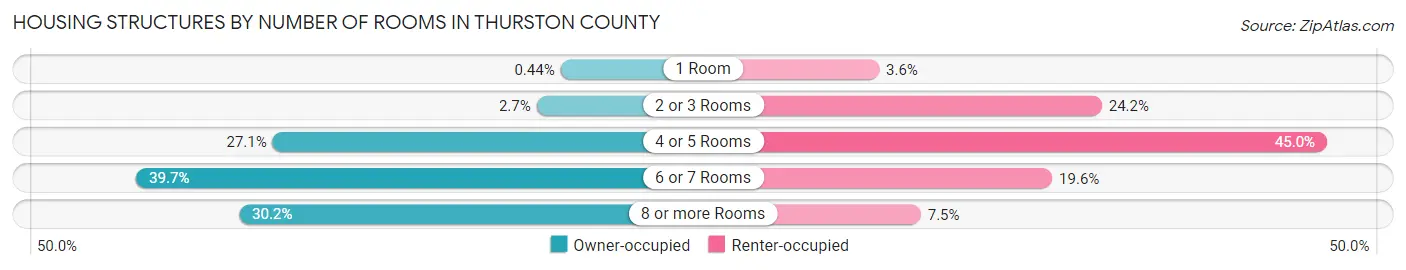
| Number of Rooms | Owner-occupied | Renter-occupied |
| 1 Room | 342 (0.4%) | 1,371 (3.6%) |
| 2 or 3 Rooms | 2,062 (2.6%) | 9,172 (24.2%) |
| 4 or 5 Rooms | 21,068 (27.1%) | 17,056 (45.0%) |
| 6 or 7 Rooms | 30,881 (39.7%) | 7,433 (19.6%) |
| 8 or more Rooms | 23,477 (30.2%) | 2,833 (7.5%) |
| Total | 77,830 (100.0%) | 37,865 (100.0%) |
Housing Structure by Heating Type in Thurston County
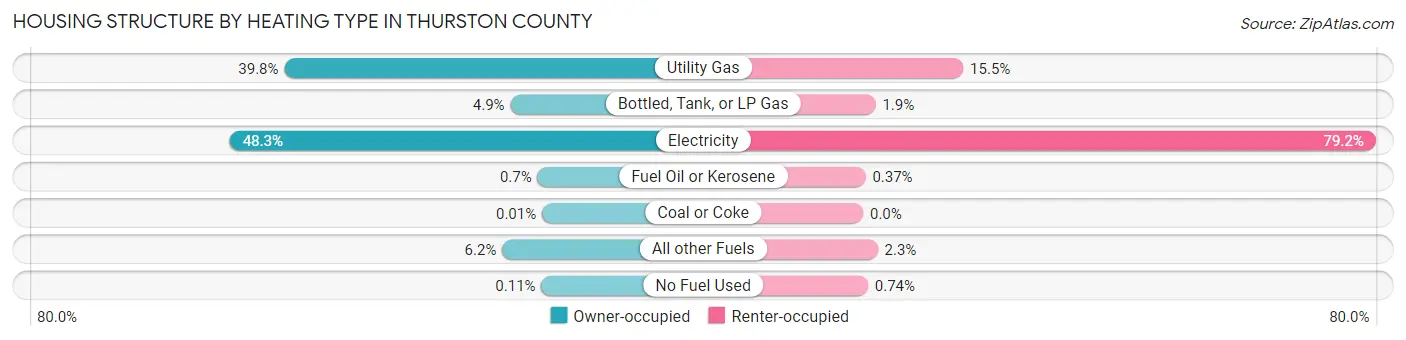
| Heating Type | Owner-occupied | Renter-occupied |
| Utility Gas | 31,009 (39.8%) | 5,860 (15.5%) |
| Bottled, Tank, or LP Gas | 3,810 (4.9%) | 728 (1.9%) |
| Electricity | 37,582 (48.3%) | 30,004 (79.2%) |
| Fuel Oil or Kerosene | 543 (0.7%) | 141 (0.4%) |
| Coal or Coke | 9 (0.0%) | 0 (0.0%) |
| All other Fuels | 4,795 (6.2%) | 851 (2.2%) |
| No Fuel Used | 82 (0.1%) | 281 (0.7%) |
| Total | 77,830 (100.0%) | 37,865 (100.0%) |
Household Vehicle Usage in Thurston County
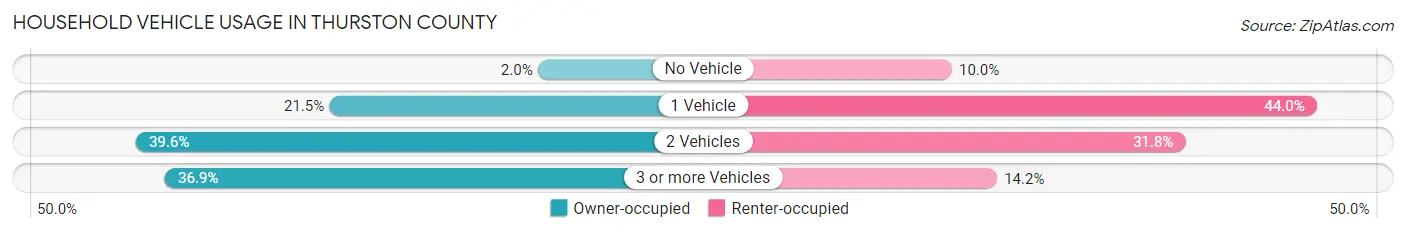
| Vehicles per Household | Owner-occupied | Renter-occupied |
| No Vehicle | 1,583 (2.0%) | 3,787 (10.0%) |
| 1 Vehicle | 16,724 (21.5%) | 16,670 (44.0%) |
| 2 Vehicles | 30,822 (39.6%) | 12,025 (31.8%) |
| 3 or more Vehicles | 28,701 (36.9%) | 5,383 (14.2%) |
| Total | 77,830 (100.0%) | 37,865 (100.0%) |
Real Estate & Mortgages in Thurston County
Real Estate and Mortgage Overview in Thurston County
| Characteristic | Without Mortgage | With Mortgage |
| Housing Units | 24,831 | 52,999 |
| Median Property Value | $381,800 | $422,800 |
| Median Household Income | $82,453 | $16,805 |
| Monthly Housing Costs | $694 | $7,487 |
| Real Estate Taxes | $3,686 | $1,208 |
Property Value by Mortgage Status in Thurston County
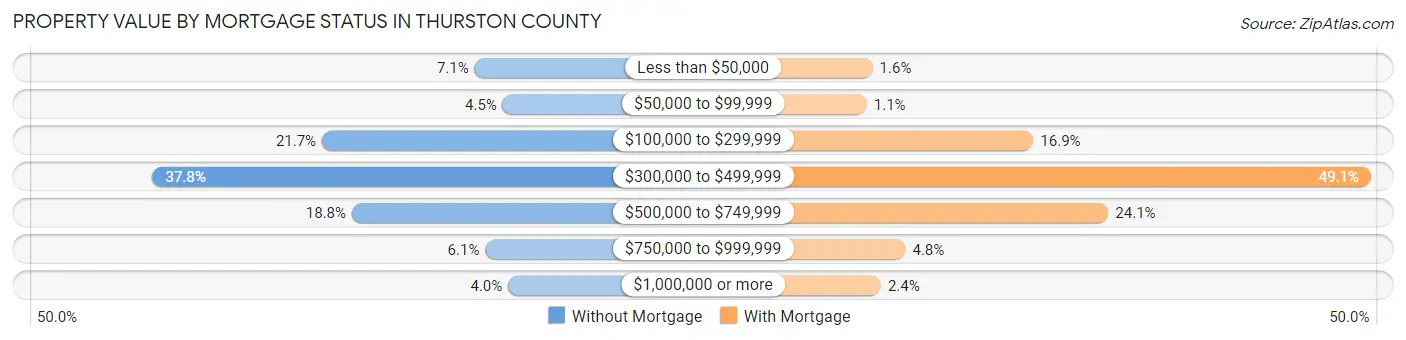
| Property Value | Without Mortgage | With Mortgage |
| Less than $50,000 | 1,773 (7.1%) | 865 (1.6%) |
| $50,000 to $99,999 | 1,110 (4.5%) | 572 (1.1%) |
| $100,000 to $299,999 | 5,384 (21.7%) | 8,978 (16.9%) |
| $300,000 to $499,999 | 9,388 (37.8%) | 26,012 (49.1%) |
| $500,000 to $749,999 | 4,675 (18.8%) | 12,763 (24.1%) |
| $750,000 to $999,999 | 1,521 (6.1%) | 2,525 (4.8%) |
| $1,000,000 or more | 980 (4.0%) | 1,284 (2.4%) |
| Total | 24,831 (100.0%) | 52,999 (100.0%) |
Household Income by Mortgage Status in Thurston County
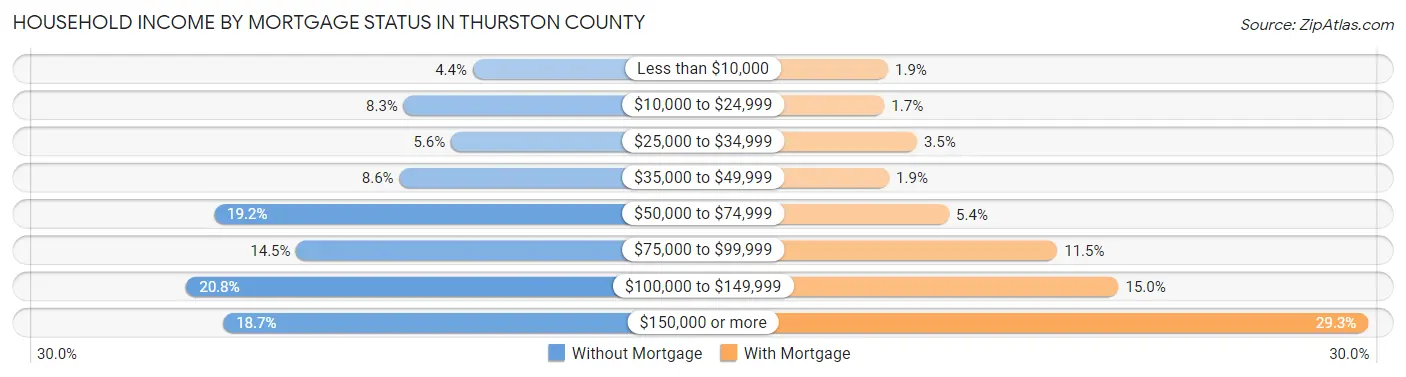
| Household Income | Without Mortgage | With Mortgage |
| Less than $10,000 | 1,089 (4.4%) | 985 (1.9%) |
| $10,000 to $24,999 | 2,072 (8.3%) | 876 (1.7%) |
| $25,000 to $34,999 | 1,398 (5.6%) | 1,862 (3.5%) |
| $35,000 to $49,999 | 2,131 (8.6%) | 1,016 (1.9%) |
| $50,000 to $74,999 | 4,761 (19.2%) | 2,836 (5.3%) |
| $75,000 to $99,999 | 3,592 (14.5%) | 6,110 (11.5%) |
| $100,000 to $149,999 | 5,156 (20.8%) | 7,968 (15.0%) |
| $150,000 or more | 4,632 (18.6%) | 15,526 (29.3%) |
| Total | 24,831 (100.0%) | 52,999 (100.0%) |
Property Value to Household Income Ratio in Thurston County
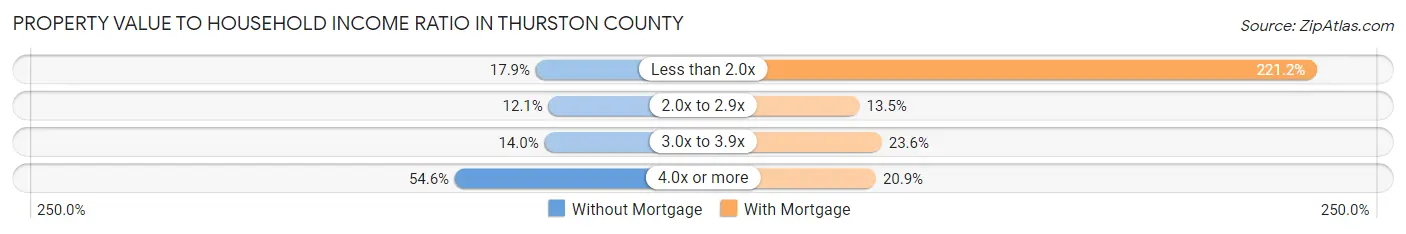
| Value-to-Income Ratio | Without Mortgage | With Mortgage |
| Less than 2.0x | 4,439 (17.9%) | 117,235 (221.2%) |
| 2.0x to 2.9x | 3,001 (12.1%) | 7,157 (13.5%) |
| 3.0x to 3.9x | 3,464 (14.0%) | 12,493 (23.6%) |
| 4.0x or more | 13,561 (54.6%) | 11,078 (20.9%) |
| Total | 24,831 (100.0%) | 52,999 (100.0%) |
Real Estate Taxes by Mortgage Status in Thurston County
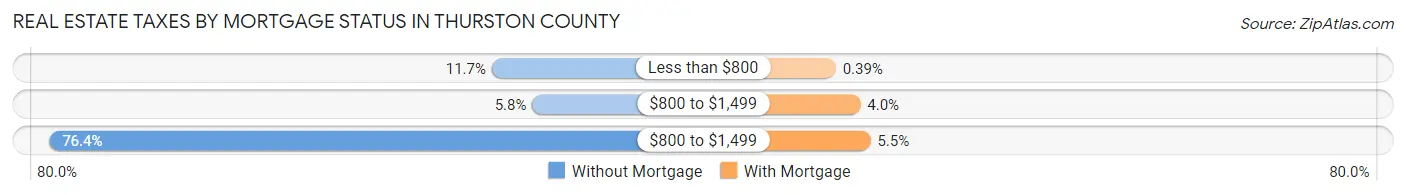
| Property Taxes | Without Mortgage | With Mortgage |
| Less than $800 | 2,914 (11.7%) | 205 (0.4%) |
| $800 to $1,499 | 1,444 (5.8%) | 2,115 (4.0%) |
| $800 to $1,499 | 18,971 (76.4%) | 2,899 (5.5%) |
| Total | 24,831 (100.0%) | 52,999 (100.0%) |
Health & Disability in Thurston County
Health Insurance Coverage by Age in Thurston County
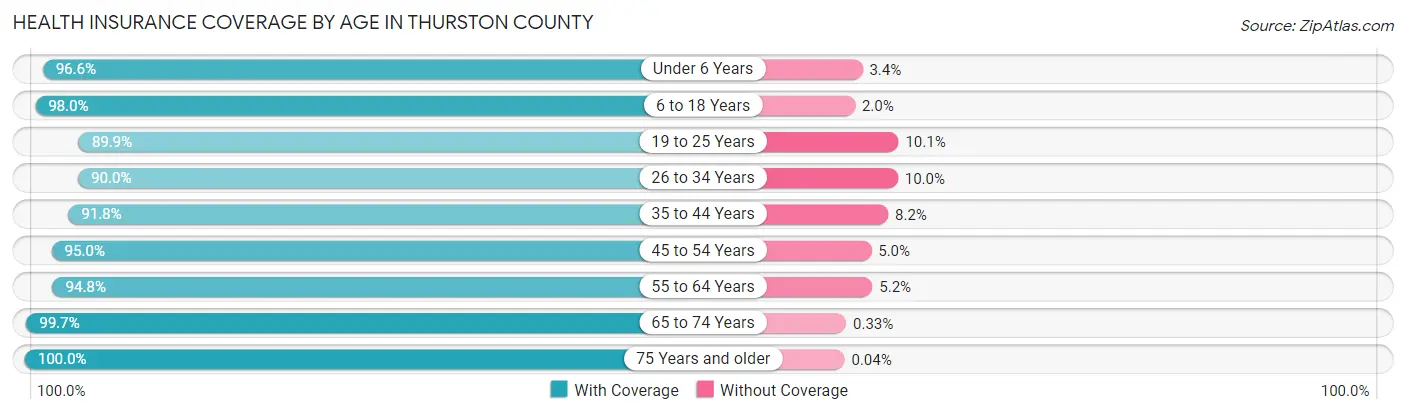
| Age Bracket | With Coverage | Without Coverage |
| Under 6 Years | 19,214 (96.6%) | 674 (3.4%) |
| 6 to 18 Years | 44,721 (98.0%) | 906 (2.0%) |
| 19 to 25 Years | 20,557 (89.9%) | 2,313 (10.1%) |
| 26 to 34 Years | 31,432 (90.0%) | 3,479 (10.0%) |
| 35 to 44 Years | 36,319 (91.8%) | 3,233 (8.2%) |
| 45 to 54 Years | 32,934 (95.0%) | 1,744 (5.0%) |
| 55 to 64 Years | 35,004 (94.8%) | 1,932 (5.2%) |
| 65 to 74 Years | 32,415 (99.7%) | 106 (0.3%) |
| 75 Years and older | 19,442 (100.0%) | 8 (0.0%) |
| Total | 272,038 (95.0%) | 14,395 (5.0%) |
Health Insurance Coverage by Citizenship Status in Thurston County
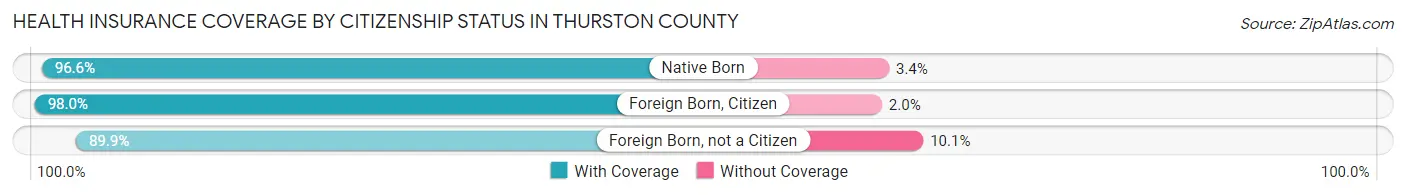
| Citizenship Status | With Coverage | Without Coverage |
| Native Born | 19,214 (96.6%) | 674 (3.4%) |
| Foreign Born, Citizen | 44,721 (98.0%) | 906 (2.0%) |
| Foreign Born, not a Citizen | 20,557 (89.9%) | 2,313 (10.1%) |
Health Insurance Coverage by Household Income in Thurston County
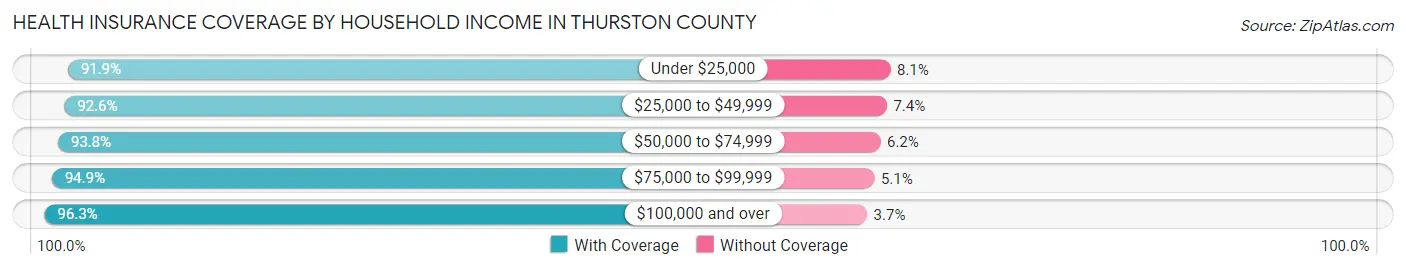
| Household Income | With Coverage | Without Coverage |
| Under $25,000 | 20,468 (91.9%) | 1,803 (8.1%) |
| $25,000 to $49,999 | 29,248 (92.6%) | 2,346 (7.4%) |
| $50,000 to $74,999 | 37,666 (93.8%) | 2,502 (6.2%) |
| $75,000 to $99,999 | 38,960 (94.9%) | 2,088 (5.1%) |
| $100,000 and over | 143,762 (96.3%) | 5,556 (3.7%) |
Public vs Private Health Insurance Coverage by Age in Thurston County
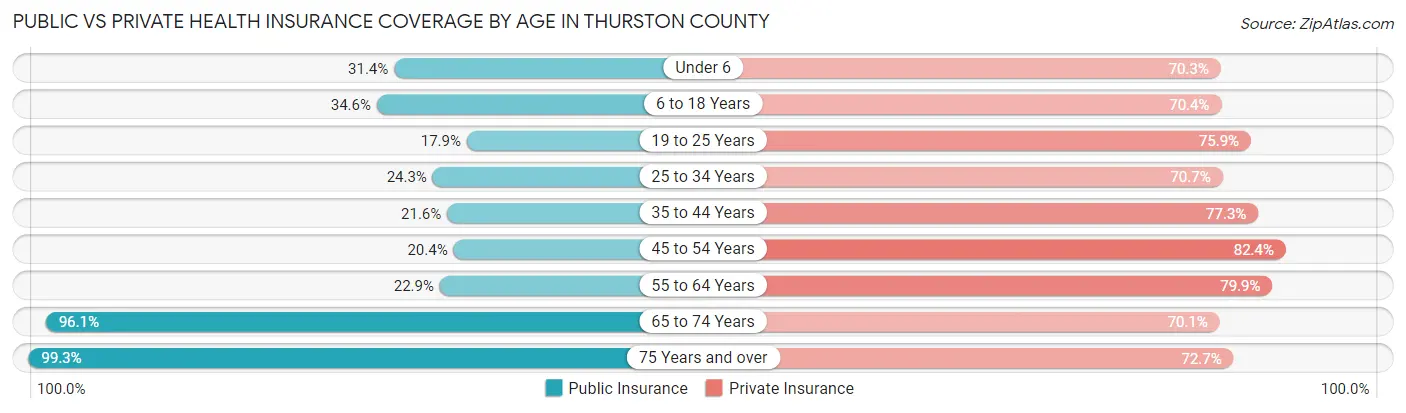
| Age Bracket | Public Insurance | Private Insurance |
| Under 6 | 6,246 (31.4%) | 13,987 (70.3%) |
| 6 to 18 Years | 15,801 (34.6%) | 32,138 (70.4%) |
| 19 to 25 Years | 4,099 (17.9%) | 17,367 (75.9%) |
| 25 to 34 Years | 8,466 (24.2%) | 24,668 (70.7%) |
| 35 to 44 Years | 8,535 (21.6%) | 30,566 (77.3%) |
| 45 to 54 Years | 7,071 (20.4%) | 28,575 (82.4%) |
| 55 to 64 Years | 8,470 (22.9%) | 29,517 (79.9%) |
| 65 to 74 Years | 31,242 (96.1%) | 22,811 (70.1%) |
| 75 Years and over | 19,312 (99.3%) | 14,142 (72.7%) |
| Total | 109,242 (38.1%) | 213,771 (74.6%) |
Disability Status by Sex by Age in Thurston County
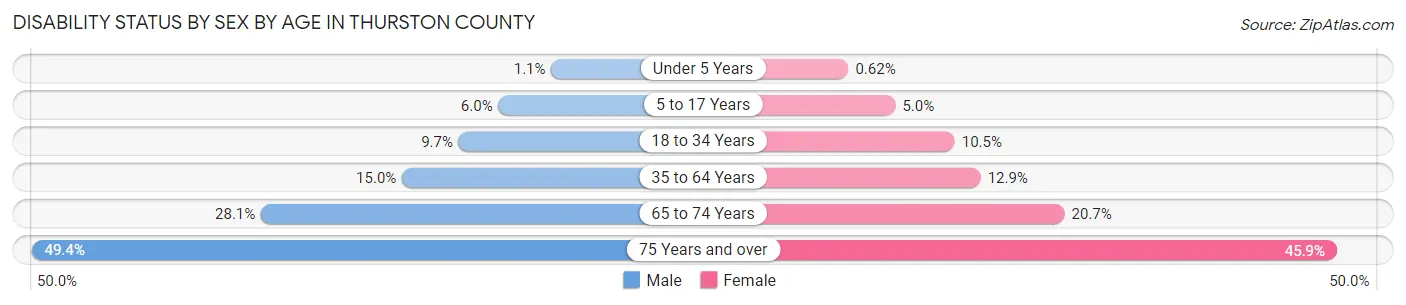
| Age Bracket | Male | Female |
| Under 5 Years | 94 (1.1%) | 48 (0.6%) |
| 5 to 17 Years | 1,421 (6.0%) | 1,103 (5.0%) |
| 18 to 34 Years | 2,885 (9.7%) | 3,317 (10.5%) |
| 35 to 64 Years | 8,054 (15.0%) | 7,391 (12.9%) |
| 65 to 74 Years | 4,228 (28.1%) | 3,609 (20.7%) |
| 75 Years and over | 4,017 (49.3%) | 5,196 (45.9%) |
Disability Class by Sex by Age in Thurston County
Disability Class: Hearing Difficulty
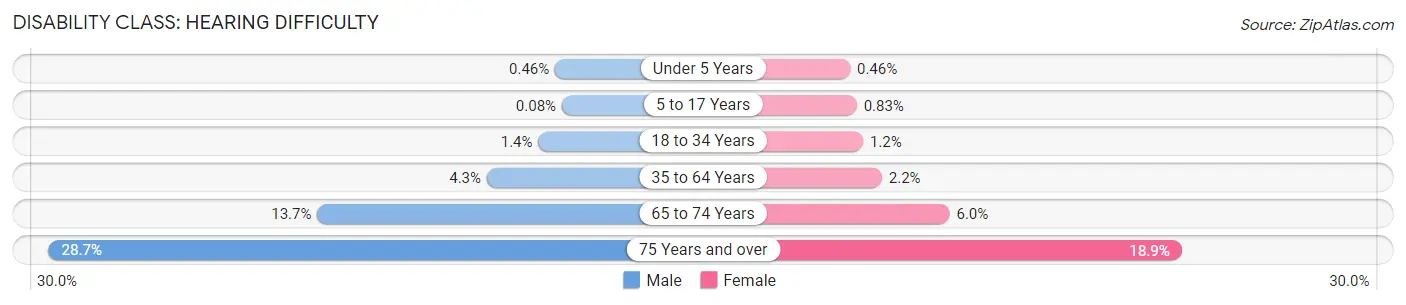
| Age Bracket | Male | Female |
| Under 5 Years | 39 (0.5%) | 36 (0.5%) |
| 5 to 17 Years | 20 (0.1%) | 184 (0.8%) |
| 18 to 34 Years | 414 (1.4%) | 374 (1.2%) |
| 35 to 64 Years | 2,295 (4.3%) | 1,277 (2.2%) |
| 65 to 74 Years | 2,065 (13.7%) | 1,047 (6.0%) |
| 75 Years and over | 2,333 (28.7%) | 2,140 (18.9%) |
Disability Class: Vision Difficulty
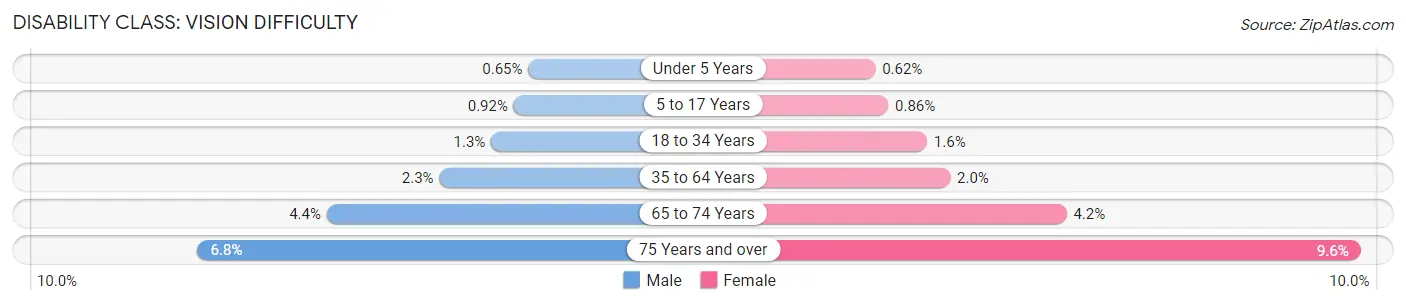
| Age Bracket | Male | Female |
| Under 5 Years | 55 (0.6%) | 48 (0.6%) |
| 5 to 17 Years | 218 (0.9%) | 190 (0.9%) |
| 18 to 34 Years | 399 (1.3%) | 498 (1.6%) |
| 35 to 64 Years | 1,238 (2.3%) | 1,155 (2.0%) |
| 65 to 74 Years | 662 (4.4%) | 727 (4.2%) |
| 75 Years and over | 553 (6.8%) | 1,089 (9.6%) |
Disability Class: Cognitive Difficulty
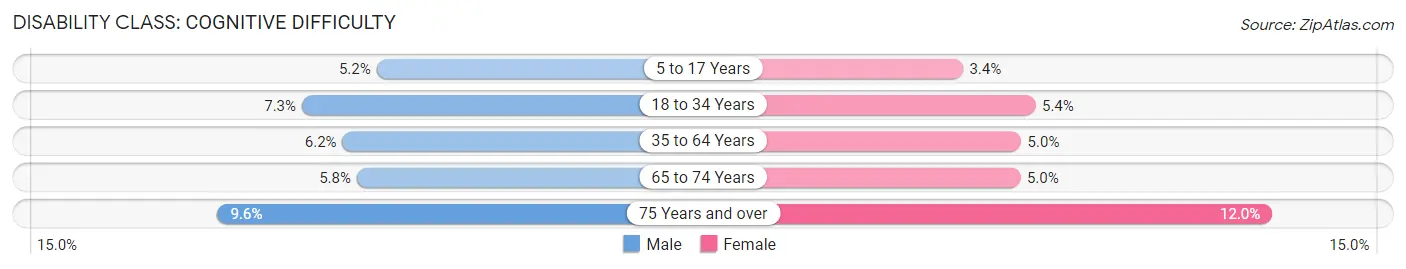
| Age Bracket | Male | Female |
| 5 to 17 Years | 1,226 (5.2%) | 745 (3.4%) |
| 18 to 34 Years | 2,166 (7.3%) | 1,701 (5.4%) |
| 35 to 64 Years | 3,308 (6.1%) | 2,856 (5.0%) |
| 65 to 74 Years | 866 (5.8%) | 866 (5.0%) |
| 75 Years and over | 784 (9.6%) | 1,355 (12.0%) |
Disability Class: Ambulatory Difficulty
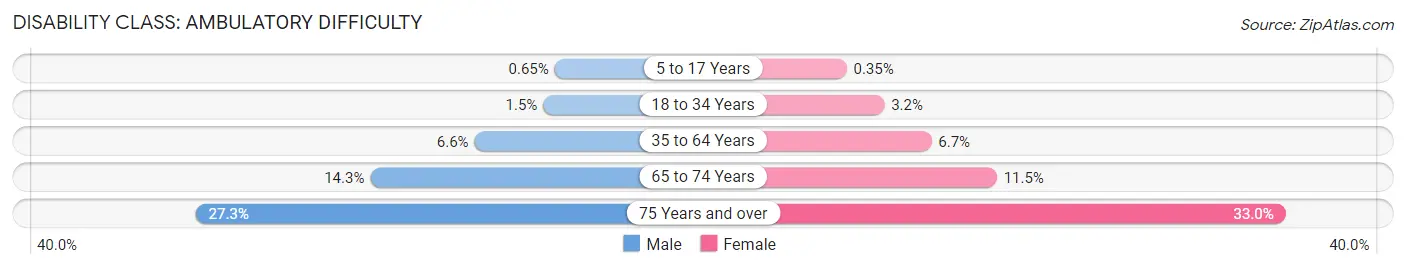
| Age Bracket | Male | Female |
| 5 to 17 Years | 153 (0.6%) | 77 (0.4%) |
| 18 to 34 Years | 447 (1.5%) | 997 (3.2%) |
| 35 to 64 Years | 3,553 (6.6%) | 3,815 (6.7%) |
| 65 to 74 Years | 2,161 (14.3%) | 2,006 (11.5%) |
| 75 Years and over | 2,222 (27.3%) | 3,727 (33.0%) |
Disability Class: Self-Care Difficulty
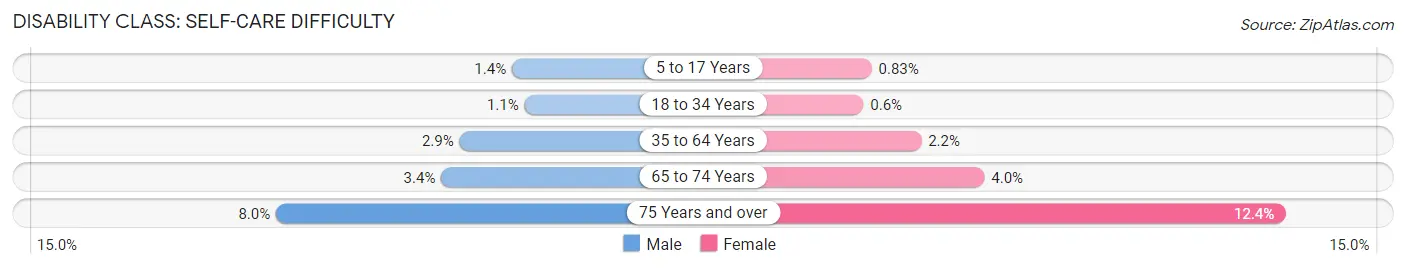
| Age Bracket | Male | Female |
| 5 to 17 Years | 337 (1.4%) | 183 (0.8%) |
| 18 to 34 Years | 321 (1.1%) | 189 (0.6%) |
| 35 to 64 Years | 1,556 (2.9%) | 1,266 (2.2%) |
| 65 to 74 Years | 512 (3.4%) | 693 (4.0%) |
| 75 Years and over | 651 (8.0%) | 1,399 (12.4%) |
Technology Access in Thurston County
Computing Device Access in Thurston County
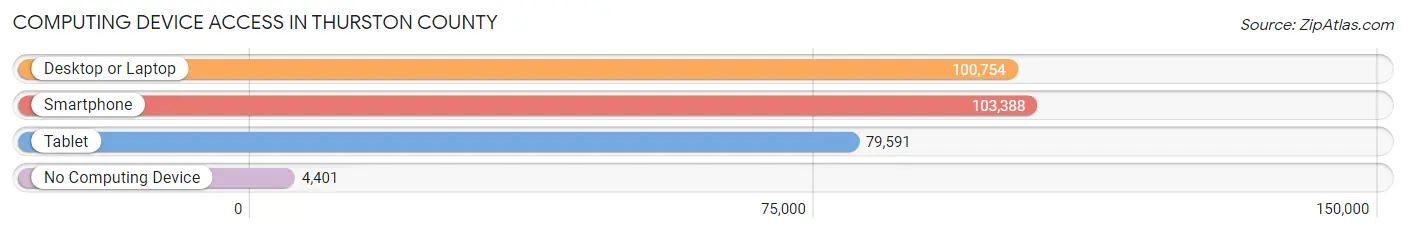
| Device Type | # Households | % Households |
| Desktop or Laptop | 100,754 | 87.1% |
| Smartphone | 103,388 | 89.4% |
| Tablet | 79,591 | 68.8% |
| No Computing Device | 4,401 | 3.8% |
| Total | 115,695 | 100.0% |
Internet Access in Thurston County
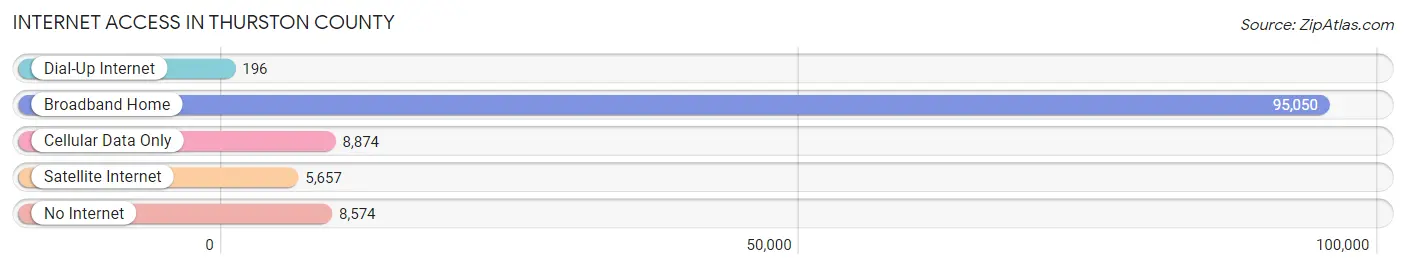
| Internet Type | # Households | % Households |
| Dial-Up Internet | 196 | 0.2% |
| Broadband Home | 95,050 | 82.2% |
| Cellular Data Only | 8,874 | 7.7% |
| Satellite Internet | 5,657 | 4.9% |
| No Internet | 8,574 | 7.4% |
| Total | 115,695 | 100.0% |
Thurston County Summary
Thurston County is located in the Puget Sound region of Washington State, and is the home of the state capital, Olympia. It is bordered by Mason County to the north, Lewis County to the east, Grays Harbor County to the west, and Pierce County to the south. Thurston County is the seventh most populous county in Washington, with a population of 252,264 as of 2019.
History
The area that is now Thurston County was inhabited by the Nisqually, Squaxin, Chehalis, and other Native American tribes for thousands of years before the arrival of European settlers. The first European settlers arrived in the area in the early 1800s, and the county was officially established in 1852. The county was named after Samuel R. Thurston, who was the first delegate to the United States Congress from the Oregon Territory.
In the late 1800s, the county experienced a period of rapid growth due to the logging and railroad industries. The county seat, Olympia, was established in 1853 and quickly became the center of commerce and government in the region.
Geography
Thurston County covers an area of 1,879 square miles, making it the second largest county in Washington State. The county is located in the Puget Sound region of the state, and is bordered by Mason County to the north, Lewis County to the east, Grays Harbor County to the west, and Pierce County to the south. The county is home to several rivers, including the Deschutes, Nisqually, and Chehalis Rivers. The county also contains several lakes, including Long Lake, Deep Lake, and Lake Lawrence.
The county is home to several state parks, including Capitol State Forest, Millersylvania State Park, and Tolmie State Park. The county also contains several wildlife refuges, including the Nisqually National Wildlife Refuge and the Billy Frank Jr. Nisqually National Wildlife Refuge.
Economy
Thurston County has a diverse economy, with a mix of industries including government, retail, healthcare, manufacturing, and technology. The county is home to several major employers, including the State of Washington, Providence St. Peter Hospital, and the Olympia School District.
The county is also home to several major industries, including timber, agriculture, and tourism. The county is home to several wineries, breweries, and distilleries, as well as several popular tourist attractions, including the Washington State Capitol, the Nisqually National Wildlife Refuge, and the Billy Frank Jr. Nisqually National Wildlife Refuge.
Demographics
As of 2019, Thurston County had a population of 252,264. The population is racially and ethnically diverse, with the largest racial/ethnic groups being White (77.2%), Hispanic or Latino (10.2%), and Asian (5.2%). The median household income in the county is $60,845, and the median home value is $281,400. The county has a poverty rate of 11.2%, and the unemployment rate is 4.2%.
Conclusion
Thurston County is a vibrant and diverse county located in the Puget Sound region of Washington State. The county is home to the state capital, Olympia, and is the seventh most populous county in the state. The county has a diverse economy, with a mix of industries including government, retail, healthcare, manufacturing, and technology. The county is also home to several major employers, including the State of Washington, Providence St. Peter Hospital, and the Olympia School District. The population of the county is racially and ethnically diverse, with the largest racial/ethnic groups being White (77.2%), Hispanic or Latino (10.2%), and Asian (5.2%). The median household income in the county is $60,845, and the median home value is $281,400.
Common Questions
What is the Total Population of Thurston County?
Total Population of Thurston County is 294,272.
What is the Total Male Population of Thurston County?
Total Male Population of Thurston County is 145,124.
What is the Total Female Population of Thurston County?
Total Female Population of Thurston County is 149,148.
What is the Ratio of Males per 100 Females in Thurston County?
There are 97.30 Males per 100 Females in Thurston County.
What is the Ratio of Females per 100 Males in Thurston County?
There are 102.77 Females per 100 Males in Thurston County.
What is the Median Population Age in Thurston County?
Median Population Age in Thurston County is 39.5 Years.
What is the Average Family Size in Thurston County
Average Family Size in Thurston County is 3.0 People.
What is the Average Household Size in Thurston County
Average Household Size in Thurston County is 2.5 People.
What is Per Capita Income in Thurston County?
Per Capita income in Thurston County is $42,306.
What is the Median Family Income in Thurston County?
Median Family Income in Thurston County is $106,190.
What is the Median Household income in Thurston County?
Median Household Income in Thurston County is $88,895.
What is Income or Wage Gap in Thurston County?
Income or Wage Gap in Thurston County is 27.5%.
Women in Thurston County earn 72.5 cents for every dollar earned by a man.
What is Family Income Deficit in Thurston County?
Family Income Deficit in Thurston County is $11,937.
Families that are below poverty line in Thurston County earn $11,937 less on average than the poverty threshold level.
What is Inequality or Gini Index in Thurston County?
Inequality or Gini Index in Thurston County is 0.41.
How Large is the Labor Force in Thurston County?
There are 148,493 People in the Labor Forcein in Thurston County.
What is the Percentage of People in the Labor Force in Thurston County?
62.0% of People are in the Labor Force in Thurston County.
What is the Unemployment Rate in Thurston County?
Unemployment Rate in Thurston County is 5.5%.