Snohomish County, WA
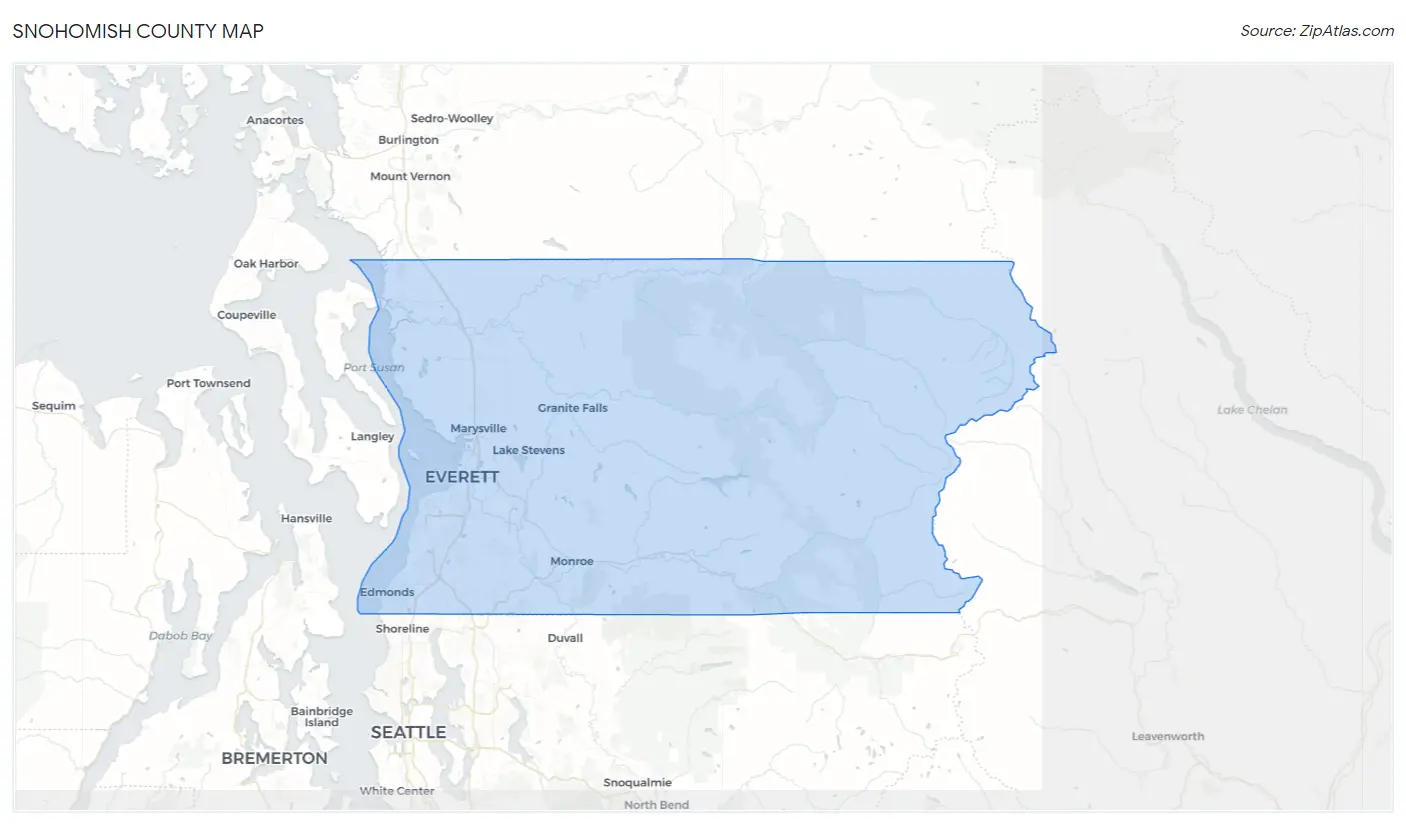
Snohomish County Map
Snohomish County Overview
828,337
TOTAL POPULATION
418,342
MALE POPULATION
409,995
FEMALE POPULATION
102.04
MALES / 100 FEMALES
98.00
FEMALES / 100 MALES
38.3
MEDIAN AGE
3.1
AVG FAMILY SIZE
2.7
AVG HOUSEHOLD SIZE
$49,215
PER CAPITA INCOME
$121,379
AVG FAMILY INCOME
$104,083
AVG HOUSEHOLD INCOME
33.0%
WAGE / INCOME GAP [ % ]
67.0¢/ $1
WAGE / INCOME GAP [ $ ]
$11,662
FAMILY INCOME DEFICIT
0.42
INEQUALITY / GINI INDEX
447,998
LABOR FORCE [ PEOPLE ]
67.4%
PERCENT IN LABOR FORCE
4.4%
UNEMPLOYMENT RATE
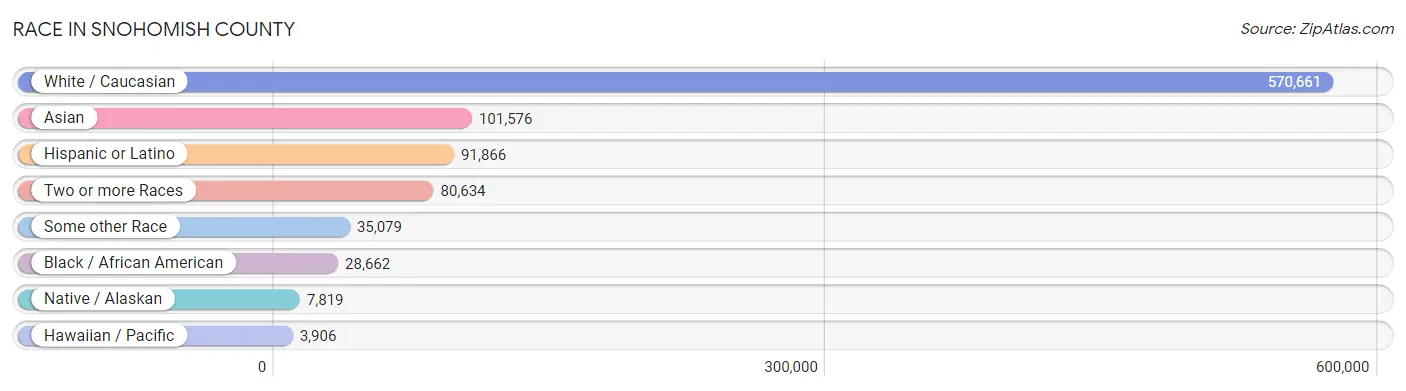
Race in Snohomish County
The most populous races in Snohomish County are White / Caucasian (570,661 | 68.9%), Asian (101,576 | 12.3%), and Hispanic or Latino (91,866 | 11.1%).
| Race | # Population | % Population |
| Asian | 101,576 | 12.3% |
| Black / African American | 28,662 | 3.5% |
| Hawaiian / Pacific | 3,906 | 0.5% |
| Hispanic or Latino | 91,866 | 11.1% |
| Native / Alaskan | 7,819 | 0.9% |
| White / Caucasian | 570,661 | 68.9% |
| Two or more Races | 80,634 | 9.7% |
| Some other Race | 35,079 | 4.2% |
| Total | 828,337 | 100.0% |
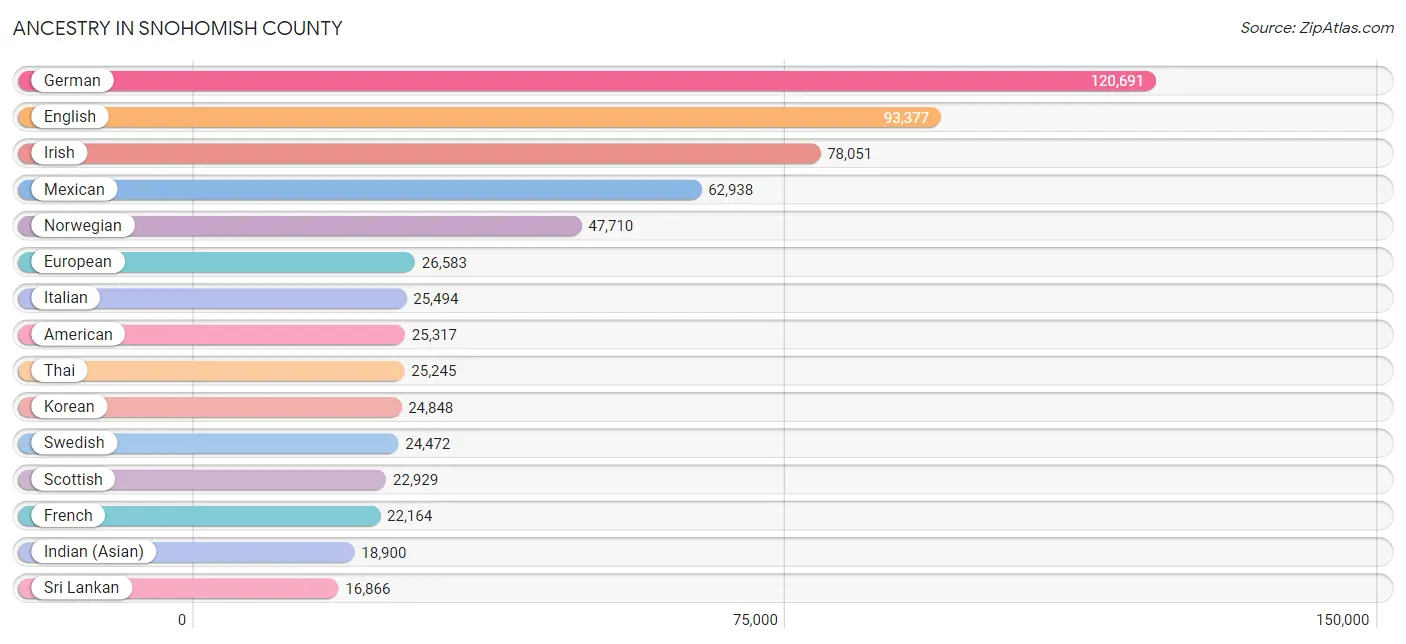
Ancestry in Snohomish County
The most populous ancestries reported in Snohomish County are German (120,691 | 14.6%), English (93,377 | 11.3%), Irish (78,051 | 9.4%), Mexican (62,938 | 7.6%), and Norwegian (47,710 | 5.8%), together accounting for 48.6% of all Snohomish County residents.
| Ancestry | # Population | % Population |
| Afghan | 181 | 0.0% |
| African | 3,923 | 0.5% |
| Alaska Native | 275 | 0.0% |
| Alaskan Athabascan | 241 | 0.0% |
| Albanian | 189 | 0.0% |
| Aleut | 494 | 0.1% |
| Alsatian | 40 | 0.0% |
| American | 25,317 | 3.1% |
| Apache | 463 | 0.1% |
| Arab | 5,958 | 0.7% |
| Argentinean | 510 | 0.1% |
| Armenian | 1,081 | 0.1% |
| Assyrian / Chaldean / Syriac | 19 | 0.0% |
| Australian | 376 | 0.1% |
| Austrian | 2,003 | 0.2% |
| Bahamian | 51 | 0.0% |
| Bangladeshi | 777 | 0.1% |
| Barbadian | 42 | 0.0% |
| Basque | 220 | 0.0% |
| Belgian | 1,072 | 0.1% |
| Belizean | 125 | 0.0% |
| Bhutanese | 10,160 | 1.2% |
| Blackfeet | 1,072 | 0.1% |
| Bolivian | 73 | 0.0% |
| Brazilian | 1,086 | 0.1% |
| British | 6,504 | 0.8% |
| British West Indian | 44 | 0.0% |
| Bulgarian | 1,120 | 0.1% |
| Burmese | 16,830 | 2.0% |
| Cajun | 42 | 0.0% |
| Cambodian | 824 | 0.1% |
| Canadian | 2,933 | 0.4% |
| Celtic | 372 | 0.0% |
| Central American | 8,667 | 1.1% |
| Central American Indian | 646 | 0.1% |
| Cherokee | 2,482 | 0.3% |
| Cheyenne | 129 | 0.0% |
| Chickasaw | 130 | 0.0% |
| Chilean | 518 | 0.1% |
| Chinese | 42 | 0.0% |
| Chippewa | 820 | 0.1% |
| Choctaw | 675 | 0.1% |
| Colombian | 2,349 | 0.3% |
| Colville | 261 | 0.0% |
| Comanche | 170 | 0.0% |
| Costa Rican | 302 | 0.0% |
| Cree | 175 | 0.0% |
| Creek | 67 | 0.0% |
| Croatian | 1,057 | 0.1% |
| Crow | 44 | 0.0% |
| Cuban | 1,372 | 0.2% |
| Czech | 2,428 | 0.3% |
| Czechoslovakian | 813 | 0.1% |
| Danish | 7,689 | 0.9% |
| Delaware | 61 | 0.0% |
| Dominican | 531 | 0.1% |
| Dutch | 12,734 | 1.5% |
| Dutch West Indian | 8 | 0.0% |
| Eastern European | 1,381 | 0.2% |
| Ecuadorian | 466 | 0.1% |
| Egyptian | 1,360 | 0.2% |
| English | 93,377 | 11.3% |
| Estonian | 479 | 0.1% |
| Ethiopian | 5,089 | 0.6% |
| European | 26,583 | 3.2% |
| Fijian | 449 | 0.1% |
| Filipino | 1,074 | 0.1% |
| Finnish | 5,441 | 0.7% |
| French | 22,164 | 2.7% |
| French American Indian | 445 | 0.1% |
| French Canadian | 3,931 | 0.5% |
| German | 120,691 | 14.6% |
| German Russian | 8 | 0.0% |
| Ghanaian | 243 | 0.0% |
| Greek | 2,685 | 0.3% |
| Guamanian / Chamorro | 2,061 | 0.3% |
| Guatemalan | 1,885 | 0.2% |
| Guyanese | 76 | 0.0% |
| Haitian | 135 | 0.0% |
| Hmong | 35 | 0.0% |
| Honduran | 1,202 | 0.2% |
| Hopi | 97 | 0.0% |
| Hungarian | 1,968 | 0.2% |
| Icelander | 592 | 0.1% |
| Indian (Asian) | 18,900 | 2.3% |
| Indonesian | 243 | 0.0% |
| Inupiat | 381 | 0.1% |
| Iranian | 1,846 | 0.2% |
| Iraqi | 693 | 0.1% |
| Irish | 78,051 | 9.4% |
| Iroquois | 276 | 0.0% |
| Israeli | 25 | 0.0% |
| Italian | 25,494 | 3.1% |
| Jamaican | 1,161 | 0.1% |
| Japanese | 4,759 | 0.6% |
| Jordanian | 321 | 0.0% |
| Kenyan | 1,063 | 0.1% |
| Kiowa | 13 | 0.0% |
| Korean | 24,848 | 3.0% |
| Laotian | 1,900 | 0.2% |
| Latvian | 244 | 0.0% |
| Lebanese | 922 | 0.1% |
| Liberian | 81 | 0.0% |
| Lithuanian | 1,466 | 0.2% |
| Luxembourger | 118 | 0.0% |
| Macedonian | 34 | 0.0% |
| Malaysian | 1,721 | 0.2% |
| Maltese | 133 | 0.0% |
| Marshallese | 13 | 0.0% |
| Mexican | 62,938 | 7.6% |
| Mexican American Indian | 1,750 | 0.2% |
| Mongolian | 124 | 0.0% |
| Moroccan | 431 | 0.1% |
| Native Hawaiian | 3,971 | 0.5% |
| Navajo | 225 | 0.0% |
| New Zealander | 130 | 0.0% |
| Nicaraguan | 452 | 0.1% |
| Nigerian | 1,319 | 0.2% |
| Northern European | 3,676 | 0.4% |
| Norwegian | 47,710 | 5.8% |
| Okinawan | 70 | 0.0% |
| Osage | 203 | 0.0% |
| Pakistani | 2,109 | 0.3% |
| Palestinian | 639 | 0.1% |
| Panamanian | 480 | 0.1% |
| Paraguayan | 61 | 0.0% |
| Pennsylvania German | 153 | 0.0% |
| Peruvian | 1,646 | 0.2% |
| Polish | 12,334 | 1.5% |
| Portuguese | 2,516 | 0.3% |
| Potawatomi | 67 | 0.0% |
| Pueblo | 11 | 0.0% |
| Puerto Rican | 4,318 | 0.5% |
| Puget Sound Salish | 3,966 | 0.5% |
| Romanian | 2,380 | 0.3% |
| Russian | 10,764 | 1.3% |
| Salvadoran | 4,327 | 0.5% |
| Samoan | 1,464 | 0.2% |
| Scandinavian | 8,301 | 1.0% |
| Scotch-Irish | 8,981 | 1.1% |
| Scottish | 22,929 | 2.8% |
| Seminole | 94 | 0.0% |
| Senegalese | 102 | 0.0% |
| Serbian | 335 | 0.0% |
| Sierra Leonean | 70 | 0.0% |
| Sioux | 535 | 0.1% |
| Slavic | 575 | 0.1% |
| Slovak | 629 | 0.1% |
| Slovene | 162 | 0.0% |
| Somali | 19 | 0.0% |
| South African | 329 | 0.0% |
| South American | 6,593 | 0.8% |
| South American Indian | 354 | 0.0% |
| Soviet Union | 10 | 0.0% |
| Spaniard | 3,039 | 0.4% |
| Spanish | 1,947 | 0.2% |
| Spanish American | 187 | 0.0% |
| Spanish American Indian | 8 | 0.0% |
| Sri Lankan | 16,866 | 2.0% |
| Subsaharan African | 14,165 | 1.7% |
| Sudanese | 102 | 0.0% |
| Swedish | 24,472 | 2.9% |
| Swiss | 2,471 | 0.3% |
| Syrian | 532 | 0.1% |
| Thai | 25,245 | 3.0% |
| Tlingit-Haida | 1,289 | 0.2% |
| Tongan | 522 | 0.1% |
| Trinidadian and Tobagonian | 112 | 0.0% |
| Tsimshian | 79 | 0.0% |
| Turkish | 351 | 0.0% |
| U.S. Virgin Islander | 12 | 0.0% |
| Ugandan | 175 | 0.0% |
| Ukrainian | 8,780 | 1.1% |
| Uruguayan | 103 | 0.0% |
| Venezuelan | 792 | 0.1% |
| Vietnamese | 342 | 0.0% |
| Welsh | 6,309 | 0.8% |
| West Indian | 158 | 0.0% |
| Yakama | 242 | 0.0% |
| Yaqui | 201 | 0.0% |
| Yugoslavian | 924 | 0.1% |
| Yuman | 4 | 0.0% |
| Yup'ik | 195 | 0.0% | View All 183 Rows |
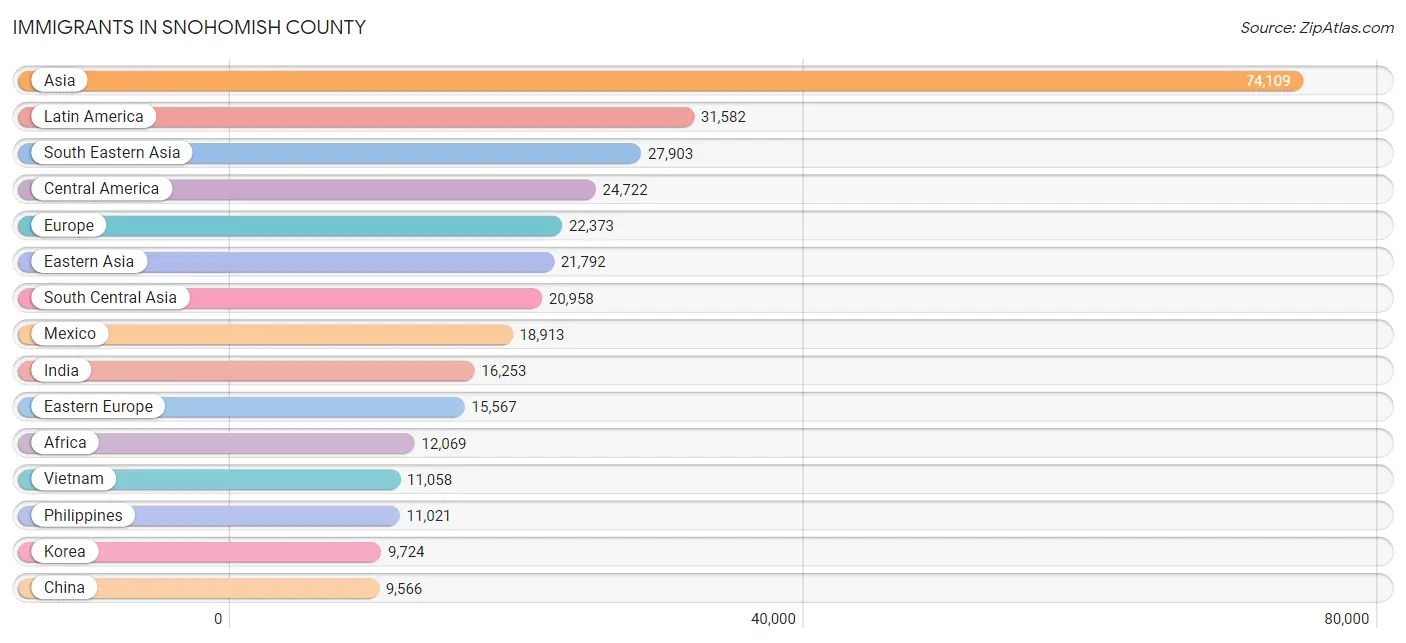
Immigrants in Snohomish County
The most numerous immigrant groups reported in Snohomish County came from Asia (74,109 | 8.9%), Latin America (31,582 | 3.8%), South Eastern Asia (27,903 | 3.4%), Central America (24,722 | 3.0%), and Europe (22,373 | 2.7%), together accounting for 21.8% of all Snohomish County residents.
| Immigration Origin | # Population | % Population |
| Afghanistan | 103 | 0.0% |
| Africa | 12,069 | 1.5% |
| Albania | 186 | 0.0% |
| Argentina | 273 | 0.0% |
| Armenia | 491 | 0.1% |
| Asia | 74,109 | 8.9% |
| Australia | 293 | 0.0% |
| Austria | 71 | 0.0% |
| Bangladesh | 292 | 0.0% |
| Belarus | 674 | 0.1% |
| Belgium | 123 | 0.0% |
| Belize | 70 | 0.0% |
| Bolivia | 78 | 0.0% |
| Bosnia and Herzegovina | 482 | 0.1% |
| Brazil | 1,234 | 0.2% |
| Bulgaria | 889 | 0.1% |
| Cambodia | 2,056 | 0.3% |
| Cameroon | 13 | 0.0% |
| Canada | 4,998 | 0.6% |
| Caribbean | 1,146 | 0.1% |
| Central America | 24,722 | 3.0% |
| Chile | 441 | 0.1% |
| China | 9,566 | 1.1% |
| Colombia | 1,322 | 0.2% |
| Congo | 25 | 0.0% |
| Costa Rica | 190 | 0.0% |
| Croatia | 23 | 0.0% |
| Cuba | 394 | 0.1% |
| Czechoslovakia | 203 | 0.0% |
| Denmark | 256 | 0.0% |
| Dominica | 32 | 0.0% |
| Dominican Republic | 247 | 0.0% |
| Eastern Africa | 6,190 | 0.7% |
| Eastern Asia | 21,792 | 2.6% |
| Eastern Europe | 15,567 | 1.9% |
| Ecuador | 225 | 0.0% |
| Egypt | 1,014 | 0.1% |
| El Salvador | 3,062 | 0.4% |
| England | 1,102 | 0.1% |
| Eritrea | 902 | 0.1% |
| Ethiopia | 3,791 | 0.5% |
| Europe | 22,373 | 2.7% |
| Fiji | 450 | 0.1% |
| France | 356 | 0.0% |
| Germany | 1,528 | 0.2% |
| Ghana | 388 | 0.1% |
| Greece | 58 | 0.0% |
| Guatemala | 1,439 | 0.2% |
| Haiti | 40 | 0.0% |
| Honduras | 673 | 0.1% |
| Hong Kong | 853 | 0.1% |
| Hungary | 81 | 0.0% |
| India | 16,253 | 2.0% |
| Indonesia | 1,139 | 0.1% |
| Iran | 1,718 | 0.2% |
| Iraq | 565 | 0.1% |
| Ireland | 218 | 0.0% |
| Israel | 63 | 0.0% |
| Italy | 122 | 0.0% |
| Jamaica | 404 | 0.1% |
| Japan | 2,053 | 0.3% |
| Jordan | 357 | 0.0% |
| Kazakhstan | 144 | 0.0% |
| Kenya | 1,088 | 0.1% |
| Korea | 9,724 | 1.2% |
| Kuwait | 80 | 0.0% |
| Laos | 837 | 0.1% |
| Latin America | 31,582 | 3.8% |
| Latvia | 107 | 0.0% |
| Lebanon | 499 | 0.1% |
| Liberia | 23 | 0.0% |
| Lithuania | 180 | 0.0% |
| Malaysia | 229 | 0.0% |
| Mexico | 18,913 | 2.3% |
| Micronesia | 69 | 0.0% |
| Middle Africa | 249 | 0.0% |
| Moldova | 214 | 0.0% |
| Morocco | 344 | 0.0% |
| Nepal | 128 | 0.0% |
| Netherlands | 192 | 0.0% |
| Nicaragua | 152 | 0.0% |
| Nigeria | 683 | 0.1% |
| North Macedonia | 6 | 0.0% |
| Northern Africa | 1,574 | 0.2% |
| Northern Europe | 3,788 | 0.5% |
| Norway | 175 | 0.0% |
| Oceania | 1,824 | 0.2% |
| Pakistan | 1,617 | 0.2% |
| Panama | 223 | 0.0% |
| Peru | 1,261 | 0.2% |
| Philippines | 11,021 | 1.3% |
| Poland | 713 | 0.1% |
| Portugal | 98 | 0.0% |
| Romania | 1,400 | 0.2% |
| Russia | 3,981 | 0.5% |
| Saudi Arabia | 213 | 0.0% |
| Scotland | 308 | 0.0% |
| Senegal | 38 | 0.0% |
| Serbia | 86 | 0.0% |
| Sierra Leone | 28 | 0.0% |
| Singapore | 52 | 0.0% |
| Somalia | 24 | 0.0% |
| South Africa | 433 | 0.1% |
| South America | 5,714 | 0.7% |
| South Central Asia | 20,958 | 2.5% |
| South Eastern Asia | 27,903 | 3.4% |
| Southern Europe | 524 | 0.1% |
| Spain | 226 | 0.0% |
| Sri Lanka | 330 | 0.0% |
| Sudan | 126 | 0.0% |
| Sweden | 241 | 0.0% |
| Switzerland | 98 | 0.0% |
| Syria | 616 | 0.1% |
| Taiwan | 1,399 | 0.2% |
| Thailand | 1,335 | 0.2% |
| Trinidad and Tobago | 14 | 0.0% |
| Turkey | 112 | 0.0% |
| Uganda | 232 | 0.0% |
| Ukraine | 5,675 | 0.7% |
| Uruguay | 107 | 0.0% |
| Uzbekistan | 150 | 0.0% |
| Venezuela | 742 | 0.1% |
| Vietnam | 11,058 | 1.3% |
| Western Africa | 3,381 | 0.4% |
| Western Asia | 3,355 | 0.4% |
| Western Europe | 2,368 | 0.3% |
| Zaire | 144 | 0.0% |
| Zimbabwe | 48 | 0.0% | View All 128 Rows |
Sex and Age in Snohomish County
Sex and Age in Snohomish County
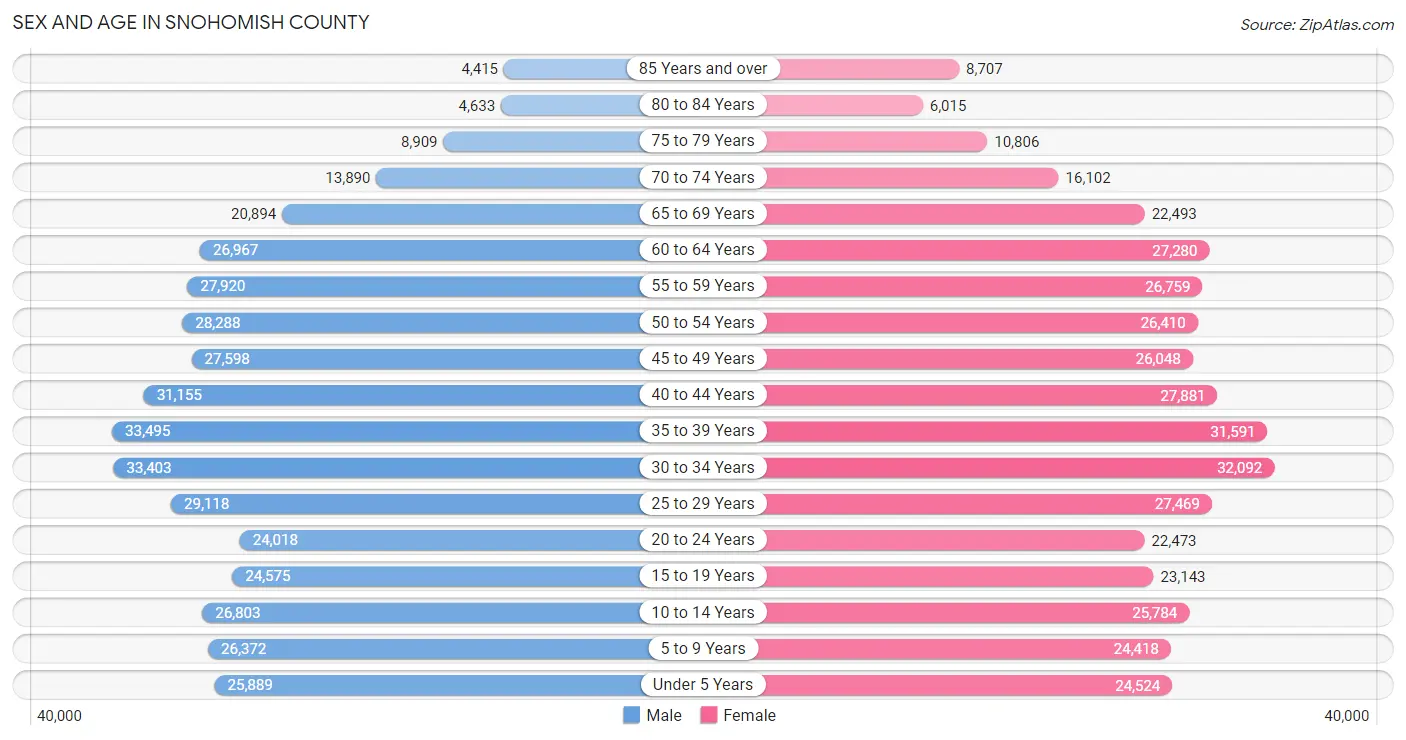
The most populous age groups in Snohomish County are 35 to 39 Years (33,495 | 8.0%) for men and 30 to 34 Years (32,092 | 7.8%) for women.
| Age Bracket | Male | Female |
| Under 5 Years | 25,889 (6.2%) | 24,524 (6.0%) |
| 5 to 9 Years | 26,372 (6.3%) | 24,418 (6.0%) |
| 10 to 14 Years | 26,803 (6.4%) | 25,784 (6.3%) |
| 15 to 19 Years | 24,575 (5.9%) | 23,143 (5.6%) |
| 20 to 24 Years | 24,018 (5.7%) | 22,473 (5.5%) |
| 25 to 29 Years | 29,118 (7.0%) | 27,469 (6.7%) |
| 30 to 34 Years | 33,403 (8.0%) | 32,092 (7.8%) |
| 35 to 39 Years | 33,495 (8.0%) | 31,591 (7.7%) |
| 40 to 44 Years | 31,155 (7.4%) | 27,881 (6.8%) |
| 45 to 49 Years | 27,598 (6.6%) | 26,048 (6.4%) |
| 50 to 54 Years | 28,288 (6.8%) | 26,410 (6.4%) |
| 55 to 59 Years | 27,920 (6.7%) | 26,759 (6.5%) |
| 60 to 64 Years | 26,967 (6.5%) | 27,280 (6.7%) |
| 65 to 69 Years | 20,894 (5.0%) | 22,493 (5.5%) |
| 70 to 74 Years | 13,890 (3.3%) | 16,102 (3.9%) |
| 75 to 79 Years | 8,909 (2.1%) | 10,806 (2.6%) |
| 80 to 84 Years | 4,633 (1.1%) | 6,015 (1.5%) |
| 85 Years and over | 4,415 (1.1%) | 8,707 (2.1%) |
| Total | 418,342 (100.0%) | 409,995 (100.0%) |
Families and Households in Snohomish County
Median Family Size in Snohomish County
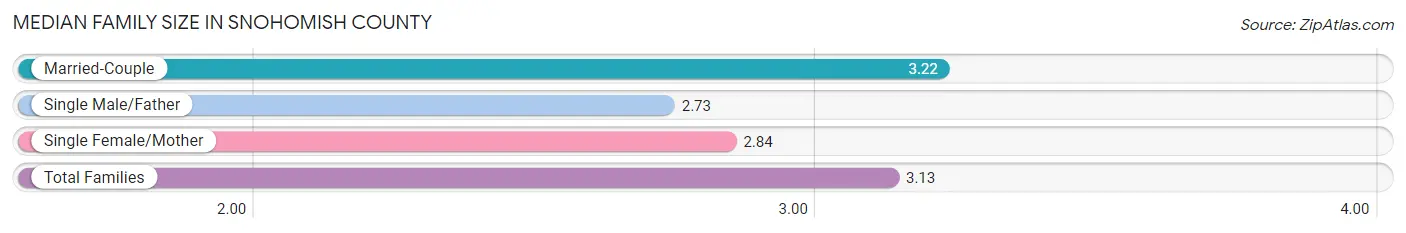
The median family size in Snohomish County is 3.13 persons per family, with married-couple families (167,010 | 78.8%) accounting for the largest median family size of 3.22 persons per family. On the other hand, single male/father families (15,696 | 7.4%) represent the smallest median family size with 2.73 persons per family.
| Family Type | # Families | Family Size |
| Married-Couple | 167,010 (78.8%) | 3.22 |
| Single Male/Father | 15,696 (7.4%) | 2.73 |
| Single Female/Mother | 29,154 (13.8%) | 2.84 |
| Total Families | 211,860 (100.0%) | 3.13 |
Median Household Size in Snohomish County
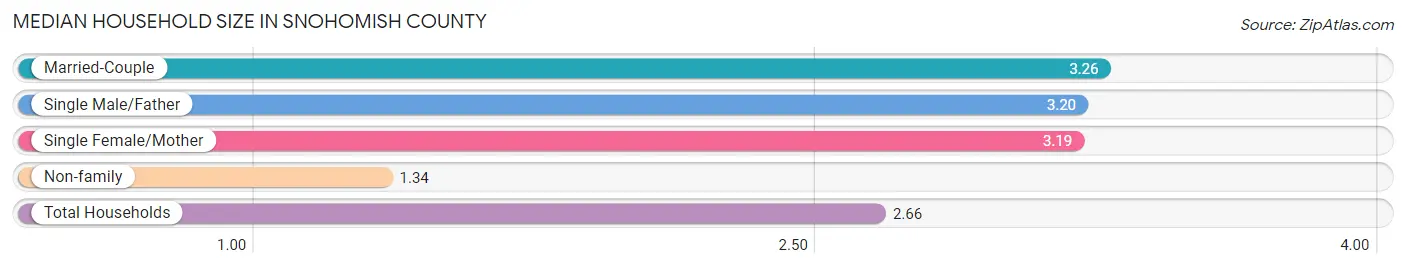
The median household size in Snohomish County is 2.66 persons per household, with married-couple households (167,010 | 54.3%) accounting for the largest median household size of 3.26 persons per household. non-family households (95,783 | 31.1%) represent the smallest median household size with 1.34 persons per household.
| Household Type | # Households | Household Size |
| Married-Couple | 167,010 (54.3%) | 3.26 |
| Single Male/Father | 15,696 (5.1%) | 3.20 |
| Single Female/Mother | 29,154 (9.5%) | 3.19 |
| Non-family | 95,783 (31.1%) | 1.34 |
| Total Households | 307,643 (100.0%) | 2.66 |
Household Size by Marriage Status in Snohomish County
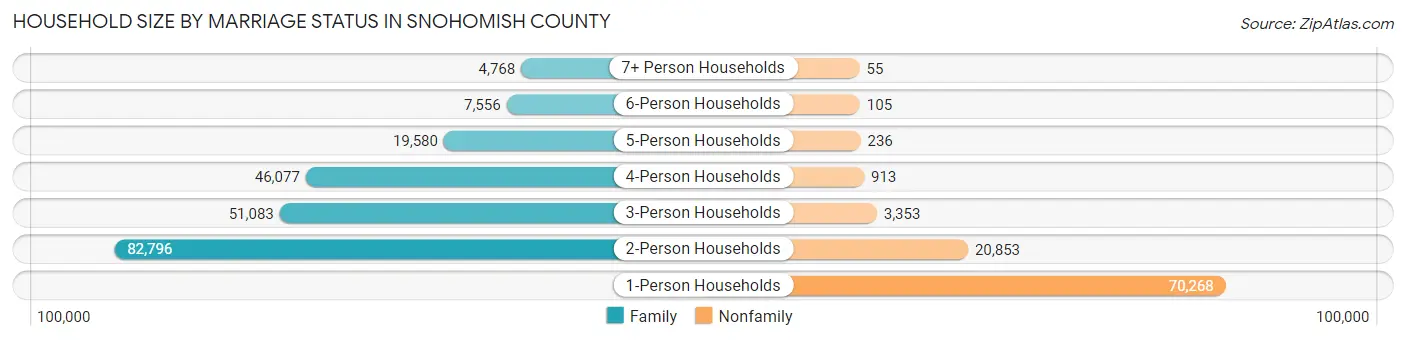
Out of a total of 307,643 households in Snohomish County, 211,860 (68.9%) are family households, while 95,783 (31.1%) are nonfamily households. The most numerous type of family households are 2-person households, comprising 82,796, and the most common type of nonfamily households are 1-person households, comprising 70,268.
| Household Size | Family Households | Nonfamily Households |
| 1-Person Households | - | 70,268 (22.8%) |
| 2-Person Households | 82,796 (26.9%) | 20,853 (6.8%) |
| 3-Person Households | 51,083 (16.6%) | 3,353 (1.1%) |
| 4-Person Households | 46,077 (15.0%) | 913 (0.3%) |
| 5-Person Households | 19,580 (6.4%) | 236 (0.1%) |
| 6-Person Households | 7,556 (2.5%) | 105 (0.0%) |
| 7+ Person Households | 4,768 (1.5%) | 55 (0.0%) |
| Total | 211,860 (68.9%) | 95,783 (31.1%) |
Female Fertility in Snohomish County
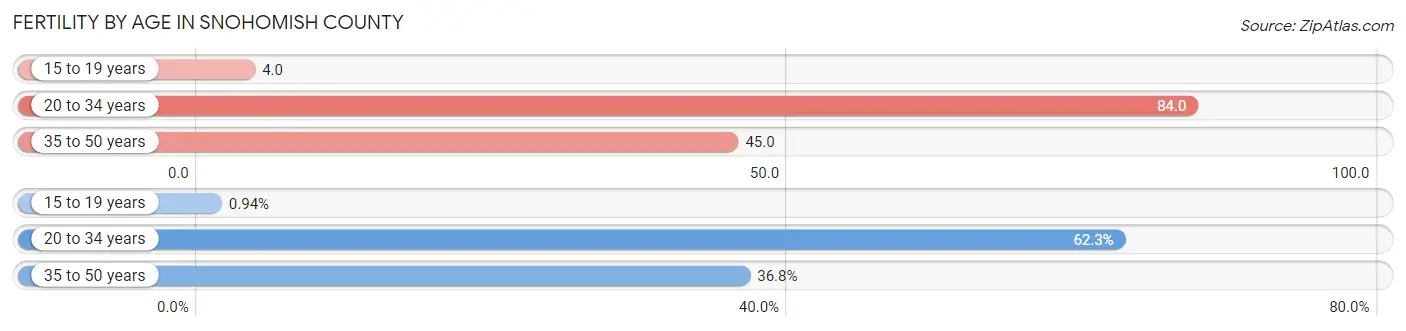
Fertility by Age in Snohomish County
Average fertility rate in Snohomish County is 56.0 births per 1,000 women. Women in the age bracket of 20 to 34 years have the highest fertility rate with 84.0 births per 1,000 women. Women in the age bracket of 20 to 34 years acount for 62.3% of all women with births.
| Age Bracket | Women with Births | Births / 1,000 Women |
| 15 to 19 years | 104 (0.9%) | 4.0 |
| 20 to 34 years | 6,887 (62.3%) | 84.0 |
| 35 to 50 years | 4,071 (36.8%) | 45.0 |
| Total | 11,062 (100.0%) | 56.0 |
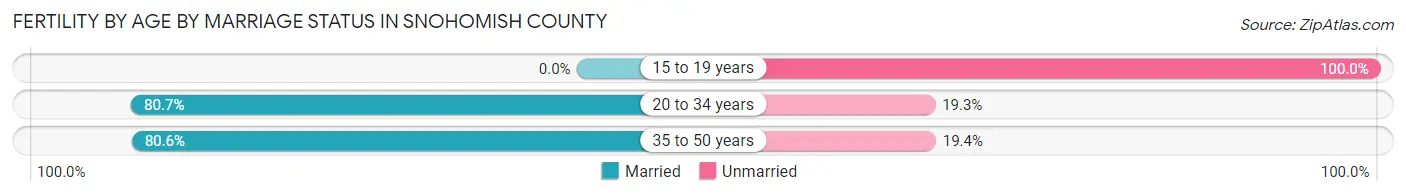
Fertility by Age by Marriage Status in Snohomish County
79.9% of women with births (11,062) in Snohomish County are married. The highest percentage of unmarried women with births falls into 15 to 19 years age bracket with 100.0% of them unmarried at the time of birth, while the lowest percentage of unmarried women with births belong to 20 to 34 years age bracket with 19.3% of them unmarried.
| Age Bracket | Married | Unmarried |
| 15 to 19 years | 0 (0.0%) | 104 (100.0%) |
| 20 to 34 years | 5,558 (80.7%) | 1,329 (19.3%) |
| 35 to 50 years | 3,281 (80.6%) | 790 (19.4%) |
| Total | 8,839 (79.9%) | 2,223 (20.1%) |
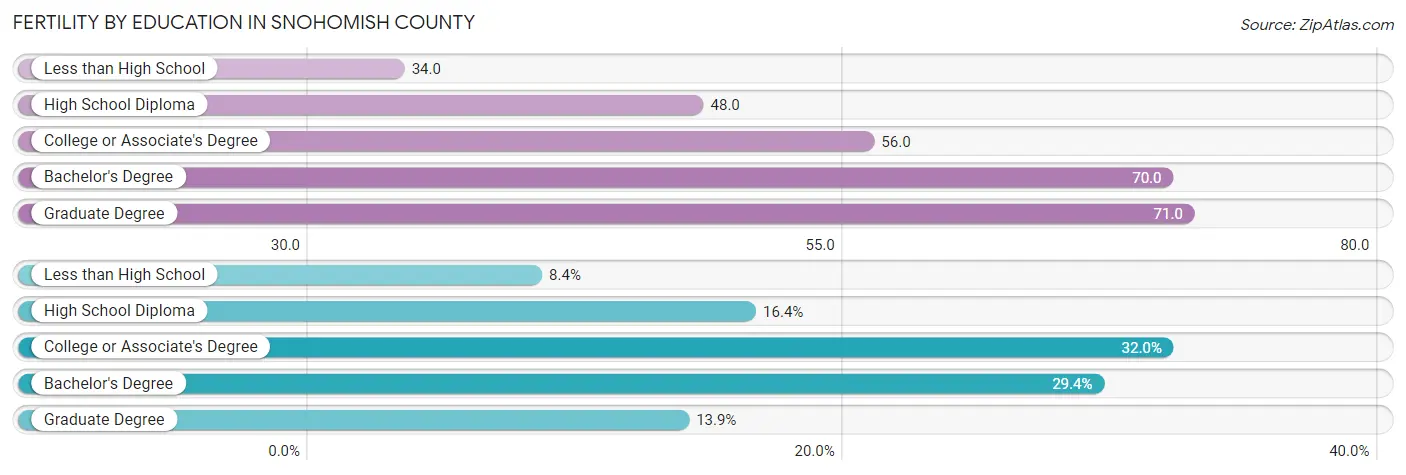
Fertility by Education in Snohomish County
Average fertility rate in Snohomish County is 56.0 births per 1,000 women. Women with the education attainment of graduate degree have the highest fertility rate of 71.0 births per 1,000 women, while women with the education attainment of less than high school have the lowest fertility at 34.0 births per 1,000 women. Women with the education attainment of college or associate's degree represent 32.0% of all women with births.
| Educational Attainment | Women with Births | Births / 1,000 Women |
| Less than High School | 924 (8.4%) | 34.0 |
| High School Diploma | 1,811 (16.4%) | 48.0 |
| College or Associate's Degree | 3,541 (32.0%) | 56.0 |
| Bachelor's Degree | 3,253 (29.4%) | 70.0 |
| Graduate Degree | 1,533 (13.9%) | 71.0 |
| Total | 11,062 (100.0%) | 56.0 |
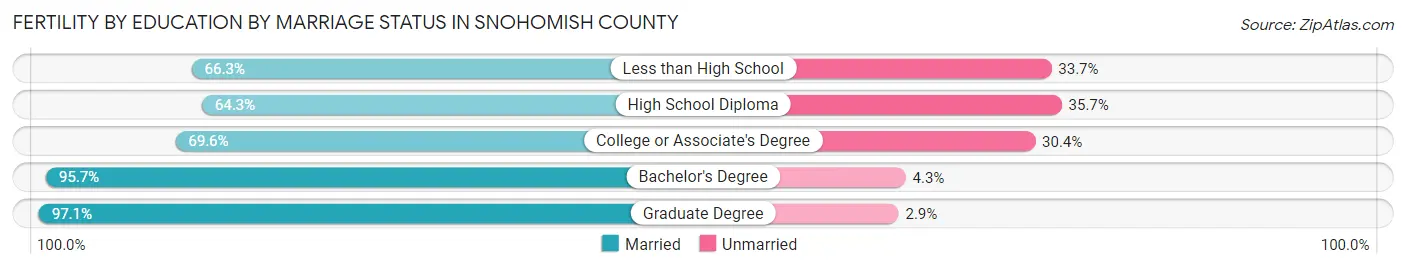
Fertility by Education by Marriage Status in Snohomish County
20.1% of women with births in Snohomish County are unmarried. Women with the educational attainment of graduate degree are most likely to be married with 97.1% of them married at childbirth, while women with the educational attainment of high school diploma are least likely to be married with 35.7% of them unmarried at childbirth.
| Educational Attainment | Married | Unmarried |
| Less than High School | 613 (66.3%) | 311 (33.7%) |
| High School Diploma | 1,164 (64.3%) | 647 (35.7%) |
| College or Associate's Degree | 2,465 (69.6%) | 1,076 (30.4%) |
| Bachelor's Degree | 3,113 (95.7%) | 140 (4.3%) |
| Graduate Degree | 1,489 (97.1%) | 44 (2.9%) |
| Total | 8,839 (79.9%) | 2,223 (20.1%) |
Income in Snohomish County
Income Overview in Snohomish County
Per Capita Income in Snohomish County is $49,215, while median incomes of families and households are $121,379 and $104,083 respectively.
| Characteristic | Number | Measure |
| Per Capita Income | 828,337 | $49,215 |
| Median Family Income | 211,860 | $121,379 |
| Mean Family Income | 211,860 | $148,392 |
| Median Household Income | 307,643 | $104,083 |
| Mean Household Income | 307,643 | $129,761 |
| Income Deficit | 211,860 | $11,662 |
| Wage / Income Gap (%) | 828,337 | 33.02% |
| Wage / Income Gap ($) | 828,337 | 66.98¢ per $1 |
| Gini / Inequality Index | 828,337 | 0.42 |
Earnings by Sex in Snohomish County
Average Earnings in Snohomish County are $54,898, $65,331 for men and $43,759 for women, a difference of 33.0%.
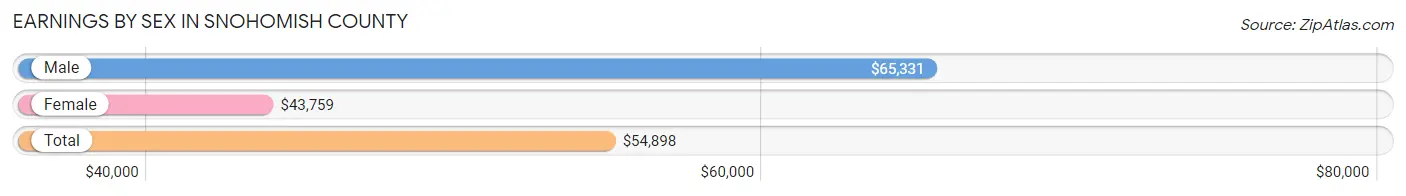
| Sex | Number | Average Earnings |
| Male | 256,493 (55.0%) | $65,331 |
| Female | 209,731 (45.0%) | $43,759 |
| Total | 466,224 (100.0%) | $54,898 |
Earnings by Sex by Income Bracket in Snohomish County
The most common earnings brackets in Snohomish County are $100,000+ for men (77,568 | 30.2%) and $100,000+ for women (30,898 | 14.7%).
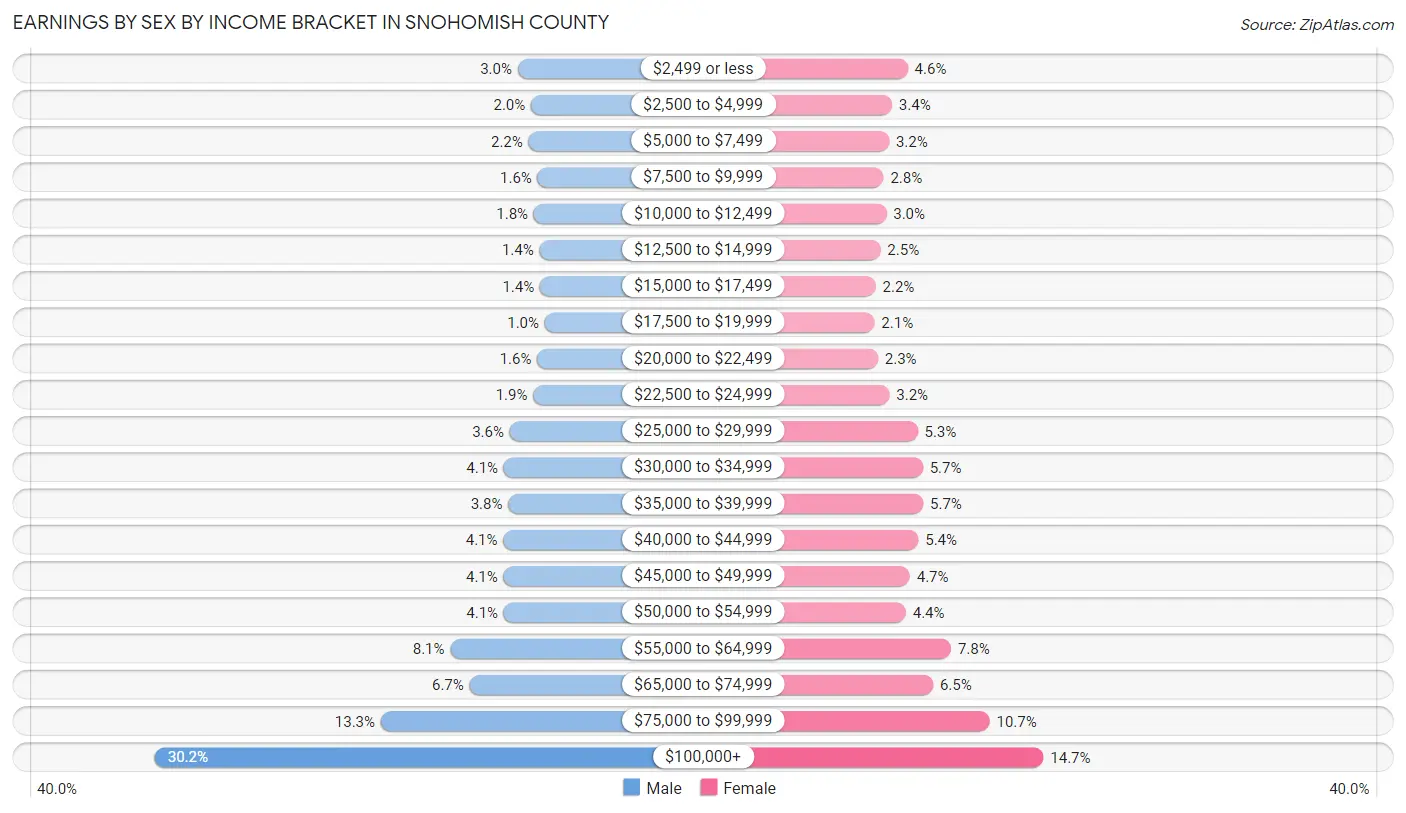
| Income | Male | Female |
| $2,499 or less | 7,810 (3.0%) | 9,559 (4.6%) |
| $2,500 to $4,999 | 5,231 (2.0%) | 7,090 (3.4%) |
| $5,000 to $7,499 | 5,725 (2.2%) | 6,624 (3.2%) |
| $7,500 to $9,999 | 3,974 (1.5%) | 5,758 (2.8%) |
| $10,000 to $12,499 | 4,687 (1.8%) | 6,210 (3.0%) |
| $12,500 to $14,999 | 3,629 (1.4%) | 5,294 (2.5%) |
| $15,000 to $17,499 | 3,521 (1.4%) | 4,530 (2.2%) |
| $17,500 to $19,999 | 2,592 (1.0%) | 4,334 (2.1%) |
| $20,000 to $22,499 | 4,056 (1.6%) | 4,882 (2.3%) |
| $22,500 to $24,999 | 4,814 (1.9%) | 6,693 (3.2%) |
| $25,000 to $29,999 | 9,337 (3.6%) | 11,116 (5.3%) |
| $30,000 to $34,999 | 10,474 (4.1%) | 11,933 (5.7%) |
| $35,000 to $39,999 | 9,617 (3.7%) | 12,005 (5.7%) |
| $40,000 to $44,999 | 10,576 (4.1%) | 11,245 (5.4%) |
| $45,000 to $49,999 | 10,518 (4.1%) | 9,905 (4.7%) |
| $50,000 to $54,999 | 10,460 (4.1%) | 9,280 (4.4%) |
| $55,000 to $64,999 | 20,743 (8.1%) | 16,390 (7.8%) |
| $65,000 to $74,999 | 17,045 (6.7%) | 13,547 (6.5%) |
| $75,000 to $99,999 | 34,116 (13.3%) | 22,438 (10.7%) |
| $100,000+ | 77,568 (30.2%) | 30,898 (14.7%) |
| Total | 256,493 (100.0%) | 209,731 (100.0%) |
Earnings by Sex by Educational Attainment in Snohomish County
Average earnings in Snohomish County are $72,899 for men and $49,732 for women, a difference of 31.8%. Men with an educational attainment of graduate degree enjoy the highest average annual earnings of $126,788, while those with less than high school education earn the least with $45,641. Women with an educational attainment of graduate degree earn the most with the average annual earnings of $86,821, while those with less than high school education have the smallest earnings of $28,028.

| Educational Attainment | Male Income | Female Income |
| Less than High School | $45,641 | $28,028 |
| High School Diploma | $58,356 | $38,936 |
| College or Associate's Degree | $67,314 | $44,865 |
| Bachelor's Degree | $100,335 | $61,177 |
| Graduate Degree | $126,788 | $86,821 |
| Total | $72,899 | $49,732 |
Family Income in Snohomish County
Family Income Brackets in Snohomish County
According to the Snohomish County family income data, there are 50,635 families falling into the $100,000 to $149,999 income range, which is the most common income bracket and makes up 23.9% of all families. Conversely, the $10,000 to $14,999 income bracket is the least frequent group with only 2,119 families (1.0%) belonging to this category.
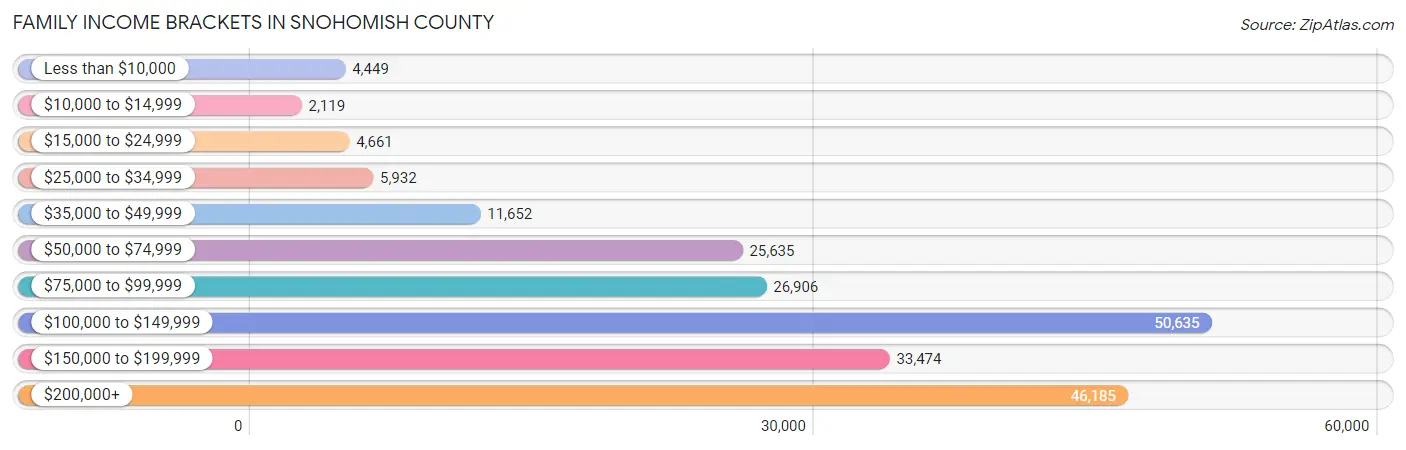
| Income Bracket | # Families | % Families |
| Less than $10,000 | 4,449 | 2.1% |
| $10,000 to $14,999 | 2,119 | 1.0% |
| $15,000 to $24,999 | 4,661 | 2.2% |
| $25,000 to $34,999 | 5,932 | 2.8% |
| $35,000 to $49,999 | 11,652 | 5.5% |
| $50,000 to $74,999 | 25,635 | 12.1% |
| $75,000 to $99,999 | 26,906 | 12.7% |
| $100,000 to $149,999 | 50,635 | 23.9% |
| $150,000 to $199,999 | 33,474 | 15.8% |
| $200,000+ | 46,185 | 21.8% |
Family Income by Famaliy Size in Snohomish County
7+ person families (3,810 | 1.8%) account for the highest median family income in Snohomish County with $150,648 per family, while 2-person families (91,491 | 43.2%) have the highest median income of $52,178 per family member.
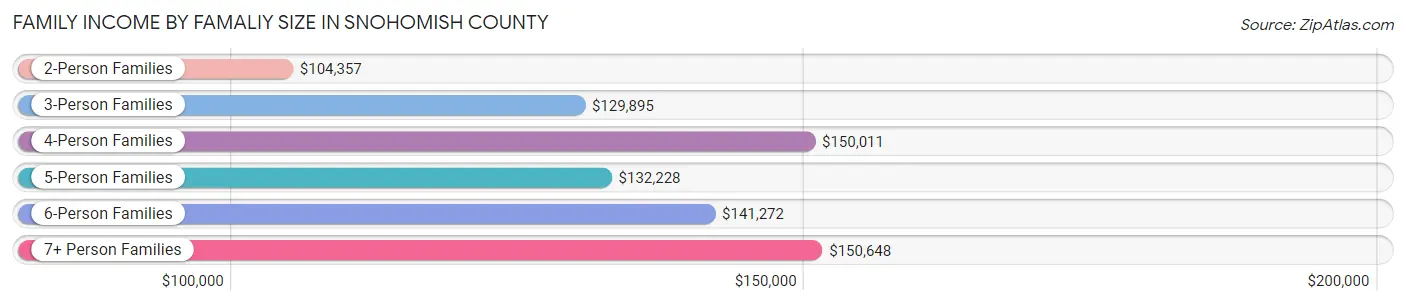
| Income Bracket | # Families | Median Income |
| 2-Person Families | 91,491 (43.2%) | $104,357 |
| 3-Person Families | 49,001 (23.1%) | $129,895 |
| 4-Person Families | 43,336 (20.5%) | $150,011 |
| 5-Person Families | 17,368 (8.2%) | $132,228 |
| 6-Person Families | 6,854 (3.2%) | $141,272 |
| 7+ Person Families | 3,810 (1.8%) | $150,648 |
| Total | 211,860 (100.0%) | $121,379 |
Family Income by Number of Earners in Snohomish County
The median family income in Snohomish County is $121,379, with families comprising 3+ earners (28,063) having the highest median family income of $171,508, while families with no earners (24,013) have the lowest median family income of $60,438, accounting for 13.3% and 11.3% of families, respectively.
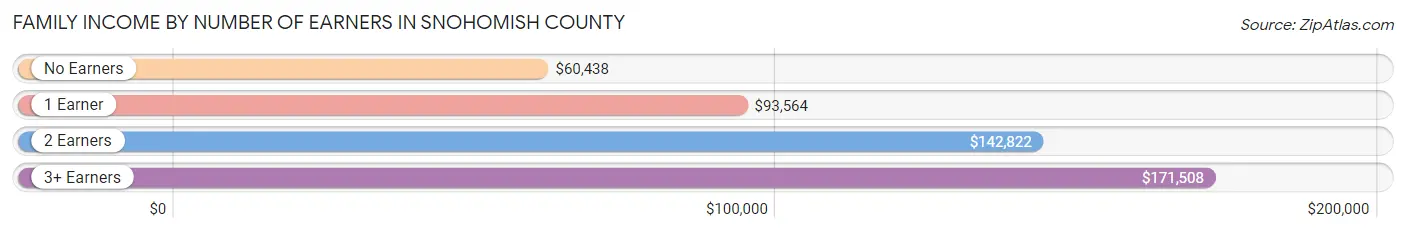
| Number of Earners | # Families | Median Income |
| No Earners | 24,013 (11.3%) | $60,438 |
| 1 Earner | 62,903 (29.7%) | $93,564 |
| 2 Earners | 96,881 (45.7%) | $142,822 |
| 3+ Earners | 28,063 (13.3%) | $171,508 |
| Total | 211,860 (100.0%) | $121,379 |
Household Income in Snohomish County
Household Income Brackets in Snohomish County
With 66,143 households falling in the category, the $100,000 to $149,999 income range is the most frequent in Snohomish County, accounting for 21.5% of all households. In contrast, only 6,153 households (2.0%) fall into the $10,000 to $14,999 income bracket, making it the least populous group.
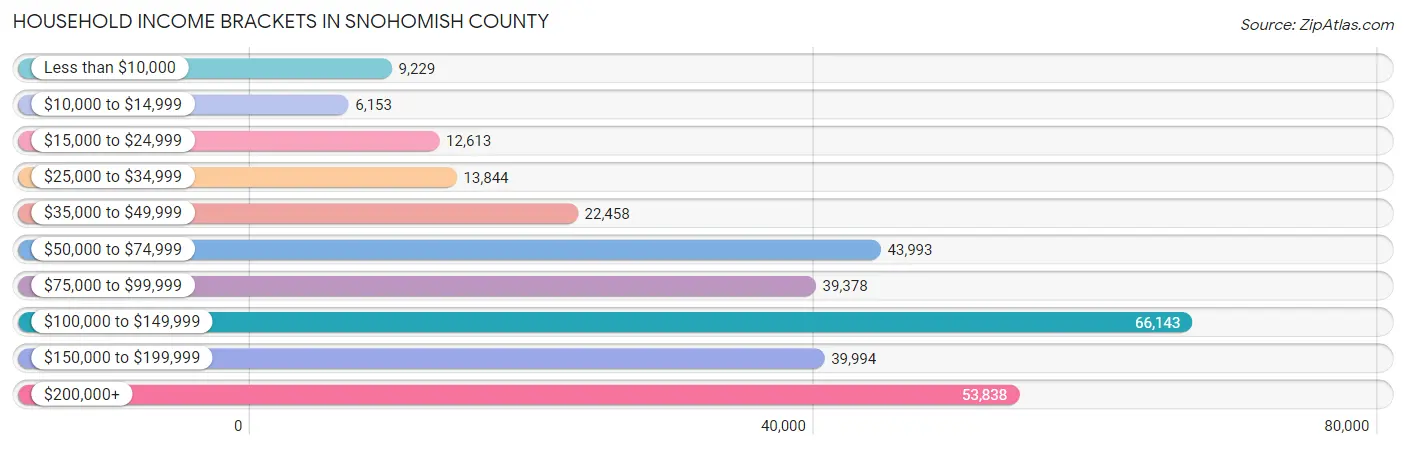
| Income Bracket | # Households | % Households |
| Less than $10,000 | 9,229 | 3.0% |
| $10,000 to $14,999 | 6,153 | 2.0% |
| $15,000 to $24,999 | 12,613 | 4.1% |
| $25,000 to $34,999 | 13,844 | 4.5% |
| $35,000 to $49,999 | 22,458 | 7.3% |
| $50,000 to $74,999 | 43,993 | 14.3% |
| $75,000 to $99,999 | 39,378 | 12.8% |
| $100,000 to $149,999 | 66,143 | 21.5% |
| $150,000 to $199,999 | 39,994 | 13.0% |
| $200,000+ | 53,838 | 17.5% |
Household Income by Householder Age in Snohomish County
The median household income in Snohomish County is $104,083, with the highest median household income of $121,761 found in the 45 to 64 years age bracket for the primary householder. A total of 119,208 households (38.8%) fall into this category. Meanwhile, the 65+ years age bracket for the primary householder has the lowest median household income of $64,763, with 68,557 households (22.3%) in this group.
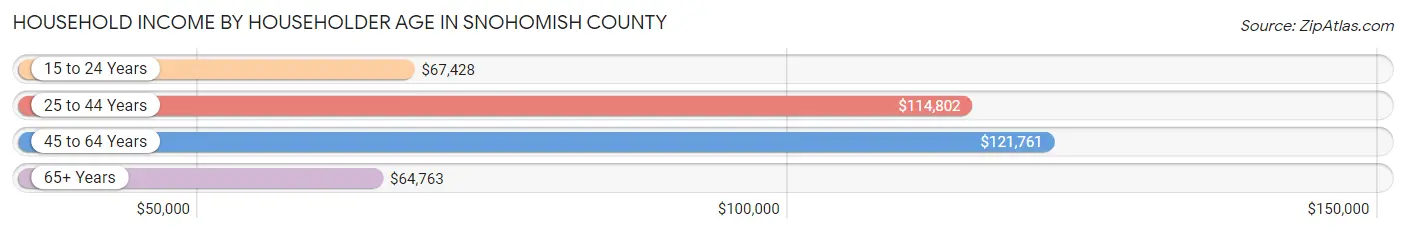
| Income Bracket | # Households | Median Income |
| 15 to 24 Years | 8,221 (2.7%) | $67,428 |
| 25 to 44 Years | 111,657 (36.3%) | $114,802 |
| 45 to 64 Years | 119,208 (38.8%) | $121,761 |
| 65+ Years | 68,557 (22.3%) | $64,763 |
| Total | 307,643 (100.0%) | $104,083 |
Poverty in Snohomish County
Income Below Poverty by Sex and Age in Snohomish County
With 6.7% poverty level for males and 8.5% for females among the residents of Snohomish County, 16 and 17 year old males and 75 year old and over females are the most vulnerable to poverty, with 1,144 males (10.4%) and 2,526 females (10.4%) in their respective age groups living below the poverty level.
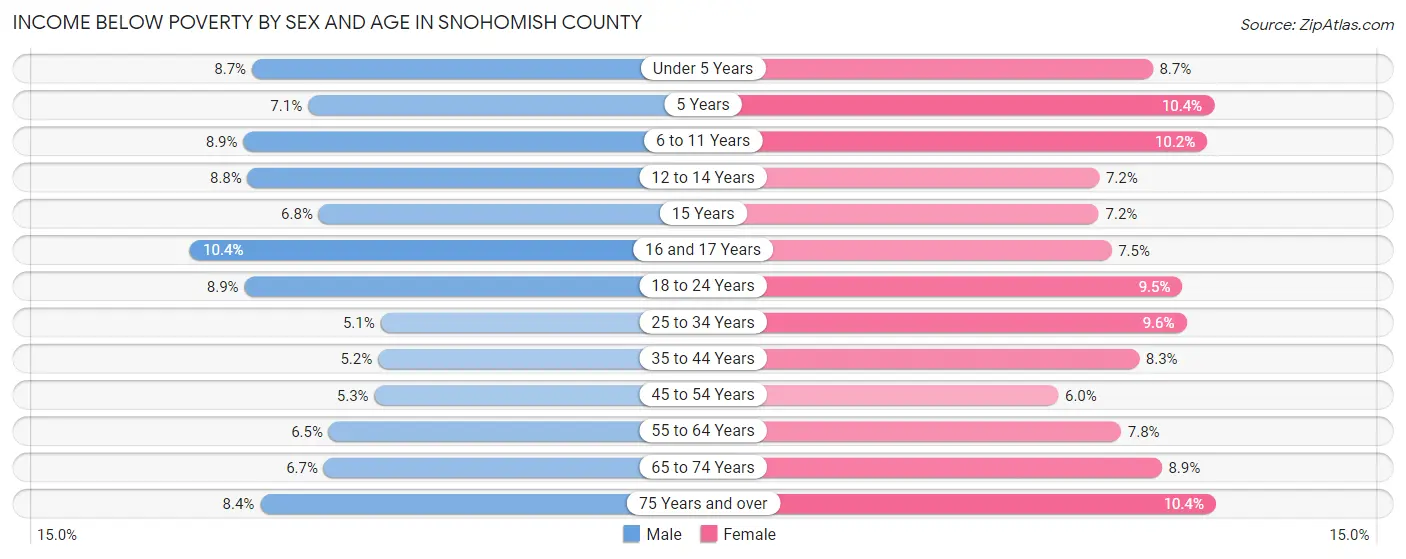
| Age Bracket | Male | Female |
| Under 5 Years | 2,211 (8.7%) | 2,086 (8.6%) |
| 5 Years | 372 (7.1%) | 400 (10.4%) |
| 6 to 11 Years | 2,755 (8.9%) | 3,024 (10.2%) |
| 12 to 14 Years | 1,416 (8.8%) | 1,123 (7.2%) |
| 15 Years | 314 (6.8%) | 374 (7.1%) |
| 16 and 17 Years | 1,144 (10.4%) | 736 (7.5%) |
| 18 to 24 Years | 2,834 (8.9%) | 2,864 (9.5%) |
| 25 to 34 Years | 3,114 (5.1%) | 5,706 (9.6%) |
| 35 to 44 Years | 3,286 (5.2%) | 4,914 (8.3%) |
| 45 to 54 Years | 2,900 (5.3%) | 3,157 (6.0%) |
| 55 to 64 Years | 3,540 (6.5%) | 4,189 (7.8%) |
| 65 to 74 Years | 2,298 (6.7%) | 3,410 (8.9%) |
| 75 Years and over | 1,478 (8.4%) | 2,526 (10.4%) |
| Total | 27,662 (6.7%) | 34,509 (8.5%) |
Income Above Poverty by Sex and Age in Snohomish County
According to the poverty statistics in Snohomish County, males aged 25 to 34 years and females aged 45 to 54 years are the age groups that are most secure financially, with 94.9% of males and 94.0% of females in these age groups living above the poverty line.
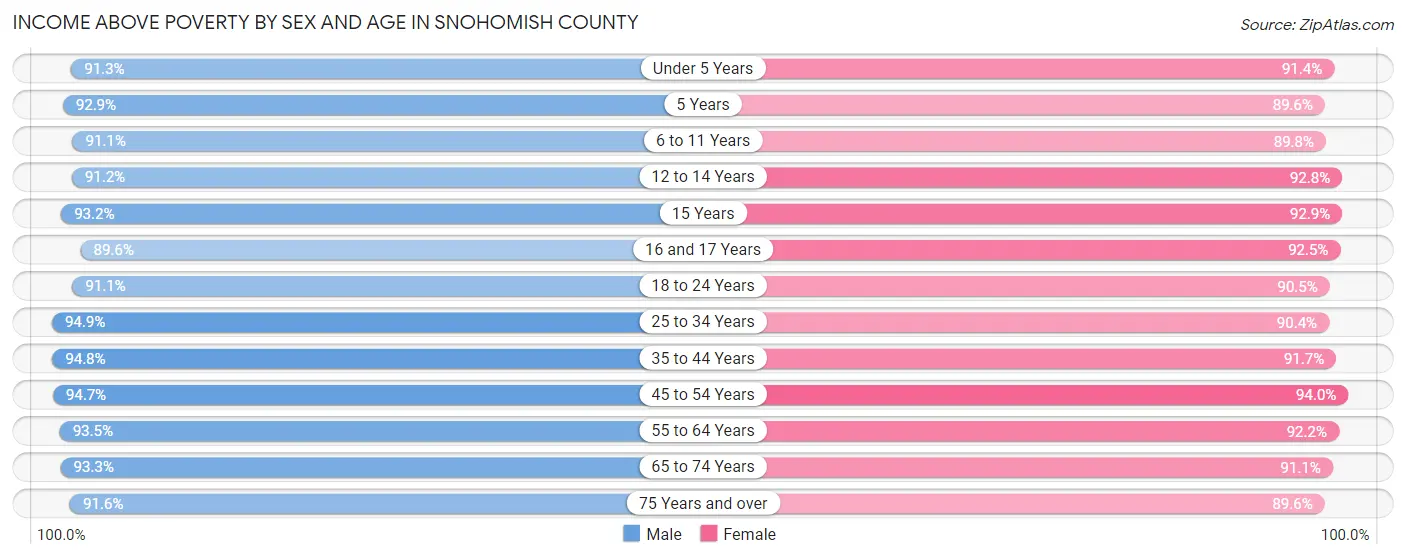
| Age Bracket | Male | Female |
| Under 5 Years | 23,302 (91.3%) | 22,020 (91.3%) |
| 5 Years | 4,863 (92.9%) | 3,461 (89.6%) |
| 6 to 11 Years | 28,164 (91.1%) | 26,704 (89.8%) |
| 12 to 14 Years | 14,695 (91.2%) | 14,551 (92.8%) |
| 15 Years | 4,298 (93.2%) | 4,859 (92.8%) |
| 16 and 17 Years | 9,866 (89.6%) | 9,078 (92.5%) |
| 18 to 24 Years | 29,080 (91.1%) | 27,338 (90.5%) |
| 25 to 34 Years | 58,076 (94.9%) | 53,764 (90.4%) |
| 35 to 44 Years | 60,449 (94.8%) | 54,486 (91.7%) |
| 45 to 54 Years | 52,254 (94.7%) | 49,271 (94.0%) |
| 55 to 64 Years | 50,647 (93.5%) | 49,717 (92.2%) |
| 65 to 74 Years | 32,178 (93.3%) | 34,908 (91.1%) |
| 75 Years and over | 16,028 (91.6%) | 21,745 (89.6%) |
| Total | 383,900 (93.3%) | 371,902 (91.5%) |
Income Below Poverty Among Married-Couple Families in Snohomish County
The poverty statistics for married-couple families in Snohomish County show that 2.8% or 4,704 of the total 167,010 families live below the poverty line. Families with 3 or 4 children have the highest poverty rate of 7.6%, comprising of 1,101 families. On the other hand, families with 1 or 2 children have the lowest poverty rate of 2.1%, which includes 1,242 families.
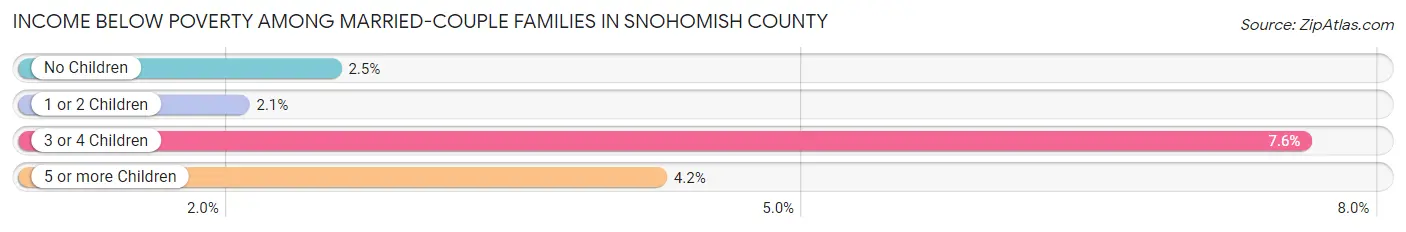
| Children | Above Poverty | Below Poverty |
| No Children | 88,635 (97.5%) | 2,309 (2.5%) |
| 1 or 2 Children | 59,124 (97.9%) | 1,242 (2.1%) |
| 3 or 4 Children | 13,374 (92.4%) | 1,101 (7.6%) |
| 5 or more Children | 1,173 (95.8%) | 52 (4.2%) |
| Total | 162,306 (97.2%) | 4,704 (2.8%) |
Income Below Poverty Among Single-Parent Households in Snohomish County
According to the poverty data in Snohomish County, 6.3% or 987 single-father households and 17.1% or 4,982 single-mother households are living below the poverty line. Among single-father households, those with 5 or more children have the highest poverty rate, with 65 households (53.3%) experiencing poverty. Likewise, among single-mother households, those with 5 or more children have the highest poverty rate, with 85 households (49.4%) falling below the poverty line.
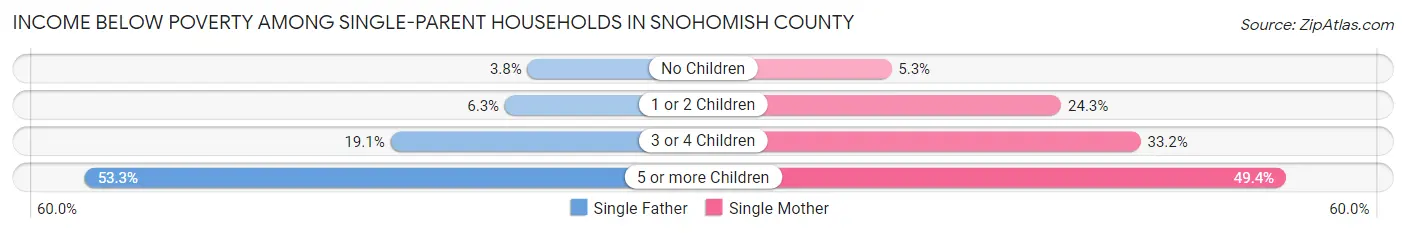
| Children | Single Father | Single Mother |
| No Children | 278 (3.8%) | 656 (5.3%) |
| 1 or 2 Children | 459 (6.3%) | 3,535 (24.3%) |
| 3 or 4 Children | 185 (19.1%) | 706 (33.2%) |
| 5 or more Children | 65 (53.3%) | 85 (49.4%) |
| Total | 987 (6.3%) | 4,982 (17.1%) |
Income Below Poverty Among Married-Couple vs Single-Parent Households in Snohomish County
The poverty data for Snohomish County shows that 4,704 of the married-couple family households (2.8%) and 5,969 of the single-parent households (13.3%) are living below the poverty level. Within the married-couple family households, those with 3 or 4 children have the highest poverty rate, with 1,101 households (7.6%) falling below the poverty line. Among the single-parent households, those with 5 or more children have the highest poverty rate, with 150 household (51.0%) living below poverty.
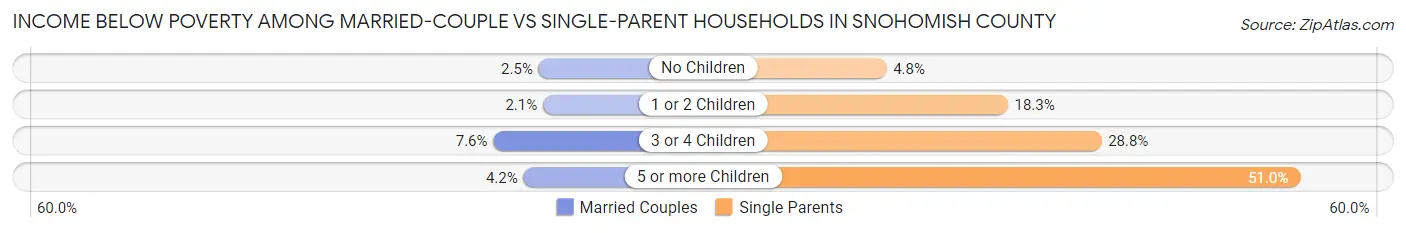
| Children | Married-Couple Families | Single-Parent Households |
| No Children | 2,309 (2.5%) | 934 (4.8%) |
| 1 or 2 Children | 1,242 (2.1%) | 3,994 (18.3%) |
| 3 or 4 Children | 1,101 (7.6%) | 891 (28.8%) |
| 5 or more Children | 52 (4.2%) | 150 (51.0%) |
| Total | 4,704 (2.8%) | 5,969 (13.3%) |
Employment Characteristics in Snohomish County
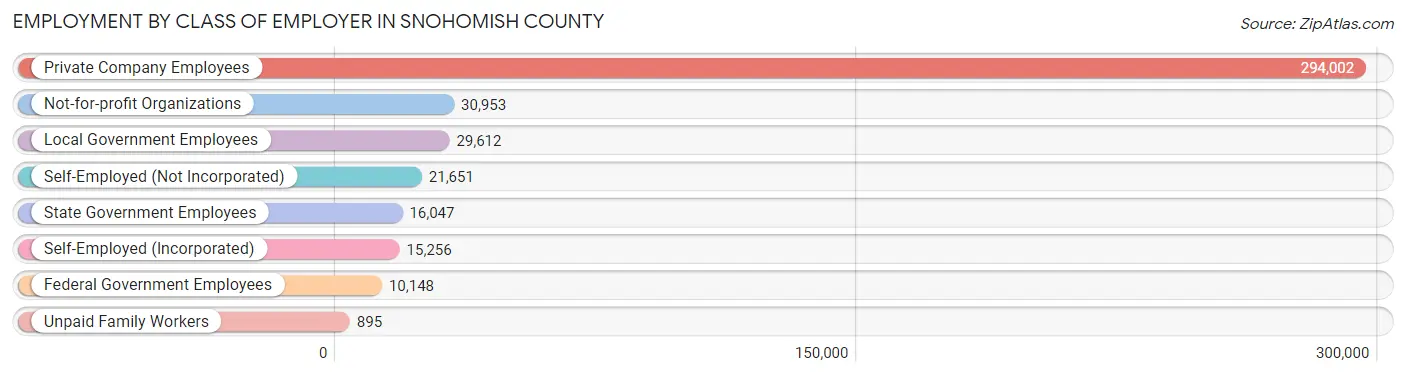
Employment by Class of Employer in Snohomish County
Among the 418,564 employed individuals in Snohomish County, private company employees (294,002 | 70.2%), not-for-profit organizations (30,953 | 7.4%), and local government employees (29,612 | 7.1%) make up the most common classes of employment.
| Employer Class | # Employees | % Employees |
| Private Company Employees | 294,002 | 70.2% |
| Self-Employed (Incorporated) | 15,256 | 3.6% |
| Self-Employed (Not Incorporated) | 21,651 | 5.2% |
| Not-for-profit Organizations | 30,953 | 7.4% |
| Local Government Employees | 29,612 | 7.1% |
| State Government Employees | 16,047 | 3.8% |
| Federal Government Employees | 10,148 | 2.4% |
| Unpaid Family Workers | 895 | 0.2% |
| Total | 418,564 | 100.0% |
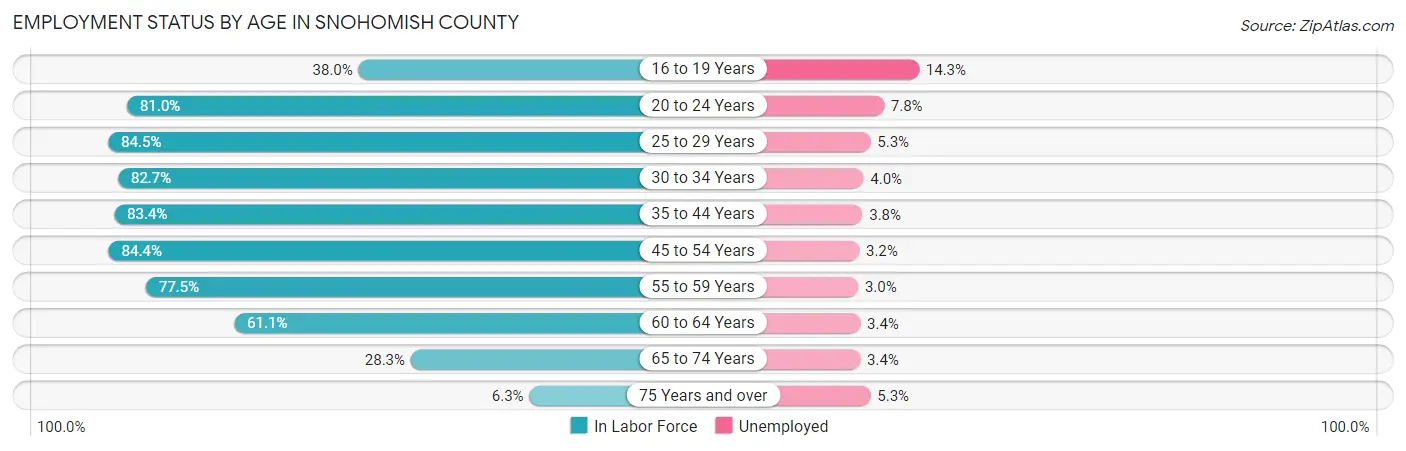
Employment Status by Age in Snohomish County
According to the labor force statistics for Snohomish County, out of the total population over 16 years of age (664,685), 67.4% or 447,998 individuals are in the labor force, with 4.4% or 19,712 of them unemployed. The age group with the highest labor force participation rate is 25 to 29 years, with 84.5% or 47,816 individuals in the labor force. Within the labor force, the 16 to 19 years age range has the highest percentage of unemployed individuals, with 14.3% or 2,057 of them being unemployed.
| Age Bracket | In Labor Force | Unemployed |
| 16 to 19 Years | 14,385 (38.0%) | 2,057 (14.3%) |
| 20 to 24 Years | 37,658 (81.0%) | 2,937 (7.8%) |
| 25 to 29 Years | 47,816 (84.5%) | 2,534 (5.3%) |
| 30 to 34 Years | 54,164 (82.7%) | 2,167 (4.0%) |
| 35 to 44 Years | 103,518 (83.4%) | 3,934 (3.8%) |
| 45 to 54 Years | 91,442 (84.4%) | 2,926 (3.2%) |
| 55 to 59 Years | 42,376 (77.5%) | 1,271 (3.0%) |
| 60 to 64 Years | 33,145 (61.1%) | 1,127 (3.4%) |
| 65 to 74 Years | 20,766 (28.3%) | 706 (3.4%) |
| 75 Years and over | 2,740 (6.3%) | 145 (5.3%) |
| Total | 447,998 (67.4%) | 19,712 (4.4%) |
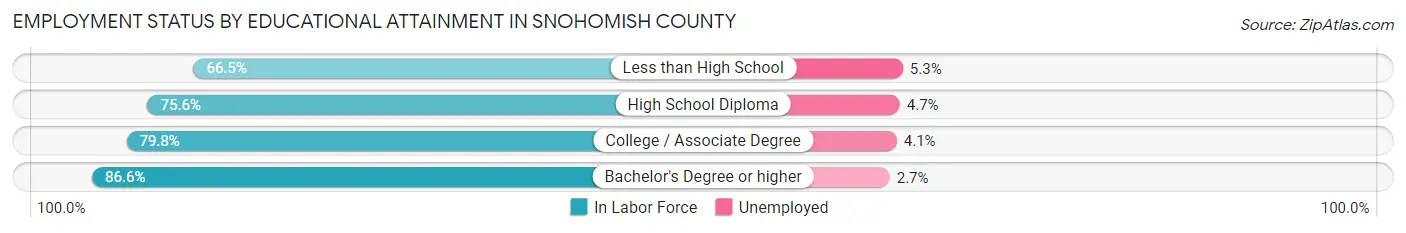
Employment Status by Educational Attainment in Snohomish County
According to labor force statistics for Snohomish County, 80.4% of individuals (372,633) out of the total population between 25 and 64 years of age (463,474) are in the labor force, with 3.7% or 13,787 of them being unemployed. The group with the highest labor force participation rate are those with the educational attainment of bachelor's degree or higher, with 86.6% or 146,074 individuals in the labor force. Within the labor force, individuals with less than high school education have the highest percentage of unemployment, with 5.3% or 1,149 of them being unemployed.
| Educational Attainment | In Labor Force | Unemployed |
| Less than High School | 21,670 (66.5%) | 1,727 (5.3%) |
| High School Diploma | 78,537 (75.6%) | 4,883 (4.7%) |
| College / Associate Degree | 126,344 (79.8%) | 6,491 (4.1%) |
| Bachelor's Degree or higher | 146,074 (86.6%) | 4,554 (2.7%) |
| Total | 372,633 (80.4%) | 17,149 (3.7%) |
Employment Occupations by Sex in Snohomish County
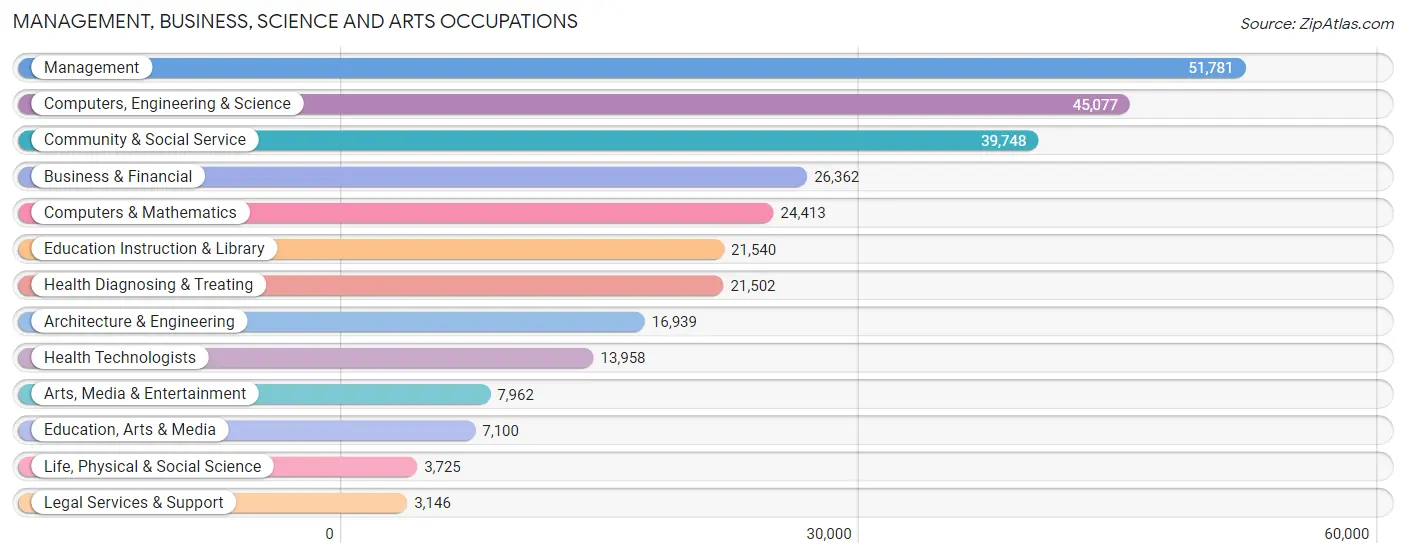
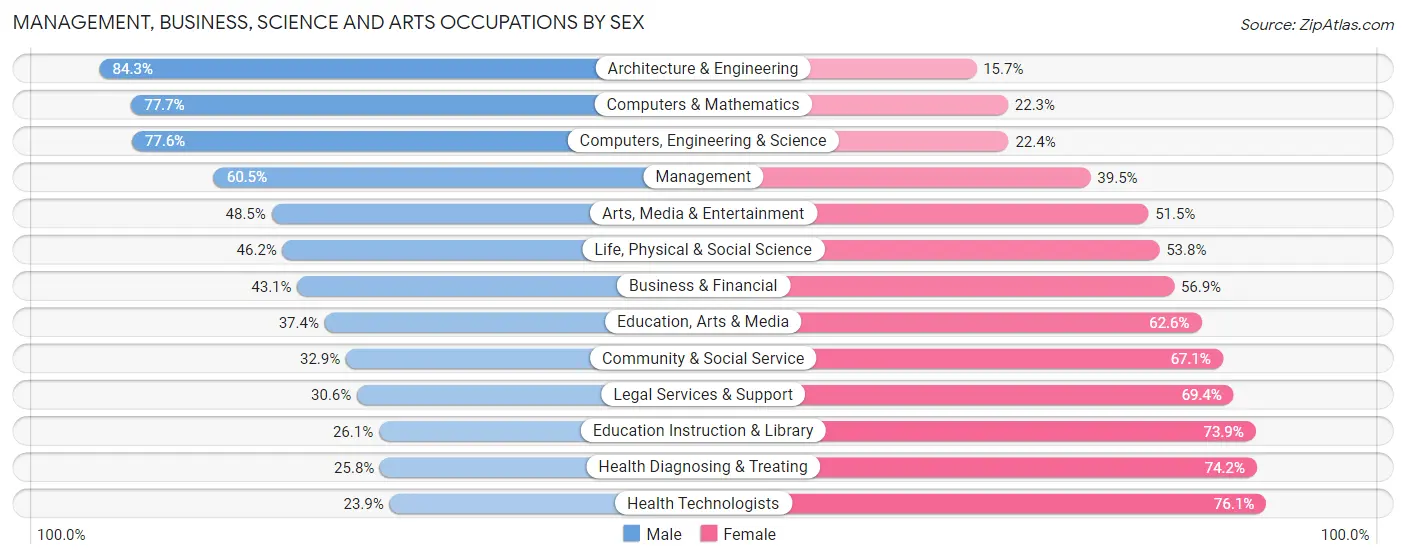
Management, Business, Science and Arts Occupations
The most common Management, Business, Science and Arts occupations in Snohomish County are Management (51,781 | 12.2%), Computers, Engineering & Science (45,077 | 10.6%), Community & Social Service (39,748 | 9.3%), Business & Financial (26,362 | 6.2%), and Computers & Mathematics (24,413 | 5.7%).
Management, Business, Science and Arts Occupations by Sex
Within the Management, Business, Science and Arts occupations in Snohomish County, the most male-oriented occupations are Architecture & Engineering (84.3%), Computers & Mathematics (77.7%), and Computers, Engineering & Science (77.6%), while the most female-oriented occupations are Health Technologists (76.1%), Health Diagnosing & Treating (74.2%), and Education Instruction & Library (73.9%).
| Occupation | Male | Female |
| Management | 31,339 (60.5%) | 20,442 (39.5%) |
| Business & Financial | 11,361 (43.1%) | 15,001 (56.9%) |
| Computers, Engineering & Science | 34,986 (77.6%) | 10,091 (22.4%) |
| Computers & Mathematics | 18,979 (77.7%) | 5,434 (22.3%) |
| Architecture & Engineering | 14,287 (84.3%) | 2,652 (15.7%) |
| Life, Physical & Social Science | 1,720 (46.2%) | 2,005 (53.8%) |
| Community & Social Service | 13,093 (32.9%) | 26,655 (67.1%) |
| Education, Arts & Media | 2,655 (37.4%) | 4,445 (62.6%) |
| Legal Services & Support | 964 (30.6%) | 2,182 (69.4%) |
| Education Instruction & Library | 5,615 (26.1%) | 15,925 (73.9%) |
| Arts, Media & Entertainment | 3,859 (48.5%) | 4,103 (51.5%) |
| Health Diagnosing & Treating | 5,554 (25.8%) | 15,948 (74.2%) |
| Health Technologists | 3,332 (23.9%) | 10,626 (76.1%) |
| Total (Category) | 96,333 (52.2%) | 88,137 (47.8%) |
| Total (Overall) | 234,284 (55.1%) | 190,883 (44.9%) |
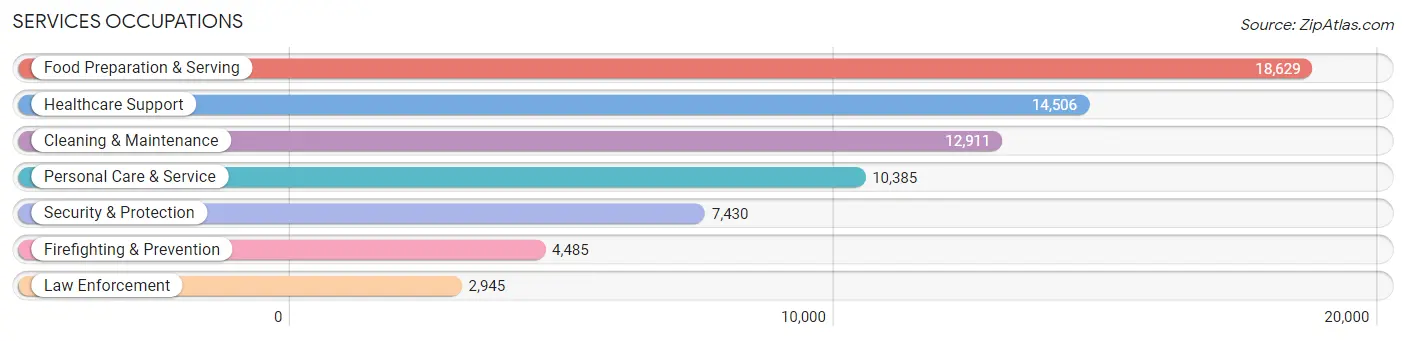
Services Occupations
The most common Services occupations in Snohomish County are Food Preparation & Serving (18,629 | 4.4%), Healthcare Support (14,506 | 3.4%), Cleaning & Maintenance (12,911 | 3.0%), Personal Care & Service (10,385 | 2.4%), and Security & Protection (7,430 | 1.8%).
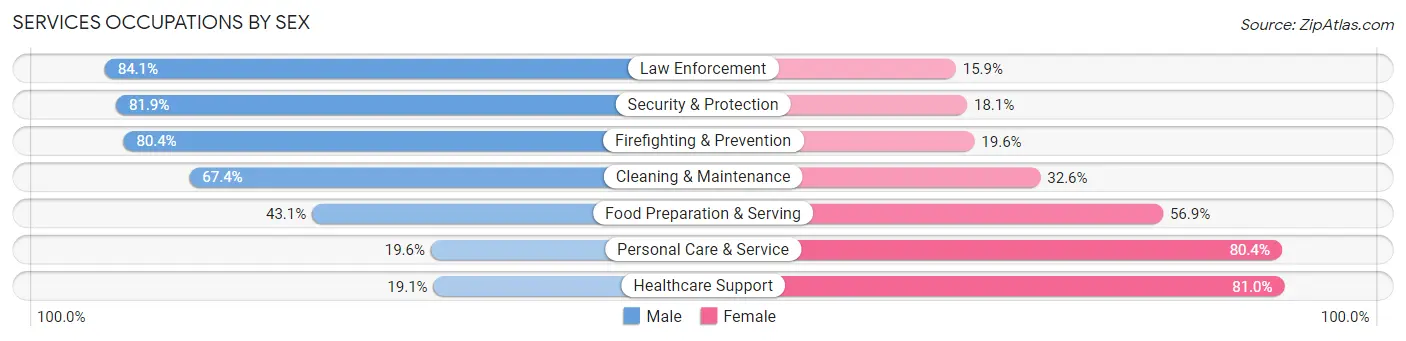
Services Occupations by Sex
Within the Services occupations in Snohomish County, the most male-oriented occupations are Law Enforcement (84.1%), Security & Protection (81.9%), and Firefighting & Prevention (80.4%), while the most female-oriented occupations are Healthcare Support (80.9%), Personal Care & Service (80.4%), and Food Preparation & Serving (56.9%).
| Occupation | Male | Female |
| Healthcare Support | 2,763 (19.1%) | 11,743 (80.9%) |
| Security & Protection | 6,084 (81.9%) | 1,346 (18.1%) |
| Firefighting & Prevention | 3,607 (80.4%) | 878 (19.6%) |
| Law Enforcement | 2,477 (84.1%) | 468 (15.9%) |
| Food Preparation & Serving | 8,025 (43.1%) | 10,604 (56.9%) |
| Cleaning & Maintenance | 8,697 (67.4%) | 4,214 (32.6%) |
| Personal Care & Service | 2,032 (19.6%) | 8,353 (80.4%) |
| Total (Category) | 27,601 (43.2%) | 36,260 (56.8%) |
| Total (Overall) | 234,284 (55.1%) | 190,883 (44.9%) |
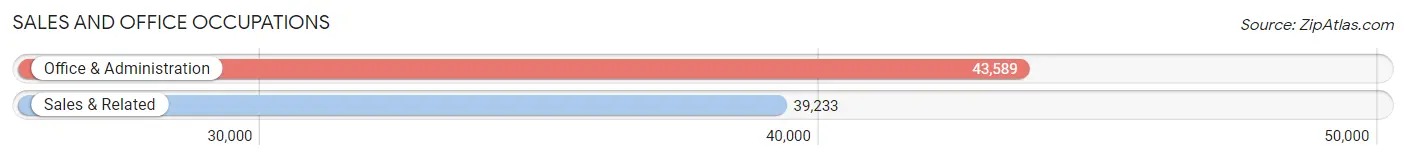
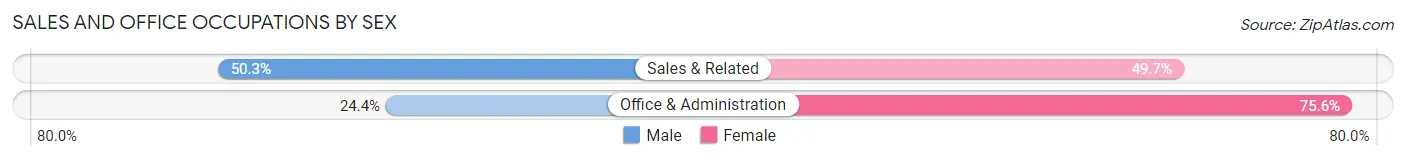
Sales and Office Occupations
The most common Sales and Office occupations in Snohomish County are Office & Administration (43,589 | 10.2%), and Sales & Related (39,233 | 9.2%).
Sales and Office Occupations by Sex
| Occupation | Male | Female |
| Sales & Related | 19,725 (50.3%) | 19,508 (49.7%) |
| Office & Administration | 10,640 (24.4%) | 32,949 (75.6%) |
| Total (Category) | 30,365 (36.7%) | 52,457 (63.3%) |
| Total (Overall) | 234,284 (55.1%) | 190,883 (44.9%) |
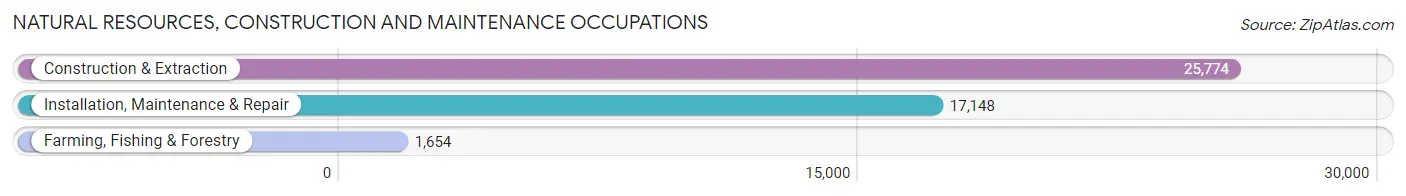
Natural Resources, Construction and Maintenance Occupations
The most common Natural Resources, Construction and Maintenance occupations in Snohomish County are Construction & Extraction (25,774 | 6.1%), Installation, Maintenance & Repair (17,148 | 4.0%), and Farming, Fishing & Forestry (1,654 | 0.4%).
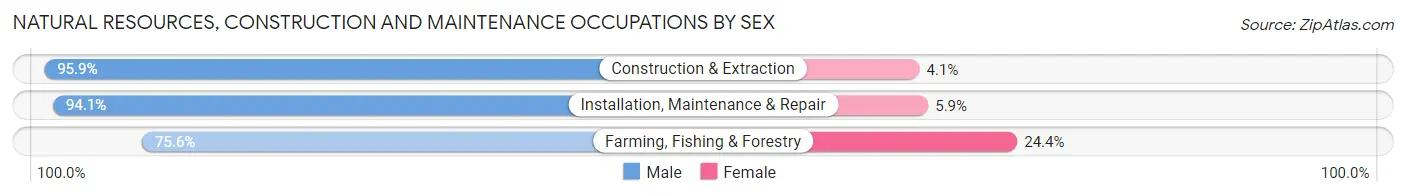
Natural Resources, Construction and Maintenance Occupations by Sex
| Occupation | Male | Female |
| Farming, Fishing & Forestry | 1,250 (75.6%) | 404 (24.4%) |
| Construction & Extraction | 24,719 (95.9%) | 1,055 (4.1%) |
| Installation, Maintenance & Repair | 16,136 (94.1%) | 1,012 (5.9%) |
| Total (Category) | 42,105 (94.5%) | 2,471 (5.5%) |
| Total (Overall) | 234,284 (55.1%) | 190,883 (44.9%) |
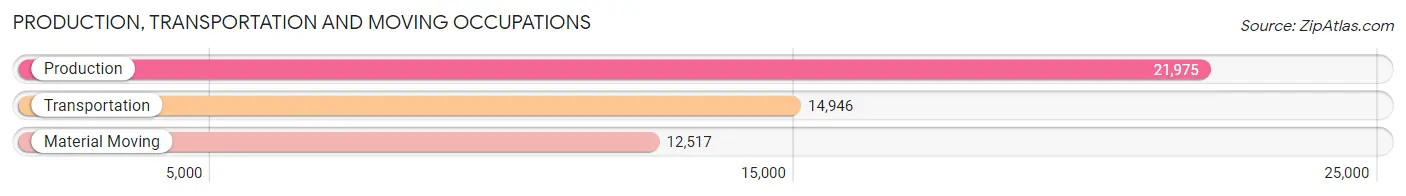
Production, Transportation and Moving Occupations
The most common Production, Transportation and Moving occupations in Snohomish County are Production (21,975 | 5.2%), Transportation (14,946 | 3.5%), and Material Moving (12,517 | 2.9%).
Production, Transportation and Moving Occupations by Sex
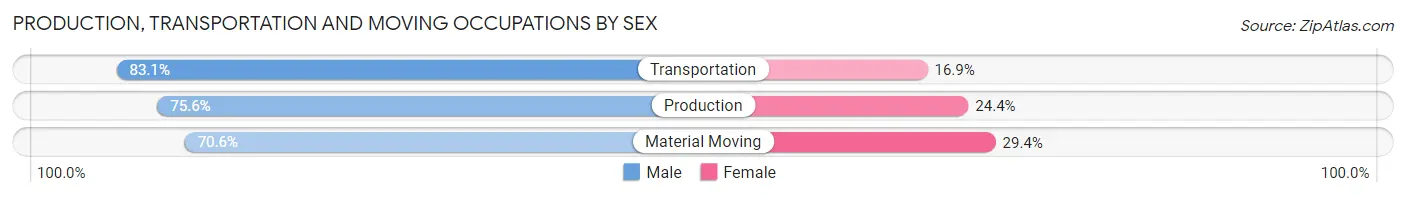
| Occupation | Male | Female |
| Production | 16,618 (75.6%) | 5,357 (24.4%) |
| Transportation | 12,423 (83.1%) | 2,523 (16.9%) |
| Material Moving | 8,839 (70.6%) | 3,678 (29.4%) |
| Total (Category) | 37,880 (76.6%) | 11,558 (23.4%) |
| Total (Overall) | 234,284 (55.1%) | 190,883 (44.9%) |
Employment Industries by Sex in Snohomish County
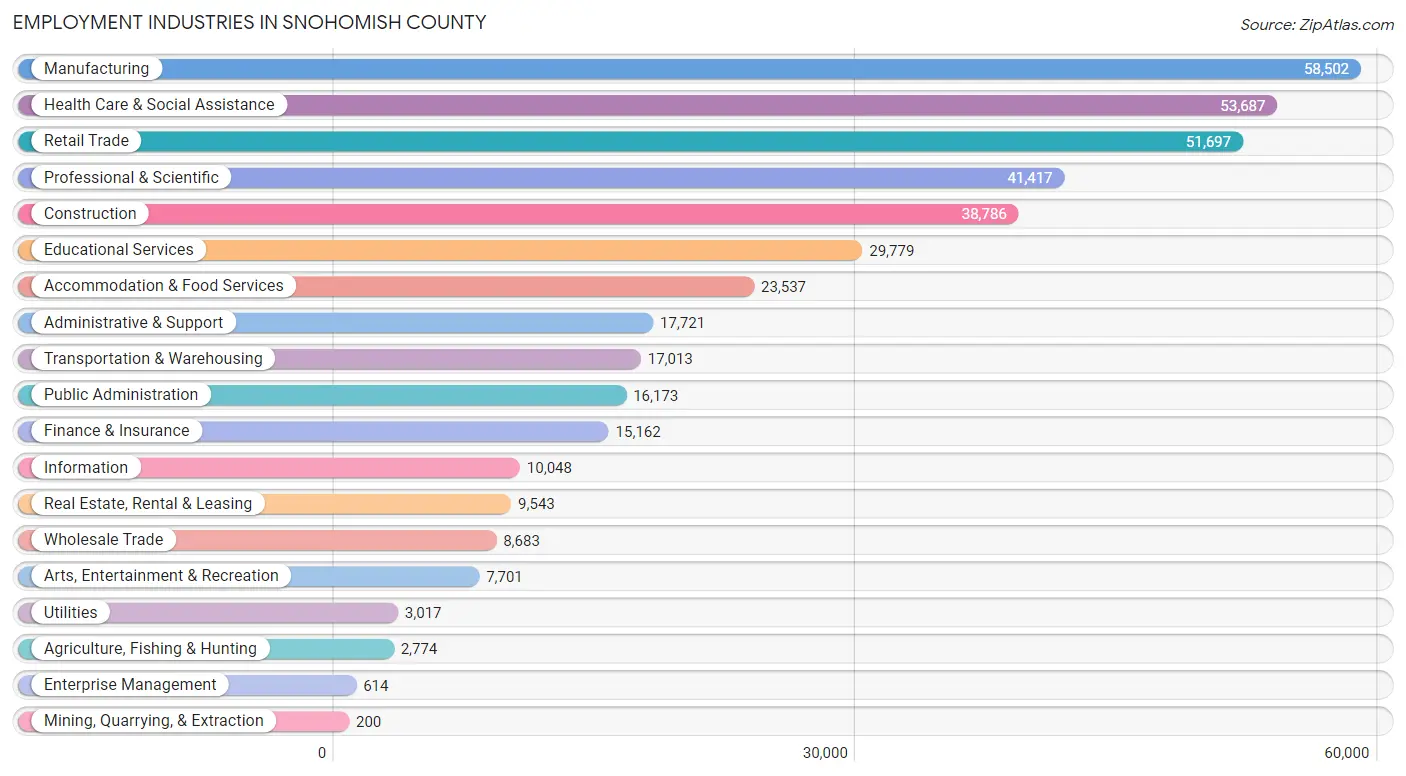
Employment Industries in Snohomish County
The major employment industries in Snohomish County include Manufacturing (58,502 | 13.8%), Health Care & Social Assistance (53,687 | 12.6%), Retail Trade (51,697 | 12.2%), Professional & Scientific (41,417 | 9.7%), and Construction (38,786 | 9.1%).
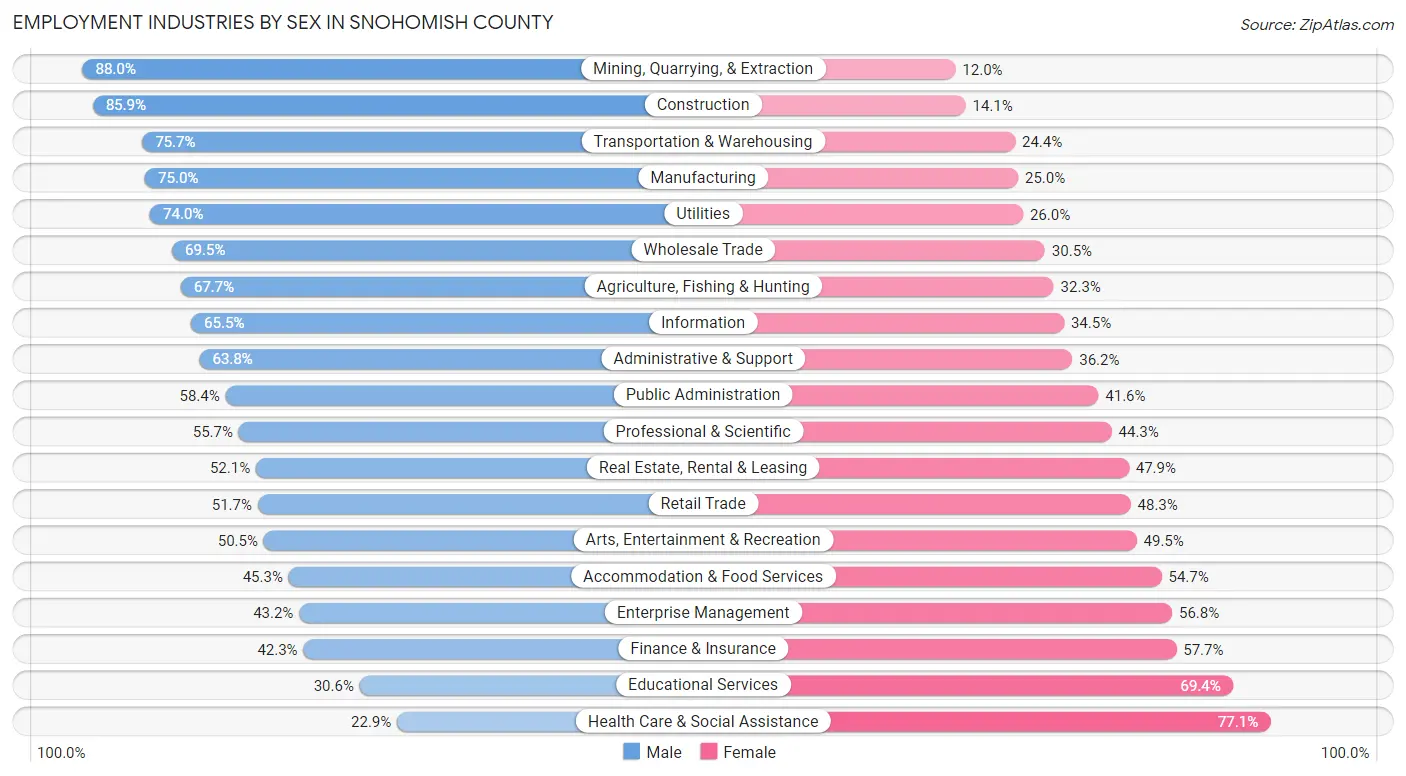
Employment Industries by Sex in Snohomish County
The Snohomish County industries that see more men than women are Mining, Quarrying, & Extraction (88.0%), Construction (85.9%), and Transportation & Warehousing (75.6%), whereas the industries that tend to have a higher number of women are Health Care & Social Assistance (77.1%), Educational Services (69.4%), and Finance & Insurance (57.7%).
| Industry | Male | Female |
| Agriculture, Fishing & Hunting | 1,877 (67.7%) | 897 (32.3%) |
| Mining, Quarrying, & Extraction | 176 (88.0%) | 24 (12.0%) |
| Construction | 33,313 (85.9%) | 5,473 (14.1%) |
| Manufacturing | 43,902 (75.0%) | 14,600 (25.0%) |
| Wholesale Trade | 6,032 (69.5%) | 2,651 (30.5%) |
| Retail Trade | 26,742 (51.7%) | 24,955 (48.3%) |
| Transportation & Warehousing | 12,870 (75.6%) | 4,143 (24.3%) |
| Utilities | 2,233 (74.0%) | 784 (26.0%) |
| Information | 6,583 (65.5%) | 3,465 (34.5%) |
| Finance & Insurance | 6,410 (42.3%) | 8,752 (57.7%) |
| Real Estate, Rental & Leasing | 4,973 (52.1%) | 4,570 (47.9%) |
| Professional & Scientific | 23,052 (55.7%) | 18,365 (44.3%) |
| Enterprise Management | 265 (43.2%) | 349 (56.8%) |
| Administrative & Support | 11,306 (63.8%) | 6,415 (36.2%) |
| Educational Services | 9,121 (30.6%) | 20,658 (69.4%) |
| Health Care & Social Assistance | 12,287 (22.9%) | 41,400 (77.1%) |
| Arts, Entertainment & Recreation | 3,888 (50.5%) | 3,813 (49.5%) |
| Accommodation & Food Services | 10,669 (45.3%) | 12,868 (54.7%) |
| Public Administration | 9,446 (58.4%) | 6,727 (41.6%) |
| Total | 234,284 (55.1%) | 190,883 (44.9%) |
Education in Snohomish County
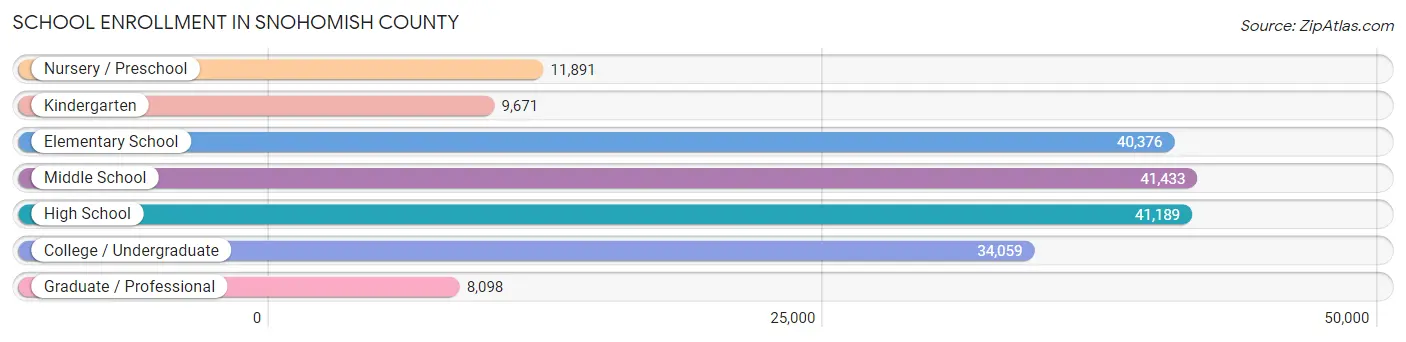
School Enrollment in Snohomish County
The most common levels of schooling among the 186,717 students in Snohomish County are middle school (41,433 | 22.2%), high school (41,189 | 22.1%), and elementary school (40,376 | 21.6%).
| School Level | # Students | % Students |
| Nursery / Preschool | 11,891 | 6.4% |
| Kindergarten | 9,671 | 5.2% |
| Elementary School | 40,376 | 21.6% |
| Middle School | 41,433 | 22.2% |
| High School | 41,189 | 22.1% |
| College / Undergraduate | 34,059 | 18.2% |
| Graduate / Professional | 8,098 | 4.3% |
| Total | 186,717 | 100.0% |
School Enrollment by Age by Funding Source in Snohomish County
Out of a total of 186,717 students who are enrolled in schools in Snohomish County, 29,688 (15.9%) attend a private institution, while the remaining 157,029 (84.1%) are enrolled in public schools. The age group of 3 to 4 year olds has the highest likelihood of being enrolled in private schools, with 5,773 (61.5% in the age bracket) enrolled. Conversely, the age group of 15 to 17 year olds has the lowest likelihood of being enrolled in a private school, with 27,404 (92.2% in the age bracket) attending a public institution.
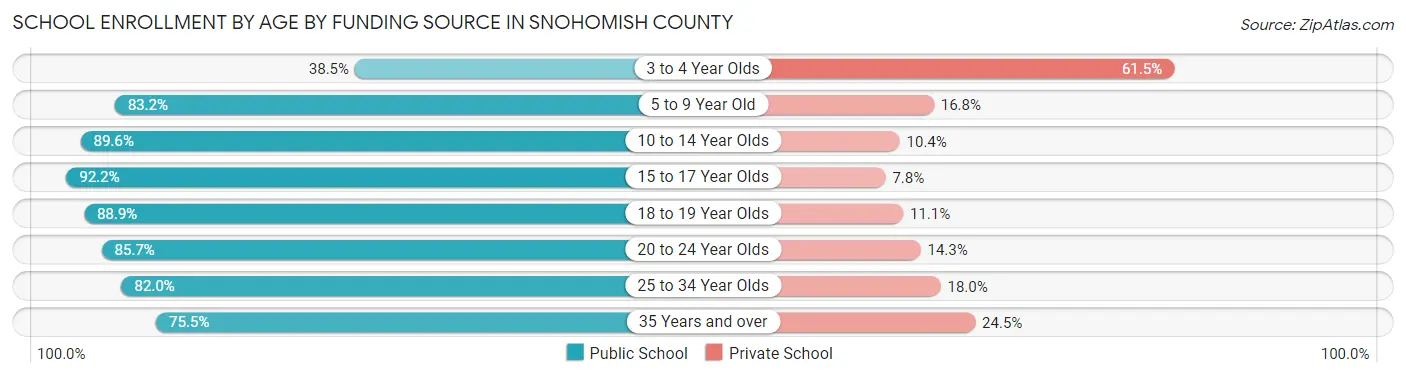
| Age Bracket | Public School | Private School |
| 3 to 4 Year Olds | 3,611 (38.5%) | 5,773 (61.5%) |
| 5 to 9 Year Old | 39,607 (83.2%) | 7,994 (16.8%) |
| 10 to 14 Year Olds | 46,053 (89.6%) | 5,355 (10.4%) |
| 15 to 17 Year Olds | 27,404 (92.2%) | 2,313 (7.8%) |
| 18 to 19 Year Olds | 9,828 (88.9%) | 1,222 (11.1%) |
| 20 to 24 Year Olds | 11,967 (85.7%) | 2,000 (14.3%) |
| 25 to 34 Year Olds | 9,762 (82.0%) | 2,149 (18.0%) |
| 35 Years and over | 8,819 (75.5%) | 2,860 (24.5%) |
| Total | 157,029 (84.1%) | 29,688 (15.9%) |
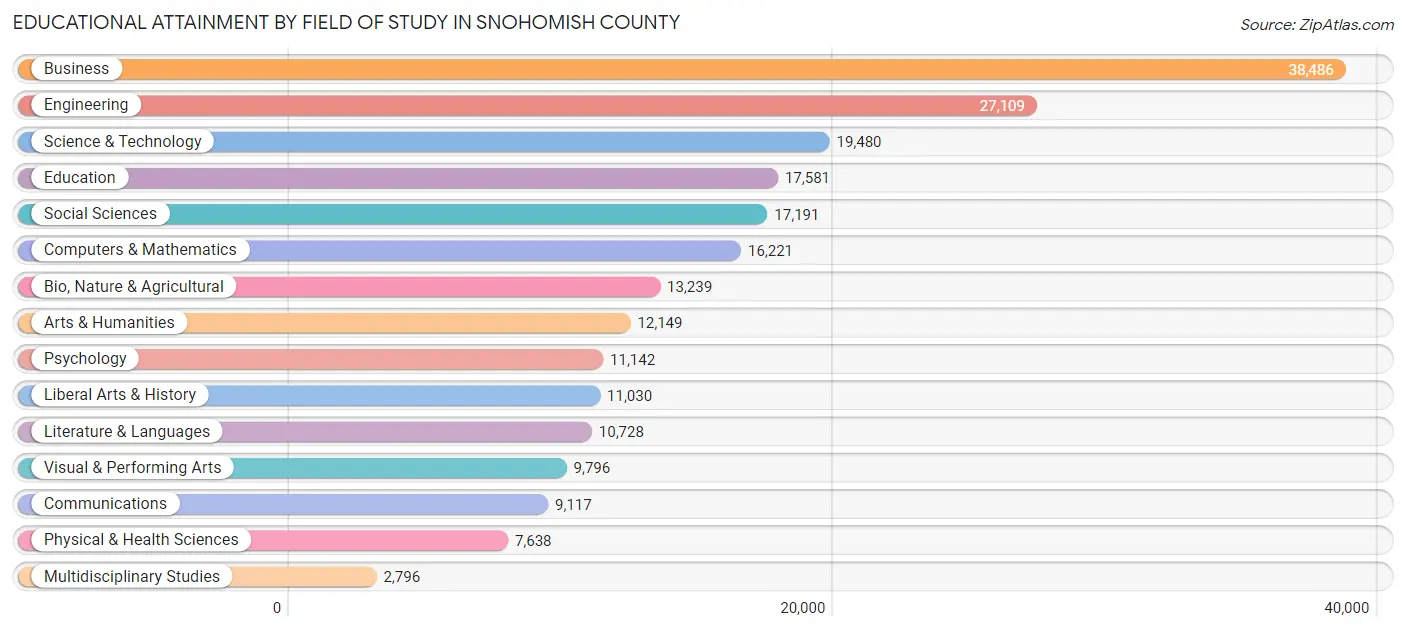
Educational Attainment by Field of Study in Snohomish County
Business (38,486 | 17.2%), engineering (27,109 | 12.1%), science & technology (19,480 | 8.7%), education (17,581 | 7.9%), and social sciences (17,191 | 7.7%) are the most common fields of study among 223,703 individuals in Snohomish County who have obtained a bachelor's degree or higher.
| Field of Study | # Graduates | % Graduates |
| Computers & Mathematics | 16,221 | 7.2% |
| Bio, Nature & Agricultural | 13,239 | 5.9% |
| Physical & Health Sciences | 7,638 | 3.4% |
| Psychology | 11,142 | 5.0% |
| Social Sciences | 17,191 | 7.7% |
| Engineering | 27,109 | 12.1% |
| Multidisciplinary Studies | 2,796 | 1.3% |
| Science & Technology | 19,480 | 8.7% |
| Business | 38,486 | 17.2% |
| Education | 17,581 | 7.9% |
| Literature & Languages | 10,728 | 4.8% |
| Liberal Arts & History | 11,030 | 4.9% |
| Visual & Performing Arts | 9,796 | 4.4% |
| Communications | 9,117 | 4.1% |
| Arts & Humanities | 12,149 | 5.4% |
| Total | 223,703 | 100.0% |
Transportation & Commute in Snohomish County
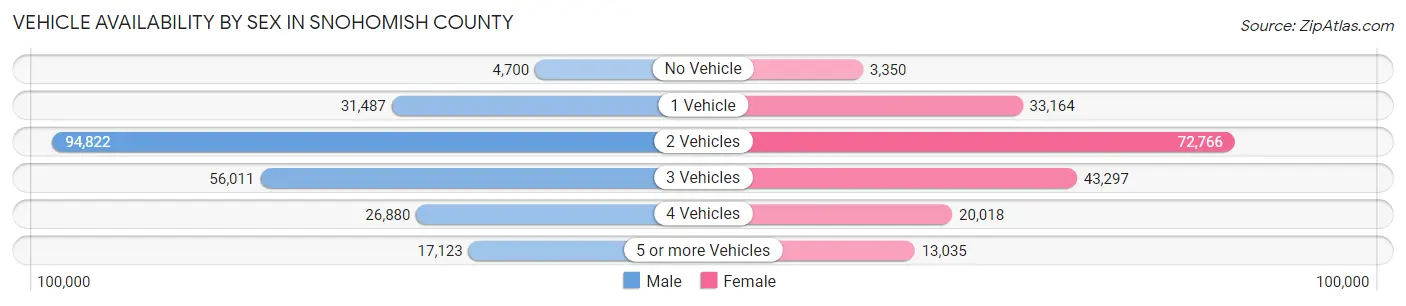
Vehicle Availability by Sex in Snohomish County
The most prevalent vehicle ownership categories in Snohomish County are males with 2 vehicles (94,822, accounting for 41.0%) and females with 2 vehicles (72,766, making up 51.1%).
| Vehicles Available | Male | Female |
| No Vehicle | 4,700 (2.0%) | 3,350 (1.8%) |
| 1 Vehicle | 31,487 (13.6%) | 33,164 (17.9%) |
| 2 Vehicles | 94,822 (41.0%) | 72,766 (39.2%) |
| 3 Vehicles | 56,011 (24.2%) | 43,297 (23.3%) |
| 4 Vehicles | 26,880 (11.6%) | 20,018 (10.8%) |
| 5 or more Vehicles | 17,123 (7.4%) | 13,035 (7.0%) |
| Total | 231,023 (100.0%) | 185,630 (100.0%) |
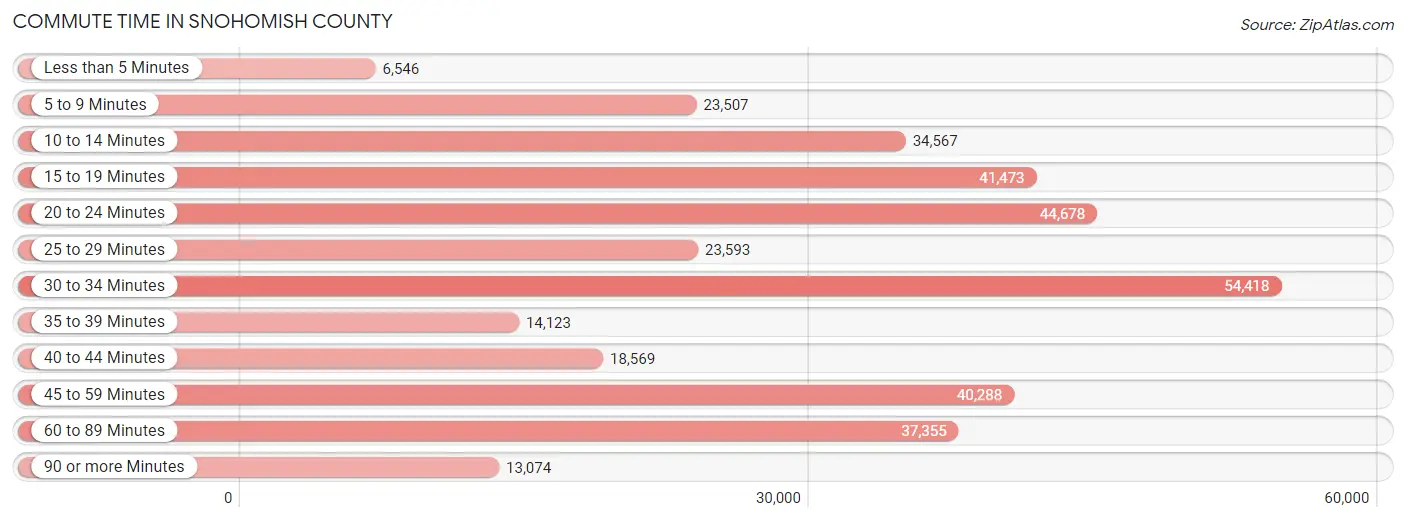
Commute Time in Snohomish County
The most frequently occuring commute durations in Snohomish County are 30 to 34 minutes (54,418 commuters, 15.4%), 20 to 24 minutes (44,678 commuters, 12.7%), and 15 to 19 minutes (41,473 commuters, 11.8%).
| Commute Time | # Commuters | % Commuters |
| Less than 5 Minutes | 6,546 | 1.9% |
| 5 to 9 Minutes | 23,507 | 6.7% |
| 10 to 14 Minutes | 34,567 | 9.8% |
| 15 to 19 Minutes | 41,473 | 11.8% |
| 20 to 24 Minutes | 44,678 | 12.7% |
| 25 to 29 Minutes | 23,593 | 6.7% |
| 30 to 34 Minutes | 54,418 | 15.4% |
| 35 to 39 Minutes | 14,123 | 4.0% |
| 40 to 44 Minutes | 18,569 | 5.3% |
| 45 to 59 Minutes | 40,288 | 11.4% |
| 60 to 89 Minutes | 37,355 | 10.6% |
| 90 or more Minutes | 13,074 | 3.7% |
Commute Time by Sex in Snohomish County
The most common commute times in Snohomish County are 30 to 34 minutes (30,959 commuters, 15.5%) for males and 30 to 34 minutes (23,459 commuters, 15.3%) for females.
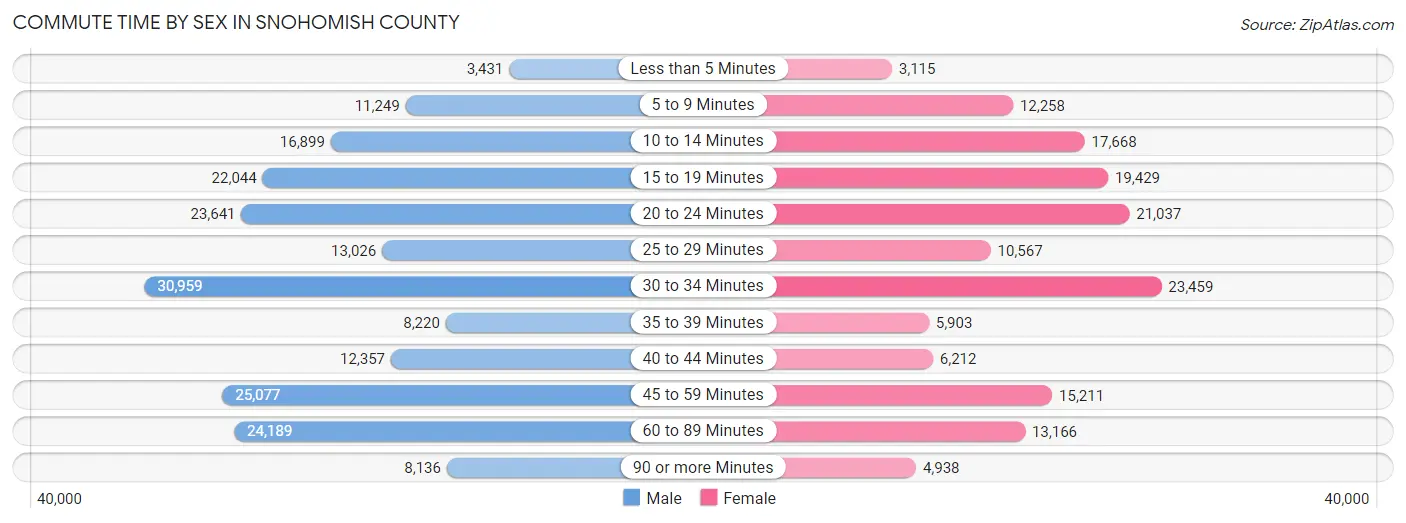
| Commute Time | Male | Female |
| Less than 5 Minutes | 3,431 (1.7%) | 3,115 (2.0%) |
| 5 to 9 Minutes | 11,249 (5.7%) | 12,258 (8.0%) |
| 10 to 14 Minutes | 16,899 (8.5%) | 17,668 (11.6%) |
| 15 to 19 Minutes | 22,044 (11.1%) | 19,429 (12.7%) |
| 20 to 24 Minutes | 23,641 (11.9%) | 21,037 (13.8%) |
| 25 to 29 Minutes | 13,026 (6.5%) | 10,567 (6.9%) |
| 30 to 34 Minutes | 30,959 (15.5%) | 23,459 (15.3%) |
| 35 to 39 Minutes | 8,220 (4.1%) | 5,903 (3.9%) |
| 40 to 44 Minutes | 12,357 (6.2%) | 6,212 (4.1%) |
| 45 to 59 Minutes | 25,077 (12.6%) | 15,211 (9.9%) |
| 60 to 89 Minutes | 24,189 (12.1%) | 13,166 (8.6%) |
| 90 or more Minutes | 8,136 (4.1%) | 4,938 (3.2%) |
Time of Departure to Work by Sex in Snohomish County
The most frequent times of departure to work in Snohomish County are 6:00 AM to 6:29 AM (23,199, 11.6%) for males and 7:00 AM to 7:29 AM (18,992, 12.4%) for females.
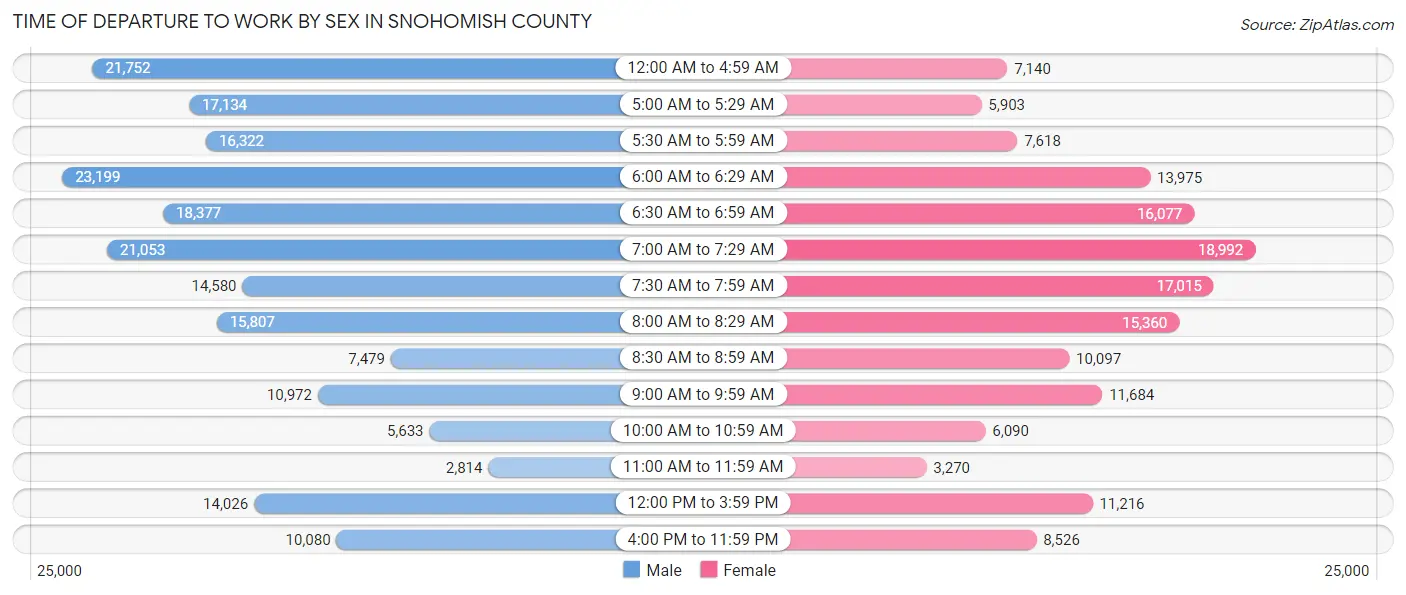
| Time of Departure | Male | Female |
| 12:00 AM to 4:59 AM | 21,752 (10.9%) | 7,140 (4.7%) |
| 5:00 AM to 5:29 AM | 17,134 (8.6%) | 5,903 (3.9%) |
| 5:30 AM to 5:59 AM | 16,322 (8.2%) | 7,618 (5.0%) |
| 6:00 AM to 6:29 AM | 23,199 (11.6%) | 13,975 (9.1%) |
| 6:30 AM to 6:59 AM | 18,377 (9.2%) | 16,077 (10.5%) |
| 7:00 AM to 7:29 AM | 21,053 (10.6%) | 18,992 (12.4%) |
| 7:30 AM to 7:59 AM | 14,580 (7.3%) | 17,015 (11.1%) |
| 8:00 AM to 8:29 AM | 15,807 (7.9%) | 15,360 (10.0%) |
| 8:30 AM to 8:59 AM | 7,479 (3.7%) | 10,097 (6.6%) |
| 9:00 AM to 9:59 AM | 10,972 (5.5%) | 11,684 (7.6%) |
| 10:00 AM to 10:59 AM | 5,633 (2.8%) | 6,090 (4.0%) |
| 11:00 AM to 11:59 AM | 2,814 (1.4%) | 3,270 (2.1%) |
| 12:00 PM to 3:59 PM | 14,026 (7.0%) | 11,216 (7.3%) |
| 4:00 PM to 11:59 PM | 10,080 (5.1%) | 8,526 (5.6%) |
| Total | 199,228 (100.0%) | 152,963 (100.0%) |
Housing Occupancy in Snohomish County
Occupancy by Ownership in Snohomish County
Of the total 307,643 dwellings in Snohomish County, owner-occupied units account for 210,931 (68.6%), while renter-occupied units make up 96,712 (31.4%).
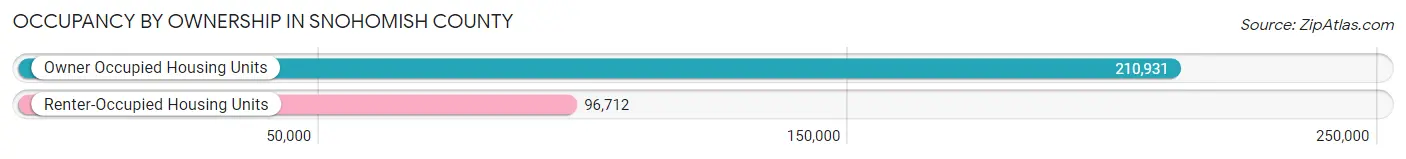
| Occupancy | # Housing Units | % Housing Units |
| Owner Occupied Housing Units | 210,931 | 68.6% |
| Renter-Occupied Housing Units | 96,712 | 31.4% |
| Total Occupied Housing Units | 307,643 | 100.0% |
Occupancy by Household Size in Snohomish County
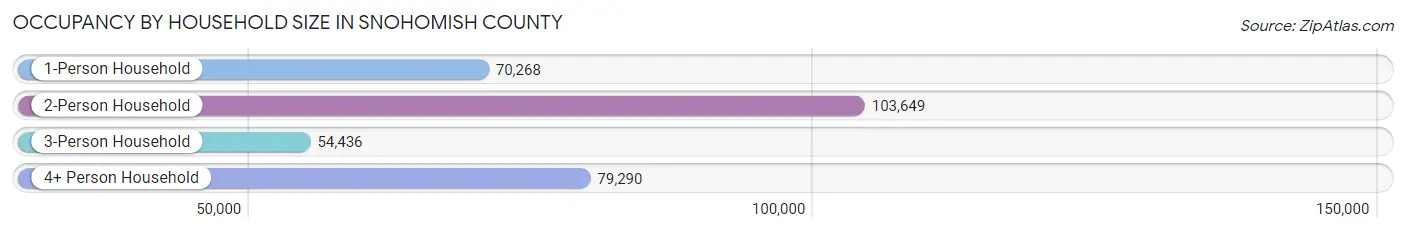
| Household Size | # Housing Units | % Housing Units |
| 1-Person Household | 70,268 | 22.8% |
| 2-Person Household | 103,649 | 33.7% |
| 3-Person Household | 54,436 | 17.7% |
| 4+ Person Household | 79,290 | 25.8% |
| Total Housing Units | 307,643 | 100.0% |
Occupancy by Ownership by Household Size in Snohomish County
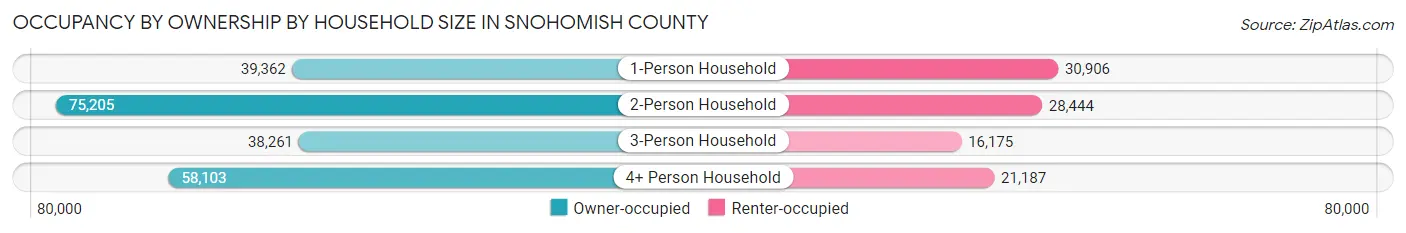
| Household Size | Owner-occupied | Renter-occupied |
| 1-Person Household | 39,362 (56.0%) | 30,906 (44.0%) |
| 2-Person Household | 75,205 (72.6%) | 28,444 (27.4%) |
| 3-Person Household | 38,261 (70.3%) | 16,175 (29.7%) |
| 4+ Person Household | 58,103 (73.3%) | 21,187 (26.7%) |
| Total Housing Units | 210,931 (68.6%) | 96,712 (31.4%) |
Occupancy by Educational Attainment in Snohomish County
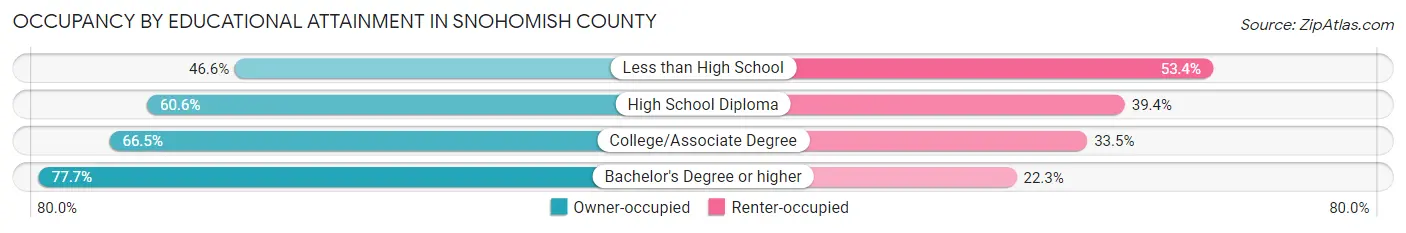
| Household Size | Owner-occupied | Renter-occupied |
| Less than High School | 8,381 (46.6%) | 9,595 (53.4%) |
| High School Diploma | 35,485 (60.6%) | 23,103 (39.4%) |
| College/Associate Degree | 74,502 (66.5%) | 37,498 (33.5%) |
| Bachelor's Degree or higher | 92,563 (77.7%) | 26,516 (22.3%) |
Occupancy by Age of Householder in Snohomish County
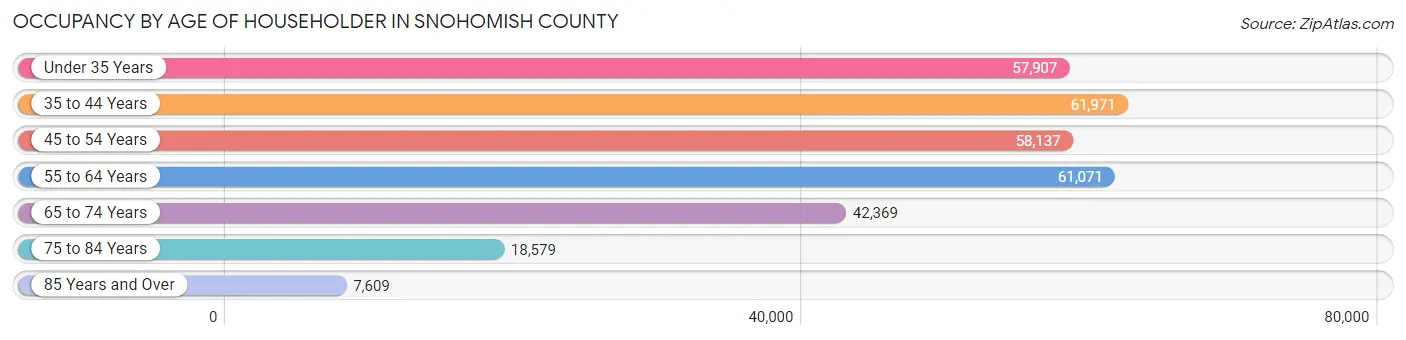
| Age Bracket | # Households | % Households |
| Under 35 Years | 57,907 | 18.8% |
| 35 to 44 Years | 61,971 | 20.1% |
| 45 to 54 Years | 58,137 | 18.9% |
| 55 to 64 Years | 61,071 | 19.9% |
| 65 to 74 Years | 42,369 | 13.8% |
| 75 to 84 Years | 18,579 | 6.0% |
| 85 Years and Over | 7,609 | 2.5% |
| Total | 307,643 | 100.0% |
Housing Finances in Snohomish County
Median Income by Occupancy in Snohomish County
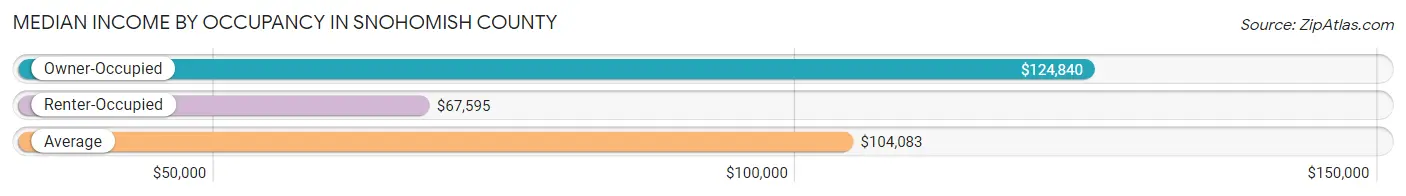
| Occupancy Type | # Households | Median Income |
| Owner-Occupied | 210,931 (68.6%) | $124,840 |
| Renter-Occupied | 96,712 (31.4%) | $67,595 |
| Average | 307,643 (100.0%) | $104,083 |
Occupancy by Householder Income Bracket in Snohomish County
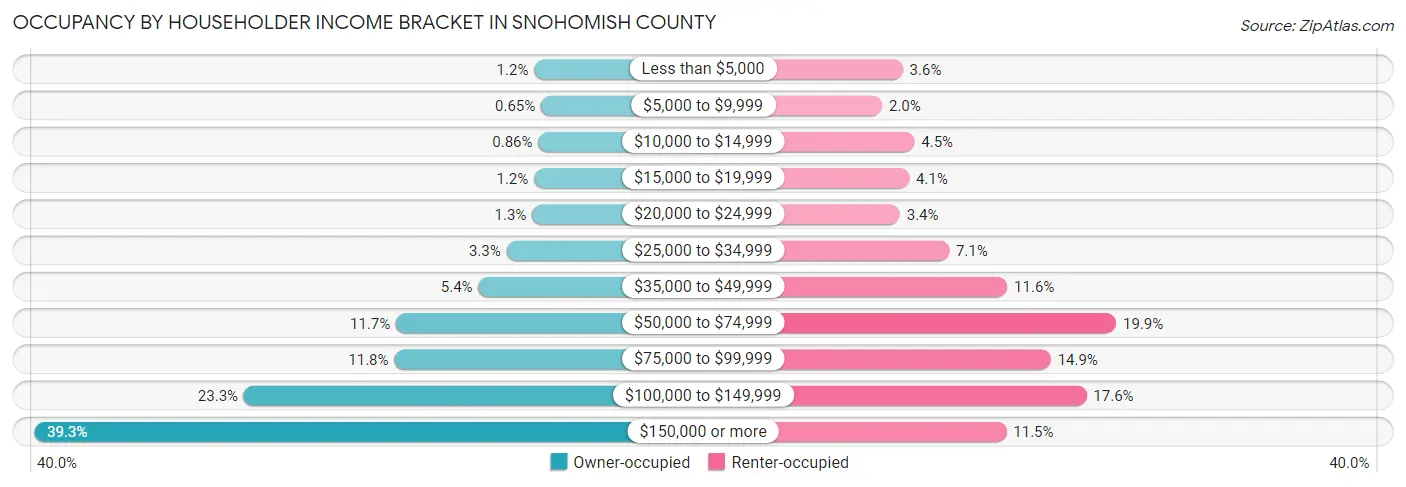
| Income Bracket | Owner-occupied | Renter-occupied |
| Less than $5,000 | 2,459 (1.2%) | 3,468 (3.6%) |
| $5,000 to $9,999 | 1,365 (0.6%) | 1,957 (2.0%) |
| $10,000 to $14,999 | 1,814 (0.9%) | 4,335 (4.5%) |
| $15,000 to $19,999 | 2,491 (1.2%) | 3,933 (4.1%) |
| $20,000 to $24,999 | 2,809 (1.3%) | 3,264 (3.4%) |
| $25,000 to $34,999 | 6,922 (3.3%) | 6,885 (7.1%) |
| $35,000 to $49,999 | 11,438 (5.4%) | 11,167 (11.6%) |
| $50,000 to $74,999 | 24,685 (11.7%) | 19,196 (19.9%) |
| $75,000 to $99,999 | 24,954 (11.8%) | 14,377 (14.9%) |
| $100,000 to $149,999 | 49,136 (23.3%) | 17,015 (17.6%) |
| $150,000 or more | 82,858 (39.3%) | 11,115 (11.5%) |
| Total | 210,931 (100.0%) | 96,712 (100.0%) |
Monthly Housing Cost Tiers in Snohomish County
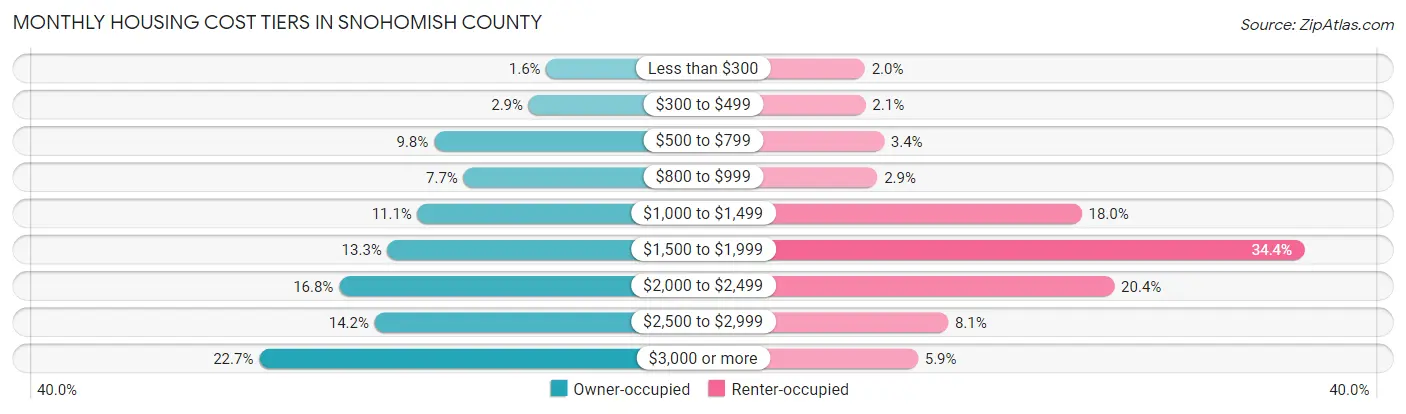
| Monthly Cost | Owner-occupied | Renter-occupied |
| Less than $300 | 3,306 (1.6%) | 1,947 (2.0%) |
| $300 to $499 | 6,030 (2.9%) | 1,996 (2.1%) |
| $500 to $799 | 20,758 (9.8%) | 3,305 (3.4%) |
| $800 to $999 | 16,156 (7.7%) | 2,834 (2.9%) |
| $1,000 to $1,499 | 23,312 (11.1%) | 17,393 (18.0%) |
| $1,500 to $1,999 | 27,978 (13.3%) | 33,219 (34.4%) |
| $2,000 to $2,499 | 35,492 (16.8%) | 19,707 (20.4%) |
| $2,500 to $2,999 | 29,982 (14.2%) | 7,872 (8.1%) |
| $3,000 or more | 47,917 (22.7%) | 5,725 (5.9%) |
| Total | 210,931 (100.0%) | 96,712 (100.0%) |
Physical Housing Characteristics in Snohomish County
Housing Structures in Snohomish County
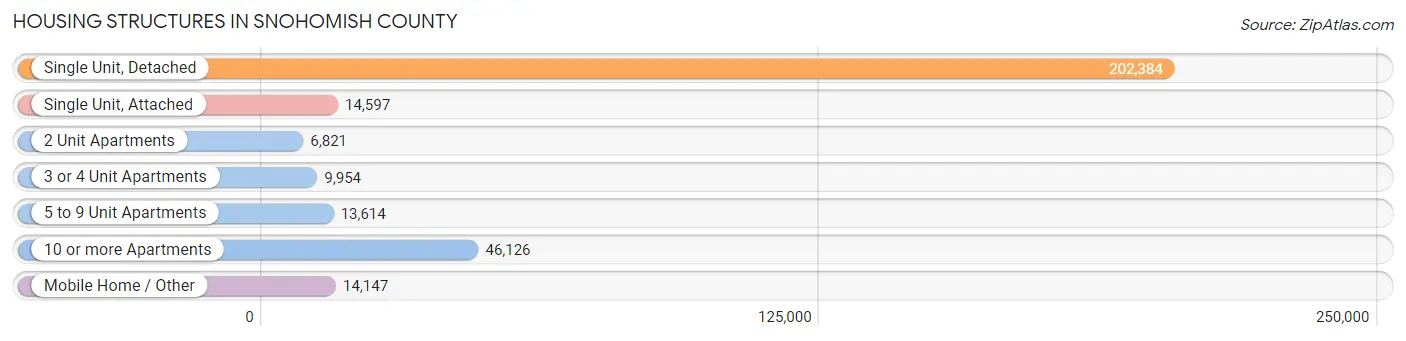
| Structure Type | # Housing Units | % Housing Units |
| Single Unit, Detached | 202,384 | 65.8% |
| Single Unit, Attached | 14,597 | 4.7% |
| 2 Unit Apartments | 6,821 | 2.2% |
| 3 or 4 Unit Apartments | 9,954 | 3.2% |
| 5 to 9 Unit Apartments | 13,614 | 4.4% |
| 10 or more Apartments | 46,126 | 15.0% |
| Mobile Home / Other | 14,147 | 4.6% |
| Total | 307,643 | 100.0% |
Housing Structures by Occupancy in Snohomish County
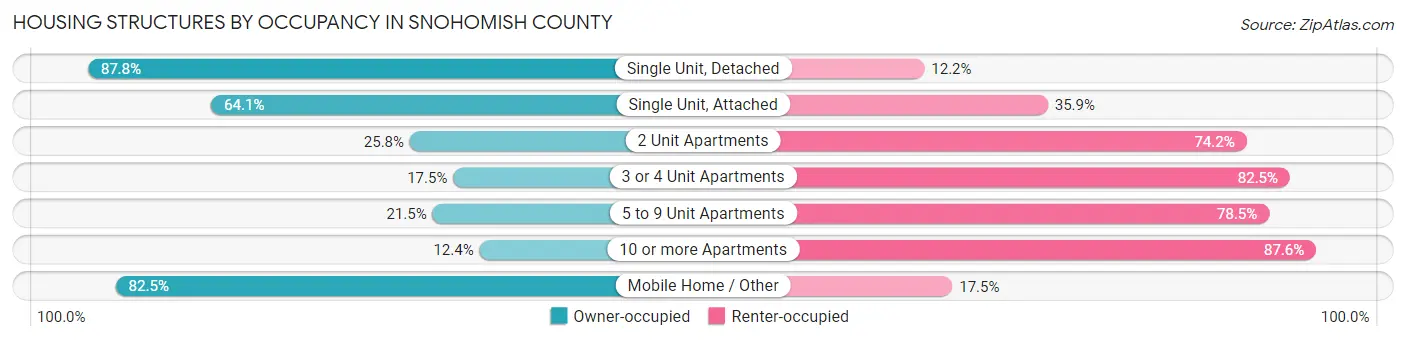
| Structure Type | Owner-occupied | Renter-occupied |
| Single Unit, Detached | 177,763 (87.8%) | 24,621 (12.2%) |
| Single Unit, Attached | 9,352 (64.1%) | 5,245 (35.9%) |
| 2 Unit Apartments | 1,761 (25.8%) | 5,060 (74.2%) |
| 3 or 4 Unit Apartments | 1,739 (17.5%) | 8,215 (82.5%) |
| 5 to 9 Unit Apartments | 2,922 (21.5%) | 10,692 (78.5%) |
| 10 or more Apartments | 5,729 (12.4%) | 40,397 (87.6%) |
| Mobile Home / Other | 11,665 (82.5%) | 2,482 (17.5%) |
| Total | 210,931 (68.6%) | 96,712 (31.4%) |
Housing Structures by Number of Rooms in Snohomish County
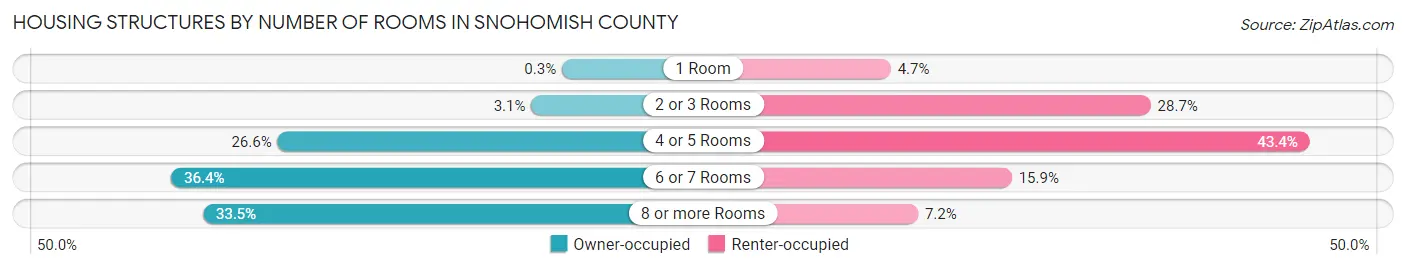
| Number of Rooms | Owner-occupied | Renter-occupied |
| 1 Room | 627 (0.3%) | 4,547 (4.7%) |
| 2 or 3 Rooms | 6,630 (3.1%) | 27,796 (28.7%) |
| 4 or 5 Rooms | 56,127 (26.6%) | 42,012 (43.4%) |
| 6 or 7 Rooms | 76,869 (36.4%) | 15,371 (15.9%) |
| 8 or more Rooms | 70,678 (33.5%) | 6,986 (7.2%) |
| Total | 210,931 (100.0%) | 96,712 (100.0%) |
Housing Structure by Heating Type in Snohomish County
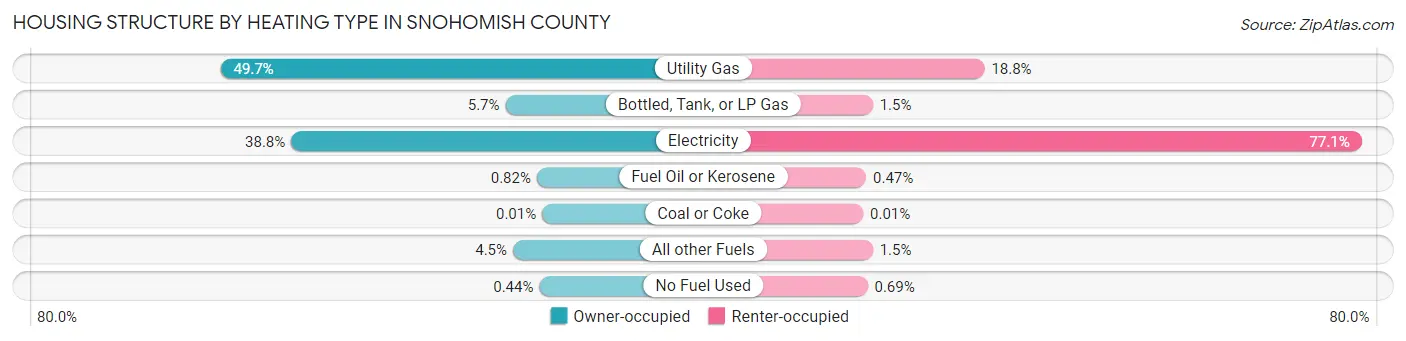
| Heating Type | Owner-occupied | Renter-occupied |
| Utility Gas | 104,870 (49.7%) | 18,152 (18.8%) |
| Bottled, Tank, or LP Gas | 11,982 (5.7%) | 1,441 (1.5%) |
| Electricity | 81,844 (38.8%) | 74,538 (77.1%) |
| Fuel Oil or Kerosene | 1,730 (0.8%) | 459 (0.5%) |
| Coal or Coke | 30 (0.0%) | 7 (0.0%) |
| All other Fuels | 9,544 (4.5%) | 1,446 (1.5%) |
| No Fuel Used | 931 (0.4%) | 669 (0.7%) |
| Total | 210,931 (100.0%) | 96,712 (100.0%) |
Household Vehicle Usage in Snohomish County
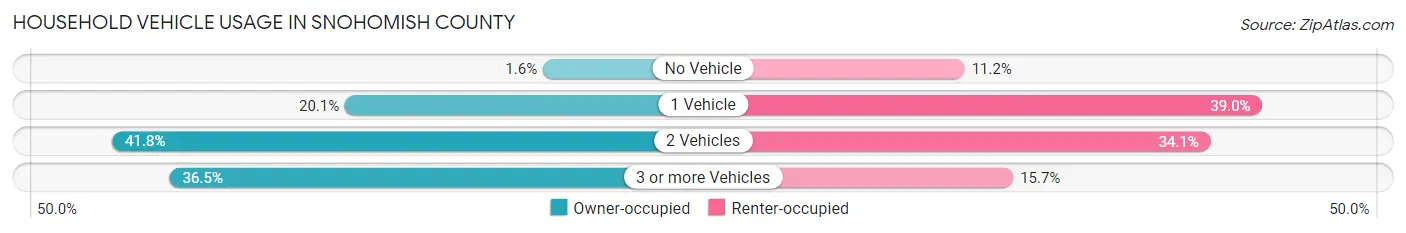
| Vehicles per Household | Owner-occupied | Renter-occupied |
| No Vehicle | 3,396 (1.6%) | 10,809 (11.2%) |
| 1 Vehicle | 42,367 (20.1%) | 37,693 (39.0%) |
| 2 Vehicles | 88,247 (41.8%) | 33,013 (34.1%) |
| 3 or more Vehicles | 76,921 (36.5%) | 15,197 (15.7%) |
| Total | 210,931 (100.0%) | 96,712 (100.0%) |
Real Estate & Mortgages in Snohomish County
Real Estate and Mortgage Overview in Snohomish County
| Characteristic | Without Mortgage | With Mortgage |
| Housing Units | 57,001 | 153,930 |
| Median Property Value | $548,200 | $607,000 |
| Median Household Income | $87,265 | $68,453 |
| Monthly Housing Costs | $805 | $47,557 |
| Real Estate Taxes | $4,718 | $2,400 |
Property Value by Mortgage Status in Snohomish County
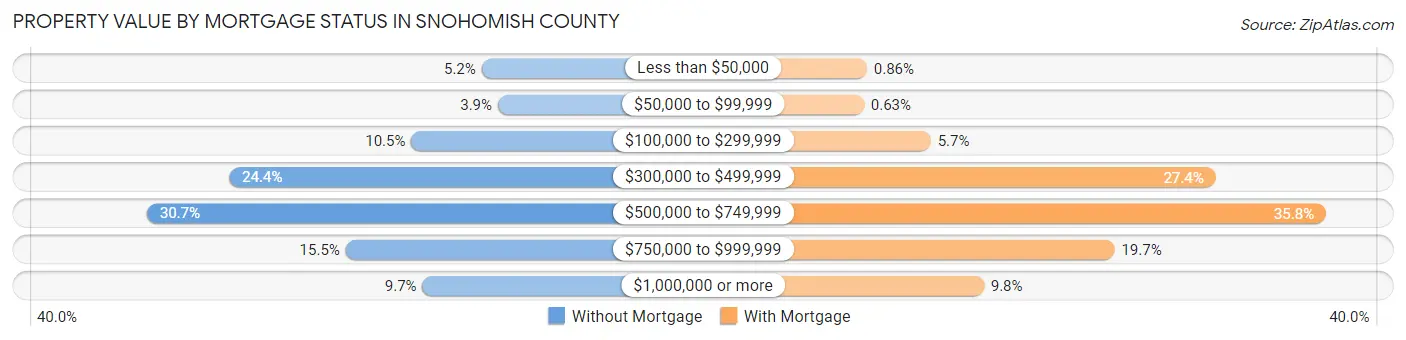
| Property Value | Without Mortgage | With Mortgage |
| Less than $50,000 | 2,951 (5.2%) | 1,319 (0.9%) |
| $50,000 to $99,999 | 2,247 (3.9%) | 965 (0.6%) |
| $100,000 to $299,999 | 6,009 (10.5%) | 8,827 (5.7%) |
| $300,000 to $499,999 | 13,918 (24.4%) | 42,245 (27.4%) |
| $500,000 to $749,999 | 17,494 (30.7%) | 55,172 (35.8%) |
| $750,000 to $999,999 | 8,857 (15.5%) | 30,367 (19.7%) |
| $1,000,000 or more | 5,525 (9.7%) | 15,035 (9.8%) |
| Total | 57,001 (100.0%) | 153,930 (100.0%) |
Household Income by Mortgage Status in Snohomish County
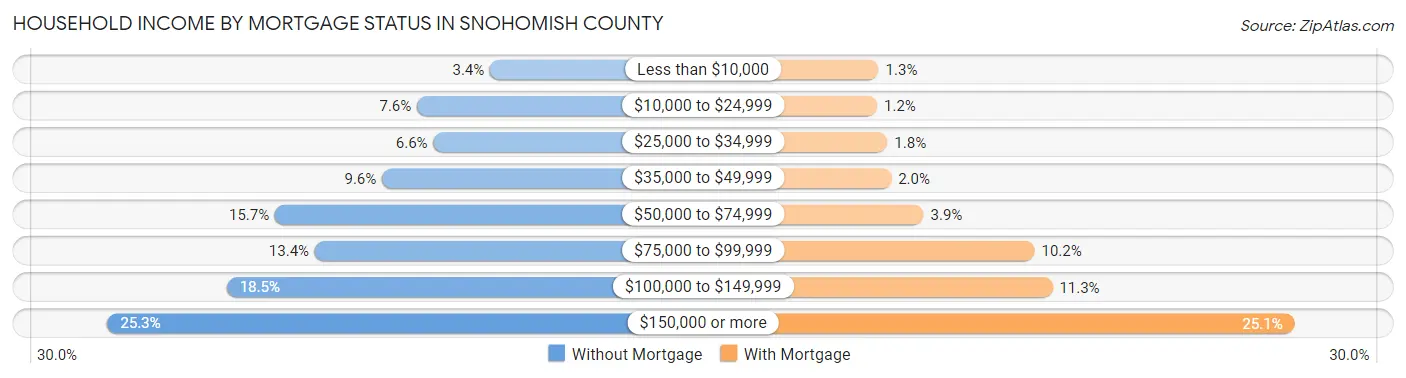
| Household Income | Without Mortgage | With Mortgage |
| Less than $10,000 | 1,936 (3.4%) | 2,027 (1.3%) |
| $10,000 to $24,999 | 4,316 (7.6%) | 1,888 (1.2%) |
| $25,000 to $34,999 | 3,787 (6.6%) | 2,798 (1.8%) |
| $35,000 to $49,999 | 5,457 (9.6%) | 3,135 (2.0%) |
| $50,000 to $74,999 | 8,945 (15.7%) | 5,981 (3.9%) |
| $75,000 to $99,999 | 7,641 (13.4%) | 15,740 (10.2%) |
| $100,000 to $149,999 | 10,514 (18.4%) | 17,313 (11.3%) |
| $150,000 or more | 14,405 (25.3%) | 38,622 (25.1%) |
| Total | 57,001 (100.0%) | 153,930 (100.0%) |
Property Value to Household Income Ratio in Snohomish County
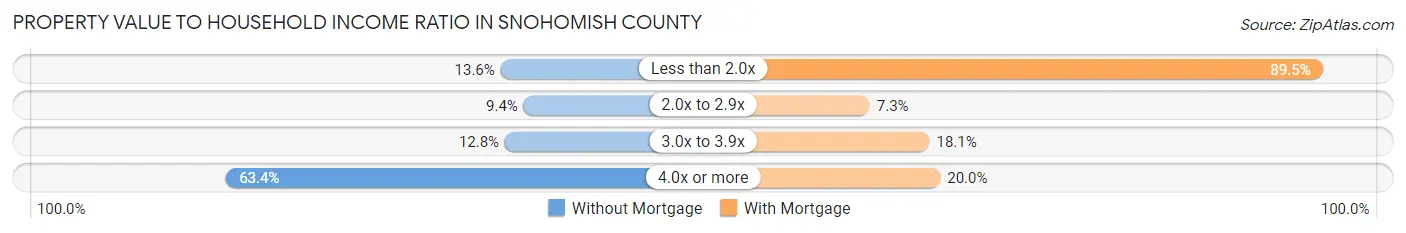
| Value-to-Income Ratio | Without Mortgage | With Mortgage |
| Less than 2.0x | 7,723 (13.6%) | 137,727 (89.5%) |
| 2.0x to 2.9x | 5,333 (9.4%) | 11,166 (7.2%) |
| 3.0x to 3.9x | 7,271 (12.8%) | 27,845 (18.1%) |
| 4.0x or more | 36,127 (63.4%) | 30,853 (20.0%) |
| Total | 57,001 (100.0%) | 153,930 (100.0%) |
Real Estate Taxes by Mortgage Status in Snohomish County
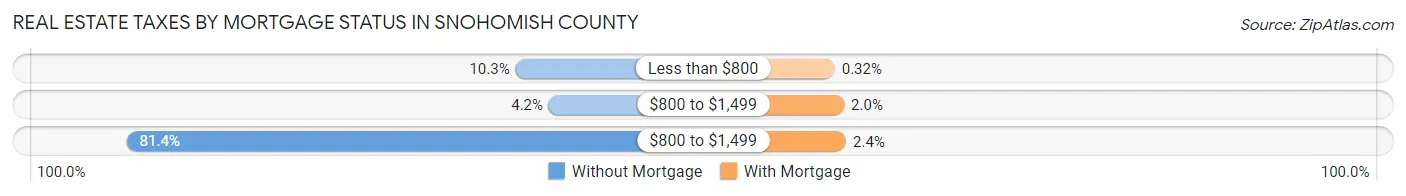
| Property Taxes | Without Mortgage | With Mortgage |
| Less than $800 | 5,896 (10.3%) | 496 (0.3%) |
| $800 to $1,499 | 2,419 (4.2%) | 3,119 (2.0%) |
| $800 to $1,499 | 46,369 (81.4%) | 3,663 (2.4%) |
| Total | 57,001 (100.0%) | 153,930 (100.0%) |
Health & Disability in Snohomish County
Health Insurance Coverage by Age in Snohomish County
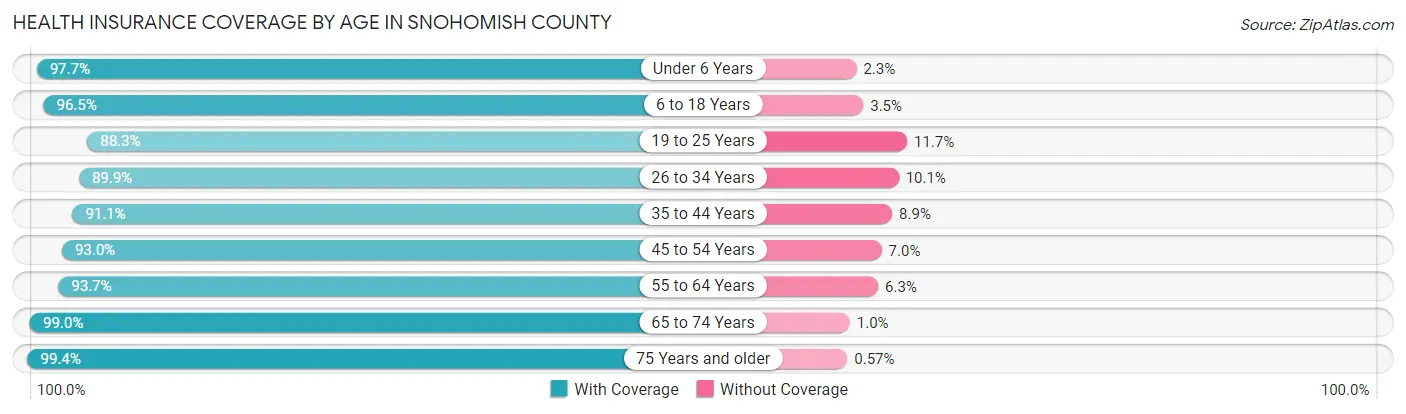
| Age Bracket | With Coverage | Without Coverage |
| Under 6 Years | 58,259 (97.7%) | 1,355 (2.3%) |
| 6 to 18 Years | 129,574 (96.5%) | 4,754 (3.5%) |
| 19 to 25 Years | 55,081 (88.3%) | 7,297 (11.7%) |
| 26 to 34 Years | 98,657 (89.9%) | 11,134 (10.1%) |
| 35 to 44 Years | 111,601 (91.1%) | 10,948 (8.9%) |
| 45 to 54 Years | 100,021 (93.0%) | 7,491 (7.0%) |
| 55 to 64 Years | 101,278 (93.7%) | 6,815 (6.3%) |
| 65 to 74 Years | 72,042 (99.0%) | 752 (1.0%) |
| 75 Years and older | 41,539 (99.4%) | 238 (0.6%) |
| Total | 768,052 (93.8%) | 50,784 (6.2%) |
Health Insurance Coverage by Citizenship Status in Snohomish County
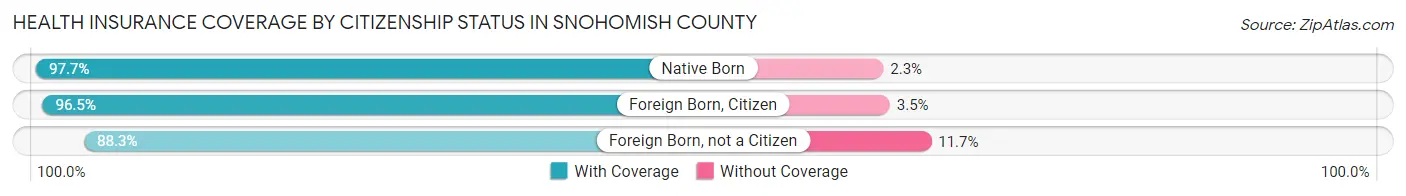
| Citizenship Status | With Coverage | Without Coverage |
| Native Born | 58,259 (97.7%) | 1,355 (2.3%) |
| Foreign Born, Citizen | 129,574 (96.5%) | 4,754 (3.5%) |
| Foreign Born, not a Citizen | 55,081 (88.3%) | 7,297 (11.7%) |
Health Insurance Coverage by Household Income in Snohomish County
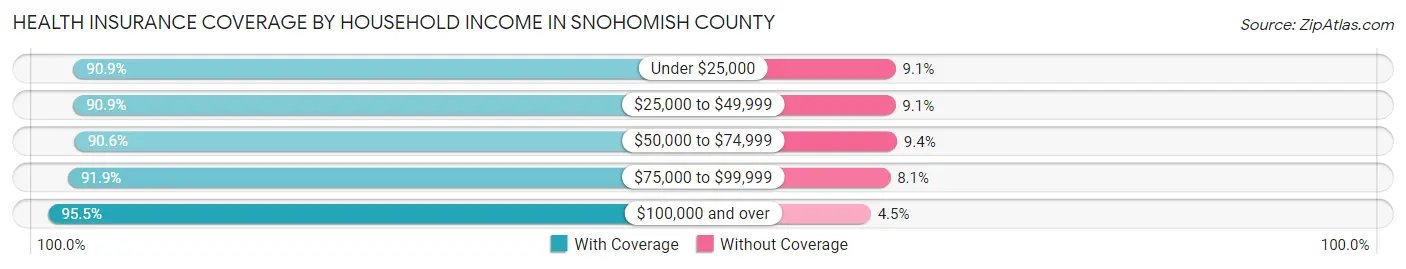
| Household Income | With Coverage | Without Coverage |
| Under $25,000 | 43,201 (90.9%) | 4,348 (9.1%) |
| $25,000 to $49,999 | 64,226 (90.9%) | 6,435 (9.1%) |
| $50,000 to $74,999 | 90,486 (90.6%) | 9,373 (9.4%) |
| $75,000 to $99,999 | 93,015 (91.9%) | 8,232 (8.1%) |
| $100,000 and over | 473,459 (95.5%) | 22,227 (4.5%) |
Public vs Private Health Insurance Coverage by Age in Snohomish County
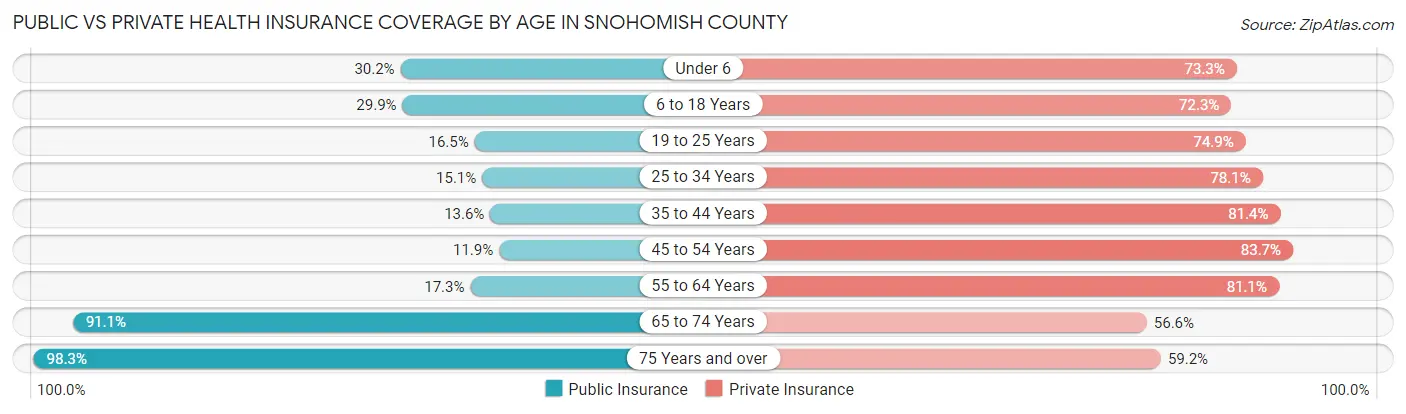
| Age Bracket | Public Insurance | Private Insurance |
| Under 6 | 18,029 (30.2%) | 43,686 (73.3%) |
| 6 to 18 Years | 40,123 (29.9%) | 97,071 (72.3%) |
| 19 to 25 Years | 10,280 (16.5%) | 46,748 (74.9%) |
| 25 to 34 Years | 16,559 (15.1%) | 85,728 (78.1%) |
| 35 to 44 Years | 16,642 (13.6%) | 99,758 (81.4%) |
| 45 to 54 Years | 12,832 (11.9%) | 90,010 (83.7%) |
| 55 to 64 Years | 18,670 (17.3%) | 87,675 (81.1%) |
| 65 to 74 Years | 66,292 (91.1%) | 41,223 (56.6%) |
| 75 Years and over | 41,075 (98.3%) | 24,747 (59.2%) |
| Total | 240,502 (29.4%) | 616,646 (75.3%) |
Disability Status by Sex by Age in Snohomish County
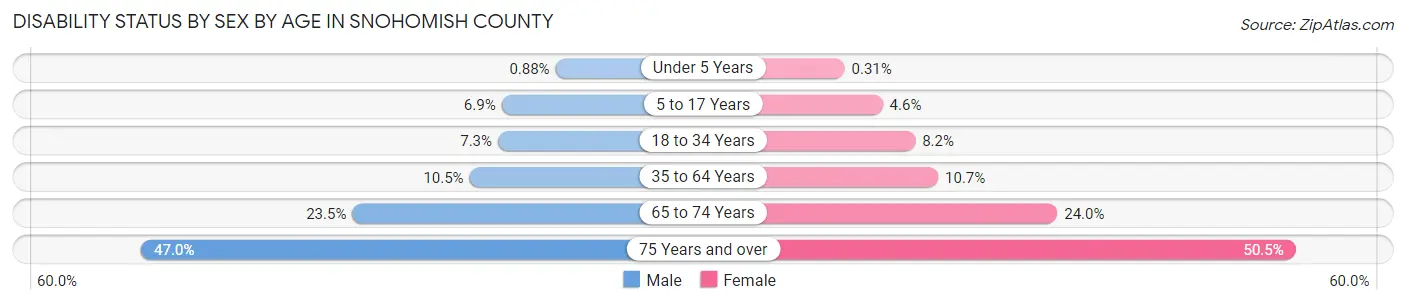
| Age Bracket | Male | Female |
| Under 5 Years | 228 (0.9%) | 76 (0.3%) |
| 5 to 17 Years | 4,743 (6.9%) | 2,968 (4.5%) |
| 18 to 34 Years | 6,711 (7.3%) | 7,334 (8.2%) |
| 35 to 64 Years | 18,041 (10.5%) | 17,778 (10.7%) |
| 65 to 74 Years | 8,106 (23.5%) | 9,197 (24.0%) |
| 75 Years and over | 8,232 (47.0%) | 12,263 (50.5%) |
Disability Class by Sex by Age in Snohomish County
Disability Class: Hearing Difficulty
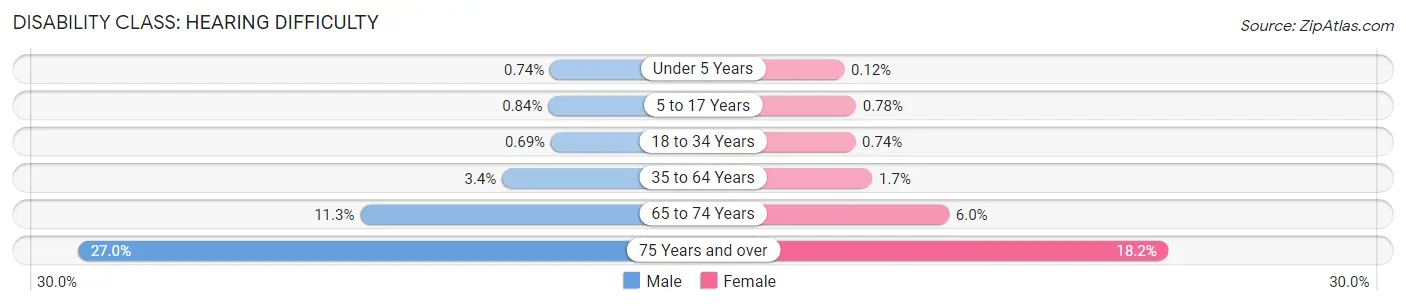
| Age Bracket | Male | Female |
| Under 5 Years | 192 (0.7%) | 30 (0.1%) |
| 5 to 17 Years | 579 (0.8%) | 510 (0.8%) |
| 18 to 34 Years | 631 (0.7%) | 663 (0.7%) |
| 35 to 64 Years | 5,889 (3.4%) | 2,807 (1.7%) |
| 65 to 74 Years | 3,898 (11.3%) | 2,282 (6.0%) |
| 75 Years and over | 4,733 (27.0%) | 4,417 (18.2%) |
Disability Class: Vision Difficulty
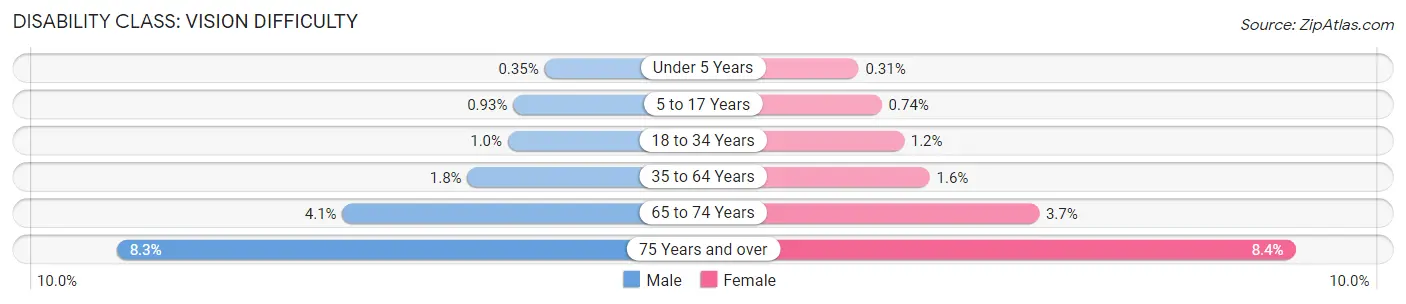
| Age Bracket | Male | Female |
| Under 5 Years | 91 (0.4%) | 76 (0.3%) |
| 5 to 17 Years | 641 (0.9%) | 481 (0.7%) |
| 18 to 34 Years | 952 (1.0%) | 1,030 (1.1%) |
| 35 to 64 Years | 3,065 (1.8%) | 2,707 (1.6%) |
| 65 to 74 Years | 1,415 (4.1%) | 1,404 (3.7%) |
| 75 Years and over | 1,452 (8.3%) | 2,043 (8.4%) |
Disability Class: Cognitive Difficulty
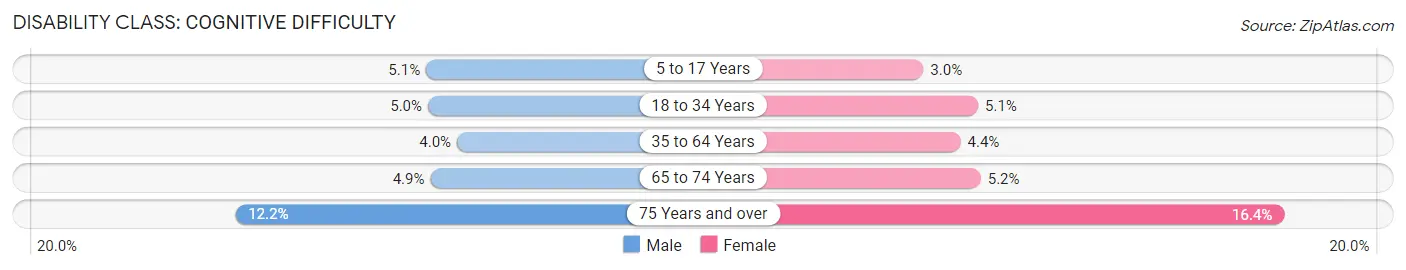
| Age Bracket | Male | Female |
| 5 to 17 Years | 3,511 (5.1%) | 1,976 (3.0%) |
| 18 to 34 Years | 4,633 (5.0%) | 4,537 (5.1%) |
| 35 to 64 Years | 6,810 (4.0%) | 7,304 (4.4%) |
| 65 to 74 Years | 1,702 (4.9%) | 1,976 (5.2%) |
| 75 Years and over | 2,133 (12.2%) | 3,985 (16.4%) |
Disability Class: Ambulatory Difficulty
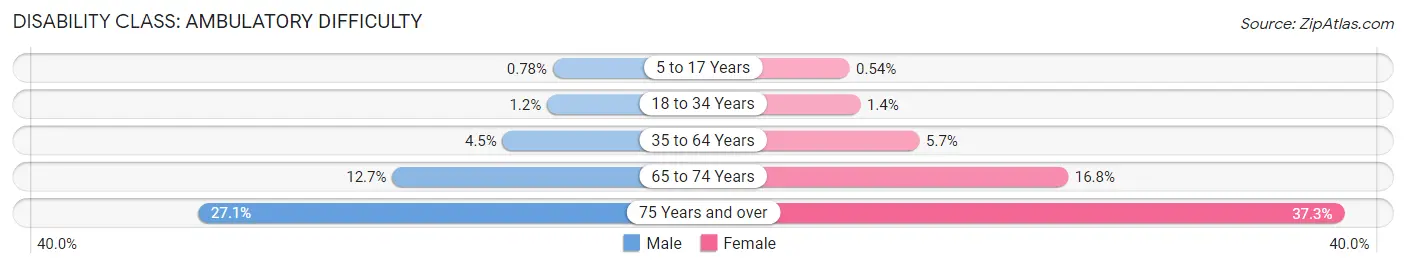
| Age Bracket | Male | Female |
| 5 to 17 Years | 535 (0.8%) | 350 (0.5%) |
| 18 to 34 Years | 1,116 (1.2%) | 1,212 (1.3%) |
| 35 to 64 Years | 7,780 (4.5%) | 9,514 (5.7%) |
| 65 to 74 Years | 4,378 (12.7%) | 6,428 (16.8%) |
| 75 Years and over | 4,749 (27.1%) | 9,052 (37.3%) |
Disability Class: Self-Care Difficulty
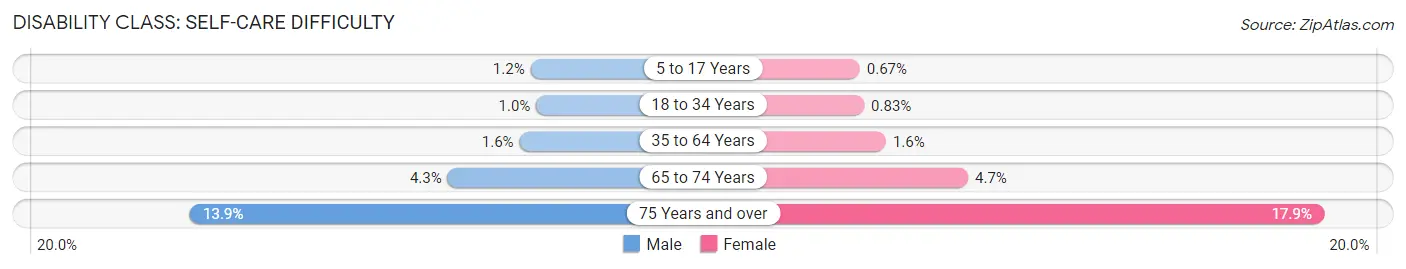
| Age Bracket | Male | Female |
| 5 to 17 Years | 841 (1.2%) | 434 (0.7%) |
| 18 to 34 Years | 926 (1.0%) | 740 (0.8%) |
| 35 to 64 Years | 2,818 (1.6%) | 2,710 (1.6%) |
| 65 to 74 Years | 1,484 (4.3%) | 1,799 (4.7%) |
| 75 Years and over | 2,427 (13.9%) | 4,343 (17.9%) |
Technology Access in Snohomish County
Computing Device Access in Snohomish County
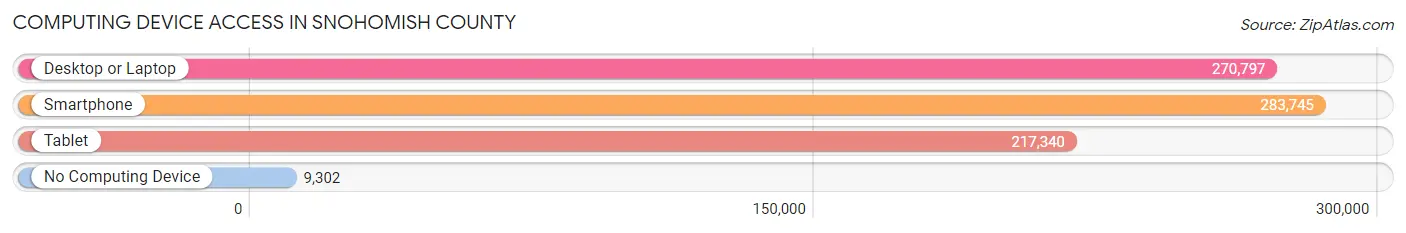
| Device Type | # Households | % Households |
| Desktop or Laptop | 270,797 | 88.0% |
| Smartphone | 283,745 | 92.2% |
| Tablet | 217,340 | 70.7% |
| No Computing Device | 9,302 | 3.0% |
| Total | 307,643 | 100.0% |
Internet Access in Snohomish County
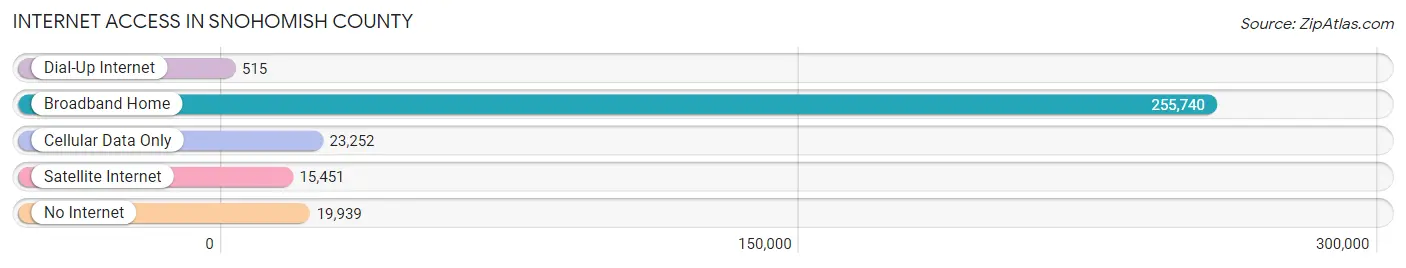
| Internet Type | # Households | % Households |
| Dial-Up Internet | 515 | 0.2% |
| Broadband Home | 255,740 | 83.1% |
| Cellular Data Only | 23,252 | 7.6% |
| Satellite Internet | 15,451 | 5.0% |
| No Internet | 19,939 | 6.5% |
| Total | 307,643 | 100.0% |
Snohomish County Summary
Snohomish County, Washington is located in the northwest corner of the state, just north of Seattle and east of the Puget Sound. It is the third most populous county in the state, with an estimated population of 822,083 in 2019. The county seat is Everett, the largest city in the county.
History
The area that is now Snohomish County was inhabited by the Snohomish, Snoqualmie, and Skykomish Native American tribes for thousands of years before the arrival of European settlers. The first recorded European exploration of the area was by George Vancouver in 1792. The first permanent settlement was established in 1858 by Henry Hewitt Jr., who established a sawmill near present-day Everett.
The county was officially established in 1861 and was named after the Snohomish tribe. The county seat was moved to Everett in 1897. The county experienced rapid growth in the late 19th and early 20th centuries, due to the logging and fishing industries. The county also became a major center for aircraft manufacturing during World War II.
Geography
Snohomish County covers an area of 2,196 square miles, making it the second largest county in the state. It is bordered by King County to the south, Skagit County to the north, and Island County to the west. The Cascade Mountains run through the northern part of the county, while the Olympic Mountains are located in the western part. The county is home to several rivers, including the Snohomish, Skykomish, and Stillaguamish.
The county is divided into several distinct geographic regions. The western part of the county is dominated by the Cascade Mountains, while the eastern part is mostly flat and is home to the cities of Everett, Marysville, and Lake Stevens. The northern part of the county is home to the Snohomish River Valley, while the southern part is home to the Puget Sound.
Economy
Snohomish County has a diverse economy, with a mix of manufacturing, technology, and service industries. The county is home to several major employers, including Boeing, Microsoft, and Amazon. The county is also home to several military bases, including Naval Station Everett and Joint Base Lewis-McChord.
The county is also home to several agricultural industries, including dairy farming, fruit and vegetable production, and livestock. The county is also home to several wineries and breweries.
Demographics
As of 2019, Snohomish County had an estimated population of 822,083. The population is fairly diverse, with the largest racial/ethnic groups being White (71.2%), Hispanic or Latino (14.2%), Asian (7.3%), and African American (3.2%). The median household income is $77,845, and the median home value is $420,000.
Snohomish County is home to several major cities, including Everett, Marysville, and Lake Stevens. The county is also home to several smaller towns, including Snohomish, Monroe, and Stanwood. The county is served by several school districts, including the Everett Public Schools, Marysville Public Schools, and Lake Stevens School District.
Common Questions
What is the Total Population of Snohomish County?
Total Population of Snohomish County is 828,337.
What is the Total Male Population of Snohomish County?
Total Male Population of Snohomish County is 418,342.
What is the Total Female Population of Snohomish County?
Total Female Population of Snohomish County is 409,995.
What is the Ratio of Males per 100 Females in Snohomish County?
There are 102.04 Males per 100 Females in Snohomish County.
What is the Ratio of Females per 100 Males in Snohomish County?
There are 98.00 Females per 100 Males in Snohomish County.
What is the Median Population Age in Snohomish County?
Median Population Age in Snohomish County is 38.3 Years.
What is the Average Family Size in Snohomish County
Average Family Size in Snohomish County is 3.1 People.
What is the Average Household Size in Snohomish County
Average Household Size in Snohomish County is 2.7 People.
What is Per Capita Income in Snohomish County?
Per Capita income in Snohomish County is $49,215.
What is the Median Family Income in Snohomish County?
Median Family Income in Snohomish County is $121,379.
What is the Median Household income in Snohomish County?
Median Household Income in Snohomish County is $104,083.
What is Income or Wage Gap in Snohomish County?
Income or Wage Gap in Snohomish County is 33.0%.
Women in Snohomish County earn 67.0 cents for every dollar earned by a man.
What is Family Income Deficit in Snohomish County?
Family Income Deficit in Snohomish County is $11,662.
Families that are below poverty line in Snohomish County earn $11,662 less on average than the poverty threshold level.
What is Inequality or Gini Index in Snohomish County?
Inequality or Gini Index in Snohomish County is 0.42.
How Large is the Labor Force in Snohomish County?
There are 447,998 People in the Labor Forcein in Snohomish County.
What is the Percentage of People in the Labor Force in Snohomish County?
67.4% of People are in the Labor Force in Snohomish County.
What is the Unemployment Rate in Snohomish County?
Unemployment Rate in Snohomish County is 4.4%.