Skagit County, WA
Skagit County Overview
129,480
TOTAL POPULATION
64,614
MALE POPULATION
64,866
FEMALE POPULATION
99.61
MALES / 100 FEMALES
100.39
FEMALES / 100 MALES
41.5
MEDIAN AGE
3.0
AVG FAMILY SIZE
2.5
AVG HOUSEHOLD SIZE
$41,191
PER CAPITA INCOME
$94,291
AVG FAMILY INCOME
$82,029
AVG HOUSEHOLD INCOME
33.4%
WAGE / INCOME GAP [ % ]
66.6¢/ $1
WAGE / INCOME GAP [ $ ]
$12,512
FAMILY INCOME DEFICIT
0.44
INEQUALITY / GINI INDEX
62,127
LABOR FORCE [ PEOPLE ]
59.0%
PERCENT IN LABOR FORCE
5.1%
UNEMPLOYMENT RATE
Skagit County Area Codes
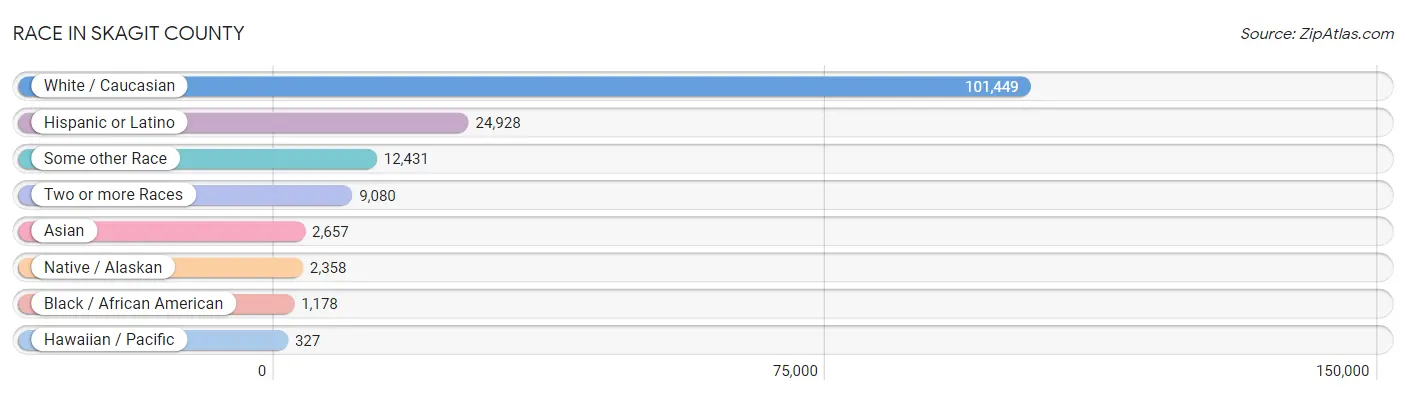
Race in Skagit County
The most populous races in Skagit County are White / Caucasian (101,449 | 78.3%), Hispanic or Latino (24,928 | 19.3%), and Some other Race (12,431 | 9.6%).
| Race | # Population | % Population |
| Asian | 2,657 | 2.1% |
| Black / African American | 1,178 | 0.9% |
| Hawaiian / Pacific | 327 | 0.3% |
| Hispanic or Latino | 24,928 | 19.3% |
| Native / Alaskan | 2,358 | 1.8% |
| White / Caucasian | 101,449 | 78.3% |
| Two or more Races | 9,080 | 7.0% |
| Some other Race | 12,431 | 9.6% |
| Total | 129,480 | 100.0% |
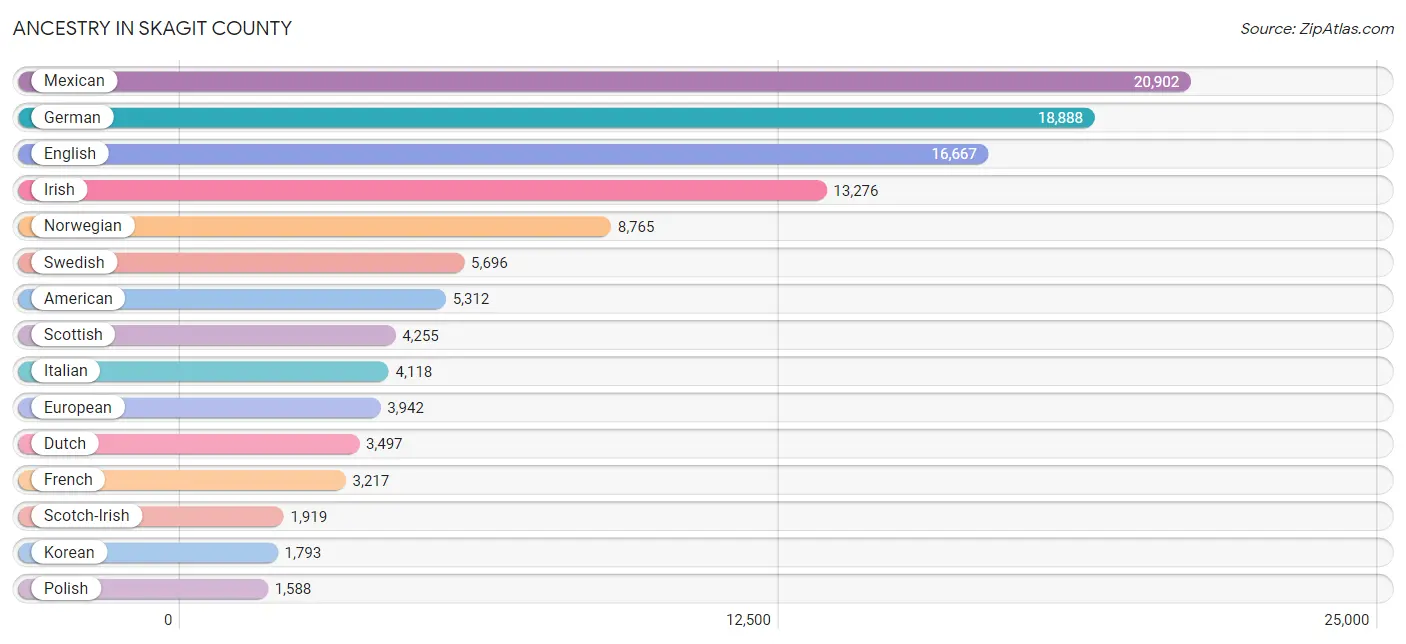
Ancestry in Skagit County
The most populous ancestries reported in Skagit County are Mexican (20,902 | 16.1%), German (18,888 | 14.6%), English (16,667 | 12.9%), Irish (13,276 | 10.2%), and Norwegian (8,765 | 6.8%), together accounting for 60.6% of all Skagit County residents.
| Ancestry | # Population | % Population |
| African | 168 | 0.1% |
| Alaska Native | 25 | 0.0% |
| Alaskan Athabascan | 109 | 0.1% |
| Albanian | 38 | 0.0% |
| Aleut | 44 | 0.0% |
| American | 5,312 | 4.1% |
| Apache | 222 | 0.2% |
| Arab | 311 | 0.2% |
| Argentinean | 32 | 0.0% |
| Armenian | 19 | 0.0% |
| Assyrian / Chaldean / Syriac | 7 | 0.0% |
| Australian | 194 | 0.2% |
| Austrian | 174 | 0.1% |
| Bahamian | 3 | 0.0% |
| Bangladeshi | 34 | 0.0% |
| Barbadian | 8 | 0.0% |
| Basque | 83 | 0.1% |
| Belgian | 132 | 0.1% |
| Bhutanese | 529 | 0.4% |
| Blackfeet | 193 | 0.2% |
| Bolivian | 3 | 0.0% |
| Brazilian | 20 | 0.0% |
| British | 1,486 | 1.1% |
| Bulgarian | 45 | 0.0% |
| Burmese | 268 | 0.2% |
| Cajun | 16 | 0.0% |
| Canadian | 701 | 0.5% |
| Celtic | 49 | 0.0% |
| Central American | 1,054 | 0.8% |
| Central American Indian | 106 | 0.1% |
| Cherokee | 377 | 0.3% |
| Cheyenne | 5 | 0.0% |
| Chickasaw | 44 | 0.0% |
| Chilean | 67 | 0.1% |
| Chinese | 7 | 0.0% |
| Chippewa | 120 | 0.1% |
| Choctaw | 174 | 0.1% |
| Colombian | 271 | 0.2% |
| Colville | 101 | 0.1% |
| Comanche | 5 | 0.0% |
| Costa Rican | 152 | 0.1% |
| Cree | 9 | 0.0% |
| Creek | 117 | 0.1% |
| Croatian | 311 | 0.2% |
| Crow | 4 | 0.0% |
| Cuban | 276 | 0.2% |
| Czech | 387 | 0.3% |
| Czechoslovakian | 193 | 0.2% |
| Danish | 1,277 | 1.0% |
| Delaware | 4 | 0.0% |
| Dominican | 1 | 0.0% |
| Dutch | 3,497 | 2.7% |
| Dutch West Indian | 1 | 0.0% |
| Eastern European | 300 | 0.2% |
| Ecuadorian | 115 | 0.1% |
| Egyptian | 58 | 0.0% |
| English | 16,667 | 12.9% |
| Estonian | 12 | 0.0% |
| European | 3,942 | 3.0% |
| Fijian | 8 | 0.0% |
| Filipino | 81 | 0.1% |
| Finnish | 771 | 0.6% |
| French | 3,217 | 2.5% |
| French American Indian | 60 | 0.1% |
| French Canadian | 817 | 0.6% |
| German | 18,888 | 14.6% |
| German Russian | 2 | 0.0% |
| Ghanaian | 5 | 0.0% |
| Greek | 291 | 0.2% |
| Guamanian / Chamorro | 239 | 0.2% |
| Guatemalan | 379 | 0.3% |
| Haitian | 68 | 0.1% |
| Honduran | 159 | 0.1% |
| Hungarian | 354 | 0.3% |
| Icelander | 165 | 0.1% |
| Indian (Asian) | 1,052 | 0.8% |
| Inupiat | 54 | 0.0% |
| Iranian | 87 | 0.1% |
| Iraqi | 7 | 0.0% |
| Irish | 13,276 | 10.2% |
| Iroquois | 78 | 0.1% |
| Israeli | 16 | 0.0% |
| Italian | 4,118 | 3.2% |
| Jamaican | 8 | 0.0% |
| Japanese | 42 | 0.0% |
| Kenyan | 8 | 0.0% |
| Korean | 1,793 | 1.4% |
| Laotian | 48 | 0.0% |
| Latvian | 10 | 0.0% |
| Lebanese | 57 | 0.0% |
| Liberian | 3 | 0.0% |
| Lithuanian | 124 | 0.1% |
| Malaysian | 45 | 0.0% |
| Maltese | 21 | 0.0% |
| Marshallese | 2 | 0.0% |
| Menominee | 113 | 0.1% |
| Mexican | 20,902 | 16.1% |
| Mexican American Indian | 372 | 0.3% |
| Moroccan | 12 | 0.0% |
| Native Hawaiian | 278 | 0.2% |
| Navajo | 19 | 0.0% |
| New Zealander | 4 | 0.0% |
| Nicaraguan | 74 | 0.1% |
| Nigerian | 85 | 0.1% |
| Northern European | 846 | 0.6% |
| Norwegian | 8,765 | 6.8% |
| Okinawan | 2 | 0.0% |
| Osage | 18 | 0.0% |
| Pakistani | 60 | 0.1% |
| Palestinian | 21 | 0.0% |
| Panamanian | 58 | 0.0% |
| Pennsylvania German | 5 | 0.0% |
| Peruvian | 34 | 0.0% |
| Polish | 1,588 | 1.2% |
| Portuguese | 264 | 0.2% |
| Potawatomi | 69 | 0.1% |
| Pueblo | 29 | 0.0% |
| Puerto Rican | 800 | 0.6% |
| Puget Sound Salish | 972 | 0.7% |
| Romanian | 85 | 0.1% |
| Russian | 1,240 | 1.0% |
| Salvadoran | 232 | 0.2% |
| Samoan | 51 | 0.0% |
| Scandinavian | 1,569 | 1.2% |
| Scotch-Irish | 1,919 | 1.5% |
| Scottish | 4,255 | 3.3% |
| Seminole | 2 | 0.0% |
| Serbian | 9 | 0.0% |
| Shoshone | 52 | 0.0% |
| Sioux | 103 | 0.1% |
| Slavic | 55 | 0.0% |
| Slovak | 58 | 0.0% |
| Slovene | 32 | 0.0% |
| South African | 10 | 0.0% |
| South American | 626 | 0.5% |
| South American Indian | 5 | 0.0% |
| Spaniard | 453 | 0.4% |
| Spanish | 199 | 0.2% |
| Sri Lankan | 188 | 0.2% |
| Subsaharan African | 293 | 0.2% |
| Sudanese | 2 | 0.0% |
| Swedish | 5,696 | 4.4% |
| Swiss | 703 | 0.5% |
| Syrian | 10 | 0.0% |
| Thai | 163 | 0.1% |
| Tlingit-Haida | 112 | 0.1% |
| Tongan | 31 | 0.0% |
| Tsimshian | 8 | 0.0% |
| Turkish | 6 | 0.0% |
| Ukrainian | 521 | 0.4% |
| Venezuelan | 26 | 0.0% |
| Welsh | 1,432 | 1.1% |
| Yakama | 133 | 0.1% |
| Yaqui | 37 | 0.0% |
| Yugoslavian | 104 | 0.1% |
| Yup'ik | 2 | 0.0% | View All 156 Rows |
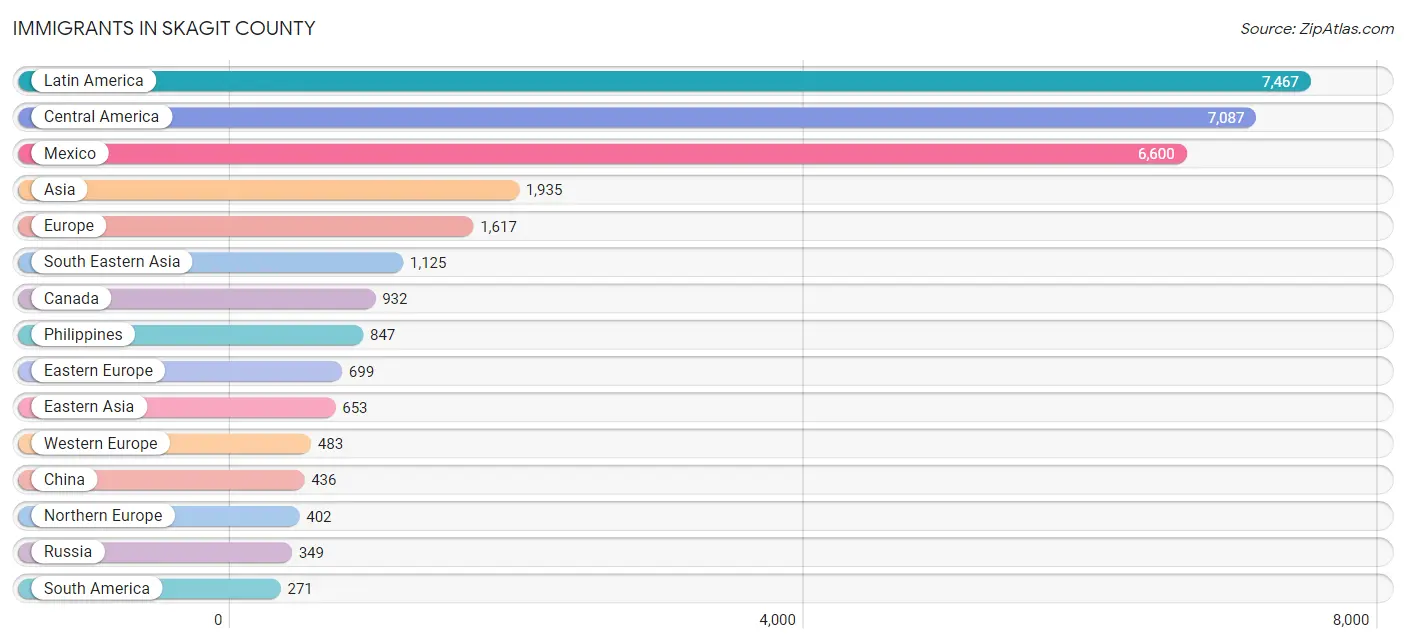
Immigrants in Skagit County
The most numerous immigrant groups reported in Skagit County came from Latin America (7,467 | 5.8%), Central America (7,087 | 5.5%), Mexico (6,600 | 5.1%), Asia (1,935 | 1.5%), and Europe (1,617 | 1.3%), together accounting for 19.1% of all Skagit County residents.
| Immigration Origin | # Population | % Population |
| Africa | 142 | 0.1% |
| Albania | 13 | 0.0% |
| Argentina | 29 | 0.0% |
| Asia | 1,935 | 1.5% |
| Australia | 82 | 0.1% |
| Austria | 4 | 0.0% |
| Belarus | 46 | 0.0% |
| Belgium | 11 | 0.0% |
| Brazil | 62 | 0.1% |
| Bulgaria | 33 | 0.0% |
| Cambodia | 39 | 0.0% |
| Canada | 932 | 0.7% |
| Caribbean | 109 | 0.1% |
| Central America | 7,087 | 5.5% |
| Chile | 15 | 0.0% |
| China | 436 | 0.3% |
| Colombia | 87 | 0.1% |
| Costa Rica | 123 | 0.1% |
| Croatia | 9 | 0.0% |
| Cuba | 75 | 0.1% |
| Czechoslovakia | 8 | 0.0% |
| Denmark | 7 | 0.0% |
| Eastern Africa | 35 | 0.0% |
| Eastern Asia | 653 | 0.5% |
| Eastern Europe | 699 | 0.5% |
| Ecuador | 34 | 0.0% |
| Egypt | 27 | 0.0% |
| El Salvador | 49 | 0.0% |
| England | 165 | 0.1% |
| Europe | 1,617 | 1.3% |
| France | 22 | 0.0% |
| Germany | 180 | 0.1% |
| Ghana | 5 | 0.0% |
| Greece | 13 | 0.0% |
| Guatemala | 237 | 0.2% |
| Haiti | 2 | 0.0% |
| Honduras | 56 | 0.0% |
| Hong Kong | 62 | 0.1% |
| Hungary | 4 | 0.0% |
| India | 59 | 0.1% |
| Indonesia | 6 | 0.0% |
| Iran | 14 | 0.0% |
| Ireland | 24 | 0.0% |
| Israel | 2 | 0.0% |
| Italy | 15 | 0.0% |
| Jamaica | 8 | 0.0% |
| Japan | 72 | 0.1% |
| Jordan | 3 | 0.0% |
| Kenya | 35 | 0.0% |
| Korea | 145 | 0.1% |
| Laos | 45 | 0.0% |
| Latin America | 7,467 | 5.8% |
| Lebanon | 19 | 0.0% |
| Malaysia | 9 | 0.0% |
| Mexico | 6,600 | 5.1% |
| Moldova | 2 | 0.0% |
| Morocco | 14 | 0.0% |
| Netherlands | 236 | 0.2% |
| Nigeria | 41 | 0.0% |
| Northern Africa | 41 | 0.0% |
| Northern Europe | 402 | 0.3% |
| Norway | 53 | 0.0% |
| Oceania | 97 | 0.1% |
| Pakistan | 32 | 0.0% |
| Panama | 22 | 0.0% |
| Peru | 40 | 0.0% |
| Philippines | 847 | 0.6% |
| Poland | 23 | 0.0% |
| Romania | 8 | 0.0% |
| Russia | 349 | 0.3% |
| Saudi Arabia | 2 | 0.0% |
| Scotland | 37 | 0.0% |
| Singapore | 2 | 0.0% |
| South Africa | 14 | 0.0% |
| South America | 271 | 0.2% |
| South Central Asia | 119 | 0.1% |
| South Eastern Asia | 1,125 | 0.9% |
| Southern Europe | 30 | 0.0% |
| Spain | 2 | 0.0% |
| Sri Lanka | 14 | 0.0% |
| Sweden | 11 | 0.0% |
| Switzerland | 30 | 0.0% |
| Taiwan | 33 | 0.0% |
| Thailand | 54 | 0.0% |
| Trinidad and Tobago | 24 | 0.0% |
| Turkey | 2 | 0.0% |
| Ukraine | 169 | 0.1% |
| Venezuela | 4 | 0.0% |
| Vietnam | 123 | 0.1% |
| Western Africa | 46 | 0.0% |
| Western Asia | 28 | 0.0% |
| Western Europe | 483 | 0.4% | View All 92 Rows |
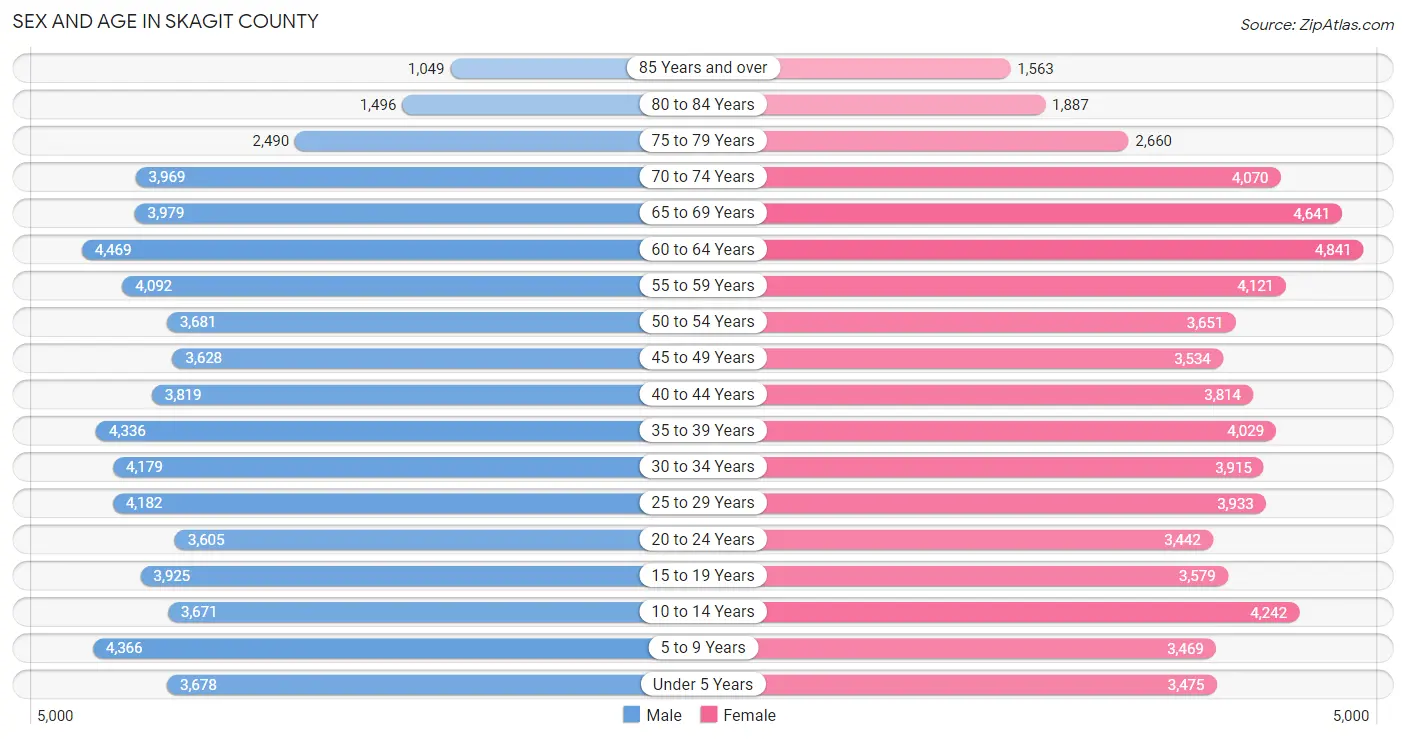
Sex and Age in Skagit County
Sex and Age in Skagit County
The most populous age groups in Skagit County are 60 to 64 Years (4,469 | 6.9%) for men and 60 to 64 Years (4,841 | 7.5%) for women.
| Age Bracket | Male | Female |
| Under 5 Years | 3,678 (5.7%) | 3,475 (5.4%) |
| 5 to 9 Years | 4,366 (6.8%) | 3,469 (5.3%) |
| 10 to 14 Years | 3,671 (5.7%) | 4,242 (6.5%) |
| 15 to 19 Years | 3,925 (6.1%) | 3,579 (5.5%) |
| 20 to 24 Years | 3,605 (5.6%) | 3,442 (5.3%) |
| 25 to 29 Years | 4,182 (6.5%) | 3,933 (6.1%) |
| 30 to 34 Years | 4,179 (6.5%) | 3,915 (6.0%) |
| 35 to 39 Years | 4,336 (6.7%) | 4,029 (6.2%) |
| 40 to 44 Years | 3,819 (5.9%) | 3,814 (5.9%) |
| 45 to 49 Years | 3,628 (5.6%) | 3,534 (5.4%) |
| 50 to 54 Years | 3,681 (5.7%) | 3,651 (5.6%) |
| 55 to 59 Years | 4,092 (6.3%) | 4,121 (6.4%) |
| 60 to 64 Years | 4,469 (6.9%) | 4,841 (7.5%) |
| 65 to 69 Years | 3,979 (6.2%) | 4,641 (7.1%) |
| 70 to 74 Years | 3,969 (6.1%) | 4,070 (6.3%) |
| 75 to 79 Years | 2,490 (3.8%) | 2,660 (4.1%) |
| 80 to 84 Years | 1,496 (2.3%) | 1,887 (2.9%) |
| 85 Years and over | 1,049 (1.6%) | 1,563 (2.4%) |
| Total | 64,614 (100.0%) | 64,866 (100.0%) |
Families and Households in Skagit County
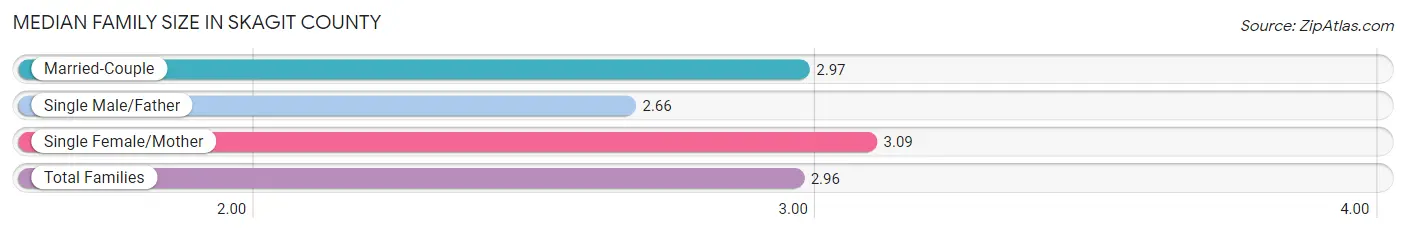
Median Family Size in Skagit County
The median family size in Skagit County is 2.96 persons per family, with single female/mother families (5,194 | 14.9%) accounting for the largest median family size of 3.09 persons per family. On the other hand, single male/father families (2,689 | 7.7%) represent the smallest median family size with 2.66 persons per family.
| Family Type | # Families | Family Size |
| Married-Couple | 26,861 (77.3%) | 2.97 |
| Single Male/Father | 2,689 (7.7%) | 2.66 |
| Single Female/Mother | 5,194 (14.9%) | 3.09 |
| Total Families | 34,744 (100.0%) | 2.96 |
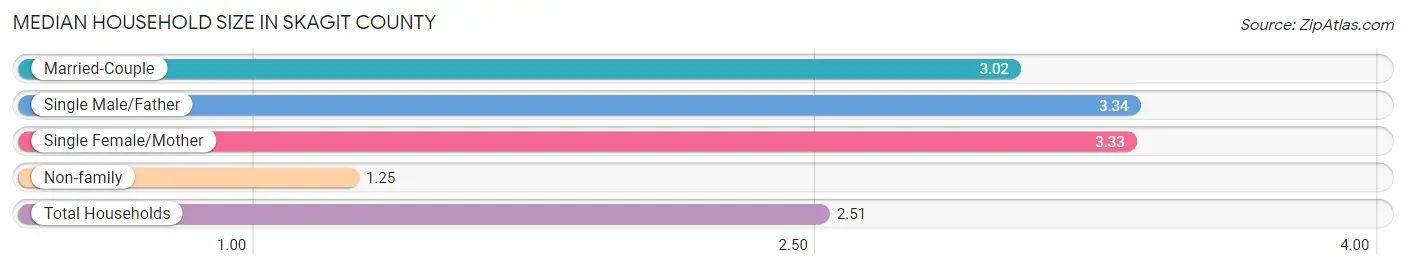
Median Household Size in Skagit County
The median household size in Skagit County is 2.51 persons per household, with single male/father households (2,689 | 5.3%) accounting for the largest median household size of 3.34 persons per household. non-family households (16,080 | 31.6%) represent the smallest median household size with 1.25 persons per household.
| Household Type | # Households | Household Size |
| Married-Couple | 26,861 (52.8%) | 3.02 |
| Single Male/Father | 2,689 (5.3%) | 3.34 |
| Single Female/Mother | 5,194 (10.2%) | 3.33 |
| Non-family | 16,080 (31.6%) | 1.25 |
| Total Households | 50,824 (100.0%) | 2.51 |
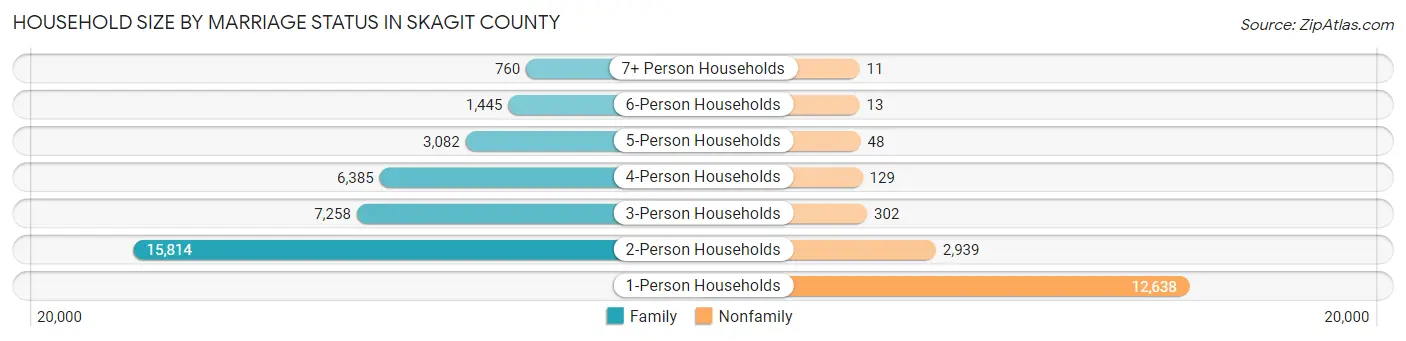
Household Size by Marriage Status in Skagit County
Out of a total of 50,824 households in Skagit County, 34,744 (68.4%) are family households, while 16,080 (31.6%) are nonfamily households. The most numerous type of family households are 2-person households, comprising 15,814, and the most common type of nonfamily households are 1-person households, comprising 12,638.
| Household Size | Family Households | Nonfamily Households |
| 1-Person Households | - | 12,638 (24.9%) |
| 2-Person Households | 15,814 (31.1%) | 2,939 (5.8%) |
| 3-Person Households | 7,258 (14.3%) | 302 (0.6%) |
| 4-Person Households | 6,385 (12.6%) | 129 (0.3%) |
| 5-Person Households | 3,082 (6.1%) | 48 (0.1%) |
| 6-Person Households | 1,445 (2.8%) | 13 (0.0%) |
| 7+ Person Households | 760 (1.5%) | 11 (0.0%) |
| Total | 34,744 (68.4%) | 16,080 (31.6%) |
Female Fertility in Skagit County
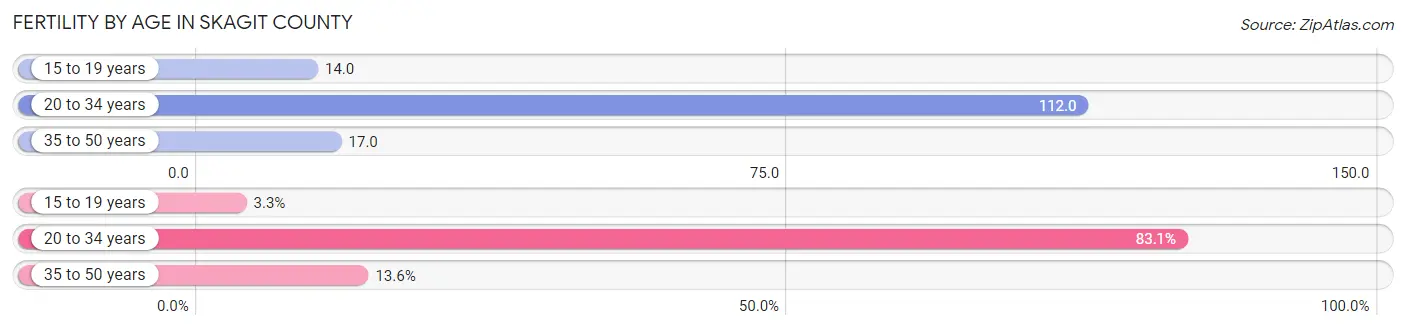
Fertility by Age in Skagit County
Average fertility rate in Skagit County is 57.0 births per 1,000 women. Women in the age bracket of 20 to 34 years have the highest fertility rate with 112.0 births per 1,000 women. Women in the age bracket of 20 to 34 years acount for 83.1% of all women with births.
| Age Bracket | Women with Births | Births / 1,000 Women |
| 15 to 19 years | 50 (3.3%) | 14.0 |
| 20 to 34 years | 1,270 (83.1%) | 112.0 |
| 35 to 50 years | 208 (13.6%) | 17.0 |
| Total | 1,528 (100.0%) | 57.0 |
Fertility by Age by Marriage Status in Skagit County
69.0% of women with births (1,528) in Skagit County are married. The highest percentage of unmarried women with births falls into 15 to 19 years age bracket with 100.0% of them unmarried at the time of birth, while the lowest percentage of unmarried women with births belong to 35 to 50 years age bracket with 4.8% of them unmarried.
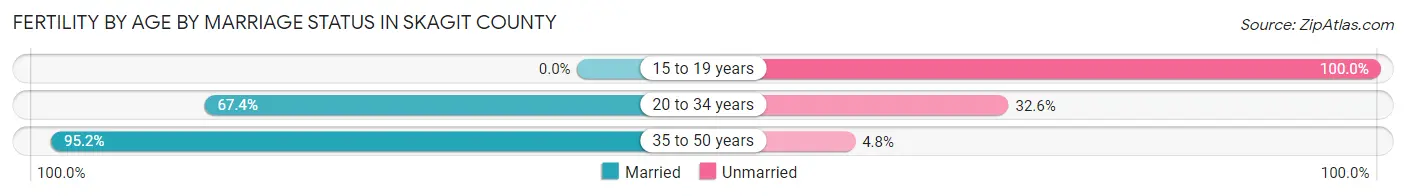
| Age Bracket | Married | Unmarried |
| 15 to 19 years | 0 (0.0%) | 50 (100.0%) |
| 20 to 34 years | 856 (67.4%) | 414 (32.6%) |
| 35 to 50 years | 198 (95.2%) | 10 (4.8%) |
| Total | 1,054 (69.0%) | 474 (31.0%) |
Fertility by Education in Skagit County
Average fertility rate in Skagit County is 57.0 births per 1,000 women. Women with the education attainment of graduate degree have the highest fertility rate of 98.0 births per 1,000 women, while women with the education attainment of less than high school have the lowest fertility at 24.0 births per 1,000 women. Women with the education attainment of high school diploma represent 33.8% of all women with births.
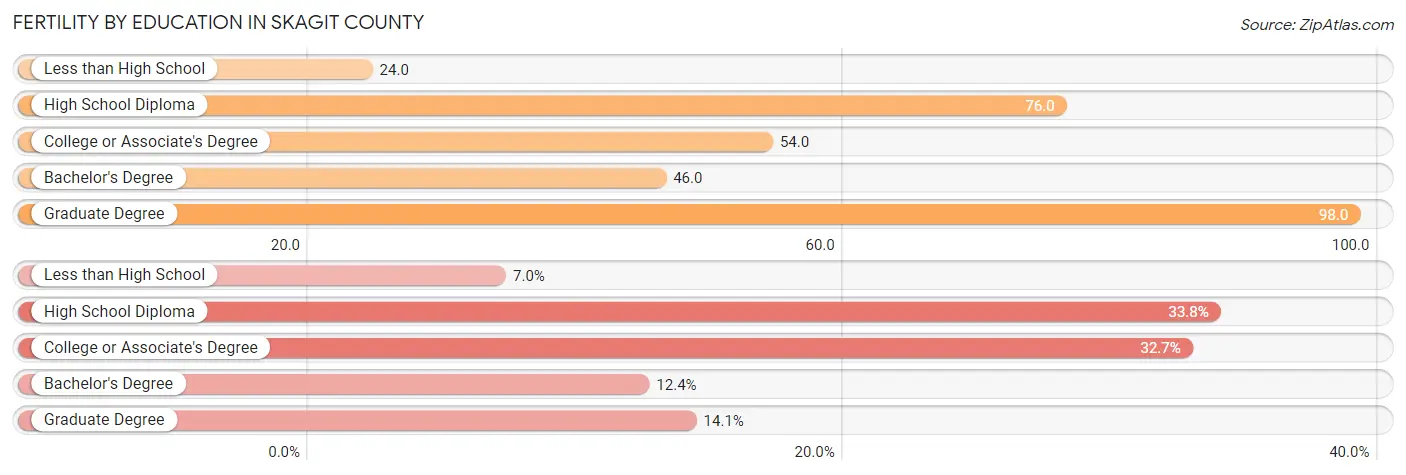
| Educational Attainment | Women with Births | Births / 1,000 Women |
| Less than High School | 107 (7.0%) | 24.0 |
| High School Diploma | 516 (33.8%) | 76.0 |
| College or Associate's Degree | 500 (32.7%) | 54.0 |
| Bachelor's Degree | 189 (12.4%) | 46.0 |
| Graduate Degree | 216 (14.1%) | 98.0 |
| Total | 1,528 (100.0%) | 57.0 |
Fertility by Education by Marriage Status in Skagit County
31.0% of women with births in Skagit County are unmarried. Women with the educational attainment of graduate degree are most likely to be married with 99.1% of them married at childbirth, while women with the educational attainment of high school diploma are least likely to be married with 58.0% of them unmarried at childbirth.
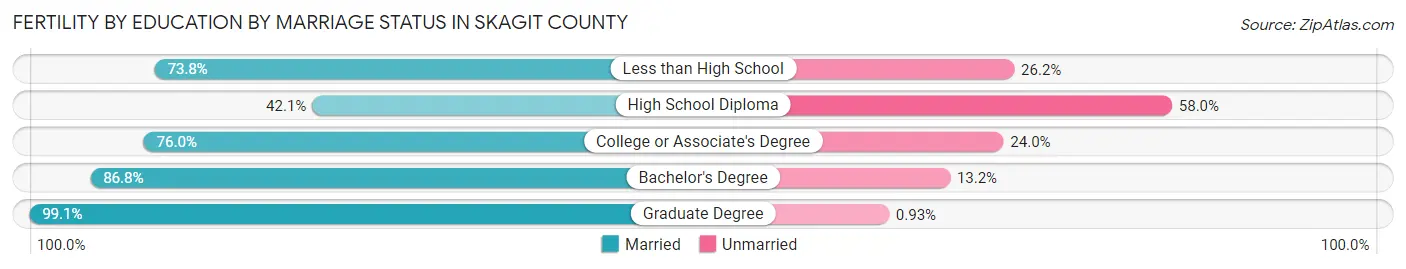
| Educational Attainment | Married | Unmarried |
| Less than High School | 79 (73.8%) | 28 (26.2%) |
| High School Diploma | 217 (42.0%) | 299 (58.0%) |
| College or Associate's Degree | 380 (76.0%) | 120 (24.0%) |
| Bachelor's Degree | 164 (86.8%) | 25 (13.2%) |
| Graduate Degree | 214 (99.1%) | 2 (0.9%) |
| Total | 1,054 (69.0%) | 474 (31.0%) |
Income in Skagit County
Income Overview in Skagit County
Per Capita Income in Skagit County is $41,191, while median incomes of families and households are $94,291 and $82,029 respectively.
| Characteristic | Number | Measure |
| Per Capita Income | 129,480 | $41,191 |
| Median Family Income | 34,744 | $94,291 |
| Mean Family Income | 34,744 | $117,164 |
| Median Household Income | 50,824 | $82,029 |
| Mean Household Income | 50,824 | $103,551 |
| Income Deficit | 34,744 | $12,512 |
| Wage / Income Gap (%) | 129,480 | 33.41% |
| Wage / Income Gap ($) | 129,480 | 66.59¢ per $1 |
| Gini / Inequality Index | 129,480 | 0.44 |
Earnings by Sex in Skagit County
Average Earnings in Skagit County are $44,391, $52,394 for men and $34,887 for women, a difference of 33.4%.
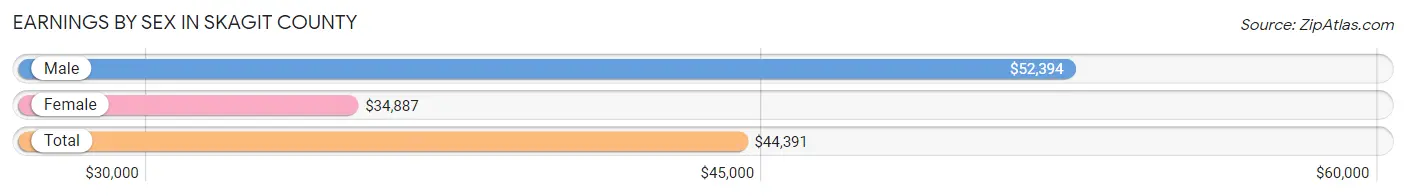
| Sex | Number | Average Earnings |
| Male | 35,478 (54.3%) | $52,394 |
| Female | 29,885 (45.7%) | $34,887 |
| Total | 65,363 (100.0%) | $44,391 |
Earnings by Sex by Income Bracket in Skagit County
The most common earnings brackets in Skagit County are $100,000+ for men (6,701 | 18.9%) and $100,000+ for women (2,786 | 9.3%).
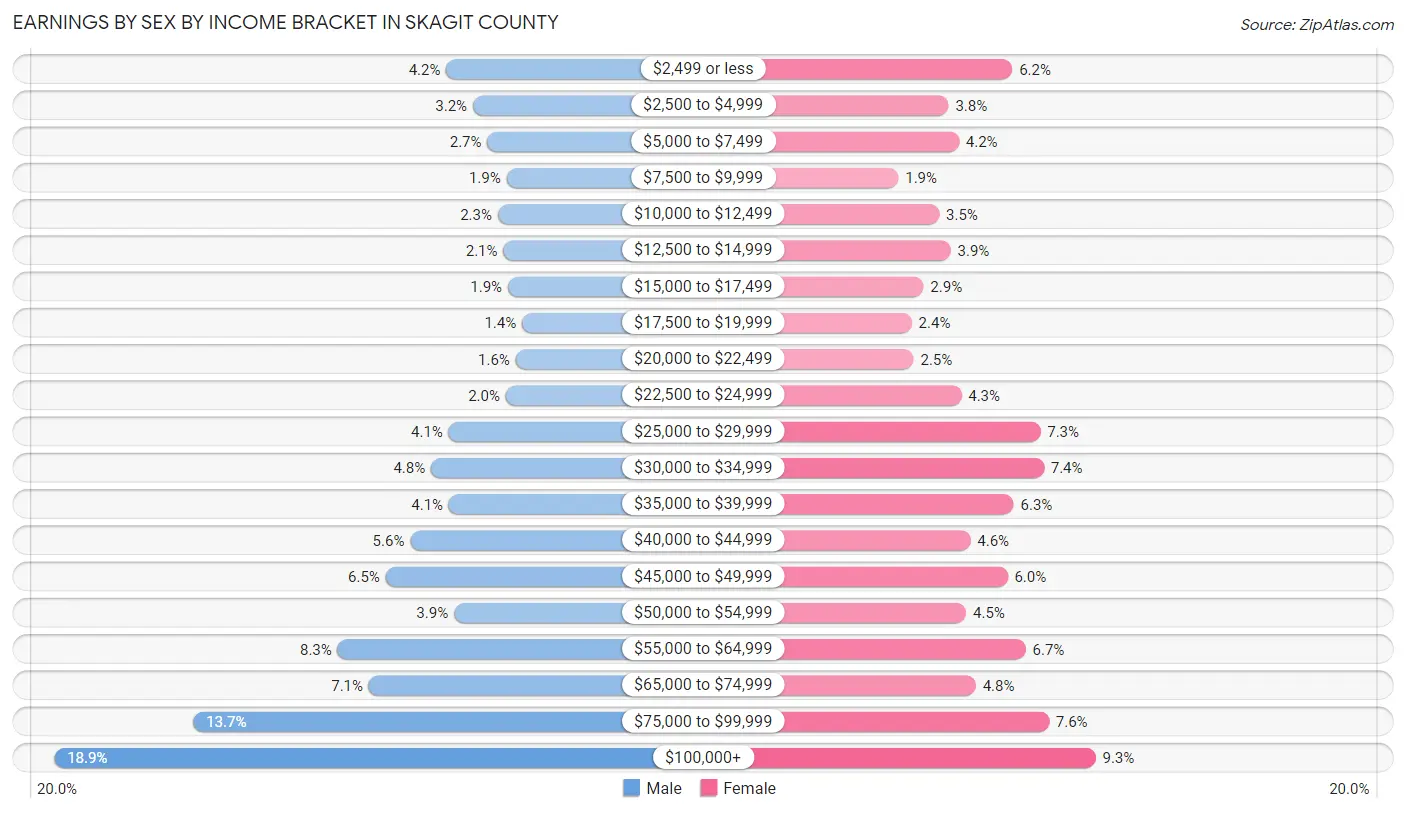
| Income | Male | Female |
| $2,499 or less | 1,489 (4.2%) | 1,853 (6.2%) |
| $2,500 to $4,999 | 1,136 (3.2%) | 1,139 (3.8%) |
| $5,000 to $7,499 | 943 (2.7%) | 1,255 (4.2%) |
| $7,500 to $9,999 | 688 (1.9%) | 578 (1.9%) |
| $10,000 to $12,499 | 804 (2.3%) | 1,035 (3.5%) |
| $12,500 to $14,999 | 731 (2.1%) | 1,163 (3.9%) |
| $15,000 to $17,499 | 669 (1.9%) | 857 (2.9%) |
| $17,500 to $19,999 | 482 (1.4%) | 725 (2.4%) |
| $20,000 to $22,499 | 569 (1.6%) | 747 (2.5%) |
| $22,500 to $24,999 | 700 (2.0%) | 1,282 (4.3%) |
| $25,000 to $29,999 | 1,458 (4.1%) | 2,166 (7.2%) |
| $30,000 to $34,999 | 1,694 (4.8%) | 2,207 (7.4%) |
| $35,000 to $39,999 | 1,455 (4.1%) | 1,869 (6.2%) |
| $40,000 to $44,999 | 1,968 (5.6%) | 1,383 (4.6%) |
| $45,000 to $49,999 | 2,297 (6.5%) | 1,799 (6.0%) |
| $50,000 to $54,999 | 1,388 (3.9%) | 1,337 (4.5%) |
| $55,000 to $64,999 | 2,933 (8.3%) | 2,001 (6.7%) |
| $65,000 to $74,999 | 2,520 (7.1%) | 1,442 (4.8%) |
| $75,000 to $99,999 | 4,853 (13.7%) | 2,261 (7.6%) |
| $100,000+ | 6,701 (18.9%) | 2,786 (9.3%) |
| Total | 35,478 (100.0%) | 29,885 (100.0%) |
Earnings by Sex by Educational Attainment in Skagit County
Average earnings in Skagit County are $58,885 for men and $39,509 for women, a difference of 32.9%. Men with an educational attainment of graduate degree enjoy the highest average annual earnings of $93,542, while those with less than high school education earn the least with $45,985. Women with an educational attainment of graduate degree earn the most with the average annual earnings of $73,808, while those with less than high school education have the smallest earnings of $25,324.
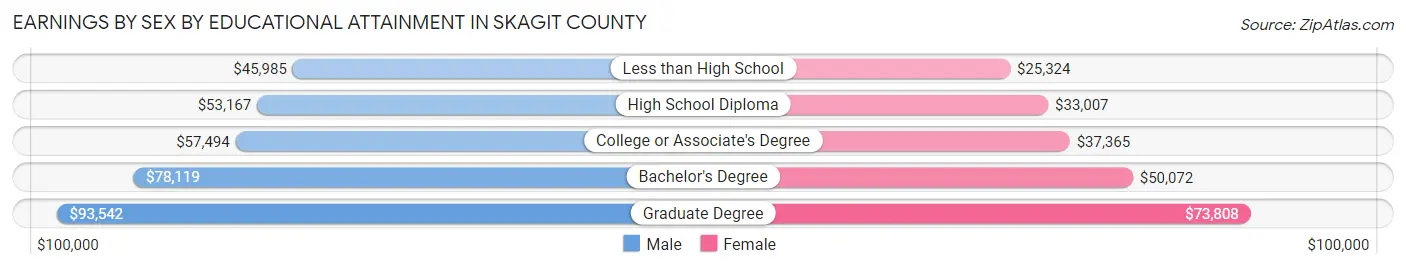
| Educational Attainment | Male Income | Female Income |
| Less than High School | $45,985 | $25,324 |
| High School Diploma | $53,167 | $33,007 |
| College or Associate's Degree | $57,494 | $37,365 |
| Bachelor's Degree | $78,119 | $50,072 |
| Graduate Degree | $93,542 | $73,808 |
| Total | $58,885 | $39,509 |
Family Income in Skagit County
Family Income Brackets in Skagit County
According to the Skagit County family income data, there are 7,678 families falling into the $100,000 to $149,999 income range, which is the most common income bracket and makes up 22.1% of all families. Conversely, the $10,000 to $14,999 income bracket is the least frequent group with only 417 families (1.2%) belonging to this category.
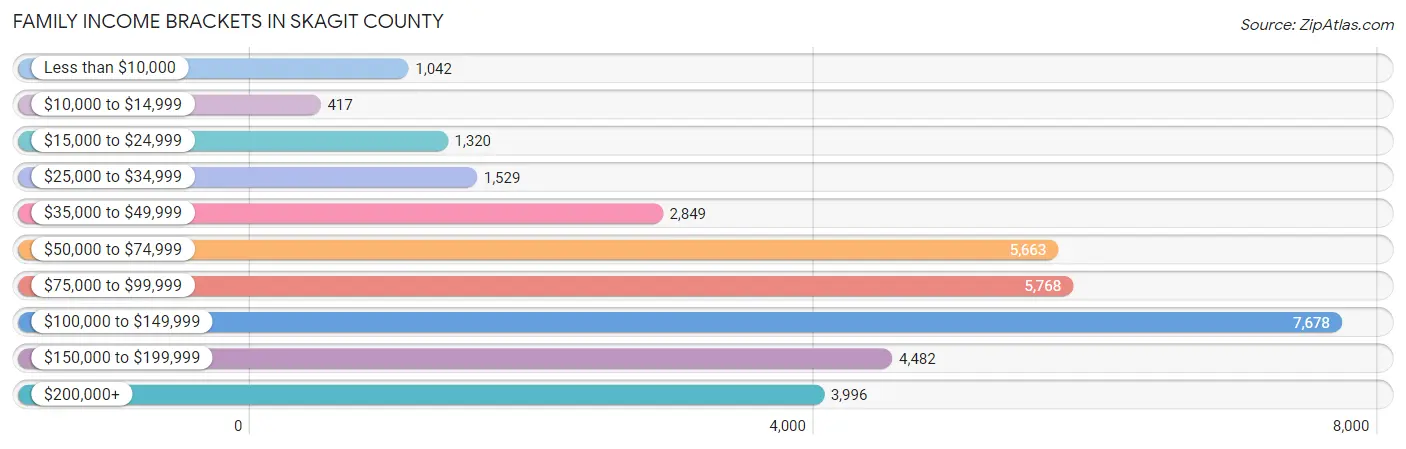
| Income Bracket | # Families | % Families |
| Less than $10,000 | 1,042 | 3.0% |
| $10,000 to $14,999 | 417 | 1.2% |
| $15,000 to $24,999 | 1,320 | 3.8% |
| $25,000 to $34,999 | 1,529 | 4.4% |
| $35,000 to $49,999 | 2,849 | 8.2% |
| $50,000 to $74,999 | 5,663 | 16.3% |
| $75,000 to $99,999 | 5,768 | 16.6% |
| $100,000 to $149,999 | 7,678 | 22.1% |
| $150,000 to $199,999 | 4,482 | 12.9% |
| $200,000+ | 3,996 | 11.5% |
Family Income by Famaliy Size in Skagit County
7+ person families (587 | 1.7%) account for the highest median family income in Skagit County with $115,179 per family, while 2-person families (17,189 | 49.5%) have the highest median income of $43,923 per family member.
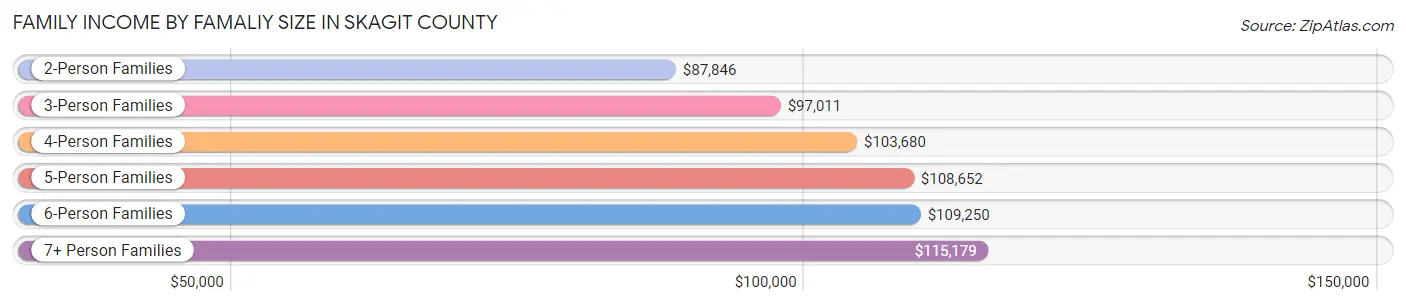
| Income Bracket | # Families | Median Income |
| 2-Person Families | 17,189 (49.5%) | $87,846 |
| 3-Person Families | 7,473 (21.5%) | $97,011 |
| 4-Person Families | 5,587 (16.1%) | $103,680 |
| 5-Person Families | 2,750 (7.9%) | $108,652 |
| 6-Person Families | 1,158 (3.3%) | $109,250 |
| 7+ Person Families | 587 (1.7%) | $115,179 |
| Total | 34,744 (100.0%) | $94,291 |
Family Income by Number of Earners in Skagit County
The median family income in Skagit County is $94,291, with families comprising 3+ earners (4,338) having the highest median family income of $142,902, while families with no earners (7,632) have the lowest median family income of $60,874, accounting for 12.5% and 22.0% of families, respectively.
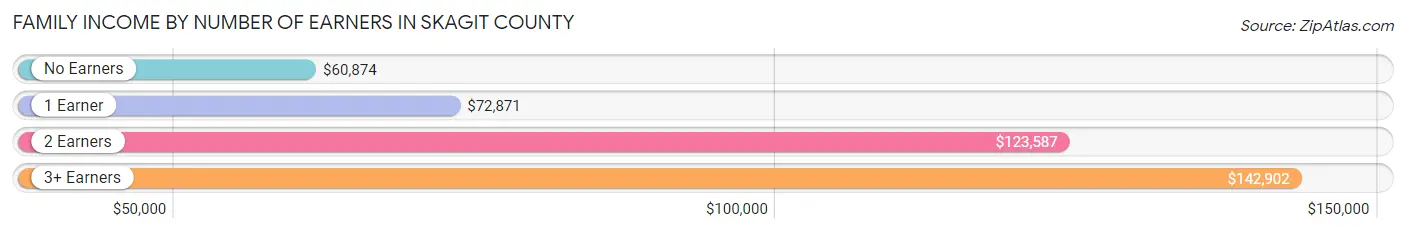
| Number of Earners | # Families | Median Income |
| No Earners | 7,632 (22.0%) | $60,874 |
| 1 Earner | 10,417 (30.0%) | $72,871 |
| 2 Earners | 12,357 (35.6%) | $123,587 |
| 3+ Earners | 4,338 (12.5%) | $142,902 |
| Total | 34,744 (100.0%) | $94,291 |
Household Income in Skagit County
Household Income Brackets in Skagit County
With 10,114 households falling in the category, the $100,000 to $149,999 income range is the most frequent in Skagit County, accounting for 19.9% of all households. In contrast, only 1,372 households (2.7%) fall into the $10,000 to $14,999 income bracket, making it the least populous group.
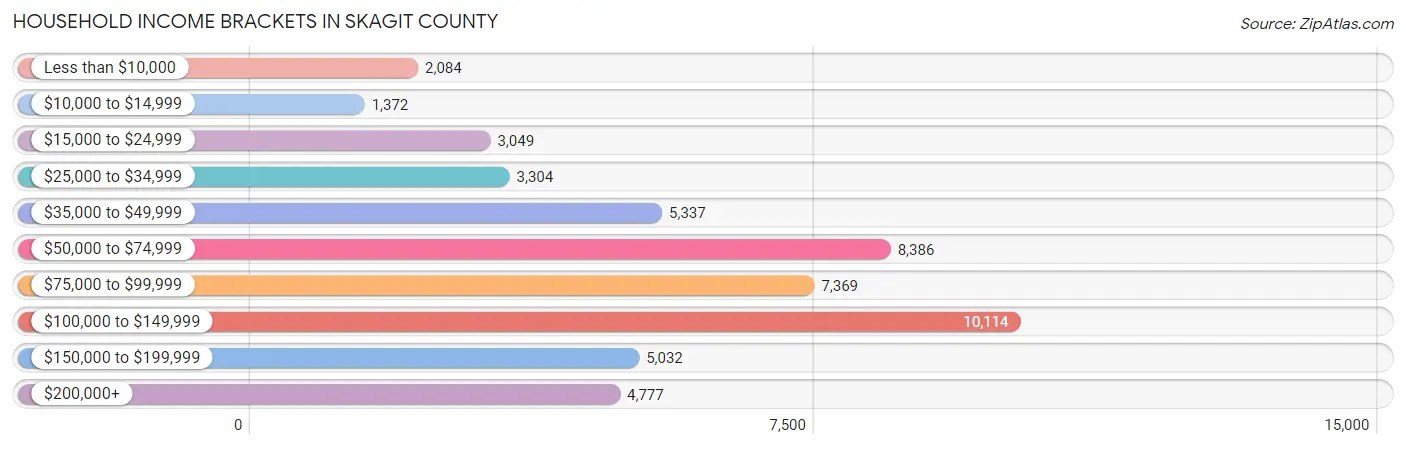
| Income Bracket | # Households | % Households |
| Less than $10,000 | 2,084 | 4.1% |
| $10,000 to $14,999 | 1,372 | 2.7% |
| $15,000 to $24,999 | 3,049 | 6.0% |
| $25,000 to $34,999 | 3,304 | 6.5% |
| $35,000 to $49,999 | 5,337 | 10.5% |
| $50,000 to $74,999 | 8,386 | 16.5% |
| $75,000 to $99,999 | 7,369 | 14.5% |
| $100,000 to $149,999 | 10,114 | 19.9% |
| $150,000 to $199,999 | 5,032 | 9.9% |
| $200,000+ | 4,777 | 9.4% |
Household Income by Householder Age in Skagit County
The median household income in Skagit County is $82,029, with the highest median household income of $97,374 found in the 45 to 64 years age bracket for the primary householder. A total of 17,591 households (34.6%) fall into this category. Meanwhile, the 15 to 24 years age bracket for the primary householder has the lowest median household income of $53,750, with 1,362 households (2.7%) in this group.
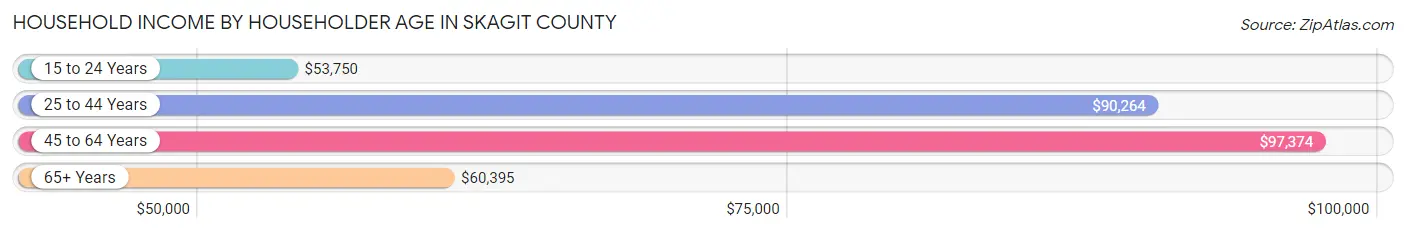
| Income Bracket | # Households | Median Income |
| 15 to 24 Years | 1,362 (2.7%) | $53,750 |
| 25 to 44 Years | 14,673 (28.9%) | $90,264 |
| 45 to 64 Years | 17,591 (34.6%) | $97,374 |
| 65+ Years | 17,198 (33.8%) | $60,395 |
| Total | 50,824 (100.0%) | $82,029 |
Poverty in Skagit County
Income Below Poverty by Sex and Age in Skagit County
With 10.7% poverty level for males and 13.3% for females among the residents of Skagit County, 15 year old males and 18 to 24 year old females are the most vulnerable to poverty, with 226 males (37.0%) and 1,124 females (24.6%) in their respective age groups living below the poverty level.
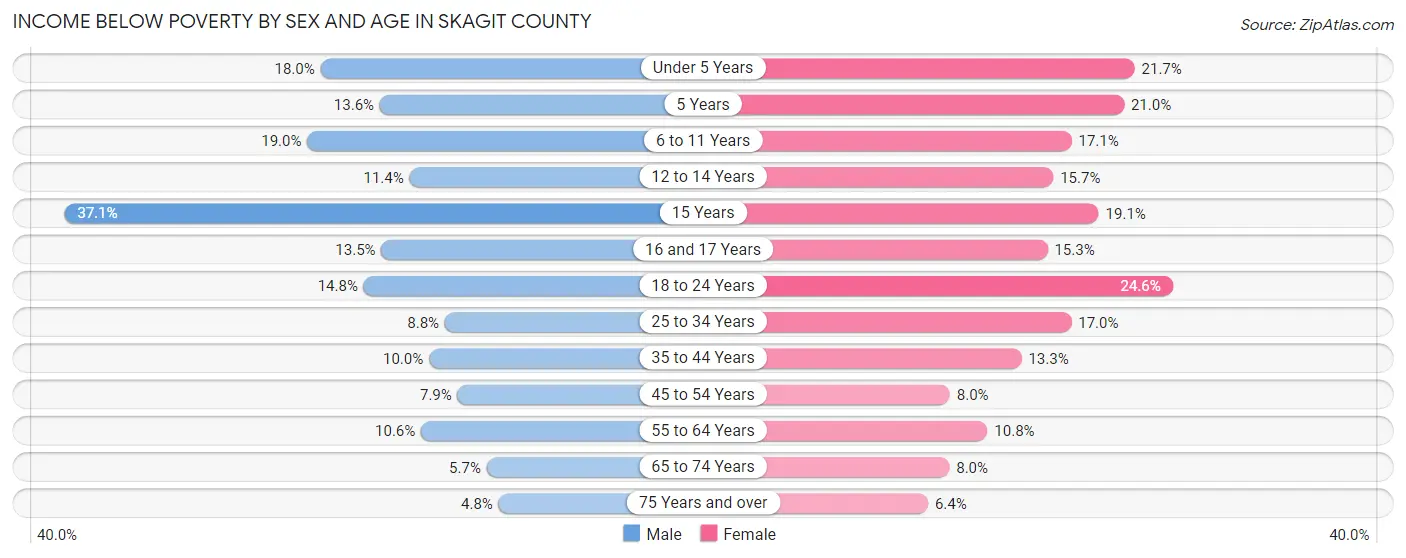
| Age Bracket | Male | Female |
| Under 5 Years | 641 (18.0%) | 719 (21.7%) |
| 5 Years | 123 (13.6%) | 185 (20.9%) |
| 6 to 11 Years | 926 (19.0%) | 701 (17.1%) |
| 12 to 14 Years | 227 (11.4%) | 402 (15.7%) |
| 15 Years | 226 (37.0%) | 127 (19.1%) |
| 16 and 17 Years | 242 (13.5%) | 249 (15.3%) |
| 18 to 24 Years | 735 (14.8%) | 1,124 (24.6%) |
| 25 to 34 Years | 728 (8.8%) | 1,330 (17.0%) |
| 35 to 44 Years | 808 (10.0%) | 1,043 (13.3%) |
| 45 to 54 Years | 572 (7.9%) | 576 (8.0%) |
| 55 to 64 Years | 901 (10.6%) | 960 (10.8%) |
| 65 to 74 Years | 449 (5.7%) | 693 (8.0%) |
| 75 Years and over | 238 (4.8%) | 380 (6.4%) |
| Total | 6,816 (10.7%) | 8,489 (13.3%) |
Income Above Poverty by Sex and Age in Skagit County
According to the poverty statistics in Skagit County, males aged 75 years and over and females aged 75 years and over are the age groups that are most secure financially, with 95.2% of males and 93.6% of females in these age groups living above the poverty line.
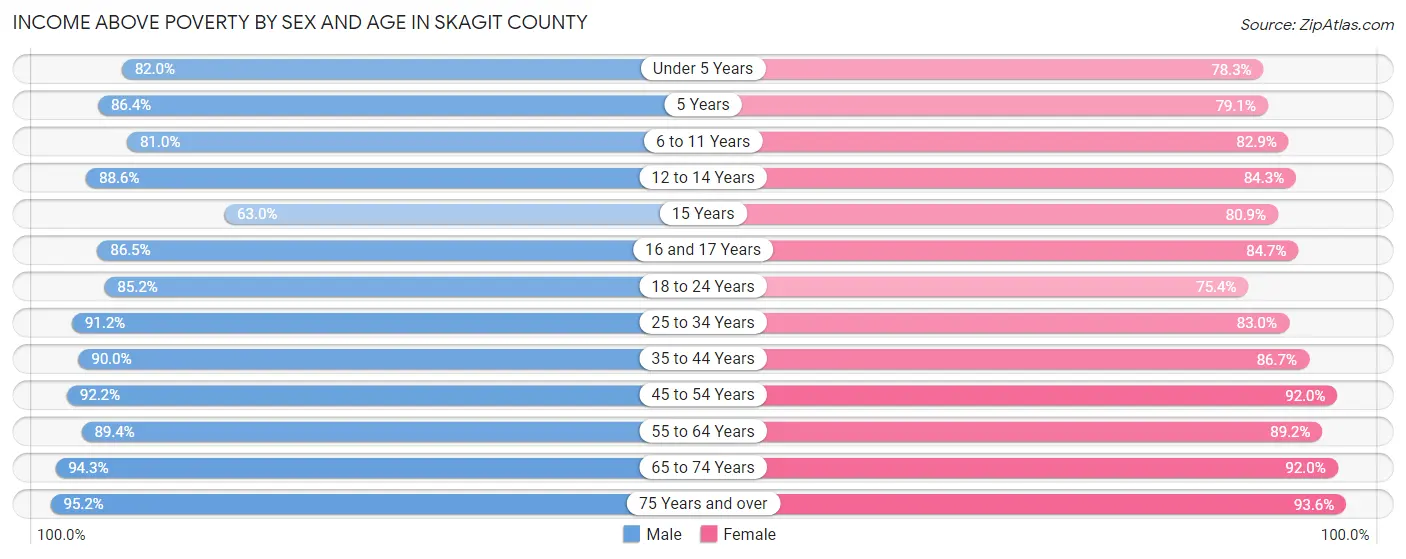
| Age Bracket | Male | Female |
| Under 5 Years | 2,914 (82.0%) | 2,588 (78.3%) |
| 5 Years | 780 (86.4%) | 698 (79.0%) |
| 6 to 11 Years | 3,944 (81.0%) | 3,409 (82.9%) |
| 12 to 14 Years | 1,760 (88.6%) | 2,158 (84.3%) |
| 15 Years | 384 (62.9%) | 539 (80.9%) |
| 16 and 17 Years | 1,549 (86.5%) | 1,382 (84.7%) |
| 18 to 24 Years | 4,224 (85.2%) | 3,453 (75.4%) |
| 25 to 34 Years | 7,552 (91.2%) | 6,477 (83.0%) |
| 35 to 44 Years | 7,299 (90.0%) | 6,778 (86.7%) |
| 45 to 54 Years | 6,718 (92.1%) | 6,609 (92.0%) |
| 55 to 64 Years | 7,635 (89.4%) | 7,921 (89.2%) |
| 65 to 74 Years | 7,436 (94.3%) | 7,996 (92.0%) |
| 75 Years and over | 4,718 (95.2%) | 5,554 (93.6%) |
| Total | 56,913 (89.3%) | 55,562 (86.8%) |
Income Below Poverty Among Married-Couple Families in Skagit County
The poverty statistics for married-couple families in Skagit County show that 4.0% or 1,065 of the total 26,861 families live below the poverty line. Families with 5 or more children have the highest poverty rate of 25.5%, comprising of 38 families. On the other hand, families with no children have the lowest poverty rate of 2.5%, which includes 425 families.
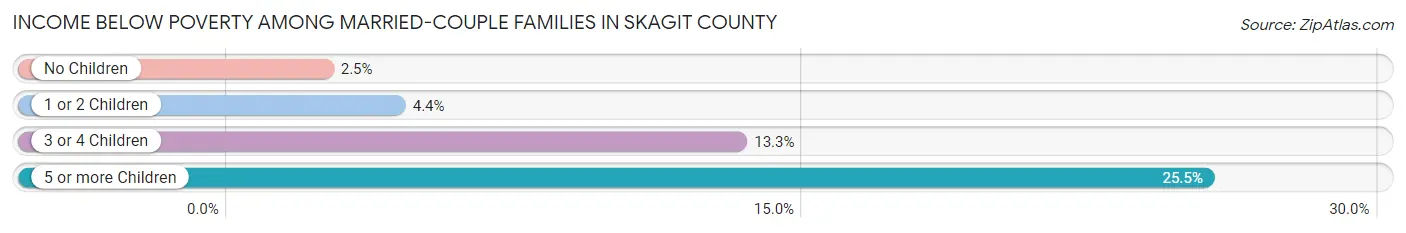
| Children | Above Poverty | Below Poverty |
| No Children | 16,608 (97.5%) | 425 (2.5%) |
| 1 or 2 Children | 7,349 (95.6%) | 337 (4.4%) |
| 3 or 4 Children | 1,728 (86.7%) | 265 (13.3%) |
| 5 or more Children | 111 (74.5%) | 38 (25.5%) |
| Total | 25,796 (96.0%) | 1,065 (4.0%) |
Income Below Poverty Among Single-Parent Households in Skagit County
According to the poverty data in Skagit County, 9.1% or 245 single-father households and 24.9% or 1,292 single-mother households are living below the poverty line. Among single-father households, those with 1 or 2 children have the highest poverty rate, with 147 households (10.4%) experiencing poverty. Likewise, among single-mother households, those with 5 or more children have the highest poverty rate, with 32 households (91.4%) falling below the poverty line.
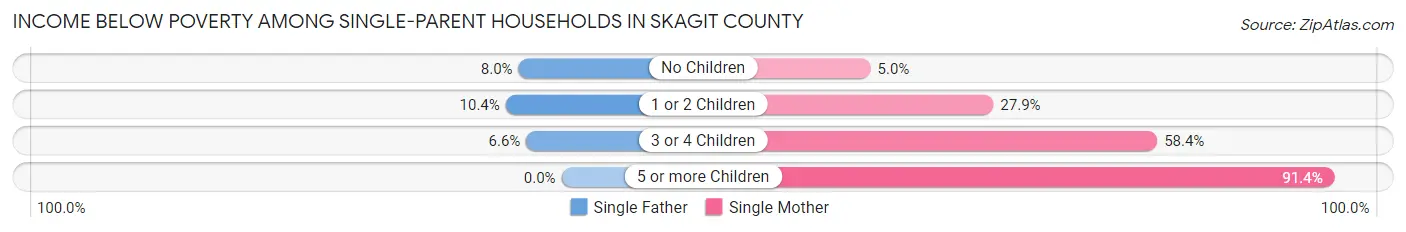
| Children | Single Father | Single Mother |
| No Children | 78 (8.0%) | 86 (5.0%) |
| 1 or 2 Children | 147 (10.4%) | 764 (27.9%) |
| 3 or 4 Children | 20 (6.6%) | 410 (58.4%) |
| 5 or more Children | 0 (0.0%) | 32 (91.4%) |
| Total | 245 (9.1%) | 1,292 (24.9%) |
Income Below Poverty Among Married-Couple vs Single-Parent Households in Skagit County
The poverty data for Skagit County shows that 1,065 of the married-couple family households (4.0%) and 1,537 of the single-parent households (19.5%) are living below the poverty level. Within the married-couple family households, those with 5 or more children have the highest poverty rate, with 38 households (25.5%) falling below the poverty line. Among the single-parent households, those with 5 or more children have the highest poverty rate, with 32 household (91.4%) living below poverty.
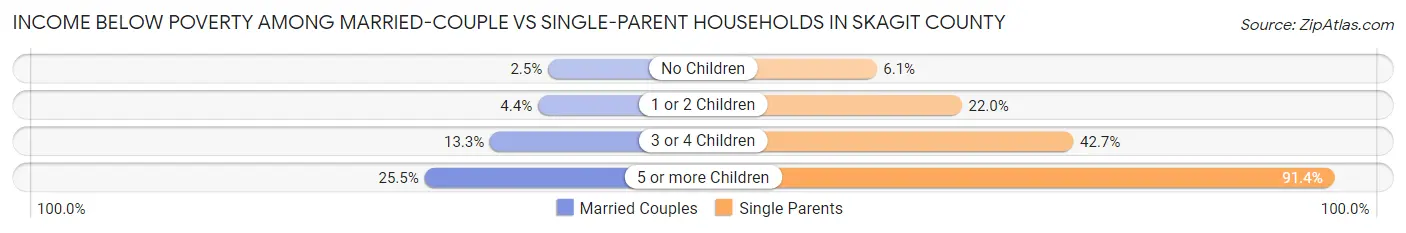
| Children | Married-Couple Families | Single-Parent Households |
| No Children | 425 (2.5%) | 164 (6.1%) |
| 1 or 2 Children | 337 (4.4%) | 911 (22.0%) |
| 3 or 4 Children | 265 (13.3%) | 430 (42.7%) |
| 5 or more Children | 38 (25.5%) | 32 (91.4%) |
| Total | 1,065 (4.0%) | 1,537 (19.5%) |
Employment Characteristics in Skagit County
Employment by Class of Employer in Skagit County
Among the 57,119 employed individuals in Skagit County, private company employees (36,718 | 64.3%), local government employees (6,000 | 10.5%), and not-for-profit organizations (3,586 | 6.3%) make up the most common classes of employment.
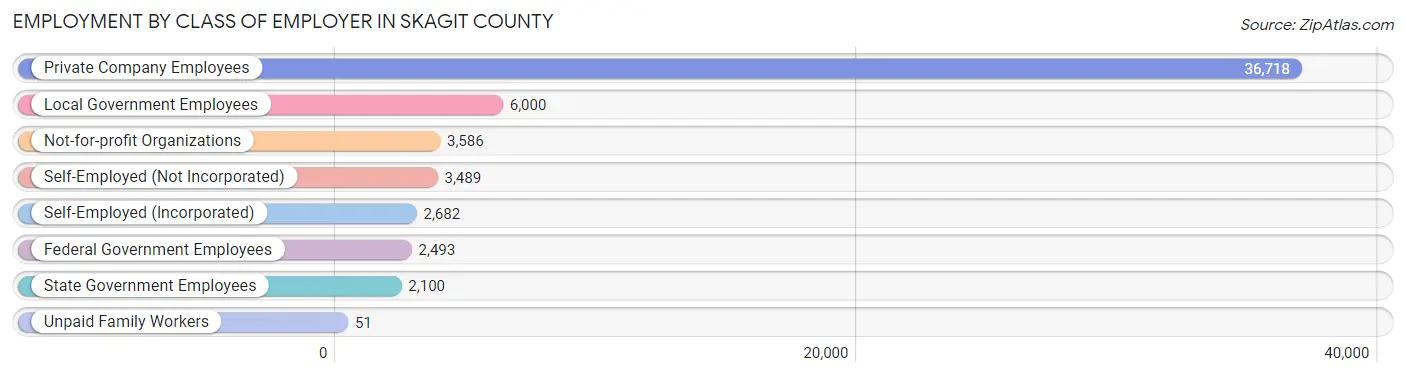
| Employer Class | # Employees | % Employees |
| Private Company Employees | 36,718 | 64.3% |
| Self-Employed (Incorporated) | 2,682 | 4.7% |
| Self-Employed (Not Incorporated) | 3,489 | 6.1% |
| Not-for-profit Organizations | 3,586 | 6.3% |
| Local Government Employees | 6,000 | 10.5% |
| State Government Employees | 2,100 | 3.7% |
| Federal Government Employees | 2,493 | 4.4% |
| Unpaid Family Workers | 51 | 0.1% |
| Total | 57,119 | 100.0% |
Employment Status by Age in Skagit County
According to the labor force statistics for Skagit County, out of the total population over 16 years of age (105,300), 59.0% or 62,127 individuals are in the labor force, with 5.1% or 3,168 of them unemployed. The age group with the highest labor force participation rate is 25 to 29 years, with 83.8% or 6,800 individuals in the labor force. Within the labor force, the 16 to 19 years age range has the highest percentage of unemployed individuals, with 15.1% or 414 of them being unemployed.
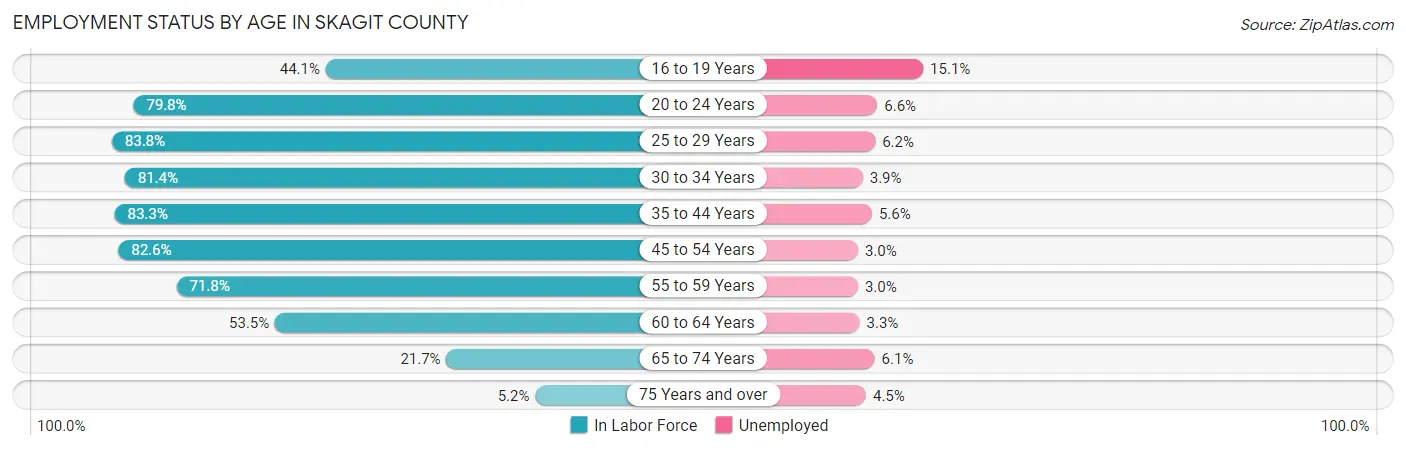
| Age Bracket | In Labor Force | Unemployed |
| 16 to 19 Years | 2,745 (44.1%) | 414 (15.1%) |
| 20 to 24 Years | 5,624 (79.8%) | 371 (6.6%) |
| 25 to 29 Years | 6,800 (83.8%) | 422 (6.2%) |
| 30 to 34 Years | 6,589 (81.4%) | 257 (3.9%) |
| 35 to 44 Years | 13,326 (83.3%) | 746 (5.6%) |
| 45 to 54 Years | 11,972 (82.6%) | 359 (3.0%) |
| 55 to 59 Years | 5,897 (71.8%) | 177 (3.0%) |
| 60 to 64 Years | 4,981 (53.5%) | 164 (3.3%) |
| 65 to 74 Years | 3,615 (21.7%) | 221 (6.1%) |
| 75 Years and over | 580 (5.2%) | 26 (4.5%) |
| Total | 62,127 (59.0%) | 3,168 (5.1%) |
Employment Status by Educational Attainment in Skagit County
According to labor force statistics for Skagit County, 77.2% of individuals (49,581) out of the total population between 25 and 64 years of age (64,224) are in the labor force, with 4.3% or 2,132 of them being unemployed. The group with the highest labor force participation rate are those with the educational attainment of bachelor's degree or higher, with 85.3% or 14,695 individuals in the labor force. Within the labor force, individuals with less than high school education have the highest percentage of unemployment, with 8.8% or 406 of them being unemployed.
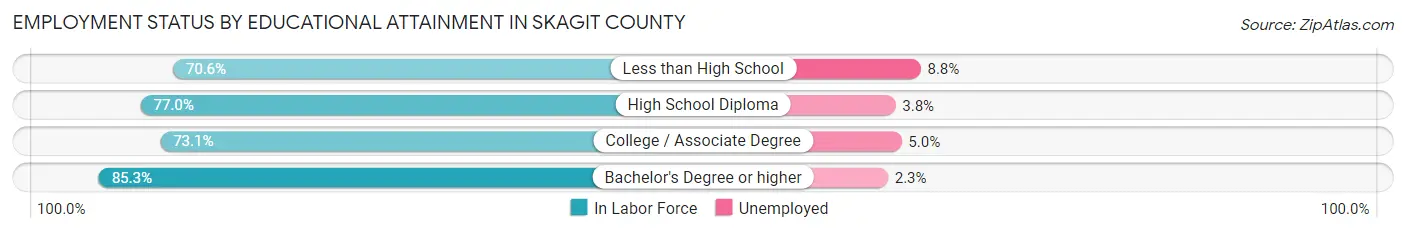
| Educational Attainment | In Labor Force | Unemployed |
| Less than High School | 4,619 (70.6%) | 576 (8.8%) |
| High School Diploma | 13,371 (77.0%) | 660 (3.8%) |
| College / Associate Degree | 16,879 (73.1%) | 1,154 (5.0%) |
| Bachelor's Degree or higher | 14,695 (85.3%) | 396 (2.3%) |
| Total | 49,581 (77.2%) | 2,762 (4.3%) |
Employment Occupations by Sex in Skagit County
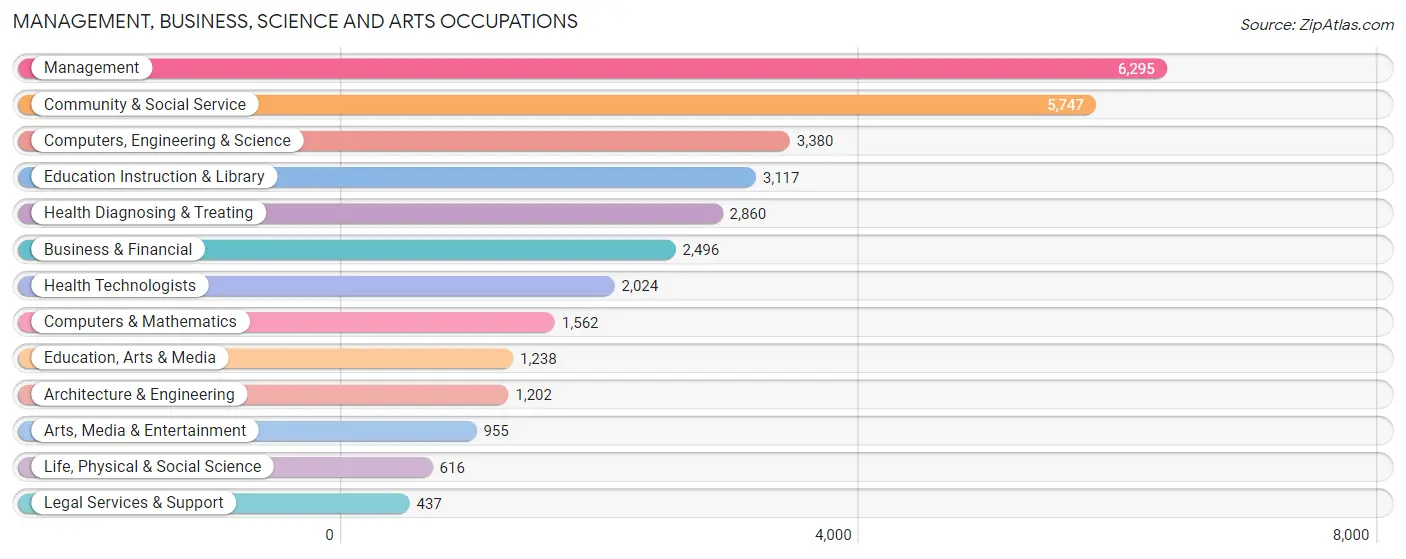
Management, Business, Science and Arts Occupations
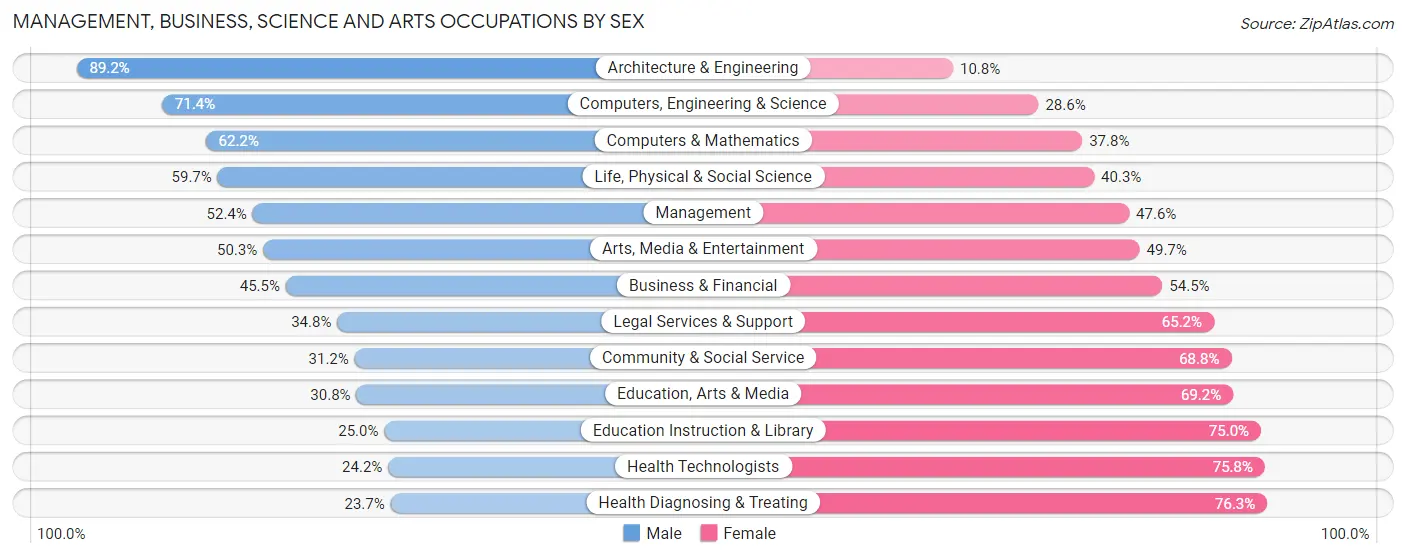
The most common Management, Business, Science and Arts occupations in Skagit County are Management (6,295 | 10.9%), Community & Social Service (5,747 | 10.0%), Computers, Engineering & Science (3,380 | 5.9%), Education Instruction & Library (3,117 | 5.4%), and Health Diagnosing & Treating (2,860 | 5.0%).
Management, Business, Science and Arts Occupations by Sex
Within the Management, Business, Science and Arts occupations in Skagit County, the most male-oriented occupations are Architecture & Engineering (89.2%), Computers, Engineering & Science (71.4%), and Computers & Mathematics (62.2%), while the most female-oriented occupations are Health Diagnosing & Treating (76.3%), Health Technologists (75.8%), and Education Instruction & Library (75.0%).
| Occupation | Male | Female |
| Management | 3,301 (52.4%) | 2,994 (47.6%) |
| Business & Financial | 1,136 (45.5%) | 1,360 (54.5%) |
| Computers, Engineering & Science | 2,412 (71.4%) | 968 (28.6%) |
| Computers & Mathematics | 972 (62.2%) | 590 (37.8%) |
| Architecture & Engineering | 1,072 (89.2%) | 130 (10.8%) |
| Life, Physical & Social Science | 368 (59.7%) | 248 (40.3%) |
| Community & Social Service | 1,791 (31.2%) | 3,956 (68.8%) |
| Education, Arts & Media | 381 (30.8%) | 857 (69.2%) |
| Legal Services & Support | 152 (34.8%) | 285 (65.2%) |
| Education Instruction & Library | 778 (25.0%) | 2,339 (75.0%) |
| Arts, Media & Entertainment | 480 (50.3%) | 475 (49.7%) |
| Health Diagnosing & Treating | 677 (23.7%) | 2,183 (76.3%) |
| Health Technologists | 489 (24.2%) | 1,535 (75.8%) |
| Total (Category) | 9,317 (44.8%) | 11,461 (55.2%) |
| Total (Overall) | 31,112 (53.9%) | 26,646 (46.1%) |
Services Occupations
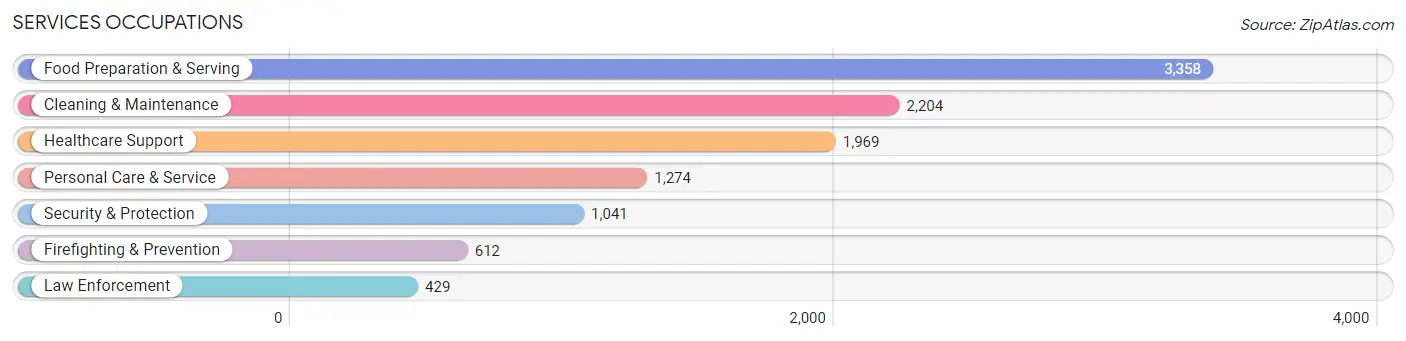
The most common Services occupations in Skagit County are Food Preparation & Serving (3,358 | 5.8%), Cleaning & Maintenance (2,204 | 3.8%), Healthcare Support (1,969 | 3.4%), Personal Care & Service (1,274 | 2.2%), and Security & Protection (1,041 | 1.8%).
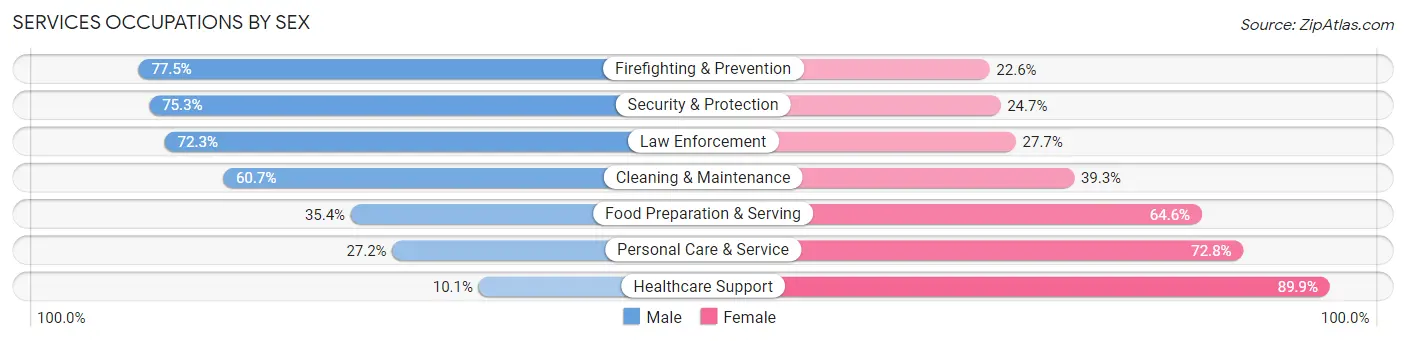
Services Occupations by Sex
Within the Services occupations in Skagit County, the most male-oriented occupations are Firefighting & Prevention (77.4%), Security & Protection (75.3%), and Law Enforcement (72.3%), while the most female-oriented occupations are Healthcare Support (89.9%), Personal Care & Service (72.8%), and Food Preparation & Serving (64.6%).
| Occupation | Male | Female |
| Healthcare Support | 198 (10.1%) | 1,771 (89.9%) |
| Security & Protection | 784 (75.3%) | 257 (24.7%) |
| Firefighting & Prevention | 474 (77.4%) | 138 (22.6%) |
| Law Enforcement | 310 (72.3%) | 119 (27.7%) |
| Food Preparation & Serving | 1,188 (35.4%) | 2,170 (64.6%) |
| Cleaning & Maintenance | 1,338 (60.7%) | 866 (39.3%) |
| Personal Care & Service | 346 (27.2%) | 928 (72.8%) |
| Total (Category) | 3,854 (39.1%) | 5,992 (60.9%) |
| Total (Overall) | 31,112 (53.9%) | 26,646 (46.1%) |
Sales and Office Occupations
The most common Sales and Office occupations in Skagit County are Office & Administration (5,444 | 9.4%), and Sales & Related (5,091 | 8.8%).
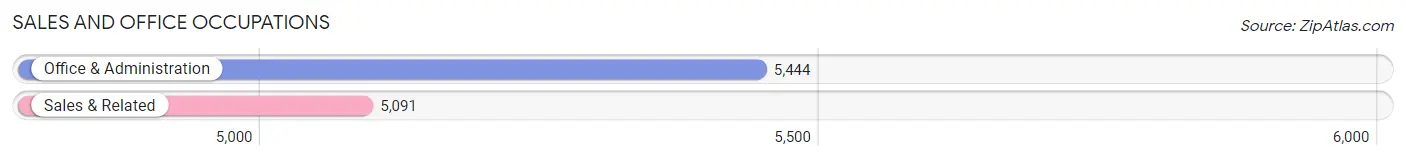
Sales and Office Occupations by Sex
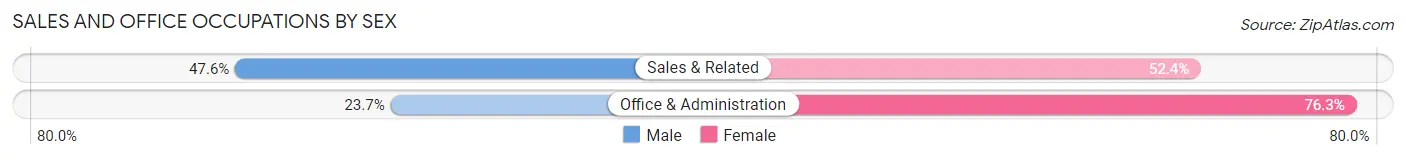
| Occupation | Male | Female |
| Sales & Related | 2,424 (47.6%) | 2,667 (52.4%) |
| Office & Administration | 1,291 (23.7%) | 4,153 (76.3%) |
| Total (Category) | 3,715 (35.3%) | 6,820 (64.7%) |
| Total (Overall) | 31,112 (53.9%) | 26,646 (46.1%) |
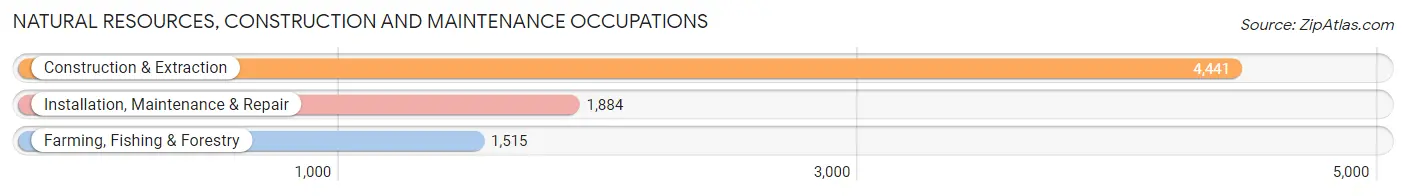
Natural Resources, Construction and Maintenance Occupations
The most common Natural Resources, Construction and Maintenance occupations in Skagit County are Construction & Extraction (4,441 | 7.7%), Installation, Maintenance & Repair (1,884 | 3.3%), and Farming, Fishing & Forestry (1,515 | 2.6%).
Natural Resources, Construction and Maintenance Occupations by Sex
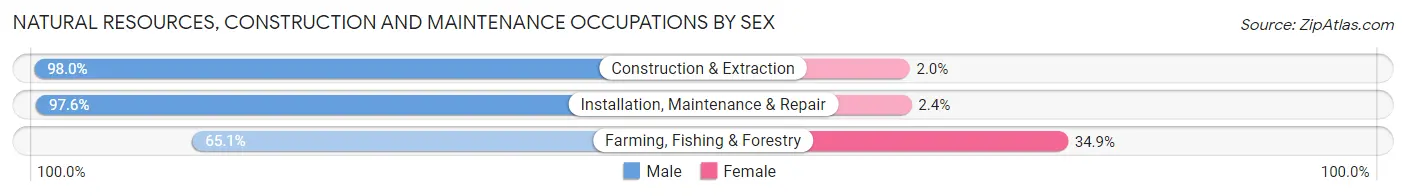
| Occupation | Male | Female |
| Farming, Fishing & Forestry | 986 (65.1%) | 529 (34.9%) |
| Construction & Extraction | 4,352 (98.0%) | 89 (2.0%) |
| Installation, Maintenance & Repair | 1,839 (97.6%) | 45 (2.4%) |
| Total (Category) | 7,177 (91.5%) | 663 (8.5%) |
| Total (Overall) | 31,112 (53.9%) | 26,646 (46.1%) |
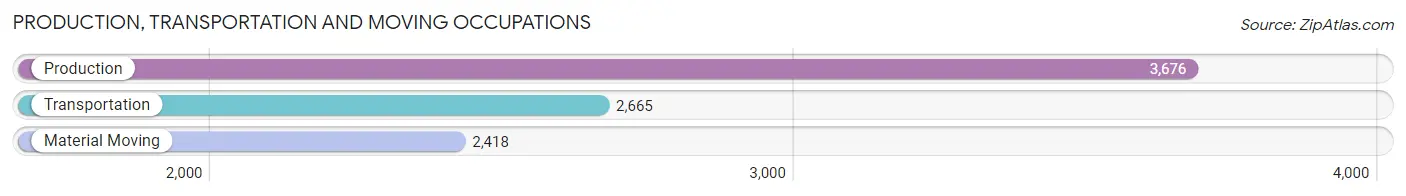
Production, Transportation and Moving Occupations
The most common Production, Transportation and Moving occupations in Skagit County are Production (3,676 | 6.4%), Transportation (2,665 | 4.6%), and Material Moving (2,418 | 4.2%).
Production, Transportation and Moving Occupations by Sex
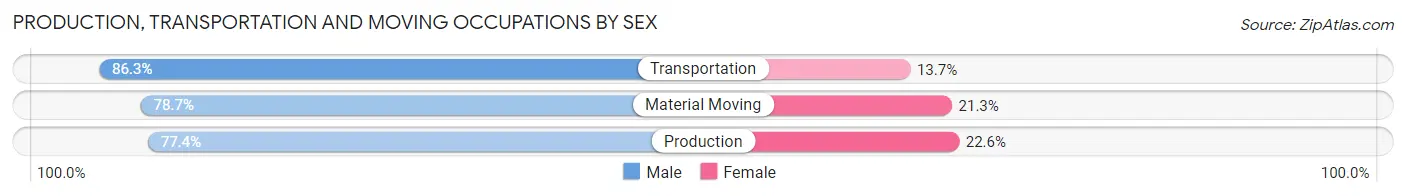
| Occupation | Male | Female |
| Production | 2,845 (77.4%) | 831 (22.6%) |
| Transportation | 2,301 (86.3%) | 364 (13.7%) |
| Material Moving | 1,903 (78.7%) | 515 (21.3%) |
| Total (Category) | 7,049 (80.5%) | 1,710 (19.5%) |
| Total (Overall) | 31,112 (53.9%) | 26,646 (46.1%) |
Employment Industries by Sex in Skagit County
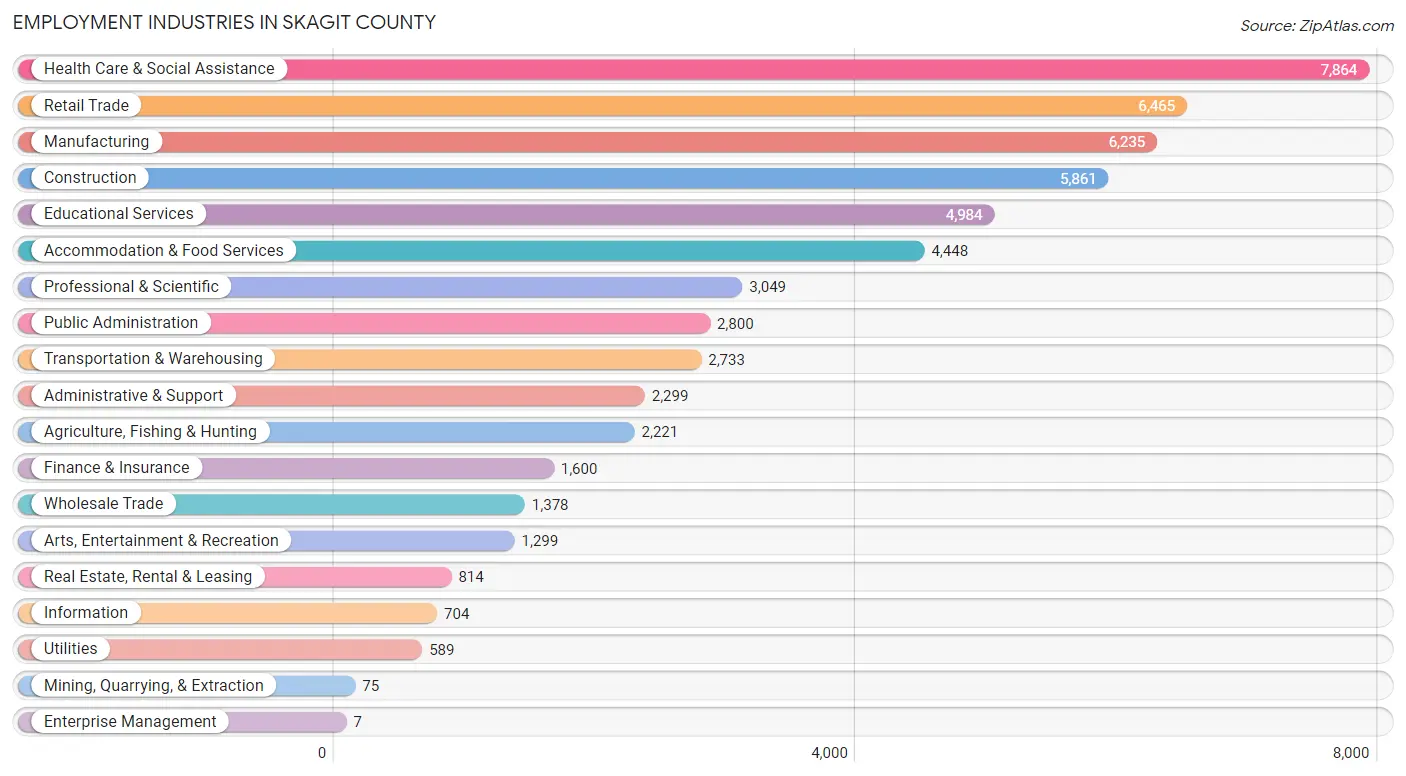
Employment Industries in Skagit County
The major employment industries in Skagit County include Health Care & Social Assistance (7,864 | 13.6%), Retail Trade (6,465 | 11.2%), Manufacturing (6,235 | 10.8%), Construction (5,861 | 10.2%), and Educational Services (4,984 | 8.6%).
Employment Industries by Sex in Skagit County
The Skagit County industries that see more men than women are Construction (91.2%), Mining, Quarrying, & Extraction (85.3%), and Manufacturing (78.0%), whereas the industries that tend to have a higher number of women are Enterprise Management (100.0%), Health Care & Social Assistance (80.9%), and Educational Services (67.9%).
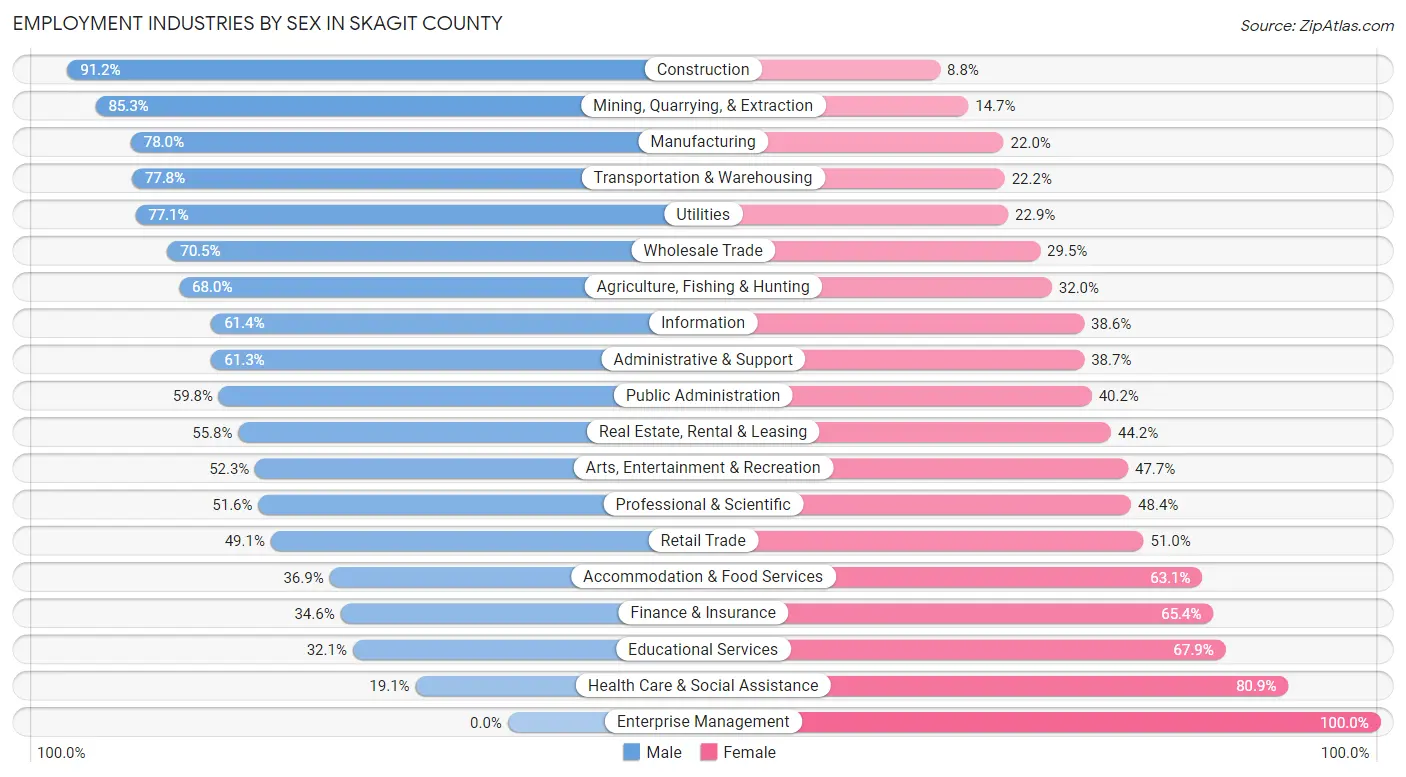
| Industry | Male | Female |
| Agriculture, Fishing & Hunting | 1,511 (68.0%) | 710 (32.0%) |
| Mining, Quarrying, & Extraction | 64 (85.3%) | 11 (14.7%) |
| Construction | 5,343 (91.2%) | 518 (8.8%) |
| Manufacturing | 4,864 (78.0%) | 1,371 (22.0%) |
| Wholesale Trade | 971 (70.5%) | 407 (29.5%) |
| Retail Trade | 3,171 (49.0%) | 3,294 (50.9%) |
| Transportation & Warehousing | 2,126 (77.8%) | 607 (22.2%) |
| Utilities | 454 (77.1%) | 135 (22.9%) |
| Information | 432 (61.4%) | 272 (38.6%) |
| Finance & Insurance | 554 (34.6%) | 1,046 (65.4%) |
| Real Estate, Rental & Leasing | 454 (55.8%) | 360 (44.2%) |
| Professional & Scientific | 1,574 (51.6%) | 1,475 (48.4%) |
| Enterprise Management | 0 (0.0%) | 7 (100.0%) |
| Administrative & Support | 1,410 (61.3%) | 889 (38.7%) |
| Educational Services | 1,599 (32.1%) | 3,385 (67.9%) |
| Health Care & Social Assistance | 1,503 (19.1%) | 6,361 (80.9%) |
| Arts, Entertainment & Recreation | 679 (52.3%) | 620 (47.7%) |
| Accommodation & Food Services | 1,641 (36.9%) | 2,807 (63.1%) |
| Public Administration | 1,674 (59.8%) | 1,126 (40.2%) |
| Total | 31,112 (53.9%) | 26,646 (46.1%) |
Education in Skagit County
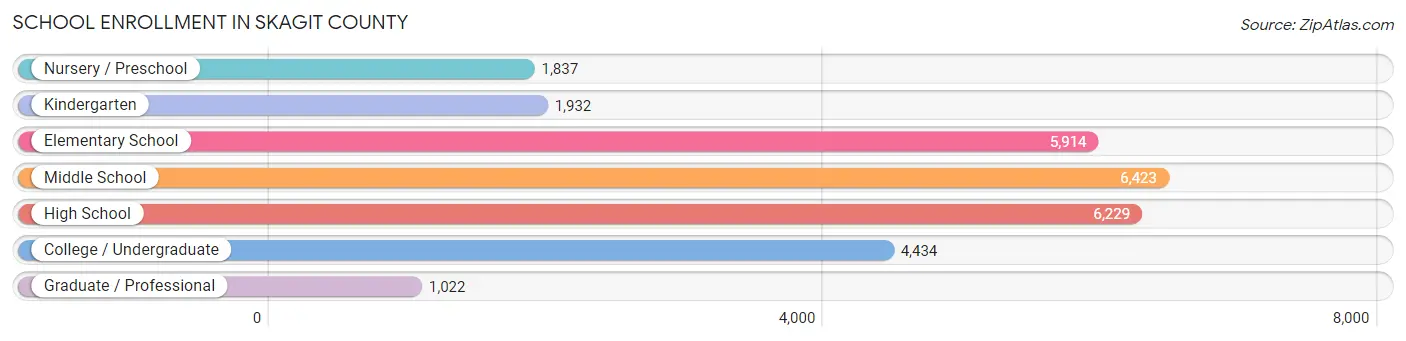
School Enrollment in Skagit County
The most common levels of schooling among the 27,791 students in Skagit County are middle school (6,423 | 23.1%), high school (6,229 | 22.4%), and elementary school (5,914 | 21.3%).
| School Level | # Students | % Students |
| Nursery / Preschool | 1,837 | 6.6% |
| Kindergarten | 1,932 | 7.0% |
| Elementary School | 5,914 | 21.3% |
| Middle School | 6,423 | 23.1% |
| High School | 6,229 | 22.4% |
| College / Undergraduate | 4,434 | 16.0% |
| Graduate / Professional | 1,022 | 3.7% |
| Total | 27,791 | 100.0% |
School Enrollment by Age by Funding Source in Skagit County
Out of a total of 27,791 students who are enrolled in schools in Skagit County, 4,502 (16.2%) attend a private institution, while the remaining 23,289 (83.8%) are enrolled in public schools. The age group of 3 to 4 year olds has the highest likelihood of being enrolled in private schools, with 821 (55.2% in the age bracket) enrolled. Conversely, the age group of 18 to 19 year olds has the lowest likelihood of being enrolled in a private school, with 1,737 (96.3% in the age bracket) attending a public institution.
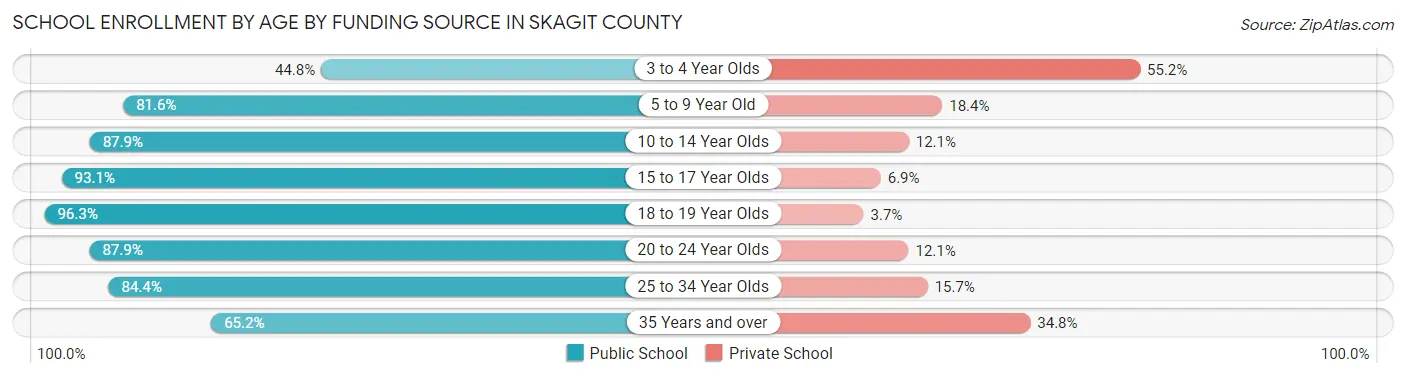
| Age Bracket | Public School | Private School |
| 3 to 4 Year Olds | 666 (44.8%) | 821 (55.2%) |
| 5 to 9 Year Old | 5,957 (81.6%) | 1,341 (18.4%) |
| 10 to 14 Year Olds | 6,833 (87.9%) | 943 (12.1%) |
| 15 to 17 Year Olds | 4,258 (93.1%) | 316 (6.9%) |
| 18 to 19 Year Olds | 1,737 (96.3%) | 67 (3.7%) |
| 20 to 24 Year Olds | 1,658 (87.9%) | 228 (12.1%) |
| 25 to 34 Year Olds | 1,051 (84.4%) | 195 (15.7%) |
| 35 Years and over | 1,122 (65.2%) | 598 (34.8%) |
| Total | 23,289 (83.8%) | 4,502 (16.2%) |
Educational Attainment by Field of Study in Skagit County
Business (3,960 | 13.7%), education (3,610 | 12.5%), science & technology (2,821 | 9.8%), bio, nature & agricultural (2,698 | 9.3%), and social sciences (2,516 | 8.7%) are the most common fields of study among 28,845 individuals in Skagit County who have obtained a bachelor's degree or higher.
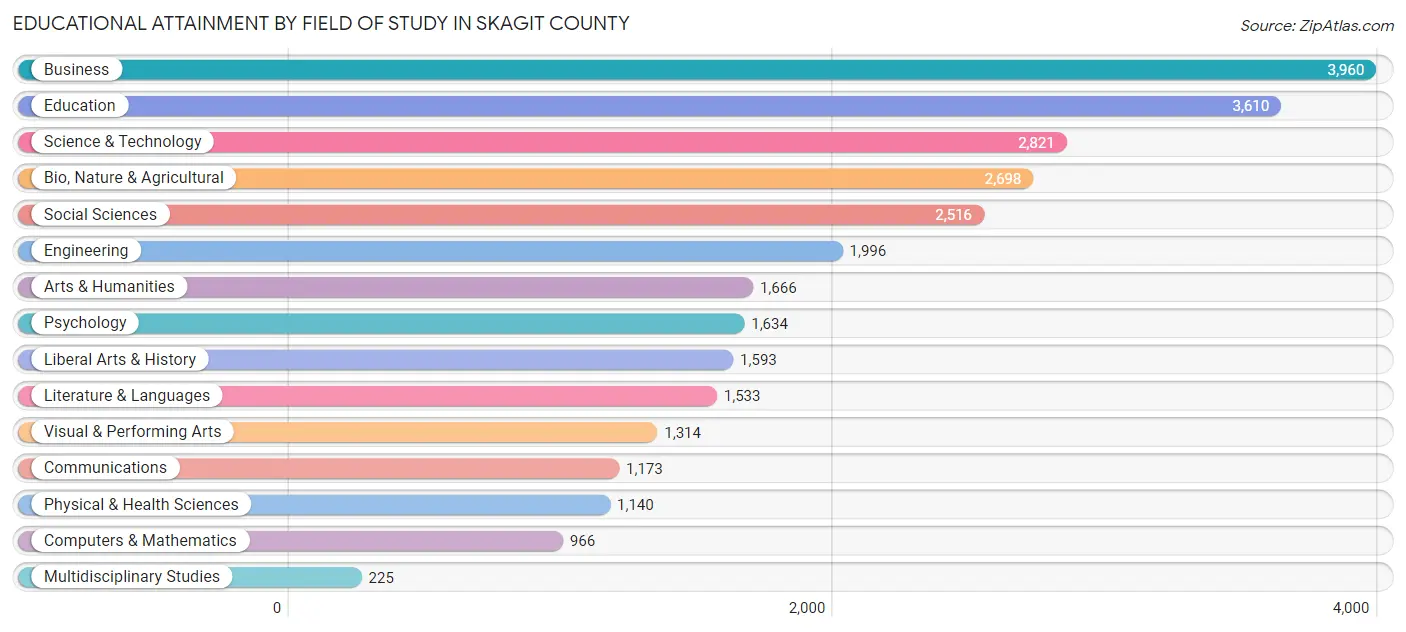
| Field of Study | # Graduates | % Graduates |
| Computers & Mathematics | 966 | 3.4% |
| Bio, Nature & Agricultural | 2,698 | 9.3% |
| Physical & Health Sciences | 1,140 | 4.0% |
| Psychology | 1,634 | 5.7% |
| Social Sciences | 2,516 | 8.7% |
| Engineering | 1,996 | 6.9% |
| Multidisciplinary Studies | 225 | 0.8% |
| Science & Technology | 2,821 | 9.8% |
| Business | 3,960 | 13.7% |
| Education | 3,610 | 12.5% |
| Literature & Languages | 1,533 | 5.3% |
| Liberal Arts & History | 1,593 | 5.5% |
| Visual & Performing Arts | 1,314 | 4.6% |
| Communications | 1,173 | 4.1% |
| Arts & Humanities | 1,666 | 5.8% |
| Total | 28,845 | 100.0% |
Transportation & Commute in Skagit County
Vehicle Availability by Sex in Skagit County
The most prevalent vehicle ownership categories in Skagit County are males with 2 vehicles (10,732, accounting for 34.8%) and females with 2 vehicles (8,730, making up 41.6%).
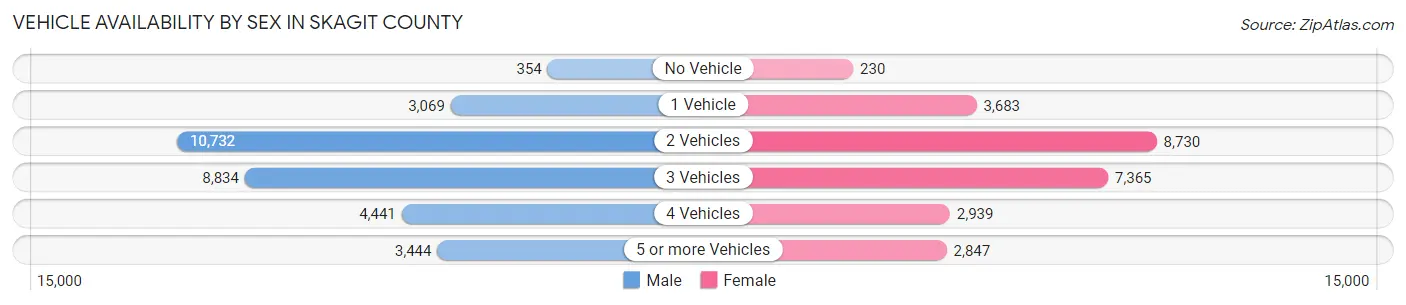
| Vehicles Available | Male | Female |
| No Vehicle | 354 (1.1%) | 230 (0.9%) |
| 1 Vehicle | 3,069 (9.9%) | 3,683 (14.3%) |
| 2 Vehicles | 10,732 (34.8%) | 8,730 (33.9%) |
| 3 Vehicles | 8,834 (28.6%) | 7,365 (28.5%) |
| 4 Vehicles | 4,441 (14.4%) | 2,939 (11.4%) |
| 5 or more Vehicles | 3,444 (11.2%) | 2,847 (11.0%) |
| Total | 30,874 (100.0%) | 25,794 (100.0%) |
Commute Time in Skagit County
The most frequently occuring commute durations in Skagit County are 10 to 14 minutes (8,358 commuters, 16.4%), 5 to 9 minutes (6,901 commuters, 13.5%), and 15 to 19 minutes (6,821 commuters, 13.4%).
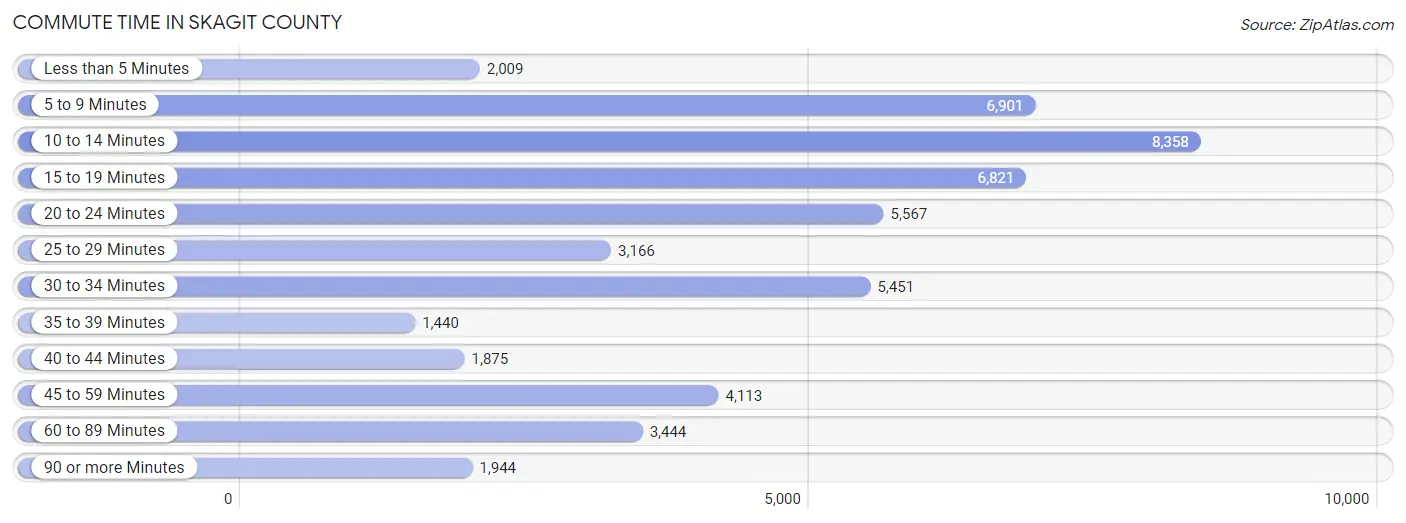
| Commute Time | # Commuters | % Commuters |
| Less than 5 Minutes | 2,009 | 3.9% |
| 5 to 9 Minutes | 6,901 | 13.5% |
| 10 to 14 Minutes | 8,358 | 16.4% |
| 15 to 19 Minutes | 6,821 | 13.4% |
| 20 to 24 Minutes | 5,567 | 10.9% |
| 25 to 29 Minutes | 3,166 | 6.2% |
| 30 to 34 Minutes | 5,451 | 10.7% |
| 35 to 39 Minutes | 1,440 | 2.8% |
| 40 to 44 Minutes | 1,875 | 3.7% |
| 45 to 59 Minutes | 4,113 | 8.1% |
| 60 to 89 Minutes | 3,444 | 6.7% |
| 90 or more Minutes | 1,944 | 3.8% |
Commute Time by Sex in Skagit County
The most common commute times in Skagit County are 10 to 14 minutes (4,057 commuters, 14.3%) for males and 10 to 14 minutes (4,301 commuters, 18.9%) for females.
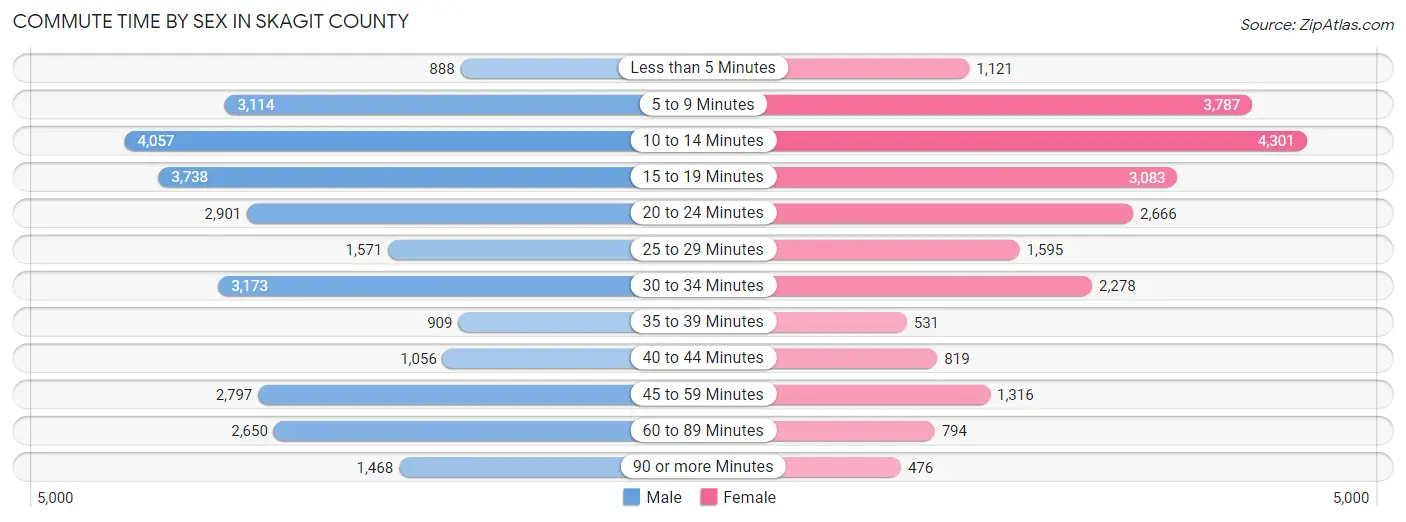
| Commute Time | Male | Female |
| Less than 5 Minutes | 888 (3.1%) | 1,121 (4.9%) |
| 5 to 9 Minutes | 3,114 (11.0%) | 3,787 (16.6%) |
| 10 to 14 Minutes | 4,057 (14.3%) | 4,301 (18.9%) |
| 15 to 19 Minutes | 3,738 (13.2%) | 3,083 (13.5%) |
| 20 to 24 Minutes | 2,901 (10.2%) | 2,666 (11.7%) |
| 25 to 29 Minutes | 1,571 (5.6%) | 1,595 (7.0%) |
| 30 to 34 Minutes | 3,173 (11.2%) | 2,278 (10.0%) |
| 35 to 39 Minutes | 909 (3.2%) | 531 (2.3%) |
| 40 to 44 Minutes | 1,056 (3.7%) | 819 (3.6%) |
| 45 to 59 Minutes | 2,797 (9.9%) | 1,316 (5.8%) |
| 60 to 89 Minutes | 2,650 (9.4%) | 794 (3.5%) |
| 90 or more Minutes | 1,468 (5.2%) | 476 (2.1%) |
Time of Departure to Work by Sex in Skagit County
The most frequent times of departure to work in Skagit County are 7:00 AM to 7:29 AM (3,681, 13.0%) for males and 7:30 AM to 7:59 AM (2,906, 12.8%) for females.
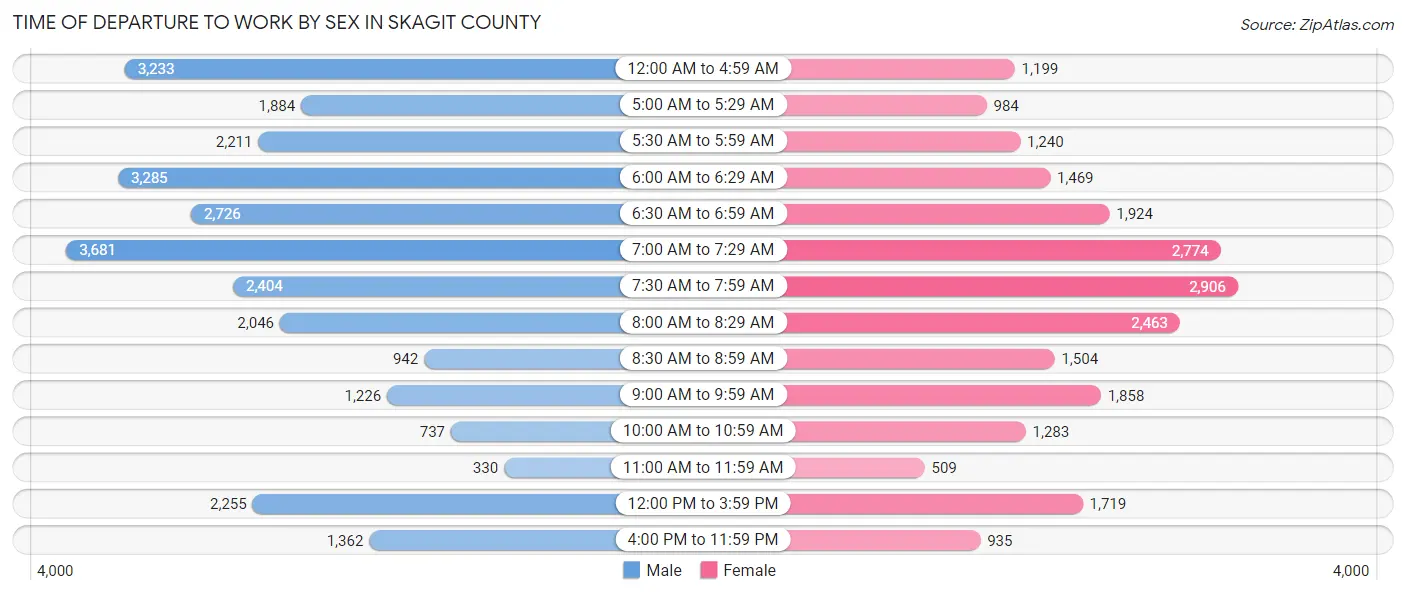
| Time of Departure | Male | Female |
| 12:00 AM to 4:59 AM | 3,233 (11.4%) | 1,199 (5.3%) |
| 5:00 AM to 5:29 AM | 1,884 (6.7%) | 984 (4.3%) |
| 5:30 AM to 5:59 AM | 2,211 (7.8%) | 1,240 (5.4%) |
| 6:00 AM to 6:29 AM | 3,285 (11.6%) | 1,469 (6.5%) |
| 6:30 AM to 6:59 AM | 2,726 (9.6%) | 1,924 (8.5%) |
| 7:00 AM to 7:29 AM | 3,681 (13.0%) | 2,774 (12.2%) |
| 7:30 AM to 7:59 AM | 2,404 (8.5%) | 2,906 (12.8%) |
| 8:00 AM to 8:29 AM | 2,046 (7.2%) | 2,463 (10.8%) |
| 8:30 AM to 8:59 AM | 942 (3.3%) | 1,504 (6.6%) |
| 9:00 AM to 9:59 AM | 1,226 (4.3%) | 1,858 (8.2%) |
| 10:00 AM to 10:59 AM | 737 (2.6%) | 1,283 (5.6%) |
| 11:00 AM to 11:59 AM | 330 (1.2%) | 509 (2.2%) |
| 12:00 PM to 3:59 PM | 2,255 (8.0%) | 1,719 (7.5%) |
| 4:00 PM to 11:59 PM | 1,362 (4.8%) | 935 (4.1%) |
| Total | 28,322 (100.0%) | 22,767 (100.0%) |
Housing Occupancy in Skagit County
Occupancy by Ownership in Skagit County
Of the total 50,824 dwellings in Skagit County, owner-occupied units account for 35,746 (70.3%), while renter-occupied units make up 15,078 (29.7%).
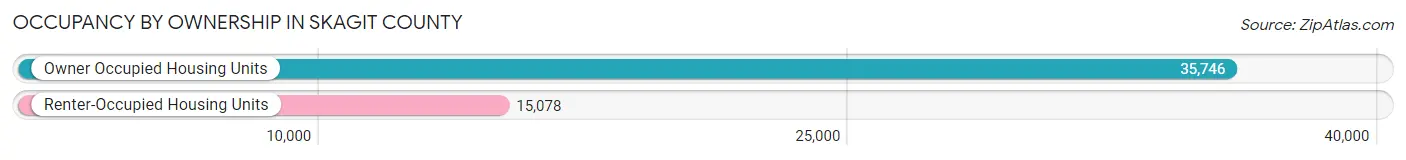
| Occupancy | # Housing Units | % Housing Units |
| Owner Occupied Housing Units | 35,746 | 70.3% |
| Renter-Occupied Housing Units | 15,078 | 29.7% |
| Total Occupied Housing Units | 50,824 | 100.0% |
Occupancy by Household Size in Skagit County
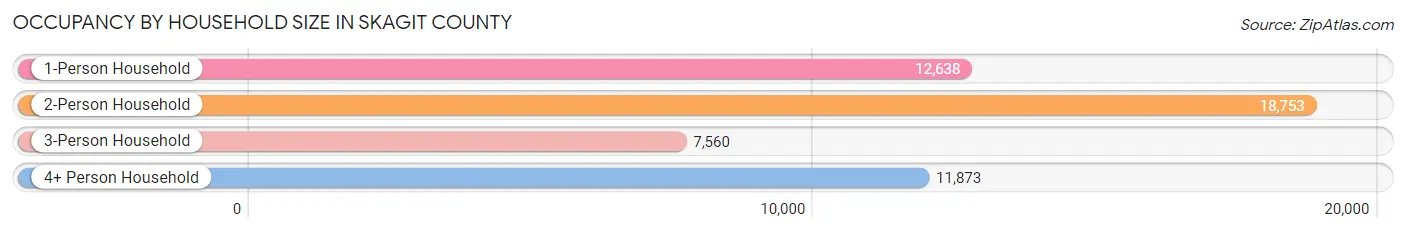
| Household Size | # Housing Units | % Housing Units |
| 1-Person Household | 12,638 | 24.9% |
| 2-Person Household | 18,753 | 36.9% |
| 3-Person Household | 7,560 | 14.9% |
| 4+ Person Household | 11,873 | 23.4% |
| Total Housing Units | 50,824 | 100.0% |
Occupancy by Ownership by Household Size in Skagit County
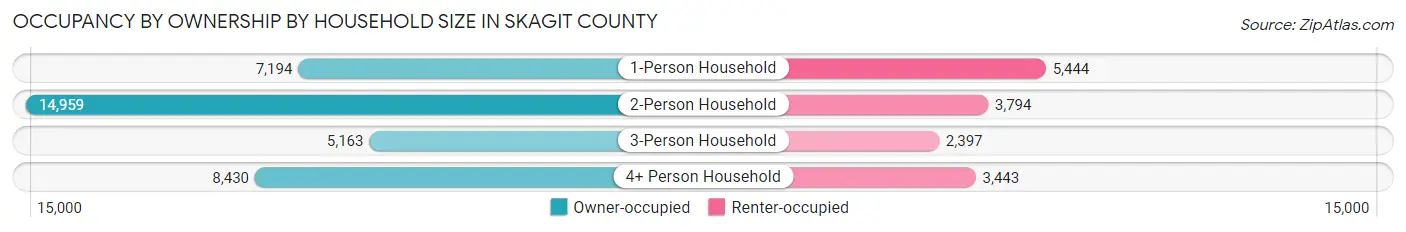
| Household Size | Owner-occupied | Renter-occupied |
| 1-Person Household | 7,194 (56.9%) | 5,444 (43.1%) |
| 2-Person Household | 14,959 (79.8%) | 3,794 (20.2%) |
| 3-Person Household | 5,163 (68.3%) | 2,397 (31.7%) |
| 4+ Person Household | 8,430 (71.0%) | 3,443 (29.0%) |
| Total Housing Units | 35,746 (70.3%) | 15,078 (29.7%) |
Occupancy by Educational Attainment in Skagit County
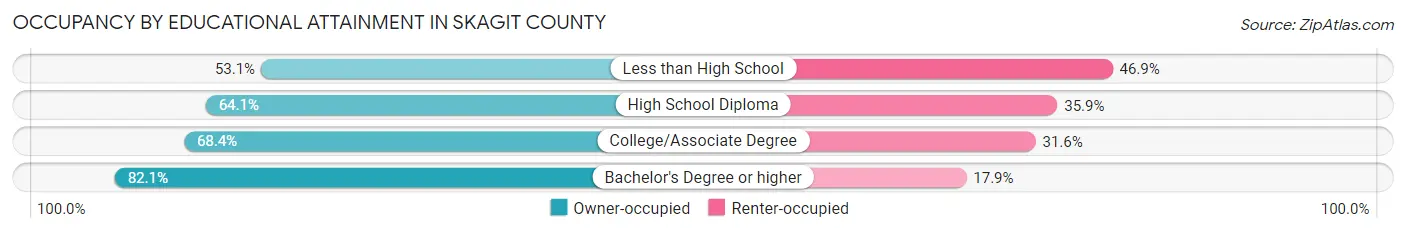
| Household Size | Owner-occupied | Renter-occupied |
| Less than High School | 2,288 (53.1%) | 2,018 (46.9%) |
| High School Diploma | 7,314 (64.1%) | 4,098 (35.9%) |
| College/Associate Degree | 13,383 (68.4%) | 6,183 (31.6%) |
| Bachelor's Degree or higher | 12,761 (82.1%) | 2,779 (17.9%) |
Occupancy by Age of Householder in Skagit County
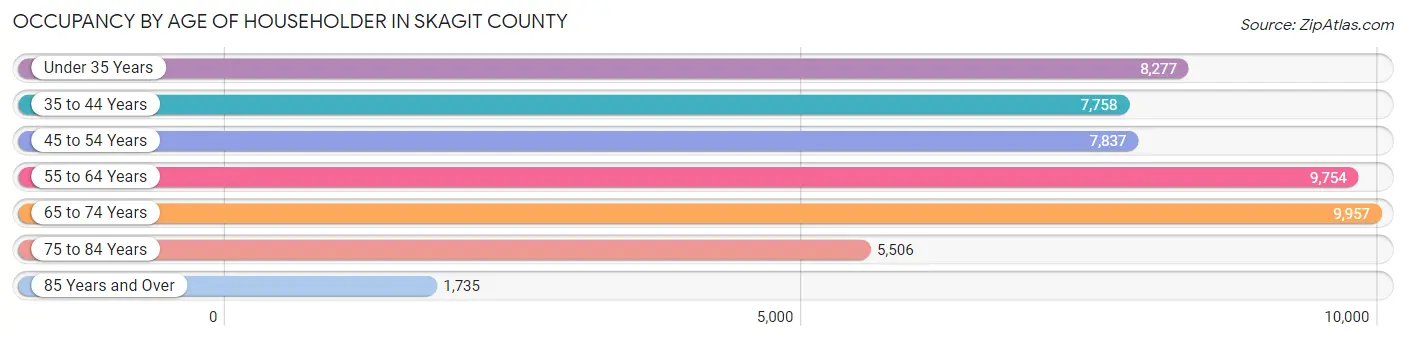
| Age Bracket | # Households | % Households |
| Under 35 Years | 8,277 | 16.3% |
| 35 to 44 Years | 7,758 | 15.3% |
| 45 to 54 Years | 7,837 | 15.4% |
| 55 to 64 Years | 9,754 | 19.2% |
| 65 to 74 Years | 9,957 | 19.6% |
| 75 to 84 Years | 5,506 | 10.8% |
| 85 Years and Over | 1,735 | 3.4% |
| Total | 50,824 | 100.0% |
Housing Finances in Skagit County
Median Income by Occupancy in Skagit County
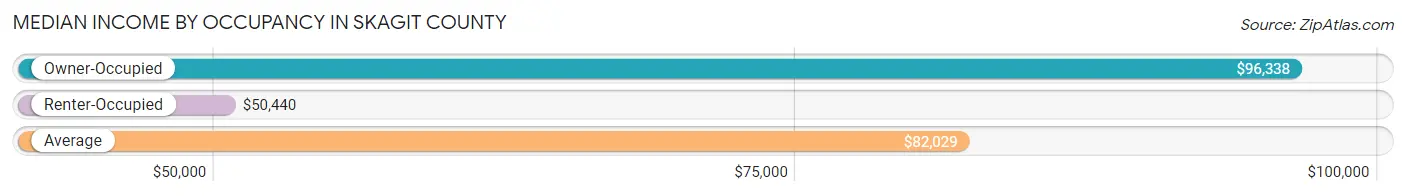
| Occupancy Type | # Households | Median Income |
| Owner-Occupied | 35,746 (70.3%) | $96,338 |
| Renter-Occupied | 15,078 (29.7%) | $50,440 |
| Average | 50,824 (100.0%) | $82,029 |
Occupancy by Householder Income Bracket in Skagit County
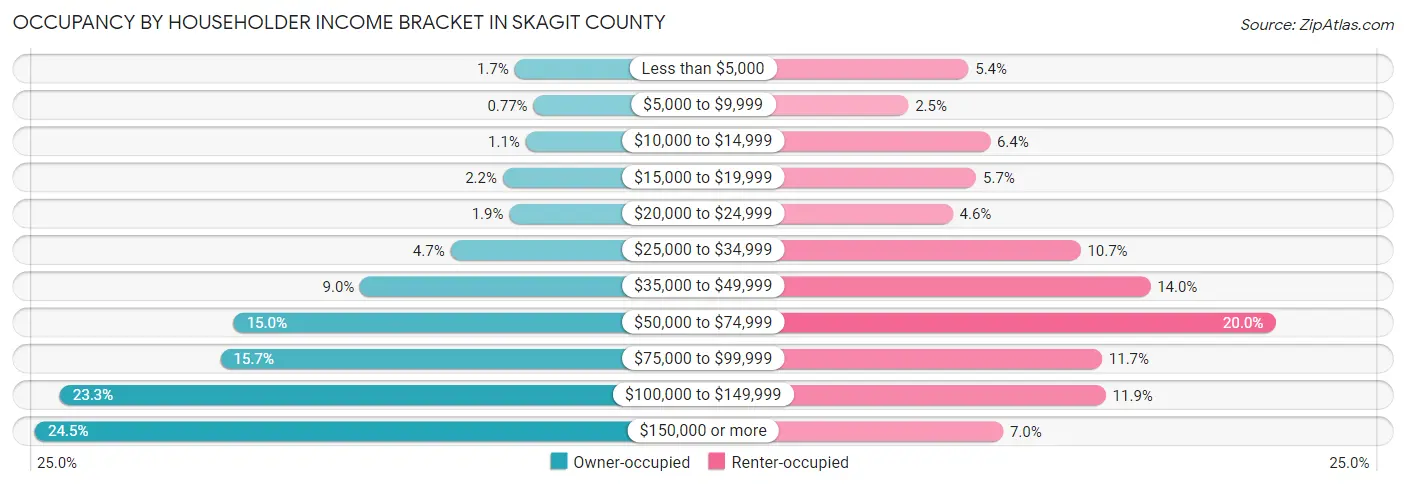
| Income Bracket | Owner-occupied | Renter-occupied |
| Less than $5,000 | 598 (1.7%) | 809 (5.4%) |
| $5,000 to $9,999 | 277 (0.8%) | 378 (2.5%) |
| $10,000 to $14,999 | 406 (1.1%) | 965 (6.4%) |
| $15,000 to $19,999 | 797 (2.2%) | 866 (5.7%) |
| $20,000 to $24,999 | 687 (1.9%) | 696 (4.6%) |
| $25,000 to $34,999 | 1,688 (4.7%) | 1,615 (10.7%) |
| $35,000 to $49,999 | 3,223 (9.0%) | 2,115 (14.0%) |
| $50,000 to $74,999 | 5,375 (15.0%) | 3,012 (20.0%) |
| $75,000 to $99,999 | 5,603 (15.7%) | 1,768 (11.7%) |
| $100,000 to $149,999 | 8,336 (23.3%) | 1,796 (11.9%) |
| $150,000 or more | 8,756 (24.5%) | 1,058 (7.0%) |
| Total | 35,746 (100.0%) | 15,078 (100.0%) |
Monthly Housing Cost Tiers in Skagit County
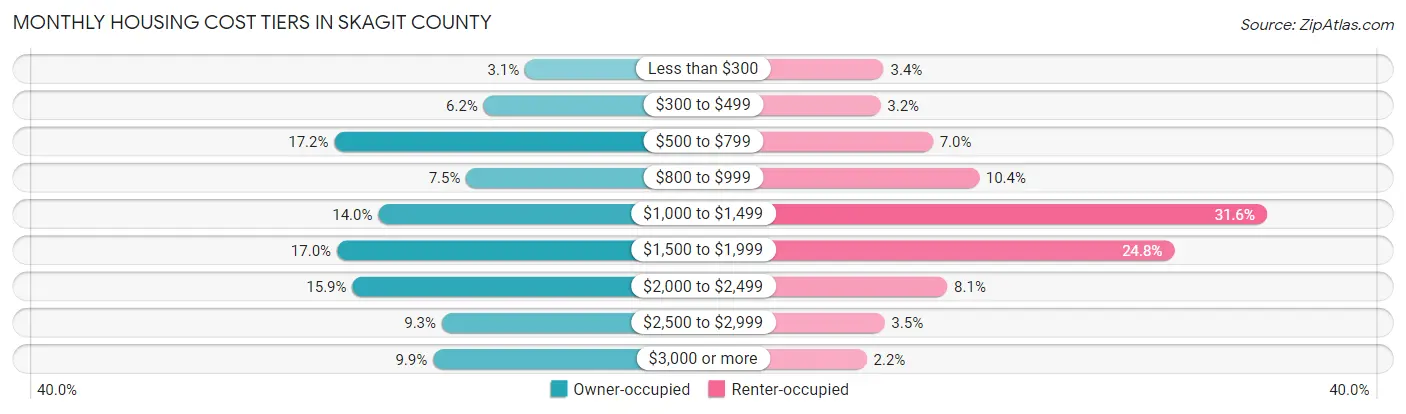
| Monthly Cost | Owner-occupied | Renter-occupied |
| Less than $300 | 1,122 (3.1%) | 512 (3.4%) |
| $300 to $499 | 2,212 (6.2%) | 476 (3.2%) |
| $500 to $799 | 6,146 (17.2%) | 1,059 (7.0%) |
| $800 to $999 | 2,671 (7.5%) | 1,570 (10.4%) |
| $1,000 to $1,499 | 4,986 (14.0%) | 4,768 (31.6%) |
| $1,500 to $1,999 | 6,078 (17.0%) | 3,740 (24.8%) |
| $2,000 to $2,499 | 5,671 (15.9%) | 1,219 (8.1%) |
| $2,500 to $2,999 | 3,315 (9.3%) | 521 (3.5%) |
| $3,000 or more | 3,545 (9.9%) | 324 (2.1%) |
| Total | 35,746 (100.0%) | 15,078 (100.0%) |
Physical Housing Characteristics in Skagit County
Housing Structures in Skagit County
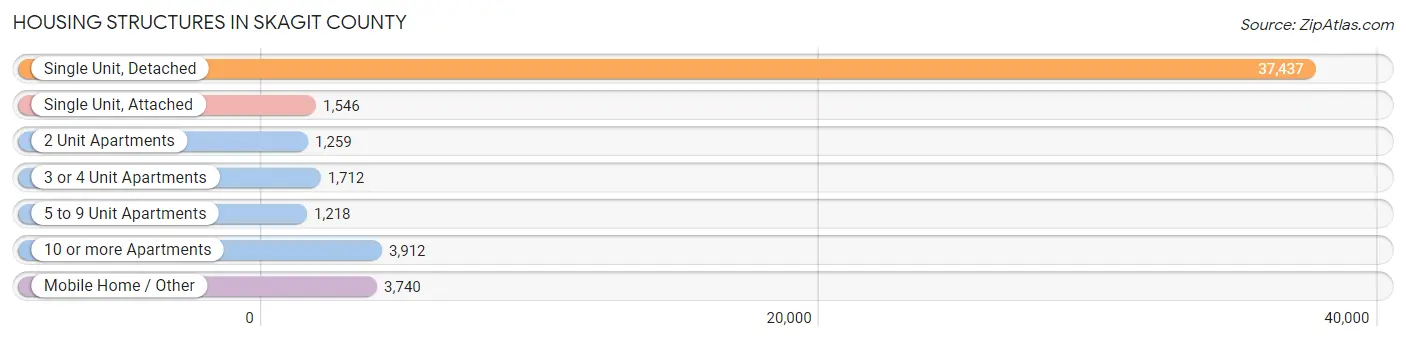
| Structure Type | # Housing Units | % Housing Units |
| Single Unit, Detached | 37,437 | 73.7% |
| Single Unit, Attached | 1,546 | 3.0% |
| 2 Unit Apartments | 1,259 | 2.5% |
| 3 or 4 Unit Apartments | 1,712 | 3.4% |
| 5 to 9 Unit Apartments | 1,218 | 2.4% |
| 10 or more Apartments | 3,912 | 7.7% |
| Mobile Home / Other | 3,740 | 7.4% |
| Total | 50,824 | 100.0% |
Housing Structures by Occupancy in Skagit County
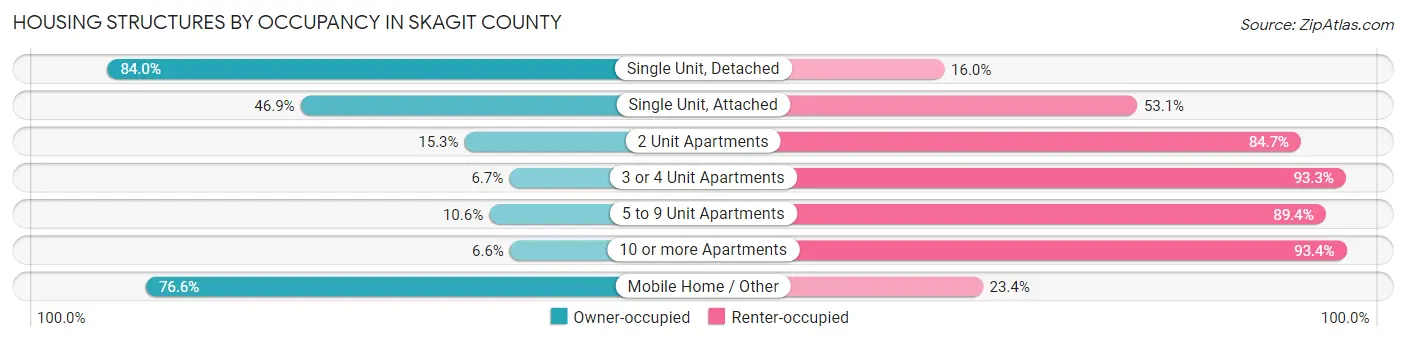
| Structure Type | Owner-occupied | Renter-occupied |
| Single Unit, Detached | 31,460 (84.0%) | 5,977 (16.0%) |
| Single Unit, Attached | 725 (46.9%) | 821 (53.1%) |
| 2 Unit Apartments | 193 (15.3%) | 1,066 (84.7%) |
| 3 or 4 Unit Apartments | 115 (6.7%) | 1,597 (93.3%) |
| 5 to 9 Unit Apartments | 129 (10.6%) | 1,089 (89.4%) |
| 10 or more Apartments | 258 (6.6%) | 3,654 (93.4%) |
| Mobile Home / Other | 2,866 (76.6%) | 874 (23.4%) |
| Total | 35,746 (70.3%) | 15,078 (29.7%) |
Housing Structures by Number of Rooms in Skagit County
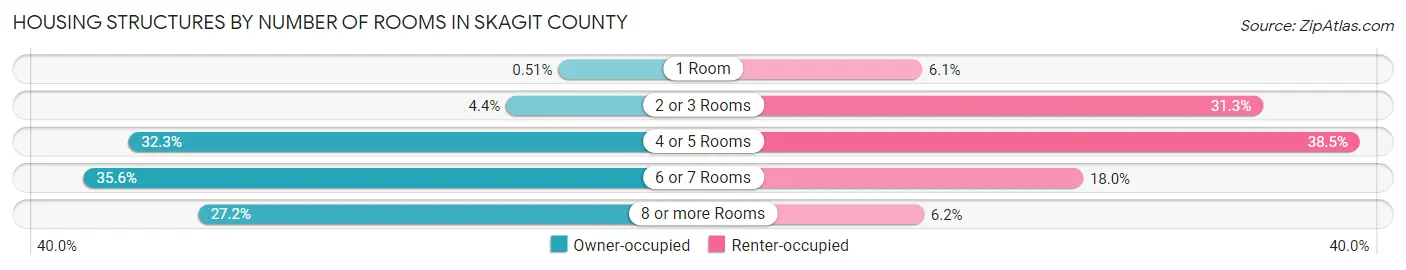
| Number of Rooms | Owner-occupied | Renter-occupied |
| 1 Room | 182 (0.5%) | 913 (6.1%) |
| 2 or 3 Rooms | 1,561 (4.4%) | 4,719 (31.3%) |
| 4 or 5 Rooms | 11,548 (32.3%) | 5,799 (38.5%) |
| 6 or 7 Rooms | 12,736 (35.6%) | 2,711 (18.0%) |
| 8 or more Rooms | 9,719 (27.2%) | 936 (6.2%) |
| Total | 35,746 (100.0%) | 15,078 (100.0%) |
Housing Structure by Heating Type in Skagit County
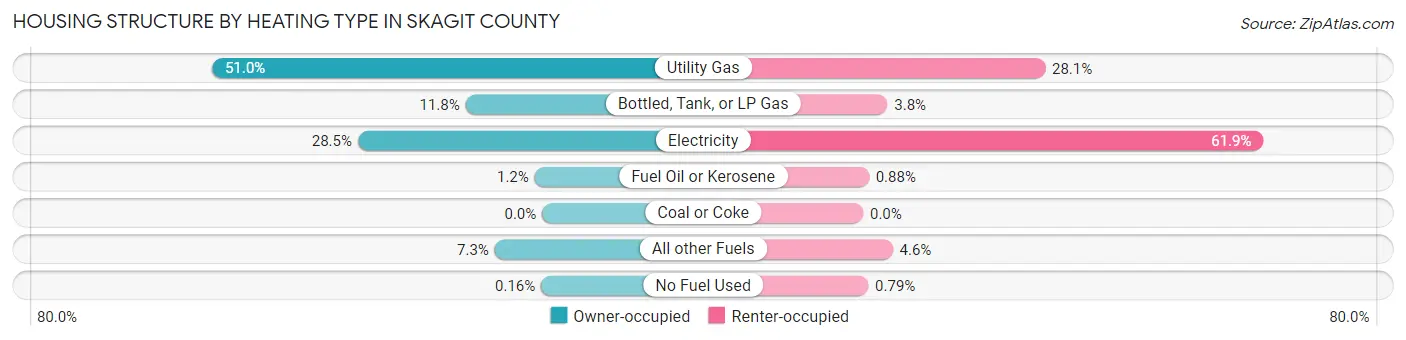
| Heating Type | Owner-occupied | Renter-occupied |
| Utility Gas | 18,240 (51.0%) | 4,243 (28.1%) |
| Bottled, Tank, or LP Gas | 4,233 (11.8%) | 565 (3.7%) |
| Electricity | 10,184 (28.5%) | 9,329 (61.9%) |
| Fuel Oil or Kerosene | 413 (1.2%) | 133 (0.9%) |
| Coal or Coke | 0 (0.0%) | 0 (0.0%) |
| All other Fuels | 2,620 (7.3%) | 689 (4.6%) |
| No Fuel Used | 56 (0.2%) | 119 (0.8%) |
| Total | 35,746 (100.0%) | 15,078 (100.0%) |
Household Vehicle Usage in Skagit County
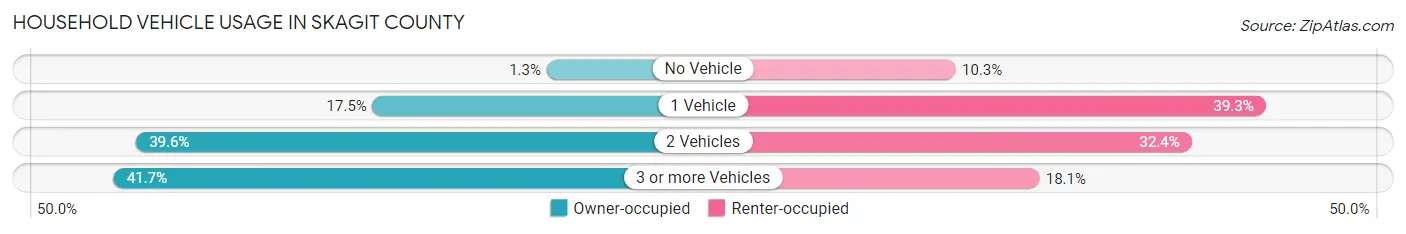
| Vehicles per Household | Owner-occupied | Renter-occupied |
| No Vehicle | 446 (1.3%) | 1,550 (10.3%) |
| 1 Vehicle | 6,258 (17.5%) | 5,920 (39.3%) |
| 2 Vehicles | 14,148 (39.6%) | 4,879 (32.4%) |
| 3 or more Vehicles | 14,894 (41.7%) | 2,729 (18.1%) |
| Total | 35,746 (100.0%) | 15,078 (100.0%) |
Real Estate & Mortgages in Skagit County
Real Estate and Mortgage Overview in Skagit County
| Characteristic | Without Mortgage | With Mortgage |
| Housing Units | 13,146 | 22,600 |
| Median Property Value | $432,300 | $449,800 |
| Median Household Income | $74,518 | $6,810 |
| Monthly Housing Costs | $681 | $3,506 |
| Real Estate Taxes | $3,766 | $562 |
Property Value by Mortgage Status in Skagit County
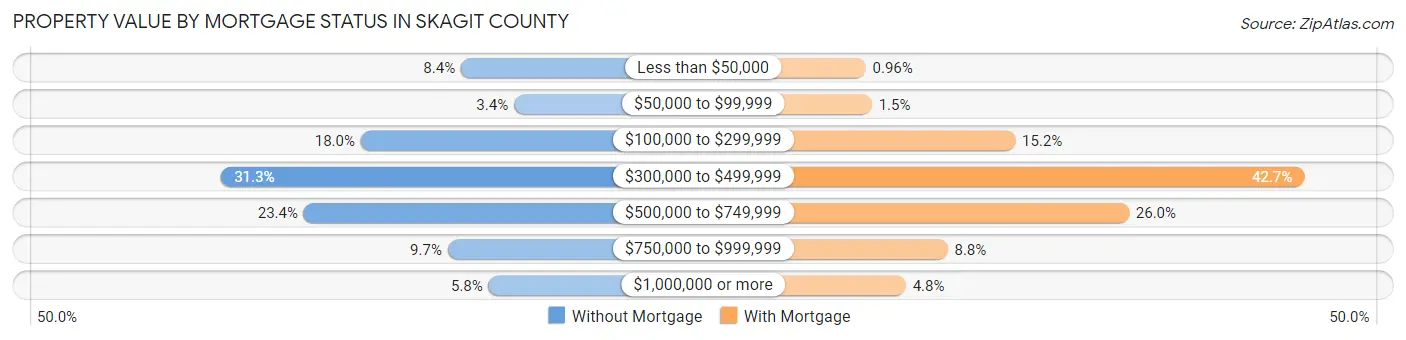
| Property Value | Without Mortgage | With Mortgage |
| Less than $50,000 | 1,109 (8.4%) | 218 (1.0%) |
| $50,000 to $99,999 | 445 (3.4%) | 348 (1.5%) |
| $100,000 to $299,999 | 2,364 (18.0%) | 3,435 (15.2%) |
| $300,000 to $499,999 | 4,111 (31.3%) | 9,658 (42.7%) |
| $500,000 to $749,999 | 3,078 (23.4%) | 5,882 (26.0%) |
| $750,000 to $999,999 | 1,275 (9.7%) | 1,979 (8.8%) |
| $1,000,000 or more | 764 (5.8%) | 1,080 (4.8%) |
| Total | 13,146 (100.0%) | 22,600 (100.0%) |
Household Income by Mortgage Status in Skagit County
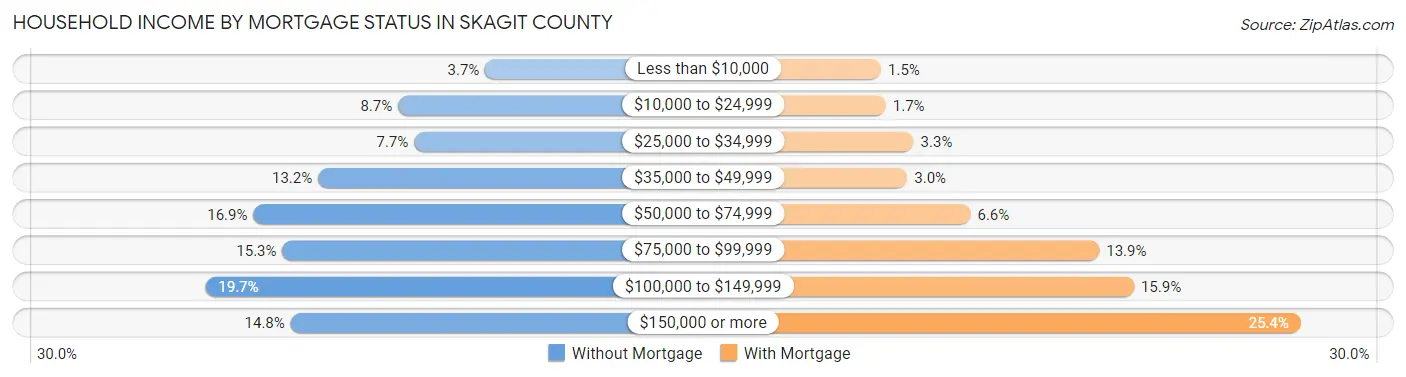
| Household Income | Without Mortgage | With Mortgage |
| Less than $10,000 | 484 (3.7%) | 329 (1.5%) |
| $10,000 to $24,999 | 1,139 (8.7%) | 391 (1.7%) |
| $25,000 to $34,999 | 1,018 (7.7%) | 751 (3.3%) |
| $35,000 to $49,999 | 1,739 (13.2%) | 670 (3.0%) |
| $50,000 to $74,999 | 2,226 (16.9%) | 1,484 (6.6%) |
| $75,000 to $99,999 | 2,008 (15.3%) | 3,149 (13.9%) |
| $100,000 to $149,999 | 2,586 (19.7%) | 3,595 (15.9%) |
| $150,000 or more | 1,946 (14.8%) | 5,750 (25.4%) |
| Total | 13,146 (100.0%) | 22,600 (100.0%) |
Property Value to Household Income Ratio in Skagit County
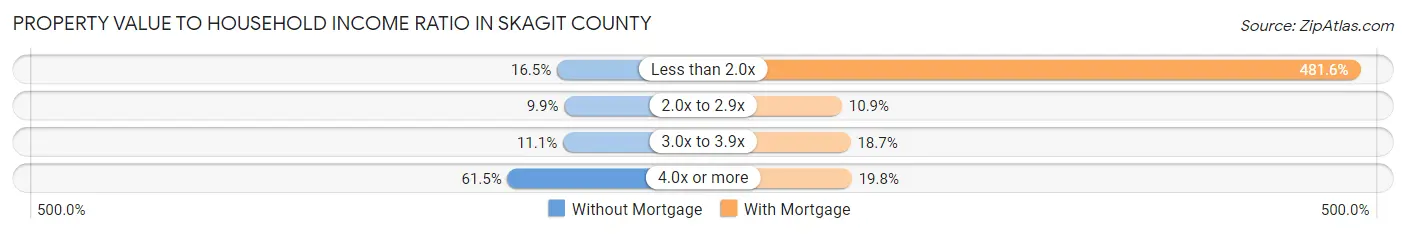
| Value-to-Income Ratio | Without Mortgage | With Mortgage |
| Less than 2.0x | 2,171 (16.5%) | 108,840 (481.6%) |
| 2.0x to 2.9x | 1,302 (9.9%) | 2,451 (10.8%) |
| 3.0x to 3.9x | 1,462 (11.1%) | 4,218 (18.7%) |
| 4.0x or more | 8,078 (61.5%) | 4,474 (19.8%) |
| Total | 13,146 (100.0%) | 22,600 (100.0%) |
Real Estate Taxes by Mortgage Status in Skagit County
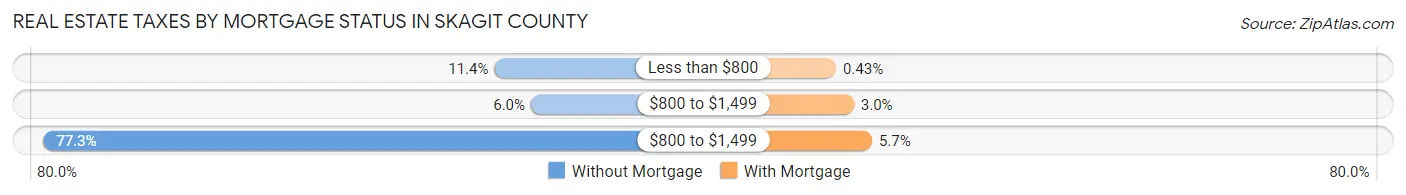
| Property Taxes | Without Mortgage | With Mortgage |
| Less than $800 | 1,495 (11.4%) | 98 (0.4%) |
| $800 to $1,499 | 793 (6.0%) | 686 (3.0%) |
| $800 to $1,499 | 10,157 (77.3%) | 1,286 (5.7%) |
| Total | 13,146 (100.0%) | 22,600 (100.0%) |
Health & Disability in Skagit County
Health Insurance Coverage by Age in Skagit County
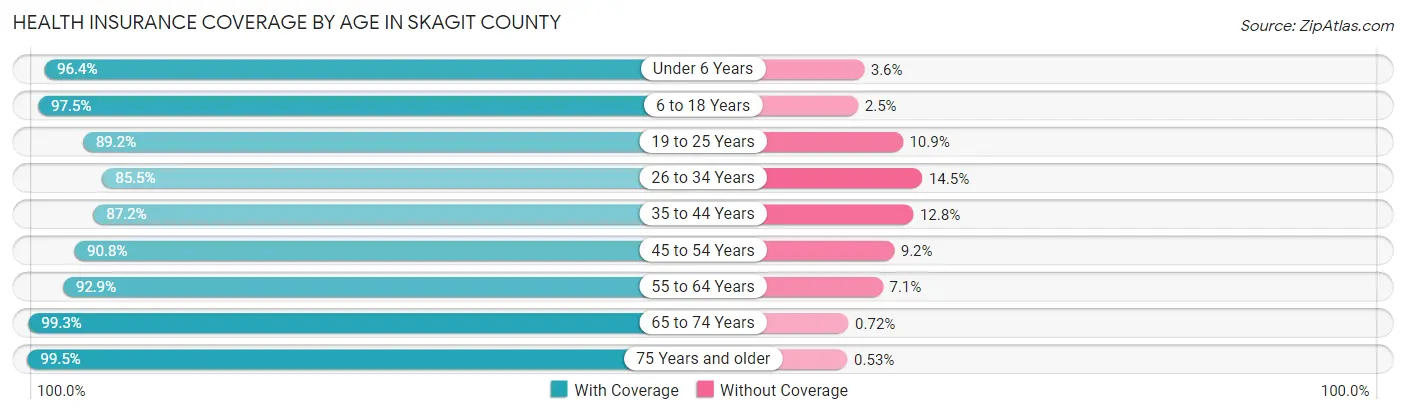
| Age Bracket | With Coverage | Without Coverage |
| Under 6 Years | 8,706 (96.4%) | 328 (3.6%) |
| 6 to 18 Years | 19,741 (97.5%) | 512 (2.5%) |
| 19 to 25 Years | 8,486 (89.1%) | 1,033 (10.8%) |
| 26 to 34 Years | 11,886 (85.5%) | 2,014 (14.5%) |
| 35 to 44 Years | 13,493 (87.2%) | 1,982 (12.8%) |
| 45 to 54 Years | 13,085 (90.8%) | 1,330 (9.2%) |
| 55 to 64 Years | 16,171 (92.9%) | 1,242 (7.1%) |
| 65 to 74 Years | 16,455 (99.3%) | 119 (0.7%) |
| 75 Years and older | 10,832 (99.5%) | 58 (0.5%) |
| Total | 118,855 (93.2%) | 8,618 (6.8%) |
Health Insurance Coverage by Citizenship Status in Skagit County
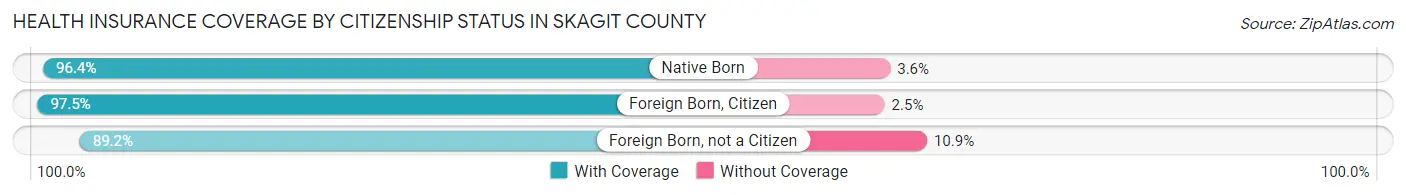
| Citizenship Status | With Coverage | Without Coverage |
| Native Born | 8,706 (96.4%) | 328 (3.6%) |
| Foreign Born, Citizen | 19,741 (97.5%) | 512 (2.5%) |
| Foreign Born, not a Citizen | 8,486 (89.1%) | 1,033 (10.8%) |
Health Insurance Coverage by Household Income in Skagit County
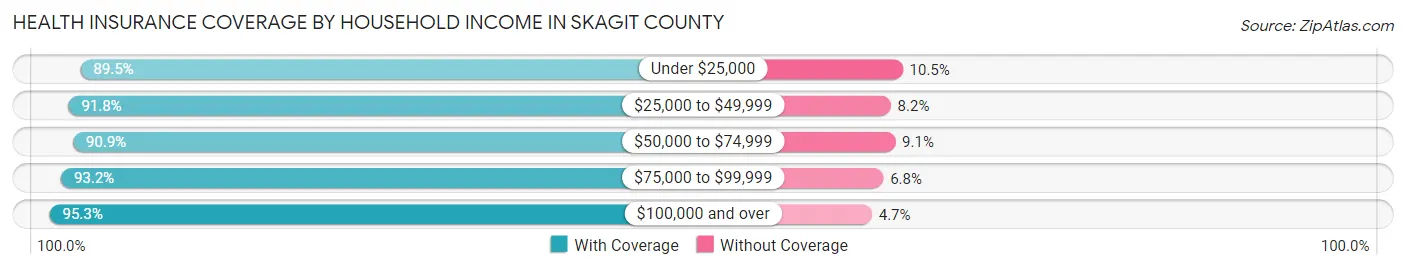
| Household Income | With Coverage | Without Coverage |
| Under $25,000 | 10,005 (89.5%) | 1,169 (10.5%) |
| $25,000 to $49,999 | 16,520 (91.8%) | 1,480 (8.2%) |
| $50,000 to $74,999 | 17,285 (90.9%) | 1,722 (9.1%) |
| $75,000 to $99,999 | 18,177 (93.2%) | 1,330 (6.8%) |
| $100,000 and over | 55,856 (95.3%) | 2,745 (4.7%) |
Public vs Private Health Insurance Coverage by Age in Skagit County
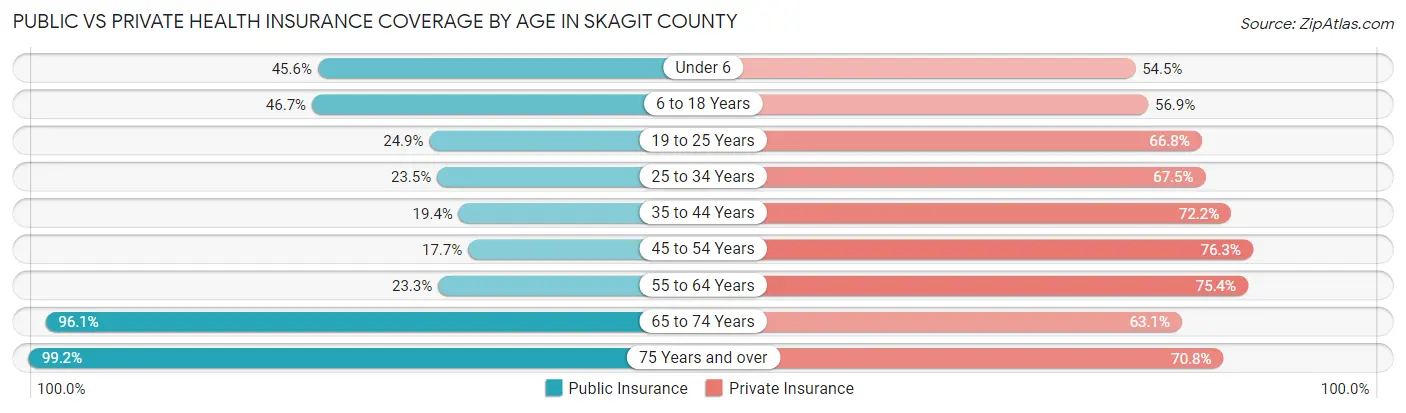
| Age Bracket | Public Insurance | Private Insurance |
| Under 6 | 4,119 (45.6%) | 4,920 (54.5%) |
| 6 to 18 Years | 9,453 (46.7%) | 11,513 (56.9%) |
| 19 to 25 Years | 2,368 (24.9%) | 6,357 (66.8%) |
| 25 to 34 Years | 3,260 (23.4%) | 9,378 (67.5%) |
| 35 to 44 Years | 3,007 (19.4%) | 11,179 (72.2%) |
| 45 to 54 Years | 2,550 (17.7%) | 10,996 (76.3%) |
| 55 to 64 Years | 4,050 (23.3%) | 13,122 (75.4%) |
| 65 to 74 Years | 15,934 (96.1%) | 10,457 (63.1%) |
| 75 Years and over | 10,803 (99.2%) | 7,712 (70.8%) |
| Total | 55,544 (43.6%) | 85,634 (67.2%) |
Disability Status by Sex by Age in Skagit County
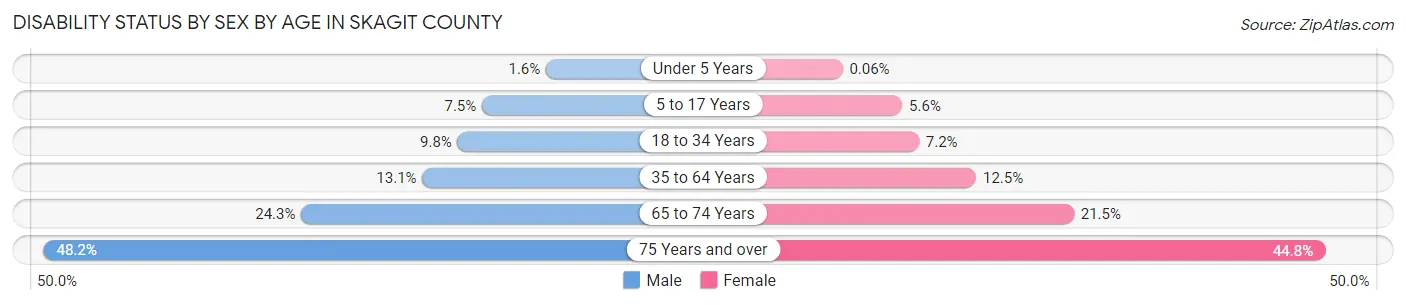
| Age Bracket | Male | Female |
| Under 5 Years | 59 (1.6%) | 2 (0.1%) |
| 5 to 17 Years | 788 (7.5%) | 561 (5.6%) |
| 18 to 34 Years | 1,252 (9.8%) | 883 (7.1%) |
| 35 to 64 Years | 3,063 (13.1%) | 2,975 (12.5%) |
| 65 to 74 Years | 1,918 (24.3%) | 1,871 (21.5%) |
| 75 Years and over | 2,391 (48.2%) | 2,661 (44.8%) |
Disability Class by Sex by Age in Skagit County
Disability Class: Hearing Difficulty
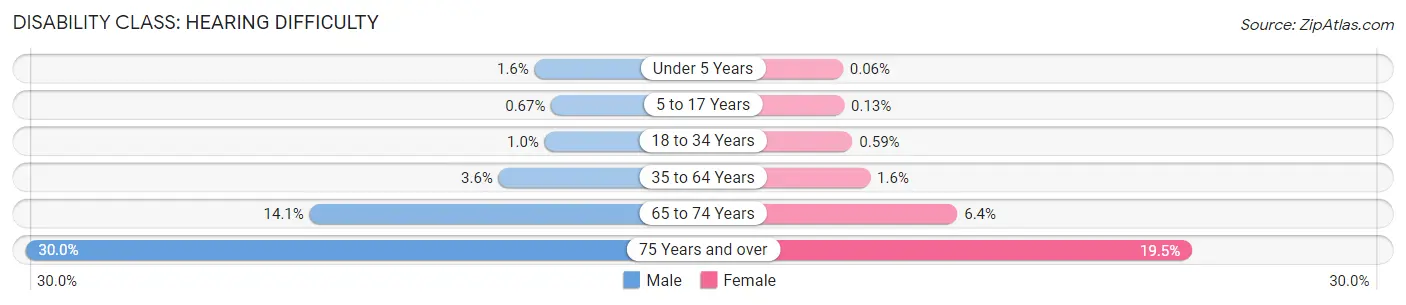
| Age Bracket | Male | Female |
| Under 5 Years | 59 (1.6%) | 2 (0.1%) |
| 5 to 17 Years | 70 (0.7%) | 13 (0.1%) |
| 18 to 34 Years | 133 (1.0%) | 73 (0.6%) |
| 35 to 64 Years | 844 (3.6%) | 377 (1.6%) |
| 65 to 74 Years | 1,114 (14.1%) | 559 (6.4%) |
| 75 Years and over | 1,485 (30.0%) | 1,157 (19.5%) |
Disability Class: Vision Difficulty
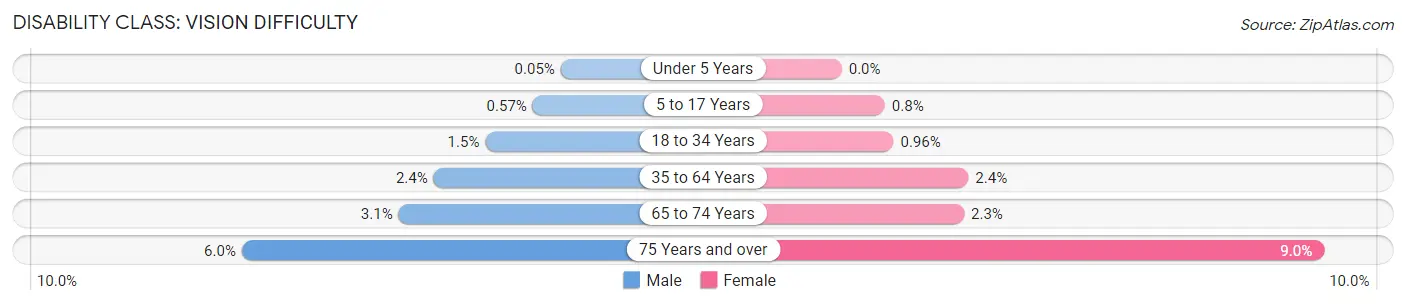
| Age Bracket | Male | Female |
| Under 5 Years | 2 (0.1%) | 0 (0.0%) |
| 5 to 17 Years | 60 (0.6%) | 80 (0.8%) |
| 18 to 34 Years | 185 (1.5%) | 118 (1.0%) |
| 35 to 64 Years | 564 (2.4%) | 561 (2.4%) |
| 65 to 74 Years | 241 (3.1%) | 197 (2.3%) |
| 75 Years and over | 296 (6.0%) | 531 (8.9%) |
Disability Class: Cognitive Difficulty
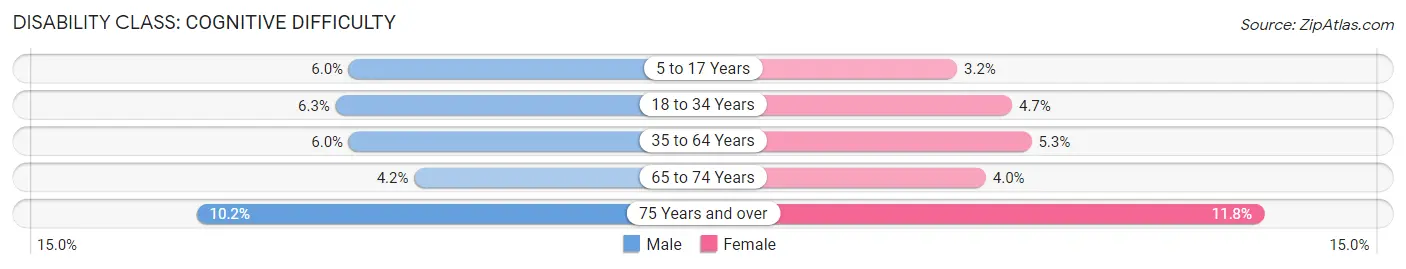
| Age Bracket | Male | Female |
| 5 to 17 Years | 624 (6.0%) | 321 (3.2%) |
| 18 to 34 Years | 809 (6.3%) | 585 (4.7%) |
| 35 to 64 Years | 1,399 (6.0%) | 1,260 (5.3%) |
| 65 to 74 Years | 327 (4.2%) | 348 (4.0%) |
| 75 Years and over | 506 (10.2%) | 697 (11.7%) |
Disability Class: Ambulatory Difficulty
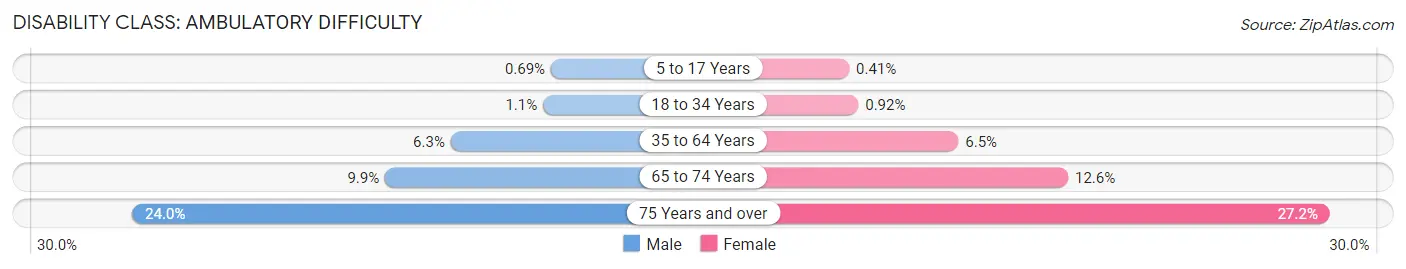
| Age Bracket | Male | Female |
| 5 to 17 Years | 72 (0.7%) | 41 (0.4%) |
| 18 to 34 Years | 144 (1.1%) | 113 (0.9%) |
| 35 to 64 Years | 1,468 (6.3%) | 1,550 (6.5%) |
| 65 to 74 Years | 783 (9.9%) | 1,095 (12.6%) |
| 75 Years and over | 1,190 (24.0%) | 1,612 (27.2%) |
Disability Class: Self-Care Difficulty
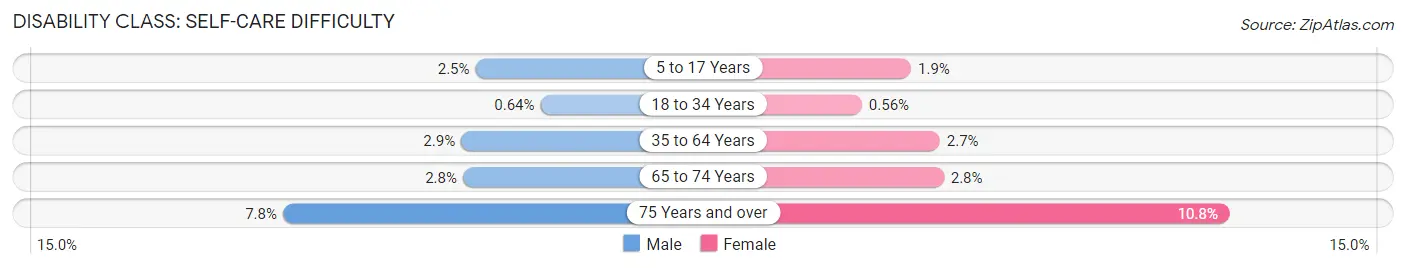
| Age Bracket | Male | Female |
| 5 to 17 Years | 256 (2.5%) | 193 (1.9%) |
| 18 to 34 Years | 82 (0.6%) | 69 (0.6%) |
| 35 to 64 Years | 667 (2.9%) | 653 (2.7%) |
| 65 to 74 Years | 221 (2.8%) | 247 (2.8%) |
| 75 Years and over | 387 (7.8%) | 641 (10.8%) |
Technology Access in Skagit County
Computing Device Access in Skagit County
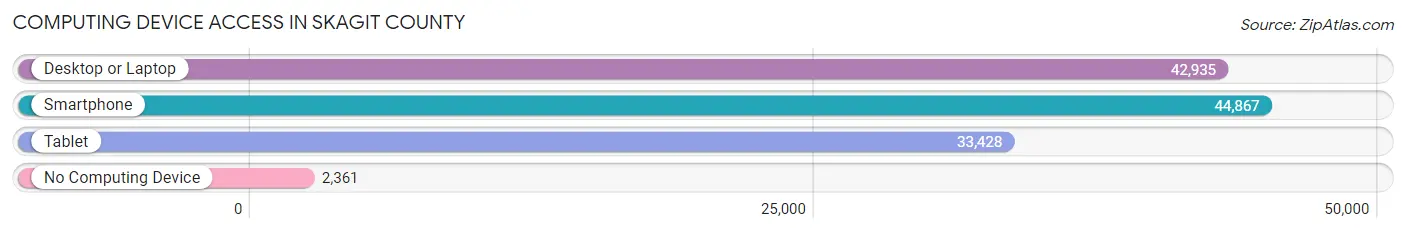
| Device Type | # Households | % Households |
| Desktop or Laptop | 42,935 | 84.5% |
| Smartphone | 44,867 | 88.3% |
| Tablet | 33,428 | 65.8% |
| No Computing Device | 2,361 | 4.6% |
| Total | 50,824 | 100.0% |
Internet Access in Skagit County
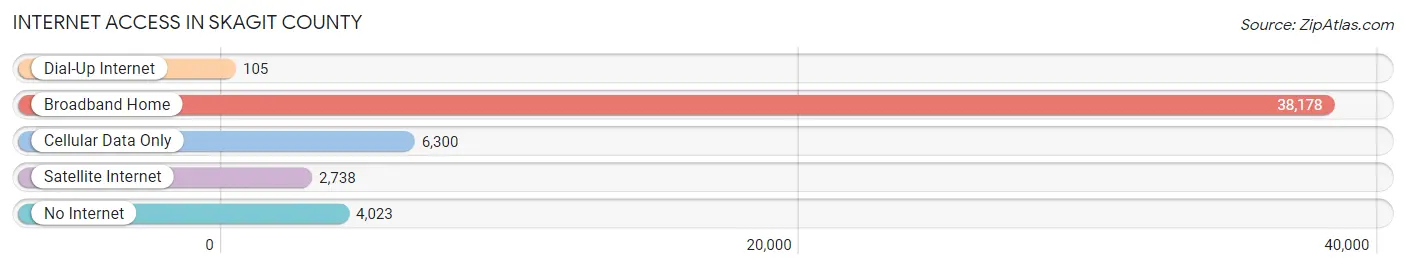
| Internet Type | # Households | % Households |
| Dial-Up Internet | 105 | 0.2% |
| Broadband Home | 38,178 | 75.1% |
| Cellular Data Only | 6,300 | 12.4% |
| Satellite Internet | 2,738 | 5.4% |
| No Internet | 4,023 | 7.9% |
| Total | 50,824 | 100.0% |
Skagit County Summary
Skagit County is located in the northwest corner of Washington State, and is bordered by the Canadian province of British Columbia to the north, Whatcom County to the south, Snohomish County to the east, and the Puget Sound to the west. The county seat is Mount Vernon, and the largest city is Burlington. The county covers an area of 1,911 square miles, and has a population of 122,110 as of the 2019 census.
Geography
Skagit County is located in the Puget Sound region of Washington State, and is part of the Cascade Range. The county is home to several mountain ranges, including the North Cascades, the Chuckanuts, and the Skagit Range. The county is also home to several rivers, including the Skagit, Sauk, and Stillaguamish. The county is also home to several lakes, including Lake Samish, Lake Cavanaugh, and Lake McMurray.
The county is home to several state parks, including Deception Pass State Park, which is located on Fidalgo Island, and is the most visited state park in Washington State. The county is also home to several wildlife refuges, including the Skagit Wildlife Area, which is home to a variety of birds and other wildlife.
Economy
Skagit County is home to a diverse economy, with a variety of industries, including agriculture, manufacturing, tourism, and retail. Agriculture is the largest industry in the county, with dairy, poultry, and berry farming being the most common. Manufacturing is also a major industry in the county, with companies such as Boeing, Microsoft, and Amazon having a presence in the county. Tourism is also a major industry in the county, with the county being home to several popular attractions, such as Deception Pass State Park, the Skagit Valley Tulip Festival, and the San Juan Islands. Retail is also a major industry in the county, with several major retailers, such as Walmart, Target, and Costco, having a presence in the county.
Demographics
As of the 2019 census, Skagit County had a population of 122,110. The population is made up of a variety of ethnic and racial groups, including White (83.3%), Hispanic or Latino (7.7%), Asian (3.7%), and African American (2.2%). The median household income in the county is $60,945, and the median home value is $310,000. The county is also home to a variety of educational institutions, including Skagit Valley College, Western Washington University, and the University of Washington.
Skagit County is a diverse and vibrant county, with a variety of industries, attractions, and educational institutions. The county is home to a variety of ethnic and racial groups, and has a strong economy. The county is also home to several state parks and wildlife refuges, making it a great place to live, work, and play.
Common Questions
What is the Total Population of Skagit County?
Total Population of Skagit County is 129,480.
What is the Total Male Population of Skagit County?
Total Male Population of Skagit County is 64,614.
What is the Total Female Population of Skagit County?
Total Female Population of Skagit County is 64,866.
What is the Ratio of Males per 100 Females in Skagit County?
There are 99.61 Males per 100 Females in Skagit County.
What is the Ratio of Females per 100 Males in Skagit County?
There are 100.39 Females per 100 Males in Skagit County.
What is the Median Population Age in Skagit County?
Median Population Age in Skagit County is 41.5 Years.
What is the Average Family Size in Skagit County
Average Family Size in Skagit County is 3.0 People.
What is the Average Household Size in Skagit County
Average Household Size in Skagit County is 2.5 People.
What is Per Capita Income in Skagit County?
Per Capita income in Skagit County is $41,191.
What is the Median Family Income in Skagit County?
Median Family Income in Skagit County is $94,291.
What is the Median Household income in Skagit County?
Median Household Income in Skagit County is $82,029.
What is Income or Wage Gap in Skagit County?
Income or Wage Gap in Skagit County is 33.4%.
Women in Skagit County earn 66.6 cents for every dollar earned by a man.
What is Family Income Deficit in Skagit County?
Family Income Deficit in Skagit County is $12,512.
Families that are below poverty line in Skagit County earn $12,512 less on average than the poverty threshold level.
What is Inequality or Gini Index in Skagit County?
Inequality or Gini Index in Skagit County is 0.44.
How Large is the Labor Force in Skagit County?
There are 62,127 People in the Labor Forcein in Skagit County.
What is the Percentage of People in the Labor Force in Skagit County?
59.0% of People are in the Labor Force in Skagit County.
What is the Unemployment Rate in Skagit County?
Unemployment Rate in Skagit County is 5.1%.