Pierce County, WA
Pierce County Overview
918,993
TOTAL POPULATION
462,489
MALE POPULATION
456,504
FEMALE POPULATION
101.31
MALES / 100 FEMALES
98.71
FEMALES / 100 MALES
36.5
MEDIAN AGE
3.1
AVG FAMILY SIZE
2.6
AVG HOUSEHOLD SIZE
$43,575
PER CAPITA INCOME
$104,927
AVG FAMILY INCOME
$91,486
AVG HOUSEHOLD INCOME
27.5%
WAGE / INCOME GAP [ % ]
72.5¢/ $1
WAGE / INCOME GAP [ $ ]
$12,271
FAMILY INCOME DEFICIT
0.42
INEQUALITY / GINI INDEX
483,112
LABOR FORCE [ PEOPLE ]
66.3%
PERCENT IN LABOR FORCE
5.0%
UNEMPLOYMENT RATE
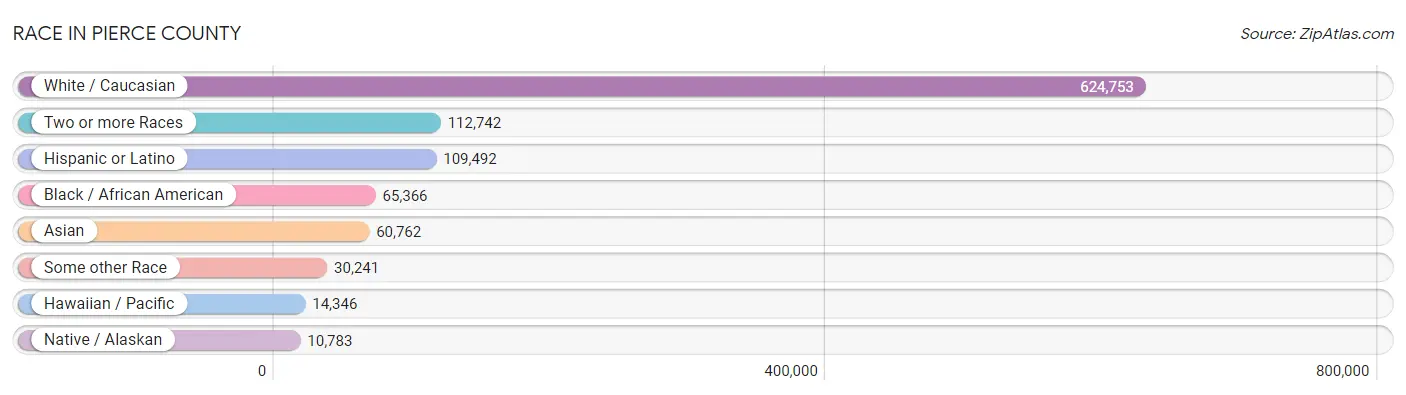
Race in Pierce County
The most populous races in Pierce County are White / Caucasian (624,753 | 68.0%), Two or more Races (112,742 | 12.3%), and Hispanic or Latino (109,492 | 11.9%).
| Race | # Population | % Population |
| Asian | 60,762 | 6.6% |
| Black / African American | 65,366 | 7.1% |
| Hawaiian / Pacific | 14,346 | 1.6% |
| Hispanic or Latino | 109,492 | 11.9% |
| Native / Alaskan | 10,783 | 1.2% |
| White / Caucasian | 624,753 | 68.0% |
| Two or more Races | 112,742 | 12.3% |
| Some other Race | 30,241 | 3.3% |
| Total | 918,993 | 100.0% |
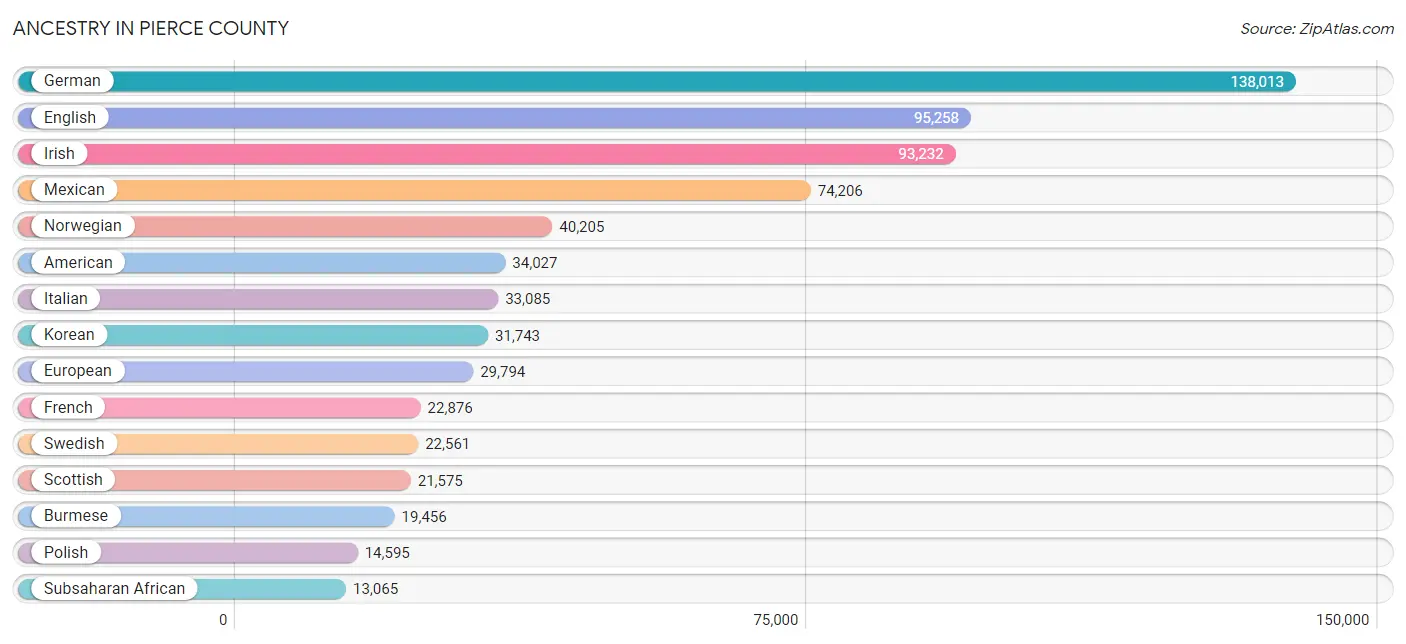
Ancestry in Pierce County
The most populous ancestries reported in Pierce County are German (138,013 | 15.0%), English (95,258 | 10.4%), Irish (93,232 | 10.2%), Mexican (74,206 | 8.1%), and Norwegian (40,205 | 4.4%), together accounting for 48.0% of all Pierce County residents.
| Ancestry | # Population | % Population |
| Afghan | 318 | 0.0% |
| African | 7,248 | 0.8% |
| Alaska Native | 646 | 0.1% |
| Alaskan Athabascan | 181 | 0.0% |
| Albanian | 95 | 0.0% |
| Aleut | 621 | 0.1% |
| Alsatian | 19 | 0.0% |
| American | 34,027 | 3.7% |
| Apache | 619 | 0.1% |
| Arab | 3,057 | 0.3% |
| Arapaho | 11 | 0.0% |
| Argentinean | 521 | 0.1% |
| Armenian | 340 | 0.0% |
| Assyrian / Chaldean / Syriac | 13 | 0.0% |
| Australian | 234 | 0.0% |
| Austrian | 1,303 | 0.1% |
| Bahamian | 58 | 0.0% |
| Bangladeshi | 233 | 0.0% |
| Barbadian | 46 | 0.0% |
| Basque | 144 | 0.0% |
| Belgian | 1,144 | 0.1% |
| Belizean | 234 | 0.0% |
| Bhutanese | 12,863 | 1.4% |
| Blackfeet | 2,298 | 0.3% |
| Bolivian | 81 | 0.0% |
| Brazilian | 683 | 0.1% |
| British | 7,448 | 0.8% |
| British West Indian | 107 | 0.0% |
| Bulgarian | 262 | 0.0% |
| Burmese | 19,456 | 2.1% |
| Cajun | 85 | 0.0% |
| Cambodian | 14 | 0.0% |
| Canadian | 2,634 | 0.3% |
| Carpatho Rusyn | 19 | 0.0% |
| Celtic | 331 | 0.0% |
| Central American | 8,385 | 0.9% |
| Central American Indian | 1,014 | 0.1% |
| Cherokee | 4,564 | 0.5% |
| Cheyenne | 249 | 0.0% |
| Chickasaw | 187 | 0.0% |
| Chilean | 319 | 0.0% |
| Chinese | 109 | 0.0% |
| Chippewa | 1,403 | 0.2% |
| Choctaw | 1,136 | 0.1% |
| Colombian | 1,303 | 0.1% |
| Colville | 378 | 0.0% |
| Comanche | 131 | 0.0% |
| Costa Rican | 365 | 0.0% |
| Cree | 65 | 0.0% |
| Creek | 306 | 0.0% |
| Croatian | 1,929 | 0.2% |
| Crow | 73 | 0.0% |
| Cuban | 1,534 | 0.2% |
| Czech | 3,179 | 0.4% |
| Czechoslovakian | 831 | 0.1% |
| Danish | 7,015 | 0.8% |
| Delaware | 128 | 0.0% |
| Dominican | 957 | 0.1% |
| Dutch | 10,871 | 1.2% |
| Dutch West Indian | 3 | 0.0% |
| Eastern European | 2,270 | 0.3% |
| Ecuadorian | 244 | 0.0% |
| Egyptian | 220 | 0.0% |
| English | 95,258 | 10.4% |
| Estonian | 87 | 0.0% |
| Ethiopian | 605 | 0.1% |
| European | 29,794 | 3.2% |
| Fijian | 363 | 0.0% |
| Filipino | 359 | 0.0% |
| Finnish | 3,649 | 0.4% |
| French | 22,876 | 2.5% |
| French American Indian | 291 | 0.0% |
| French Canadian | 5,380 | 0.6% |
| German | 138,013 | 15.0% |
| German Russian | 70 | 0.0% |
| Ghanaian | 200 | 0.0% |
| Greek | 2,699 | 0.3% |
| Guamanian / Chamorro | 6,061 | 0.7% |
| Guatemalan | 1,311 | 0.1% |
| Guyanese | 62 | 0.0% |
| Haitian | 289 | 0.0% |
| Hmong | 9 | 0.0% |
| Honduran | 1,513 | 0.2% |
| Hopi | 29 | 0.0% |
| Houma | 58 | 0.0% |
| Hungarian | 1,564 | 0.2% |
| Icelander | 559 | 0.1% |
| Indian (Asian) | 10,429 | 1.1% |
| Indonesian | 268 | 0.0% |
| Inupiat | 174 | 0.0% |
| Iranian | 894 | 0.1% |
| Iraqi | 429 | 0.1% |
| Irish | 93,232 | 10.2% |
| Iroquois | 505 | 0.1% |
| Israeli | 165 | 0.0% |
| Italian | 33,085 | 3.6% |
| Jamaican | 1,425 | 0.2% |
| Japanese | 7,779 | 0.9% |
| Jordanian | 18 | 0.0% |
| Kenyan | 2,311 | 0.3% |
| Kiowa | 107 | 0.0% |
| Korean | 31,743 | 3.5% |
| Laotian | 234 | 0.0% |
| Latvian | 272 | 0.0% |
| Lebanese | 826 | 0.1% |
| Liberian | 75 | 0.0% |
| Lithuanian | 1,075 | 0.1% |
| Luxembourger | 38 | 0.0% |
| Macedonian | 149 | 0.0% |
| Malaysian | 2,030 | 0.2% |
| Maltese | 9 | 0.0% |
| Mexican | 74,206 | 8.1% |
| Mexican American Indian | 1,948 | 0.2% |
| Mongolian | 29 | 0.0% |
| Moroccan | 251 | 0.0% |
| Native Hawaiian | 6,748 | 0.7% |
| Navajo | 1,152 | 0.1% |
| Nepalese | 8 | 0.0% |
| New Zealander | 47 | 0.0% |
| Nicaraguan | 502 | 0.1% |
| Nigerian | 1,024 | 0.1% |
| Northern European | 3,212 | 0.4% |
| Norwegian | 40,205 | 4.4% |
| Osage | 211 | 0.0% |
| Pakistani | 2,033 | 0.2% |
| Palestinian | 350 | 0.0% |
| Panamanian | 1,461 | 0.2% |
| Pennsylvania German | 244 | 0.0% |
| Peruvian | 1,129 | 0.1% |
| Polish | 14,595 | 1.6% |
| Portuguese | 3,957 | 0.4% |
| Potawatomi | 49 | 0.0% |
| Pueblo | 232 | 0.0% |
| Puerto Rican | 10,729 | 1.2% |
| Puget Sound Salish | 4,238 | 0.5% |
| Romanian | 1,743 | 0.2% |
| Russian | 6,930 | 0.7% |
| Salvadoran | 3,215 | 0.4% |
| Samoan | 8,036 | 0.9% |
| Scandinavian | 10,766 | 1.2% |
| Scotch-Irish | 7,857 | 0.9% |
| Scottish | 21,575 | 2.4% |
| Seminole | 67 | 0.0% |
| Senegalese | 57 | 0.0% |
| Serbian | 263 | 0.0% |
| Shoshone | 39 | 0.0% |
| Sierra Leonean | 18 | 0.0% |
| Sioux | 1,171 | 0.1% |
| Slavic | 454 | 0.1% |
| Slovak | 658 | 0.1% |
| Slovene | 223 | 0.0% |
| Somali | 222 | 0.0% |
| South African | 247 | 0.0% |
| South American | 3,884 | 0.4% |
| South American Indian | 39 | 0.0% |
| Spaniard | 4,776 | 0.5% |
| Spanish | 2,006 | 0.2% |
| Spanish American | 18 | 0.0% |
| Sri Lankan | 10,269 | 1.1% |
| Subsaharan African | 13,065 | 1.4% |
| Swedish | 22,561 | 2.5% |
| Swiss | 3,063 | 0.3% |
| Syrian | 86 | 0.0% |
| Taiwanese | 26 | 0.0% |
| Thai | 4,330 | 0.5% |
| Tlingit-Haida | 860 | 0.1% |
| Tohono O'Odham | 35 | 0.0% |
| Tongan | 509 | 0.1% |
| Trinidadian and Tobagonian | 431 | 0.1% |
| Tsimshian | 75 | 0.0% |
| Turkish | 1,129 | 0.1% |
| U.S. Virgin Islander | 7 | 0.0% |
| Ugandan | 349 | 0.0% |
| Ukrainian | 8,517 | 0.9% |
| Uruguayan | 5 | 0.0% |
| Ute | 37 | 0.0% |
| Venezuelan | 282 | 0.0% |
| Vietnamese | 102 | 0.0% |
| Welsh | 6,361 | 0.7% |
| West Indian | 454 | 0.1% |
| Yakama | 473 | 0.1% |
| Yaqui | 102 | 0.0% |
| Yugoslavian | 701 | 0.1% |
| Yuman | 15 | 0.0% |
| Yup'ik | 106 | 0.0% |
| Zimbabwean | 27 | 0.0% | View All 186 Rows |
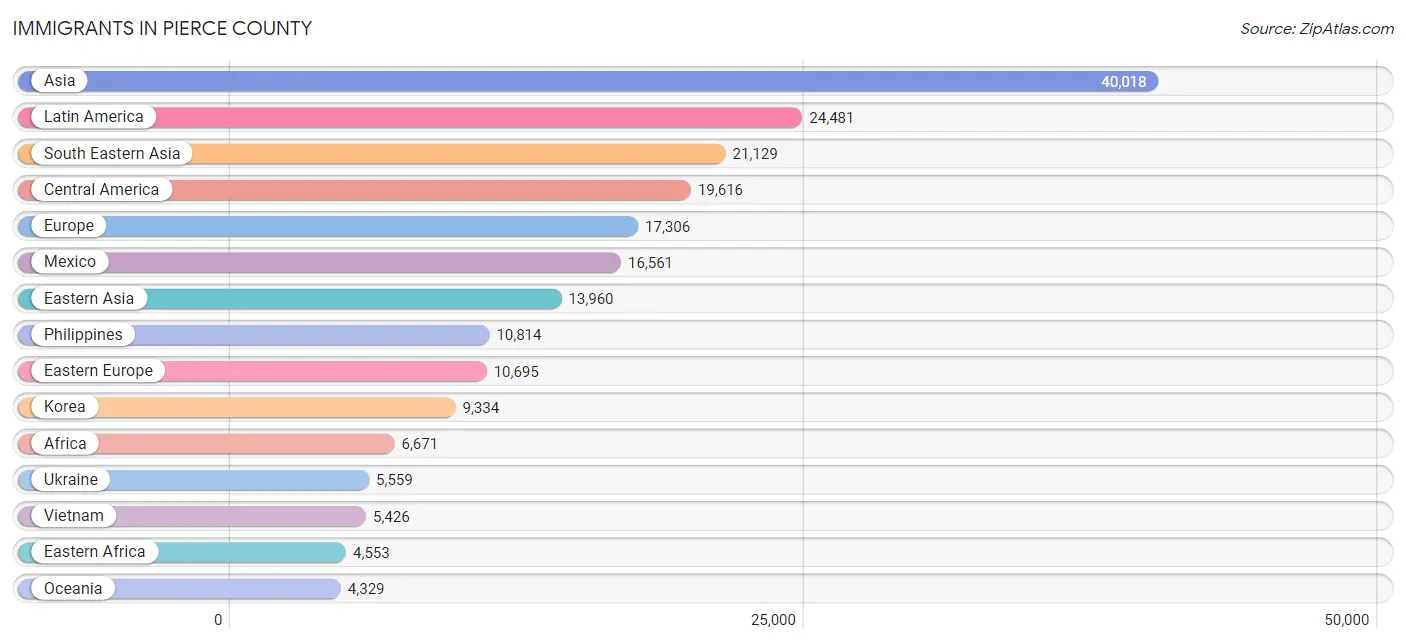
Immigrants in Pierce County
The most numerous immigrant groups reported in Pierce County came from Asia (40,018 | 4.3%), Latin America (24,481 | 2.7%), South Eastern Asia (21,129 | 2.3%), Central America (19,616 | 2.1%), and Europe (17,306 | 1.9%), together accounting for 13.3% of all Pierce County residents.
| Immigration Origin | # Population | % Population |
| Afghanistan | 247 | 0.0% |
| Africa | 6,671 | 0.7% |
| Albania | 12 | 0.0% |
| Argentina | 160 | 0.0% |
| Armenia | 40 | 0.0% |
| Asia | 40,018 | 4.3% |
| Australia | 290 | 0.0% |
| Austria | 101 | 0.0% |
| Bangladesh | 72 | 0.0% |
| Barbados | 52 | 0.0% |
| Belarus | 874 | 0.1% |
| Belgium | 13 | 0.0% |
| Belize | 201 | 0.0% |
| Bolivia | 19 | 0.0% |
| Bosnia and Herzegovina | 24 | 0.0% |
| Brazil | 444 | 0.1% |
| Bulgaria | 111 | 0.0% |
| Cambodia | 2,387 | 0.3% |
| Cameroon | 91 | 0.0% |
| Canada | 3,352 | 0.4% |
| Caribbean | 2,711 | 0.3% |
| Central America | 19,616 | 2.1% |
| Chile | 106 | 0.0% |
| China | 2,936 | 0.3% |
| Colombia | 635 | 0.1% |
| Congo | 83 | 0.0% |
| Costa Rica | 168 | 0.0% |
| Croatia | 7 | 0.0% |
| Cuba | 395 | 0.0% |
| Czechoslovakia | 127 | 0.0% |
| Denmark | 176 | 0.0% |
| Dominican Republic | 405 | 0.0% |
| Eastern Africa | 4,553 | 0.5% |
| Eastern Asia | 13,960 | 1.5% |
| Eastern Europe | 10,695 | 1.2% |
| Ecuador | 52 | 0.0% |
| Egypt | 171 | 0.0% |
| El Salvador | 1,139 | 0.1% |
| England | 825 | 0.1% |
| Ethiopia | 292 | 0.0% |
| Europe | 17,306 | 1.9% |
| Fiji | 319 | 0.0% |
| France | 238 | 0.0% |
| Germany | 3,047 | 0.3% |
| Ghana | 149 | 0.0% |
| Greece | 72 | 0.0% |
| Guatemala | 633 | 0.1% |
| Guyana | 38 | 0.0% |
| Haiti | 636 | 0.1% |
| Honduras | 639 | 0.1% |
| Hong Kong | 120 | 0.0% |
| Hungary | 145 | 0.0% |
| India | 1,748 | 0.2% |
| Indonesia | 247 | 0.0% |
| Iran | 626 | 0.1% |
| Iraq | 306 | 0.0% |
| Ireland | 213 | 0.0% |
| Israel | 135 | 0.0% |
| Italy | 209 | 0.0% |
| Jamaica | 679 | 0.1% |
| Japan | 1,690 | 0.2% |
| Kazakhstan | 90 | 0.0% |
| Kenya | 3,222 | 0.4% |
| Korea | 9,334 | 1.0% |
| Kuwait | 10 | 0.0% |
| Laos | 835 | 0.1% |
| Latin America | 24,481 | 2.7% |
| Latvia | 85 | 0.0% |
| Lebanon | 59 | 0.0% |
| Liberia | 37 | 0.0% |
| Lithuania | 24 | 0.0% |
| Malaysia | 94 | 0.0% |
| Mexico | 16,561 | 1.8% |
| Micronesia | 635 | 0.1% |
| Middle Africa | 327 | 0.0% |
| Moldova | 1,095 | 0.1% |
| Morocco | 60 | 0.0% |
| Nepal | 283 | 0.0% |
| Netherlands | 294 | 0.0% |
| Nicaragua | 74 | 0.0% |
| Nigeria | 321 | 0.0% |
| North Macedonia | 15 | 0.0% |
| Northern Africa | 370 | 0.0% |
| Northern Europe | 2,433 | 0.3% |
| Norway | 130 | 0.0% |
| Oceania | 4,329 | 0.5% |
| Pakistan | 378 | 0.0% |
| Panama | 201 | 0.0% |
| Peru | 493 | 0.1% |
| Philippines | 10,814 | 1.2% |
| Poland | 591 | 0.1% |
| Portugal | 13 | 0.0% |
| Romania | 139 | 0.0% |
| Russia | 1,749 | 0.2% |
| Saudi Arabia | 101 | 0.0% |
| Scotland | 234 | 0.0% |
| Senegal | 122 | 0.0% |
| Serbia | 12 | 0.0% |
| Sierra Leone | 29 | 0.0% |
| Singapore | 10 | 0.0% |
| Somalia | 284 | 0.0% |
| South Africa | 190 | 0.0% |
| South America | 2,154 | 0.2% |
| South Central Asia | 3,572 | 0.4% |
| South Eastern Asia | 21,129 | 2.3% |
| Southern Europe | 431 | 0.1% |
| Spain | 117 | 0.0% |
| St. Vincent and the Grenadines | 8 | 0.0% |
| Sweden | 106 | 0.0% |
| Switzerland | 40 | 0.0% |
| Taiwan | 405 | 0.0% |
| Thailand | 1,161 | 0.1% |
| Trinidad and Tobago | 440 | 0.1% |
| Turkey | 368 | 0.0% |
| Uganda | 471 | 0.1% |
| Ukraine | 5,559 | 0.6% |
| Uzbekistan | 36 | 0.0% |
| Venezuela | 207 | 0.0% |
| Vietnam | 5,426 | 0.6% |
| West Indies | 46 | 0.0% |
| Western Africa | 1,070 | 0.1% |
| Western Asia | 1,357 | 0.2% |
| Western Europe | 3,733 | 0.4% |
| Yemen | 217 | 0.0% |
| Zaire | 153 | 0.0% |
| Zimbabwe | 114 | 0.0% | View All 126 Rows |
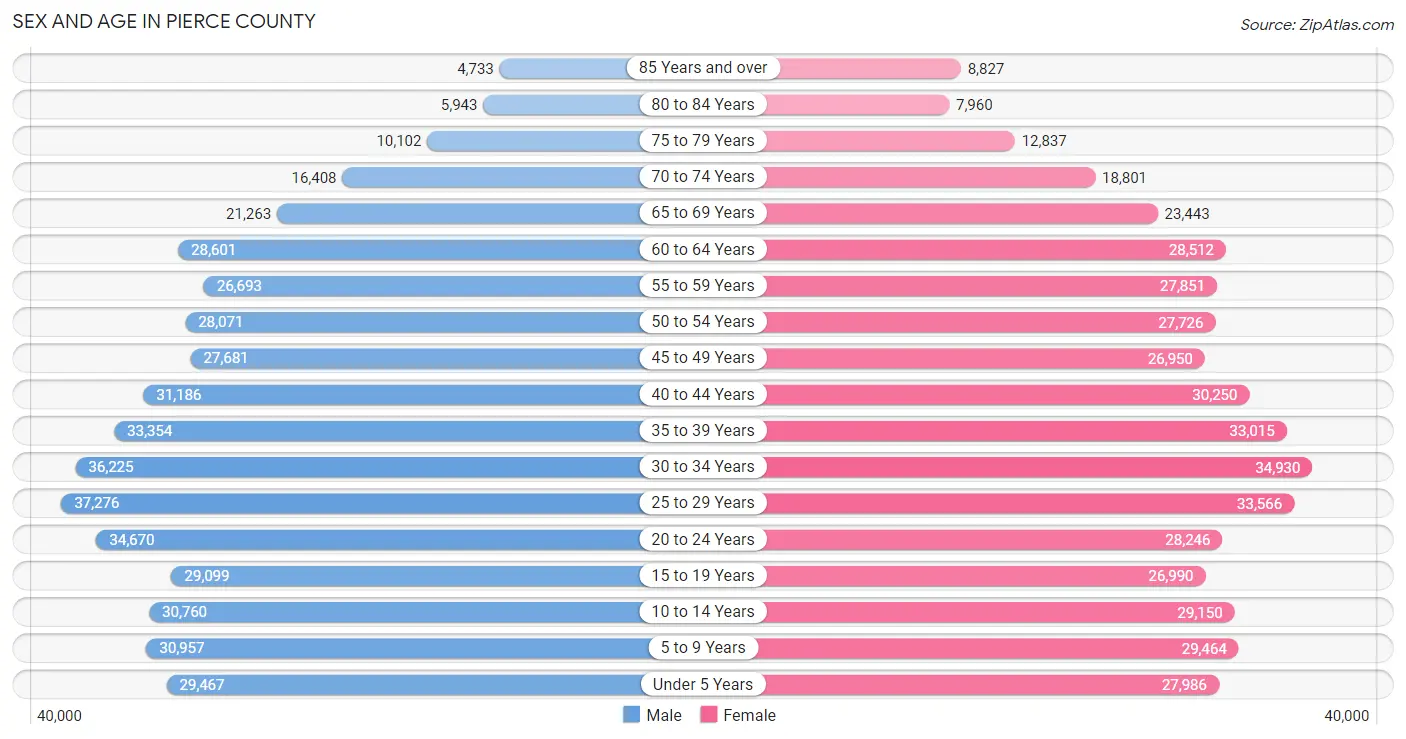
Sex and Age in Pierce County
Sex and Age in Pierce County
The most populous age groups in Pierce County are 25 to 29 Years (37,276 | 8.1%) for men and 30 to 34 Years (34,930 | 7.6%) for women.
| Age Bracket | Male | Female |
| Under 5 Years | 29,467 (6.4%) | 27,986 (6.1%) |
| 5 to 9 Years | 30,957 (6.7%) | 29,464 (6.5%) |
| 10 to 14 Years | 30,760 (6.7%) | 29,150 (6.4%) |
| 15 to 19 Years | 29,099 (6.3%) | 26,990 (5.9%) |
| 20 to 24 Years | 34,670 (7.5%) | 28,246 (6.2%) |
| 25 to 29 Years | 37,276 (8.1%) | 33,566 (7.3%) |
| 30 to 34 Years | 36,225 (7.8%) | 34,930 (7.6%) |
| 35 to 39 Years | 33,354 (7.2%) | 33,015 (7.2%) |
| 40 to 44 Years | 31,186 (6.7%) | 30,250 (6.6%) |
| 45 to 49 Years | 27,681 (6.0%) | 26,950 (5.9%) |
| 50 to 54 Years | 28,071 (6.1%) | 27,726 (6.1%) |
| 55 to 59 Years | 26,693 (5.8%) | 27,851 (6.1%) |
| 60 to 64 Years | 28,601 (6.2%) | 28,512 (6.2%) |
| 65 to 69 Years | 21,263 (4.6%) | 23,443 (5.1%) |
| 70 to 74 Years | 16,408 (3.5%) | 18,801 (4.1%) |
| 75 to 79 Years | 10,102 (2.2%) | 12,837 (2.8%) |
| 80 to 84 Years | 5,943 (1.3%) | 7,960 (1.7%) |
| 85 Years and over | 4,733 (1.0%) | 8,827 (1.9%) |
| Total | 462,489 (100.0%) | 456,504 (100.0%) |
Families and Households in Pierce County
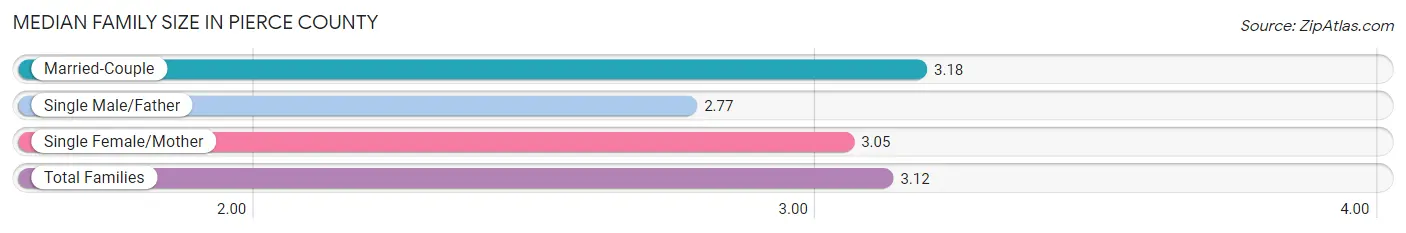
Median Family Size in Pierce County
The median family size in Pierce County is 3.12 persons per family, with married-couple families (173,738 | 75.0%) accounting for the largest median family size of 3.18 persons per family. On the other hand, single male/father families (19,226 | 8.3%) represent the smallest median family size with 2.77 persons per family.
| Family Type | # Families | Family Size |
| Married-Couple | 173,738 (75.0%) | 3.18 |
| Single Male/Father | 19,226 (8.3%) | 2.77 |
| Single Female/Mother | 38,618 (16.7%) | 3.05 |
| Total Families | 231,582 (100.0%) | 3.12 |
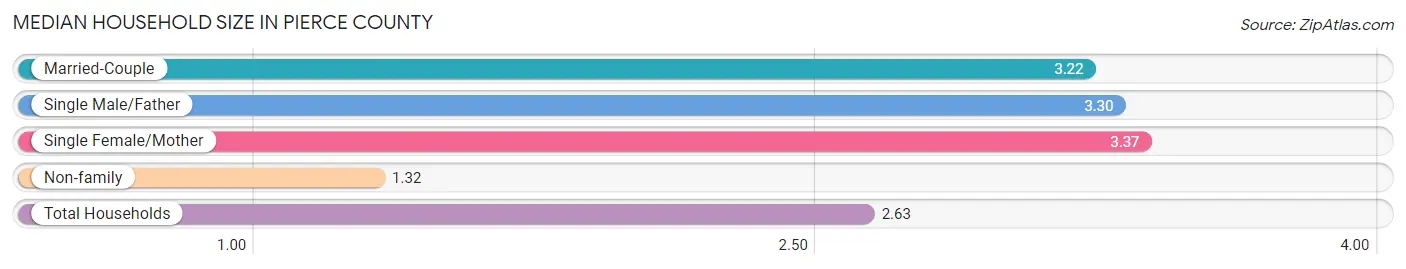
Median Household Size in Pierce County
The median household size in Pierce County is 2.63 persons per household, with single female/mother households (38,618 | 11.3%) accounting for the largest median household size of 3.37 persons per household. non-family households (110,201 | 32.2%) represent the smallest median household size with 1.32 persons per household.
| Household Type | # Households | Household Size |
| Married-Couple | 173,738 (50.8%) | 3.22 |
| Single Male/Father | 19,226 (5.6%) | 3.30 |
| Single Female/Mother | 38,618 (11.3%) | 3.37 |
| Non-family | 110,201 (32.2%) | 1.32 |
| Total Households | 341,783 (100.0%) | 2.63 |
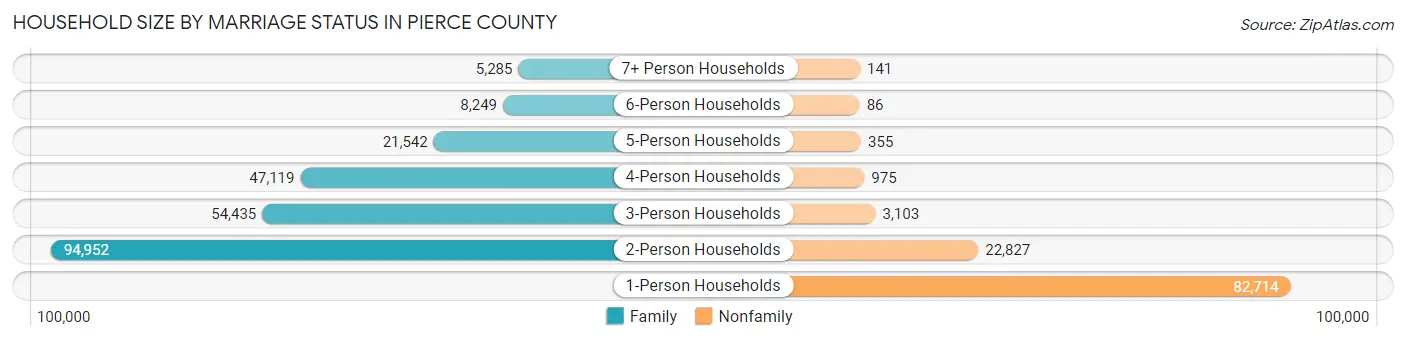
Household Size by Marriage Status in Pierce County
Out of a total of 341,783 households in Pierce County, 231,582 (67.8%) are family households, while 110,201 (32.2%) are nonfamily households. The most numerous type of family households are 2-person households, comprising 94,952, and the most common type of nonfamily households are 1-person households, comprising 82,714.
| Household Size | Family Households | Nonfamily Households |
| 1-Person Households | - | 82,714 (24.2%) |
| 2-Person Households | 94,952 (27.8%) | 22,827 (6.7%) |
| 3-Person Households | 54,435 (15.9%) | 3,103 (0.9%) |
| 4-Person Households | 47,119 (13.8%) | 975 (0.3%) |
| 5-Person Households | 21,542 (6.3%) | 355 (0.1%) |
| 6-Person Households | 8,249 (2.4%) | 86 (0.0%) |
| 7+ Person Households | 5,285 (1.5%) | 141 (0.0%) |
| Total | 231,582 (67.8%) | 110,201 (32.2%) |
Female Fertility in Pierce County
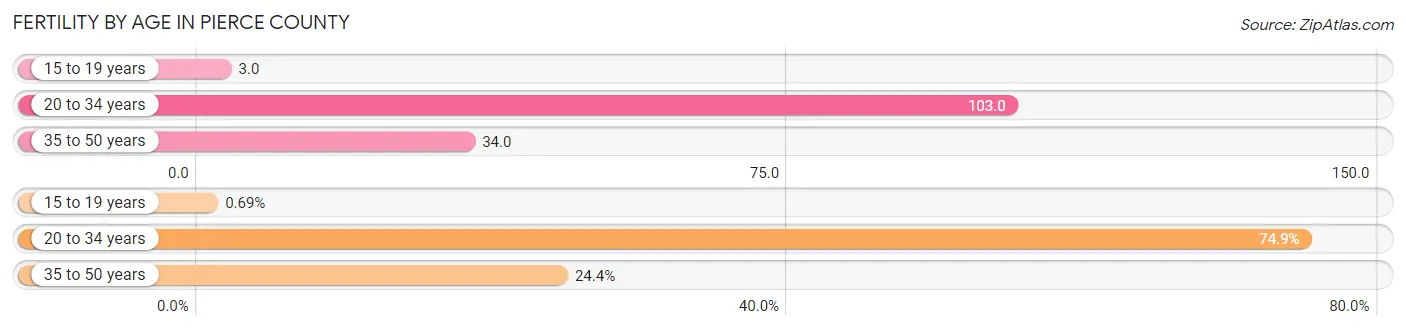
Fertility by Age in Pierce County
Average fertility rate in Pierce County is 61.0 births per 1,000 women. Women in the age bracket of 20 to 34 years have the highest fertility rate with 103.0 births per 1,000 women. Women in the age bracket of 20 to 34 years acount for 74.9% of all women with births.
| Age Bracket | Women with Births | Births / 1,000 Women |
| 15 to 19 years | 92 (0.7%) | 3.0 |
| 20 to 34 years | 9,987 (74.9%) | 103.0 |
| 35 to 50 years | 3,258 (24.4%) | 34.0 |
| Total | 13,337 (100.0%) | 61.0 |
Fertility by Age by Marriage Status in Pierce County
75.1% of women with births (13,337) in Pierce County are married. The highest percentage of unmarried women with births falls into 15 to 19 years age bracket with 45.7% of them unmarried at the time of birth, while the lowest percentage of unmarried women with births belong to 35 to 50 years age bracket with 16.4% of them unmarried.
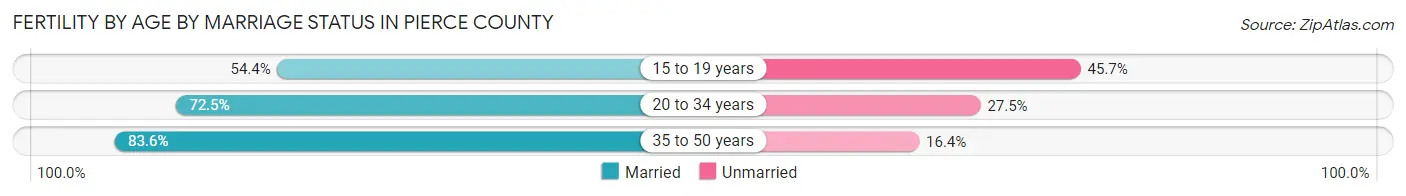
| Age Bracket | Married | Unmarried |
| 15 to 19 years | 50 (54.3%) | 42 (45.7%) |
| 20 to 34 years | 7,241 (72.5%) | 2,746 (27.5%) |
| 35 to 50 years | 2,724 (83.6%) | 534 (16.4%) |
| Total | 10,016 (75.1%) | 3,321 (24.9%) |
Fertility by Education in Pierce County
Average fertility rate in Pierce County is 61.0 births per 1,000 women. Women with the education attainment of bachelor's degree have the highest fertility rate of 76.0 births per 1,000 women, while women with the education attainment of less than high school have the lowest fertility at 19.0 births per 1,000 women. Women with the education attainment of college or associate's degree represent 40.3% of all women with births.
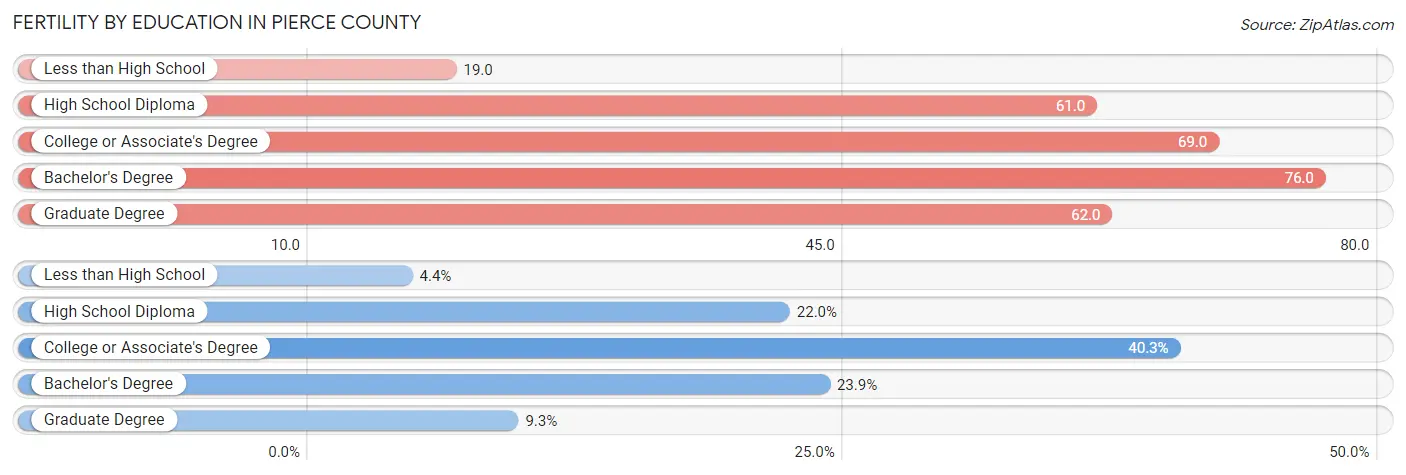
| Educational Attainment | Women with Births | Births / 1,000 Women |
| Less than High School | 583 (4.4%) | 19.0 |
| High School Diploma | 2,940 (22.0%) | 61.0 |
| College or Associate's Degree | 5,379 (40.3%) | 69.0 |
| Bachelor's Degree | 3,190 (23.9%) | 76.0 |
| Graduate Degree | 1,245 (9.3%) | 62.0 |
| Total | 13,337 (100.0%) | 61.0 |
Fertility by Education by Marriage Status in Pierce County
24.9% of women with births in Pierce County are unmarried. Women with the educational attainment of graduate degree are most likely to be married with 95.1% of them married at childbirth, while women with the educational attainment of high school diploma are least likely to be married with 47.2% of them unmarried at childbirth.
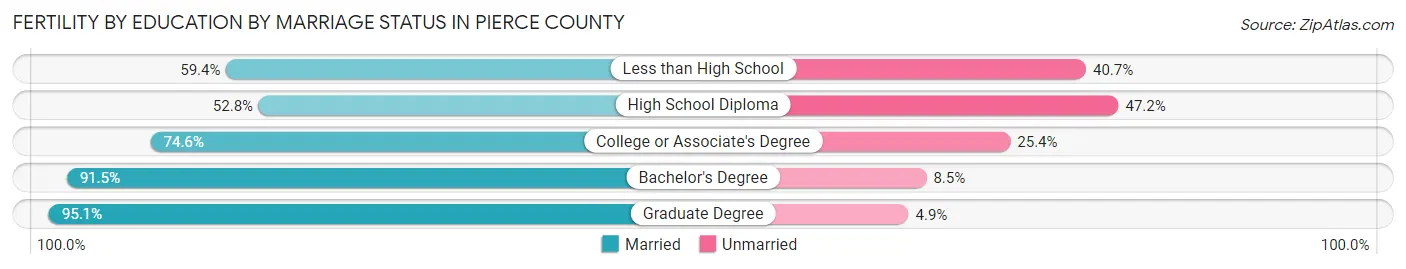
| Educational Attainment | Married | Unmarried |
| Less than High School | 346 (59.4%) | 237 (40.6%) |
| High School Diploma | 1,552 (52.8%) | 1,388 (47.2%) |
| College or Associate's Degree | 4,013 (74.6%) | 1,366 (25.4%) |
| Bachelor's Degree | 2,919 (91.5%) | 271 (8.5%) |
| Graduate Degree | 1,184 (95.1%) | 61 (4.9%) |
| Total | 10,016 (75.1%) | 3,321 (24.9%) |
Income in Pierce County
Income Overview in Pierce County
Per Capita Income in Pierce County is $43,575, while median incomes of families and households are $104,927 and $91,486 respectively.
| Characteristic | Number | Measure |
| Per Capita Income | 918,993 | $43,575 |
| Median Family Income | 231,582 | $104,927 |
| Mean Family Income | 231,582 | $128,874 |
| Median Household Income | 341,783 | $91,486 |
| Mean Household Income | 341,783 | $114,432 |
| Income Deficit | 231,582 | $12,271 |
| Wage / Income Gap (%) | 918,993 | 27.47% |
| Wage / Income Gap ($) | 918,993 | 72.53¢ per $1 |
| Gini / Inequality Index | 918,993 | 0.42 |
Earnings by Sex in Pierce County
Average Earnings in Pierce County are $48,541, $56,776 for men and $41,181 for women, a difference of 27.5%.
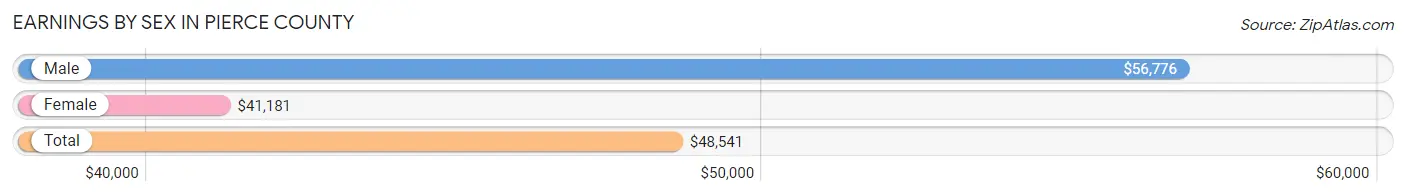
| Sex | Number | Average Earnings |
| Male | 270,127 (53.7%) | $56,776 |
| Female | 232,442 (46.3%) | $41,181 |
| Total | 502,569 (100.0%) | $48,541 |
Earnings by Sex by Income Bracket in Pierce County
The most common earnings brackets in Pierce County are $100,000+ for men (59,439 | 22.0%) and $100,000+ for women (26,846 | 11.6%).
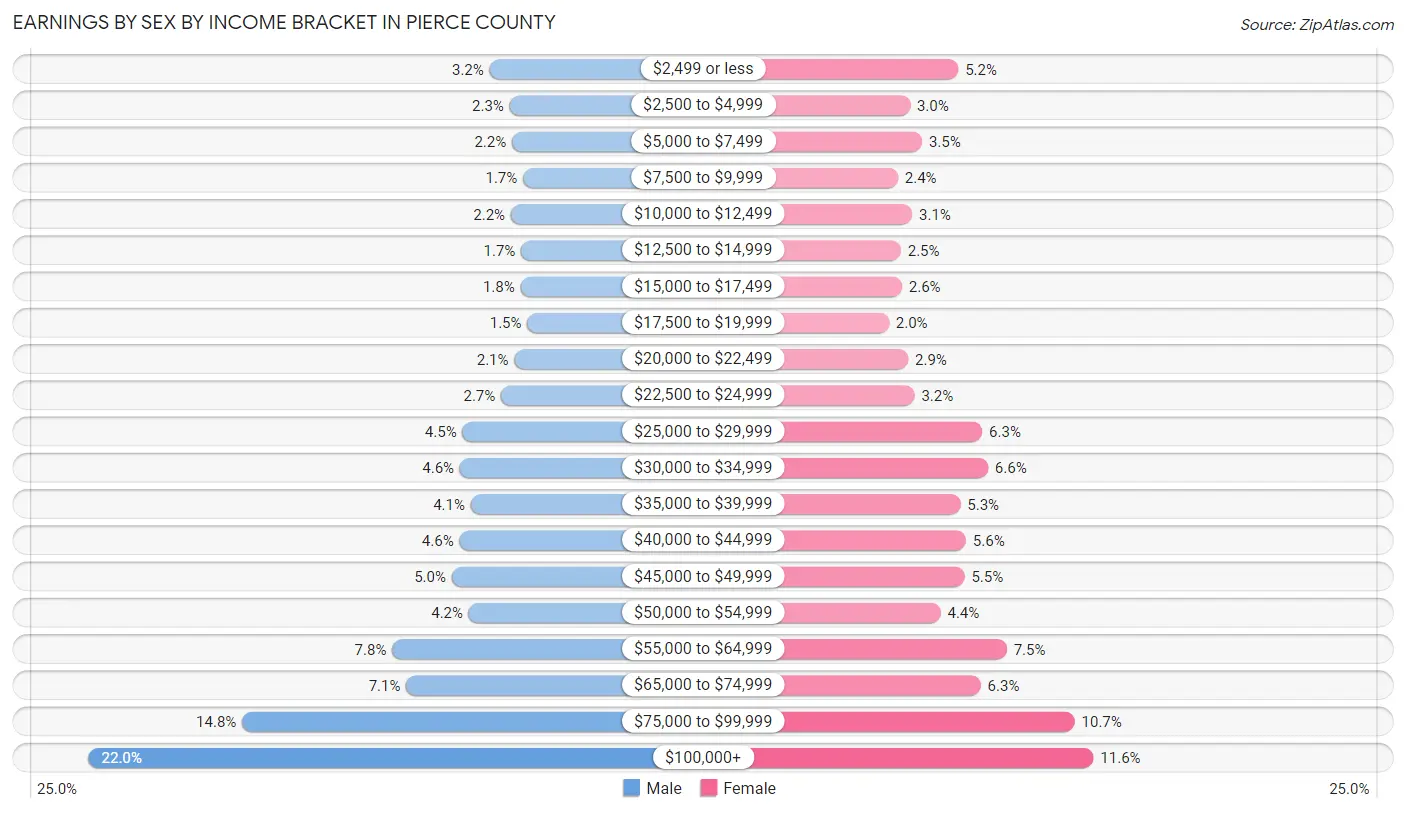
| Income | Male | Female |
| $2,499 or less | 8,708 (3.2%) | 12,131 (5.2%) |
| $2,500 to $4,999 | 6,161 (2.3%) | 6,877 (3.0%) |
| $5,000 to $7,499 | 5,870 (2.2%) | 8,181 (3.5%) |
| $7,500 to $9,999 | 4,467 (1.7%) | 5,547 (2.4%) |
| $10,000 to $12,499 | 6,002 (2.2%) | 7,112 (3.1%) |
| $12,500 to $14,999 | 4,705 (1.7%) | 5,887 (2.5%) |
| $15,000 to $17,499 | 4,788 (1.8%) | 5,990 (2.6%) |
| $17,500 to $19,999 | 3,924 (1.5%) | 4,580 (2.0%) |
| $20,000 to $22,499 | 5,578 (2.1%) | 6,666 (2.9%) |
| $22,500 to $24,999 | 7,242 (2.7%) | 7,360 (3.2%) |
| $25,000 to $29,999 | 12,142 (4.5%) | 14,744 (6.3%) |
| $30,000 to $34,999 | 12,445 (4.6%) | 15,369 (6.6%) |
| $35,000 to $39,999 | 11,071 (4.1%) | 12,366 (5.3%) |
| $40,000 to $44,999 | 12,510 (4.6%) | 12,969 (5.6%) |
| $45,000 to $49,999 | 13,482 (5.0%) | 12,817 (5.5%) |
| $50,000 to $54,999 | 11,320 (4.2%) | 10,200 (4.4%) |
| $55,000 to $64,999 | 21,023 (7.8%) | 17,417 (7.5%) |
| $65,000 to $74,999 | 19,232 (7.1%) | 14,574 (6.3%) |
| $75,000 to $99,999 | 40,018 (14.8%) | 24,809 (10.7%) |
| $100,000+ | 59,439 (22.0%) | 26,846 (11.6%) |
| Total | 270,127 (100.0%) | 232,442 (100.0%) |
Earnings by Sex by Educational Attainment in Pierce County
Average earnings in Pierce County are $66,180 for men and $46,745 for women, a difference of 29.4%. Men with an educational attainment of graduate degree enjoy the highest average annual earnings of $101,186, while those with less than high school education earn the least with $45,412. Women with an educational attainment of graduate degree earn the most with the average annual earnings of $82,515, while those with less than high school education have the smallest earnings of $27,810.
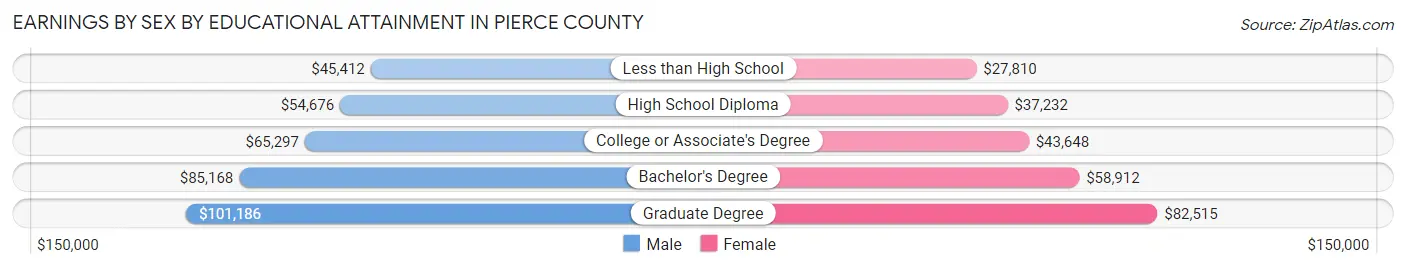
| Educational Attainment | Male Income | Female Income |
| Less than High School | $45,412 | $27,810 |
| High School Diploma | $54,676 | $37,232 |
| College or Associate's Degree | $65,297 | $43,648 |
| Bachelor's Degree | $85,168 | $58,912 |
| Graduate Degree | $101,186 | $82,515 |
| Total | $66,180 | $46,745 |
Family Income in Pierce County
Family Income Brackets in Pierce County
According to the Pierce County family income data, there are 55,117 families falling into the $100,000 to $149,999 income range, which is the most common income bracket and makes up 23.8% of all families. Conversely, the $10,000 to $14,999 income bracket is the least frequent group with only 2,084 families (0.9%) belonging to this category.
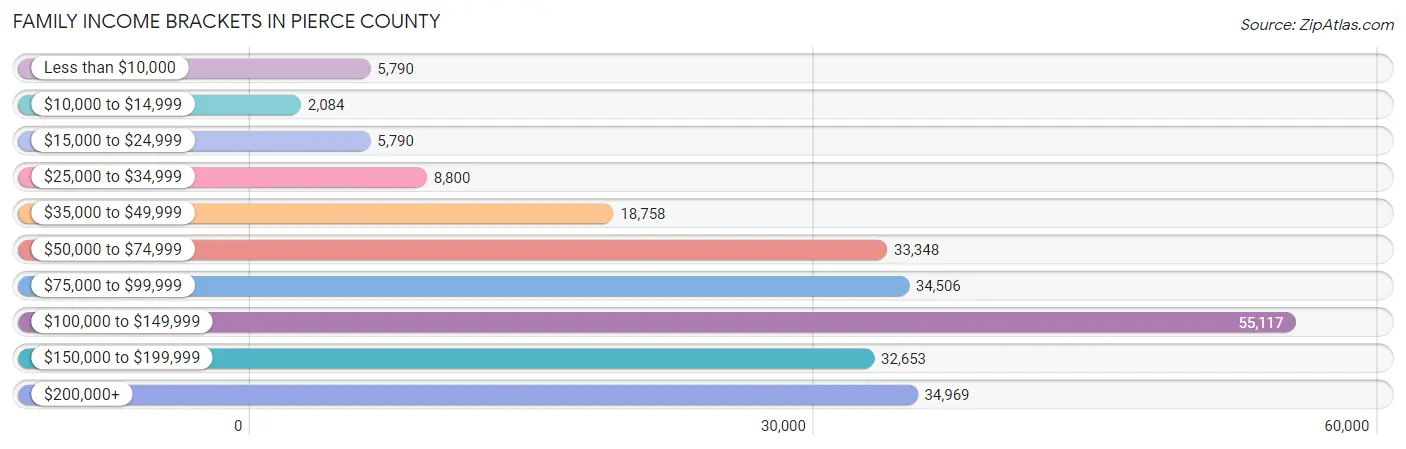
| Income Bracket | # Families | % Families |
| Less than $10,000 | 5,790 | 2.5% |
| $10,000 to $14,999 | 2,084 | 0.9% |
| $15,000 to $24,999 | 5,790 | 2.5% |
| $25,000 to $34,999 | 8,800 | 3.8% |
| $35,000 to $49,999 | 18,758 | 8.1% |
| $50,000 to $74,999 | 33,348 | 14.4% |
| $75,000 to $99,999 | 34,506 | 14.9% |
| $100,000 to $149,999 | 55,117 | 23.8% |
| $150,000 to $199,999 | 32,653 | 14.1% |
| $200,000+ | 34,969 | 15.1% |
Family Income by Famaliy Size in Pierce County
7+ person families (4,231 | 1.8%) account for the highest median family income in Pierce County with $146,282 per family, while 2-person families (104,467 | 45.1%) have the highest median income of $46,704 per family member.
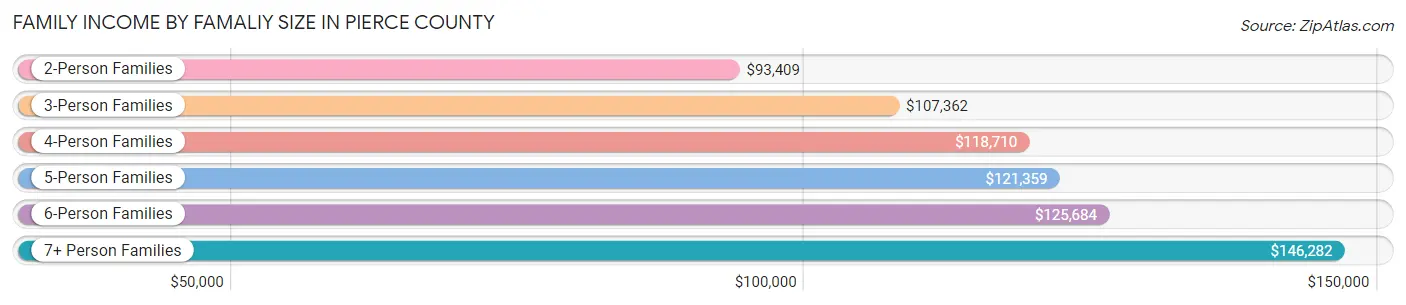
| Income Bracket | # Families | Median Income |
| 2-Person Families | 104,467 (45.1%) | $93,409 |
| 3-Person Families | 53,057 (22.9%) | $107,362 |
| 4-Person Families | 44,371 (19.2%) | $118,710 |
| 5-Person Families | 18,860 (8.1%) | $121,359 |
| 6-Person Families | 6,596 (2.9%) | $125,684 |
| 7+ Person Families | 4,231 (1.8%) | $146,282 |
| Total | 231,582 (100.0%) | $104,927 |
Family Income by Number of Earners in Pierce County
The median family income in Pierce County is $104,927, with families comprising 3+ earners (27,338) having the highest median family income of $168,734, while families with no earners (29,642) have the lowest median family income of $63,779, accounting for 11.8% and 12.8% of families, respectively.
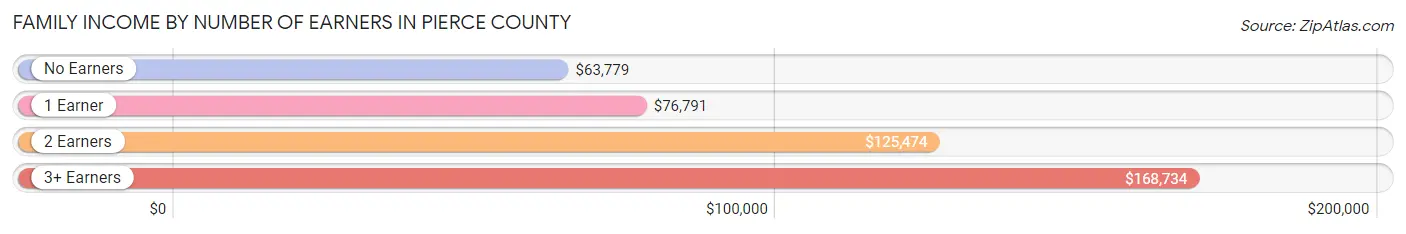
| Number of Earners | # Families | Median Income |
| No Earners | 29,642 (12.8%) | $63,779 |
| 1 Earner | 74,561 (32.2%) | $76,791 |
| 2 Earners | 100,041 (43.2%) | $125,474 |
| 3+ Earners | 27,338 (11.8%) | $168,734 |
| Total | 231,582 (100.0%) | $104,927 |
Household Income in Pierce County
Household Income Brackets in Pierce County
With 73,142 households falling in the category, the $100,000 to $149,999 income range is the most frequent in Pierce County, accounting for 21.4% of all households. In contrast, only 7,177 households (2.1%) fall into the $10,000 to $14,999 income bracket, making it the least populous group.
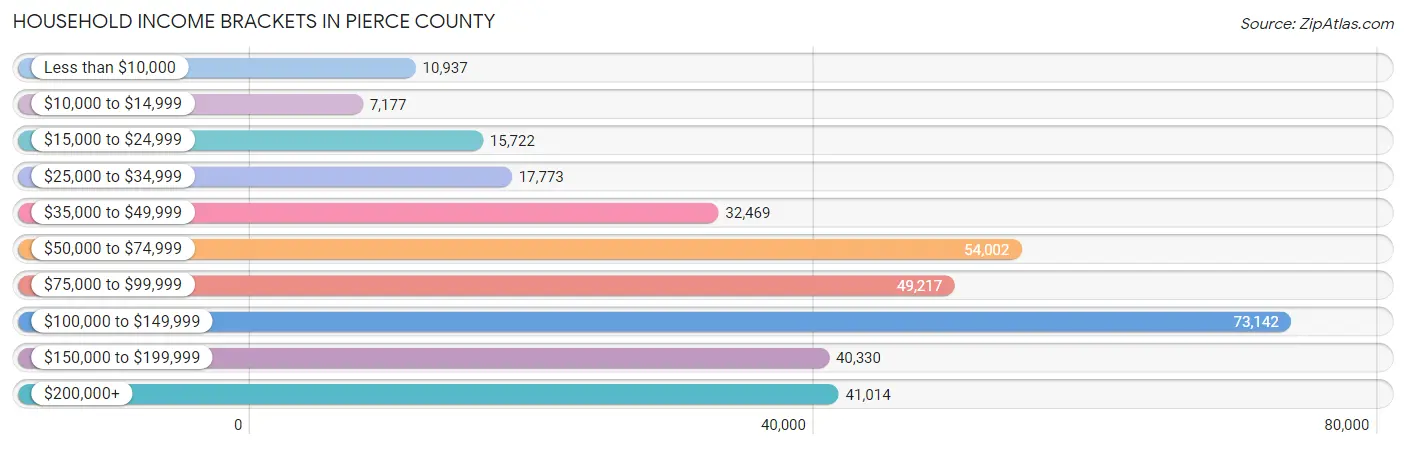
| Income Bracket | # Households | % Households |
| Less than $10,000 | 10,937 | 3.2% |
| $10,000 to $14,999 | 7,177 | 2.1% |
| $15,000 to $24,999 | 15,722 | 4.6% |
| $25,000 to $34,999 | 17,773 | 5.2% |
| $35,000 to $49,999 | 32,469 | 9.5% |
| $50,000 to $74,999 | 54,002 | 15.8% |
| $75,000 to $99,999 | 49,217 | 14.4% |
| $100,000 to $149,999 | 73,142 | 21.4% |
| $150,000 to $199,999 | 40,330 | 11.8% |
| $200,000+ | 41,014 | 12.0% |
Household Income by Householder Age in Pierce County
The median household income in Pierce County is $91,486, with the highest median household income of $109,292 found in the 45 to 64 years age bracket for the primary householder. A total of 123,068 households (36.0%) fall into this category. Meanwhile, the 15 to 24 years age bracket for the primary householder has the lowest median household income of $54,547, with 14,147 households (4.1%) in this group.
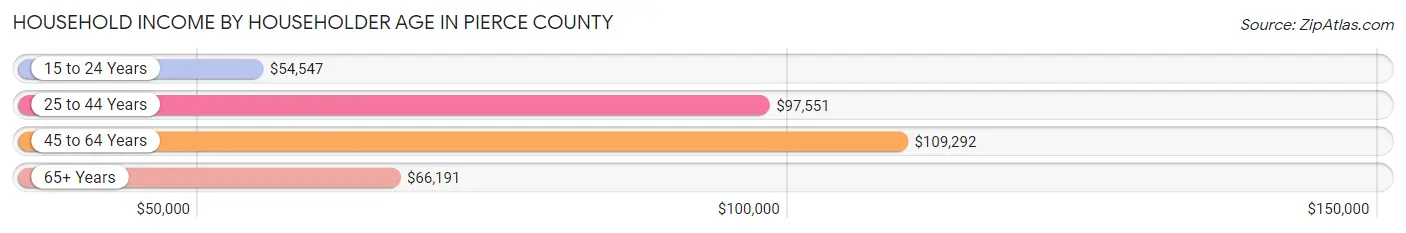
| Income Bracket | # Households | Median Income |
| 15 to 24 Years | 14,147 (4.1%) | $54,547 |
| 25 to 44 Years | 126,872 (37.1%) | $97,551 |
| 45 to 64 Years | 123,068 (36.0%) | $109,292 |
| 65+ Years | 77,696 (22.7%) | $66,191 |
| Total | 341,783 (100.0%) | $91,486 |
Poverty in Pierce County
Income Below Poverty by Sex and Age in Pierce County
With 7.8% poverty level for males and 9.5% for females among the residents of Pierce County, 15 year old males and 12 to 14 year old females are the most vulnerable to poverty, with 758 males (12.0%) and 2,278 females (12.9%) in their respective age groups living below the poverty level.
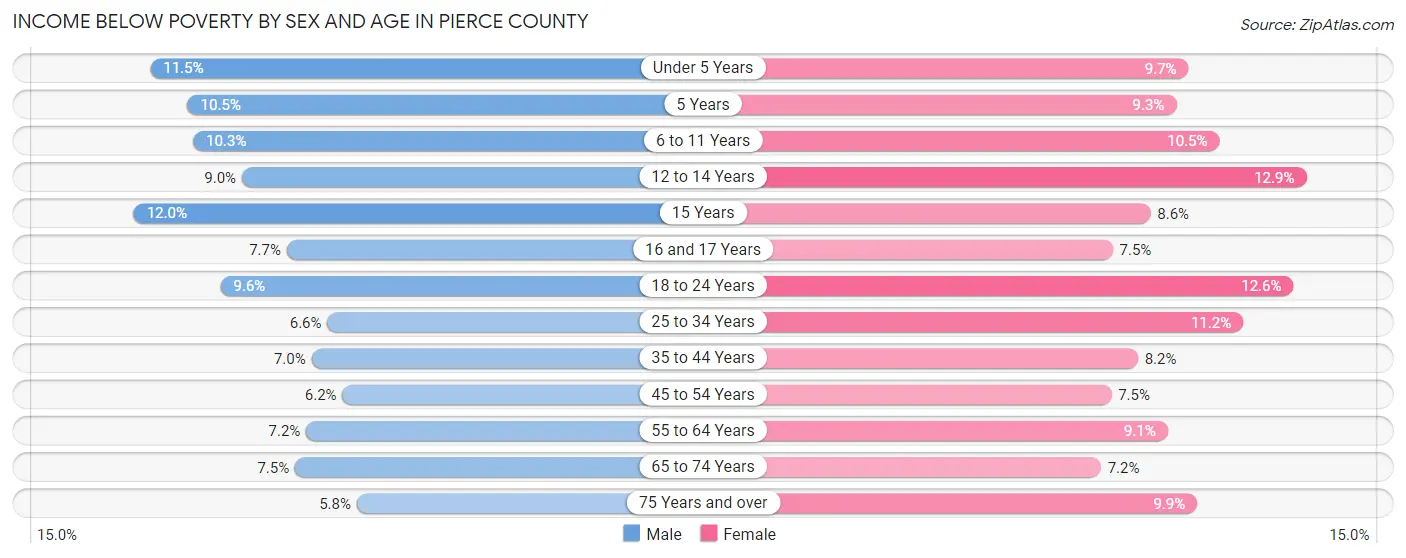
| Age Bracket | Male | Female |
| Under 5 Years | 3,285 (11.5%) | 2,642 (9.7%) |
| 5 Years | 668 (10.5%) | 494 (9.3%) |
| 6 to 11 Years | 3,700 (10.3%) | 3,616 (10.5%) |
| 12 to 14 Years | 1,625 (8.9%) | 2,278 (12.9%) |
| 15 Years | 758 (12.0%) | 531 (8.6%) |
| 16 and 17 Years | 864 (7.7%) | 793 (7.5%) |
| 18 to 24 Years | 3,851 (9.6%) | 4,599 (12.6%) |
| 25 to 34 Years | 4,713 (6.6%) | 7,540 (11.2%) |
| 35 to 44 Years | 4,498 (7.0%) | 5,184 (8.2%) |
| 45 to 54 Years | 3,415 (6.1%) | 4,073 (7.5%) |
| 55 to 64 Years | 3,946 (7.2%) | 5,078 (9.1%) |
| 65 to 74 Years | 2,794 (7.5%) | 3,011 (7.2%) |
| 75 Years and over | 1,163 (5.8%) | 2,813 (9.9%) |
| Total | 35,280 (7.8%) | 42,652 (9.5%) |
Income Above Poverty by Sex and Age in Pierce County
According to the poverty statistics in Pierce County, males aged 75 years and over and females aged 65 to 74 years are the age groups that are most secure financially, with 94.3% of males and 92.8% of females in these age groups living above the poverty line.
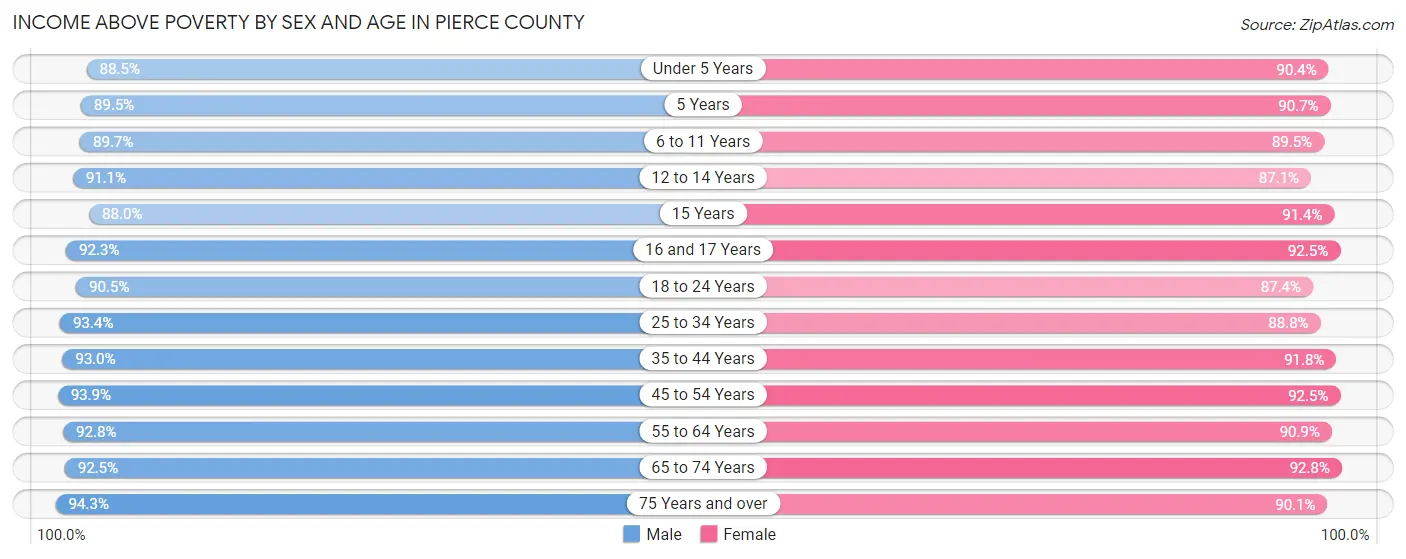
| Age Bracket | Male | Female |
| Under 5 Years | 25,268 (88.5%) | 24,730 (90.3%) |
| 5 Years | 5,721 (89.5%) | 4,814 (90.7%) |
| 6 to 11 Years | 32,187 (89.7%) | 30,799 (89.5%) |
| 12 to 14 Years | 16,539 (91.0%) | 15,345 (87.1%) |
| 15 Years | 5,578 (88.0%) | 5,654 (91.4%) |
| 16 and 17 Years | 10,360 (92.3%) | 9,729 (92.5%) |
| 18 to 24 Years | 36,489 (90.4%) | 31,978 (87.4%) |
| 25 to 34 Years | 67,004 (93.4%) | 59,976 (88.8%) |
| 35 to 44 Years | 59,710 (93.0%) | 57,694 (91.8%) |
| 45 to 54 Years | 52,113 (93.9%) | 50,230 (92.5%) |
| 55 to 64 Years | 51,147 (92.8%) | 50,917 (90.9%) |
| 65 to 74 Years | 34,594 (92.5%) | 38,757 (92.8%) |
| 75 Years and over | 19,066 (94.3%) | 25,629 (90.1%) |
| Total | 415,776 (92.2%) | 406,252 (90.5%) |
Income Below Poverty Among Married-Couple Families in Pierce County
The poverty statistics for married-couple families in Pierce County show that 2.7% or 4,736 of the total 173,738 families live below the poverty line. Families with 5 or more children have the highest poverty rate of 9.5%, comprising of 169 families. On the other hand, families with no children have the lowest poverty rate of 2.1%, which includes 2,076 families.
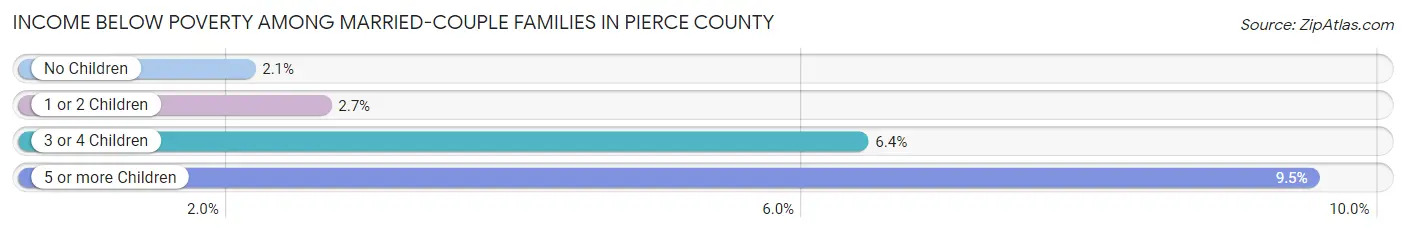
| Children | Above Poverty | Below Poverty |
| No Children | 95,869 (97.9%) | 2,076 (2.1%) |
| 1 or 2 Children | 58,315 (97.4%) | 1,589 (2.6%) |
| 3 or 4 Children | 13,214 (93.6%) | 902 (6.4%) |
| 5 or more Children | 1,604 (90.5%) | 169 (9.5%) |
| Total | 169,002 (97.3%) | 4,736 (2.7%) |
Income Below Poverty Among Single-Parent Households in Pierce County
According to the poverty data in Pierce County, 9.2% or 1,764 single-father households and 16.5% or 6,360 single-mother households are living below the poverty line. Among single-father households, those with 3 or 4 children have the highest poverty rate, with 402 households (24.7%) experiencing poverty. Likewise, among single-mother households, those with 5 or more children have the highest poverty rate, with 101 households (46.1%) falling below the poverty line.
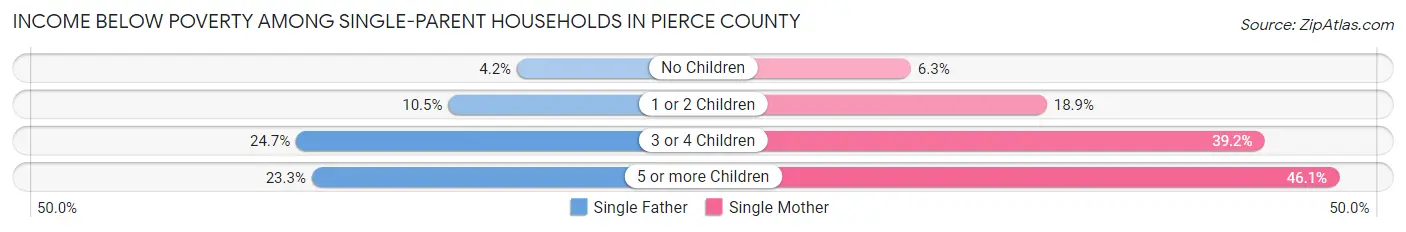
| Children | Single Father | Single Mother |
| No Children | 331 (4.2%) | 870 (6.3%) |
| 1 or 2 Children | 1,001 (10.5%) | 3,931 (18.9%) |
| 3 or 4 Children | 402 (24.7%) | 1,458 (39.2%) |
| 5 or more Children | 30 (23.3%) | 101 (46.1%) |
| Total | 1,764 (9.2%) | 6,360 (16.5%) |
Income Below Poverty Among Married-Couple vs Single-Parent Households in Pierce County
The poverty data for Pierce County shows that 4,736 of the married-couple family households (2.7%) and 8,124 of the single-parent households (14.0%) are living below the poverty level. Within the married-couple family households, those with 5 or more children have the highest poverty rate, with 169 households (9.5%) falling below the poverty line. Among the single-parent households, those with 5 or more children have the highest poverty rate, with 131 household (37.6%) living below poverty.
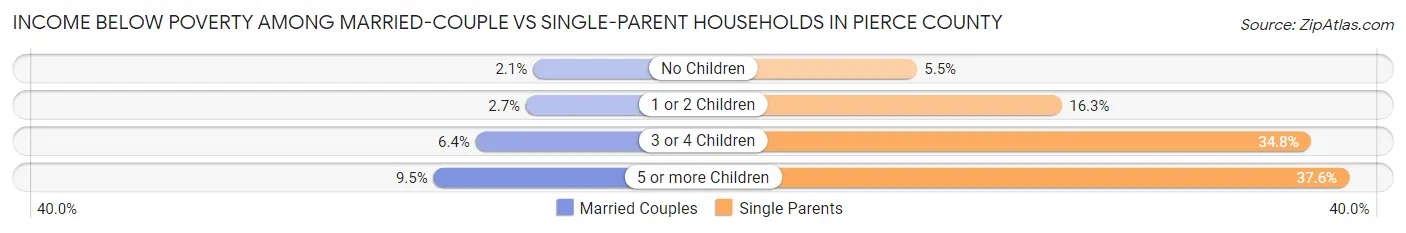
| Children | Married-Couple Families | Single-Parent Households |
| No Children | 2,076 (2.1%) | 1,201 (5.5%) |
| 1 or 2 Children | 1,589 (2.6%) | 4,932 (16.3%) |
| 3 or 4 Children | 902 (6.4%) | 1,860 (34.8%) |
| 5 or more Children | 169 (9.5%) | 131 (37.6%) |
| Total | 4,736 (2.7%) | 8,124 (14.0%) |
Employment Characteristics in Pierce County
Employment by Class of Employer in Pierce County
Among the 446,913 employed individuals in Pierce County, private company employees (277,898 | 62.2%), federal government employees (40,087 | 9.0%), and local government employees (37,283 | 8.3%) make up the most common classes of employment.
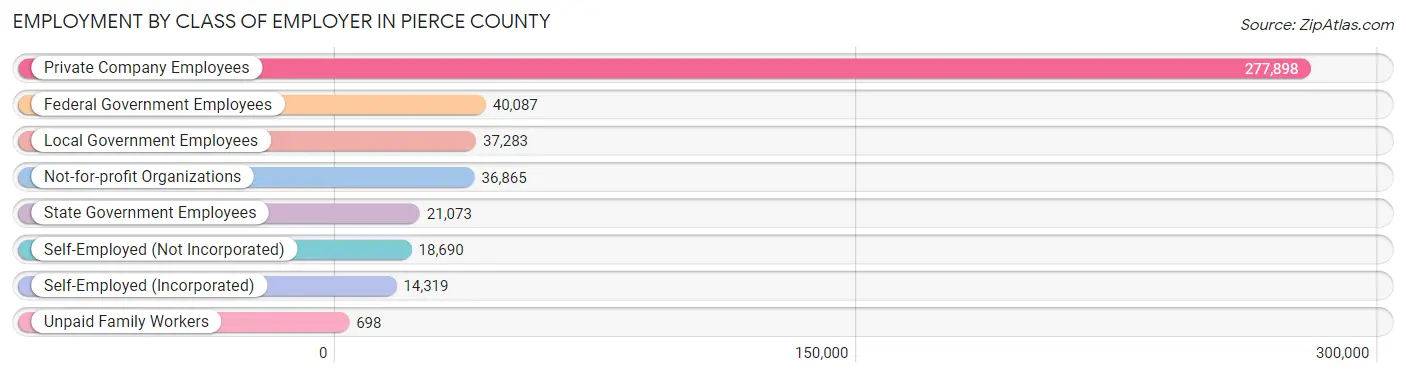
| Employer Class | # Employees | % Employees |
| Private Company Employees | 277,898 | 62.2% |
| Self-Employed (Incorporated) | 14,319 | 3.2% |
| Self-Employed (Not Incorporated) | 18,690 | 4.2% |
| Not-for-profit Organizations | 36,865 | 8.3% |
| Local Government Employees | 37,283 | 8.3% |
| State Government Employees | 21,073 | 4.7% |
| Federal Government Employees | 40,087 | 9.0% |
| Unpaid Family Workers | 698 | 0.2% |
| Total | 446,913 | 100.0% |
Employment Status by Age in Pierce County
According to the labor force statistics for Pierce County, out of the total population over 16 years of age (728,676), 66.3% or 483,112 individuals are in the labor force, with 5.0% or 24,156 of them unemployed. The age group with the highest labor force participation rate is 25 to 29 years, with 84.5% or 59,861 individuals in the labor force. Within the labor force, the 16 to 19 years age range has the highest percentage of unemployed individuals, with 16.6% or 3,123 of them being unemployed.
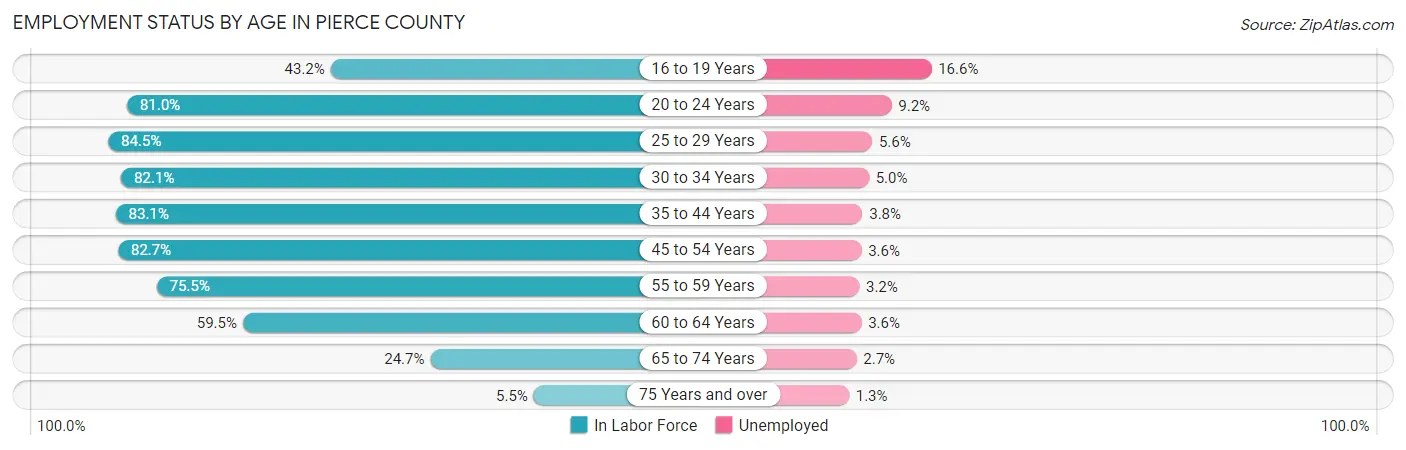
| Age Bracket | In Labor Force | Unemployed |
| 16 to 19 Years | 18,816 (43.2%) | 3,123 (16.6%) |
| 20 to 24 Years | 50,962 (81.0%) | 4,689 (9.2%) |
| 25 to 29 Years | 59,861 (84.5%) | 3,352 (5.6%) |
| 30 to 34 Years | 58,418 (82.1%) | 2,921 (5.0%) |
| 35 to 44 Years | 106,206 (83.1%) | 4,036 (3.8%) |
| 45 to 54 Years | 91,324 (82.7%) | 3,288 (3.6%) |
| 55 to 59 Years | 41,181 (75.5%) | 1,318 (3.2%) |
| 60 to 64 Years | 33,982 (59.5%) | 1,223 (3.6%) |
| 65 to 74 Years | 19,739 (24.7%) | 533 (2.7%) |
| 75 Years and over | 2,772 (5.5%) | 36 (1.3%) |
| Total | 483,112 (66.3%) | 24,156 (5.0%) |
Employment Status by Educational Attainment in Pierce County
According to labor force statistics for Pierce County, 79.5% of individuals (391,050) out of the total population between 25 and 64 years of age (491,887) are in the labor force, with 4.1% or 16,033 of them being unemployed. The group with the highest labor force participation rate are those with the educational attainment of bachelor's degree or higher, with 86.7% or 124,367 individuals in the labor force. Within the labor force, individuals with less than high school education have the highest percentage of unemployment, with 7.0% or 1,647 of them being unemployed.
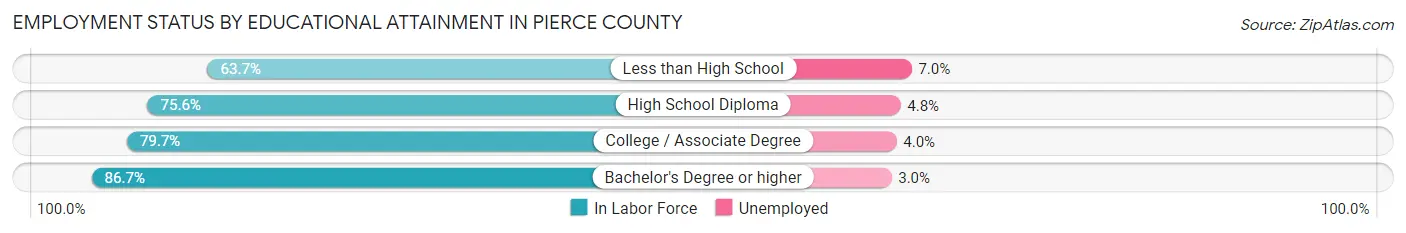
| Educational Attainment | In Labor Force | Unemployed |
| Less than High School | 23,524 (63.7%) | 2,585 (7.0%) |
| High School Diploma | 97,816 (75.6%) | 6,211 (4.8%) |
| College / Associate Degree | 145,154 (79.7%) | 7,285 (4.0%) |
| Bachelor's Degree or higher | 124,367 (86.7%) | 4,303 (3.0%) |
| Total | 391,050 (79.5%) | 20,167 (4.1%) |
Employment Occupations by Sex in Pierce County
Management, Business, Science and Arts Occupations
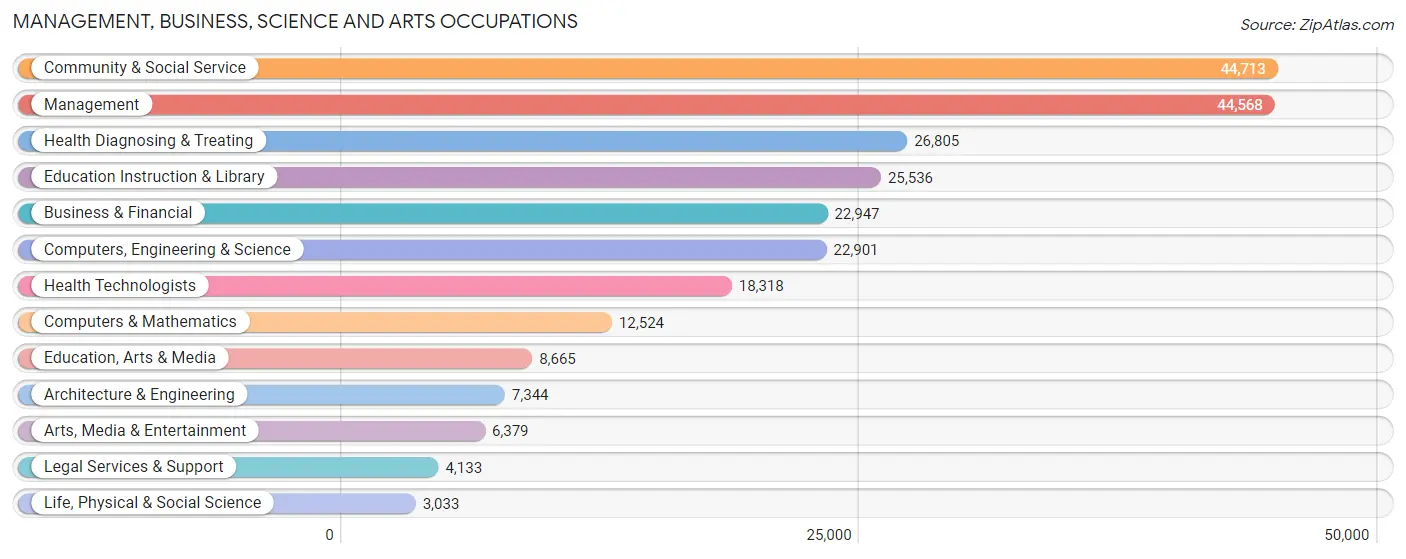
The most common Management, Business, Science and Arts occupations in Pierce County are Community & Social Service (44,713 | 10.2%), Management (44,568 | 10.2%), Health Diagnosing & Treating (26,805 | 6.1%), Education Instruction & Library (25,536 | 5.8%), and Business & Financial (22,947 | 5.2%).
Management, Business, Science and Arts Occupations by Sex
Within the Management, Business, Science and Arts occupations in Pierce County, the most male-oriented occupations are Architecture & Engineering (86.7%), Computers, Engineering & Science (74.0%), and Computers & Mathematics (73.6%), while the most female-oriented occupations are Education Instruction & Library (75.1%), Health Diagnosing & Treating (74.2%), and Health Technologists (73.3%).
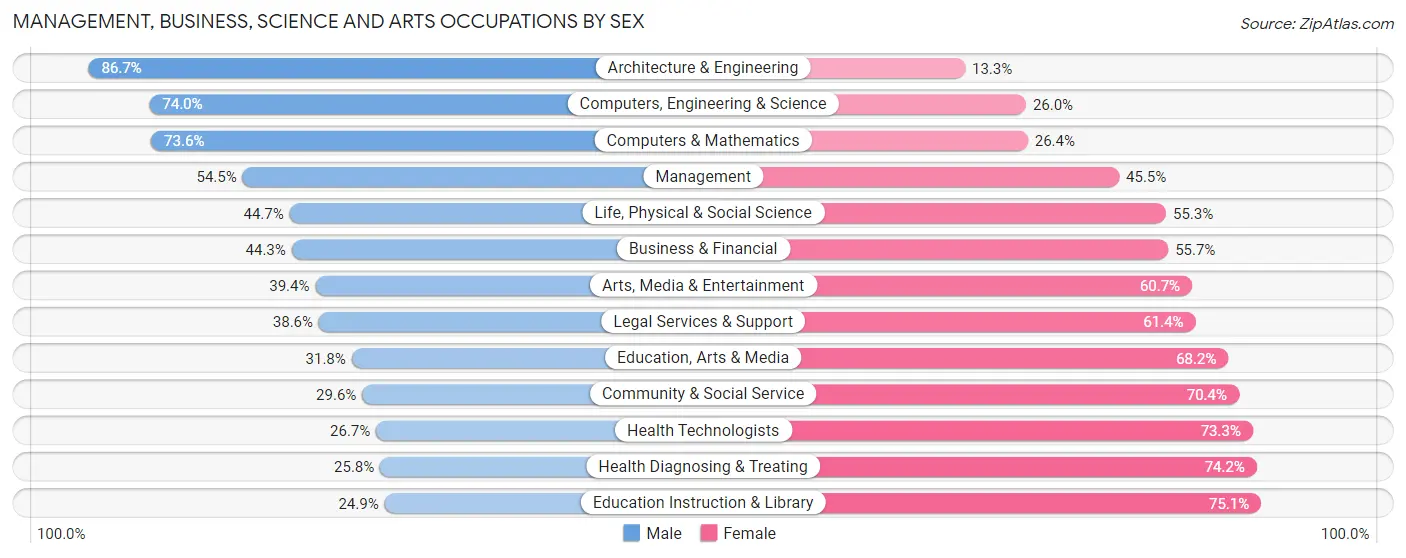
| Occupation | Male | Female |
| Management | 24,306 (54.5%) | 20,262 (45.5%) |
| Business & Financial | 10,165 (44.3%) | 12,782 (55.7%) |
| Computers, Engineering & Science | 16,939 (74.0%) | 5,962 (26.0%) |
| Computers & Mathematics | 9,217 (73.6%) | 3,307 (26.4%) |
| Architecture & Engineering | 6,365 (86.7%) | 979 (13.3%) |
| Life, Physical & Social Science | 1,357 (44.7%) | 1,676 (55.3%) |
| Community & Social Service | 13,227 (29.6%) | 31,486 (70.4%) |
| Education, Arts & Media | 2,754 (31.8%) | 5,911 (68.2%) |
| Legal Services & Support | 1,596 (38.6%) | 2,537 (61.4%) |
| Education Instruction & Library | 6,367 (24.9%) | 19,169 (75.1%) |
| Arts, Media & Entertainment | 2,510 (39.4%) | 3,869 (60.7%) |
| Health Diagnosing & Treating | 6,926 (25.8%) | 19,879 (74.2%) |
| Health Technologists | 4,886 (26.7%) | 13,432 (73.3%) |
| Total (Category) | 71,563 (44.2%) | 90,371 (55.8%) |
| Total (Overall) | 231,187 (52.7%) | 207,668 (47.3%) |
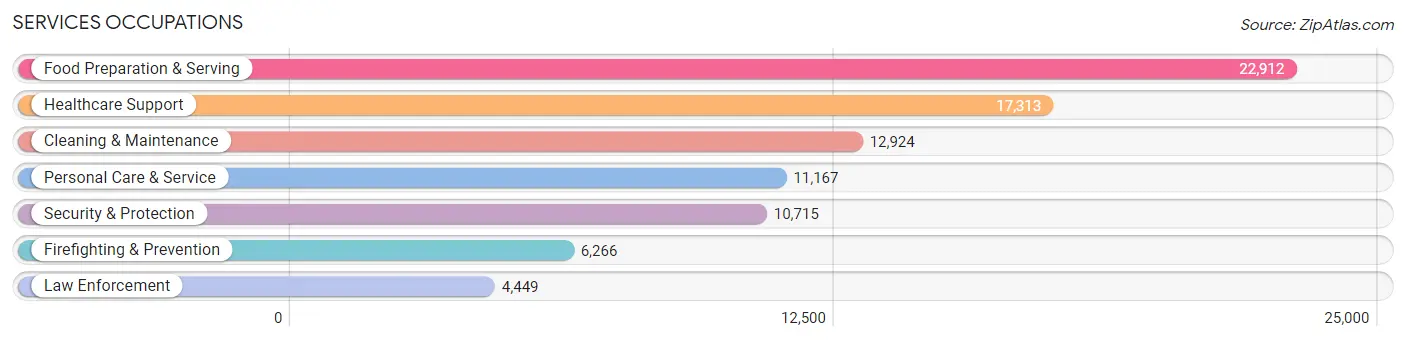
Services Occupations
The most common Services occupations in Pierce County are Food Preparation & Serving (22,912 | 5.2%), Healthcare Support (17,313 | 4.0%), Cleaning & Maintenance (12,924 | 2.9%), Personal Care & Service (11,167 | 2.5%), and Security & Protection (10,715 | 2.4%).
Services Occupations by Sex
Within the Services occupations in Pierce County, the most male-oriented occupations are Law Enforcement (78.7%), Security & Protection (78.1%), and Firefighting & Prevention (77.7%), while the most female-oriented occupations are Healthcare Support (82.7%), Personal Care & Service (77.0%), and Food Preparation & Serving (59.5%).
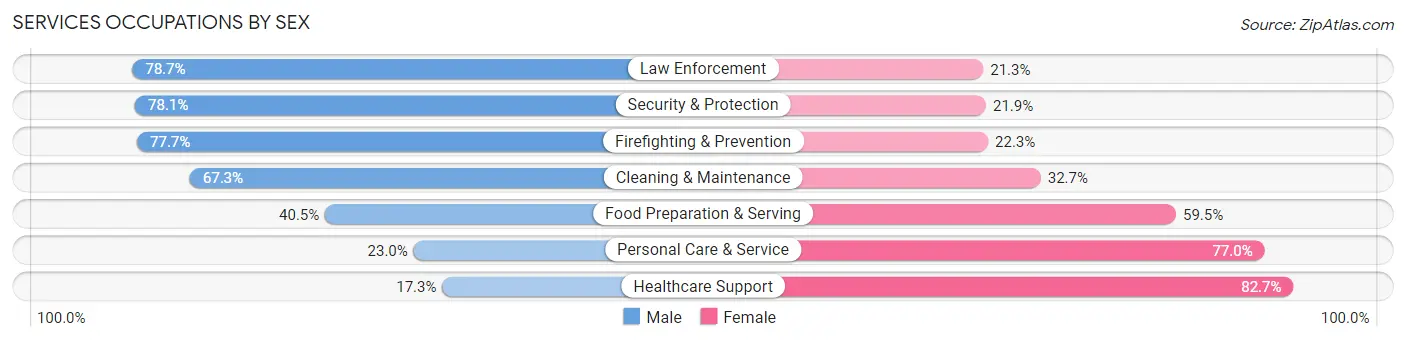
| Occupation | Male | Female |
| Healthcare Support | 2,994 (17.3%) | 14,319 (82.7%) |
| Security & Protection | 8,369 (78.1%) | 2,346 (21.9%) |
| Firefighting & Prevention | 4,869 (77.7%) | 1,397 (22.3%) |
| Law Enforcement | 3,500 (78.7%) | 949 (21.3%) |
| Food Preparation & Serving | 9,278 (40.5%) | 13,634 (59.5%) |
| Cleaning & Maintenance | 8,694 (67.3%) | 4,230 (32.7%) |
| Personal Care & Service | 2,565 (23.0%) | 8,602 (77.0%) |
| Total (Category) | 31,900 (42.5%) | 43,131 (57.5%) |
| Total (Overall) | 231,187 (52.7%) | 207,668 (47.3%) |
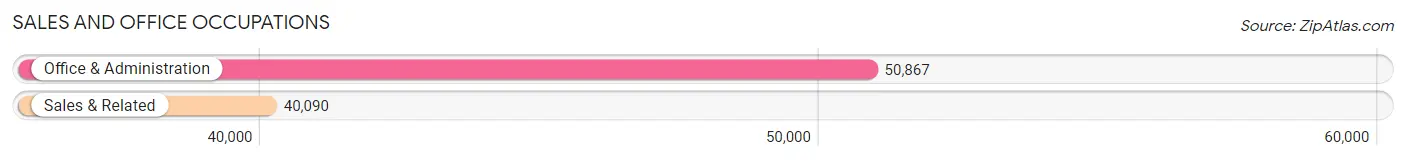
Sales and Office Occupations
The most common Sales and Office occupations in Pierce County are Office & Administration (50,867 | 11.6%), and Sales & Related (40,090 | 9.1%).
Sales and Office Occupations by Sex
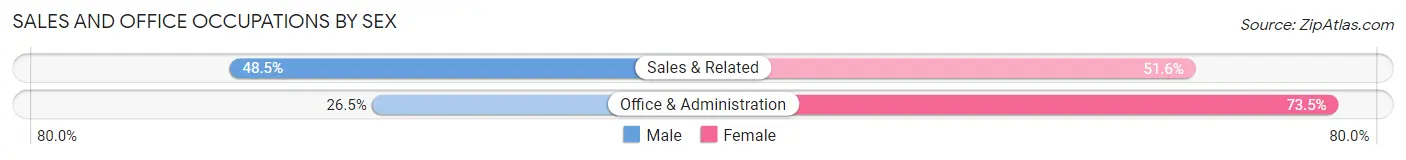
| Occupation | Male | Female |
| Sales & Related | 19,422 (48.4%) | 20,668 (51.5%) |
| Office & Administration | 13,471 (26.5%) | 37,396 (73.5%) |
| Total (Category) | 32,893 (36.2%) | 58,064 (63.8%) |
| Total (Overall) | 231,187 (52.7%) | 207,668 (47.3%) |
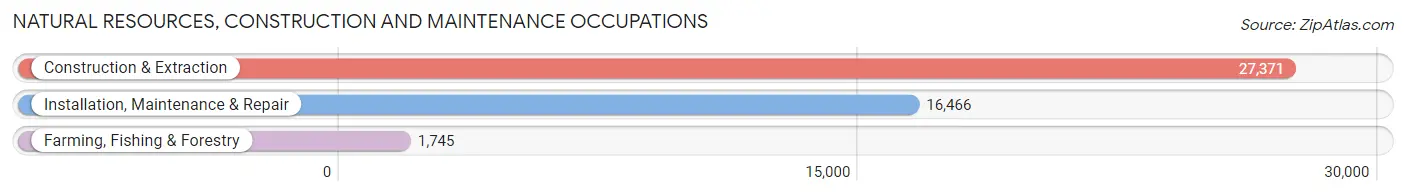
Natural Resources, Construction and Maintenance Occupations
The most common Natural Resources, Construction and Maintenance occupations in Pierce County are Construction & Extraction (27,371 | 6.2%), Installation, Maintenance & Repair (16,466 | 3.7%), and Farming, Fishing & Forestry (1,745 | 0.4%).
Natural Resources, Construction and Maintenance Occupations by Sex
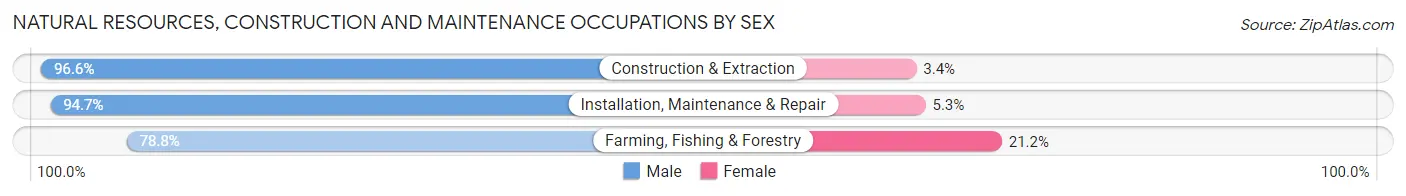
| Occupation | Male | Female |
| Farming, Fishing & Forestry | 1,375 (78.8%) | 370 (21.2%) |
| Construction & Extraction | 26,434 (96.6%) | 937 (3.4%) |
| Installation, Maintenance & Repair | 15,589 (94.7%) | 877 (5.3%) |
| Total (Category) | 43,398 (95.2%) | 2,184 (4.8%) |
| Total (Overall) | 231,187 (52.7%) | 207,668 (47.3%) |
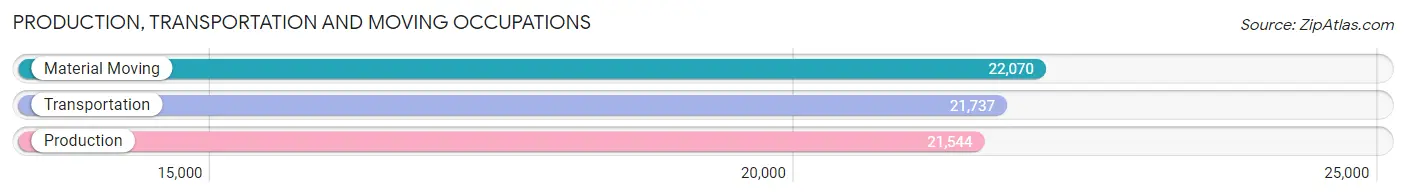
Production, Transportation and Moving Occupations
The most common Production, Transportation and Moving occupations in Pierce County are Material Moving (22,070 | 5.0%), Transportation (21,737 | 5.0%), and Production (21,544 | 4.9%).
Production, Transportation and Moving Occupations by Sex
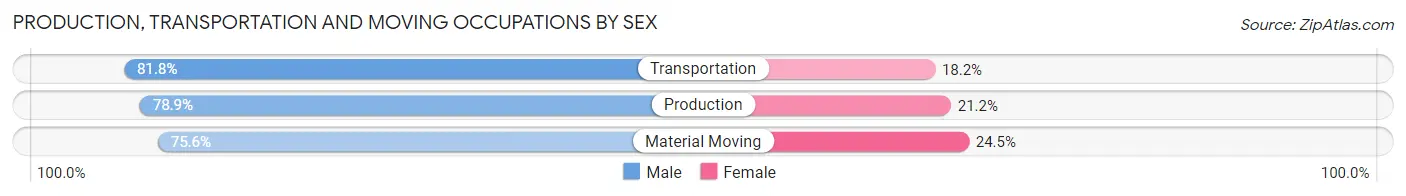
| Occupation | Male | Female |
| Production | 16,988 (78.8%) | 4,556 (21.1%) |
| Transportation | 17,772 (81.8%) | 3,965 (18.2%) |
| Material Moving | 16,673 (75.5%) | 5,397 (24.4%) |
| Total (Category) | 51,433 (78.7%) | 13,918 (21.3%) |
| Total (Overall) | 231,187 (52.7%) | 207,668 (47.3%) |
Employment Industries by Sex in Pierce County
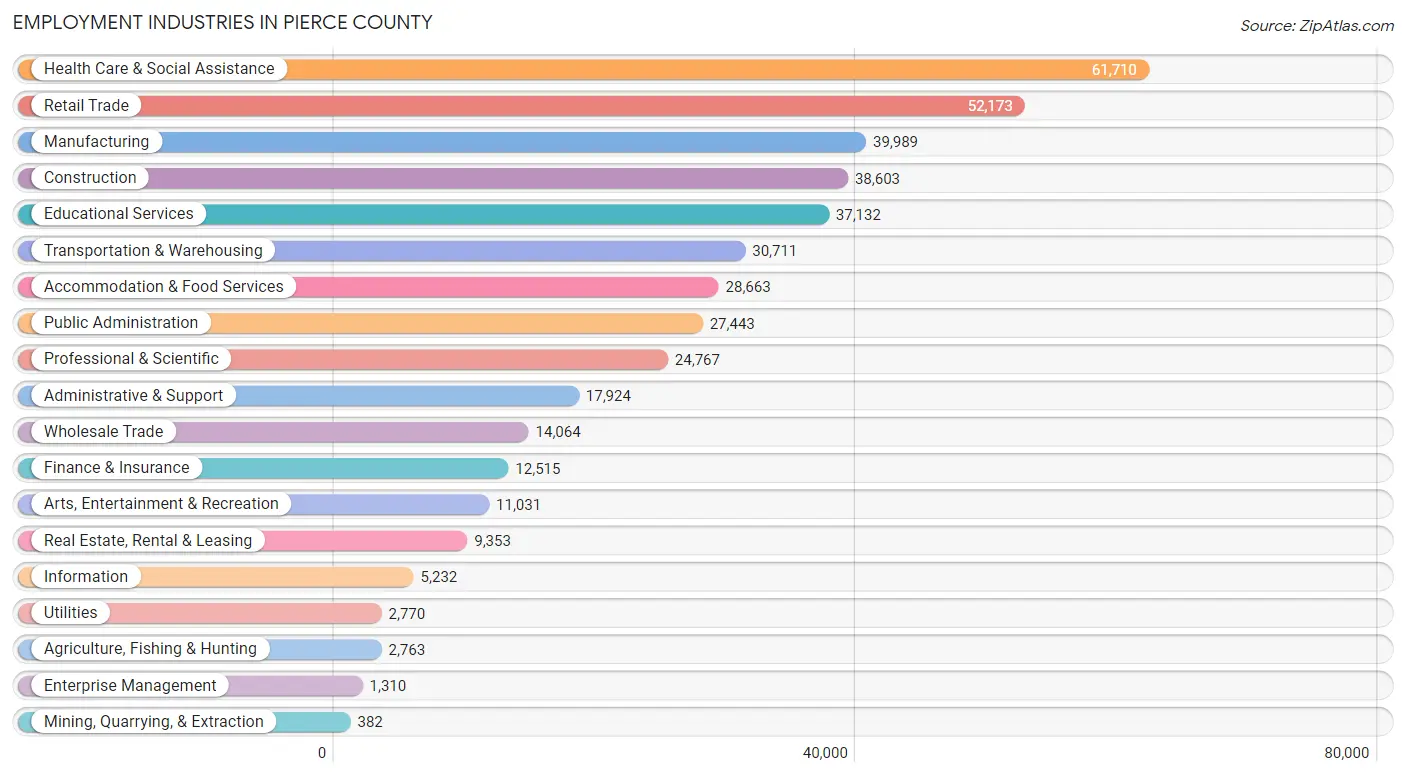
Employment Industries in Pierce County
The major employment industries in Pierce County include Health Care & Social Assistance (61,710 | 14.1%), Retail Trade (52,173 | 11.9%), Manufacturing (39,989 | 9.1%), Construction (38,603 | 8.8%), and Educational Services (37,132 | 8.5%).
Employment Industries by Sex in Pierce County
The Pierce County industries that see more men than women are Construction (88.5%), Mining, Quarrying, & Extraction (81.4%), and Manufacturing (76.6%), whereas the industries that tend to have a higher number of women are Enterprise Management (79.4%), Health Care & Social Assistance (76.6%), and Educational Services (72.8%).
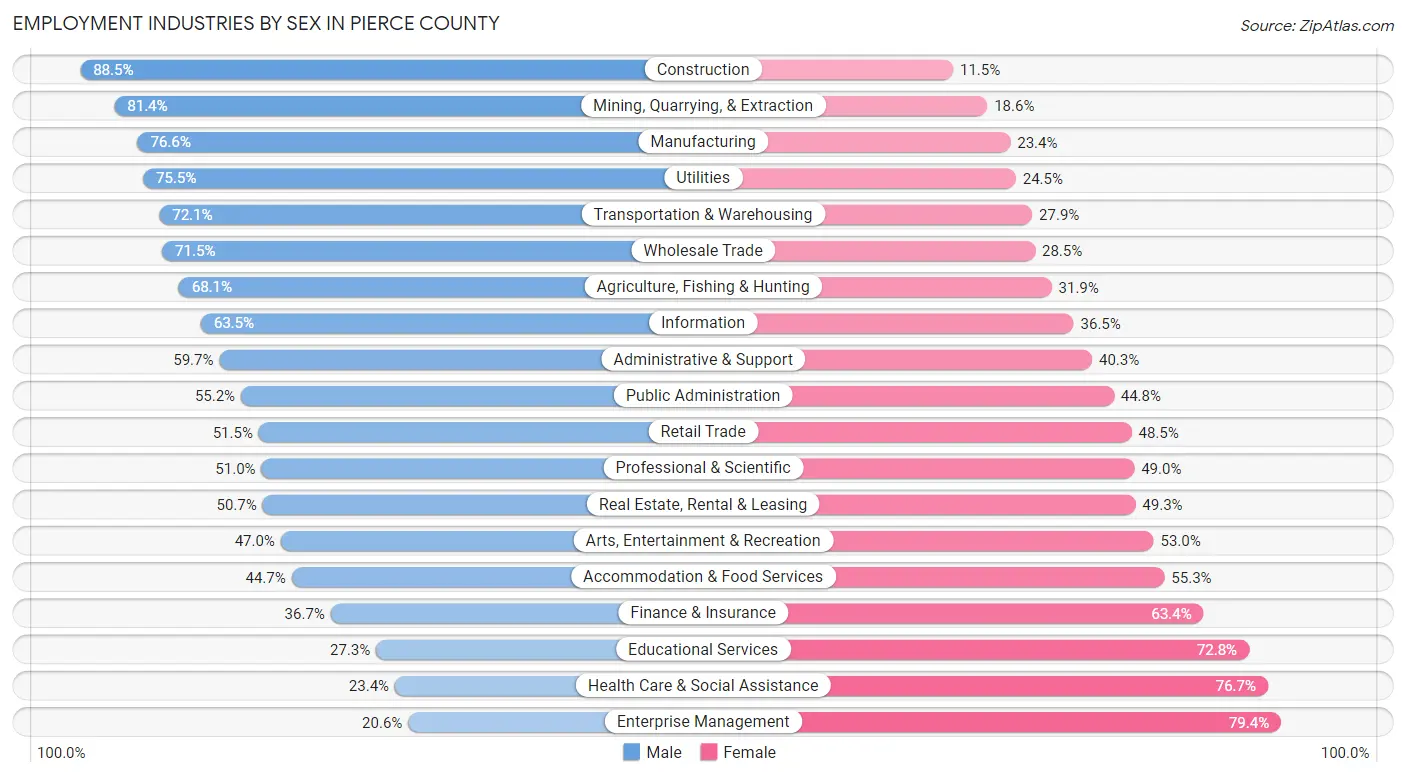
| Industry | Male | Female |
| Agriculture, Fishing & Hunting | 1,881 (68.1%) | 882 (31.9%) |
| Mining, Quarrying, & Extraction | 311 (81.4%) | 71 (18.6%) |
| Construction | 34,157 (88.5%) | 4,446 (11.5%) |
| Manufacturing | 30,645 (76.6%) | 9,344 (23.4%) |
| Wholesale Trade | 10,059 (71.5%) | 4,005 (28.5%) |
| Retail Trade | 26,891 (51.5%) | 25,282 (48.5%) |
| Transportation & Warehousing | 22,147 (72.1%) | 8,564 (27.9%) |
| Utilities | 2,091 (75.5%) | 679 (24.5%) |
| Information | 3,324 (63.5%) | 1,908 (36.5%) |
| Finance & Insurance | 4,587 (36.6%) | 7,928 (63.3%) |
| Real Estate, Rental & Leasing | 4,746 (50.7%) | 4,607 (49.3%) |
| Professional & Scientific | 12,627 (51.0%) | 12,140 (49.0%) |
| Enterprise Management | 270 (20.6%) | 1,040 (79.4%) |
| Administrative & Support | 10,702 (59.7%) | 7,222 (40.3%) |
| Educational Services | 10,117 (27.3%) | 27,015 (72.8%) |
| Health Care & Social Assistance | 14,410 (23.4%) | 47,300 (76.6%) |
| Arts, Entertainment & Recreation | 5,184 (47.0%) | 5,847 (53.0%) |
| Accommodation & Food Services | 12,824 (44.7%) | 15,839 (55.3%) |
| Public Administration | 15,153 (55.2%) | 12,290 (44.8%) |
| Total | 231,187 (52.7%) | 207,668 (47.3%) |
Education in Pierce County
School Enrollment in Pierce County
The most common levels of schooling among the 217,214 students in Pierce County are middle school (47,448 | 21.8%), elementary school (46,696 | 21.5%), and high school (45,857 | 21.1%).
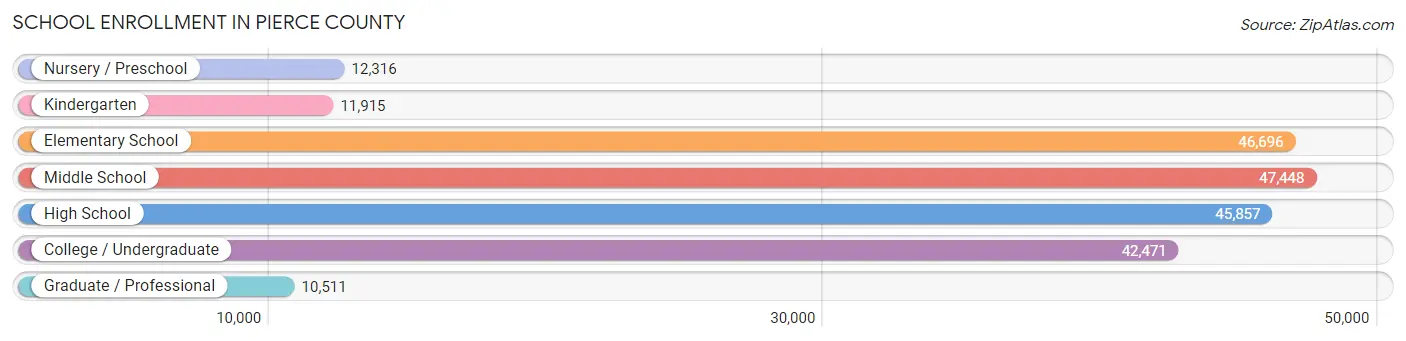
| School Level | # Students | % Students |
| Nursery / Preschool | 12,316 | 5.7% |
| Kindergarten | 11,915 | 5.5% |
| Elementary School | 46,696 | 21.5% |
| Middle School | 47,448 | 21.8% |
| High School | 45,857 | 21.1% |
| College / Undergraduate | 42,471 | 19.6% |
| Graduate / Professional | 10,511 | 4.8% |
| Total | 217,214 | 100.0% |
School Enrollment by Age by Funding Source in Pierce County
Out of a total of 217,214 students who are enrolled in schools in Pierce County, 37,144 (17.1%) attend a private institution, while the remaining 180,070 (82.9%) are enrolled in public schools. The age group of 3 to 4 year olds has the highest likelihood of being enrolled in private schools, with 4,040 (46.4% in the age bracket) enrolled. Conversely, the age group of 15 to 17 year olds has the lowest likelihood of being enrolled in a private school, with 30,691 (91.6% in the age bracket) attending a public institution.
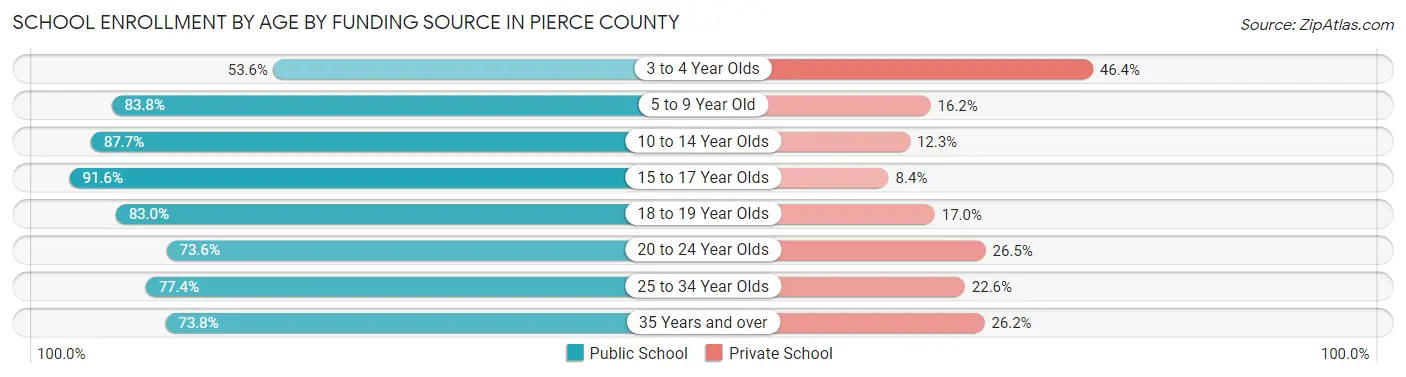
| Age Bracket | Public School | Private School |
| 3 to 4 Year Olds | 4,664 (53.6%) | 4,040 (46.4%) |
| 5 to 9 Year Old | 46,904 (83.8%) | 9,063 (16.2%) |
| 10 to 14 Year Olds | 51,407 (87.7%) | 7,234 (12.3%) |
| 15 to 17 Year Olds | 30,691 (91.6%) | 2,808 (8.4%) |
| 18 to 19 Year Olds | 11,043 (83.0%) | 2,259 (17.0%) |
| 20 to 24 Year Olds | 12,532 (73.6%) | 4,507 (26.5%) |
| 25 to 34 Year Olds | 11,802 (77.4%) | 3,441 (22.6%) |
| 35 Years and over | 10,934 (73.8%) | 3,885 (26.2%) |
| Total | 180,070 (82.9%) | 37,144 (17.1%) |
Educational Attainment by Field of Study in Pierce County
Business (33,969 | 17.2%), education (22,600 | 11.4%), science & technology (19,305 | 9.8%), social sciences (19,166 | 9.7%), and arts & humanities (15,571 | 7.9%) are the most common fields of study among 198,071 individuals in Pierce County who have obtained a bachelor's degree or higher.
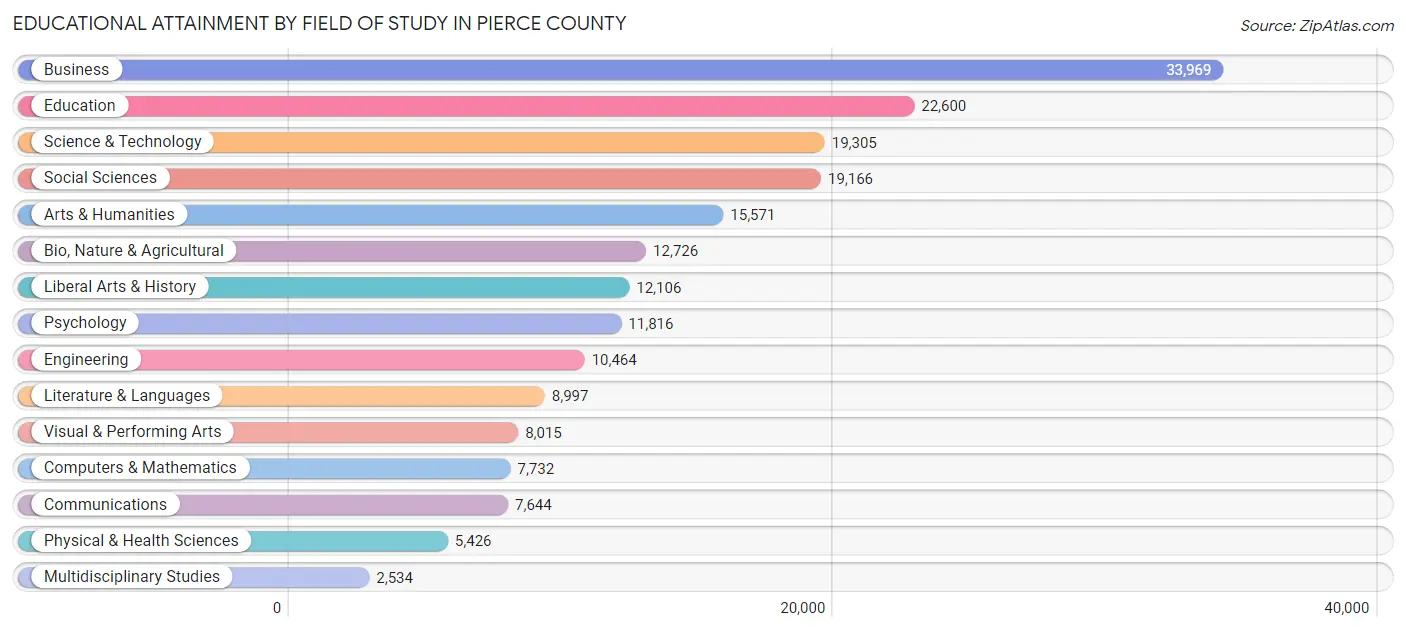
| Field of Study | # Graduates | % Graduates |
| Computers & Mathematics | 7,732 | 3.9% |
| Bio, Nature & Agricultural | 12,726 | 6.4% |
| Physical & Health Sciences | 5,426 | 2.7% |
| Psychology | 11,816 | 6.0% |
| Social Sciences | 19,166 | 9.7% |
| Engineering | 10,464 | 5.3% |
| Multidisciplinary Studies | 2,534 | 1.3% |
| Science & Technology | 19,305 | 9.8% |
| Business | 33,969 | 17.2% |
| Education | 22,600 | 11.4% |
| Literature & Languages | 8,997 | 4.5% |
| Liberal Arts & History | 12,106 | 6.1% |
| Visual & Performing Arts | 8,015 | 4.1% |
| Communications | 7,644 | 3.9% |
| Arts & Humanities | 15,571 | 7.9% |
| Total | 198,071 | 100.0% |
Transportation & Commute in Pierce County
Vehicle Availability by Sex in Pierce County
The most prevalent vehicle ownership categories in Pierce County are males with 2 vehicles (97,163, accounting for 41.0%) and females with 2 vehicles (79,780, making up 48.3%).
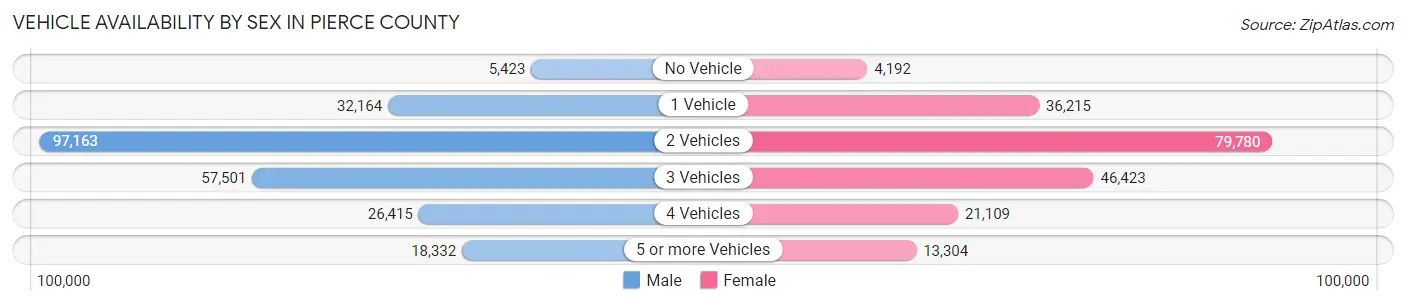
| Vehicles Available | Male | Female |
| No Vehicle | 5,423 (2.3%) | 4,192 (2.1%) |
| 1 Vehicle | 32,164 (13.6%) | 36,215 (18.0%) |
| 2 Vehicles | 97,163 (41.0%) | 79,780 (39.7%) |
| 3 Vehicles | 57,501 (24.3%) | 46,423 (23.1%) |
| 4 Vehicles | 26,415 (11.2%) | 21,109 (10.5%) |
| 5 or more Vehicles | 18,332 (7.7%) | 13,304 (6.6%) |
| Total | 236,998 (100.0%) | 201,023 (100.0%) |
Commute Time in Pierce County
The most frequently occuring commute durations in Pierce County are 30 to 34 minutes (55,679 commuters, 14.0%), 20 to 24 minutes (52,335 commuters, 13.1%), and 15 to 19 minutes (50,059 commuters, 12.6%).
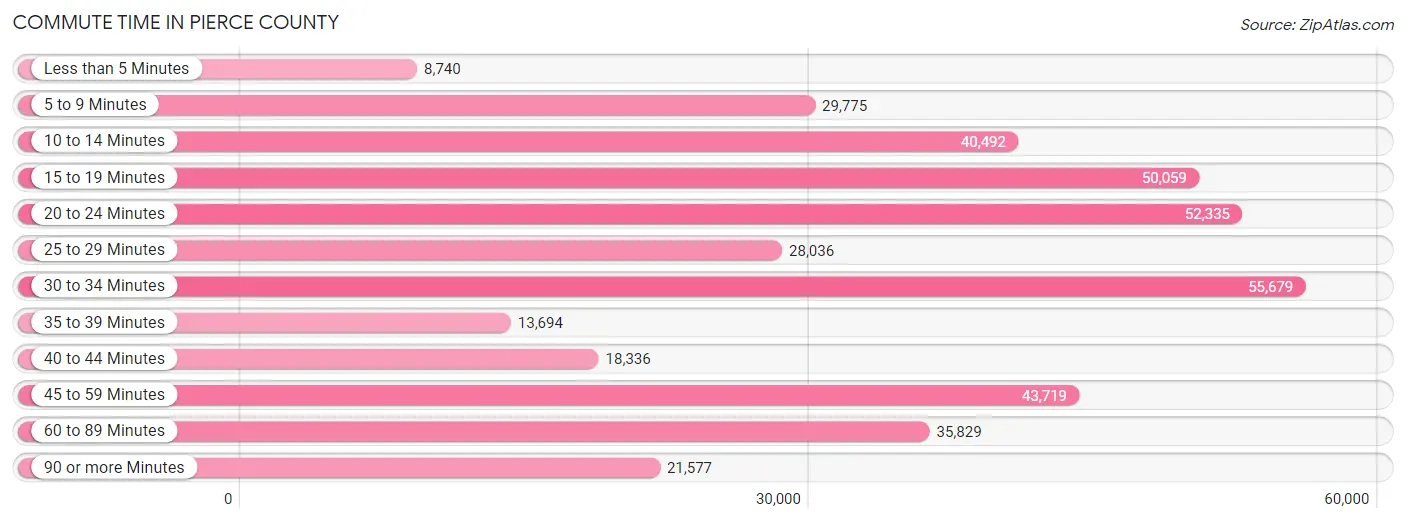
| Commute Time | # Commuters | % Commuters |
| Less than 5 Minutes | 8,740 | 2.2% |
| 5 to 9 Minutes | 29,775 | 7.5% |
| 10 to 14 Minutes | 40,492 | 10.2% |
| 15 to 19 Minutes | 50,059 | 12.6% |
| 20 to 24 Minutes | 52,335 | 13.1% |
| 25 to 29 Minutes | 28,036 | 7.0% |
| 30 to 34 Minutes | 55,679 | 14.0% |
| 35 to 39 Minutes | 13,694 | 3.4% |
| 40 to 44 Minutes | 18,336 | 4.6% |
| 45 to 59 Minutes | 43,719 | 11.0% |
| 60 to 89 Minutes | 35,829 | 9.0% |
| 90 or more Minutes | 21,577 | 5.4% |
Commute Time by Sex in Pierce County
The most common commute times in Pierce County are 30 to 34 minutes (32,309 commuters, 14.5%) for males and 15 to 19 minutes (25,477 commuters, 14.6%) for females.
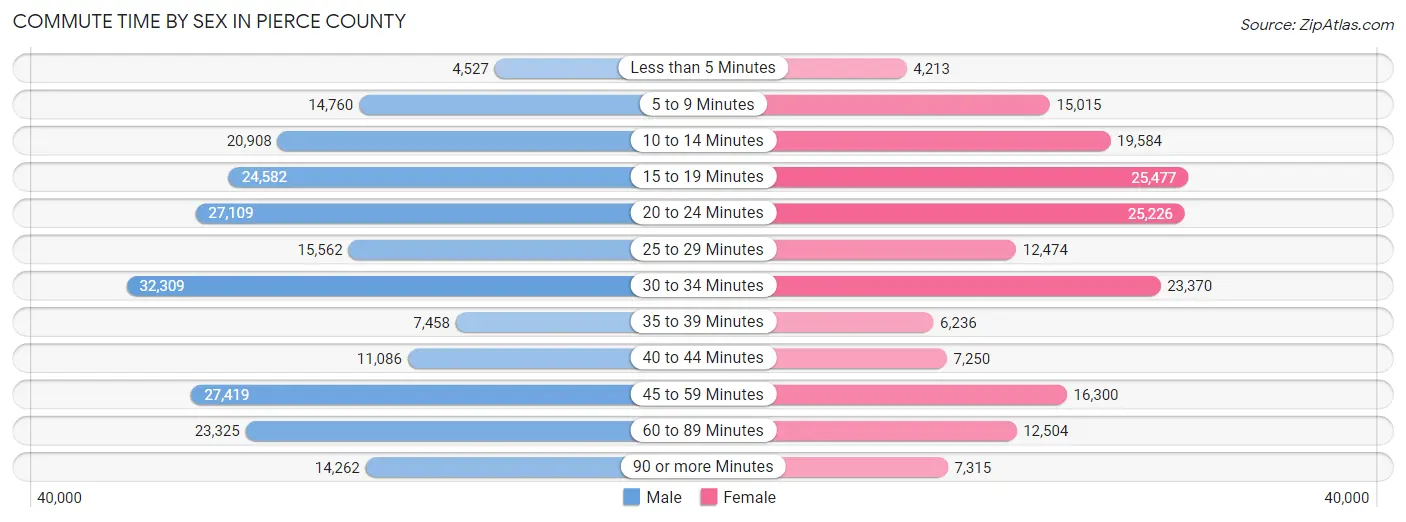
| Commute Time | Male | Female |
| Less than 5 Minutes | 4,527 (2.0%) | 4,213 (2.4%) |
| 5 to 9 Minutes | 14,760 (6.6%) | 15,015 (8.6%) |
| 10 to 14 Minutes | 20,908 (9.4%) | 19,584 (11.2%) |
| 15 to 19 Minutes | 24,582 (11.0%) | 25,477 (14.6%) |
| 20 to 24 Minutes | 27,109 (12.1%) | 25,226 (14.4%) |
| 25 to 29 Minutes | 15,562 (7.0%) | 12,474 (7.1%) |
| 30 to 34 Minutes | 32,309 (14.5%) | 23,370 (13.4%) |
| 35 to 39 Minutes | 7,458 (3.3%) | 6,236 (3.6%) |
| 40 to 44 Minutes | 11,086 (5.0%) | 7,250 (4.1%) |
| 45 to 59 Minutes | 27,419 (12.3%) | 16,300 (9.3%) |
| 60 to 89 Minutes | 23,325 (10.4%) | 12,504 (7.1%) |
| 90 or more Minutes | 14,262 (6.4%) | 7,315 (4.2%) |
Time of Departure to Work by Sex in Pierce County
The most frequent times of departure to work in Pierce County are 12:00 AM to 4:59 AM (29,631, 13.3%) for males and 7:00 AM to 7:29 AM (23,024, 13.2%) for females.
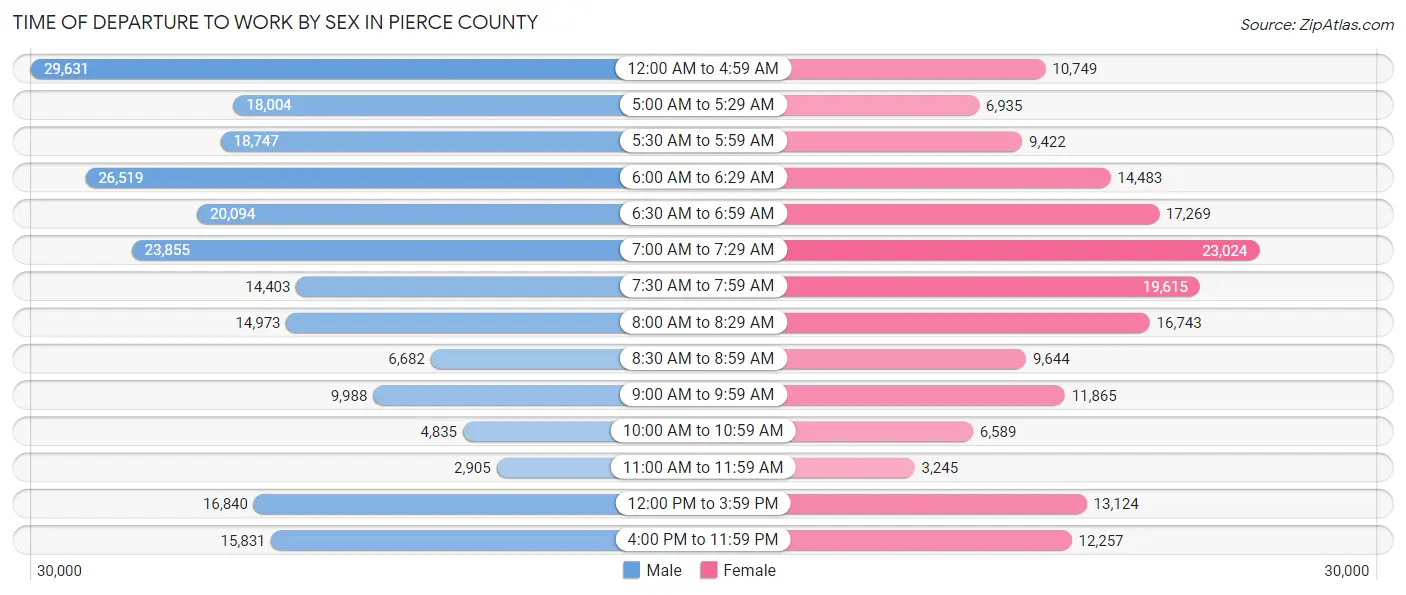
| Time of Departure | Male | Female |
| 12:00 AM to 4:59 AM | 29,631 (13.3%) | 10,749 (6.1%) |
| 5:00 AM to 5:29 AM | 18,004 (8.1%) | 6,935 (4.0%) |
| 5:30 AM to 5:59 AM | 18,747 (8.4%) | 9,422 (5.4%) |
| 6:00 AM to 6:29 AM | 26,519 (11.9%) | 14,483 (8.3%) |
| 6:30 AM to 6:59 AM | 20,094 (9.0%) | 17,269 (9.9%) |
| 7:00 AM to 7:29 AM | 23,855 (10.7%) | 23,024 (13.2%) |
| 7:30 AM to 7:59 AM | 14,403 (6.5%) | 19,615 (11.2%) |
| 8:00 AM to 8:29 AM | 14,973 (6.7%) | 16,743 (9.6%) |
| 8:30 AM to 8:59 AM | 6,682 (3.0%) | 9,644 (5.5%) |
| 9:00 AM to 9:59 AM | 9,988 (4.5%) | 11,865 (6.8%) |
| 10:00 AM to 10:59 AM | 4,835 (2.2%) | 6,589 (3.8%) |
| 11:00 AM to 11:59 AM | 2,905 (1.3%) | 3,245 (1.8%) |
| 12:00 PM to 3:59 PM | 16,840 (7.5%) | 13,124 (7.5%) |
| 4:00 PM to 11:59 PM | 15,831 (7.1%) | 12,257 (7.0%) |
| Total | 223,307 (100.0%) | 174,964 (100.0%) |
Housing Occupancy in Pierce County
Occupancy by Ownership in Pierce County
Of the total 341,783 dwellings in Pierce County, owner-occupied units account for 220,644 (64.6%), while renter-occupied units make up 121,139 (35.4%).
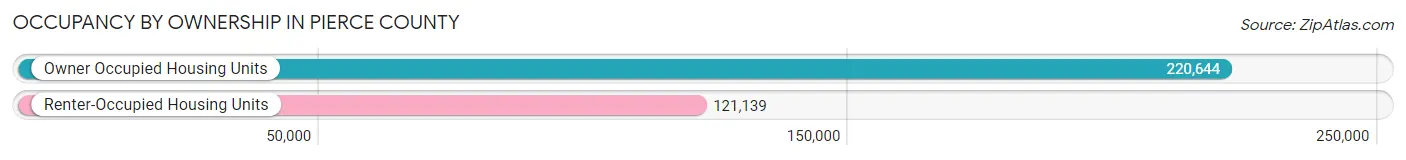
| Occupancy | # Housing Units | % Housing Units |
| Owner Occupied Housing Units | 220,644 | 64.6% |
| Renter-Occupied Housing Units | 121,139 | 35.4% |
| Total Occupied Housing Units | 341,783 | 100.0% |
Occupancy by Household Size in Pierce County
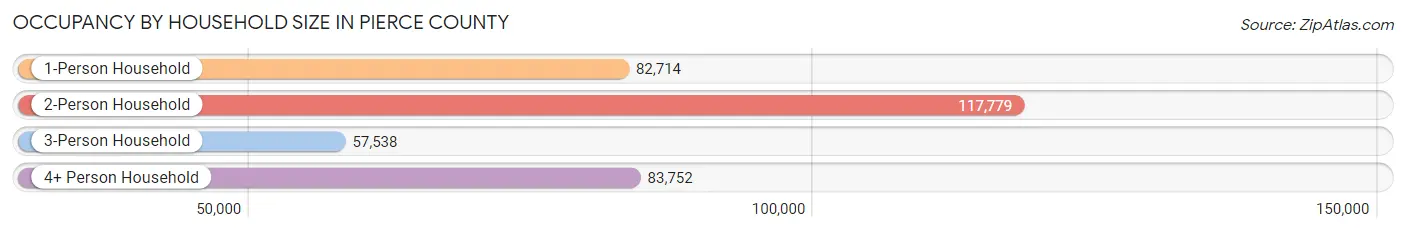
| Household Size | # Housing Units | % Housing Units |
| 1-Person Household | 82,714 | 24.2% |
| 2-Person Household | 117,779 | 34.5% |
| 3-Person Household | 57,538 | 16.8% |
| 4+ Person Household | 83,752 | 24.5% |
| Total Housing Units | 341,783 | 100.0% |
Occupancy by Ownership by Household Size in Pierce County
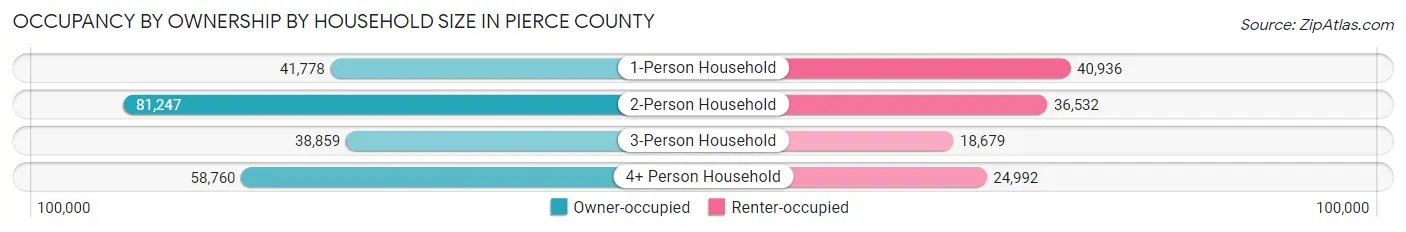
| Household Size | Owner-occupied | Renter-occupied |
| 1-Person Household | 41,778 (50.5%) | 40,936 (49.5%) |
| 2-Person Household | 81,247 (69.0%) | 36,532 (31.0%) |
| 3-Person Household | 38,859 (67.5%) | 18,679 (32.5%) |
| 4+ Person Household | 58,760 (70.2%) | 24,992 (29.8%) |
| Total Housing Units | 220,644 (64.6%) | 121,139 (35.4%) |
Occupancy by Educational Attainment in Pierce County
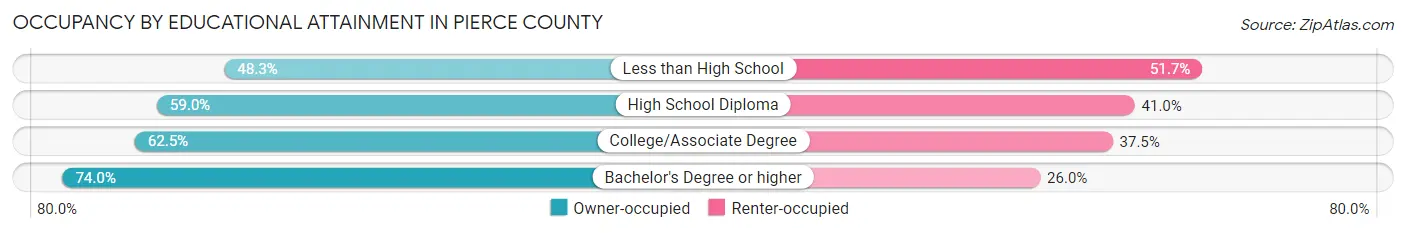
| Household Size | Owner-occupied | Renter-occupied |
| Less than High School | 9,554 (48.3%) | 10,228 (51.7%) |
| High School Diploma | 45,128 (59.0%) | 31,350 (41.0%) |
| College/Associate Degree | 85,427 (62.5%) | 51,255 (37.5%) |
| Bachelor's Degree or higher | 80,535 (74.0%) | 28,306 (26.0%) |
Occupancy by Age of Householder in Pierce County
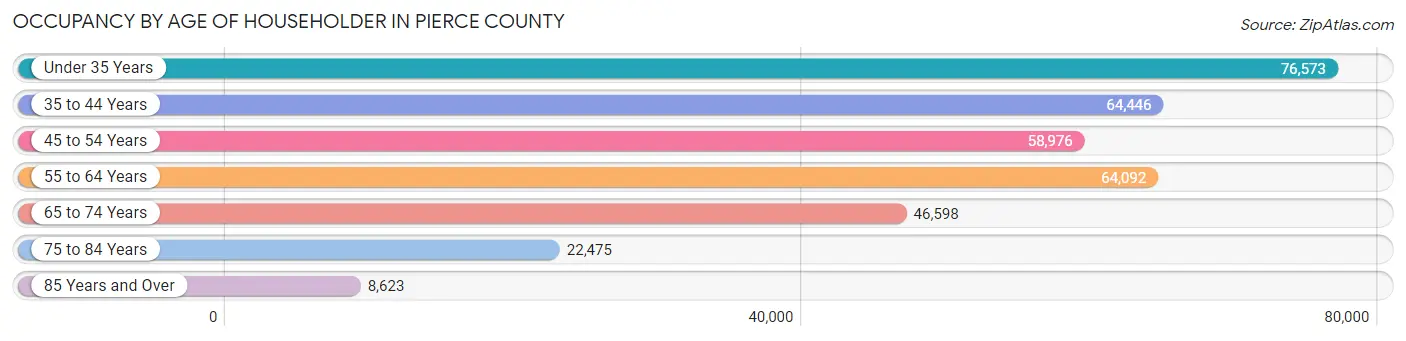
| Age Bracket | # Households | % Households |
| Under 35 Years | 76,573 | 22.4% |
| 35 to 44 Years | 64,446 | 18.9% |
| 45 to 54 Years | 58,976 | 17.3% |
| 55 to 64 Years | 64,092 | 18.8% |
| 65 to 74 Years | 46,598 | 13.6% |
| 75 to 84 Years | 22,475 | 6.6% |
| 85 Years and Over | 8,623 | 2.5% |
| Total | 341,783 | 100.0% |
Housing Finances in Pierce County
Median Income by Occupancy in Pierce County
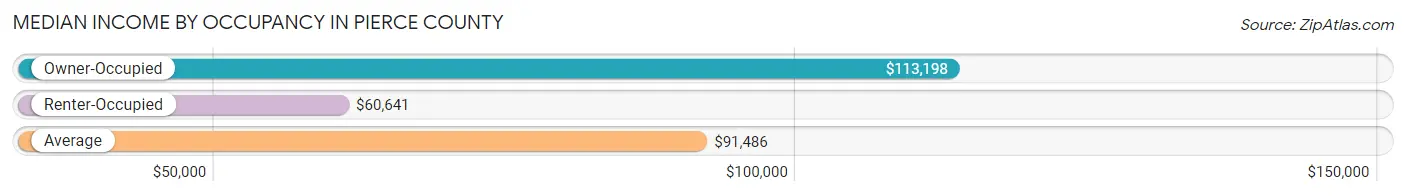
| Occupancy Type | # Households | Median Income |
| Owner-Occupied | 220,644 (64.6%) | $113,198 |
| Renter-Occupied | 121,139 (35.4%) | $60,641 |
| Average | 341,783 (100.0%) | $91,486 |
Occupancy by Householder Income Bracket in Pierce County
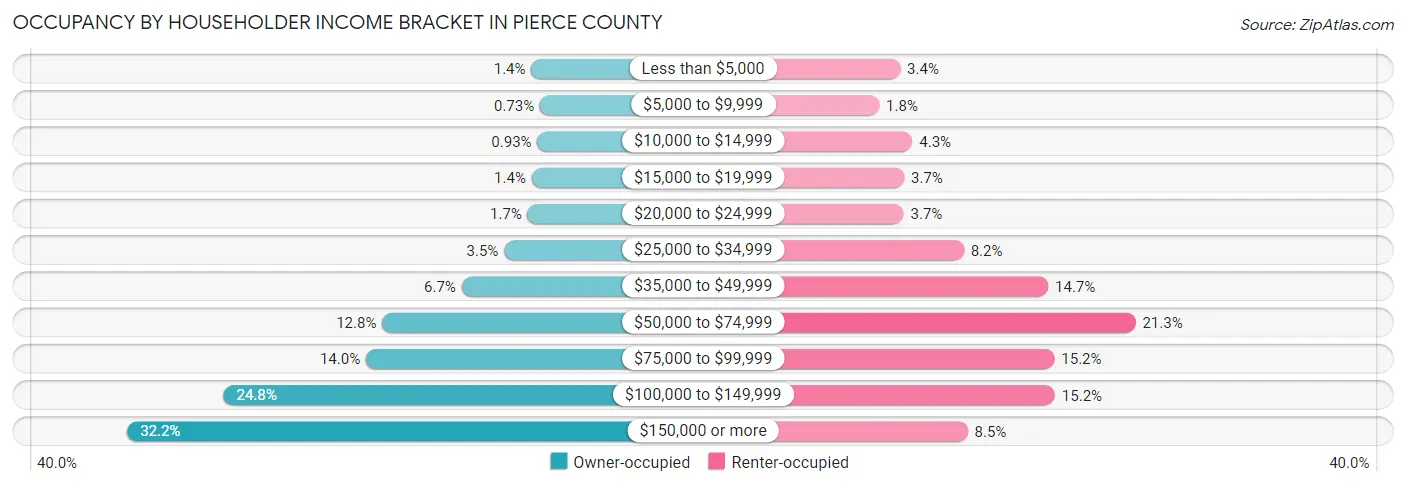
| Income Bracket | Owner-occupied | Renter-occupied |
| Less than $5,000 | 3,074 (1.4%) | 4,121 (3.4%) |
| $5,000 to $9,999 | 1,609 (0.7%) | 2,178 (1.8%) |
| $10,000 to $14,999 | 2,043 (0.9%) | 5,246 (4.3%) |
| $15,000 to $19,999 | 2,995 (1.4%) | 4,486 (3.7%) |
| $20,000 to $24,999 | 3,675 (1.7%) | 4,431 (3.7%) |
| $25,000 to $34,999 | 7,624 (3.5%) | 9,983 (8.2%) |
| $35,000 to $49,999 | 14,791 (6.7%) | 17,772 (14.7%) |
| $50,000 to $74,999 | 28,128 (12.8%) | 25,833 (21.3%) |
| $75,000 to $99,999 | 30,875 (14.0%) | 18,349 (15.1%) |
| $100,000 to $149,999 | 54,816 (24.8%) | 18,395 (15.2%) |
| $150,000 or more | 71,014 (32.2%) | 10,345 (8.5%) |
| Total | 220,644 (100.0%) | 121,139 (100.0%) |
Monthly Housing Cost Tiers in Pierce County
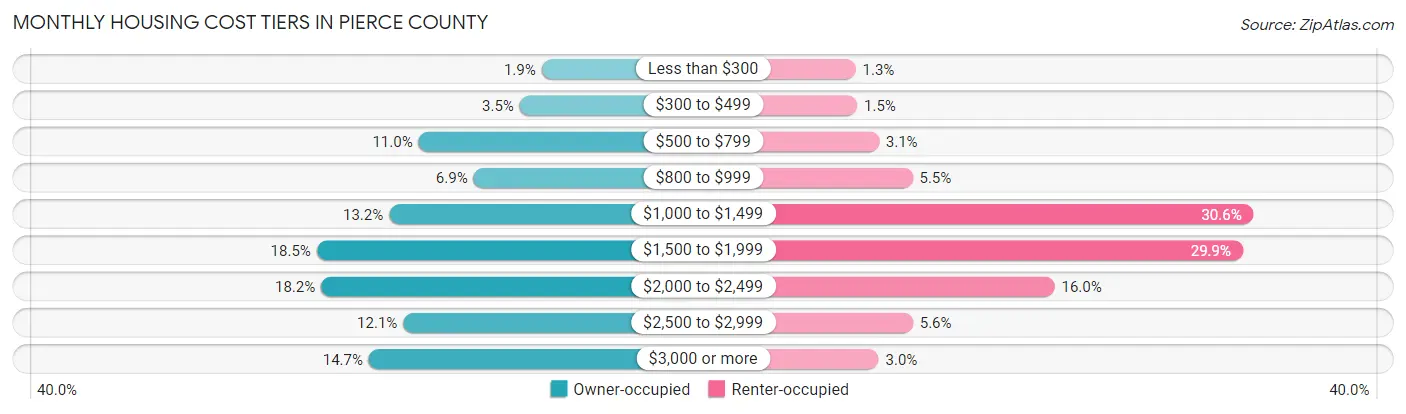
| Monthly Cost | Owner-occupied | Renter-occupied |
| Less than $300 | 4,268 (1.9%) | 1,628 (1.3%) |
| $300 to $499 | 7,817 (3.5%) | 1,759 (1.5%) |
| $500 to $799 | 24,251 (11.0%) | 3,696 (3.0%) |
| $800 to $999 | 15,306 (6.9%) | 6,695 (5.5%) |
| $1,000 to $1,499 | 29,032 (13.2%) | 37,115 (30.6%) |
| $1,500 to $1,999 | 40,805 (18.5%) | 36,164 (29.8%) |
| $2,000 to $2,499 | 40,087 (18.2%) | 19,371 (16.0%) |
| $2,500 to $2,999 | 26,745 (12.1%) | 6,723 (5.6%) |
| $3,000 or more | 32,333 (14.6%) | 3,668 (3.0%) |
| Total | 220,644 (100.0%) | 121,139 (100.0%) |
Physical Housing Characteristics in Pierce County
Housing Structures in Pierce County
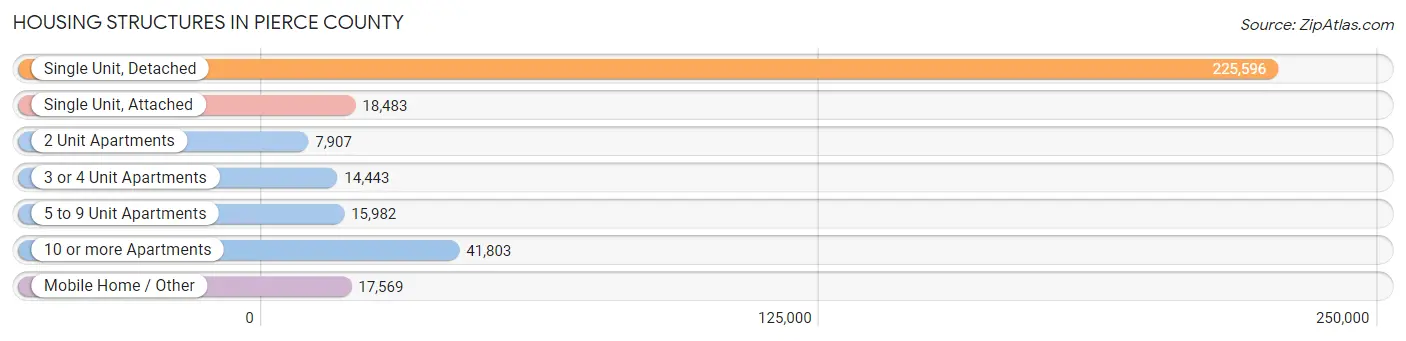
| Structure Type | # Housing Units | % Housing Units |
| Single Unit, Detached | 225,596 | 66.0% |
| Single Unit, Attached | 18,483 | 5.4% |
| 2 Unit Apartments | 7,907 | 2.3% |
| 3 or 4 Unit Apartments | 14,443 | 4.2% |
| 5 to 9 Unit Apartments | 15,982 | 4.7% |
| 10 or more Apartments | 41,803 | 12.2% |
| Mobile Home / Other | 17,569 | 5.1% |
| Total | 341,783 | 100.0% |
Housing Structures by Occupancy in Pierce County
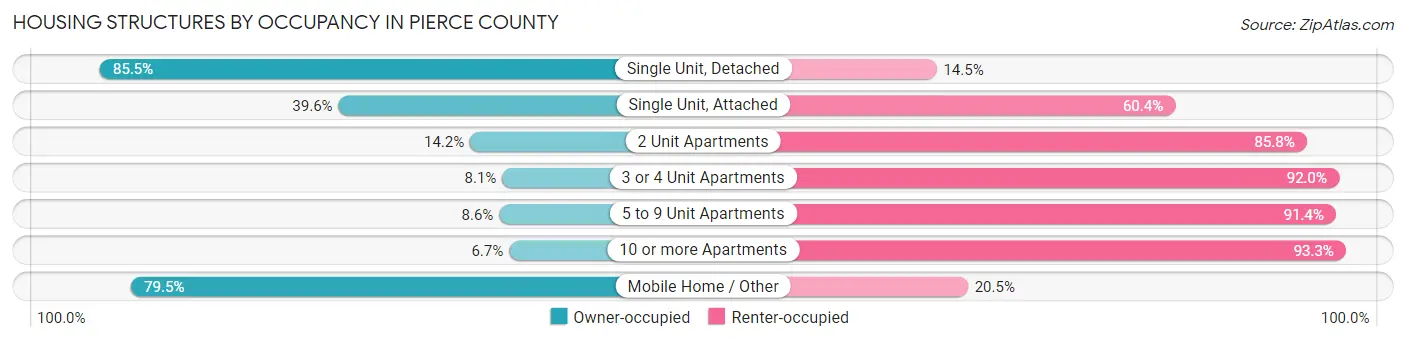
| Structure Type | Owner-occupied | Renter-occupied |
| Single Unit, Detached | 192,888 (85.5%) | 32,708 (14.5%) |
| Single Unit, Attached | 7,316 (39.6%) | 11,167 (60.4%) |
| 2 Unit Apartments | 1,126 (14.2%) | 6,781 (85.8%) |
| 3 or 4 Unit Apartments | 1,162 (8.1%) | 13,281 (91.9%) |
| 5 to 9 Unit Apartments | 1,379 (8.6%) | 14,603 (91.4%) |
| 10 or more Apartments | 2,809 (6.7%) | 38,994 (93.3%) |
| Mobile Home / Other | 13,964 (79.5%) | 3,605 (20.5%) |
| Total | 220,644 (64.6%) | 121,139 (35.4%) |
Housing Structures by Number of Rooms in Pierce County
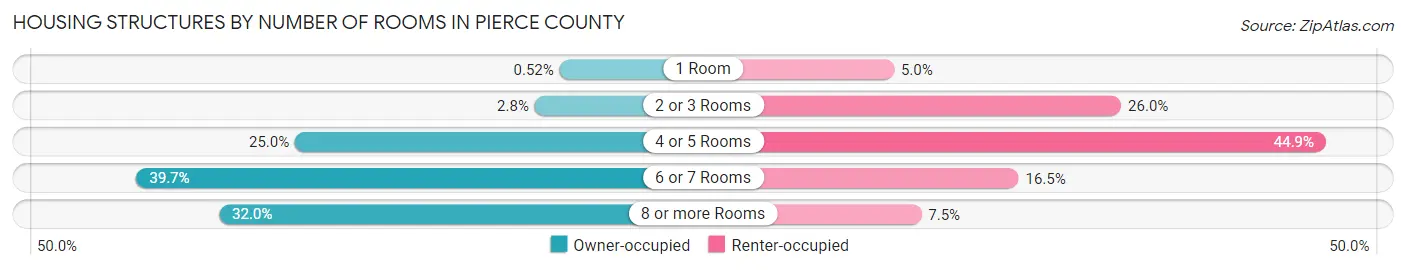
| Number of Rooms | Owner-occupied | Renter-occupied |
| 1 Room | 1,148 (0.5%) | 6,062 (5.0%) |
| 2 or 3 Rooms | 6,214 (2.8%) | 31,506 (26.0%) |
| 4 or 5 Rooms | 55,139 (25.0%) | 54,443 (44.9%) |
| 6 or 7 Rooms | 87,516 (39.7%) | 20,011 (16.5%) |
| 8 or more Rooms | 70,627 (32.0%) | 9,117 (7.5%) |
| Total | 220,644 (100.0%) | 121,139 (100.0%) |
Housing Structure by Heating Type in Pierce County
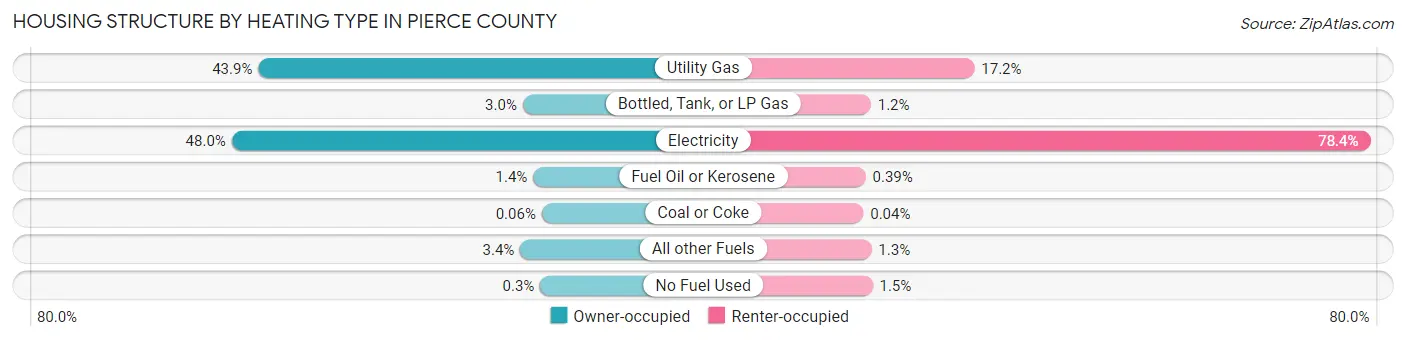
| Heating Type | Owner-occupied | Renter-occupied |
| Utility Gas | 96,811 (43.9%) | 20,847 (17.2%) |
| Bottled, Tank, or LP Gas | 6,598 (3.0%) | 1,459 (1.2%) |
| Electricity | 105,890 (48.0%) | 94,985 (78.4%) |
| Fuel Oil or Kerosene | 3,054 (1.4%) | 469 (0.4%) |
| Coal or Coke | 140 (0.1%) | 43 (0.0%) |
| All other Fuels | 7,490 (3.4%) | 1,559 (1.3%) |
| No Fuel Used | 661 (0.3%) | 1,777 (1.5%) |
| Total | 220,644 (100.0%) | 121,139 (100.0%) |
Household Vehicle Usage in Pierce County
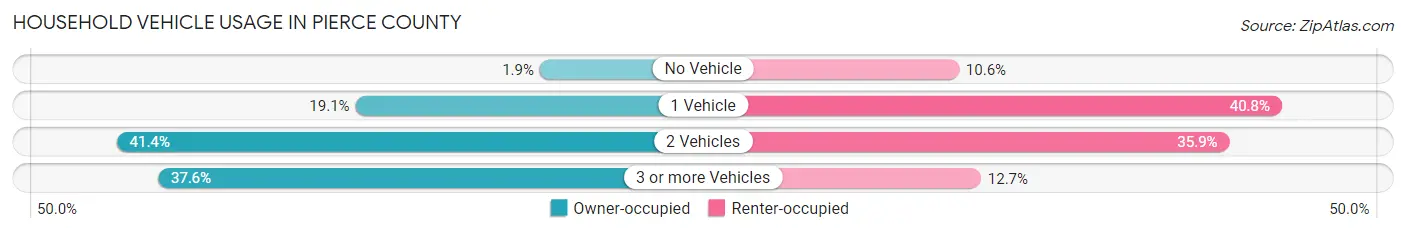
| Vehicles per Household | Owner-occupied | Renter-occupied |
| No Vehicle | 4,204 (1.9%) | 12,887 (10.6%) |
| 1 Vehicle | 42,189 (19.1%) | 49,399 (40.8%) |
| 2 Vehicles | 91,379 (41.4%) | 43,479 (35.9%) |
| 3 or more Vehicles | 82,872 (37.6%) | 15,374 (12.7%) |
| Total | 220,644 (100.0%) | 121,139 (100.0%) |
Real Estate & Mortgages in Pierce County
Real Estate and Mortgage Overview in Pierce County
| Characteristic | Without Mortgage | With Mortgage |
| Housing Units | 61,633 | 159,011 |
| Median Property Value | $423,200 | $451,800 |
| Median Household Income | $81,678 | $57,845 |
| Monthly Housing Costs | $765 | $32,136 |
| Real Estate Taxes | $4,396 | $3,819 |
Property Value by Mortgage Status in Pierce County
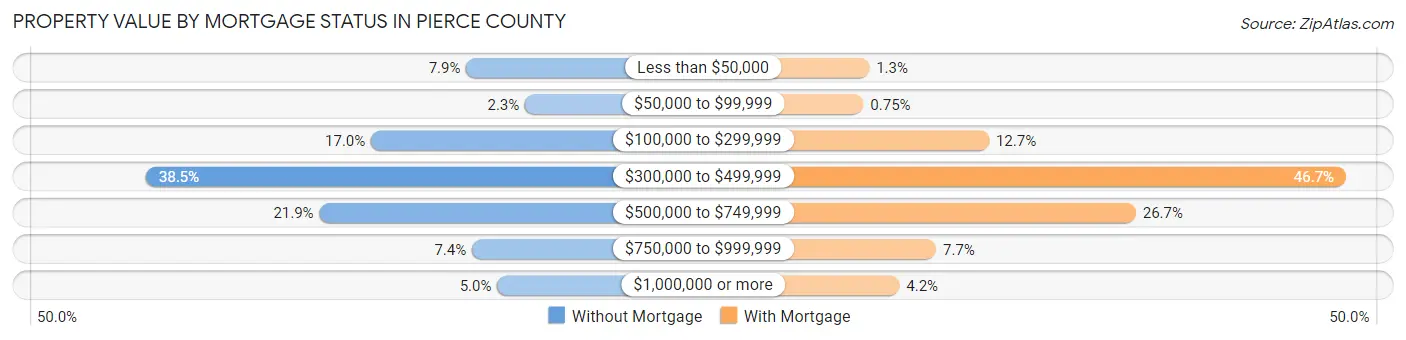
| Property Value | Without Mortgage | With Mortgage |
| Less than $50,000 | 4,886 (7.9%) | 2,062 (1.3%) |
| $50,000 to $99,999 | 1,436 (2.3%) | 1,194 (0.7%) |
| $100,000 to $299,999 | 10,478 (17.0%) | 20,213 (12.7%) |
| $300,000 to $499,999 | 23,698 (38.5%) | 74,265 (46.7%) |
| $500,000 to $749,999 | 13,511 (21.9%) | 42,442 (26.7%) |
| $750,000 to $999,999 | 4,552 (7.4%) | 12,201 (7.7%) |
| $1,000,000 or more | 3,072 (5.0%) | 6,634 (4.2%) |
| Total | 61,633 (100.0%) | 159,011 (100.0%) |
Household Income by Mortgage Status in Pierce County
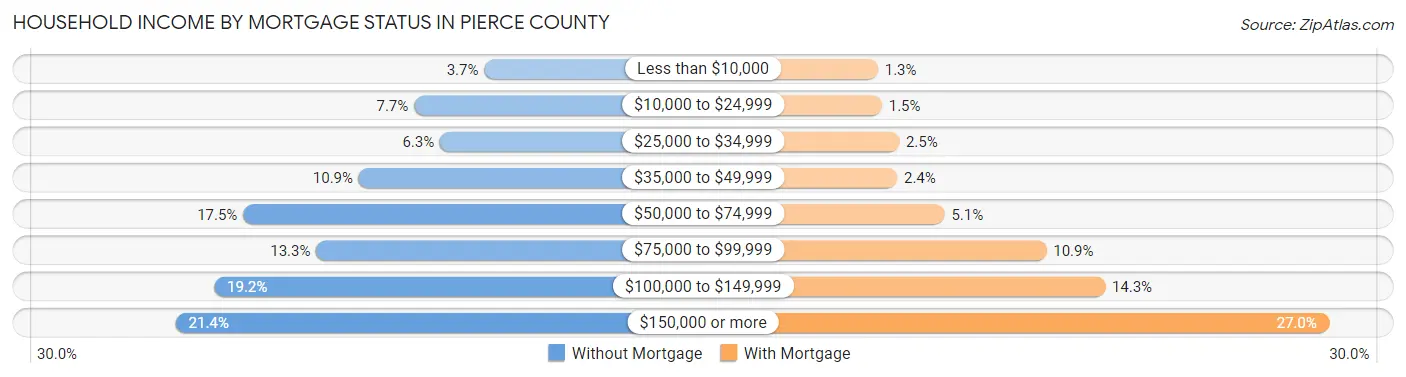
| Household Income | Without Mortgage | With Mortgage |
| Less than $10,000 | 2,301 (3.7%) | 2,012 (1.3%) |
| $10,000 to $24,999 | 4,769 (7.7%) | 2,382 (1.5%) |
| $25,000 to $34,999 | 3,858 (6.3%) | 3,944 (2.5%) |
| $35,000 to $49,999 | 6,721 (10.9%) | 3,766 (2.4%) |
| $50,000 to $74,999 | 10,789 (17.5%) | 8,070 (5.1%) |
| $75,000 to $99,999 | 8,213 (13.3%) | 17,339 (10.9%) |
| $100,000 to $149,999 | 11,813 (19.2%) | 22,662 (14.2%) |
| $150,000 or more | 13,169 (21.4%) | 43,003 (27.0%) |
| Total | 61,633 (100.0%) | 159,011 (100.0%) |
Property Value to Household Income Ratio in Pierce County
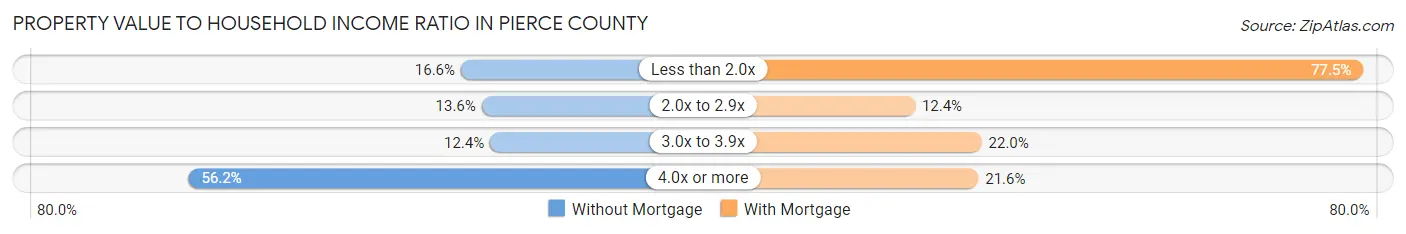
| Value-to-Income Ratio | Without Mortgage | With Mortgage |
| Less than 2.0x | 10,244 (16.6%) | 123,204 (77.5%) |
| 2.0x to 2.9x | 8,381 (13.6%) | 19,633 (12.3%) |
| 3.0x to 3.9x | 7,628 (12.4%) | 35,043 (22.0%) |
| 4.0x or more | 34,630 (56.2%) | 34,286 (21.6%) |
| Total | 61,633 (100.0%) | 159,011 (100.0%) |
Real Estate Taxes by Mortgage Status in Pierce County
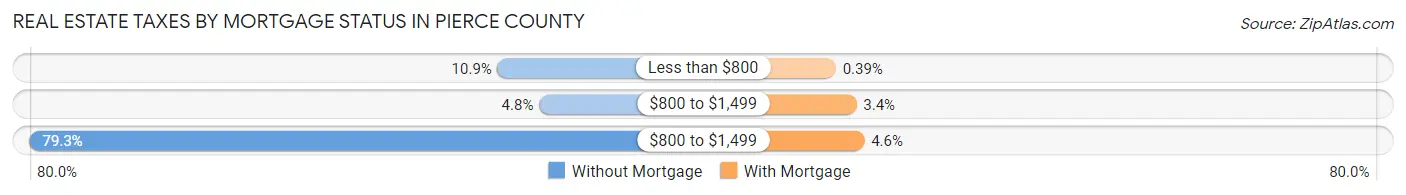
| Property Taxes | Without Mortgage | With Mortgage |
| Less than $800 | 6,704 (10.9%) | 616 (0.4%) |
| $800 to $1,499 | 2,957 (4.8%) | 5,401 (3.4%) |
| $800 to $1,499 | 48,868 (79.3%) | 7,228 (4.5%) |
| Total | 61,633 (100.0%) | 159,011 (100.0%) |
Health & Disability in Pierce County
Health Insurance Coverage by Age in Pierce County
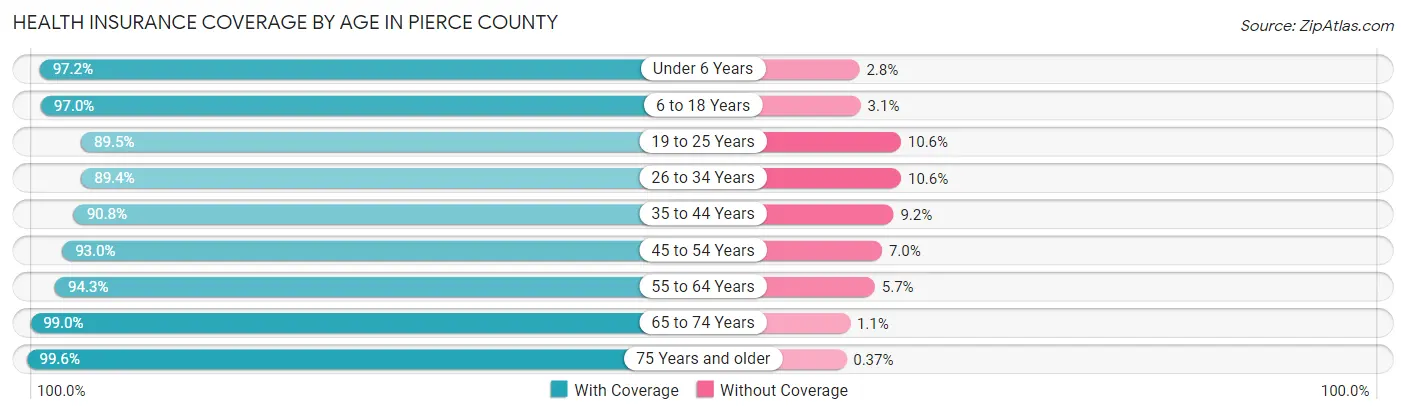
| Age Bracket | With Coverage | Without Coverage |
| Under 6 Years | 67,349 (97.2%) | 1,963 (2.8%) |
| 6 to 18 Years | 148,524 (97.0%) | 4,665 (3.0%) |
| 19 to 25 Years | 69,783 (89.4%) | 8,228 (10.5%) |
| 26 to 34 Years | 106,417 (89.4%) | 12,588 (10.6%) |
| 35 to 44 Years | 112,811 (90.8%) | 11,386 (9.2%) |
| 45 to 54 Years | 101,409 (93.0%) | 7,657 (7.0%) |
| 55 to 64 Years | 104,724 (94.3%) | 6,325 (5.7%) |
| 65 to 74 Years | 78,325 (99.0%) | 831 (1.1%) |
| 75 Years and older | 48,493 (99.6%) | 178 (0.4%) |
| Total | 837,835 (94.0%) | 53,821 (6.0%) |
Health Insurance Coverage by Citizenship Status in Pierce County
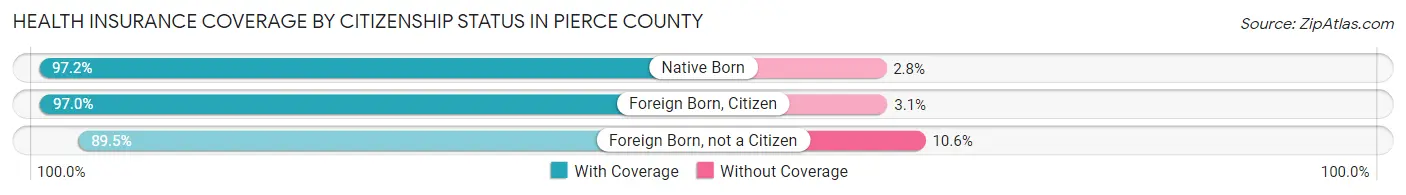
| Citizenship Status | With Coverage | Without Coverage |
| Native Born | 67,349 (97.2%) | 1,963 (2.8%) |
| Foreign Born, Citizen | 148,524 (97.0%) | 4,665 (3.0%) |
| Foreign Born, not a Citizen | 69,783 (89.4%) | 8,228 (10.5%) |
Health Insurance Coverage by Household Income in Pierce County
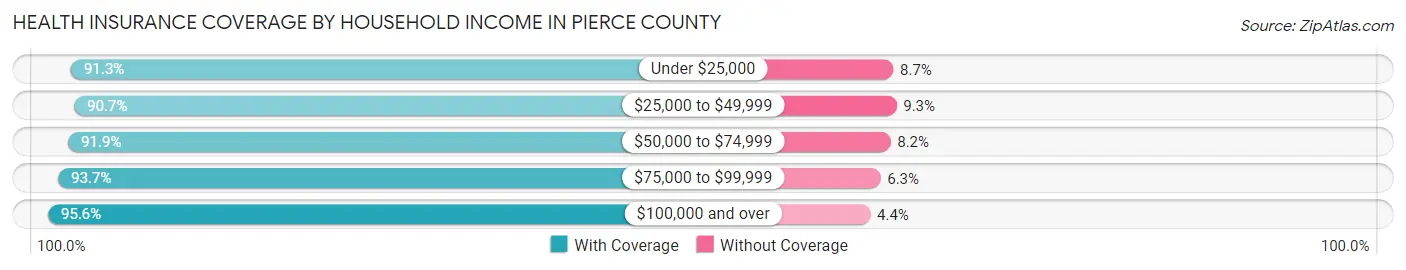
| Household Income | With Coverage | Without Coverage |
| Under $25,000 | 53,319 (91.3%) | 5,068 (8.7%) |
| $25,000 to $49,999 | 90,153 (90.7%) | 9,216 (9.3%) |
| $50,000 to $74,999 | 112,398 (91.8%) | 9,975 (8.2%) |
| $75,000 to $99,999 | 116,738 (93.7%) | 7,814 (6.3%) |
| $100,000 and over | 457,846 (95.6%) | 20,895 (4.4%) |
Public vs Private Health Insurance Coverage by Age in Pierce County
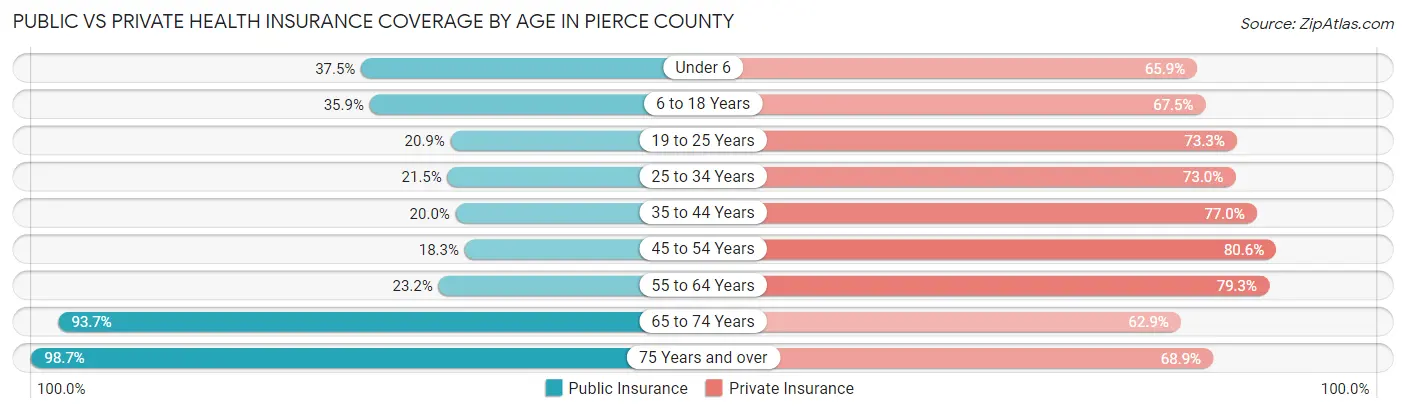
| Age Bracket | Public Insurance | Private Insurance |
| Under 6 | 26,007 (37.5%) | 45,693 (65.9%) |
| 6 to 18 Years | 55,054 (35.9%) | 103,335 (67.5%) |
| 19 to 25 Years | 16,330 (20.9%) | 57,165 (73.3%) |
| 25 to 34 Years | 25,568 (21.5%) | 86,872 (73.0%) |
| 35 to 44 Years | 24,821 (20.0%) | 95,590 (77.0%) |
| 45 to 54 Years | 19,964 (18.3%) | 87,892 (80.6%) |
| 55 to 64 Years | 25,720 (23.2%) | 88,004 (79.2%) |
| 65 to 74 Years | 74,177 (93.7%) | 49,779 (62.9%) |
| 75 Years and over | 48,052 (98.7%) | 33,526 (68.9%) |
| Total | 315,693 (35.4%) | 647,856 (72.7%) |
Disability Status by Sex by Age in Pierce County
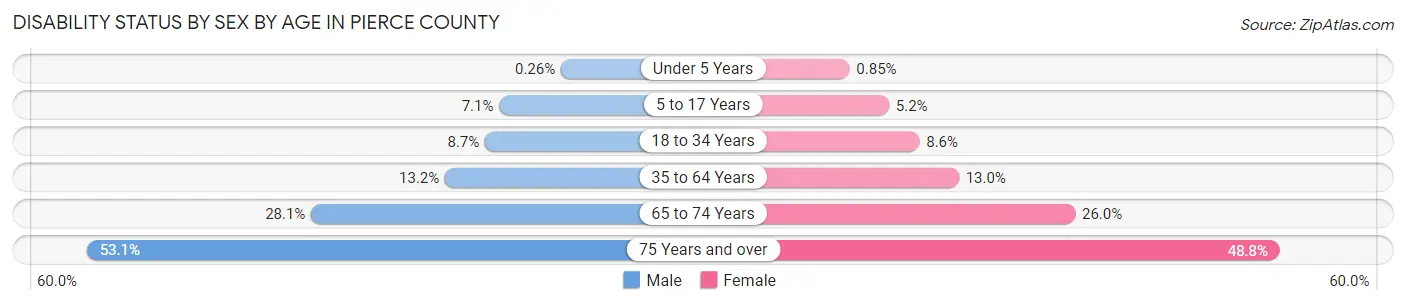
| Age Bracket | Male | Female |
| Under 5 Years | 76 (0.3%) | 239 (0.9%) |
| 5 to 17 Years | 5,655 (7.1%) | 3,946 (5.2%) |
| 18 to 34 Years | 9,045 (8.7%) | 8,940 (8.6%) |
| 35 to 64 Years | 22,599 (13.2%) | 22,481 (13.0%) |
| 65 to 74 Years | 10,498 (28.1%) | 10,852 (26.0%) |
| 75 Years and over | 10,738 (53.1%) | 13,875 (48.8%) |
Disability Class by Sex by Age in Pierce County
Disability Class: Hearing Difficulty
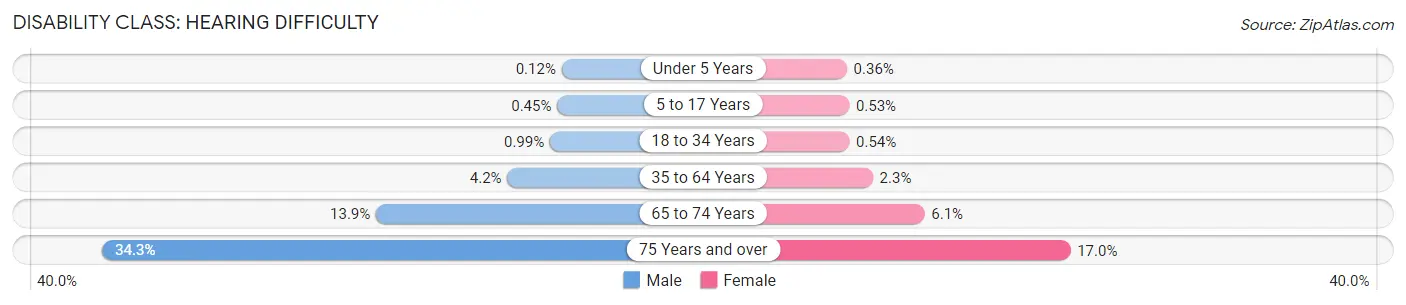
| Age Bracket | Male | Female |
| Under 5 Years | 36 (0.1%) | 102 (0.4%) |
| 5 to 17 Years | 354 (0.4%) | 399 (0.5%) |
| 18 to 34 Years | 1,026 (1.0%) | 560 (0.5%) |
| 35 to 64 Years | 7,120 (4.2%) | 3,961 (2.3%) |
| 65 to 74 Years | 5,197 (13.9%) | 2,560 (6.1%) |
| 75 Years and over | 6,929 (34.3%) | 4,823 (17.0%) |
Disability Class: Vision Difficulty
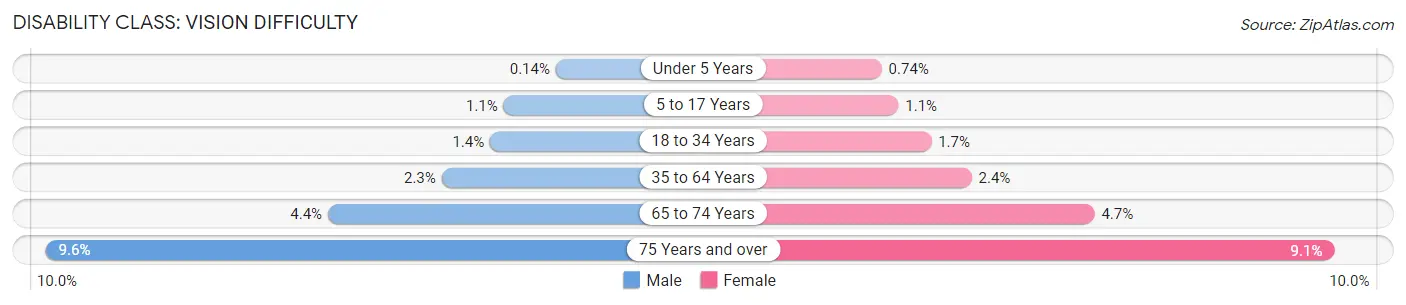
| Age Bracket | Male | Female |
| Under 5 Years | 40 (0.1%) | 206 (0.7%) |
| 5 to 17 Years | 878 (1.1%) | 789 (1.1%) |
| 18 to 34 Years | 1,412 (1.4%) | 1,723 (1.7%) |
| 35 to 64 Years | 3,884 (2.3%) | 4,170 (2.4%) |
| 65 to 74 Years | 1,632 (4.4%) | 1,958 (4.7%) |
| 75 Years and over | 1,945 (9.6%) | 2,601 (9.1%) |
Disability Class: Cognitive Difficulty
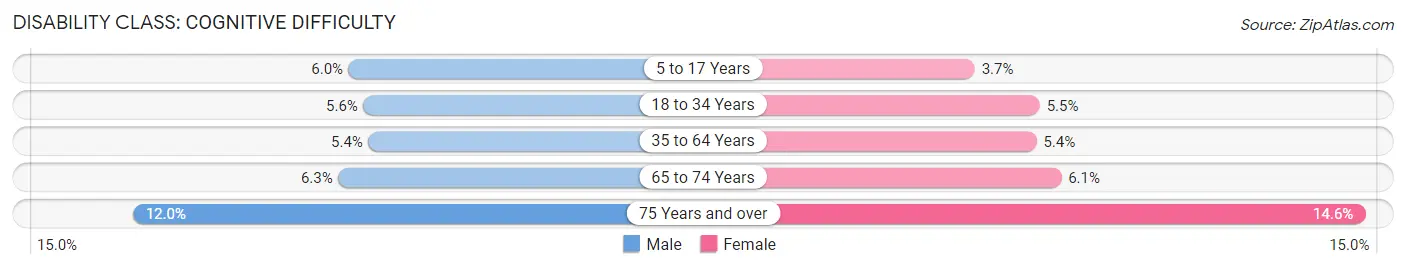
| Age Bracket | Male | Female |
| 5 to 17 Years | 4,732 (6.0%) | 2,789 (3.7%) |
| 18 to 34 Years | 5,775 (5.6%) | 5,709 (5.5%) |
| 35 to 64 Years | 9,306 (5.4%) | 9,367 (5.4%) |
| 65 to 74 Years | 2,342 (6.3%) | 2,552 (6.1%) |
| 75 Years and over | 2,425 (12.0%) | 4,143 (14.6%) |
Disability Class: Ambulatory Difficulty

| Age Bracket | Male | Female |
| 5 to 17 Years | 631 (0.8%) | 551 (0.7%) |
| 18 to 34 Years | 1,280 (1.2%) | 1,524 (1.5%) |
| 35 to 64 Years | 10,433 (6.1%) | 11,886 (6.9%) |
| 65 to 74 Years | 5,298 (14.2%) | 7,162 (17.2%) |
| 75 Years and over | 5,551 (27.4%) | 9,823 (34.5%) |
Disability Class: Self-Care Difficulty
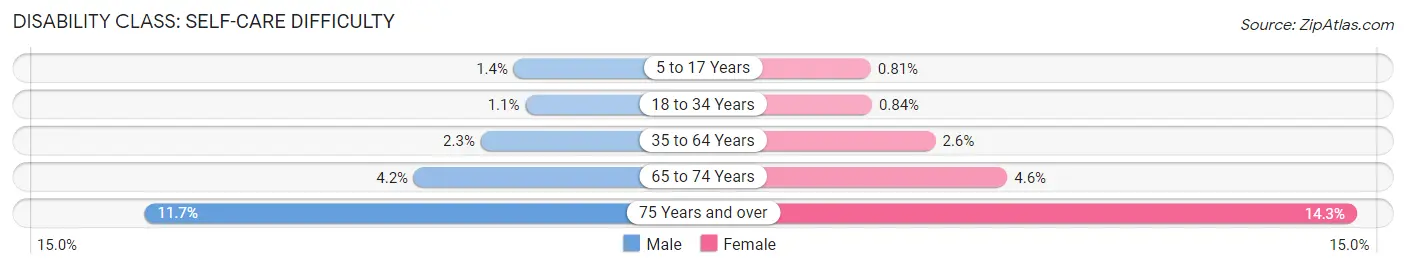
| Age Bracket | Male | Female |
| 5 to 17 Years | 1,095 (1.4%) | 610 (0.8%) |
| 18 to 34 Years | 1,100 (1.1%) | 875 (0.8%) |
| 35 to 64 Years | 3,949 (2.3%) | 4,515 (2.6%) |
| 65 to 74 Years | 1,554 (4.2%) | 1,927 (4.6%) |
| 75 Years and over | 2,359 (11.7%) | 4,078 (14.3%) |
Technology Access in Pierce County
Computing Device Access in Pierce County
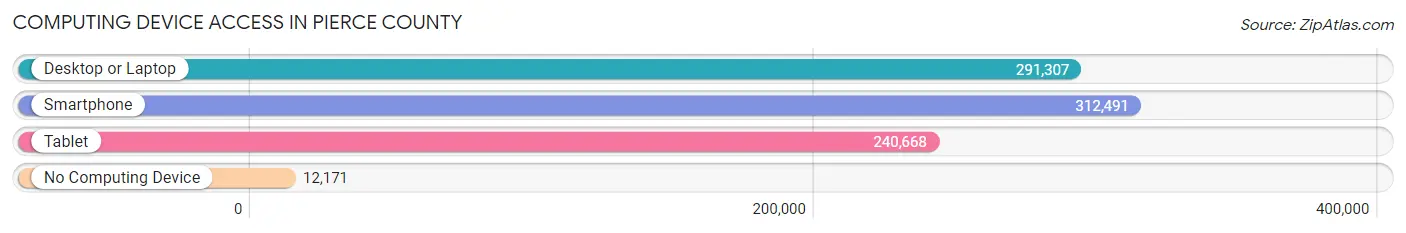
| Device Type | # Households | % Households |
| Desktop or Laptop | 291,307 | 85.2% |
| Smartphone | 312,491 | 91.4% |
| Tablet | 240,668 | 70.4% |
| No Computing Device | 12,171 | 3.6% |
| Total | 341,783 | 100.0% |
Internet Access in Pierce County
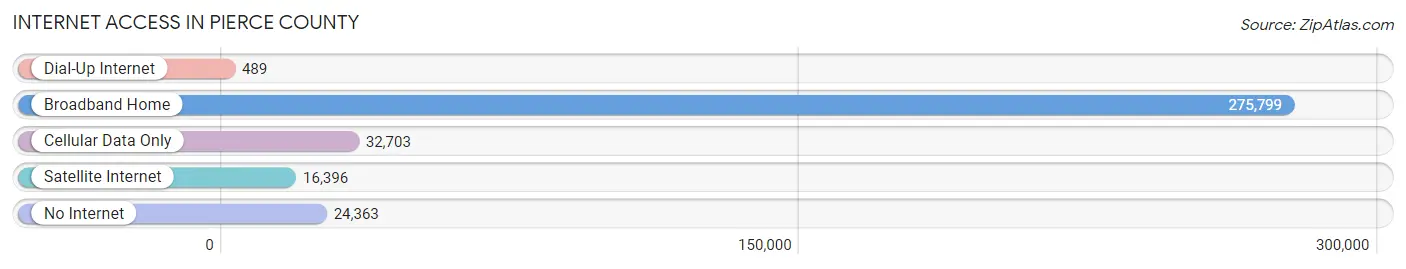
| Internet Type | # Households | % Households |
| Dial-Up Internet | 489 | 0.1% |
| Broadband Home | 275,799 | 80.7% |
| Cellular Data Only | 32,703 | 9.6% |
| Satellite Internet | 16,396 | 4.8% |
| No Internet | 24,363 | 7.1% |
| Total | 341,783 | 100.0% |
Pierce County Summary
Pierce County, Washington is located in the Puget Sound region of the Pacific Northwest. It is the second most populous county in the state, with a population of 876,764 as of 2019. The county seat is Tacoma, the third largest city in the state. Pierce County is bordered by King County to the north, Thurston County to the west, Kitsap County to the west, and Lewis County to the south.
History
Pierce County was created in 1852, when the Washington Territory was divided into four counties. It was named after U.S. President Franklin Pierce. The county was originally much larger, encompassing most of what is now King, Kitsap, and Thurston counties. In 1854, the county was reduced in size when King County was created.
The area was originally inhabited by Native American tribes, including the Puyallup, Nisqually, and Squaxin Island tribes. The first non-native settlers arrived in the 1850s, and the area quickly became a popular destination for homesteaders. The county was officially organized in 1854, and the first county seat was located in Steilacoom. In 1883, the county seat was moved to Tacoma.
Geography
Pierce County covers an area of 1,806 square miles, making it the second largest county in the state. The county is located in the Puget Sound region of the Pacific Northwest, and is bordered by King County to the north, Thurston County to the west, Kitsap County to the west, and Lewis County to the south. The county is home to several mountain ranges, including the Cascade Range, Olympic Mountains, and Mount Rainier. The county also contains several rivers, including the Puyallup, Nisqually, and White rivers.
Economy
Pierce County has a diverse economy, with a mix of industries including manufacturing, retail, healthcare, and government. The county is home to several major employers, including Joint Base Lewis-McChord, MultiCare Health System, and the State of Washington. The county is also home to several major ports, including the Port of Tacoma and the Port of Seattle.
Demographics
As of 2019, Pierce County had a population of 876,764. The population is racially and ethnically diverse, with the largest racial/ethnic groups being White (63.2%), Hispanic or Latino (14.2%), Asian (10.2%), and Black or African American (7.2%). The median household income is $68,845, and the median home value is $346,400. The county has a poverty rate of 11.2%.
Conclusion
Pierce County, Washington is a vibrant and diverse county located in the Puget Sound region of the Pacific Northwest. It has a rich history, and is home to several major employers and ports. The county is racially and ethnically diverse, with a median household income of $68,845 and a median home value of $346,400. Pierce County is an important part of the state of Washington, and is an attractive destination for businesses and residents alike.
Common Questions
What is the Total Population of Pierce County?
Total Population of Pierce County is 918,993.
What is the Total Male Population of Pierce County?
Total Male Population of Pierce County is 462,489.
What is the Total Female Population of Pierce County?
Total Female Population of Pierce County is 456,504.
What is the Ratio of Males per 100 Females in Pierce County?
There are 101.31 Males per 100 Females in Pierce County.
What is the Ratio of Females per 100 Males in Pierce County?
There are 98.71 Females per 100 Males in Pierce County.
What is the Median Population Age in Pierce County?
Median Population Age in Pierce County is 36.5 Years.
What is the Average Family Size in Pierce County
Average Family Size in Pierce County is 3.1 People.
What is the Average Household Size in Pierce County
Average Household Size in Pierce County is 2.6 People.
What is Per Capita Income in Pierce County?
Per Capita income in Pierce County is $43,575.
What is the Median Family Income in Pierce County?
Median Family Income in Pierce County is $104,927.
What is the Median Household income in Pierce County?
Median Household Income in Pierce County is $91,486.
What is Income or Wage Gap in Pierce County?
Income or Wage Gap in Pierce County is 27.5%.
Women in Pierce County earn 72.5 cents for every dollar earned by a man.
What is Family Income Deficit in Pierce County?
Family Income Deficit in Pierce County is $12,271.
Families that are below poverty line in Pierce County earn $12,271 less on average than the poverty threshold level.
What is Inequality or Gini Index in Pierce County?
Inequality or Gini Index in Pierce County is 0.42.
How Large is the Labor Force in Pierce County?
There are 483,112 People in the Labor Forcein in Pierce County.
What is the Percentage of People in the Labor Force in Pierce County?
66.3% of People are in the Labor Force in Pierce County.
What is the Unemployment Rate in Pierce County?
Unemployment Rate in Pierce County is 5.0%.