Pacific County, WA
Pacific County Map
Pacific County Overview
23,396
TOTAL POPULATION
11,714
MALE POPULATION
11,682
FEMALE POPULATION
100.27
MALES / 100 FEMALES
99.73
FEMALES / 100 MALES
54.7
MEDIAN AGE
2.6
AVG FAMILY SIZE
2.2
AVG HOUSEHOLD SIZE
$36,899
PER CAPITA INCOME
$77,574
AVG FAMILY INCOME
$58,889
AVG HOUSEHOLD INCOME
24.4%
WAGE / INCOME GAP [ % ]
75.6¢/ $1
WAGE / INCOME GAP [ $ ]
$10,262
FAMILY INCOME DEFICIT
0.46
INEQUALITY / GINI INDEX
9,285
LABOR FORCE [ PEOPLE ]
45.8%
PERCENT IN LABOR FORCE
4.3%
UNEMPLOYMENT RATE
Pacific County Area Codes
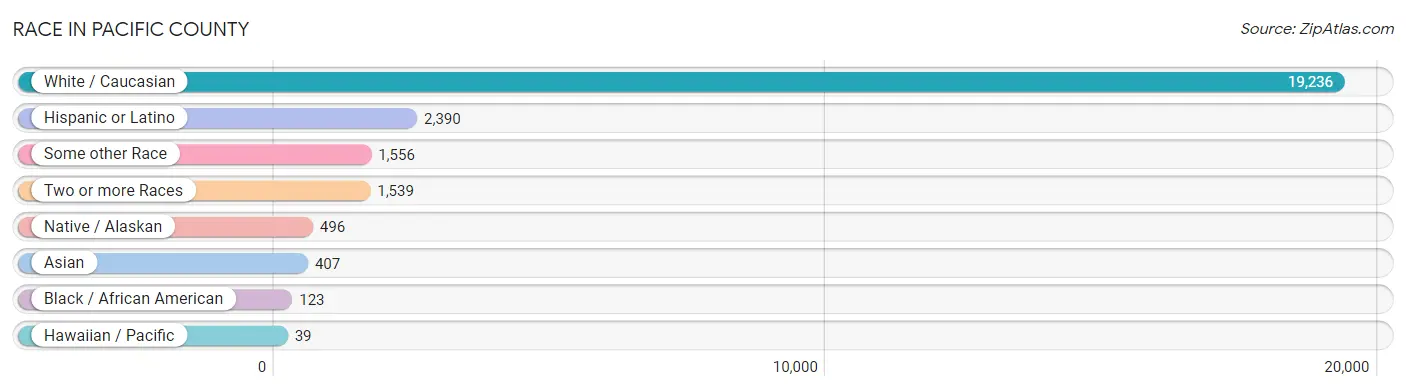
Race in Pacific County
The most populous races in Pacific County are White / Caucasian (19,236 | 82.2%), Hispanic or Latino (2,390 | 10.2%), and Some other Race (1,556 | 6.7%).
| Race | # Population | % Population |
| Asian | 407 | 1.7% |
| Black / African American | 123 | 0.5% |
| Hawaiian / Pacific | 39 | 0.2% |
| Hispanic or Latino | 2,390 | 10.2% |
| Native / Alaskan | 496 | 2.1% |
| White / Caucasian | 19,236 | 82.2% |
| Two or more Races | 1,539 | 6.6% |
| Some other Race | 1,556 | 6.7% |
| Total | 23,396 | 100.0% |
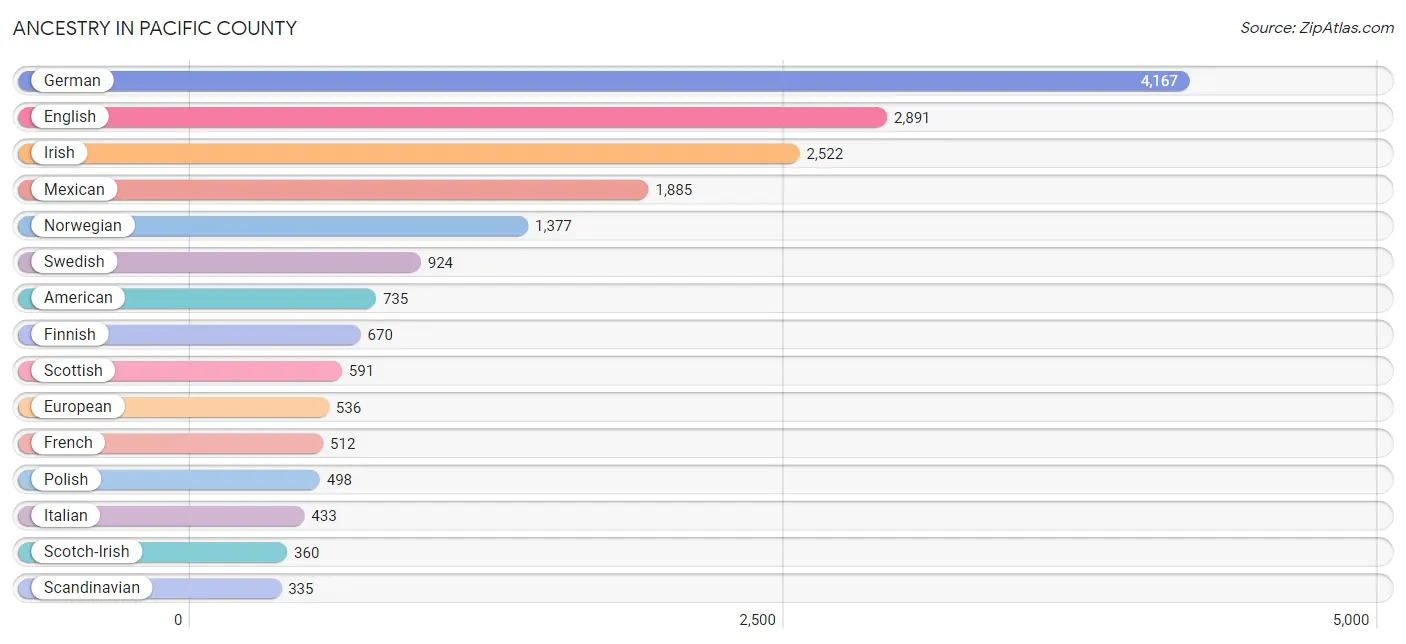
Ancestry in Pacific County
The most populous ancestries reported in Pacific County are German (4,167 | 17.8%), English (2,891 | 12.4%), Irish (2,522 | 10.8%), Mexican (1,885 | 8.1%), and Norwegian (1,377 | 5.9%), together accounting for 54.9% of all Pacific County residents.
| Ancestry | # Population | % Population |
| Alaska Native | 23 | 0.1% |
| Albanian | 12 | 0.1% |
| Aleut | 3 | 0.0% |
| American | 735 | 3.1% |
| Arab | 4 | 0.0% |
| Armenian | 4 | 0.0% |
| Austrian | 89 | 0.4% |
| Belgian | 28 | 0.1% |
| Bhutanese | 128 | 0.5% |
| Blackfeet | 9 | 0.0% |
| British | 157 | 0.7% |
| Burmese | 6 | 0.0% |
| Central American | 52 | 0.2% |
| Cherokee | 103 | 0.4% |
| Chilean | 22 | 0.1% |
| Chippewa | 67 | 0.3% |
| Choctaw | 59 | 0.3% |
| Colville | 7 | 0.0% |
| Cree | 5 | 0.0% |
| Croatian | 39 | 0.2% |
| Cuban | 46 | 0.2% |
| Czech | 51 | 0.2% |
| Czechoslovakian | 17 | 0.1% |
| Danish | 147 | 0.6% |
| Dutch | 289 | 1.2% |
| Dutch West Indian | 1 | 0.0% |
| Eastern European | 65 | 0.3% |
| Ecuadorian | 27 | 0.1% |
| English | 2,891 | 12.4% |
| Estonian | 6 | 0.0% |
| European | 536 | 2.3% |
| Finnish | 670 | 2.9% |
| French | 512 | 2.2% |
| French American Indian | 22 | 0.1% |
| French Canadian | 187 | 0.8% |
| German | 4,167 | 17.8% |
| Greek | 139 | 0.6% |
| Guatemalan | 39 | 0.2% |
| Hungarian | 71 | 0.3% |
| Indian (Asian) | 107 | 0.5% |
| Inupiat | 5 | 0.0% |
| Irish | 2,522 | 10.8% |
| Iroquois | 11 | 0.1% |
| Italian | 433 | 1.8% |
| Japanese | 7 | 0.0% |
| Korean | 93 | 0.4% |
| Lebanese | 4 | 0.0% |
| Lithuanian | 131 | 0.6% |
| Malaysian | 205 | 0.9% |
| Mexican | 1,885 | 8.1% |
| Native Hawaiian | 45 | 0.2% |
| Northern European | 206 | 0.9% |
| Norwegian | 1,377 | 5.9% |
| Pennsylvania German | 5 | 0.0% |
| Polish | 498 | 2.1% |
| Portuguese | 196 | 0.8% |
| Potawatomi | 52 | 0.2% |
| Puerto Rican | 29 | 0.1% |
| Puget Sound Salish | 41 | 0.2% |
| Romanian | 25 | 0.1% |
| Russian | 326 | 1.4% |
| Salvadoran | 13 | 0.1% |
| Samoan | 7 | 0.0% |
| Scandinavian | 335 | 1.4% |
| Scotch-Irish | 360 | 1.5% |
| Scottish | 591 | 2.5% |
| Sioux | 3 | 0.0% |
| Slovak | 4 | 0.0% |
| Slovene | 11 | 0.1% |
| South American | 49 | 0.2% |
| Spaniard | 135 | 0.6% |
| Spanish | 15 | 0.1% |
| Sri Lankan | 26 | 0.1% |
| Swedish | 924 | 4.0% |
| Swiss | 265 | 1.1% |
| Thai | 28 | 0.1% |
| Tlingit-Haida | 17 | 0.1% |
| Tongan | 28 | 0.1% |
| Tsimshian | 4 | 0.0% |
| Ukrainian | 71 | 0.3% |
| Welsh | 289 | 1.2% |
| West Indian | 17 | 0.1% | View All 82 Rows |
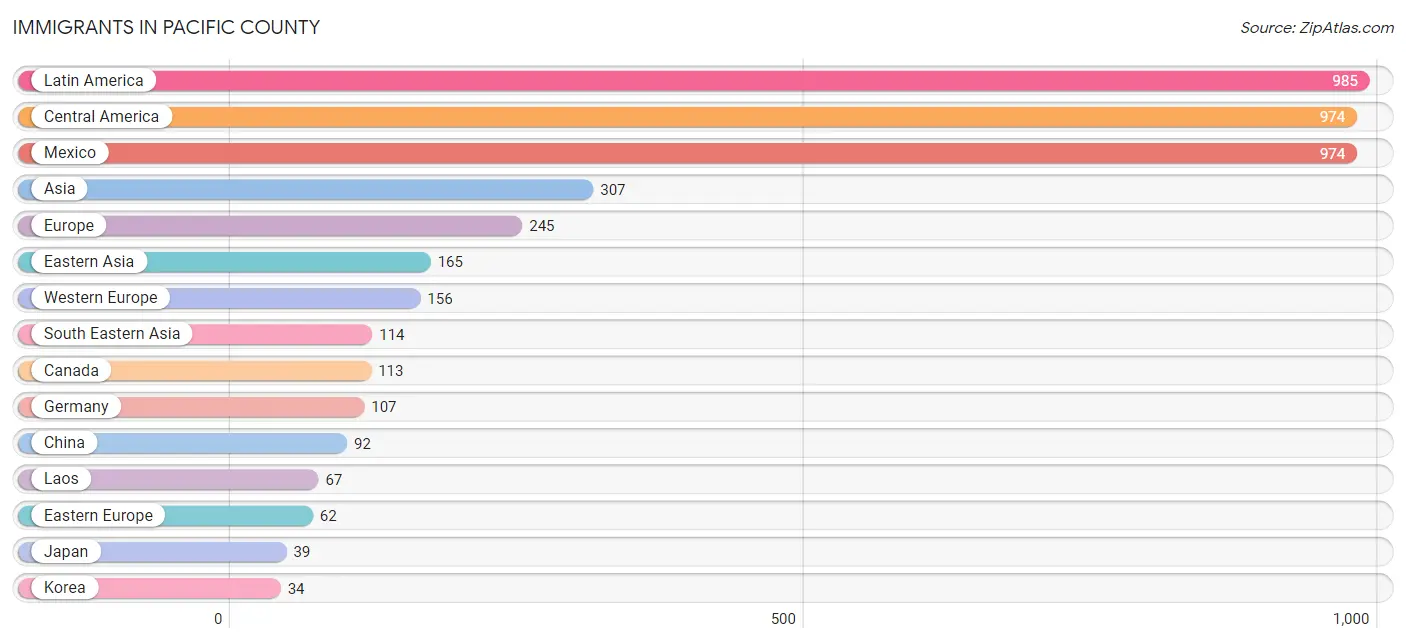
Immigrants in Pacific County
The most numerous immigrant groups reported in Pacific County came from Latin America (985 | 4.2%), Central America (974 | 4.2%), Mexico (974 | 4.2%), Asia (307 | 1.3%), and Europe (245 | 1.1%), together accounting for 14.9% of all Pacific County residents.
| Immigration Origin | # Population | % Population |
| Asia | 307 | 1.3% |
| Australia | 14 | 0.1% |
| Belgium | 22 | 0.1% |
| Cambodia | 7 | 0.0% |
| Canada | 113 | 0.5% |
| Caribbean | 11 | 0.1% |
| Central America | 974 | 4.2% |
| China | 92 | 0.4% |
| Cuba | 11 | 0.1% |
| Czechoslovakia | 10 | 0.0% |
| Eastern Asia | 165 | 0.7% |
| Eastern Europe | 62 | 0.3% |
| England | 24 | 0.1% |
| Europe | 245 | 1.1% |
| Germany | 107 | 0.5% |
| India | 28 | 0.1% |
| Japan | 39 | 0.2% |
| Korea | 34 | 0.2% |
| Laos | 67 | 0.3% |
| Latin America | 985 | 4.2% |
| Mexico | 974 | 4.2% |
| Moldova | 15 | 0.1% |
| Netherlands | 27 | 0.1% |
| Northern Europe | 27 | 0.1% |
| Oceania | 23 | 0.1% |
| Philippines | 23 | 0.1% |
| Poland | 11 | 0.1% |
| Russia | 14 | 0.1% |
| South Central Asia | 28 | 0.1% |
| South Eastern Asia | 114 | 0.5% |
| Taiwan | 17 | 0.1% |
| Vietnam | 17 | 0.1% |
| Western Europe | 156 | 0.7% | View All 33 Rows |
Sex and Age in Pacific County
Sex and Age in Pacific County
The most populous age groups in Pacific County are 65 to 69 Years (1,290 | 11.0%) for men and 65 to 69 Years (1,418 | 12.1%) for women.
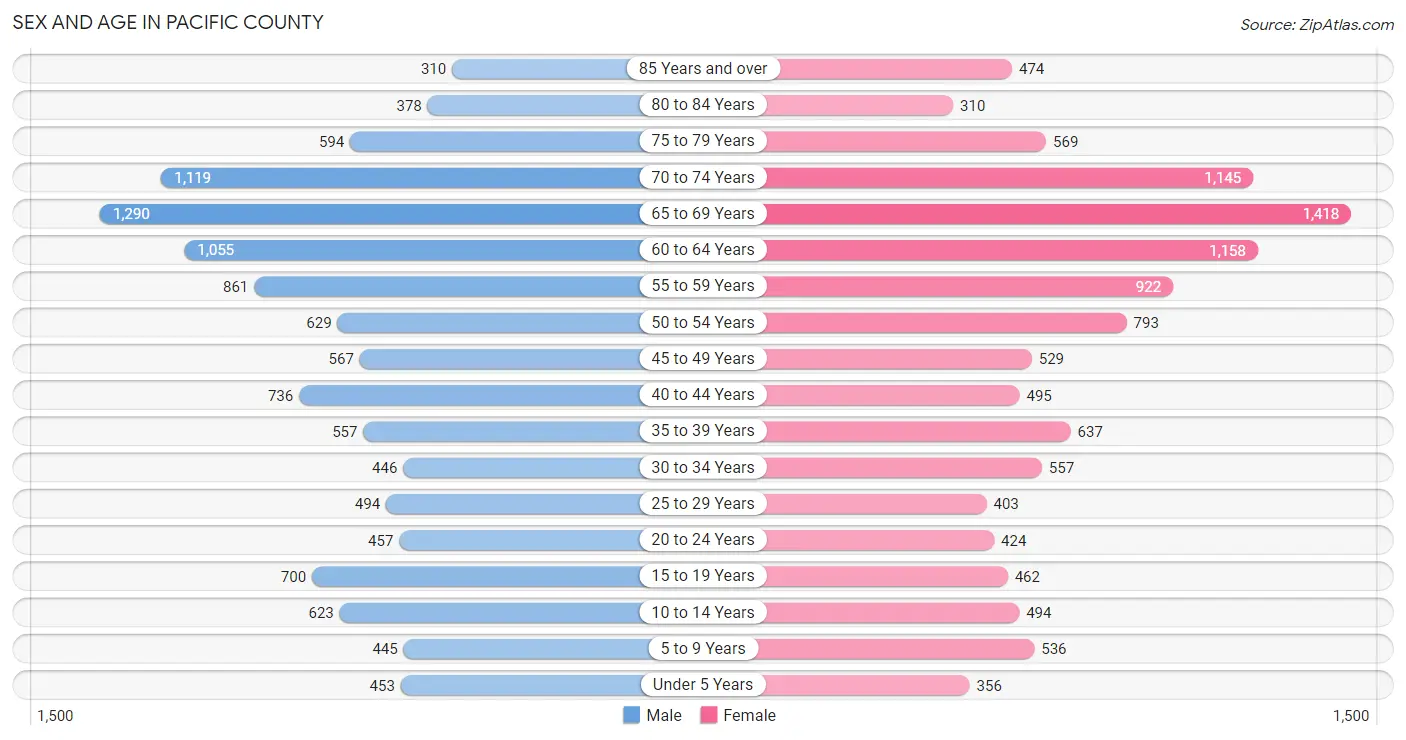
| Age Bracket | Male | Female |
| Under 5 Years | 453 (3.9%) | 356 (3.0%) |
| 5 to 9 Years | 445 (3.8%) | 536 (4.6%) |
| 10 to 14 Years | 623 (5.3%) | 494 (4.2%) |
| 15 to 19 Years | 700 (6.0%) | 462 (4.0%) |
| 20 to 24 Years | 457 (3.9%) | 424 (3.6%) |
| 25 to 29 Years | 494 (4.2%) | 403 (3.5%) |
| 30 to 34 Years | 446 (3.8%) | 557 (4.8%) |
| 35 to 39 Years | 557 (4.8%) | 637 (5.4%) |
| 40 to 44 Years | 736 (6.3%) | 495 (4.2%) |
| 45 to 49 Years | 567 (4.8%) | 529 (4.5%) |
| 50 to 54 Years | 629 (5.4%) | 793 (6.8%) |
| 55 to 59 Years | 861 (7.3%) | 922 (7.9%) |
| 60 to 64 Years | 1,055 (9.0%) | 1,158 (9.9%) |
| 65 to 69 Years | 1,290 (11.0%) | 1,418 (12.1%) |
| 70 to 74 Years | 1,119 (9.6%) | 1,145 (9.8%) |
| 75 to 79 Years | 594 (5.1%) | 569 (4.9%) |
| 80 to 84 Years | 378 (3.2%) | 310 (2.6%) |
| 85 Years and over | 310 (2.6%) | 474 (4.1%) |
| Total | 11,714 (100.0%) | 11,682 (100.0%) |
Families and Households in Pacific County
Median Family Size in Pacific County
The median family size in Pacific County is 2.63 persons per family, with single female/mother families (944 | 14.6%) accounting for the largest median family size of 2.8 persons per family. On the other hand, single male/father families (544 | 8.4%) represent the smallest median family size with 2.45 persons per family.
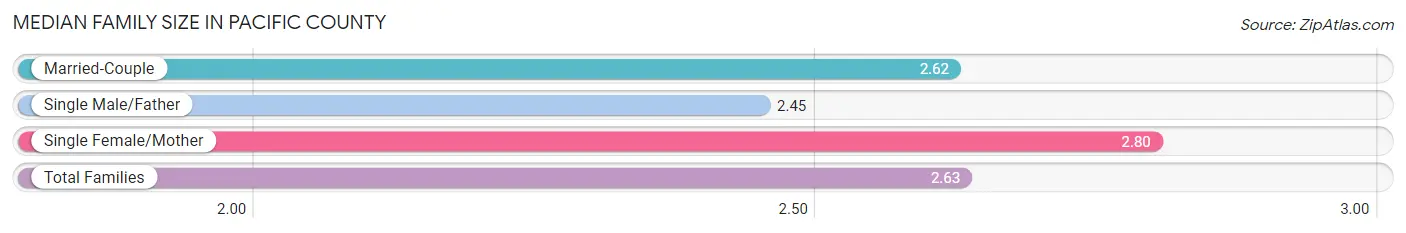
| Family Type | # Families | Family Size |
| Married-Couple | 4,990 (77.0%) | 2.62 |
| Single Male/Father | 544 (8.4%) | 2.45 |
| Single Female/Mother | 944 (14.6%) | 2.80 |
| Total Families | 6,478 (100.0%) | 2.63 |
Median Household Size in Pacific County
The median household size in Pacific County is 2.16 persons per household, with single female/mother households (944 | 8.8%) accounting for the largest median household size of 3.47 persons per household. non-family households (4,211 | 39.4%) represent the smallest median household size with 1.19 persons per household.
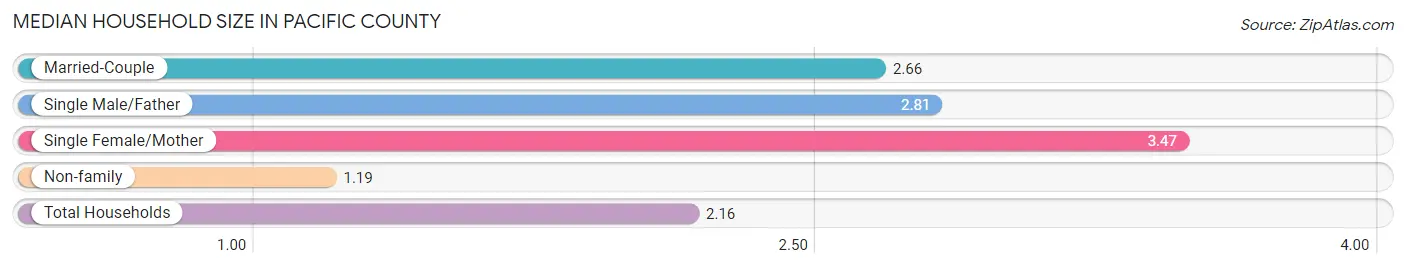
| Household Type | # Households | Household Size |
| Married-Couple | 4,990 (46.7%) | 2.66 |
| Single Male/Father | 544 (5.1%) | 2.81 |
| Single Female/Mother | 944 (8.8%) | 3.47 |
| Non-family | 4,211 (39.4%) | 1.19 |
| Total Households | 10,689 (100.0%) | 2.16 |
Household Size by Marriage Status in Pacific County
Out of a total of 10,689 households in Pacific County, 6,478 (60.6%) are family households, while 4,211 (39.4%) are nonfamily households. The most numerous type of family households are 2-person households, comprising 3,907, and the most common type of nonfamily households are 1-person households, comprising 3,536.
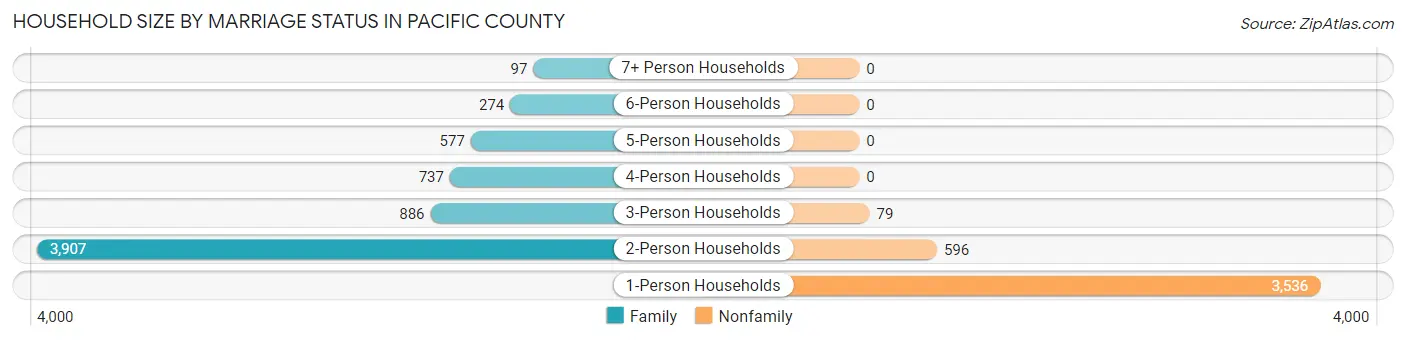
| Household Size | Family Households | Nonfamily Households |
| 1-Person Households | - | 3,536 (33.1%) |
| 2-Person Households | 3,907 (36.5%) | 596 (5.6%) |
| 3-Person Households | 886 (8.3%) | 79 (0.7%) |
| 4-Person Households | 737 (6.9%) | 0 (0.0%) |
| 5-Person Households | 577 (5.4%) | 0 (0.0%) |
| 6-Person Households | 274 (2.6%) | 0 (0.0%) |
| 7+ Person Households | 97 (0.9%) | 0 (0.0%) |
| Total | 6,478 (60.6%) | 4,211 (39.4%) |
Female Fertility in Pacific County
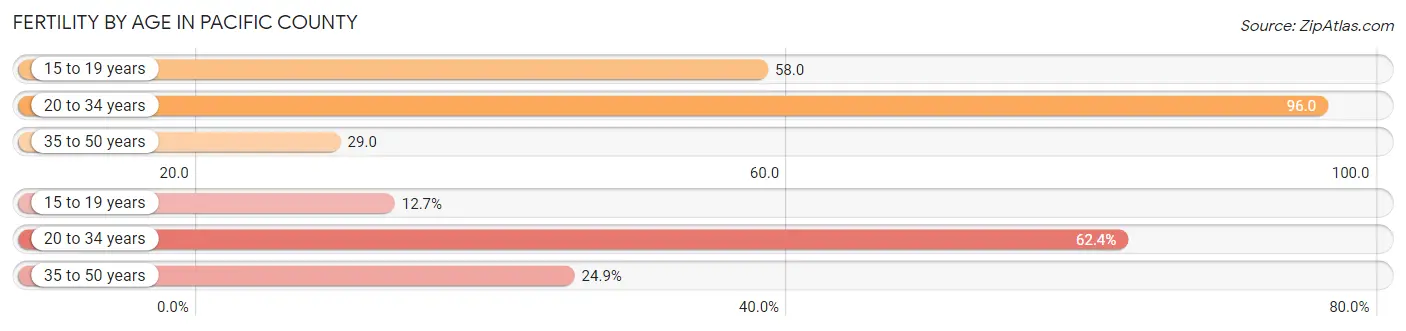
Fertility by Age in Pacific County
Average fertility rate in Pacific County is 58.0 births per 1,000 women. Women in the age bracket of 20 to 34 years have the highest fertility rate with 96.0 births per 1,000 women. Women in the age bracket of 20 to 34 years acount for 62.4% of all women with births.
| Age Bracket | Women with Births | Births / 1,000 Women |
| 15 to 19 years | 27 (12.7%) | 58.0 |
| 20 to 34 years | 133 (62.4%) | 96.0 |
| 35 to 50 years | 53 (24.9%) | 29.0 |
| Total | 213 (100.0%) | 58.0 |
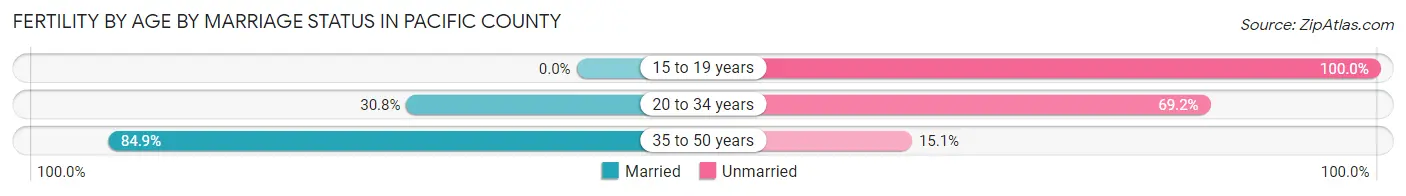
Fertility by Age by Marriage Status in Pacific County
40.4% of women with births (213) in Pacific County are married. The highest percentage of unmarried women with births falls into 15 to 19 years age bracket with 100.0% of them unmarried at the time of birth, while the lowest percentage of unmarried women with births belong to 35 to 50 years age bracket with 15.1% of them unmarried.
| Age Bracket | Married | Unmarried |
| 15 to 19 years | 0 (0.0%) | 27 (100.0%) |
| 20 to 34 years | 41 (30.8%) | 92 (69.2%) |
| 35 to 50 years | 45 (84.9%) | 8 (15.1%) |
| Total | 86 (40.4%) | 127 (59.6%) |
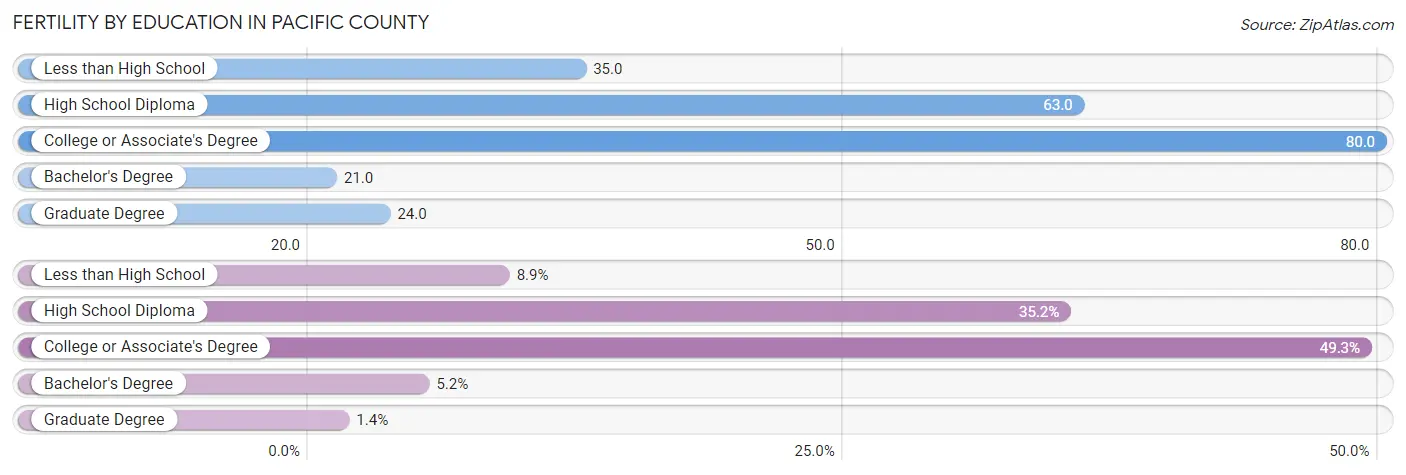
Fertility by Education in Pacific County
Average fertility rate in Pacific County is 58.0 births per 1,000 women. Women with the education attainment of college or associate's degree have the highest fertility rate of 80.0 births per 1,000 women, while women with the education attainment of bachelor's degree have the lowest fertility at 21.0 births per 1,000 women. Women with the education attainment of college or associate's degree represent 49.3% of all women with births.
| Educational Attainment | Women with Births | Births / 1,000 Women |
| Less than High School | 19 (8.9%) | 35.0 |
| High School Diploma | 75 (35.2%) | 63.0 |
| College or Associate's Degree | 105 (49.3%) | 80.0 |
| Bachelor's Degree | 11 (5.2%) | 21.0 |
| Graduate Degree | 3 (1.4%) | 24.0 |
| Total | 213 (100.0%) | 58.0 |
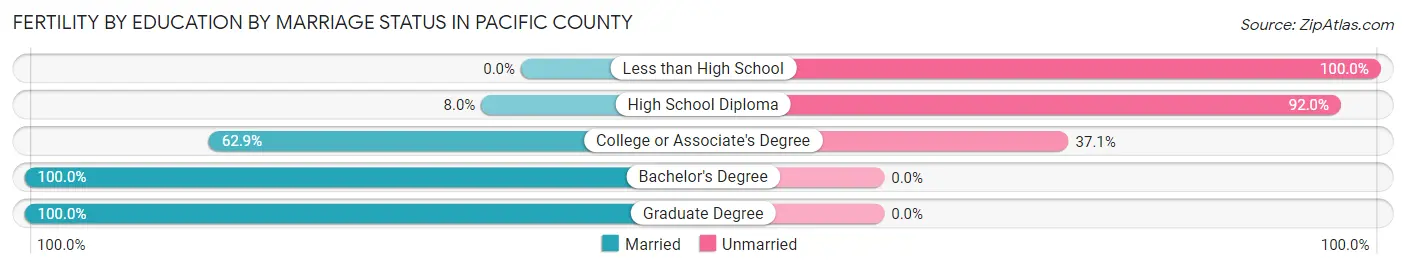
Fertility by Education by Marriage Status in Pacific County
59.6% of women with births in Pacific County are unmarried. Women with the educational attainment of bachelor's degree are most likely to be married with 100.0% of them married at childbirth, while women with the educational attainment of less than high school are least likely to be married with 100.0% of them unmarried at childbirth.
| Educational Attainment | Married | Unmarried |
| Less than High School | 0 (0.0%) | 19 (100.0%) |
| High School Diploma | 6 (8.0%) | 69 (92.0%) |
| College or Associate's Degree | 66 (62.9%) | 39 (37.1%) |
| Bachelor's Degree | 11 (100.0%) | 0 (0.0%) |
| Graduate Degree | 3 (100.0%) | 0 (0.0%) |
| Total | 86 (40.4%) | 127 (59.6%) |
Income in Pacific County
Income Overview in Pacific County
Per Capita Income in Pacific County is $36,899, while median incomes of families and households are $77,574 and $58,889 respectively.
| Characteristic | Number | Measure |
| Per Capita Income | 23,396 | $36,899 |
| Median Family Income | 6,478 | $77,574 |
| Mean Family Income | 6,478 | $90,954 |
| Median Household Income | 10,689 | $58,889 |
| Mean Household Income | 10,689 | $78,637 |
| Income Deficit | 6,478 | $10,262 |
| Wage / Income Gap (%) | 23,396 | 24.40% |
| Wage / Income Gap ($) | 23,396 | 75.60¢ per $1 |
| Gini / Inequality Index | 23,396 | 0.46 |
Earnings by Sex in Pacific County
Average Earnings in Pacific County are $36,053, $43,466 for men and $32,861 for women, a difference of 24.4%.
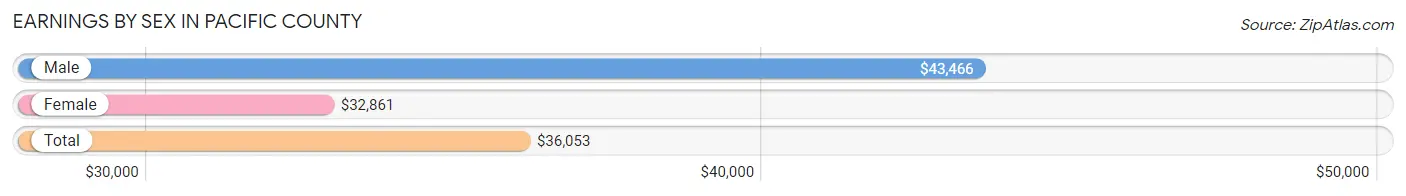
| Sex | Number | Average Earnings |
| Male | 5,471 (53.8%) | $43,466 |
| Female | 4,695 (46.2%) | $32,861 |
| Total | 10,166 (100.0%) | $36,053 |
Earnings by Sex by Income Bracket in Pacific County
The most common earnings brackets in Pacific County are $100,000+ for men (690 | 12.6%) and $75,000 to $99,999 for women (495 | 10.5%).
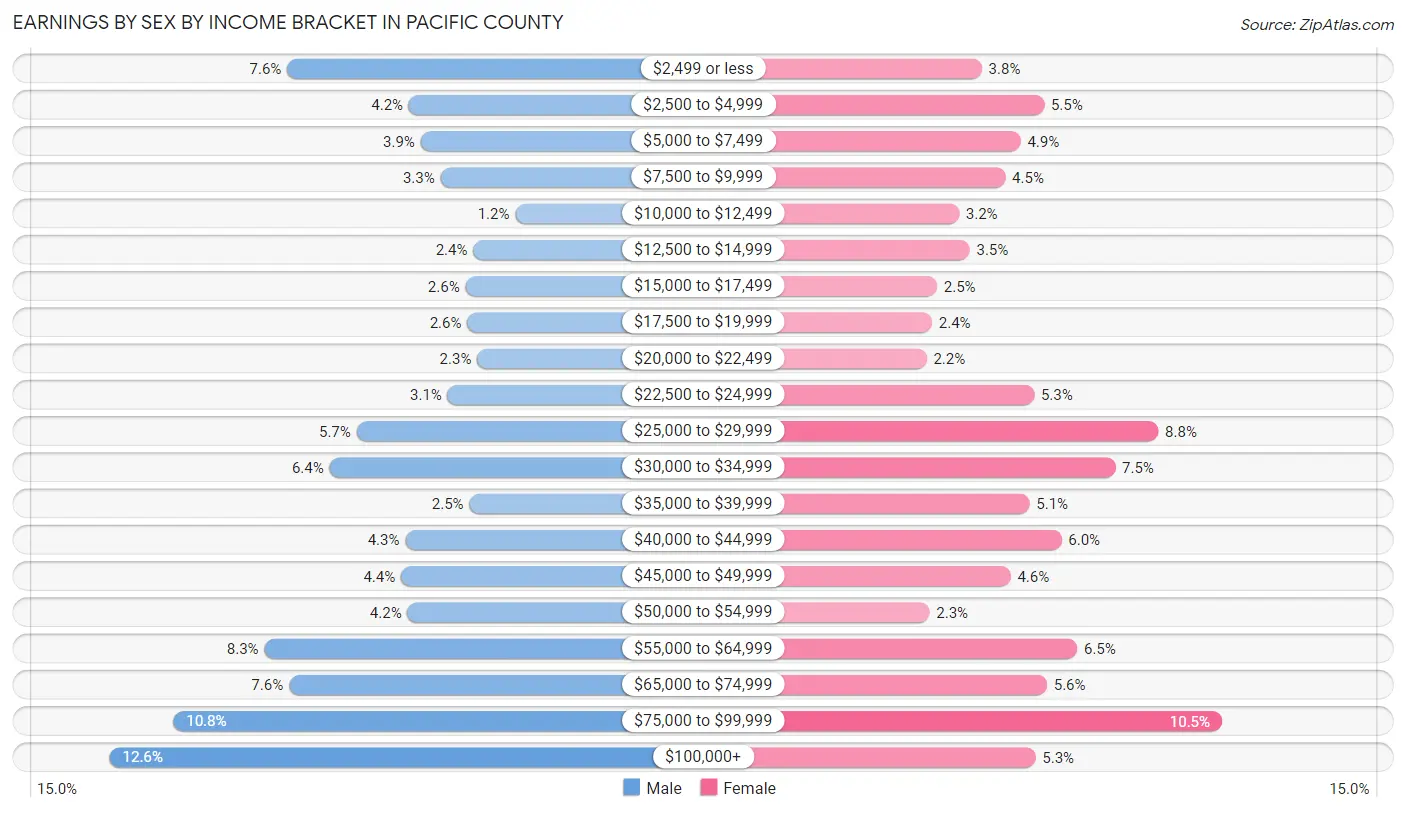
| Income | Male | Female |
| $2,499 or less | 417 (7.6%) | 178 (3.8%) |
| $2,500 to $4,999 | 230 (4.2%) | 260 (5.5%) |
| $5,000 to $7,499 | 212 (3.9%) | 229 (4.9%) |
| $7,500 to $9,999 | 181 (3.3%) | 209 (4.4%) |
| $10,000 to $12,499 | 66 (1.2%) | 148 (3.2%) |
| $12,500 to $14,999 | 131 (2.4%) | 162 (3.5%) |
| $15,000 to $17,499 | 143 (2.6%) | 119 (2.5%) |
| $17,500 to $19,999 | 140 (2.6%) | 112 (2.4%) |
| $20,000 to $22,499 | 125 (2.3%) | 105 (2.2%) |
| $22,500 to $24,999 | 170 (3.1%) | 247 (5.3%) |
| $25,000 to $29,999 | 310 (5.7%) | 411 (8.7%) |
| $30,000 to $34,999 | 352 (6.4%) | 354 (7.5%) |
| $35,000 to $39,999 | 137 (2.5%) | 241 (5.1%) |
| $40,000 to $44,999 | 235 (4.3%) | 283 (6.0%) |
| $45,000 to $49,999 | 242 (4.4%) | 216 (4.6%) |
| $50,000 to $54,999 | 232 (4.2%) | 109 (2.3%) |
| $55,000 to $64,999 | 452 (8.3%) | 304 (6.5%) |
| $65,000 to $74,999 | 414 (7.6%) | 264 (5.6%) |
| $75,000 to $99,999 | 592 (10.8%) | 495 (10.5%) |
| $100,000+ | 690 (12.6%) | 249 (5.3%) |
| Total | 5,471 (100.0%) | 4,695 (100.0%) |
Earnings by Sex by Educational Attainment in Pacific County
Average earnings in Pacific County are $49,954 for men and $34,644 for women, a difference of 30.6%. Men with an educational attainment of graduate degree enjoy the highest average annual earnings of $65,809, while those with less than high school education earn the least with $30,943. Women with an educational attainment of bachelor's degree earn the most with the average annual earnings of $55,332, while those with less than high school education have the smallest earnings of $28,611.
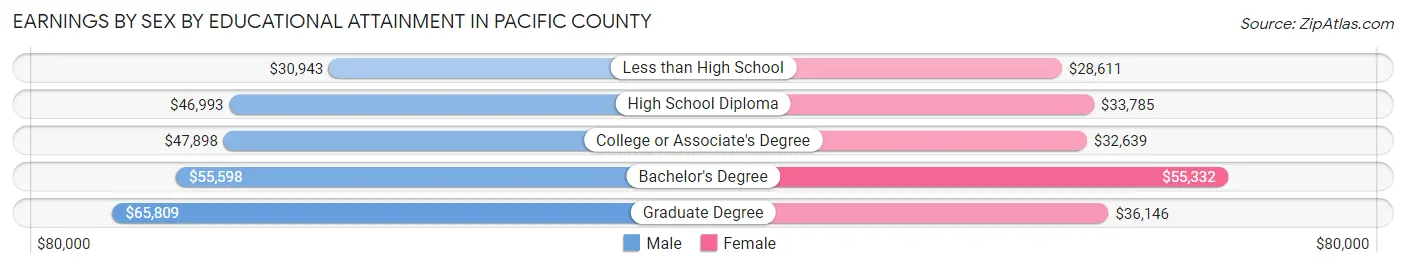
| Educational Attainment | Male Income | Female Income |
| Less than High School | $30,943 | $28,611 |
| High School Diploma | $46,993 | $33,785 |
| College or Associate's Degree | $47,898 | $32,639 |
| Bachelor's Degree | $55,598 | $55,332 |
| Graduate Degree | $65,809 | $36,146 |
| Total | $49,954 | $34,644 |
Family Income in Pacific County
Family Income Brackets in Pacific County
According to the Pacific County family income data, there are 1,503 families falling into the $100,000 to $149,999 income range, which is the most common income bracket and makes up 23.2% of all families. Conversely, the $10,000 to $14,999 income bracket is the least frequent group with only 97 families (1.5%) belonging to this category.
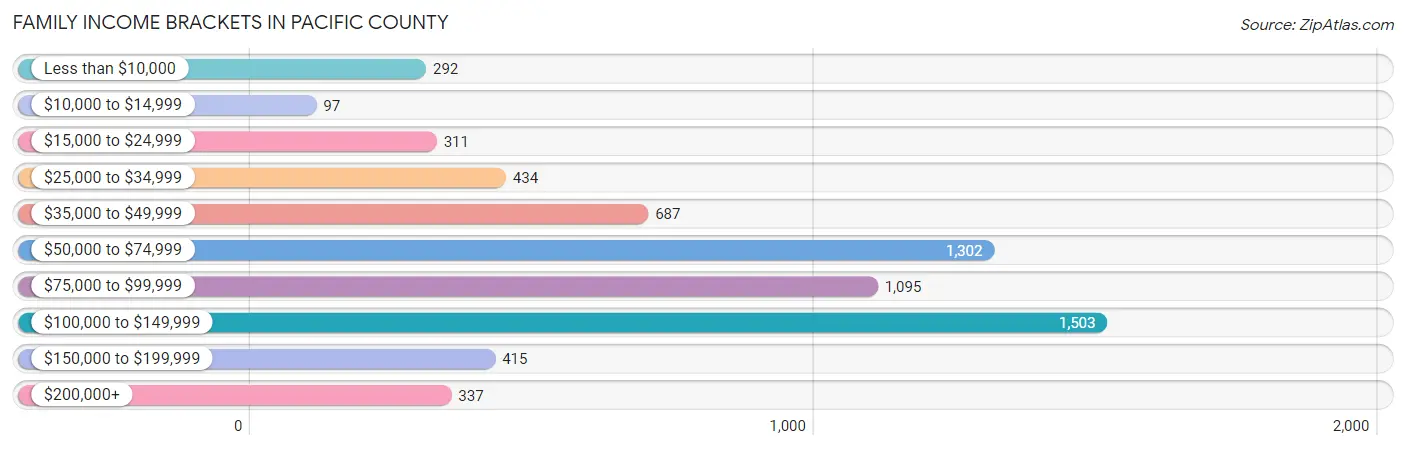
| Income Bracket | # Families | % Families |
| Less than $10,000 | 292 | 4.5% |
| $10,000 to $14,999 | 97 | 1.5% |
| $15,000 to $24,999 | 311 | 4.8% |
| $25,000 to $34,999 | 434 | 6.7% |
| $35,000 to $49,999 | 687 | 10.6% |
| $50,000 to $74,999 | 1,302 | 20.1% |
| $75,000 to $99,999 | 1,095 | 16.9% |
| $100,000 to $149,999 | 1,503 | 23.2% |
| $150,000 to $199,999 | 415 | 6.4% |
| $200,000+ | 337 | 5.2% |
Family Income by Famaliy Size in Pacific County
7+ person families (18 | 0.3%) account for the highest median family income in Pacific County with $125,962 per family, while 2-person families (4,011 | 61.9%) have the highest median income of $35,752 per family member.
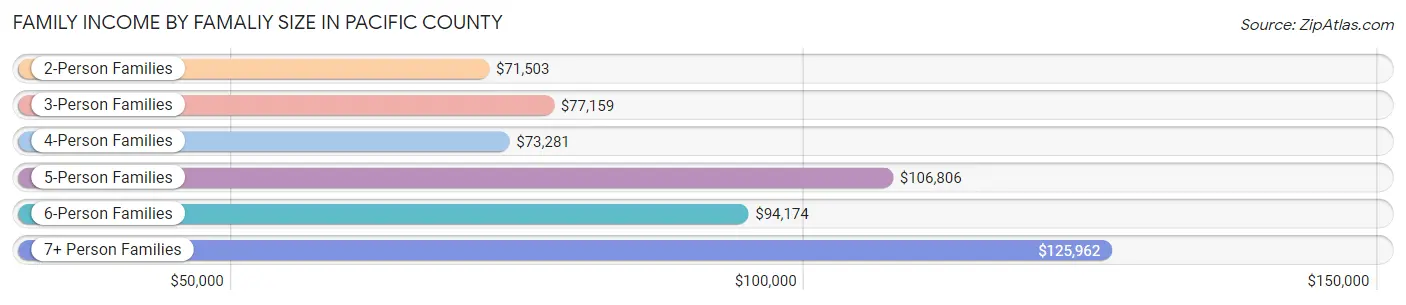
| Income Bracket | # Families | Median Income |
| 2-Person Families | 4,011 (61.9%) | $71,503 |
| 3-Person Families | 1,035 (16.0%) | $77,159 |
| 4-Person Families | 671 (10.4%) | $73,281 |
| 5-Person Families | 556 (8.6%) | $106,806 |
| 6-Person Families | 187 (2.9%) | $94,174 |
| 7+ Person Families | 18 (0.3%) | $125,962 |
| Total | 6,478 (100.0%) | $77,574 |
Family Income by Number of Earners in Pacific County
The median family income in Pacific County is $77,574, with families comprising 3+ earners (584) having the highest median family income of $106,538, while families with no earners (2,035) have the lowest median family income of $54,727, accounting for 9.0% and 31.4% of families, respectively.
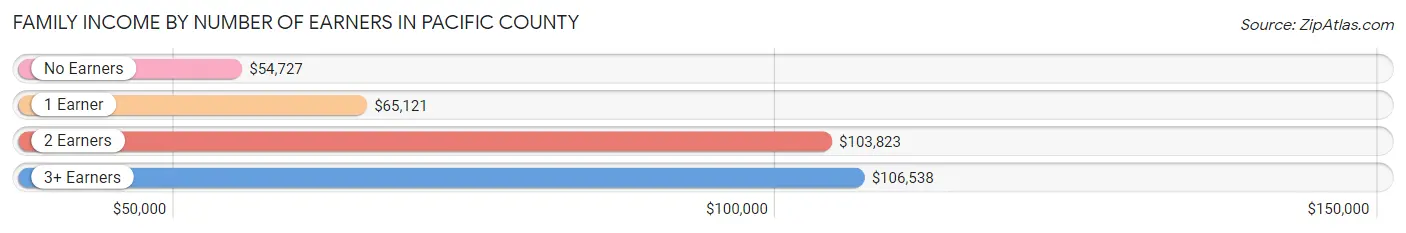
| Number of Earners | # Families | Median Income |
| No Earners | 2,035 (31.4%) | $54,727 |
| 1 Earner | 1,864 (28.8%) | $65,121 |
| 2 Earners | 1,995 (30.8%) | $103,823 |
| 3+ Earners | 584 (9.0%) | $106,538 |
| Total | 6,478 (100.0%) | $77,574 |
Household Income in Pacific County
Household Income Brackets in Pacific County
With 1,881 households falling in the category, the $50,000 to $74,999 income range is the most frequent in Pacific County, accounting for 17.6% of all households. In contrast, only 481 households (4.5%) fall into the $200,000+ income bracket, making it the least populous group.
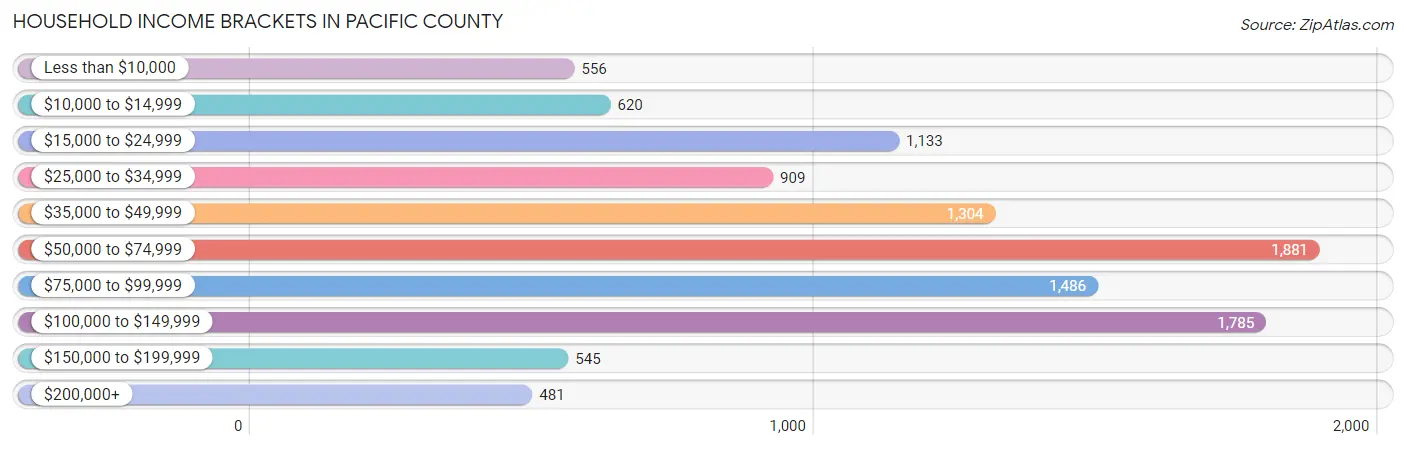
| Income Bracket | # Households | % Households |
| Less than $10,000 | 556 | 5.2% |
| $10,000 to $14,999 | 620 | 5.8% |
| $15,000 to $24,999 | 1,133 | 10.6% |
| $25,000 to $34,999 | 909 | 8.5% |
| $35,000 to $49,999 | 1,304 | 12.2% |
| $50,000 to $74,999 | 1,881 | 17.6% |
| $75,000 to $99,999 | 1,486 | 13.9% |
| $100,000 to $149,999 | 1,785 | 16.7% |
| $150,000 to $199,999 | 545 | 5.1% |
| $200,000+ | 481 | 4.5% |
Household Income by Householder Age in Pacific County
The median household income in Pacific County is $58,889, with the highest median household income of $83,975 found in the 25 to 44 years age bracket for the primary householder. A total of 1,911 households (17.9%) fall into this category. Meanwhile, the 15 to 24 years age bracket for the primary householder has the lowest median household income of $0, with 227 households (2.1%) in this group.
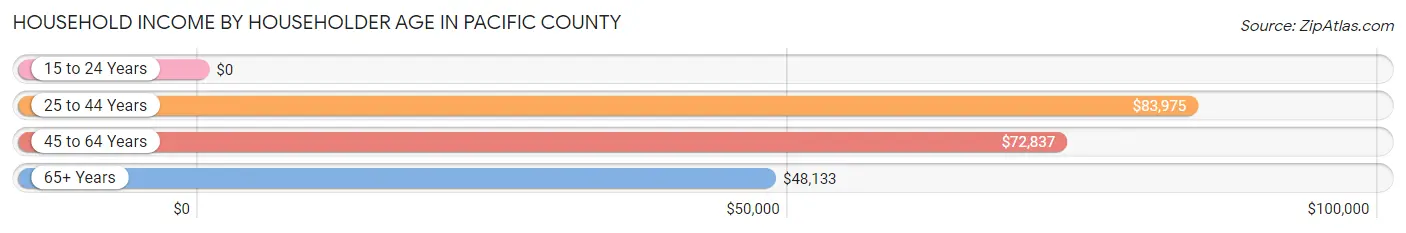
| Income Bracket | # Households | Median Income |
| 15 to 24 Years | 227 (2.1%) | $0 |
| 25 to 44 Years | 1,911 (17.9%) | $83,975 |
| 45 to 64 Years | 3,546 (33.2%) | $72,837 |
| 65+ Years | 5,005 (46.8%) | $48,133 |
| Total | 10,689 (100.0%) | $58,889 |
Poverty in Pacific County
Income Below Poverty by Sex and Age in Pacific County
With 12.8% poverty level for males and 13.5% for females among the residents of Pacific County, 15 year old males and 25 to 34 year old females are the most vulnerable to poverty, with 60 males (48.8%) and 258 females (26.9%) in their respective age groups living below the poverty level.
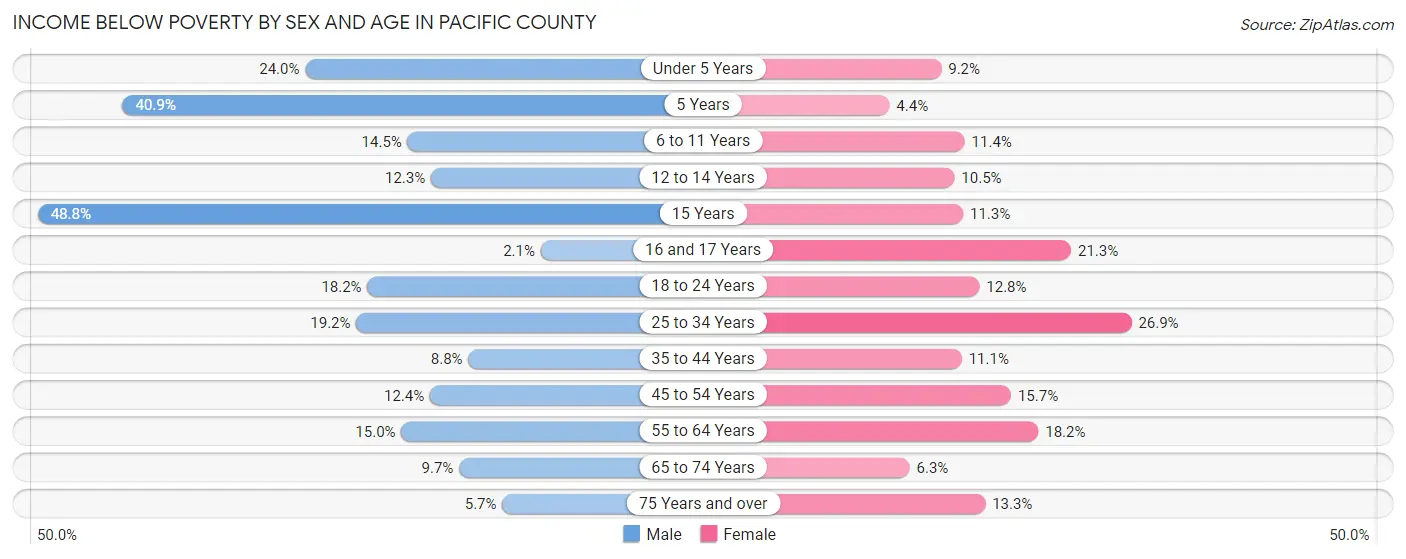
| Age Bracket | Male | Female |
| Under 5 Years | 91 (23.9%) | 31 (9.2%) |
| 5 Years | 18 (40.9%) | 5 (4.4%) |
| 6 to 11 Years | 77 (14.4%) | 71 (11.4%) |
| 12 to 14 Years | 41 (12.3%) | 30 (10.4%) |
| 15 Years | 60 (48.8%) | 9 (11.3%) |
| 16 and 17 Years | 5 (2.1%) | 40 (21.3%) |
| 18 to 24 Years | 130 (18.2%) | 76 (12.8%) |
| 25 to 34 Years | 180 (19.2%) | 258 (26.9%) |
| 35 to 44 Years | 113 (8.8%) | 126 (11.1%) |
| 45 to 54 Years | 148 (12.4%) | 205 (15.7%) |
| 55 to 64 Years | 288 (15.0%) | 378 (18.2%) |
| 65 to 74 Years | 232 (9.7%) | 161 (6.3%) |
| 75 Years and over | 72 (5.7%) | 177 (13.3%) |
| Total | 1,455 (12.8%) | 1,567 (13.5%) |
Income Above Poverty by Sex and Age in Pacific County
According to the poverty statistics in Pacific County, males aged 16 and 17 years and females aged 5 years are the age groups that are most secure financially, with 97.9% of males and 95.6% of females in these age groups living above the poverty line.
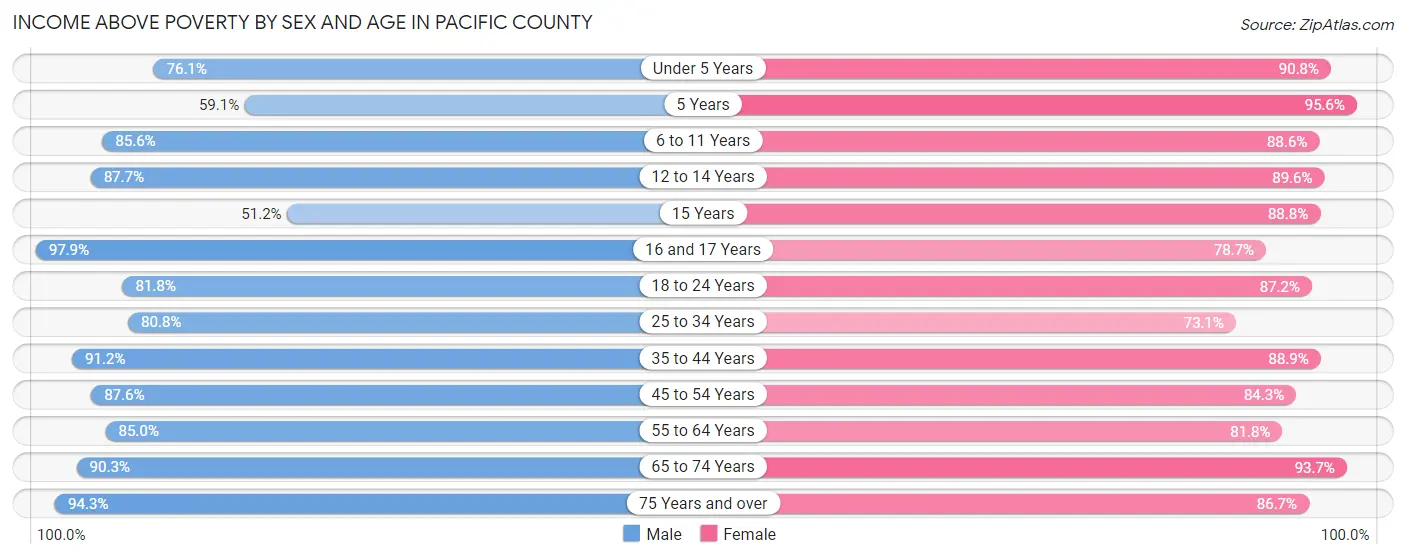
| Age Bracket | Male | Female |
| Under 5 Years | 289 (76.0%) | 305 (90.8%) |
| 5 Years | 26 (59.1%) | 108 (95.6%) |
| 6 to 11 Years | 456 (85.6%) | 552 (88.6%) |
| 12 to 14 Years | 293 (87.7%) | 257 (89.5%) |
| 15 Years | 63 (51.2%) | 71 (88.7%) |
| 16 and 17 Years | 234 (97.9%) | 148 (78.7%) |
| 18 to 24 Years | 585 (81.8%) | 519 (87.2%) |
| 25 to 34 Years | 757 (80.8%) | 702 (73.1%) |
| 35 to 44 Years | 1,170 (91.2%) | 1,006 (88.9%) |
| 45 to 54 Years | 1,048 (87.6%) | 1,101 (84.3%) |
| 55 to 64 Years | 1,628 (85.0%) | 1,694 (81.8%) |
| 65 to 74 Years | 2,168 (90.3%) | 2,399 (93.7%) |
| 75 Years and over | 1,200 (94.3%) | 1,153 (86.7%) |
| Total | 9,917 (87.2%) | 10,015 (86.5%) |
Income Below Poverty Among Married-Couple Families in Pacific County
The poverty statistics for married-couple families in Pacific County show that 4.0% or 200 of the total 4,990 families live below the poverty line. Families with no children have the highest poverty rate of 4.6%, comprising of 173 families. On the other hand, families with 3 or 4 children have the lowest poverty rate of 0.0%, which includes 0 families.
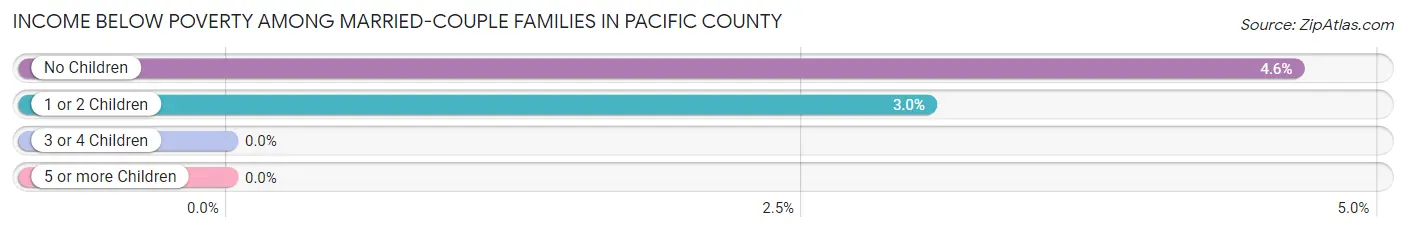
| Children | Above Poverty | Below Poverty |
| No Children | 3,554 (95.4%) | 173 (4.6%) |
| 1 or 2 Children | 861 (97.0%) | 27 (3.0%) |
| 3 or 4 Children | 371 (100.0%) | 0 (0.0%) |
| 5 or more Children | 4 (100.0%) | 0 (0.0%) |
| Total | 4,790 (96.0%) | 200 (4.0%) |
Income Below Poverty Among Single-Parent Households in Pacific County
According to the poverty data in Pacific County, 16.5% or 90 single-father households and 33.2% or 313 single-mother households are living below the poverty line. Among single-father households, those with 3 or 4 children have the highest poverty rate, with 29 households (59.2%) experiencing poverty. Likewise, among single-mother households, those with 3 or 4 children have the highest poverty rate, with 60 households (52.6%) falling below the poverty line.
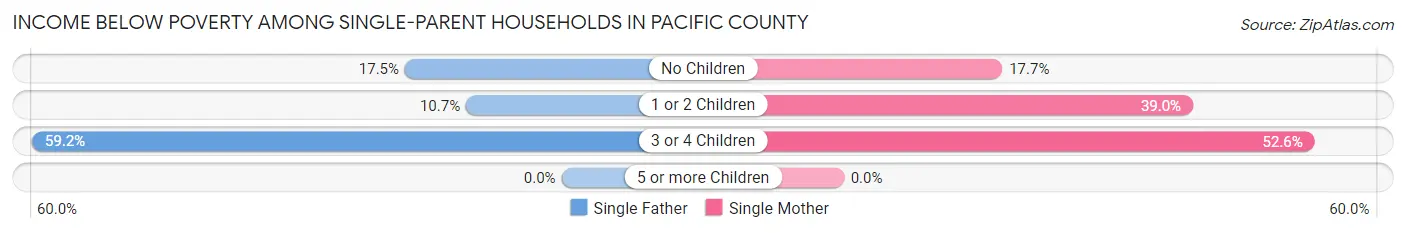
| Children | Single Father | Single Mother |
| No Children | 21 (17.5%) | 59 (17.7%) |
| 1 or 2 Children | 40 (10.7%) | 194 (39.0%) |
| 3 or 4 Children | 29 (59.2%) | 60 (52.6%) |
| 5 or more Children | 0 (0.0%) | 0 (0.0%) |
| Total | 90 (16.5%) | 313 (33.2%) |
Income Below Poverty Among Married-Couple vs Single-Parent Households in Pacific County
The poverty data for Pacific County shows that 200 of the married-couple family households (4.0%) and 403 of the single-parent households (27.1%) are living below the poverty level. Within the married-couple family households, those with no children have the highest poverty rate, with 173 households (4.6%) falling below the poverty line. Among the single-parent households, those with 3 or 4 children have the highest poverty rate, with 89 household (54.6%) living below poverty.
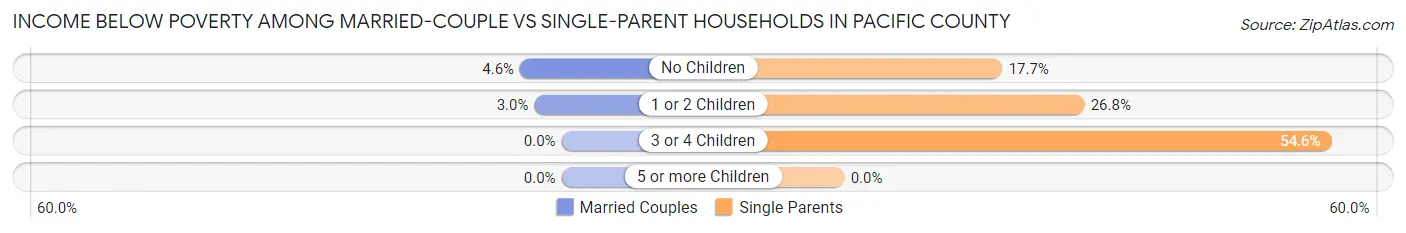
| Children | Married-Couple Families | Single-Parent Households |
| No Children | 173 (4.6%) | 80 (17.7%) |
| 1 or 2 Children | 27 (3.0%) | 234 (26.8%) |
| 3 or 4 Children | 0 (0.0%) | 89 (54.6%) |
| 5 or more Children | 0 (0.0%) | 0 (0.0%) |
| Total | 200 (4.0%) | 403 (27.1%) |
Employment Characteristics in Pacific County
Employment by Class of Employer in Pacific County
Among the 8,482 employed individuals in Pacific County, private company employees (4,740 | 55.9%), local government employees (1,031 | 12.2%), and not-for-profit organizations (705 | 8.3%) make up the most common classes of employment.
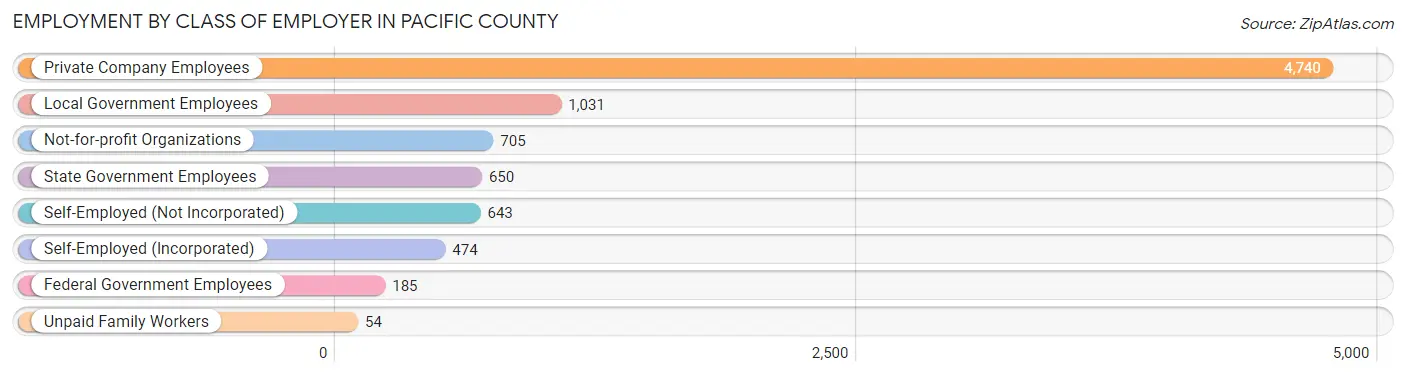
| Employer Class | # Employees | % Employees |
| Private Company Employees | 4,740 | 55.9% |
| Self-Employed (Incorporated) | 474 | 5.6% |
| Self-Employed (Not Incorporated) | 643 | 7.6% |
| Not-for-profit Organizations | 705 | 8.3% |
| Local Government Employees | 1,031 | 12.2% |
| State Government Employees | 650 | 7.7% |
| Federal Government Employees | 185 | 2.2% |
| Unpaid Family Workers | 54 | 0.6% |
| Total | 8,482 | 100.0% |
Employment Status by Age in Pacific County
According to the labor force statistics for Pacific County, out of the total population over 16 years of age (20,274), 45.8% or 9,285 individuals are in the labor force, with 4.3% or 399 of them unemployed. The age group with the highest labor force participation rate is 25 to 29 years, with 92.6% or 831 individuals in the labor force. Within the labor force, the 16 to 19 years age range has the highest percentage of unemployed individuals, with 17.6% or 62 of them being unemployed.
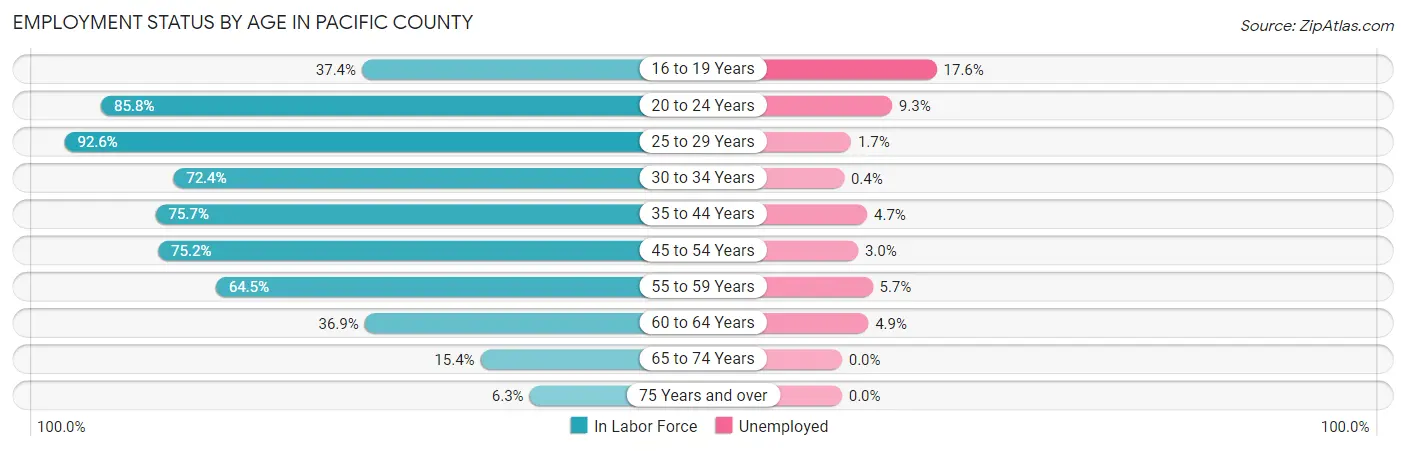
| Age Bracket | In Labor Force | Unemployed |
| 16 to 19 Years | 354 (37.4%) | 62 (17.6%) |
| 20 to 24 Years | 756 (85.8%) | 70 (9.3%) |
| 25 to 29 Years | 831 (92.6%) | 14 (1.7%) |
| 30 to 34 Years | 726 (72.4%) | 3 (0.4%) |
| 35 to 44 Years | 1,836 (75.7%) | 86 (4.7%) |
| 45 to 54 Years | 1,894 (75.2%) | 57 (3.0%) |
| 55 to 59 Years | 1,150 (64.5%) | 66 (5.7%) |
| 60 to 64 Years | 817 (36.9%) | 40 (4.9%) |
| 65 to 74 Years | 766 (15.4%) | 0 (0.0%) |
| 75 Years and over | 166 (6.3%) | 0 (0.0%) |
| Total | 9,285 (45.8%) | 399 (4.3%) |
Employment Status by Educational Attainment in Pacific County
According to labor force statistics for Pacific County, 66.9% of individuals (7,251) out of the total population between 25 and 64 years of age (10,839) are in the labor force, with 3.7% or 268 of them being unemployed. The group with the highest labor force participation rate are those with the educational attainment of bachelor's degree or higher, with 72.6% or 1,533 individuals in the labor force. Within the labor force, individuals with high school diploma education have the highest percentage of unemployment, with 4.9% or 118 of them being unemployed.
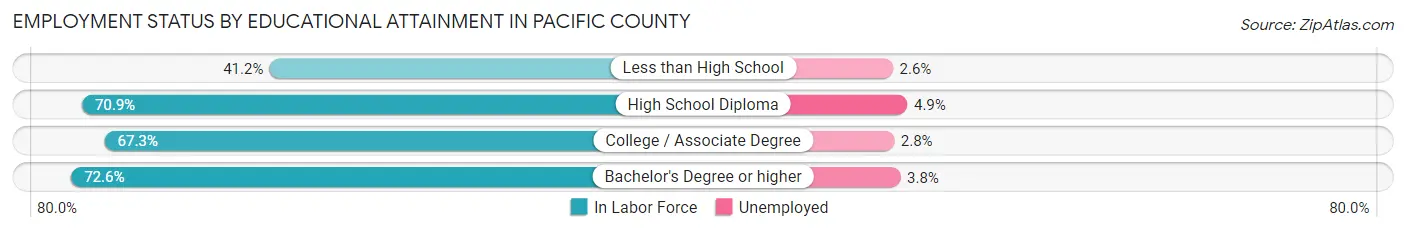
| Educational Attainment | In Labor Force | Unemployed |
| Less than High School | 431 (41.2%) | 27 (2.6%) |
| High School Diploma | 2,398 (70.9%) | 166 (4.9%) |
| College / Associate Degree | 2,895 (67.3%) | 120 (2.8%) |
| Bachelor's Degree or higher | 1,533 (72.6%) | 80 (3.8%) |
| Total | 7,251 (66.9%) | 401 (3.7%) |
Employment Occupations by Sex in Pacific County
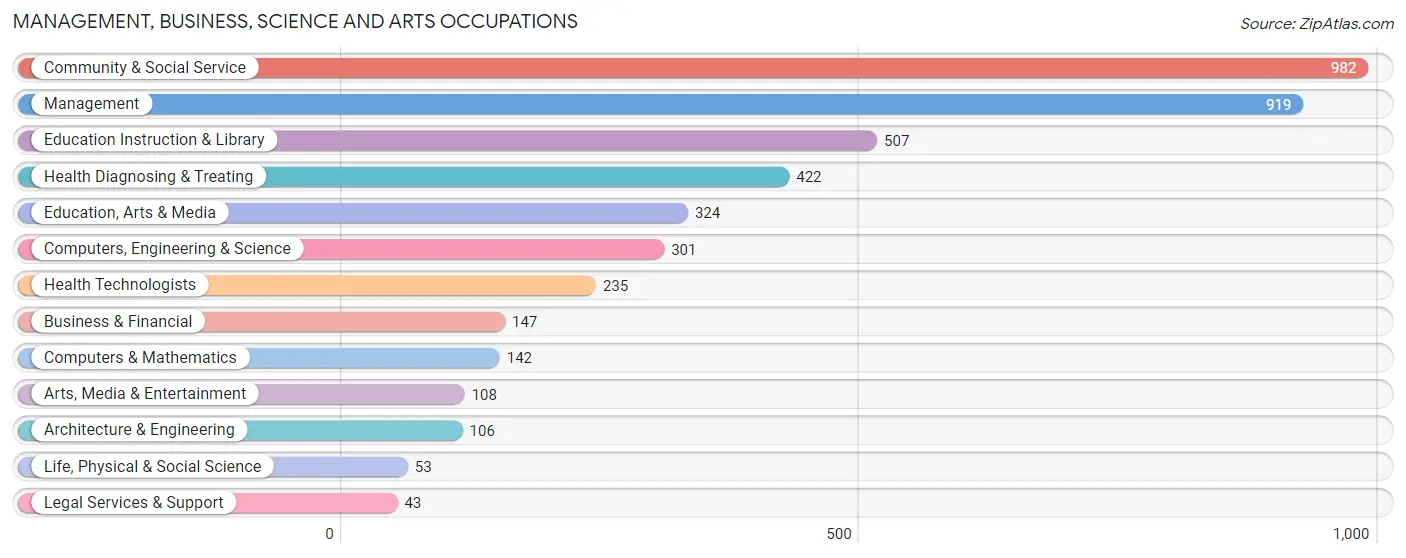
Management, Business, Science and Arts Occupations
The most common Management, Business, Science and Arts occupations in Pacific County are Community & Social Service (982 | 11.1%), Management (919 | 10.4%), Education Instruction & Library (507 | 5.7%), Health Diagnosing & Treating (422 | 4.8%), and Education, Arts & Media (324 | 3.7%).
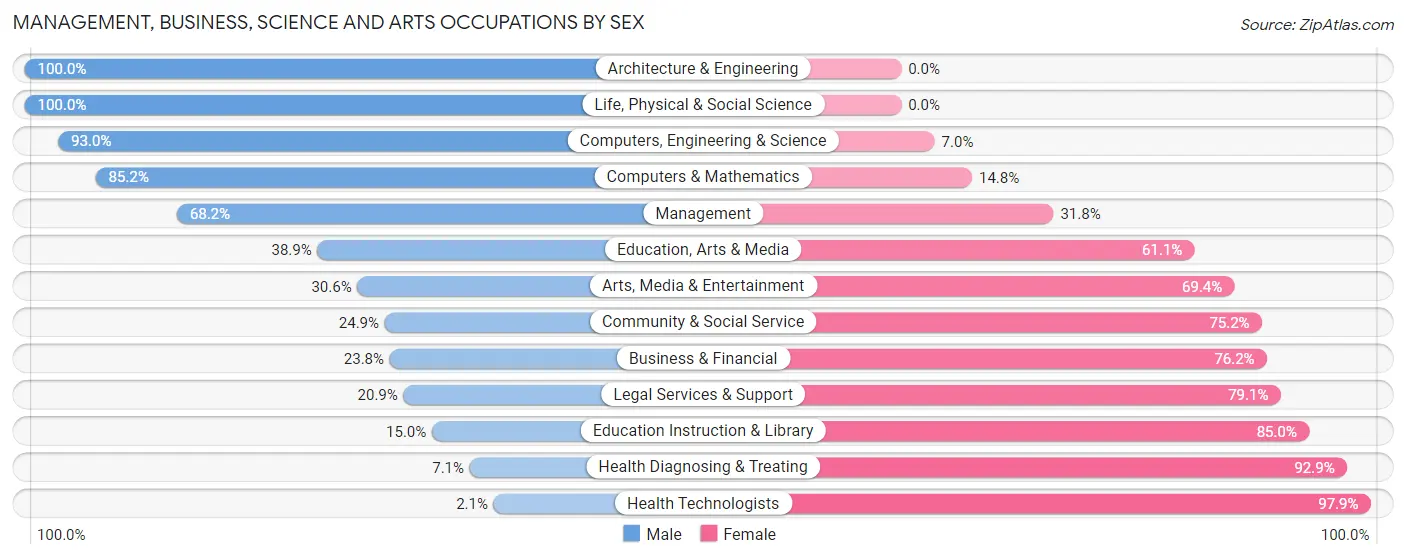
Management, Business, Science and Arts Occupations by Sex
Within the Management, Business, Science and Arts occupations in Pacific County, the most male-oriented occupations are Architecture & Engineering (100.0%), Life, Physical & Social Science (100.0%), and Computers, Engineering & Science (93.0%), while the most female-oriented occupations are Health Technologists (97.9%), Health Diagnosing & Treating (92.9%), and Education Instruction & Library (85.0%).
| Occupation | Male | Female |
| Management | 627 (68.2%) | 292 (31.8%) |
| Business & Financial | 35 (23.8%) | 112 (76.2%) |
| Computers, Engineering & Science | 280 (93.0%) | 21 (7.0%) |
| Computers & Mathematics | 121 (85.2%) | 21 (14.8%) |
| Architecture & Engineering | 106 (100.0%) | 0 (0.0%) |
| Life, Physical & Social Science | 53 (100.0%) | 0 (0.0%) |
| Community & Social Service | 244 (24.8%) | 738 (75.1%) |
| Education, Arts & Media | 126 (38.9%) | 198 (61.1%) |
| Legal Services & Support | 9 (20.9%) | 34 (79.1%) |
| Education Instruction & Library | 76 (15.0%) | 431 (85.0%) |
| Arts, Media & Entertainment | 33 (30.6%) | 75 (69.4%) |
| Health Diagnosing & Treating | 30 (7.1%) | 392 (92.9%) |
| Health Technologists | 5 (2.1%) | 230 (97.9%) |
| Total (Category) | 1,216 (43.9%) | 1,555 (56.1%) |
| Total (Overall) | 4,618 (52.2%) | 4,230 (47.8%) |
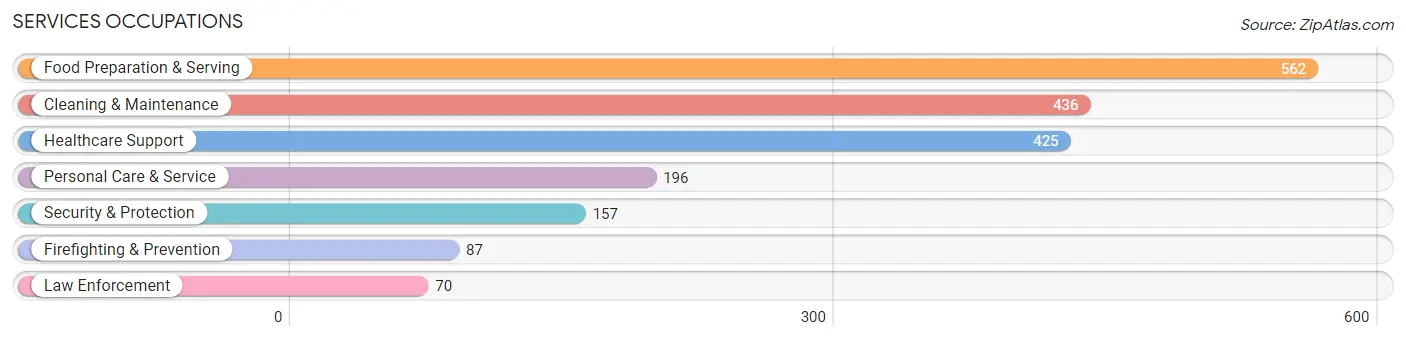
Services Occupations
The most common Services occupations in Pacific County are Food Preparation & Serving (562 | 6.4%), Cleaning & Maintenance (436 | 4.9%), Healthcare Support (425 | 4.8%), Personal Care & Service (196 | 2.2%), and Security & Protection (157 | 1.8%).
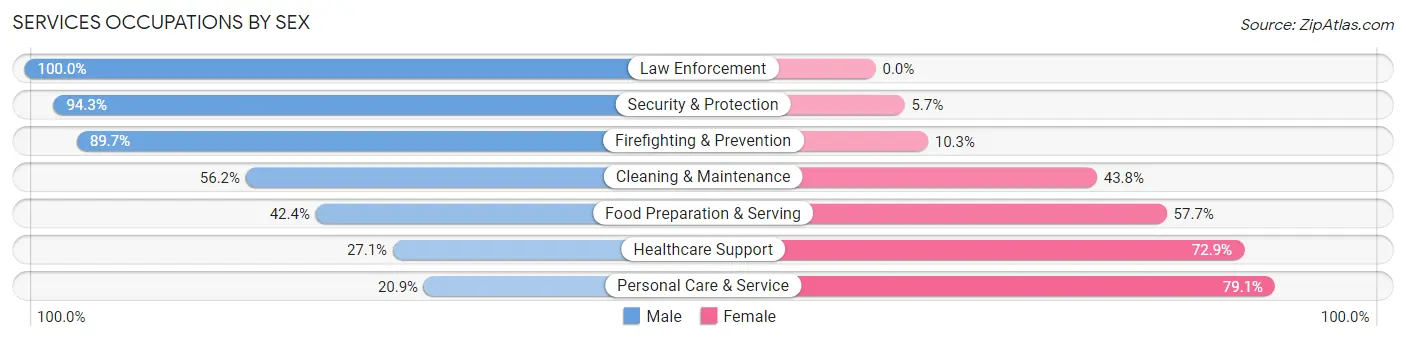
Services Occupations by Sex
Within the Services occupations in Pacific County, the most male-oriented occupations are Law Enforcement (100.0%), Security & Protection (94.3%), and Firefighting & Prevention (89.7%), while the most female-oriented occupations are Personal Care & Service (79.1%), Healthcare Support (72.9%), and Food Preparation & Serving (57.7%).
| Occupation | Male | Female |
| Healthcare Support | 115 (27.1%) | 310 (72.9%) |
| Security & Protection | 148 (94.3%) | 9 (5.7%) |
| Firefighting & Prevention | 78 (89.7%) | 9 (10.3%) |
| Law Enforcement | 70 (100.0%) | 0 (0.0%) |
| Food Preparation & Serving | 238 (42.3%) | 324 (57.7%) |
| Cleaning & Maintenance | 245 (56.2%) | 191 (43.8%) |
| Personal Care & Service | 41 (20.9%) | 155 (79.1%) |
| Total (Category) | 787 (44.3%) | 989 (55.7%) |
| Total (Overall) | 4,618 (52.2%) | 4,230 (47.8%) |
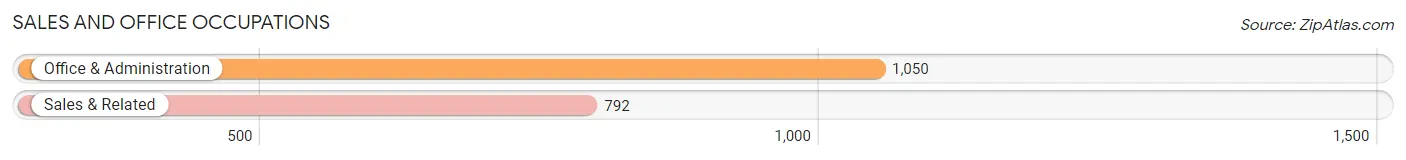
Sales and Office Occupations
The most common Sales and Office occupations in Pacific County are Office & Administration (1,050 | 11.9%), and Sales & Related (792 | 8.9%).
Sales and Office Occupations by Sex
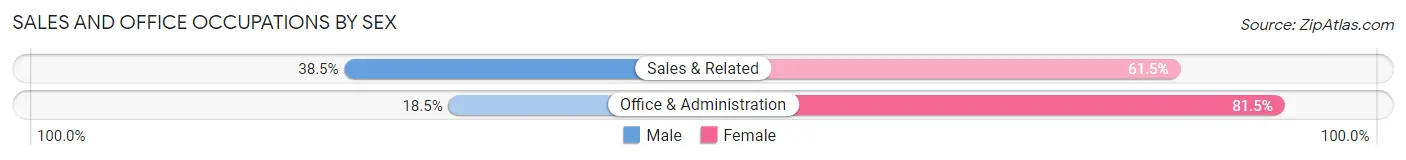
| Occupation | Male | Female |
| Sales & Related | 305 (38.5%) | 487 (61.5%) |
| Office & Administration | 194 (18.5%) | 856 (81.5%) |
| Total (Category) | 499 (27.1%) | 1,343 (72.9%) |
| Total (Overall) | 4,618 (52.2%) | 4,230 (47.8%) |
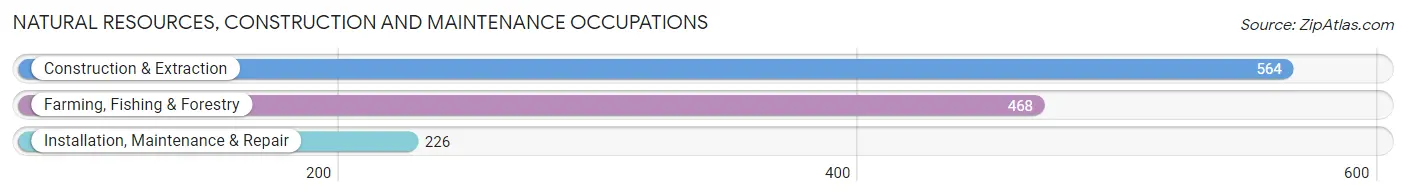
Natural Resources, Construction and Maintenance Occupations
The most common Natural Resources, Construction and Maintenance occupations in Pacific County are Construction & Extraction (564 | 6.4%), Farming, Fishing & Forestry (468 | 5.3%), and Installation, Maintenance & Repair (226 | 2.5%).
Natural Resources, Construction and Maintenance Occupations by Sex
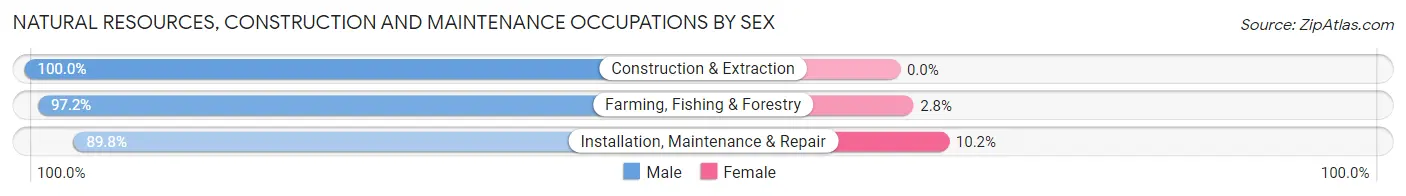
| Occupation | Male | Female |
| Farming, Fishing & Forestry | 455 (97.2%) | 13 (2.8%) |
| Construction & Extraction | 564 (100.0%) | 0 (0.0%) |
| Installation, Maintenance & Repair | 203 (89.8%) | 23 (10.2%) |
| Total (Category) | 1,222 (97.1%) | 36 (2.9%) |
| Total (Overall) | 4,618 (52.2%) | 4,230 (47.8%) |
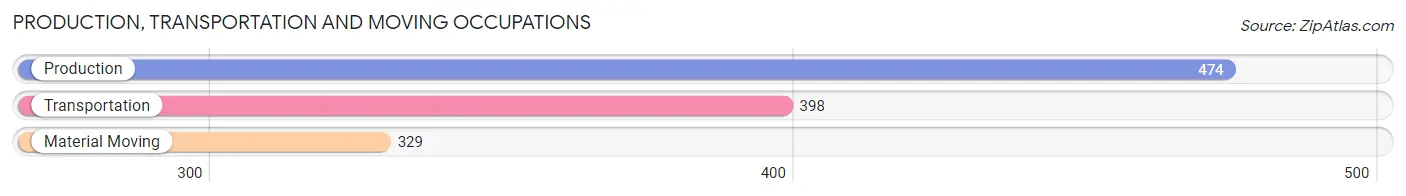
Production, Transportation and Moving Occupations
The most common Production, Transportation and Moving occupations in Pacific County are Production (474 | 5.4%), Transportation (398 | 4.5%), and Material Moving (329 | 3.7%).
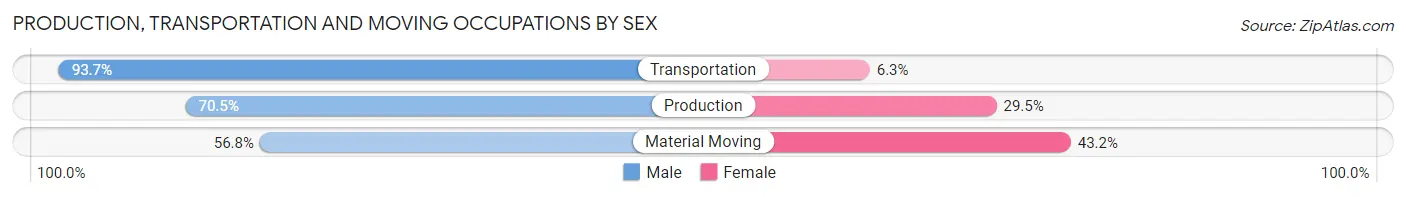
Production, Transportation and Moving Occupations by Sex
| Occupation | Male | Female |
| Production | 334 (70.5%) | 140 (29.5%) |
| Transportation | 373 (93.7%) | 25 (6.3%) |
| Material Moving | 187 (56.8%) | 142 (43.2%) |
| Total (Category) | 894 (74.4%) | 307 (25.6%) |
| Total (Overall) | 4,618 (52.2%) | 4,230 (47.8%) |
Employment Industries by Sex in Pacific County
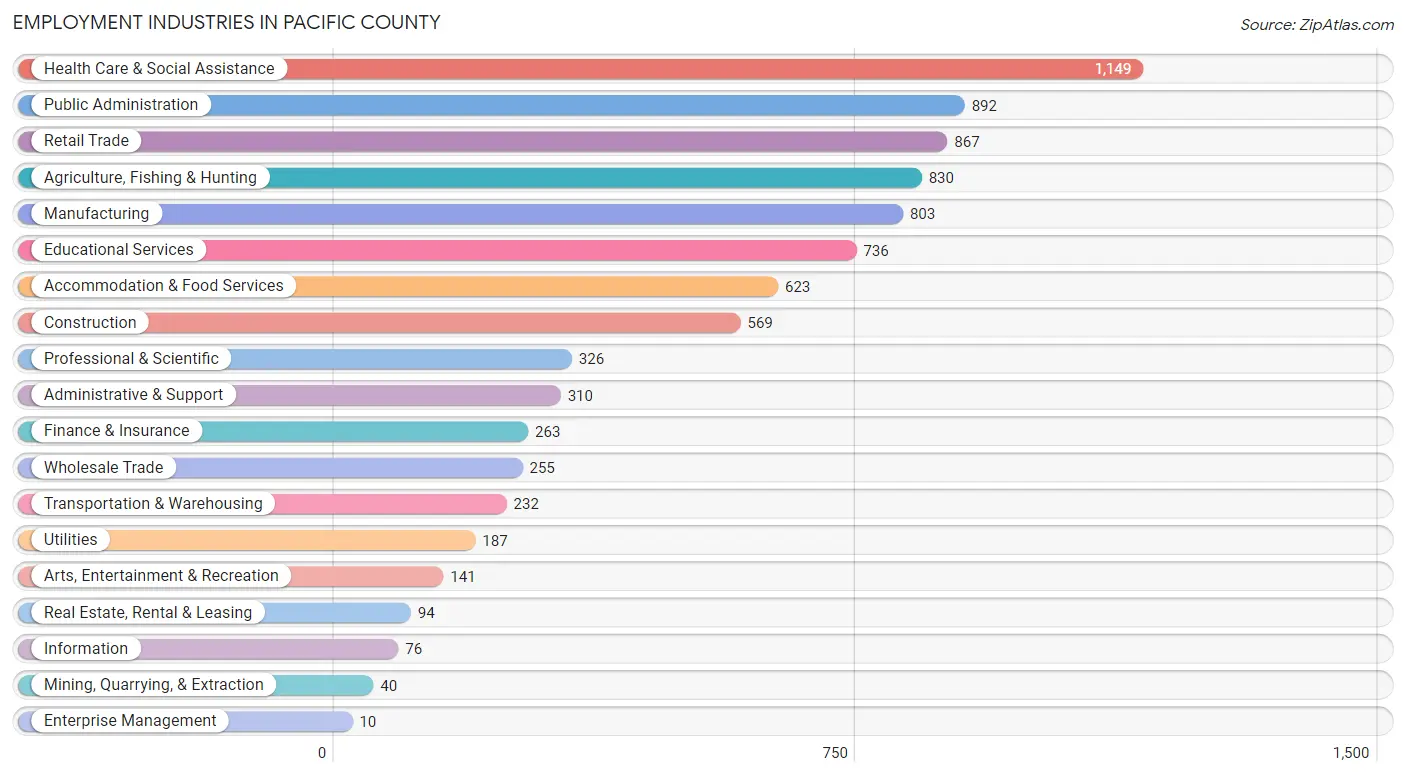
Employment Industries in Pacific County
The major employment industries in Pacific County include Health Care & Social Assistance (1,149 | 13.0%), Public Administration (892 | 10.1%), Retail Trade (867 | 9.8%), Agriculture, Fishing & Hunting (830 | 9.4%), and Manufacturing (803 | 9.1%).
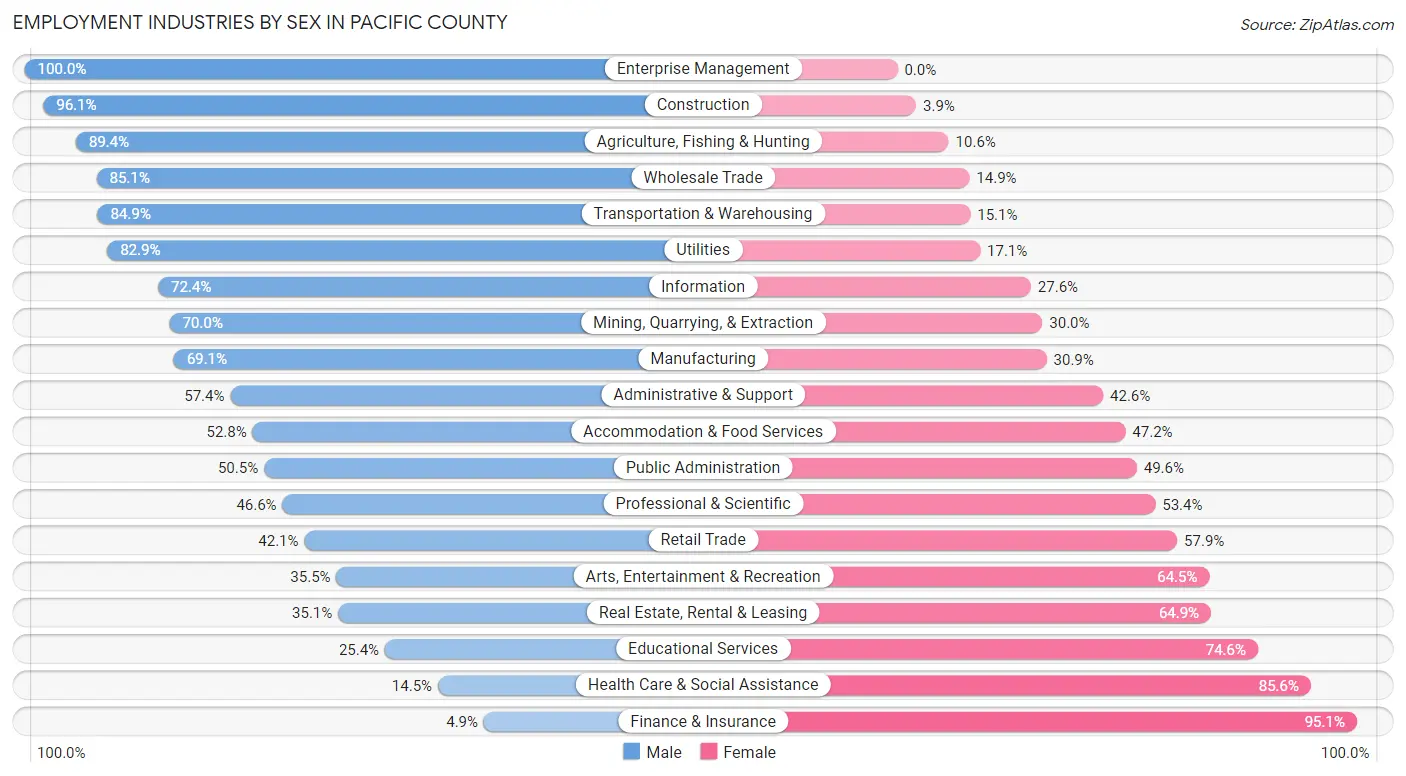
Employment Industries by Sex in Pacific County
The Pacific County industries that see more men than women are Enterprise Management (100.0%), Construction (96.1%), and Agriculture, Fishing & Hunting (89.4%), whereas the industries that tend to have a higher number of women are Finance & Insurance (95.1%), Health Care & Social Assistance (85.6%), and Educational Services (74.6%).
| Industry | Male | Female |
| Agriculture, Fishing & Hunting | 742 (89.4%) | 88 (10.6%) |
| Mining, Quarrying, & Extraction | 28 (70.0%) | 12 (30.0%) |
| Construction | 547 (96.1%) | 22 (3.9%) |
| Manufacturing | 555 (69.1%) | 248 (30.9%) |
| Wholesale Trade | 217 (85.1%) | 38 (14.9%) |
| Retail Trade | 365 (42.1%) | 502 (57.9%) |
| Transportation & Warehousing | 197 (84.9%) | 35 (15.1%) |
| Utilities | 155 (82.9%) | 32 (17.1%) |
| Information | 55 (72.4%) | 21 (27.6%) |
| Finance & Insurance | 13 (4.9%) | 250 (95.1%) |
| Real Estate, Rental & Leasing | 33 (35.1%) | 61 (64.9%) |
| Professional & Scientific | 152 (46.6%) | 174 (53.4%) |
| Enterprise Management | 10 (100.0%) | 0 (0.0%) |
| Administrative & Support | 178 (57.4%) | 132 (42.6%) |
| Educational Services | 187 (25.4%) | 549 (74.6%) |
| Health Care & Social Assistance | 166 (14.4%) | 983 (85.6%) |
| Arts, Entertainment & Recreation | 50 (35.5%) | 91 (64.5%) |
| Accommodation & Food Services | 329 (52.8%) | 294 (47.2%) |
| Public Administration | 450 (50.4%) | 442 (49.5%) |
| Total | 4,618 (52.2%) | 4,230 (47.8%) |
Education in Pacific County
School Enrollment in Pacific County
The most common levels of schooling among the 3,630 students in Pacific County are middle school (889 | 24.5%), high school (875 | 24.1%), and elementary school (767 | 21.1%).
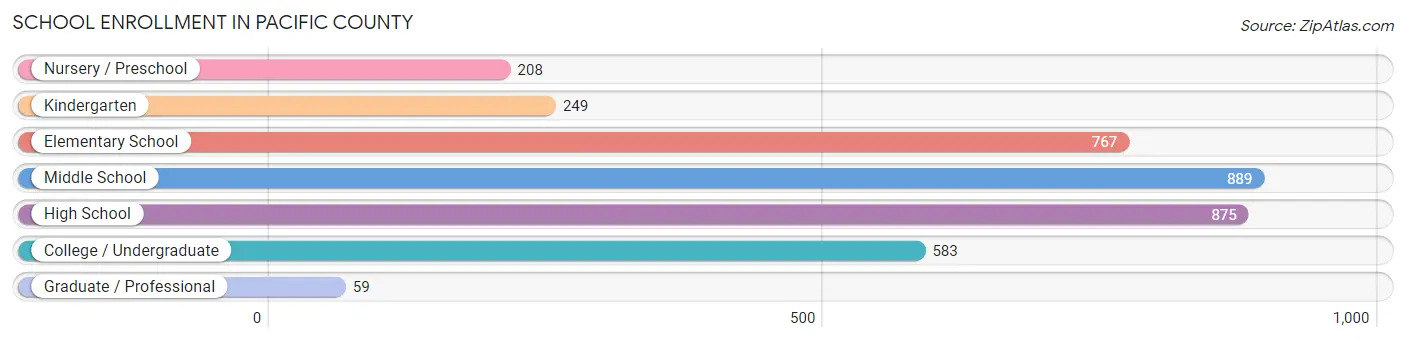
| School Level | # Students | % Students |
| Nursery / Preschool | 208 | 5.7% |
| Kindergarten | 249 | 6.9% |
| Elementary School | 767 | 21.1% |
| Middle School | 889 | 24.5% |
| High School | 875 | 24.1% |
| College / Undergraduate | 583 | 16.1% |
| Graduate / Professional | 59 | 1.6% |
| Total | 3,630 | 100.0% |
School Enrollment by Age by Funding Source in Pacific County
Out of a total of 3,630 students who are enrolled in schools in Pacific County, 232 (6.4%) attend a private institution, while the remaining 3,398 (93.6%) are enrolled in public schools. The age group of 3 to 4 year olds has the highest likelihood of being enrolled in private schools, with 19 (13.6% in the age bracket) enrolled. Conversely, the age group of 20 to 24 year olds has the lowest likelihood of being enrolled in a private school, with 276 (97.9% in the age bracket) attending a public institution.
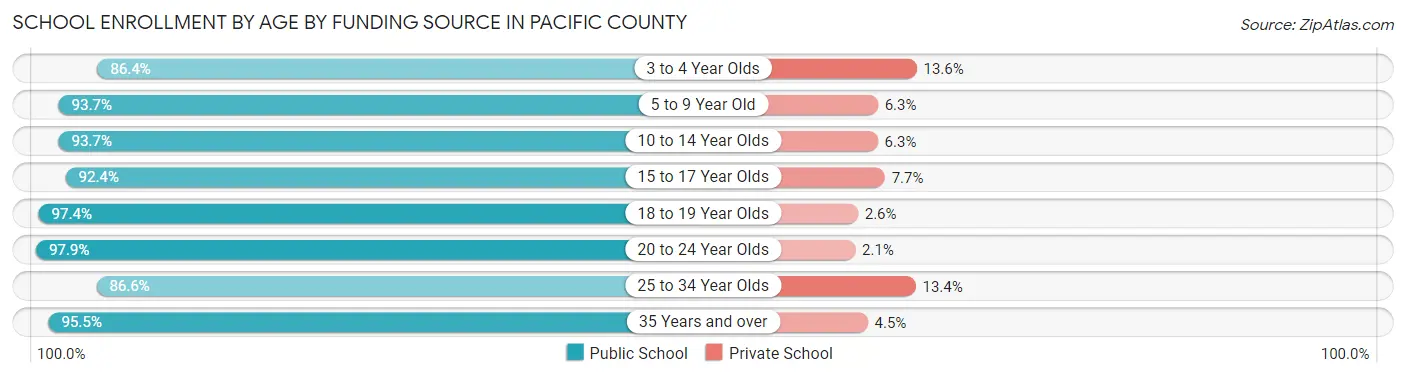
| Age Bracket | Public School | Private School |
| 3 to 4 Year Olds | 121 (86.4%) | 19 (13.6%) |
| 5 to 9 Year Old | 886 (93.7%) | 60 (6.3%) |
| 10 to 14 Year Olds | 1,035 (93.7%) | 70 (6.3%) |
| 15 to 17 Year Olds | 616 (92.3%) | 51 (7.6%) |
| 18 to 19 Year Olds | 259 (97.4%) | 7 (2.6%) |
| 20 to 24 Year Olds | 276 (97.9%) | 6 (2.1%) |
| 25 to 34 Year Olds | 97 (86.6%) | 15 (13.4%) |
| 35 Years and over | 107 (95.5%) | 5 (4.5%) |
| Total | 3,398 (93.6%) | 232 (6.4%) |
Educational Attainment by Field of Study in Pacific County
Education (788 | 16.2%), business (715 | 14.7%), science & technology (533 | 11.0%), visual & performing arts (435 | 8.9%), and social sciences (389 | 8.0%) are the most common fields of study among 4,858 individuals in Pacific County who have obtained a bachelor's degree or higher.
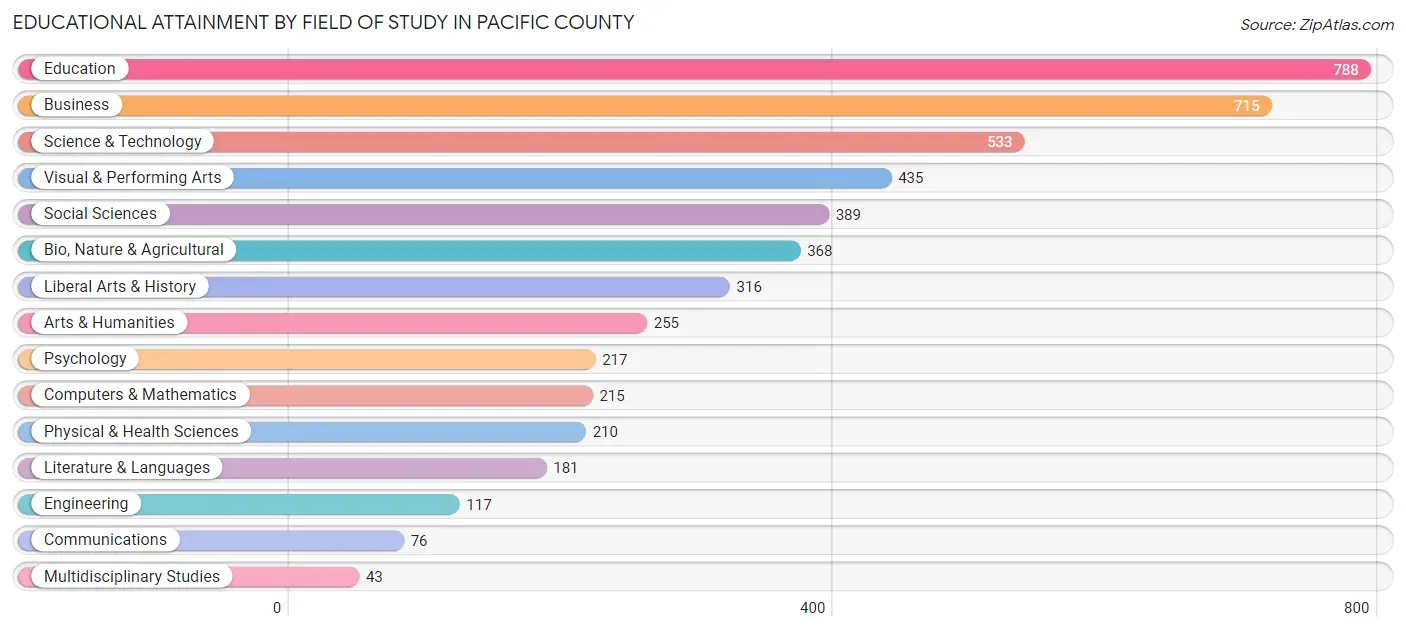
| Field of Study | # Graduates | % Graduates |
| Computers & Mathematics | 215 | 4.4% |
| Bio, Nature & Agricultural | 368 | 7.6% |
| Physical & Health Sciences | 210 | 4.3% |
| Psychology | 217 | 4.5% |
| Social Sciences | 389 | 8.0% |
| Engineering | 117 | 2.4% |
| Multidisciplinary Studies | 43 | 0.9% |
| Science & Technology | 533 | 11.0% |
| Business | 715 | 14.7% |
| Education | 788 | 16.2% |
| Literature & Languages | 181 | 3.7% |
| Liberal Arts & History | 316 | 6.5% |
| Visual & Performing Arts | 435 | 8.9% |
| Communications | 76 | 1.6% |
| Arts & Humanities | 255 | 5.2% |
| Total | 4,858 | 100.0% |
Transportation & Commute in Pacific County
Vehicle Availability by Sex in Pacific County
The most prevalent vehicle ownership categories in Pacific County are males with 2 vehicles (1,440, accounting for 32.6%) and females with 2 vehicles (1,409, making up 35.8%).
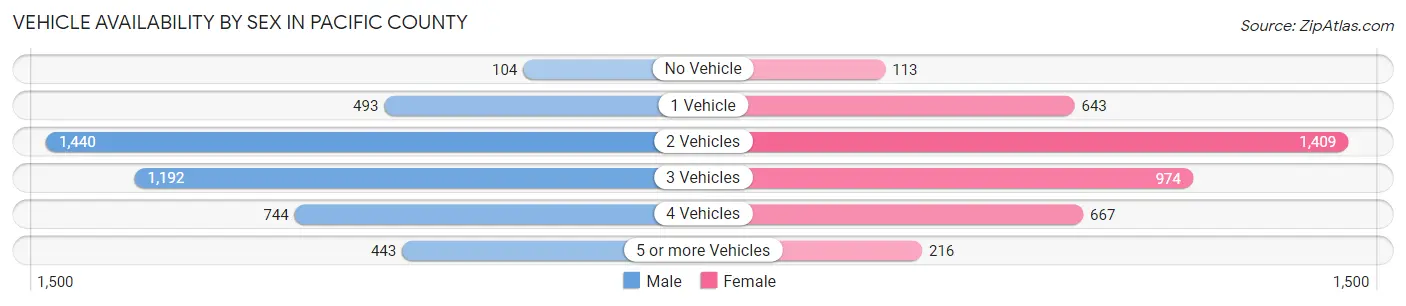
| Vehicles Available | Male | Female |
| No Vehicle | 104 (2.4%) | 113 (2.8%) |
| 1 Vehicle | 493 (11.2%) | 643 (16.0%) |
| 2 Vehicles | 1,440 (32.6%) | 1,409 (35.0%) |
| 3 Vehicles | 1,192 (27.0%) | 974 (24.2%) |
| 4 Vehicles | 744 (16.9%) | 667 (16.6%) |
| 5 or more Vehicles | 443 (10.0%) | 216 (5.4%) |
| Total | 4,416 (100.0%) | 4,022 (100.0%) |
Commute Time in Pacific County
The most frequently occuring commute durations in Pacific County are 5 to 9 minutes (1,761 commuters, 24.1%), 10 to 14 minutes (1,030 commuters, 14.1%), and less than 5 minutes (888 commuters, 12.1%).
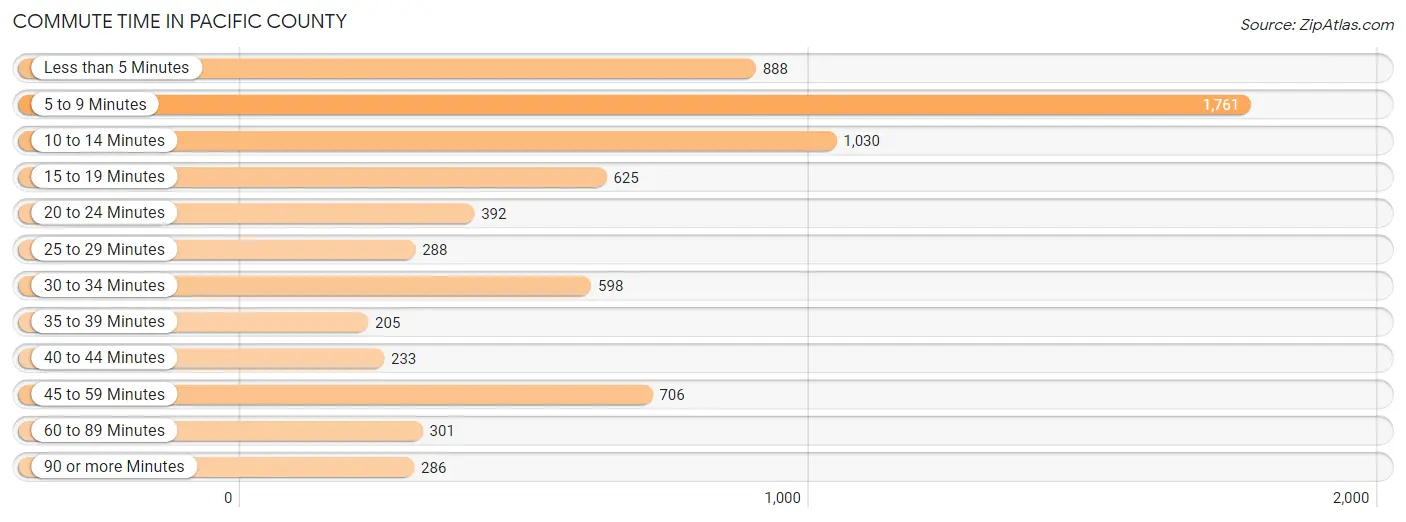
| Commute Time | # Commuters | % Commuters |
| Less than 5 Minutes | 888 | 12.1% |
| 5 to 9 Minutes | 1,761 | 24.1% |
| 10 to 14 Minutes | 1,030 | 14.1% |
| 15 to 19 Minutes | 625 | 8.6% |
| 20 to 24 Minutes | 392 | 5.4% |
| 25 to 29 Minutes | 288 | 3.9% |
| 30 to 34 Minutes | 598 | 8.2% |
| 35 to 39 Minutes | 205 | 2.8% |
| 40 to 44 Minutes | 233 | 3.2% |
| 45 to 59 Minutes | 706 | 9.7% |
| 60 to 89 Minutes | 301 | 4.1% |
| 90 or more Minutes | 286 | 3.9% |
Commute Time by Sex in Pacific County
The most common commute times in Pacific County are 5 to 9 minutes (856 commuters, 21.5%) for males and 5 to 9 minutes (905 commuters, 27.2%) for females.
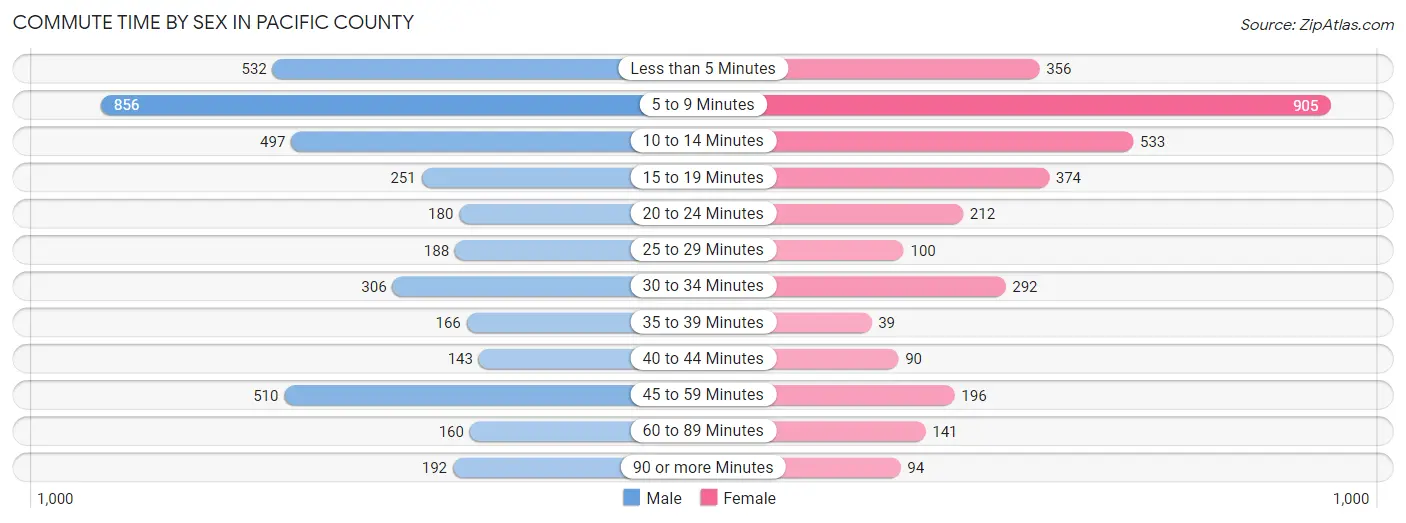
| Commute Time | Male | Female |
| Less than 5 Minutes | 532 (13.4%) | 356 (10.7%) |
| 5 to 9 Minutes | 856 (21.5%) | 905 (27.2%) |
| 10 to 14 Minutes | 497 (12.5%) | 533 (16.0%) |
| 15 to 19 Minutes | 251 (6.3%) | 374 (11.2%) |
| 20 to 24 Minutes | 180 (4.5%) | 212 (6.4%) |
| 25 to 29 Minutes | 188 (4.7%) | 100 (3.0%) |
| 30 to 34 Minutes | 306 (7.7%) | 292 (8.8%) |
| 35 to 39 Minutes | 166 (4.2%) | 39 (1.2%) |
| 40 to 44 Minutes | 143 (3.6%) | 90 (2.7%) |
| 45 to 59 Minutes | 510 (12.8%) | 196 (5.9%) |
| 60 to 89 Minutes | 160 (4.0%) | 141 (4.2%) |
| 90 or more Minutes | 192 (4.8%) | 94 (2.8%) |
Time of Departure to Work by Sex in Pacific County
The most frequent times of departure to work in Pacific County are 7:00 AM to 7:29 AM (586, 14.7%) for males and 7:00 AM to 7:29 AM (638, 19.2%) for females.
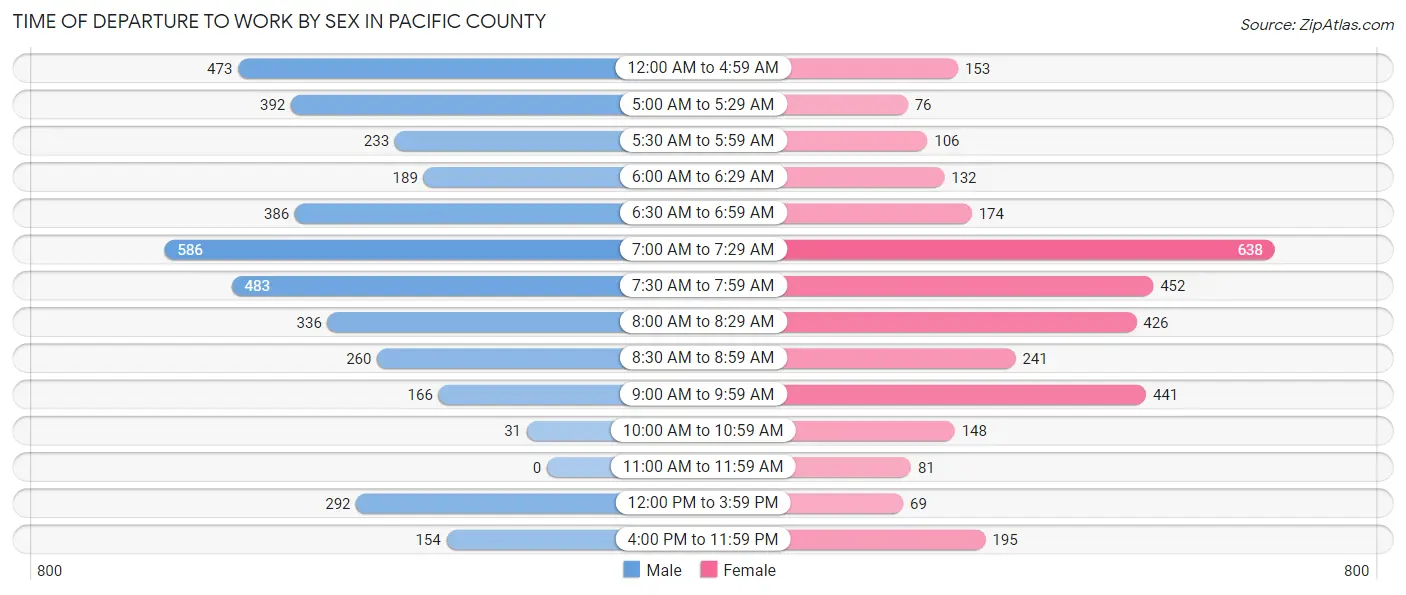
| Time of Departure | Male | Female |
| 12:00 AM to 4:59 AM | 473 (11.9%) | 153 (4.6%) |
| 5:00 AM to 5:29 AM | 392 (9.9%) | 76 (2.3%) |
| 5:30 AM to 5:59 AM | 233 (5.9%) | 106 (3.2%) |
| 6:00 AM to 6:29 AM | 189 (4.8%) | 132 (4.0%) |
| 6:30 AM to 6:59 AM | 386 (9.7%) | 174 (5.2%) |
| 7:00 AM to 7:29 AM | 586 (14.7%) | 638 (19.2%) |
| 7:30 AM to 7:59 AM | 483 (12.1%) | 452 (13.6%) |
| 8:00 AM to 8:29 AM | 336 (8.4%) | 426 (12.8%) |
| 8:30 AM to 8:59 AM | 260 (6.5%) | 241 (7.2%) |
| 9:00 AM to 9:59 AM | 166 (4.2%) | 441 (13.2%) |
| 10:00 AM to 10:59 AM | 31 (0.8%) | 148 (4.4%) |
| 11:00 AM to 11:59 AM | 0 (0.0%) | 81 (2.4%) |
| 12:00 PM to 3:59 PM | 292 (7.3%) | 69 (2.1%) |
| 4:00 PM to 11:59 PM | 154 (3.9%) | 195 (5.9%) |
| Total | 3,981 (100.0%) | 3,332 (100.0%) |
Housing Occupancy in Pacific County
Occupancy by Ownership in Pacific County
Of the total 10,689 dwellings in Pacific County, owner-occupied units account for 8,779 (82.1%), while renter-occupied units make up 1,910 (17.9%).
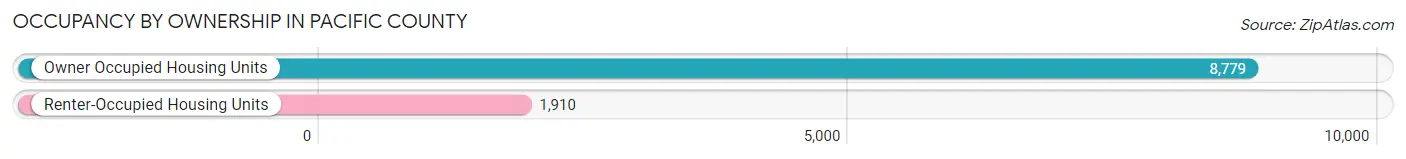
| Occupancy | # Housing Units | % Housing Units |
| Owner Occupied Housing Units | 8,779 | 82.1% |
| Renter-Occupied Housing Units | 1,910 | 17.9% |
| Total Occupied Housing Units | 10,689 | 100.0% |
Occupancy by Household Size in Pacific County
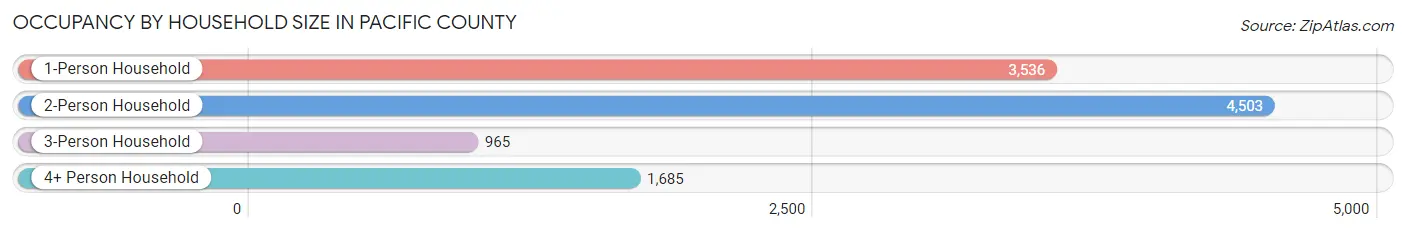
| Household Size | # Housing Units | % Housing Units |
| 1-Person Household | 3,536 | 33.1% |
| 2-Person Household | 4,503 | 42.1% |
| 3-Person Household | 965 | 9.0% |
| 4+ Person Household | 1,685 | 15.8% |
| Total Housing Units | 10,689 | 100.0% |
Occupancy by Ownership by Household Size in Pacific County
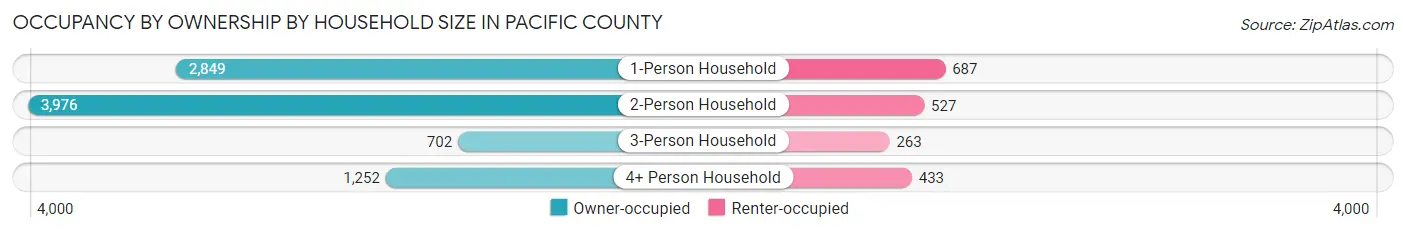
| Household Size | Owner-occupied | Renter-occupied |
| 1-Person Household | 2,849 (80.6%) | 687 (19.4%) |
| 2-Person Household | 3,976 (88.3%) | 527 (11.7%) |
| 3-Person Household | 702 (72.8%) | 263 (27.3%) |
| 4+ Person Household | 1,252 (74.3%) | 433 (25.7%) |
| Total Housing Units | 8,779 (82.1%) | 1,910 (17.9%) |
Occupancy by Educational Attainment in Pacific County
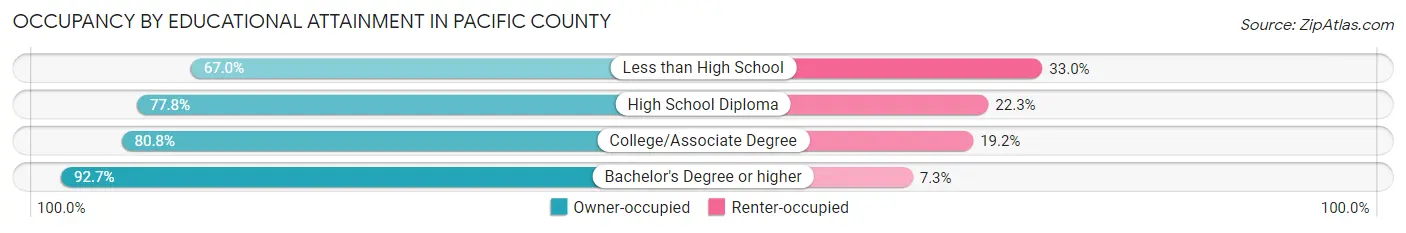
| Household Size | Owner-occupied | Renter-occupied |
| Less than High School | 545 (67.0%) | 268 (33.0%) |
| High School Diploma | 2,149 (77.7%) | 615 (22.3%) |
| College/Associate Degree | 3,441 (80.8%) | 820 (19.2%) |
| Bachelor's Degree or higher | 2,644 (92.7%) | 207 (7.3%) |
Occupancy by Age of Householder in Pacific County
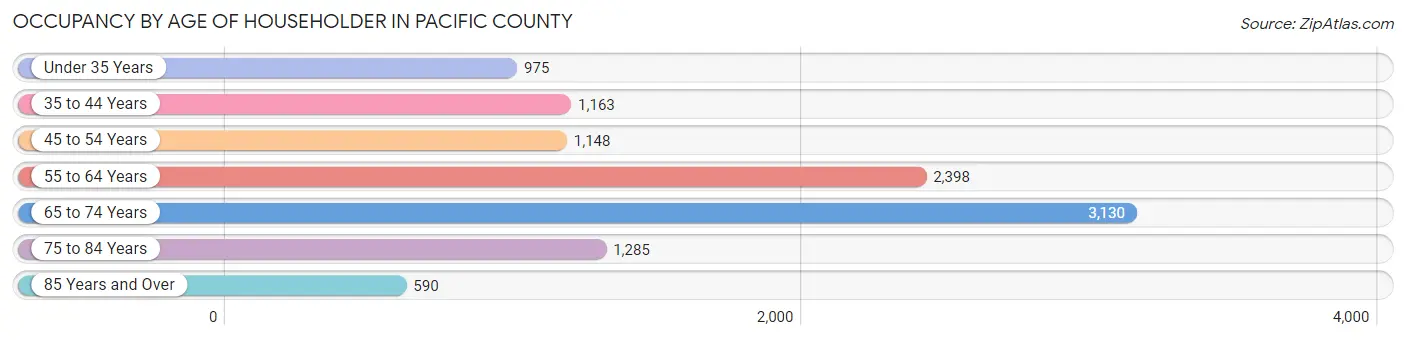
| Age Bracket | # Households | % Households |
| Under 35 Years | 975 | 9.1% |
| 35 to 44 Years | 1,163 | 10.9% |
| 45 to 54 Years | 1,148 | 10.7% |
| 55 to 64 Years | 2,398 | 22.4% |
| 65 to 74 Years | 3,130 | 29.3% |
| 75 to 84 Years | 1,285 | 12.0% |
| 85 Years and Over | 590 | 5.5% |
| Total | 10,689 | 100.0% |
Housing Finances in Pacific County
Median Income by Occupancy in Pacific County
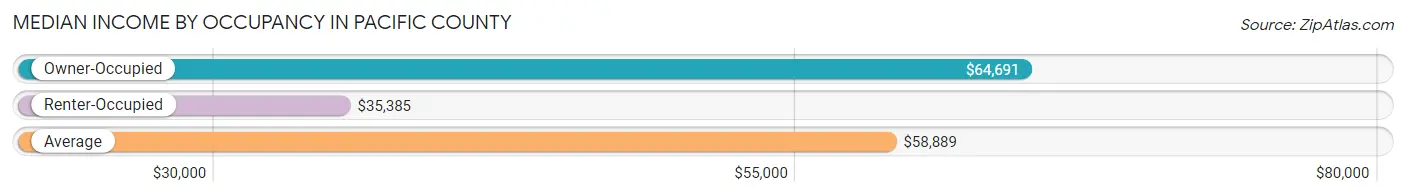
| Occupancy Type | # Households | Median Income |
| Owner-Occupied | 8,779 (82.1%) | $64,691 |
| Renter-Occupied | 1,910 (17.9%) | $35,385 |
| Average | 10,689 (100.0%) | $58,889 |
Occupancy by Householder Income Bracket in Pacific County
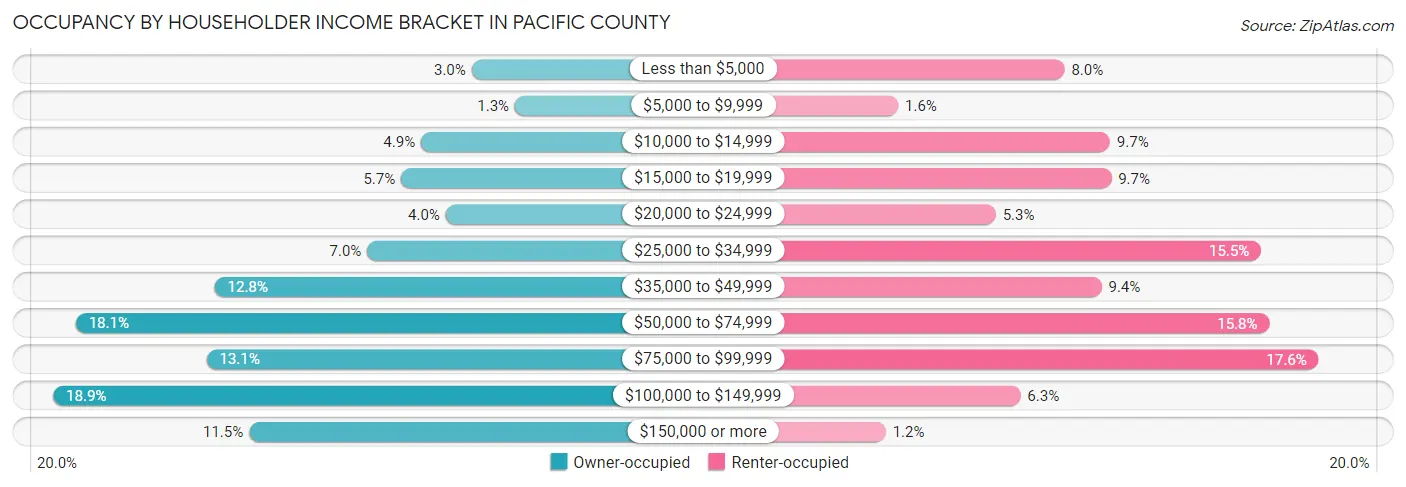
| Income Bracket | Owner-occupied | Renter-occupied |
| Less than $5,000 | 261 (3.0%) | 152 (8.0%) |
| $5,000 to $9,999 | 116 (1.3%) | 31 (1.6%) |
| $10,000 to $14,999 | 430 (4.9%) | 185 (9.7%) |
| $15,000 to $19,999 | 497 (5.7%) | 186 (9.7%) |
| $20,000 to $24,999 | 348 (4.0%) | 102 (5.3%) |
| $25,000 to $34,999 | 610 (7.0%) | 295 (15.4%) |
| $35,000 to $49,999 | 1,120 (12.8%) | 179 (9.4%) |
| $50,000 to $74,999 | 1,585 (18.0%) | 301 (15.8%) |
| $75,000 to $99,999 | 1,147 (13.1%) | 337 (17.6%) |
| $100,000 to $149,999 | 1,660 (18.9%) | 120 (6.3%) |
| $150,000 or more | 1,005 (11.5%) | 22 (1.1%) |
| Total | 8,779 (100.0%) | 1,910 (100.0%) |
Monthly Housing Cost Tiers in Pacific County
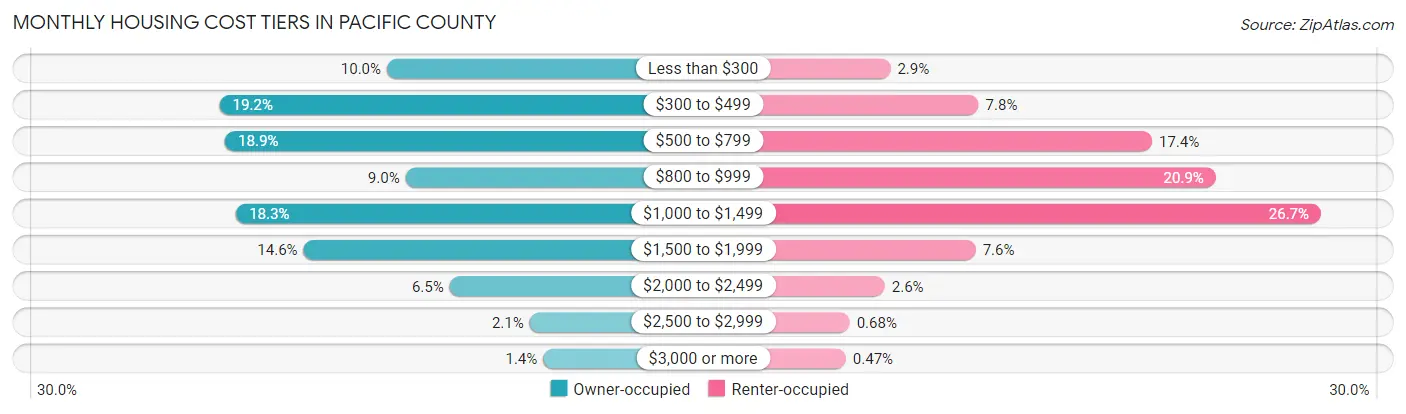
| Monthly Cost | Owner-occupied | Renter-occupied |
| Less than $300 | 877 (10.0%) | 56 (2.9%) |
| $300 to $499 | 1,688 (19.2%) | 149 (7.8%) |
| $500 to $799 | 1,661 (18.9%) | 332 (17.4%) |
| $800 to $999 | 787 (9.0%) | 399 (20.9%) |
| $1,000 to $1,499 | 1,607 (18.3%) | 510 (26.7%) |
| $1,500 to $1,999 | 1,282 (14.6%) | 146 (7.6%) |
| $2,000 to $2,499 | 573 (6.5%) | 50 (2.6%) |
| $2,500 to $2,999 | 185 (2.1%) | 13 (0.7%) |
| $3,000 or more | 119 (1.4%) | 9 (0.5%) |
| Total | 8,779 (100.0%) | 1,910 (100.0%) |
Physical Housing Characteristics in Pacific County
Housing Structures in Pacific County
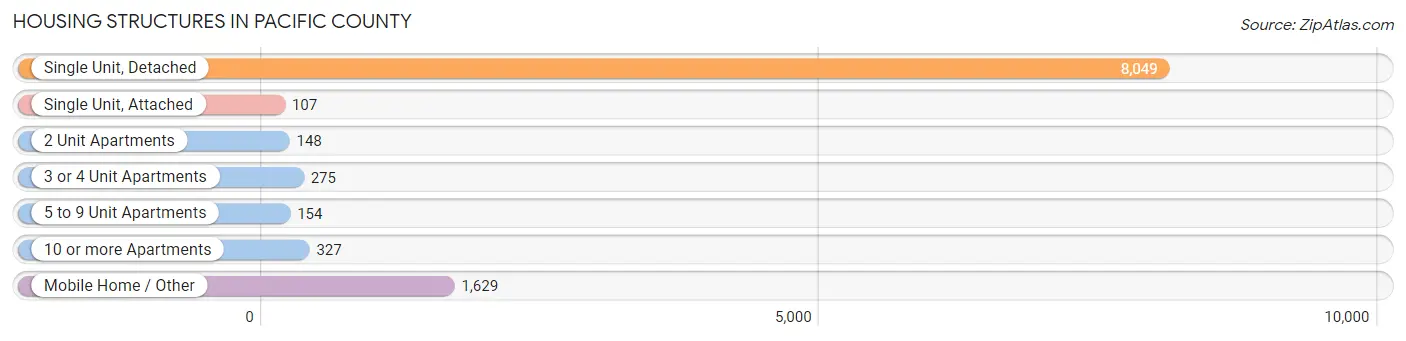
| Structure Type | # Housing Units | % Housing Units |
| Single Unit, Detached | 8,049 | 75.3% |
| Single Unit, Attached | 107 | 1.0% |
| 2 Unit Apartments | 148 | 1.4% |
| 3 or 4 Unit Apartments | 275 | 2.6% |
| 5 to 9 Unit Apartments | 154 | 1.4% |
| 10 or more Apartments | 327 | 3.1% |
| Mobile Home / Other | 1,629 | 15.2% |
| Total | 10,689 | 100.0% |
Housing Structures by Occupancy in Pacific County
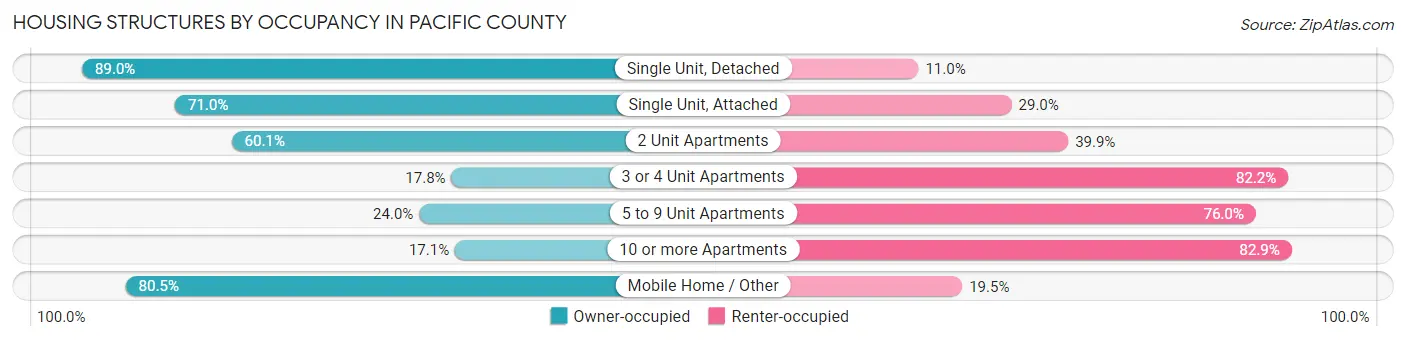
| Structure Type | Owner-occupied | Renter-occupied |
| Single Unit, Detached | 7,160 (89.0%) | 889 (11.0%) |
| Single Unit, Attached | 76 (71.0%) | 31 (29.0%) |
| 2 Unit Apartments | 89 (60.1%) | 59 (39.9%) |
| 3 or 4 Unit Apartments | 49 (17.8%) | 226 (82.2%) |
| 5 to 9 Unit Apartments | 37 (24.0%) | 117 (76.0%) |
| 10 or more Apartments | 56 (17.1%) | 271 (82.9%) |
| Mobile Home / Other | 1,312 (80.5%) | 317 (19.5%) |
| Total | 8,779 (82.1%) | 1,910 (17.9%) |
Housing Structures by Number of Rooms in Pacific County
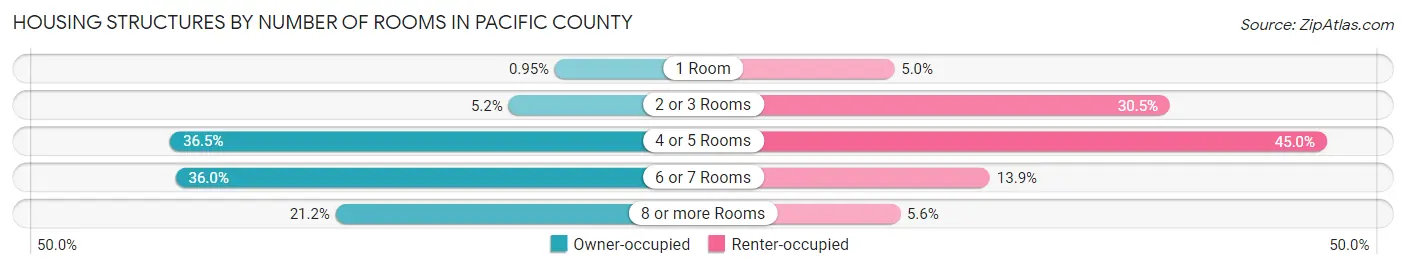
| Number of Rooms | Owner-occupied | Renter-occupied |
| 1 Room | 83 (0.9%) | 96 (5.0%) |
| 2 or 3 Rooms | 460 (5.2%) | 583 (30.5%) |
| 4 or 5 Rooms | 3,208 (36.5%) | 860 (45.0%) |
| 6 or 7 Rooms | 3,164 (36.0%) | 265 (13.9%) |
| 8 or more Rooms | 1,864 (21.2%) | 106 (5.6%) |
| Total | 8,779 (100.0%) | 1,910 (100.0%) |
Housing Structure by Heating Type in Pacific County
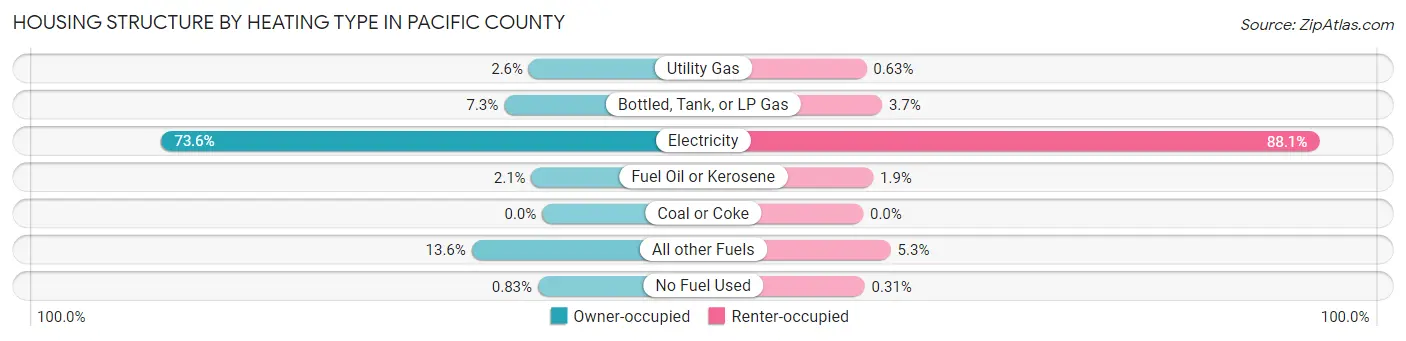
| Heating Type | Owner-occupied | Renter-occupied |
| Utility Gas | 225 (2.6%) | 12 (0.6%) |
| Bottled, Tank, or LP Gas | 644 (7.3%) | 70 (3.7%) |
| Electricity | 6,460 (73.6%) | 1,683 (88.1%) |
| Fuel Oil or Kerosene | 181 (2.1%) | 37 (1.9%) |
| Coal or Coke | 0 (0.0%) | 0 (0.0%) |
| All other Fuels | 1,196 (13.6%) | 102 (5.3%) |
| No Fuel Used | 73 (0.8%) | 6 (0.3%) |
| Total | 8,779 (100.0%) | 1,910 (100.0%) |
Household Vehicle Usage in Pacific County
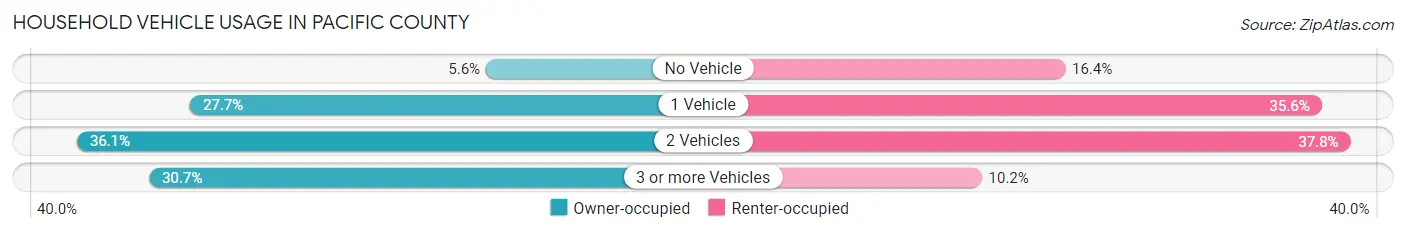
| Vehicles per Household | Owner-occupied | Renter-occupied |
| No Vehicle | 487 (5.6%) | 314 (16.4%) |
| 1 Vehicle | 2,427 (27.7%) | 680 (35.6%) |
| 2 Vehicles | 3,169 (36.1%) | 721 (37.8%) |
| 3 or more Vehicles | 2,696 (30.7%) | 195 (10.2%) |
| Total | 8,779 (100.0%) | 1,910 (100.0%) |
Real Estate & Mortgages in Pacific County
Real Estate and Mortgage Overview in Pacific County
| Characteristic | Without Mortgage | With Mortgage |
| Housing Units | 4,378 | 4,401 |
| Median Property Value | $223,800 | $280,100 |
| Median Household Income | $50,625 | $576 |
| Monthly Housing Costs | $462 | $119 |
| Real Estate Taxes | $1,903 | $87 |
Property Value by Mortgage Status in Pacific County
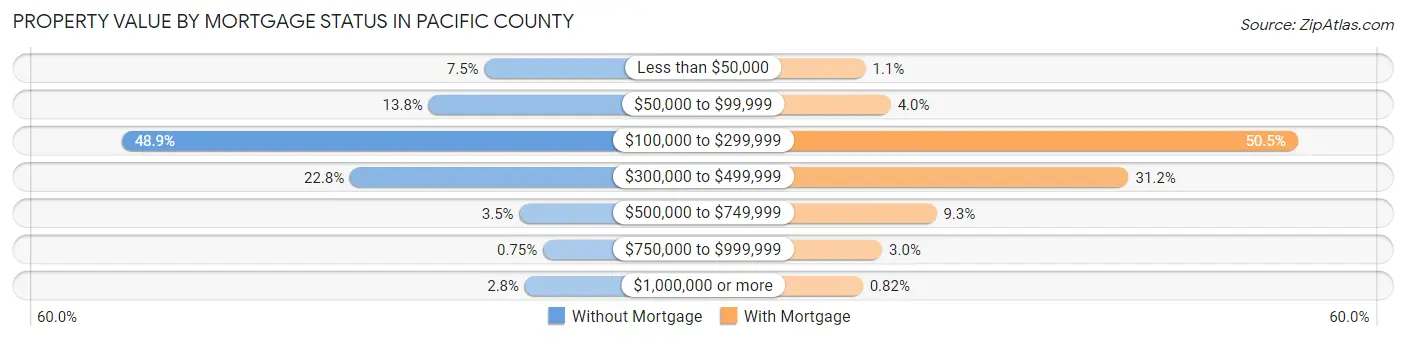
| Property Value | Without Mortgage | With Mortgage |
| Less than $50,000 | 326 (7.4%) | 50 (1.1%) |
| $50,000 to $99,999 | 605 (13.8%) | 177 (4.0%) |
| $100,000 to $299,999 | 2,141 (48.9%) | 2,224 (50.5%) |
| $300,000 to $499,999 | 998 (22.8%) | 1,373 (31.2%) |
| $500,000 to $749,999 | 151 (3.5%) | 407 (9.2%) |
| $750,000 to $999,999 | 33 (0.7%) | 134 (3.0%) |
| $1,000,000 or more | 124 (2.8%) | 36 (0.8%) |
| Total | 4,378 (100.0%) | 4,401 (100.0%) |
Household Income by Mortgage Status in Pacific County
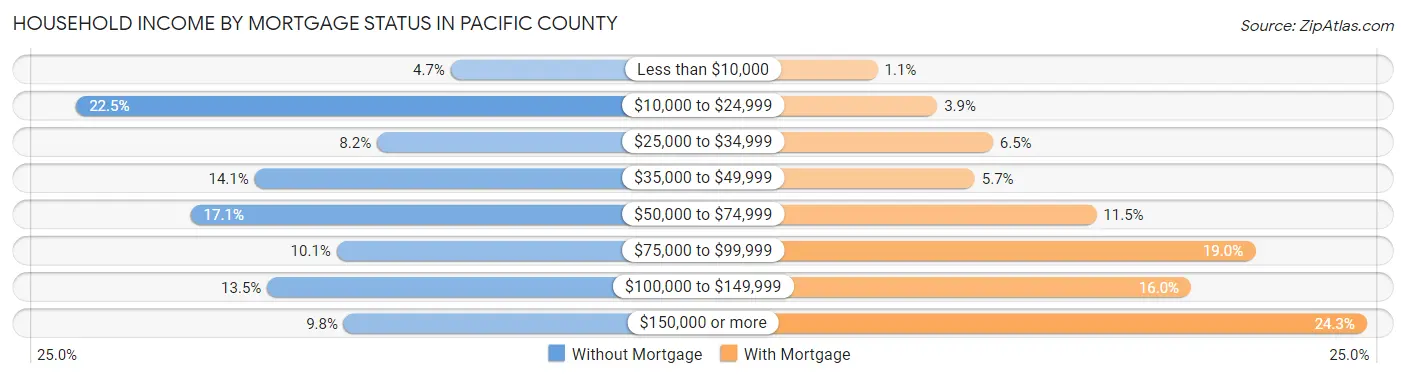
| Household Income | Without Mortgage | With Mortgage |
| Less than $10,000 | 206 (4.7%) | 46 (1.1%) |
| $10,000 to $24,999 | 987 (22.5%) | 171 (3.9%) |
| $25,000 to $34,999 | 360 (8.2%) | 288 (6.5%) |
| $35,000 to $49,999 | 615 (14.1%) | 250 (5.7%) |
| $50,000 to $74,999 | 748 (17.1%) | 505 (11.5%) |
| $75,000 to $99,999 | 444 (10.1%) | 837 (19.0%) |
| $100,000 to $149,999 | 589 (13.5%) | 703 (16.0%) |
| $150,000 or more | 429 (9.8%) | 1,071 (24.3%) |
| Total | 4,378 (100.0%) | 4,401 (100.0%) |
Property Value to Household Income Ratio in Pacific County
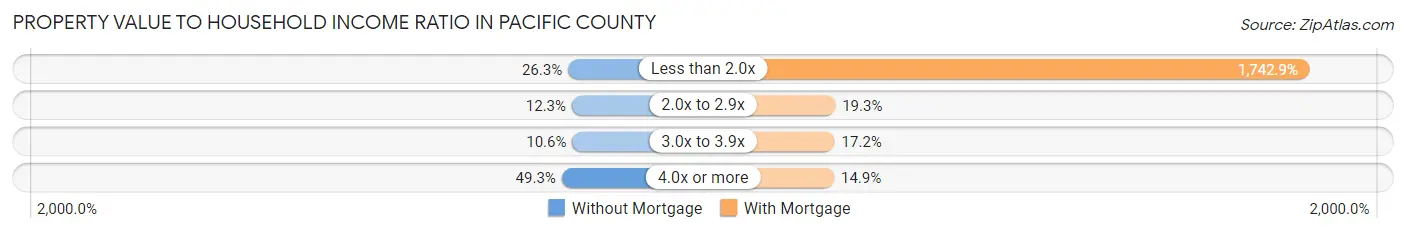
| Value-to-Income Ratio | Without Mortgage | With Mortgage |
| Less than 2.0x | 1,151 (26.3%) | 76,707 (1,742.9%) |
| 2.0x to 2.9x | 538 (12.3%) | 850 (19.3%) |
| 3.0x to 3.9x | 462 (10.5%) | 756 (17.2%) |
| 4.0x or more | 2,156 (49.2%) | 654 (14.9%) |
| Total | 4,378 (100.0%) | 4,401 (100.0%) |
Real Estate Taxes by Mortgage Status in Pacific County
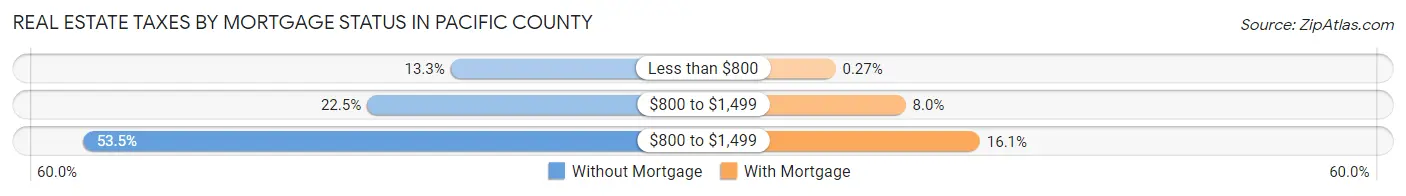
| Property Taxes | Without Mortgage | With Mortgage |
| Less than $800 | 583 (13.3%) | 12 (0.3%) |
| $800 to $1,499 | 984 (22.5%) | 350 (8.0%) |
| $800 to $1,499 | 2,343 (53.5%) | 708 (16.1%) |
| Total | 4,378 (100.0%) | 4,401 (100.0%) |
Health & Disability in Pacific County
Health Insurance Coverage by Age in Pacific County
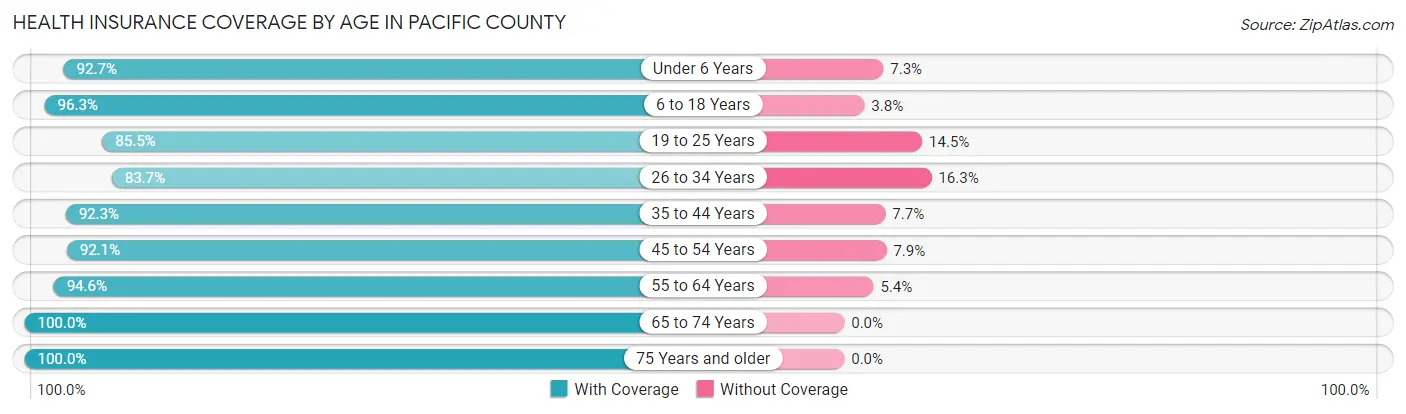
| Age Bracket | With Coverage | Without Coverage |
| Under 6 Years | 930 (92.7%) | 73 (7.3%) |
| 6 to 18 Years | 2,672 (96.3%) | 104 (3.7%) |
| 19 to 25 Years | 1,007 (85.5%) | 171 (14.5%) |
| 26 to 34 Years | 1,468 (83.7%) | 285 (16.3%) |
| 35 to 44 Years | 2,227 (92.3%) | 185 (7.7%) |
| 45 to 54 Years | 2,305 (92.1%) | 197 (7.9%) |
| 55 to 64 Years | 3,771 (94.6%) | 217 (5.4%) |
| 65 to 74 Years | 4,960 (100.0%) | 0 (0.0%) |
| 75 Years and older | 2,602 (100.0%) | 0 (0.0%) |
| Total | 21,942 (94.7%) | 1,232 (5.3%) |
Health Insurance Coverage by Citizenship Status in Pacific County
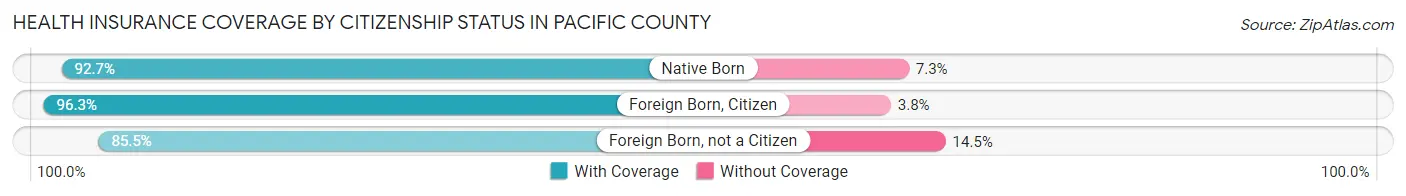
| Citizenship Status | With Coverage | Without Coverage |
| Native Born | 930 (92.7%) | 73 (7.3%) |
| Foreign Born, Citizen | 2,672 (96.3%) | 104 (3.7%) |
| Foreign Born, not a Citizen | 1,007 (85.5%) | 171 (14.5%) |
Health Insurance Coverage by Household Income in Pacific County
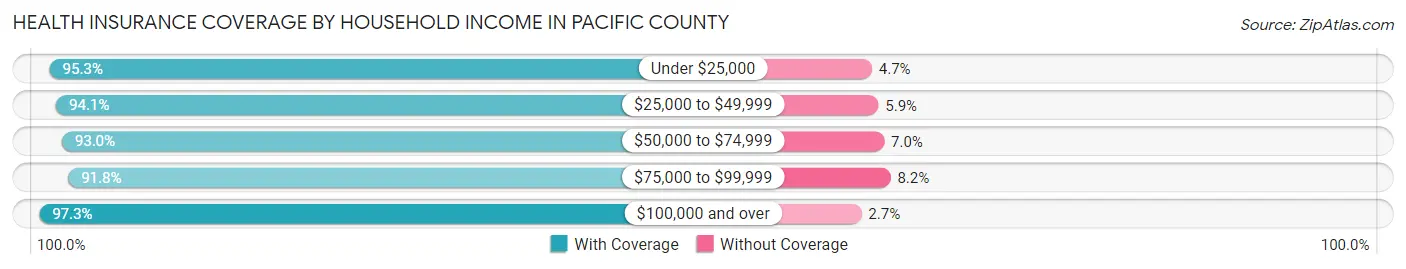
| Household Income | With Coverage | Without Coverage |
| Under $25,000 | 2,927 (95.3%) | 144 (4.7%) |
| $25,000 to $49,999 | 3,839 (94.1%) | 241 (5.9%) |
| $50,000 to $74,999 | 4,154 (93.0%) | 312 (7.0%) |
| $75,000 to $99,999 | 3,366 (91.8%) | 300 (8.2%) |
| $100,000 and over | 7,586 (97.3%) | 214 (2.7%) |
Public vs Private Health Insurance Coverage by Age in Pacific County
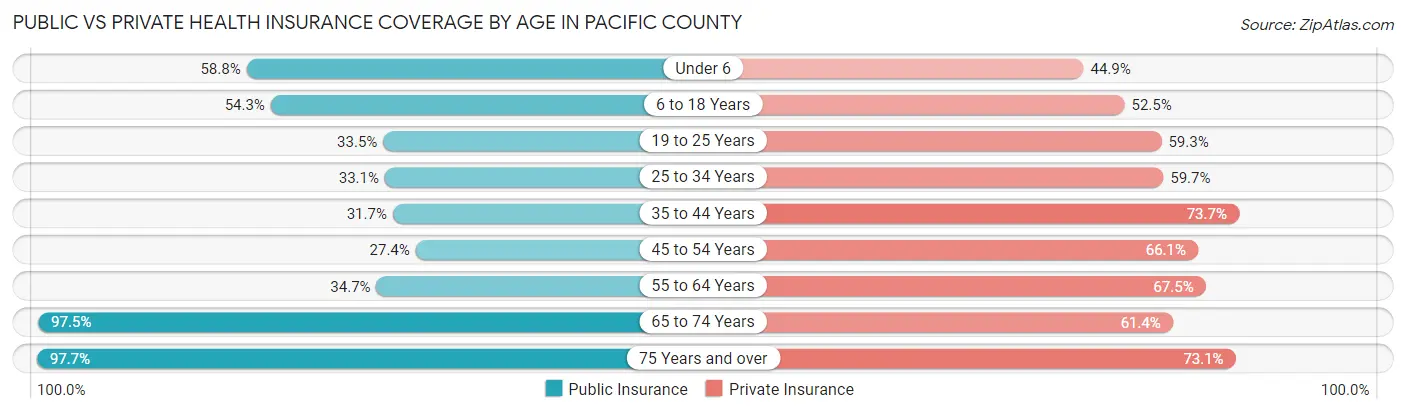
| Age Bracket | Public Insurance | Private Insurance |
| Under 6 | 590 (58.8%) | 450 (44.9%) |
| 6 to 18 Years | 1,508 (54.3%) | 1,457 (52.5%) |
| 19 to 25 Years | 394 (33.5%) | 699 (59.3%) |
| 25 to 34 Years | 581 (33.1%) | 1,046 (59.7%) |
| 35 to 44 Years | 764 (31.7%) | 1,777 (73.7%) |
| 45 to 54 Years | 686 (27.4%) | 1,653 (66.1%) |
| 55 to 64 Years | 1,384 (34.7%) | 2,692 (67.5%) |
| 65 to 74 Years | 4,836 (97.5%) | 3,046 (61.4%) |
| 75 Years and over | 2,543 (97.7%) | 1,901 (73.1%) |
| Total | 13,286 (57.3%) | 14,721 (63.5%) |
Disability Status by Sex by Age in Pacific County
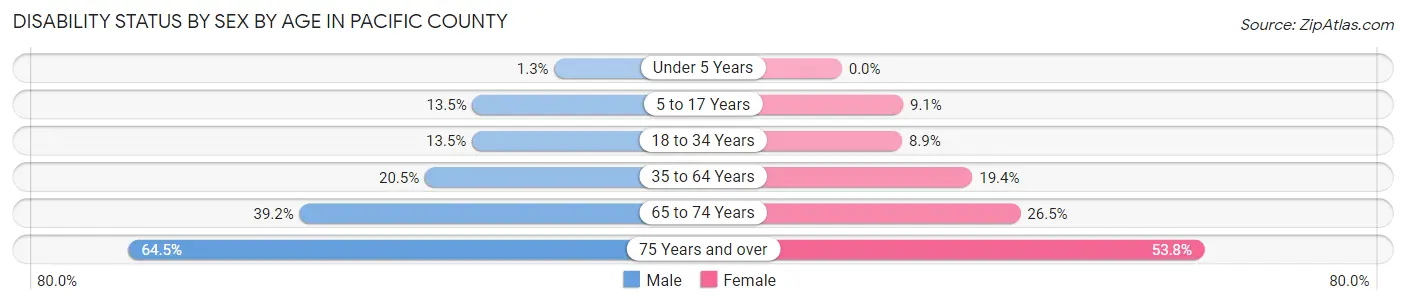
| Age Bracket | Male | Female |
| Under 5 Years | 6 (1.3%) | 0 (0.0%) |
| 5 to 17 Years | 192 (13.5%) | 118 (9.1%) |
| 18 to 34 Years | 220 (13.5%) | 139 (8.9%) |
| 35 to 64 Years | 902 (20.5%) | 874 (19.4%) |
| 65 to 74 Years | 940 (39.2%) | 679 (26.5%) |
| 75 Years and over | 821 (64.5%) | 715 (53.8%) |
Disability Class by Sex by Age in Pacific County
Disability Class: Hearing Difficulty
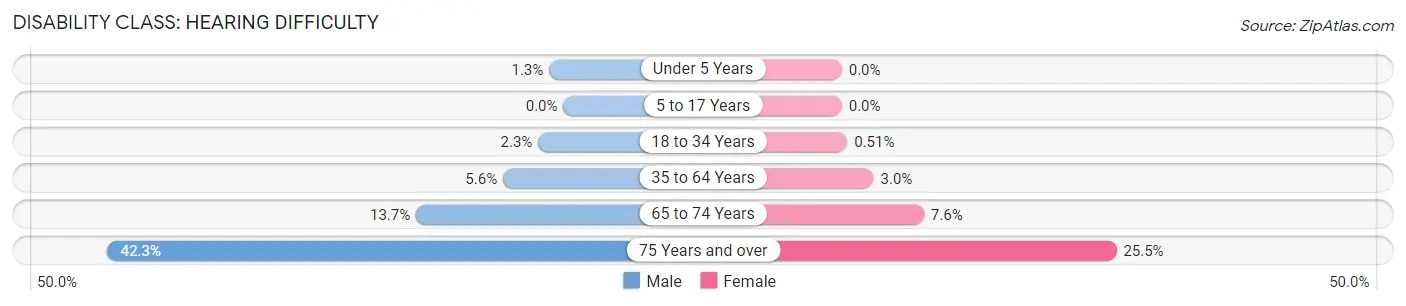
| Age Bracket | Male | Female |
| Under 5 Years | 6 (1.3%) | 0 (0.0%) |
| 5 to 17 Years | 0 (0.0%) | 0 (0.0%) |
| 18 to 34 Years | 38 (2.3%) | 8 (0.5%) |
| 35 to 64 Years | 246 (5.6%) | 133 (2.9%) |
| 65 to 74 Years | 328 (13.7%) | 195 (7.6%) |
| 75 Years and over | 538 (42.3%) | 339 (25.5%) |
Disability Class: Vision Difficulty
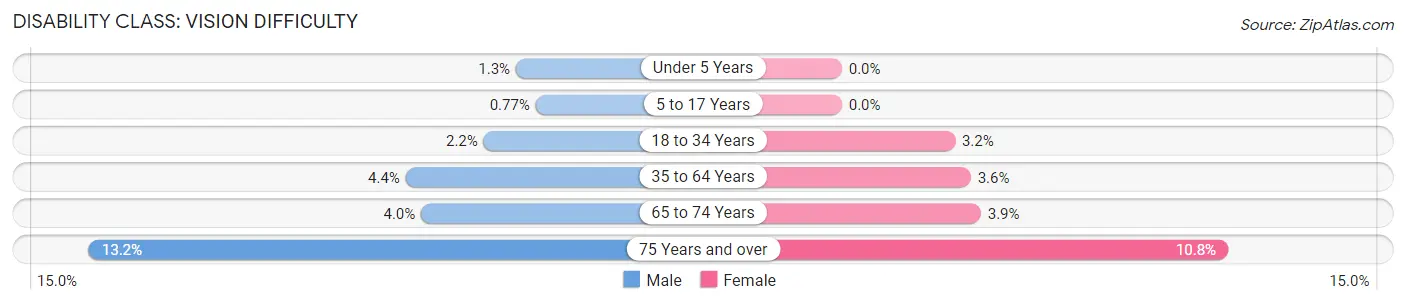
| Age Bracket | Male | Female |
| Under 5 Years | 6 (1.3%) | 0 (0.0%) |
| 5 to 17 Years | 11 (0.8%) | 0 (0.0%) |
| 18 to 34 Years | 36 (2.2%) | 49 (3.2%) |
| 35 to 64 Years | 193 (4.4%) | 162 (3.6%) |
| 65 to 74 Years | 95 (4.0%) | 99 (3.9%) |
| 75 Years and over | 168 (13.2%) | 143 (10.7%) |
Disability Class: Cognitive Difficulty
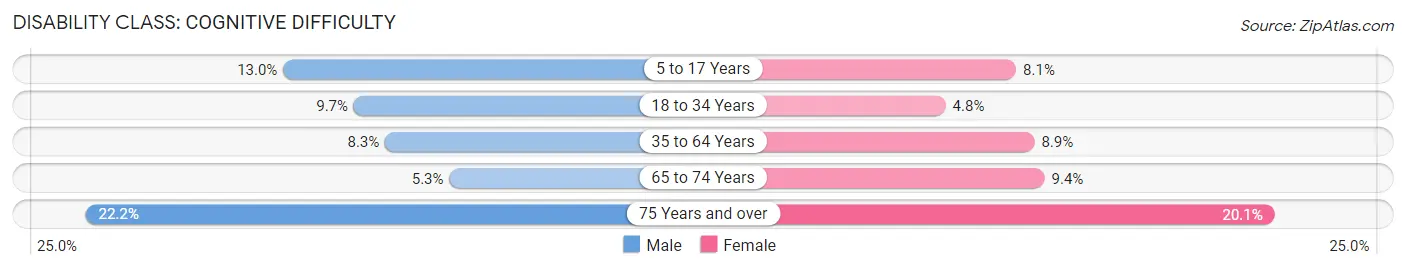
| Age Bracket | Male | Female |
| 5 to 17 Years | 185 (13.0%) | 105 (8.1%) |
| 18 to 34 Years | 158 (9.7%) | 75 (4.8%) |
| 35 to 64 Years | 363 (8.3%) | 403 (8.9%) |
| 65 to 74 Years | 127 (5.3%) | 241 (9.4%) |
| 75 Years and over | 282 (22.2%) | 267 (20.1%) |
Disability Class: Ambulatory Difficulty
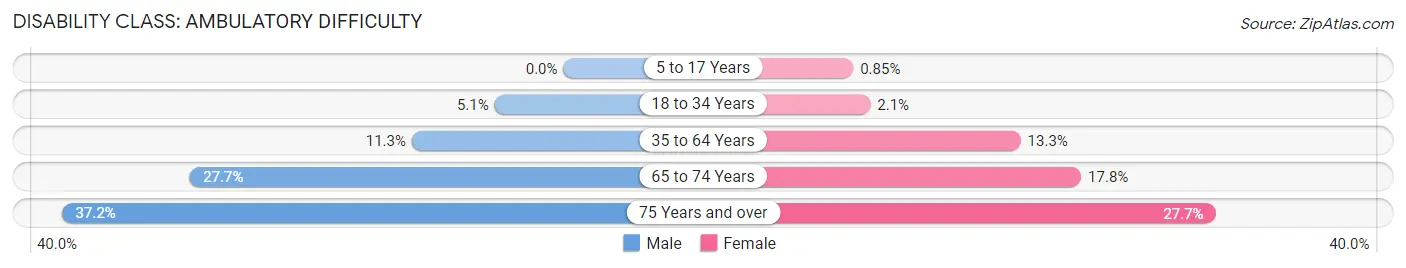
| Age Bracket | Male | Female |
| 5 to 17 Years | 0 (0.0%) | 11 (0.9%) |
| 18 to 34 Years | 83 (5.1%) | 33 (2.1%) |
| 35 to 64 Years | 494 (11.3%) | 599 (13.3%) |
| 65 to 74 Years | 665 (27.7%) | 455 (17.8%) |
| 75 Years and over | 473 (37.2%) | 369 (27.7%) |
Disability Class: Self-Care Difficulty
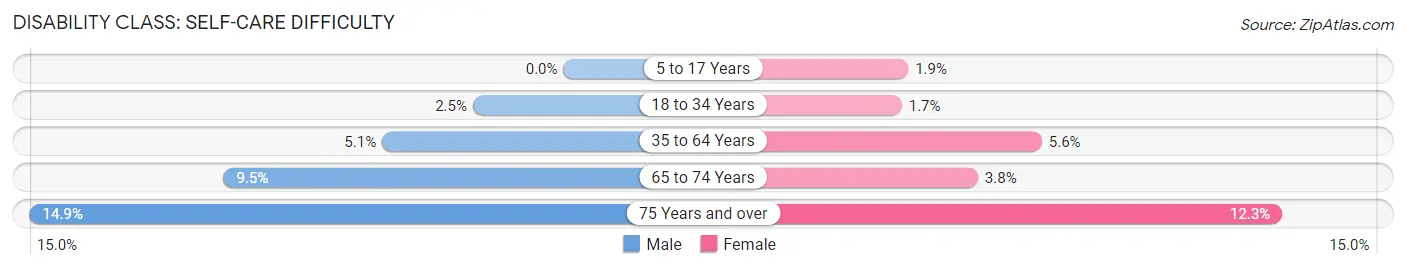
| Age Bracket | Male | Female |
| 5 to 17 Years | 0 (0.0%) | 24 (1.8%) |
| 18 to 34 Years | 41 (2.5%) | 26 (1.7%) |
| 35 to 64 Years | 222 (5.1%) | 251 (5.6%) |
| 65 to 74 Years | 227 (9.5%) | 97 (3.8%) |
| 75 Years and over | 189 (14.9%) | 163 (12.3%) |
Technology Access in Pacific County
Computing Device Access in Pacific County
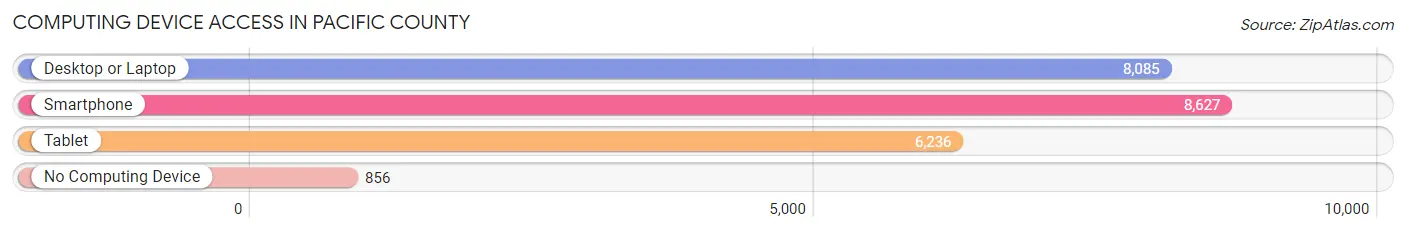
| Device Type | # Households | % Households |
| Desktop or Laptop | 8,085 | 75.6% |
| Smartphone | 8,627 | 80.7% |
| Tablet | 6,236 | 58.3% |
| No Computing Device | 856 | 8.0% |
| Total | 10,689 | 100.0% |
Internet Access in Pacific County
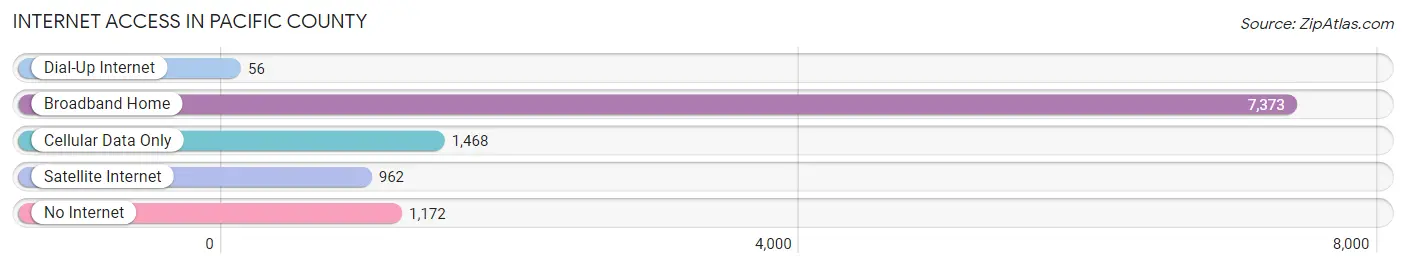
| Internet Type | # Households | % Households |
| Dial-Up Internet | 56 | 0.5% |
| Broadband Home | 7,373 | 69.0% |
| Cellular Data Only | 1,468 | 13.7% |
| Satellite Internet | 962 | 9.0% |
| No Internet | 1,172 | 11.0% |
| Total | 10,689 | 100.0% |
Pacific County Summary
Introduction
Pacific County is located in the southwestern corner of Washington State, and is bordered by the Pacific Ocean to the west, the Columbia River to the east, and the Willapa Bay to the south. It is the most southwestern county in the state, and is home to a population of approximately 20,000 people. The county is known for its natural beauty, with its rugged coastline, lush forests, and abundant wildlife. It is also home to a variety of industries, including fishing, logging, and tourism.
History
The area that is now Pacific County was first inhabited by the Chinook and Quinault Native American tribes. The first European settlers arrived in the area in the early 1800s, and the county was officially established in 1851. The county was named after the Pacific Ocean, which borders it to the west.
In the late 1800s, the county experienced a period of rapid growth, as settlers moved to the area to take advantage of the abundant natural resources. Logging and fishing were the primary industries, and the county quickly became a major producer of timber and seafood.
In the early 1900s, the county began to diversify its economy, with the development of tourism and other industries. The county also experienced a population boom, as people moved to the area to take advantage of the economic opportunities.
Geography
Pacific County is located in the southwestern corner of Washington State, and is bordered by the Pacific Ocean to the west, the Columbia River to the east, and the Willapa Bay to the south. The county covers an area of 1,788 square miles, and is home to a variety of landscapes, including rugged coastline, lush forests, and rolling hills.
The county is divided into two distinct regions: the North Coast and the South Coast. The North Coast is characterized by its rugged coastline, with rocky cliffs and sandy beaches. The South Coast is more rural, with rolling hills and lush forests.
Economy
Pacific County’s economy is largely based on natural resources, with fishing, logging, and tourism being the primary industries. The county is also home to a variety of other industries, including manufacturing, retail, and healthcare.
Fishing is the county’s largest industry, with the majority of the catch being sold to markets in Seattle and Portland. The county is also home to a number of logging companies, which harvest timber from the county’s forests. Tourism is also an important part of the economy, with visitors coming to the area to enjoy the natural beauty and recreational opportunities.
Demographics
As of the 2010 census, Pacific County had a population of 20,920. The population is largely white (90.2%), with small percentages of other races, including Native American (2.2%), Asian (1.7%), and African American (0.7%). The median household income is $45,845, and the median age is 44.
Conclusion
Pacific County is a beautiful and diverse county located in the southwestern corner of Washington State. It is home to a variety of industries, including fishing, logging, and tourism, and is known for its natural beauty and abundant wildlife. The county is also home to a diverse population, with a median household income of $45,845 and a median age of 44.
Common Questions
What is the Total Population of Pacific County?
Total Population of Pacific County is 23,396.
What is the Total Male Population of Pacific County?
Total Male Population of Pacific County is 11,714.
What is the Total Female Population of Pacific County?
Total Female Population of Pacific County is 11,682.
What is the Ratio of Males per 100 Females in Pacific County?
There are 100.27 Males per 100 Females in Pacific County.
What is the Ratio of Females per 100 Males in Pacific County?
There are 99.73 Females per 100 Males in Pacific County.
What is the Median Population Age in Pacific County?
Median Population Age in Pacific County is 54.7 Years.
What is the Average Family Size in Pacific County
Average Family Size in Pacific County is 2.6 People.
What is the Average Household Size in Pacific County
Average Household Size in Pacific County is 2.2 People.
What is Per Capita Income in Pacific County?
Per Capita income in Pacific County is $36,899.
What is the Median Family Income in Pacific County?
Median Family Income in Pacific County is $77,574.
What is the Median Household income in Pacific County?
Median Household Income in Pacific County is $58,889.
What is Income or Wage Gap in Pacific County?
Income or Wage Gap in Pacific County is 24.4%.
Women in Pacific County earn 75.6 cents for every dollar earned by a man.
What is Family Income Deficit in Pacific County?
Family Income Deficit in Pacific County is $10,262.
Families that are below poverty line in Pacific County earn $10,262 less on average than the poverty threshold level.
What is Inequality or Gini Index in Pacific County?
Inequality or Gini Index in Pacific County is 0.46.
How Large is the Labor Force in Pacific County?
There are 9,285 People in the Labor Forcein in Pacific County.
What is the Percentage of People in the Labor Force in Pacific County?
45.8% of People are in the Labor Force in Pacific County.
What is the Unemployment Rate in Pacific County?
Unemployment Rate in Pacific County is 4.3%.