Kitsap County, WA
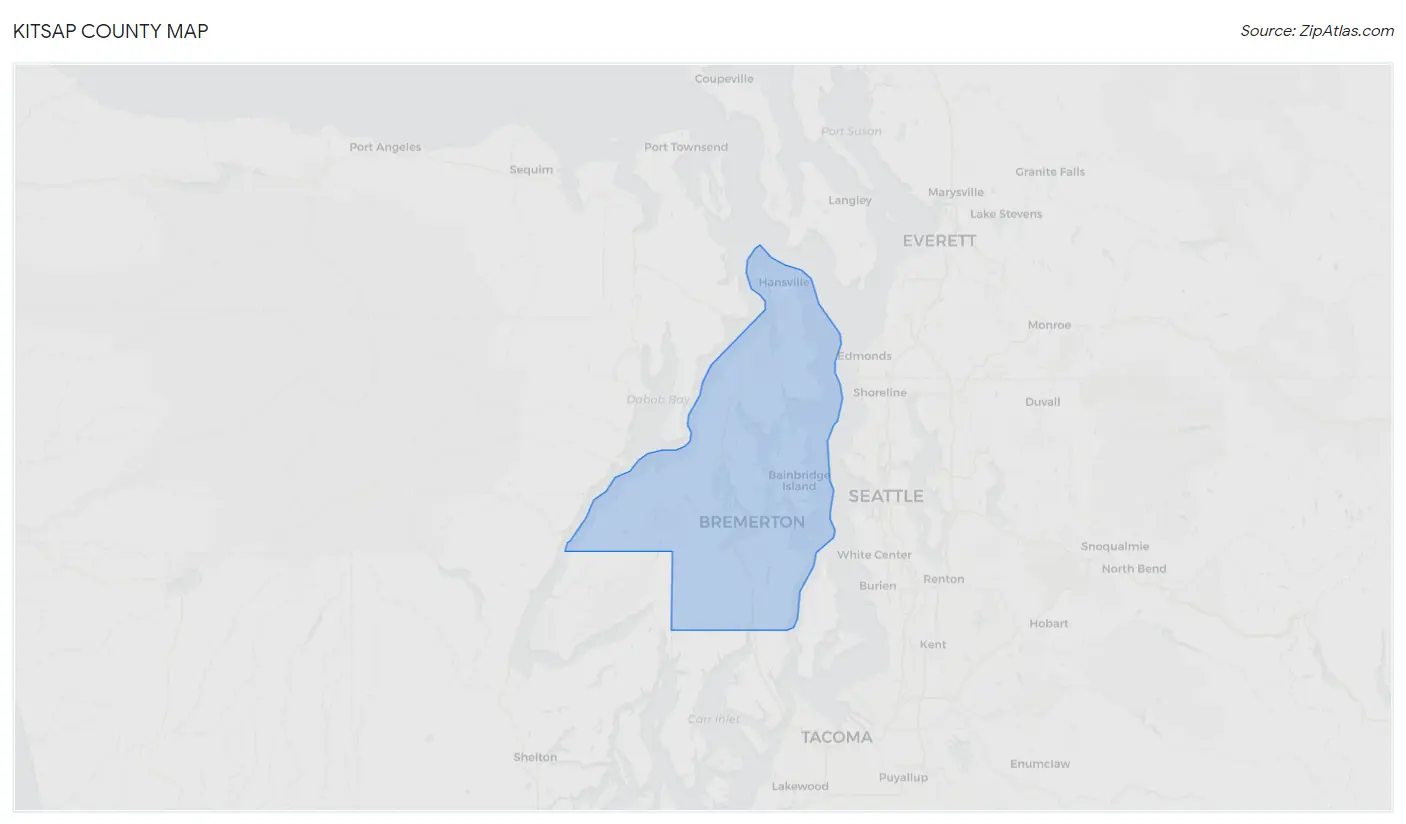
Kitsap County Map
Kitsap County Overview
275,411
TOTAL POPULATION
141,665
MALE POPULATION
133,746
FEMALE POPULATION
105.92
MALES / 100 FEMALES
94.41
FEMALES / 100 MALES
39.7
MEDIAN AGE
3.0
AVG FAMILY SIZE
2.5
AVG HOUSEHOLD SIZE
$47,713
PER CAPITA INCOME
$109,621
AVG FAMILY INCOME
$93,675
AVG HOUSEHOLD INCOME
34.4%
WAGE / INCOME GAP [ % ]
65.6¢/ $1
WAGE / INCOME GAP [ $ ]
$12,277
FAMILY INCOME DEFICIT
0.43
INEQUALITY / GINI INDEX
139,783
LABOR FORCE [ PEOPLE ]
61.7%
PERCENT IN LABOR FORCE
4.7%
UNEMPLOYMENT RATE
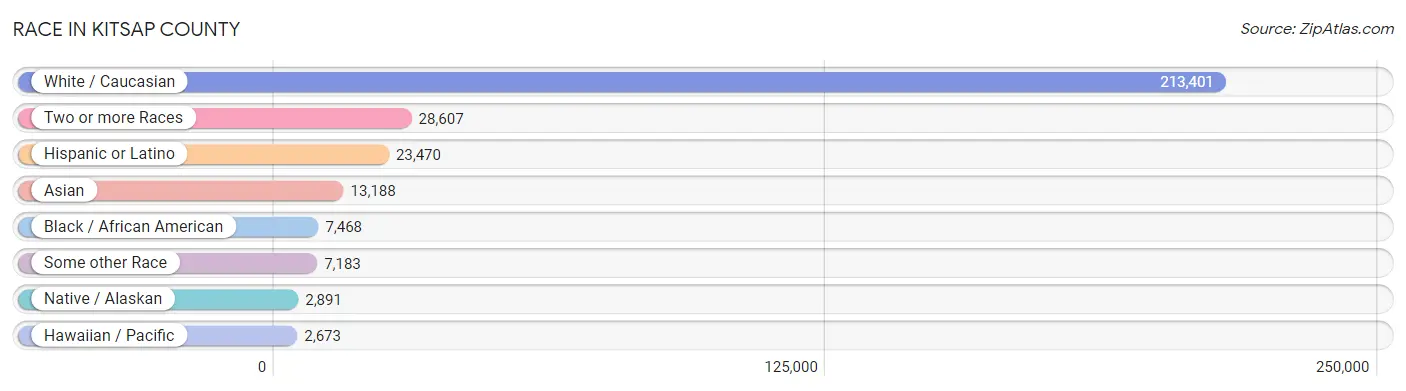
Race in Kitsap County
The most populous races in Kitsap County are White / Caucasian (213,401 | 77.5%), Two or more Races (28,607 | 10.4%), and Hispanic or Latino (23,470 | 8.5%).
| Race | # Population | % Population |
| Asian | 13,188 | 4.8% |
| Black / African American | 7,468 | 2.7% |
| Hawaiian / Pacific | 2,673 | 1.0% |
| Hispanic or Latino | 23,470 | 8.5% |
| Native / Alaskan | 2,891 | 1.1% |
| White / Caucasian | 213,401 | 77.5% |
| Two or more Races | 28,607 | 10.4% |
| Some other Race | 7,183 | 2.6% |
| Total | 275,411 | 100.0% |
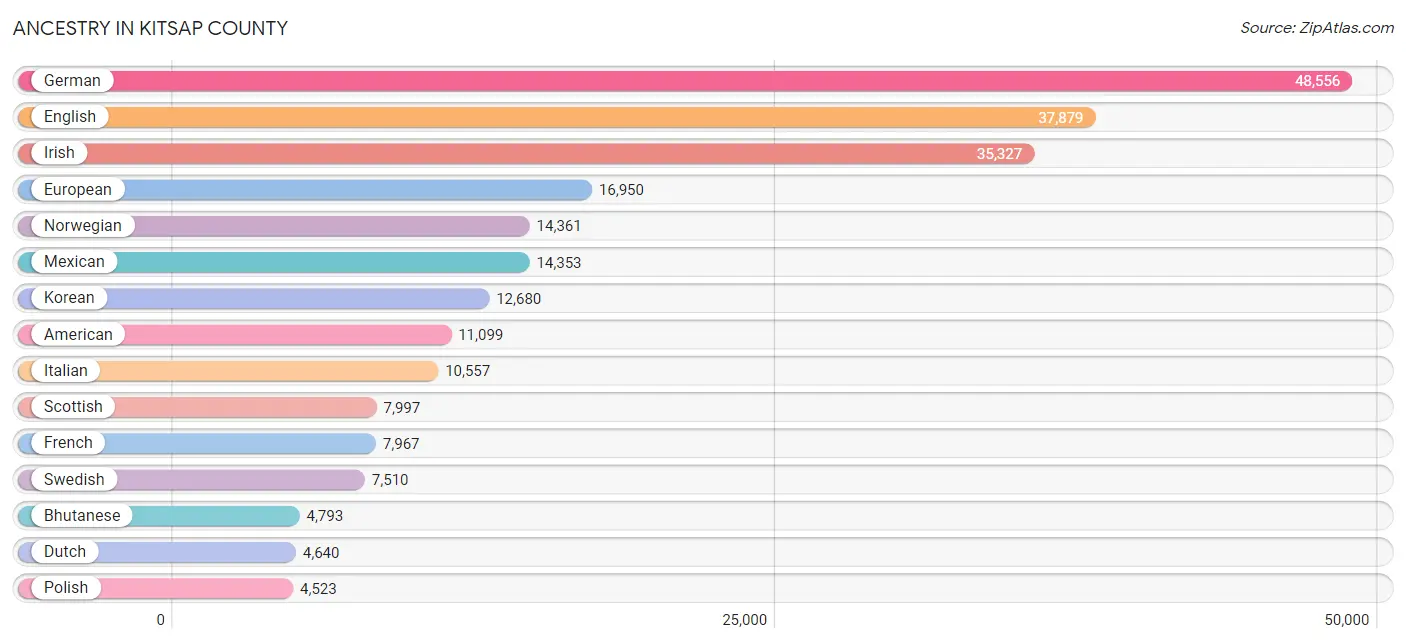
Ancestry in Kitsap County
The most populous ancestries reported in Kitsap County are German (48,556 | 17.6%), English (37,879 | 13.8%), Irish (35,327 | 12.8%), European (16,950 | 6.1%), and Norwegian (14,361 | 5.2%), together accounting for 55.6% of all Kitsap County residents.
| Ancestry | # Population | % Population |
| African | 518 | 0.2% |
| Alaska Native | 36 | 0.0% |
| Alaskan Athabascan | 59 | 0.0% |
| Aleut | 194 | 0.1% |
| Alsatian | 20 | 0.0% |
| American | 11,099 | 4.0% |
| Apache | 175 | 0.1% |
| Arab | 734 | 0.3% |
| Argentinean | 93 | 0.0% |
| Armenian | 191 | 0.1% |
| Australian | 59 | 0.0% |
| Austrian | 528 | 0.2% |
| Bahamian | 28 | 0.0% |
| Bangladeshi | 34 | 0.0% |
| Barbadian | 38 | 0.0% |
| Basque | 339 | 0.1% |
| Belgian | 157 | 0.1% |
| Bermudan | 2 | 0.0% |
| Bhutanese | 4,793 | 1.7% |
| Blackfeet | 354 | 0.1% |
| Bolivian | 20 | 0.0% |
| Brazilian | 107 | 0.0% |
| British | 3,015 | 1.1% |
| British West Indian | 26 | 0.0% |
| Burmese | 1,645 | 0.6% |
| Cajun | 23 | 0.0% |
| Canadian | 650 | 0.2% |
| Celtic | 114 | 0.0% |
| Central American | 2,247 | 0.8% |
| Central American Indian | 121 | 0.0% |
| Cherokee | 1,550 | 0.6% |
| Cheyenne | 3 | 0.0% |
| Chickasaw | 140 | 0.1% |
| Chilean | 88 | 0.0% |
| Chinese | 2 | 0.0% |
| Chippewa | 409 | 0.2% |
| Choctaw | 196 | 0.1% |
| Colombian | 282 | 0.1% |
| Colville | 26 | 0.0% |
| Comanche | 12 | 0.0% |
| Costa Rican | 56 | 0.0% |
| Cree | 63 | 0.0% |
| Creek | 63 | 0.0% |
| Croatian | 368 | 0.1% |
| Crow | 1 | 0.0% |
| Cuban | 424 | 0.2% |
| Czech | 1,144 | 0.4% |
| Czechoslovakian | 197 | 0.1% |
| Danish | 2,572 | 0.9% |
| Dominican | 65 | 0.0% |
| Dutch | 4,640 | 1.7% |
| Eastern European | 717 | 0.3% |
| Ecuadorian | 166 | 0.1% |
| English | 37,879 | 13.8% |
| Estonian | 47 | 0.0% |
| Ethiopian | 5 | 0.0% |
| European | 16,950 | 6.1% |
| Fijian | 214 | 0.1% |
| Filipino | 56 | 0.0% |
| Finnish | 1,936 | 0.7% |
| French | 7,967 | 2.9% |
| French American Indian | 101 | 0.0% |
| French Canadian | 2,345 | 0.9% |
| German | 48,556 | 17.6% |
| German Russian | 11 | 0.0% |
| Ghanaian | 18 | 0.0% |
| Greek | 801 | 0.3% |
| Guamanian / Chamorro | 2,175 | 0.8% |
| Guatemalan | 1,153 | 0.4% |
| Guyanese | 118 | 0.0% |
| Haitian | 171 | 0.1% |
| Honduran | 114 | 0.0% |
| Hopi | 2 | 0.0% |
| Hungarian | 715 | 0.3% |
| Icelander | 222 | 0.1% |
| Indian (Asian) | 2,504 | 0.9% |
| Indonesian | 13 | 0.0% |
| Inupiat | 44 | 0.0% |
| Iranian | 117 | 0.0% |
| Irish | 35,327 | 12.8% |
| Iroquois | 41 | 0.0% |
| Israeli | 40 | 0.0% |
| Italian | 10,557 | 3.8% |
| Jamaican | 403 | 0.2% |
| Japanese | 92 | 0.0% |
| Kenyan | 142 | 0.1% |
| Kiowa | 20 | 0.0% |
| Korean | 12,680 | 4.6% |
| Laotian | 321 | 0.1% |
| Latvian | 124 | 0.1% |
| Lebanese | 350 | 0.1% |
| Liberian | 2 | 0.0% |
| Lithuanian | 377 | 0.1% |
| Lumbee | 1 | 0.0% |
| Luxembourger | 17 | 0.0% |
| Macedonian | 127 | 0.1% |
| Malaysian | 96 | 0.0% |
| Maltese | 1 | 0.0% |
| Marshallese | 228 | 0.1% |
| Mexican | 14,353 | 5.2% |
| Mexican American Indian | 255 | 0.1% |
| Mongolian | 17 | 0.0% |
| Moroccan | 95 | 0.0% |
| Native Hawaiian | 1,289 | 0.5% |
| Navajo | 188 | 0.1% |
| New Zealander | 4 | 0.0% |
| Nicaraguan | 109 | 0.0% |
| Nigerian | 123 | 0.0% |
| Northern European | 1,587 | 0.6% |
| Norwegian | 14,361 | 5.2% |
| Okinawan | 7 | 0.0% |
| Osage | 5 | 0.0% |
| Ottawa | 31 | 0.0% |
| Pakistani | 295 | 0.1% |
| Palestinian | 99 | 0.0% |
| Panamanian | 198 | 0.1% |
| Pennsylvania German | 108 | 0.0% |
| Peruvian | 65 | 0.0% |
| Polish | 4,523 | 1.6% |
| Portuguese | 1,349 | 0.5% |
| Potawatomi | 99 | 0.0% |
| Pueblo | 191 | 0.1% |
| Puerto Rican | 2,300 | 0.8% |
| Puget Sound Salish | 731 | 0.3% |
| Romanian | 169 | 0.1% |
| Russian | 2,070 | 0.7% |
| Salvadoran | 617 | 0.2% |
| Samoan | 570 | 0.2% |
| Scandinavian | 3,138 | 1.1% |
| Scotch-Irish | 3,739 | 1.4% |
| Scottish | 7,997 | 2.9% |
| Seminole | 77 | 0.0% |
| Serbian | 76 | 0.0% |
| Shoshone | 19 | 0.0% |
| Sierra Leonean | 6 | 0.0% |
| Sioux | 213 | 0.1% |
| Slavic | 165 | 0.1% |
| Slovak | 294 | 0.1% |
| Slovene | 191 | 0.1% |
| Somali | 28 | 0.0% |
| South African | 71 | 0.0% |
| South American | 876 | 0.3% |
| South American Indian | 7 | 0.0% |
| Spaniard | 1,169 | 0.4% |
| Spanish | 1,010 | 0.4% |
| Spanish American | 26 | 0.0% |
| Sri Lankan | 1,362 | 0.5% |
| Subsaharan African | 992 | 0.4% |
| Swedish | 7,510 | 2.7% |
| Swiss | 934 | 0.3% |
| Thai | 1,024 | 0.4% |
| Tlingit-Haida | 276 | 0.1% |
| Tohono O'Odham | 54 | 0.0% |
| Trinidadian and Tobagonian | 136 | 0.1% |
| Tsimshian | 7 | 0.0% |
| Turkish | 86 | 0.0% |
| Ugandan | 32 | 0.0% |
| Ukrainian | 907 | 0.3% |
| Ute | 8 | 0.0% |
| Venezuelan | 149 | 0.1% |
| Welsh | 2,821 | 1.0% |
| West Indian | 5 | 0.0% |
| Yakama | 59 | 0.0% |
| Yaqui | 37 | 0.0% |
| Yugoslavian | 301 | 0.1% |
| Yup'ik | 67 | 0.0% | View All 166 Rows |
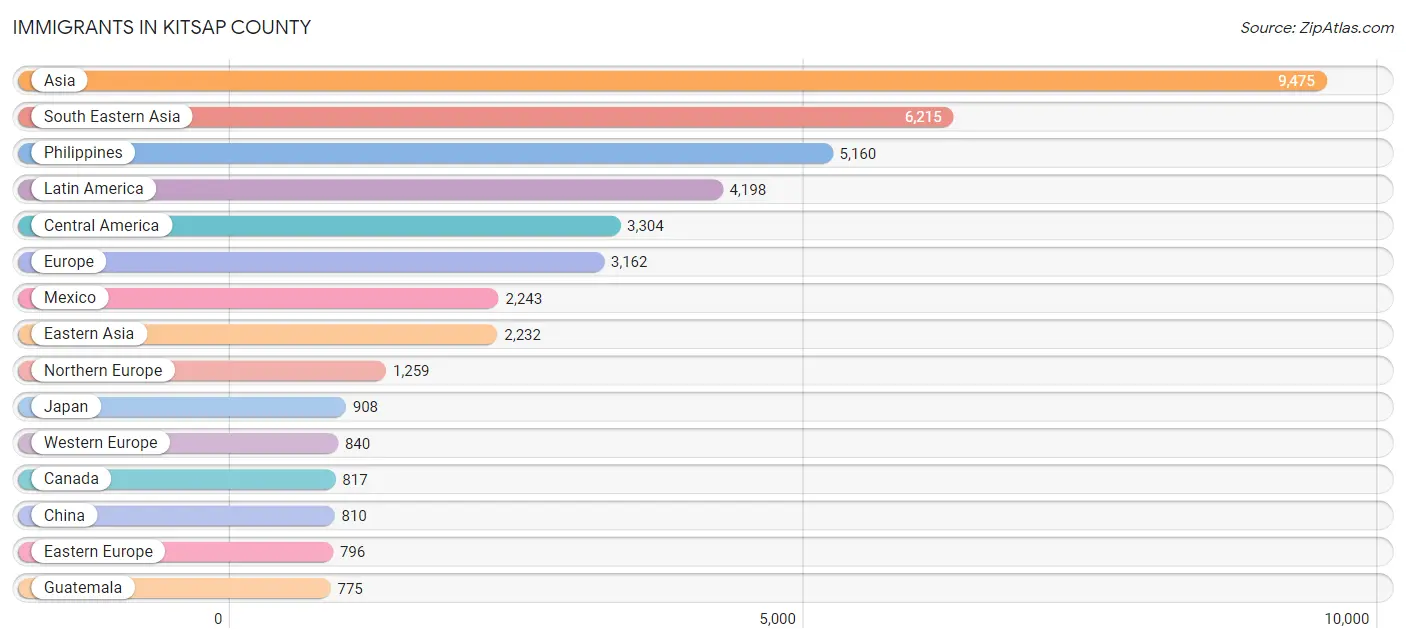
Immigrants in Kitsap County
The most numerous immigrant groups reported in Kitsap County came from Asia (9,475 | 3.4%), South Eastern Asia (6,215 | 2.3%), Philippines (5,160 | 1.9%), Latin America (4,198 | 1.5%), and Central America (3,304 | 1.2%), together accounting for 10.3% of all Kitsap County residents.
| Immigration Origin | # Population | % Population |
| Africa | 486 | 0.2% |
| Argentina | 113 | 0.0% |
| Asia | 9,475 | 3.4% |
| Australia | 140 | 0.1% |
| Austria | 15 | 0.0% |
| Bahamas | 15 | 0.0% |
| Barbados | 12 | 0.0% |
| Belarus | 4 | 0.0% |
| Belgium | 3 | 0.0% |
| Bolivia | 3 | 0.0% |
| Bosnia and Herzegovina | 17 | 0.0% |
| Brazil | 88 | 0.0% |
| Cambodia | 2 | 0.0% |
| Cameroon | 10 | 0.0% |
| Canada | 817 | 0.3% |
| Caribbean | 405 | 0.2% |
| Central America | 3,304 | 1.2% |
| Chile | 14 | 0.0% |
| China | 810 | 0.3% |
| Colombia | 114 | 0.0% |
| Costa Rica | 4 | 0.0% |
| Croatia | 42 | 0.0% |
| Cuba | 79 | 0.0% |
| Czechoslovakia | 31 | 0.0% |
| Denmark | 17 | 0.0% |
| Dominican Republic | 28 | 0.0% |
| Eastern Africa | 215 | 0.1% |
| Eastern Asia | 2,232 | 0.8% |
| Eastern Europe | 796 | 0.3% |
| Ecuador | 79 | 0.0% |
| Egypt | 9 | 0.0% |
| El Salvador | 252 | 0.1% |
| England | 428 | 0.2% |
| Ethiopia | 5 | 0.0% |
| Europe | 3,162 | 1.1% |
| Fiji | 3 | 0.0% |
| France | 385 | 0.1% |
| Germany | 305 | 0.1% |
| Greece | 12 | 0.0% |
| Guatemala | 775 | 0.3% |
| Guyana | 30 | 0.0% |
| Haiti | 29 | 0.0% |
| Hong Kong | 211 | 0.1% |
| Hungary | 73 | 0.0% |
| India | 435 | 0.2% |
| Indonesia | 200 | 0.1% |
| Iran | 152 | 0.1% |
| Iraq | 13 | 0.0% |
| Ireland | 146 | 0.1% |
| Israel | 92 | 0.0% |
| Italy | 155 | 0.1% |
| Jamaica | 169 | 0.1% |
| Japan | 908 | 0.3% |
| Jordan | 16 | 0.0% |
| Kazakhstan | 24 | 0.0% |
| Kenya | 168 | 0.1% |
| Korea | 514 | 0.2% |
| Laos | 35 | 0.0% |
| Latin America | 4,198 | 1.5% |
| Latvia | 11 | 0.0% |
| Lebanon | 105 | 0.0% |
| Liberia | 2 | 0.0% |
| Malaysia | 9 | 0.0% |
| Mexico | 2,243 | 0.8% |
| Micronesia | 286 | 0.1% |
| Middle Africa | 10 | 0.0% |
| Moldova | 12 | 0.0% |
| Morocco | 40 | 0.0% |
| Nepal | 21 | 0.0% |
| Netherlands | 96 | 0.0% |
| Nicaragua | 11 | 0.0% |
| Nigeria | 29 | 0.0% |
| North Macedonia | 118 | 0.0% |
| Northern Africa | 84 | 0.0% |
| Northern Europe | 1,259 | 0.5% |
| Norway | 147 | 0.1% |
| Oceania | 593 | 0.2% |
| Pakistan | 93 | 0.0% |
| Panama | 19 | 0.0% |
| Peru | 13 | 0.0% |
| Philippines | 5,160 | 1.9% |
| Poland | 69 | 0.0% |
| Romania | 58 | 0.0% |
| Russia | 210 | 0.1% |
| Scotland | 76 | 0.0% |
| Sierra Leone | 6 | 0.0% |
| Singapore | 18 | 0.0% |
| Somalia | 2 | 0.0% |
| South Africa | 137 | 0.1% |
| South America | 489 | 0.2% |
| South Central Asia | 725 | 0.3% |
| South Eastern Asia | 6,215 | 2.3% |
| Southern Europe | 267 | 0.1% |
| Spain | 100 | 0.0% |
| St. Vincent and the Grenadines | 15 | 0.0% |
| Sweden | 67 | 0.0% |
| Switzerland | 36 | 0.0% |
| Taiwan | 138 | 0.1% |
| Thailand | 168 | 0.1% |
| Trinidad and Tobago | 44 | 0.0% |
| Turkey | 49 | 0.0% |
| Uganda | 31 | 0.0% |
| Ukraine | 138 | 0.1% |
| Venezuela | 35 | 0.0% |
| Vietnam | 623 | 0.2% |
| Western Africa | 37 | 0.0% |
| Western Asia | 275 | 0.1% |
| Western Europe | 840 | 0.3% | View All 108 Rows |
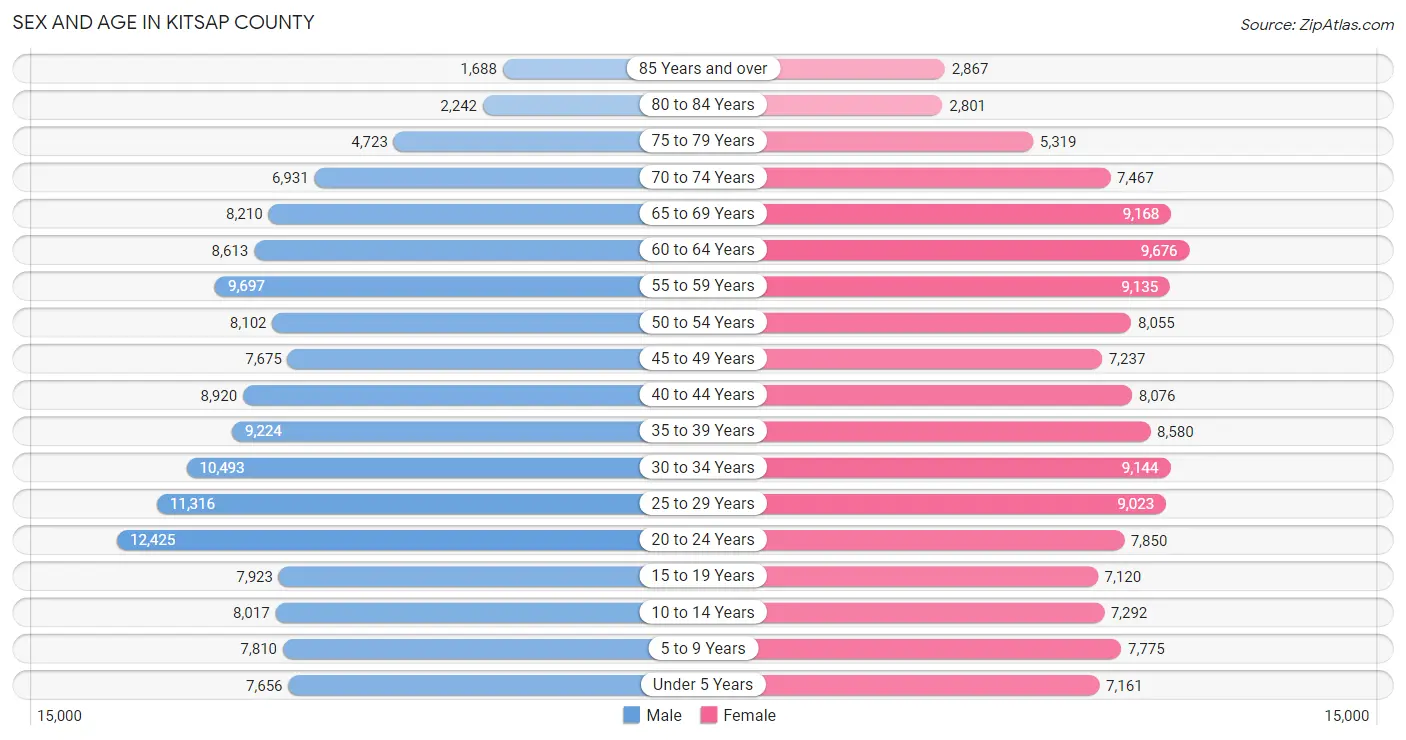
Sex and Age in Kitsap County
Sex and Age in Kitsap County
The most populous age groups in Kitsap County are 20 to 24 Years (12,425 | 8.8%) for men and 60 to 64 Years (9,676 | 7.2%) for women.
| Age Bracket | Male | Female |
| Under 5 Years | 7,656 (5.4%) | 7,161 (5.3%) |
| 5 to 9 Years | 7,810 (5.5%) | 7,775 (5.8%) |
| 10 to 14 Years | 8,017 (5.7%) | 7,292 (5.4%) |
| 15 to 19 Years | 7,923 (5.6%) | 7,120 (5.3%) |
| 20 to 24 Years | 12,425 (8.8%) | 7,850 (5.9%) |
| 25 to 29 Years | 11,316 (8.0%) | 9,023 (6.8%) |
| 30 to 34 Years | 10,493 (7.4%) | 9,144 (6.8%) |
| 35 to 39 Years | 9,224 (6.5%) | 8,580 (6.4%) |
| 40 to 44 Years | 8,920 (6.3%) | 8,076 (6.0%) |
| 45 to 49 Years | 7,675 (5.4%) | 7,237 (5.4%) |
| 50 to 54 Years | 8,102 (5.7%) | 8,055 (6.0%) |
| 55 to 59 Years | 9,697 (6.9%) | 9,135 (6.8%) |
| 60 to 64 Years | 8,613 (6.1%) | 9,676 (7.2%) |
| 65 to 69 Years | 8,210 (5.8%) | 9,168 (6.9%) |
| 70 to 74 Years | 6,931 (4.9%) | 7,467 (5.6%) |
| 75 to 79 Years | 4,723 (3.3%) | 5,319 (4.0%) |
| 80 to 84 Years | 2,242 (1.6%) | 2,801 (2.1%) |
| 85 Years and over | 1,688 (1.2%) | 2,867 (2.1%) |
| Total | 141,665 (100.0%) | 133,746 (100.0%) |
Families and Households in Kitsap County
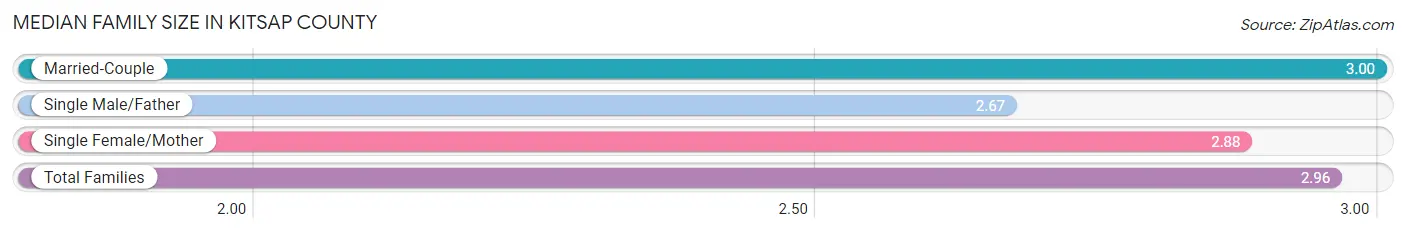
Median Family Size in Kitsap County
The median family size in Kitsap County is 2.96 persons per family, with married-couple families (57,104 | 79.1%) accounting for the largest median family size of 3 persons per family. On the other hand, single male/father families (5,335 | 7.4%) represent the smallest median family size with 2.67 persons per family.
| Family Type | # Families | Family Size |
| Married-Couple | 57,104 (79.1%) | 3.00 |
| Single Male/Father | 5,335 (7.4%) | 2.67 |
| Single Female/Mother | 9,772 (13.5%) | 2.88 |
| Total Families | 72,211 (100.0%) | 2.96 |
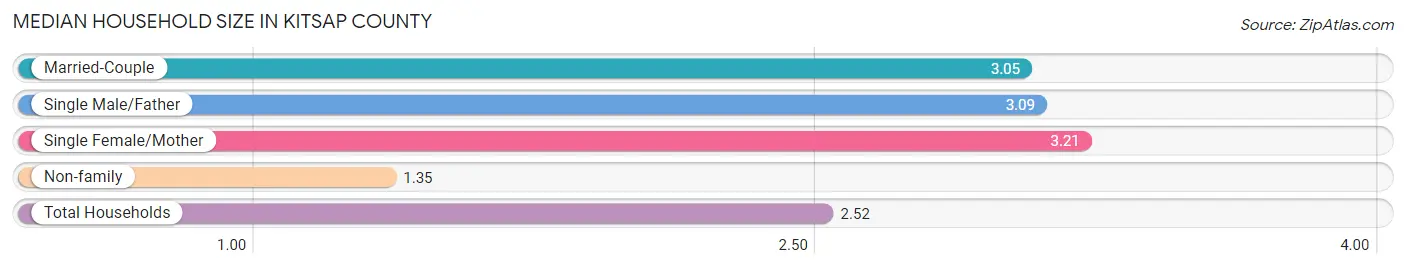
Median Household Size in Kitsap County
The median household size in Kitsap County is 2.52 persons per household, with single female/mother households (9,772 | 9.2%) accounting for the largest median household size of 3.21 persons per household. non-family households (33,820 | 31.9%) represent the smallest median household size with 1.35 persons per household.
| Household Type | # Households | Household Size |
| Married-Couple | 57,104 (53.9%) | 3.05 |
| Single Male/Father | 5,335 (5.0%) | 3.09 |
| Single Female/Mother | 9,772 (9.2%) | 3.21 |
| Non-family | 33,820 (31.9%) | 1.35 |
| Total Households | 106,031 (100.0%) | 2.52 |
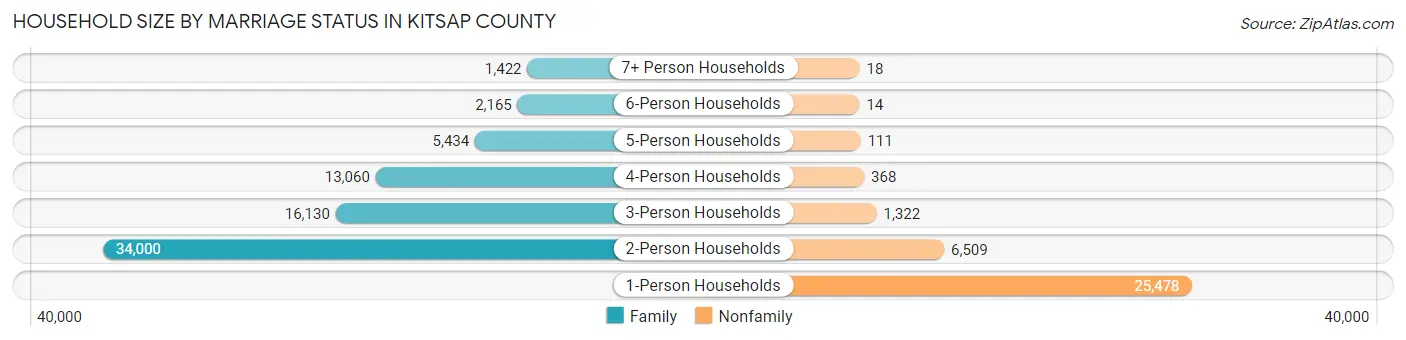
Household Size by Marriage Status in Kitsap County
Out of a total of 106,031 households in Kitsap County, 72,211 (68.1%) are family households, while 33,820 (31.9%) are nonfamily households. The most numerous type of family households are 2-person households, comprising 34,000, and the most common type of nonfamily households are 1-person households, comprising 25,478.
| Household Size | Family Households | Nonfamily Households |
| 1-Person Households | - | 25,478 (24.0%) |
| 2-Person Households | 34,000 (32.1%) | 6,509 (6.1%) |
| 3-Person Households | 16,130 (15.2%) | 1,322 (1.3%) |
| 4-Person Households | 13,060 (12.3%) | 368 (0.4%) |
| 5-Person Households | 5,434 (5.1%) | 111 (0.1%) |
| 6-Person Households | 2,165 (2.0%) | 14 (0.0%) |
| 7+ Person Households | 1,422 (1.3%) | 18 (0.0%) |
| Total | 72,211 (68.1%) | 33,820 (31.9%) |
Female Fertility in Kitsap County
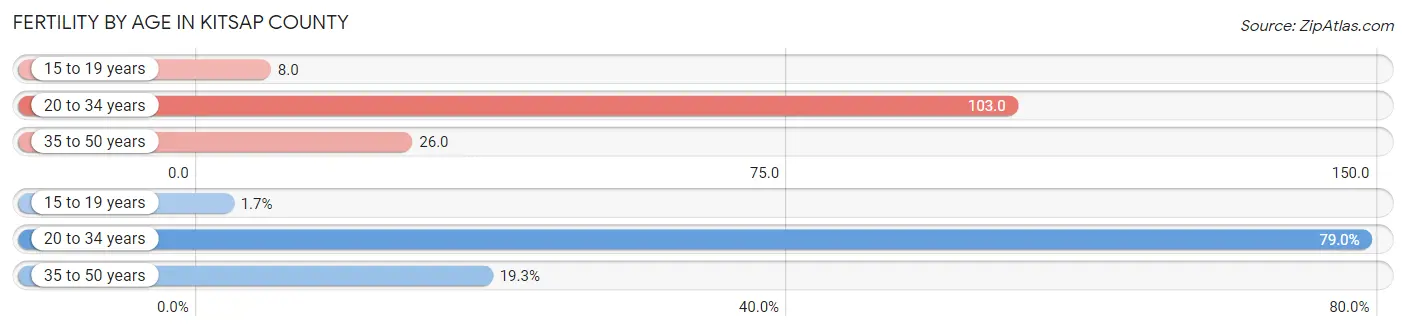
Fertility by Age in Kitsap County
Average fertility rate in Kitsap County is 58.0 births per 1,000 women. Women in the age bracket of 20 to 34 years have the highest fertility rate with 103.0 births per 1,000 women. Women in the age bracket of 20 to 34 years acount for 78.9% of all women with births.
| Age Bracket | Women with Births | Births / 1,000 Women |
| 15 to 19 years | 59 (1.7%) | 8.0 |
| 20 to 34 years | 2,681 (78.9%) | 103.0 |
| 35 to 50 years | 656 (19.3%) | 26.0 |
| Total | 3,396 (100.0%) | 58.0 |
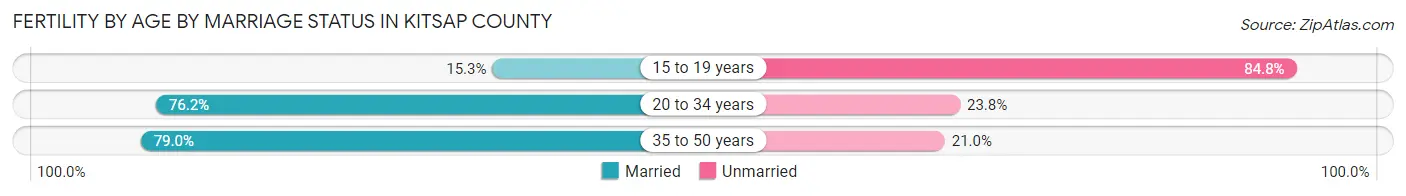
Fertility by Age by Marriage Status in Kitsap County
75.7% of women with births (3,396) in Kitsap County are married. The highest percentage of unmarried women with births falls into 15 to 19 years age bracket with 84.8% of them unmarried at the time of birth, while the lowest percentage of unmarried women with births belong to 35 to 50 years age bracket with 21.0% of them unmarried.
| Age Bracket | Married | Unmarried |
| 15 to 19 years | 9 (15.2%) | 50 (84.8%) |
| 20 to 34 years | 2,043 (76.2%) | 638 (23.8%) |
| 35 to 50 years | 518 (79.0%) | 138 (21.0%) |
| Total | 2,571 (75.7%) | 825 (24.3%) |
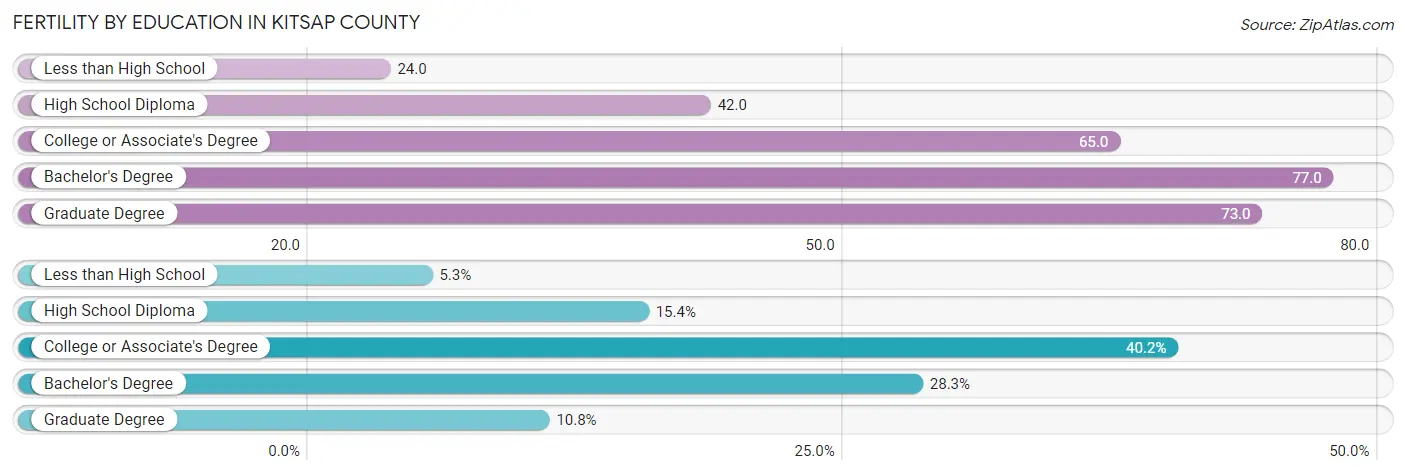
Fertility by Education in Kitsap County
Average fertility rate in Kitsap County is 58.0 births per 1,000 women. Women with the education attainment of bachelor's degree have the highest fertility rate of 77.0 births per 1,000 women, while women with the education attainment of less than high school have the lowest fertility at 24.0 births per 1,000 women. Women with the education attainment of college or associate's degree represent 40.2% of all women with births.
| Educational Attainment | Women with Births | Births / 1,000 Women |
| Less than High School | 180 (5.3%) | 24.0 |
| High School Diploma | 524 (15.4%) | 42.0 |
| College or Associate's Degree | 1,366 (40.2%) | 65.0 |
| Bachelor's Degree | 960 (28.3%) | 77.0 |
| Graduate Degree | 366 (10.8%) | 73.0 |
| Total | 3,396 (100.0%) | 58.0 |
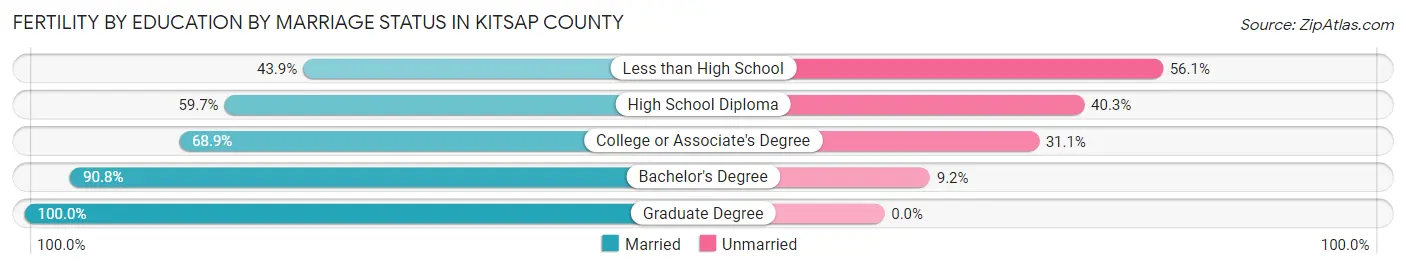
Fertility by Education by Marriage Status in Kitsap County
24.3% of women with births in Kitsap County are unmarried. Women with the educational attainment of graduate degree are most likely to be married with 100.0% of them married at childbirth, while women with the educational attainment of less than high school are least likely to be married with 56.1% of them unmarried at childbirth.
| Educational Attainment | Married | Unmarried |
| Less than High School | 79 (43.9%) | 101 (56.1%) |
| High School Diploma | 313 (59.7%) | 211 (40.3%) |
| College or Associate's Degree | 941 (68.9%) | 425 (31.1%) |
| Bachelor's Degree | 872 (90.8%) | 88 (9.2%) |
| Graduate Degree | 366 (100.0%) | 0 (0.0%) |
| Total | 2,571 (75.7%) | 825 (24.3%) |
Income in Kitsap County
Income Overview in Kitsap County
Per Capita Income in Kitsap County is $47,713, while median incomes of families and households are $109,621 and $93,675 respectively.
| Characteristic | Number | Measure |
| Per Capita Income | 275,411 | $47,713 |
| Median Family Income | 72,211 | $109,621 |
| Mean Family Income | 72,211 | $135,922 |
| Median Household Income | 106,031 | $93,675 |
| Mean Household Income | 106,031 | $119,452 |
| Income Deficit | 72,211 | $12,277 |
| Wage / Income Gap (%) | 275,411 | 34.35% |
| Wage / Income Gap ($) | 275,411 | 65.65¢ per $1 |
| Gini / Inequality Index | 275,411 | 0.43 |
Earnings by Sex in Kitsap County
Average Earnings in Kitsap County are $47,231, $57,608 for men and $37,819 for women, a difference of 34.4%.
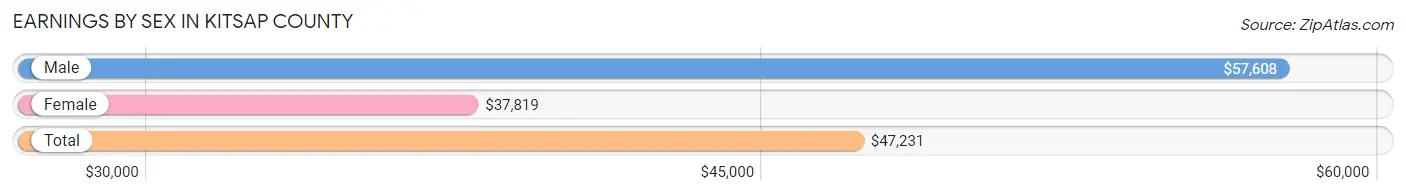
| Sex | Number | Average Earnings |
| Male | 83,506 (57.1%) | $57,608 |
| Female | 62,880 (42.9%) | $37,819 |
| Total | 146,386 (100.0%) | $47,231 |
Earnings by Sex by Income Bracket in Kitsap County
The most common earnings brackets in Kitsap County are $100,000+ for men (20,414 | 24.4%) and $100,000+ for women (7,173 | 11.4%).
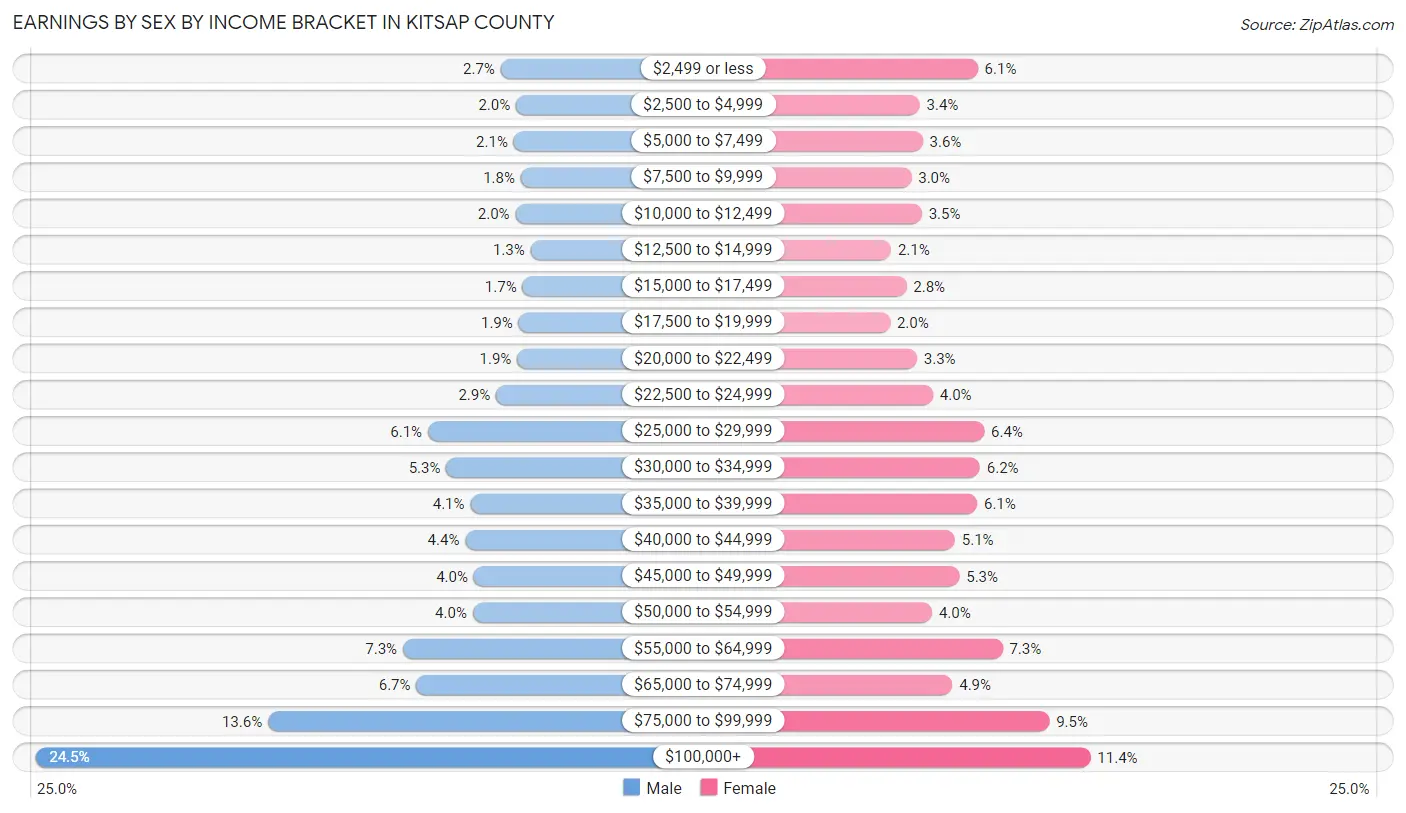
| Income | Male | Female |
| $2,499 or less | 2,254 (2.7%) | 3,853 (6.1%) |
| $2,500 to $4,999 | 1,656 (2.0%) | 2,147 (3.4%) |
| $5,000 to $7,499 | 1,744 (2.1%) | 2,235 (3.5%) |
| $7,500 to $9,999 | 1,469 (1.8%) | 1,898 (3.0%) |
| $10,000 to $12,499 | 1,675 (2.0%) | 2,205 (3.5%) |
| $12,500 to $14,999 | 1,086 (1.3%) | 1,304 (2.1%) |
| $15,000 to $17,499 | 1,400 (1.7%) | 1,752 (2.8%) |
| $17,500 to $19,999 | 1,552 (1.9%) | 1,269 (2.0%) |
| $20,000 to $22,499 | 1,613 (1.9%) | 2,060 (3.3%) |
| $22,500 to $24,999 | 2,440 (2.9%) | 2,531 (4.0%) |
| $25,000 to $29,999 | 5,103 (6.1%) | 4,045 (6.4%) |
| $30,000 to $34,999 | 4,380 (5.2%) | 3,918 (6.2%) |
| $35,000 to $39,999 | 3,439 (4.1%) | 3,838 (6.1%) |
| $40,000 to $44,999 | 3,640 (4.4%) | 3,184 (5.1%) |
| $45,000 to $49,999 | 3,303 (4.0%) | 3,312 (5.3%) |
| $50,000 to $54,999 | 3,351 (4.0%) | 2,507 (4.0%) |
| $55,000 to $64,999 | 6,080 (7.3%) | 4,582 (7.3%) |
| $65,000 to $74,999 | 5,554 (6.7%) | 3,106 (4.9%) |
| $75,000 to $99,999 | 11,353 (13.6%) | 5,961 (9.5%) |
| $100,000+ | 20,414 (24.4%) | 7,173 (11.4%) |
| Total | 83,506 (100.0%) | 62,880 (100.0%) |
Earnings by Sex by Educational Attainment in Kitsap County
Average earnings in Kitsap County are $68,951 for men and $42,758 for women, a difference of 38.0%. Men with an educational attainment of graduate degree enjoy the highest average annual earnings of $116,490, while those with less than high school education earn the least with $35,155. Women with an educational attainment of graduate degree earn the most with the average annual earnings of $75,278, while those with less than high school education have the smallest earnings of $27,010.
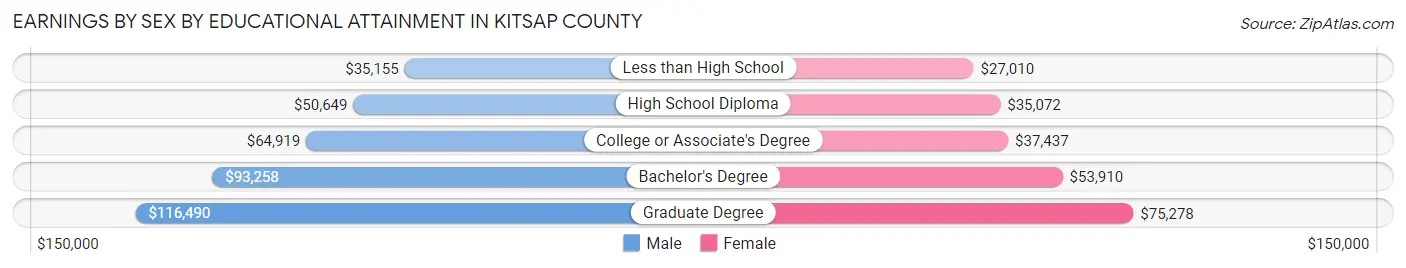
| Educational Attainment | Male Income | Female Income |
| Less than High School | $35,155 | $27,010 |
| High School Diploma | $50,649 | $35,072 |
| College or Associate's Degree | $64,919 | $37,437 |
| Bachelor's Degree | $93,258 | $53,910 |
| Graduate Degree | $116,490 | $75,278 |
| Total | $68,951 | $42,758 |
Family Income in Kitsap County
Family Income Brackets in Kitsap County
According to the Kitsap County family income data, there are 17,547 families falling into the $100,000 to $149,999 income range, which is the most common income bracket and makes up 24.3% of all families. Conversely, the $10,000 to $14,999 income bracket is the least frequent group with only 722 families (1.0%) belonging to this category.
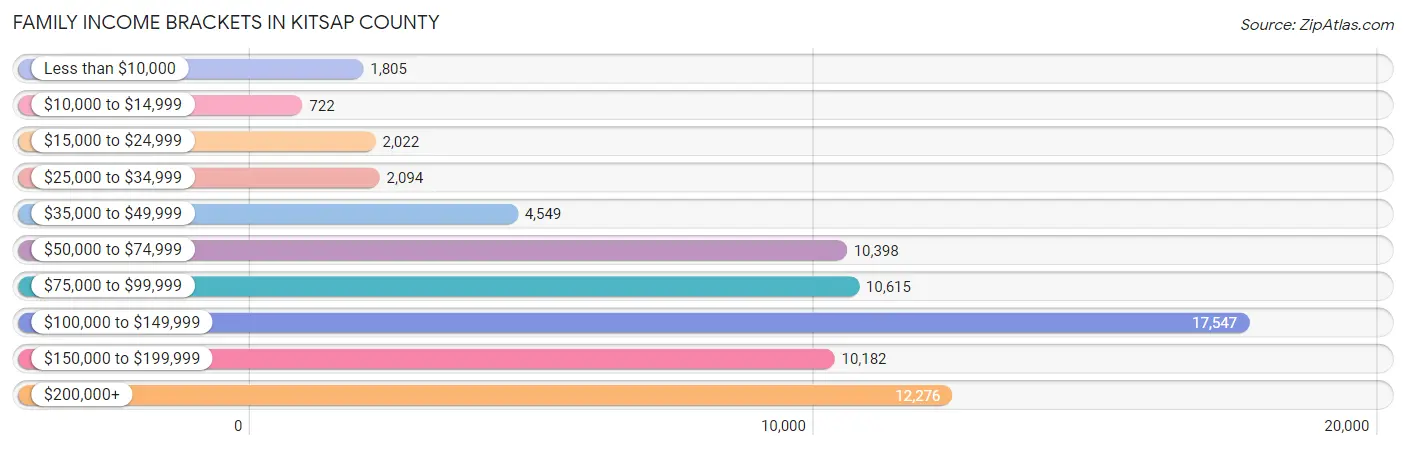
| Income Bracket | # Families | % Families |
| Less than $10,000 | 1,805 | 2.5% |
| $10,000 to $14,999 | 722 | 1.0% |
| $15,000 to $24,999 | 2,022 | 2.8% |
| $25,000 to $34,999 | 2,094 | 2.9% |
| $35,000 to $49,999 | 4,549 | 6.3% |
| $50,000 to $74,999 | 10,398 | 14.4% |
| $75,000 to $99,999 | 10,615 | 14.7% |
| $100,000 to $149,999 | 17,547 | 24.3% |
| $150,000 to $199,999 | 10,182 | 14.1% |
| $200,000+ | 12,276 | 17.0% |
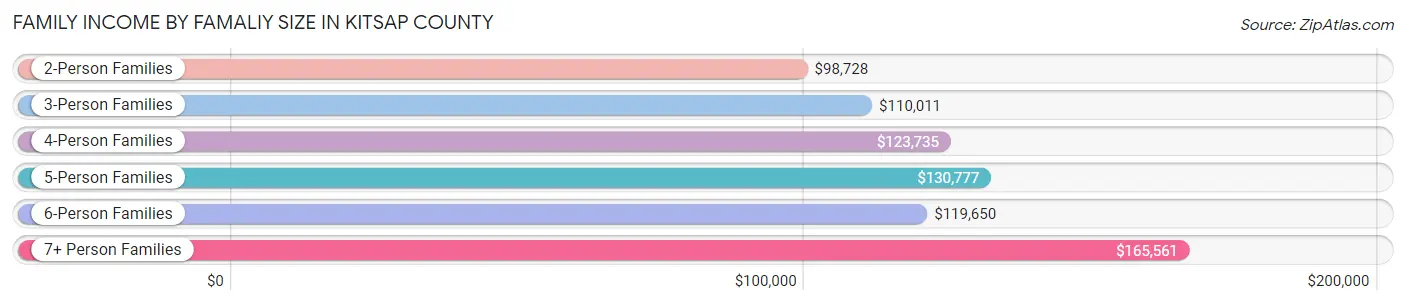
Family Income by Famaliy Size in Kitsap County
7+ person families (1,033 | 1.4%) account for the highest median family income in Kitsap County with $165,561 per family, while 2-person families (36,608 | 50.7%) have the highest median income of $49,364 per family member.
| Income Bracket | # Families | Median Income |
| 2-Person Families | 36,608 (50.7%) | $98,728 |
| 3-Person Families | 15,846 (21.9%) | $110,011 |
| 4-Person Families | 12,074 (16.7%) | $123,735 |
| 5-Person Families | 4,849 (6.7%) | $130,777 |
| 6-Person Families | 1,801 (2.5%) | $119,650 |
| 7+ Person Families | 1,033 (1.4%) | $165,561 |
| Total | 72,211 (100.0%) | $109,621 |
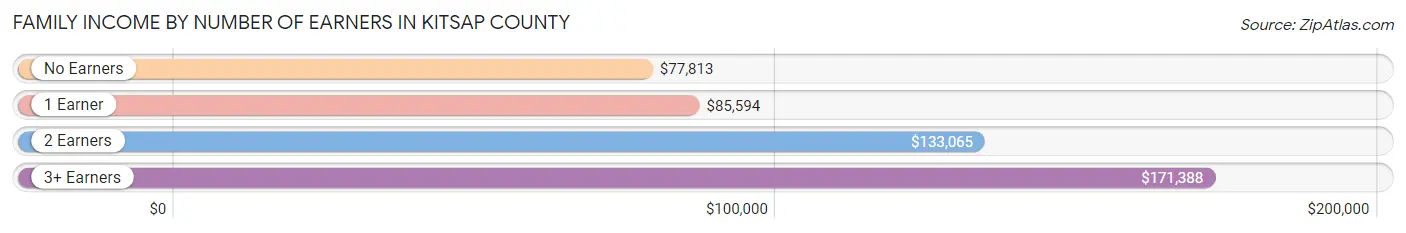
Family Income by Number of Earners in Kitsap County
The median family income in Kitsap County is $109,621, with families comprising 3+ earners (6,269) having the highest median family income of $171,388, while families with no earners (12,837) have the lowest median family income of $77,813, accounting for 8.7% and 17.8% of families, respectively.
| Number of Earners | # Families | Median Income |
| No Earners | 12,837 (17.8%) | $77,813 |
| 1 Earner | 23,783 (32.9%) | $85,594 |
| 2 Earners | 29,322 (40.6%) | $133,065 |
| 3+ Earners | 6,269 (8.7%) | $171,388 |
| Total | 72,211 (100.0%) | $109,621 |
Household Income in Kitsap County
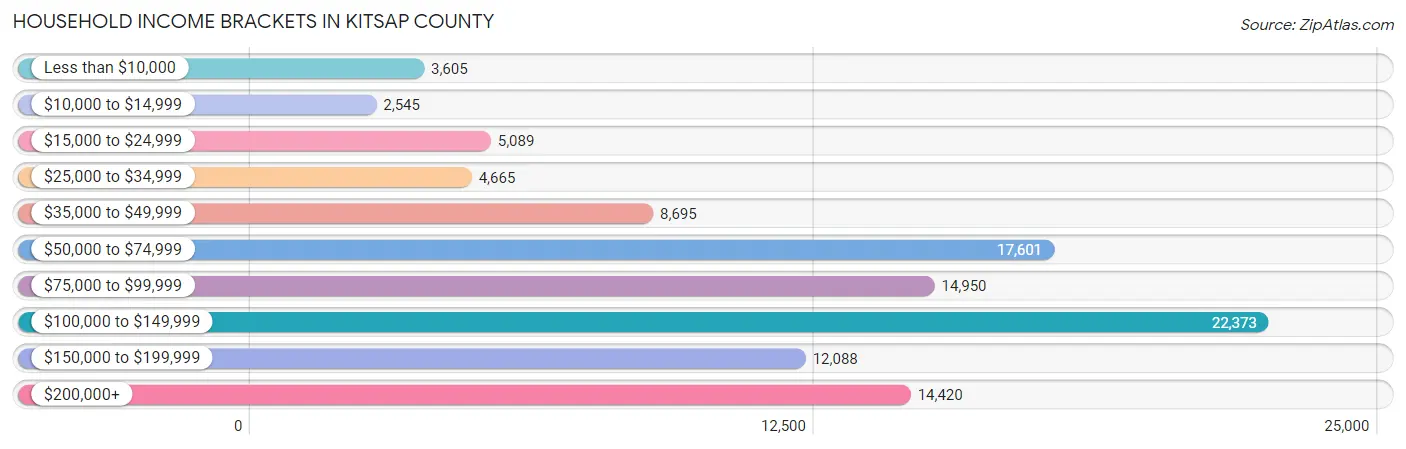
Household Income Brackets in Kitsap County
With 22,373 households falling in the category, the $100,000 to $149,999 income range is the most frequent in Kitsap County, accounting for 21.1% of all households. In contrast, only 2,545 households (2.4%) fall into the $10,000 to $14,999 income bracket, making it the least populous group.
| Income Bracket | # Households | % Households |
| Less than $10,000 | 3,605 | 3.4% |
| $10,000 to $14,999 | 2,545 | 2.4% |
| $15,000 to $24,999 | 5,089 | 4.8% |
| $25,000 to $34,999 | 4,665 | 4.4% |
| $35,000 to $49,999 | 8,695 | 8.2% |
| $50,000 to $74,999 | 17,601 | 16.6% |
| $75,000 to $99,999 | 14,950 | 14.1% |
| $100,000 to $149,999 | 22,373 | 21.1% |
| $150,000 to $199,999 | 12,088 | 11.4% |
| $200,000+ | 14,420 | 13.6% |
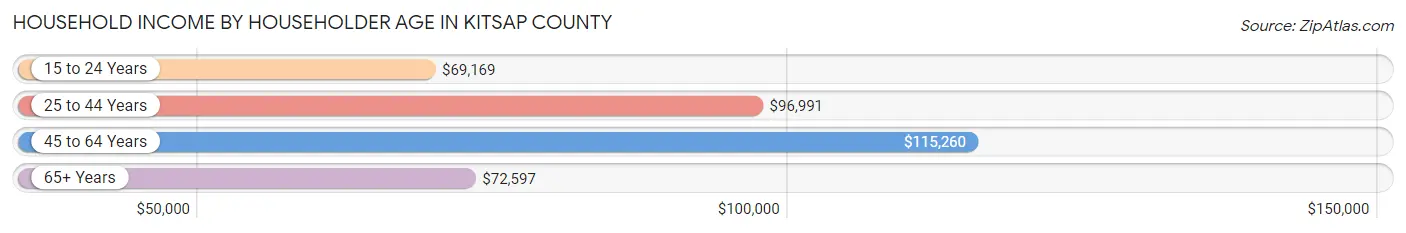
Household Income by Householder Age in Kitsap County
The median household income in Kitsap County is $93,675, with the highest median household income of $115,260 found in the 45 to 64 years age bracket for the primary householder. A total of 37,039 households (34.9%) fall into this category. Meanwhile, the 15 to 24 years age bracket for the primary householder has the lowest median household income of $69,169, with 4,305 households (4.1%) in this group.
| Income Bracket | # Households | Median Income |
| 15 to 24 Years | 4,305 (4.1%) | $69,169 |
| 25 to 44 Years | 33,805 (31.9%) | $96,991 |
| 45 to 64 Years | 37,039 (34.9%) | $115,260 |
| 65+ Years | 30,882 (29.1%) | $72,597 |
| Total | 106,031 (100.0%) | $93,675 |
Poverty in Kitsap County
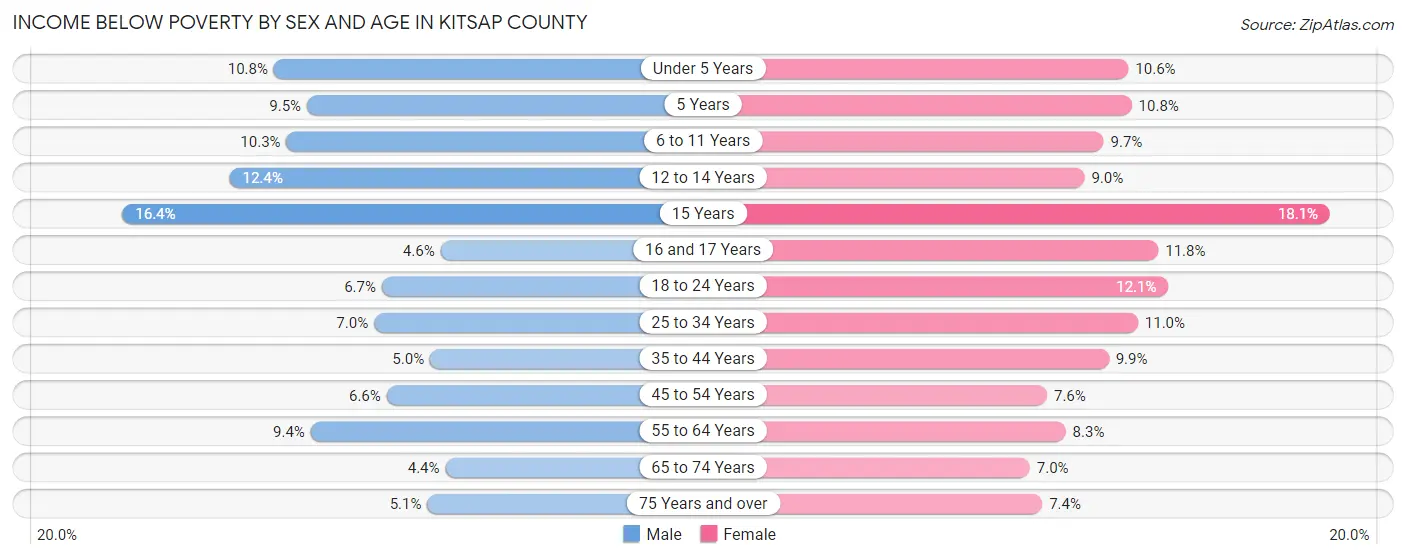
Income Below Poverty by Sex and Age in Kitsap County
With 7.3% poverty level for males and 9.3% for females among the residents of Kitsap County, 15 year old males and 15 year old females are the most vulnerable to poverty, with 275 males (16.4%) and 266 females (18.1%) in their respective age groups living below the poverty level.
| Age Bracket | Male | Female |
| Under 5 Years | 808 (10.7%) | 755 (10.6%) |
| 5 Years | 141 (9.5%) | 144 (10.8%) |
| 6 to 11 Years | 971 (10.3%) | 892 (9.7%) |
| 12 to 14 Years | 557 (12.4%) | 353 (9.0%) |
| 15 Years | 275 (16.4%) | 266 (18.1%) |
| 16 and 17 Years | 139 (4.6%) | 360 (11.7%) |
| 18 to 24 Years | 796 (6.7%) | 1,178 (12.1%) |
| 25 to 34 Years | 1,469 (7.0%) | 1,978 (11.0%) |
| 35 to 44 Years | 888 (5.0%) | 1,649 (9.9%) |
| 45 to 54 Years | 1,028 (6.6%) | 1,163 (7.6%) |
| 55 to 64 Years | 1,715 (9.4%) | 1,559 (8.3%) |
| 65 to 74 Years | 658 (4.4%) | 1,149 (7.0%) |
| 75 Years and over | 430 (5.1%) | 780 (7.4%) |
| Total | 9,875 (7.3%) | 12,226 (9.3%) |
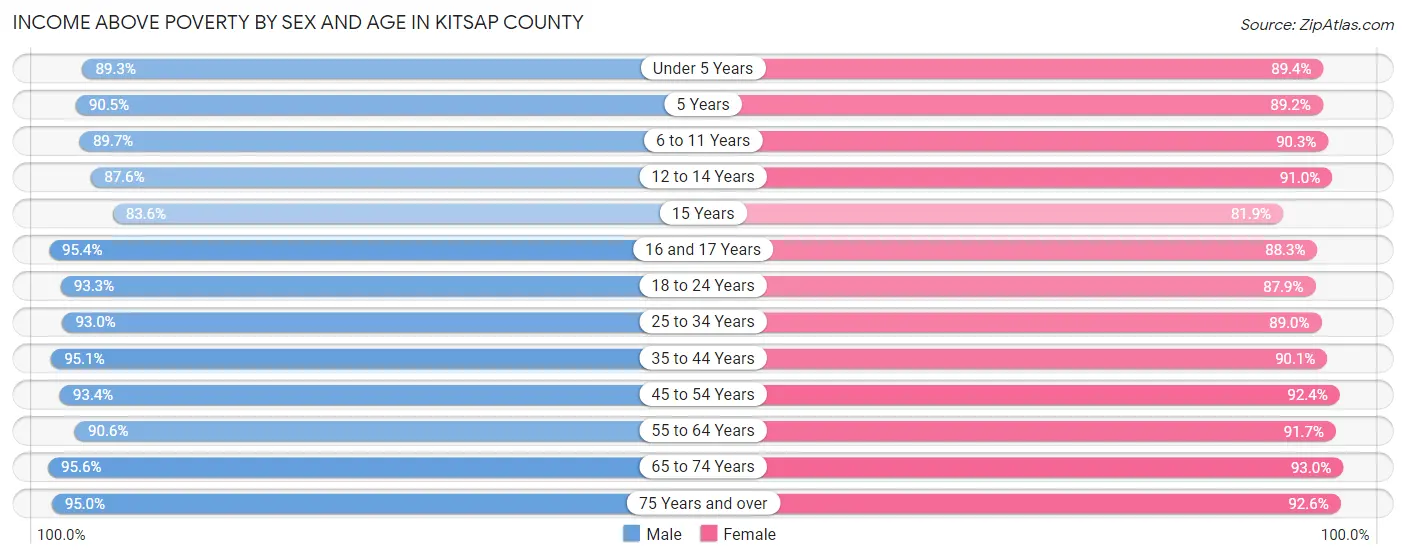
Income Above Poverty by Sex and Age in Kitsap County
According to the poverty statistics in Kitsap County, males aged 65 to 74 years and females aged 65 to 74 years are the age groups that are most secure financially, with 95.6% of males and 93.0% of females in these age groups living above the poverty line.
| Age Bracket | Male | Female |
| Under 5 Years | 6,706 (89.2%) | 6,342 (89.4%) |
| 5 Years | 1,340 (90.5%) | 1,194 (89.2%) |
| 6 to 11 Years | 8,476 (89.7%) | 8,288 (90.3%) |
| 12 to 14 Years | 3,939 (87.6%) | 3,566 (91.0%) |
| 15 Years | 1,405 (83.6%) | 1,202 (81.9%) |
| 16 and 17 Years | 2,911 (95.4%) | 2,705 (88.2%) |
| 18 to 24 Years | 11,022 (93.3%) | 8,543 (87.9%) |
| 25 to 34 Years | 19,428 (93.0%) | 16,017 (89.0%) |
| 35 to 44 Years | 17,068 (95.1%) | 14,984 (90.1%) |
| 45 to 54 Years | 14,649 (93.4%) | 14,091 (92.4%) |
| 55 to 64 Years | 16,574 (90.6%) | 17,210 (91.7%) |
| 65 to 74 Years | 14,358 (95.6%) | 15,318 (93.0%) |
| 75 Years and over | 8,084 (95.0%) | 9,700 (92.6%) |
| Total | 125,960 (92.7%) | 119,160 (90.7%) |
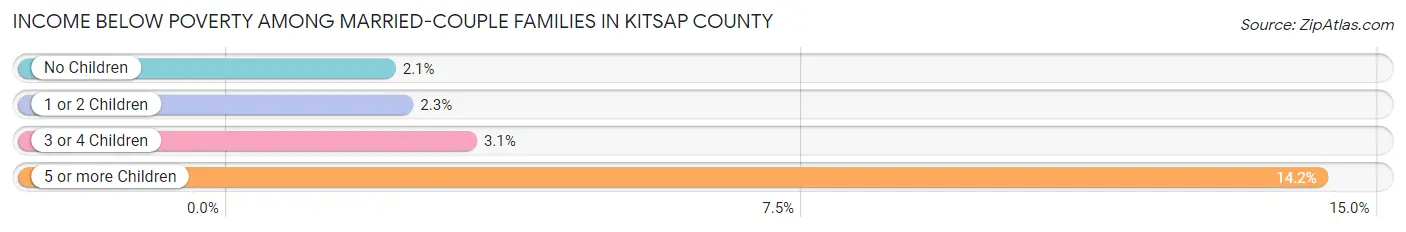
Income Below Poverty Among Married-Couple Families in Kitsap County
The poverty statistics for married-couple families in Kitsap County show that 2.3% or 1,297 of the total 57,104 families live below the poverty line. Families with 5 or more children have the highest poverty rate of 14.2%, comprising of 46 families. On the other hand, families with no children have the lowest poverty rate of 2.1%, which includes 728 families.
| Children | Above Poverty | Below Poverty |
| No Children | 34,642 (97.9%) | 728 (2.1%) |
| 1 or 2 Children | 16,971 (97.7%) | 397 (2.3%) |
| 3 or 4 Children | 3,917 (96.9%) | 126 (3.1%) |
| 5 or more Children | 277 (85.8%) | 46 (14.2%) |
| Total | 55,807 (97.7%) | 1,297 (2.3%) |
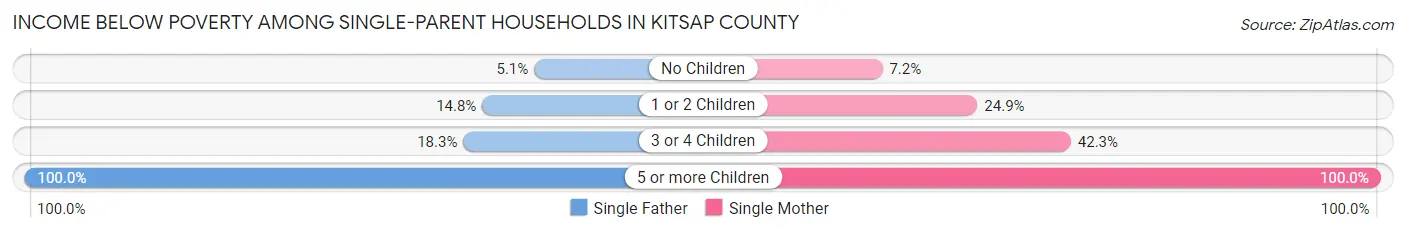
Income Below Poverty Among Single-Parent Households in Kitsap County
According to the poverty data in Kitsap County, 11.2% or 595 single-father households and 20.4% or 1,995 single-mother households are living below the poverty line. Among single-father households, those with 5 or more children have the highest poverty rate, with 2 households (100.0%) experiencing poverty. Likewise, among single-mother households, those with 5 or more children have the highest poverty rate, with 44 households (100.0%) falling below the poverty line.
| Children | Single Father | Single Mother |
| No Children | 110 (5.1%) | 259 (7.2%) |
| 1 or 2 Children | 412 (14.8%) | 1,298 (24.9%) |
| 3 or 4 Children | 71 (18.3%) | 394 (42.3%) |
| 5 or more Children | 2 (100.0%) | 44 (100.0%) |
| Total | 595 (11.2%) | 1,995 (20.4%) |
Income Below Poverty Among Married-Couple vs Single-Parent Households in Kitsap County
The poverty data for Kitsap County shows that 1,297 of the married-couple family households (2.3%) and 2,590 of the single-parent households (17.1%) are living below the poverty level. Within the married-couple family households, those with 5 or more children have the highest poverty rate, with 46 households (14.2%) falling below the poverty line. Among the single-parent households, those with 5 or more children have the highest poverty rate, with 46 household (100.0%) living below poverty.
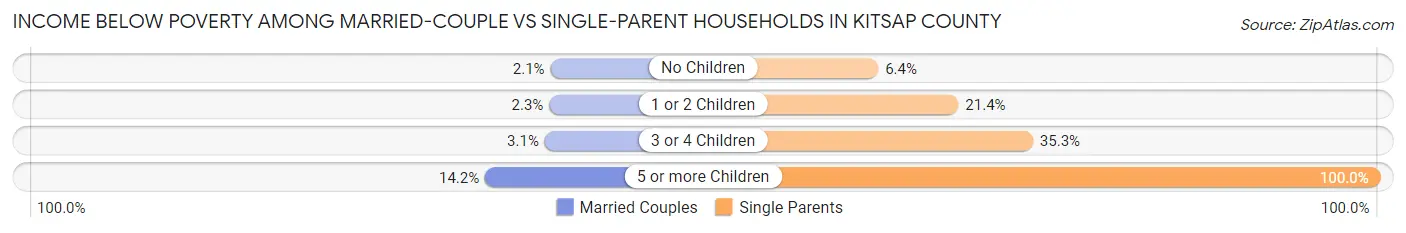
| Children | Married-Couple Families | Single-Parent Households |
| No Children | 728 (2.1%) | 369 (6.4%) |
| 1 or 2 Children | 397 (2.3%) | 1,710 (21.4%) |
| 3 or 4 Children | 126 (3.1%) | 465 (35.2%) |
| 5 or more Children | 46 (14.2%) | 46 (100.0%) |
| Total | 1,297 (2.3%) | 2,590 (17.1%) |
Employment Characteristics in Kitsap County
Employment by Class of Employer in Kitsap County
Among the 131,017 employed individuals in Kitsap County, private company employees (63,501 | 48.5%), federal government employees (33,381 | 25.5%), and not-for-profit organizations (9,395 | 7.2%) make up the most common classes of employment.
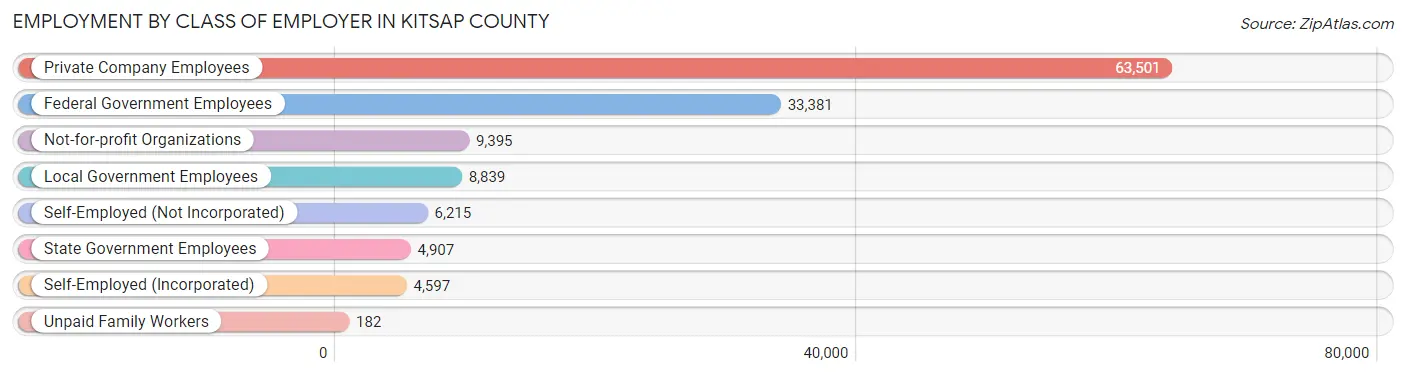
| Employer Class | # Employees | % Employees |
| Private Company Employees | 63,501 | 48.5% |
| Self-Employed (Incorporated) | 4,597 | 3.5% |
| Self-Employed (Not Incorporated) | 6,215 | 4.7% |
| Not-for-profit Organizations | 9,395 | 7.2% |
| Local Government Employees | 8,839 | 6.8% |
| State Government Employees | 4,907 | 3.7% |
| Federal Government Employees | 33,381 | 25.5% |
| Unpaid Family Workers | 182 | 0.1% |
| Total | 131,017 | 100.0% |
Employment Status by Age in Kitsap County
According to the labor force statistics for Kitsap County, out of the total population over 16 years of age (226,552), 61.7% or 139,783 individuals are in the labor force, with 4.7% or 6,570 of them unemployed. The age group with the highest labor force participation rate is 20 to 24 years, with 88.7% or 17,984 individuals in the labor force. Within the labor force, the 16 to 19 years age range has the highest percentage of unemployed individuals, with 15.7% or 760 of them being unemployed.
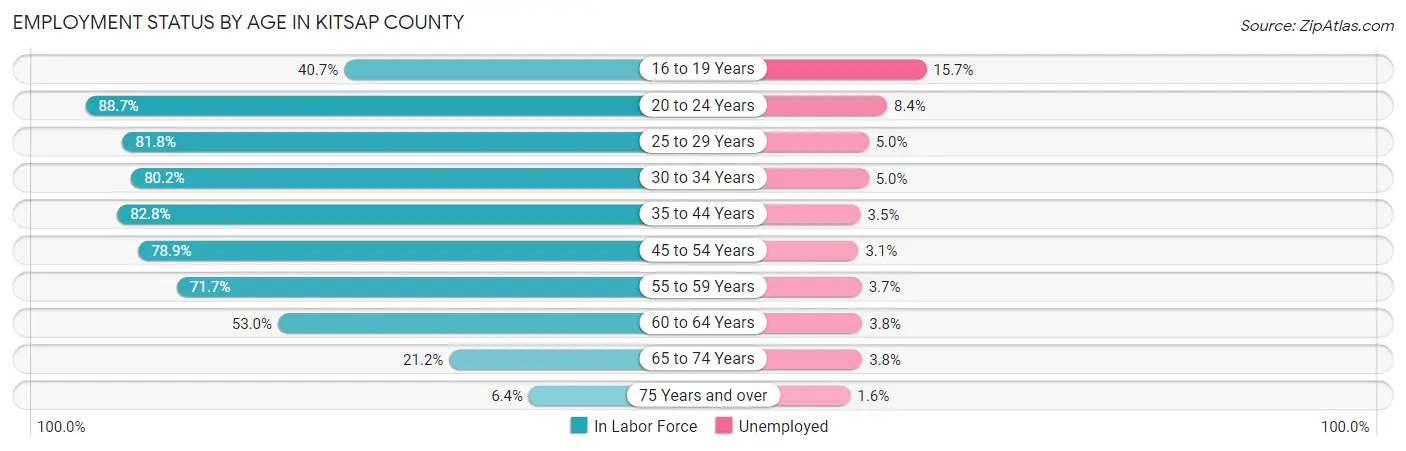
| Age Bracket | In Labor Force | Unemployed |
| 16 to 19 Years | 4,841 (40.7%) | 760 (15.7%) |
| 20 to 24 Years | 17,984 (88.7%) | 1,511 (8.4%) |
| 25 to 29 Years | 16,637 (81.8%) | 832 (5.0%) |
| 30 to 34 Years | 15,749 (80.2%) | 787 (5.0%) |
| 35 to 44 Years | 28,814 (82.8%) | 1,008 (3.5%) |
| 45 to 54 Years | 24,513 (78.9%) | 760 (3.1%) |
| 55 to 59 Years | 13,503 (71.7%) | 500 (3.7%) |
| 60 to 64 Years | 9,693 (53.0%) | 368 (3.8%) |
| 65 to 74 Years | 6,737 (21.2%) | 256 (3.8%) |
| 75 Years and over | 1,257 (6.4%) | 20 (1.6%) |
| Total | 139,783 (61.7%) | 6,570 (4.7%) |
Employment Status by Educational Attainment in Kitsap County
According to labor force statistics for Kitsap County, 76.2% of individuals (108,940) out of the total population between 25 and 64 years of age (142,966) are in the labor force, with 3.9% or 4,249 of them being unemployed. The group with the highest labor force participation rate are those with the educational attainment of bachelor's degree or higher, with 82.8% or 40,103 individuals in the labor force. Within the labor force, individuals with high school diploma education have the highest percentage of unemployment, with 7.0% or 1,569 of them being unemployed.
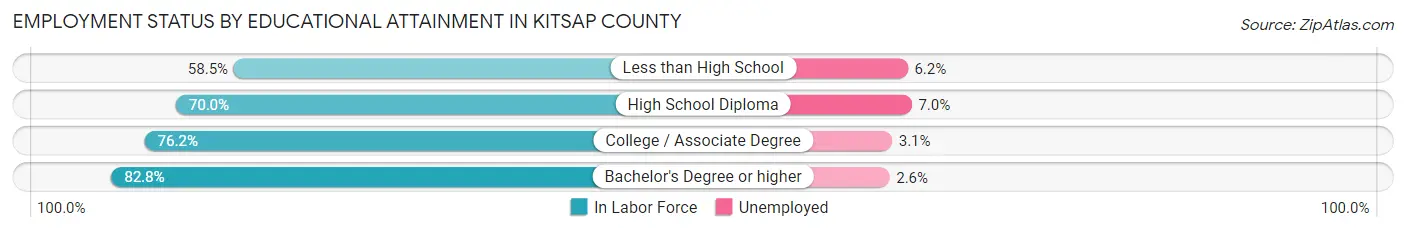
| Educational Attainment | In Labor Force | Unemployed |
| Less than High School | 4,152 (58.5%) | 440 (6.2%) |
| High School Diploma | 22,420 (70.0%) | 2,242 (7.0%) |
| College / Associate Degree | 42,220 (76.2%) | 1,718 (3.1%) |
| Bachelor's Degree or higher | 40,103 (82.8%) | 1,259 (2.6%) |
| Total | 108,940 (76.2%) | 5,576 (3.9%) |
Employment Occupations by Sex in Kitsap County
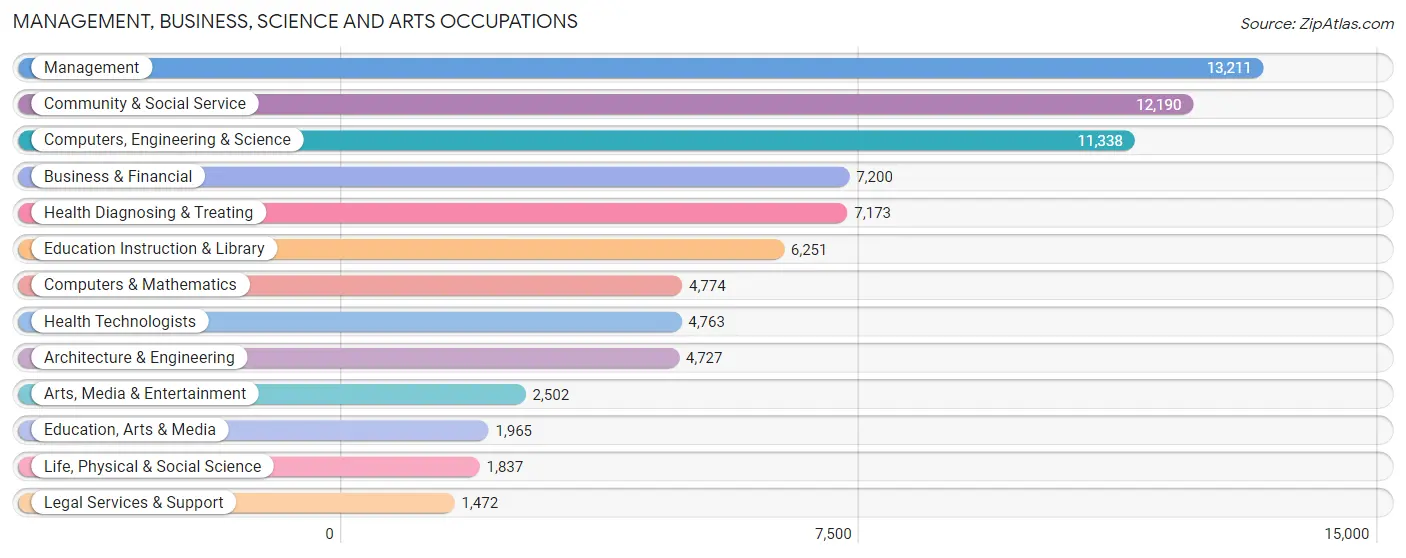
Management, Business, Science and Arts Occupations
The most common Management, Business, Science and Arts occupations in Kitsap County are Management (13,211 | 11.0%), Community & Social Service (12,190 | 10.2%), Computers, Engineering & Science (11,338 | 9.5%), Business & Financial (7,200 | 6.0%), and Health Diagnosing & Treating (7,173 | 6.0%).
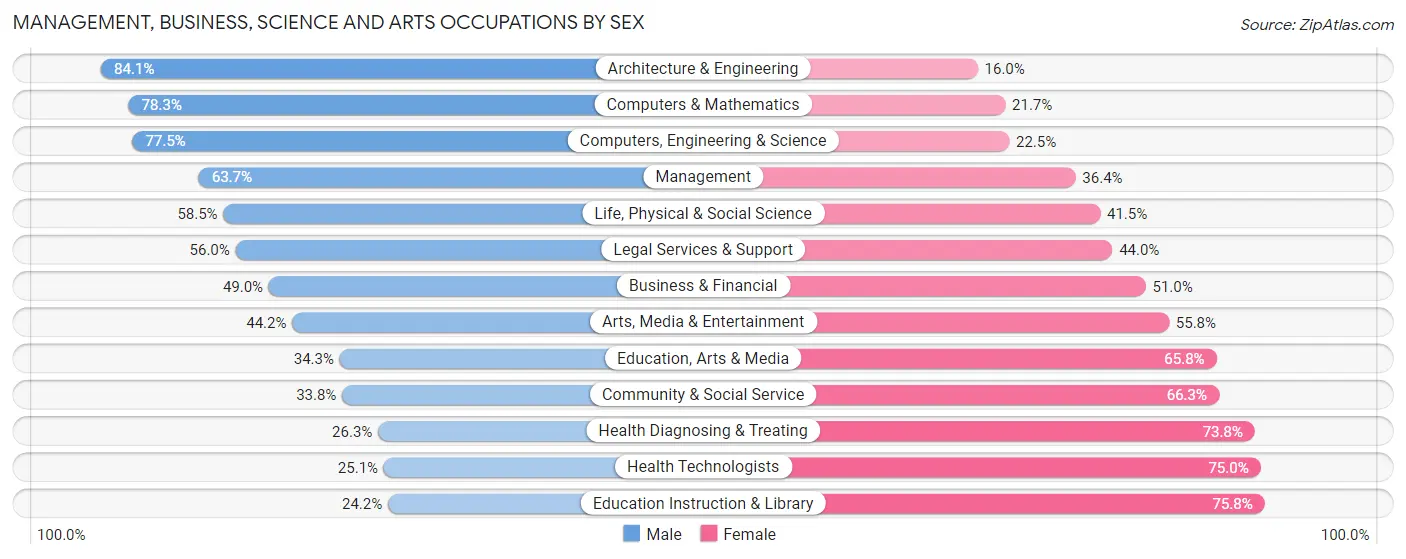
Management, Business, Science and Arts Occupations by Sex
Within the Management, Business, Science and Arts occupations in Kitsap County, the most male-oriented occupations are Architecture & Engineering (84.1%), Computers & Mathematics (78.3%), and Computers, Engineering & Science (77.5%), while the most female-oriented occupations are Education Instruction & Library (75.8%), Health Technologists (75.0%), and Health Diagnosing & Treating (73.8%).
| Occupation | Male | Female |
| Management | 8,409 (63.6%) | 4,802 (36.3%) |
| Business & Financial | 3,530 (49.0%) | 3,670 (51.0%) |
| Computers, Engineering & Science | 8,787 (77.5%) | 2,551 (22.5%) |
| Computers & Mathematics | 3,739 (78.3%) | 1,035 (21.7%) |
| Architecture & Engineering | 3,973 (84.1%) | 754 (16.0%) |
| Life, Physical & Social Science | 1,075 (58.5%) | 762 (41.5%) |
| Community & Social Service | 4,114 (33.8%) | 8,076 (66.2%) |
| Education, Arts & Media | 673 (34.3%) | 1,292 (65.7%) |
| Legal Services & Support | 824 (56.0%) | 648 (44.0%) |
| Education Instruction & Library | 1,512 (24.2%) | 4,739 (75.8%) |
| Arts, Media & Entertainment | 1,105 (44.2%) | 1,397 (55.8%) |
| Health Diagnosing & Treating | 1,883 (26.3%) | 5,290 (73.8%) |
| Health Technologists | 1,193 (25.1%) | 3,570 (75.0%) |
| Total (Category) | 26,723 (52.3%) | 24,389 (47.7%) |
| Total (Overall) | 65,473 (54.7%) | 54,279 (45.3%) |
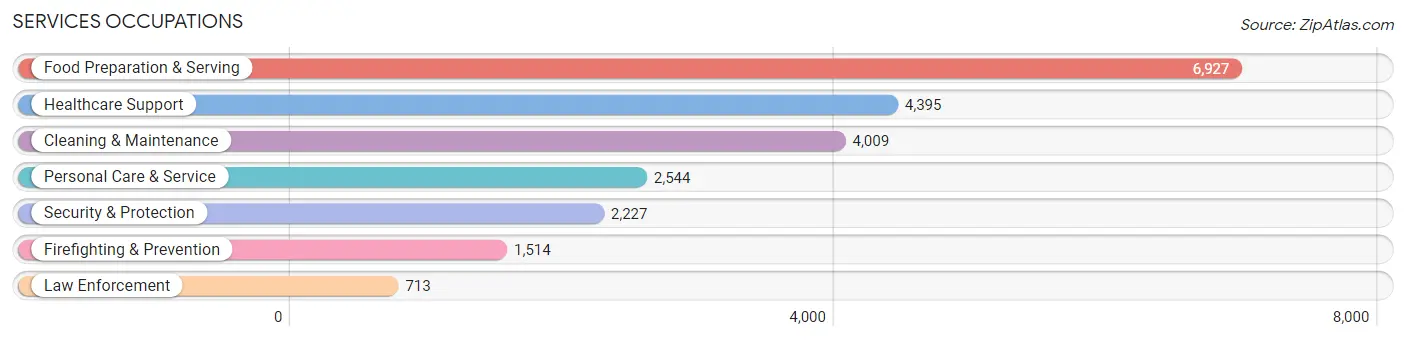
Services Occupations
The most common Services occupations in Kitsap County are Food Preparation & Serving (6,927 | 5.8%), Healthcare Support (4,395 | 3.7%), Cleaning & Maintenance (4,009 | 3.4%), Personal Care & Service (2,544 | 2.1%), and Security & Protection (2,227 | 1.9%).
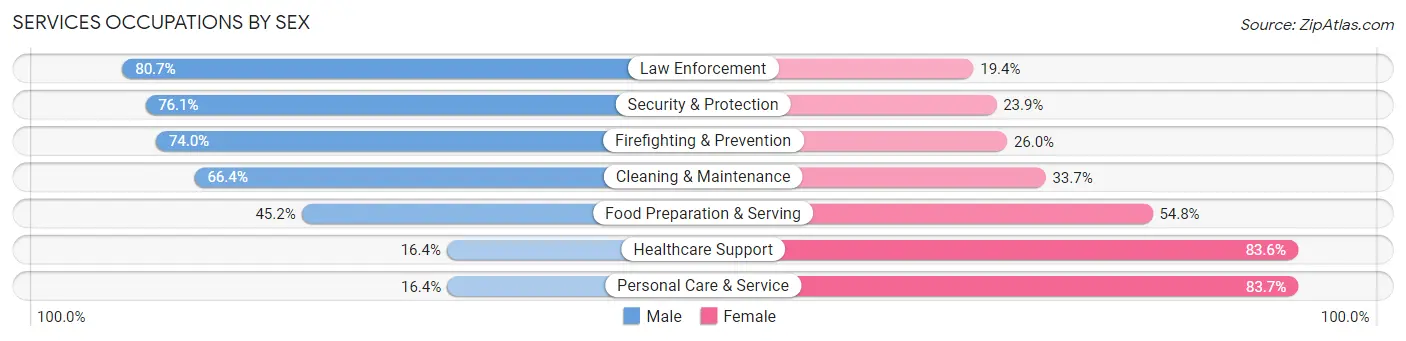
Services Occupations by Sex
Within the Services occupations in Kitsap County, the most male-oriented occupations are Law Enforcement (80.6%), Security & Protection (76.1%), and Firefighting & Prevention (74.0%), while the most female-oriented occupations are Personal Care & Service (83.7%), Healthcare Support (83.6%), and Food Preparation & Serving (54.8%).
| Occupation | Male | Female |
| Healthcare Support | 721 (16.4%) | 3,674 (83.6%) |
| Security & Protection | 1,695 (76.1%) | 532 (23.9%) |
| Firefighting & Prevention | 1,120 (74.0%) | 394 (26.0%) |
| Law Enforcement | 575 (80.6%) | 138 (19.4%) |
| Food Preparation & Serving | 3,129 (45.2%) | 3,798 (54.8%) |
| Cleaning & Maintenance | 2,660 (66.3%) | 1,349 (33.7%) |
| Personal Care & Service | 416 (16.4%) | 2,128 (83.7%) |
| Total (Category) | 8,621 (42.9%) | 11,481 (57.1%) |
| Total (Overall) | 65,473 (54.7%) | 54,279 (45.3%) |
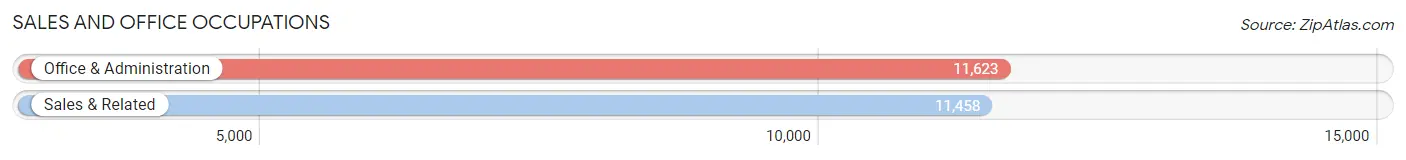
Sales and Office Occupations
The most common Sales and Office occupations in Kitsap County are Office & Administration (11,623 | 9.7%), and Sales & Related (11,458 | 9.6%).
Sales and Office Occupations by Sex
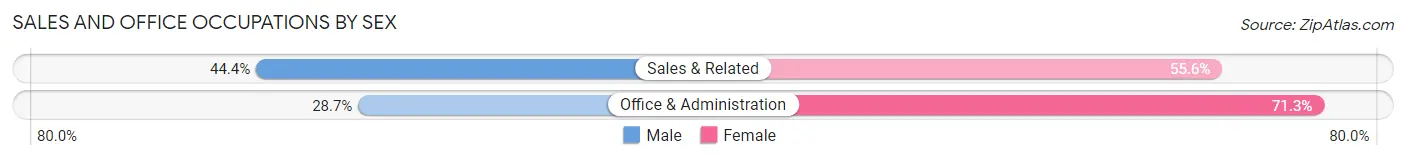
| Occupation | Male | Female |
| Sales & Related | 5,086 (44.4%) | 6,372 (55.6%) |
| Office & Administration | 3,333 (28.7%) | 8,290 (71.3%) |
| Total (Category) | 8,419 (36.5%) | 14,662 (63.5%) |
| Total (Overall) | 65,473 (54.7%) | 54,279 (45.3%) |
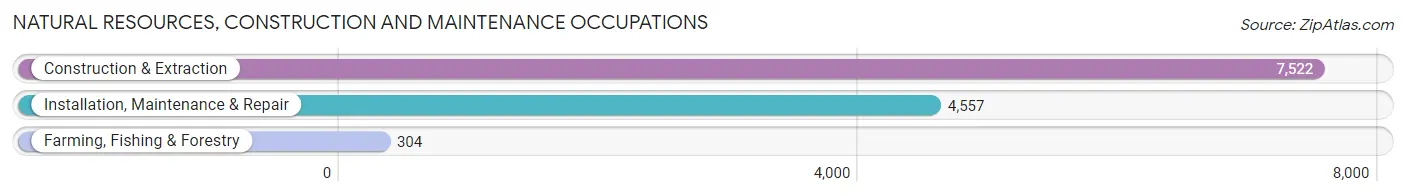
Natural Resources, Construction and Maintenance Occupations
The most common Natural Resources, Construction and Maintenance occupations in Kitsap County are Construction & Extraction (7,522 | 6.3%), Installation, Maintenance & Repair (4,557 | 3.8%), and Farming, Fishing & Forestry (304 | 0.3%).
Natural Resources, Construction and Maintenance Occupations by Sex
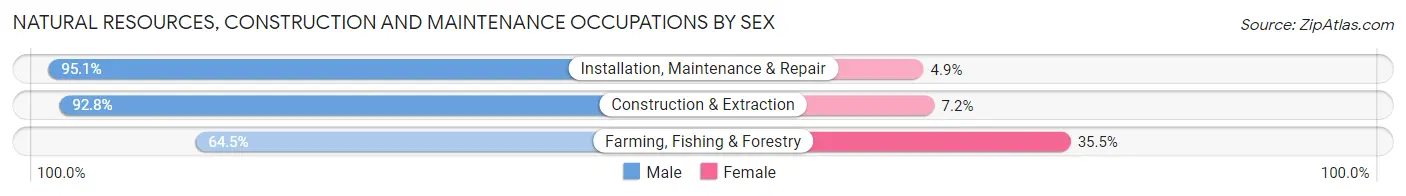
| Occupation | Male | Female |
| Farming, Fishing & Forestry | 196 (64.5%) | 108 (35.5%) |
| Construction & Extraction | 6,978 (92.8%) | 544 (7.2%) |
| Installation, Maintenance & Repair | 4,332 (95.1%) | 225 (4.9%) |
| Total (Category) | 11,506 (92.9%) | 877 (7.1%) |
| Total (Overall) | 65,473 (54.7%) | 54,279 (45.3%) |
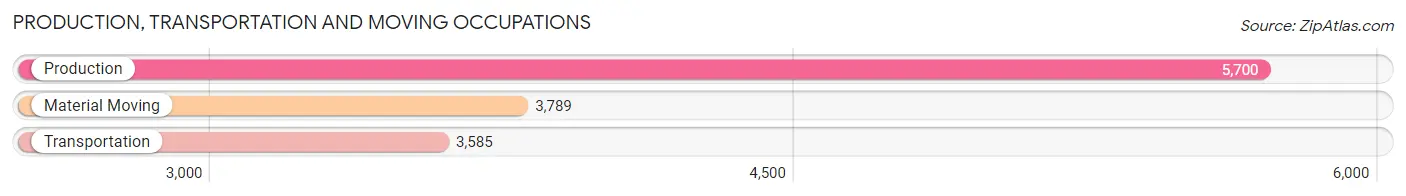
Production, Transportation and Moving Occupations
The most common Production, Transportation and Moving occupations in Kitsap County are Production (5,700 | 4.8%), Material Moving (3,789 | 3.2%), and Transportation (3,585 | 3.0%).
Production, Transportation and Moving Occupations by Sex
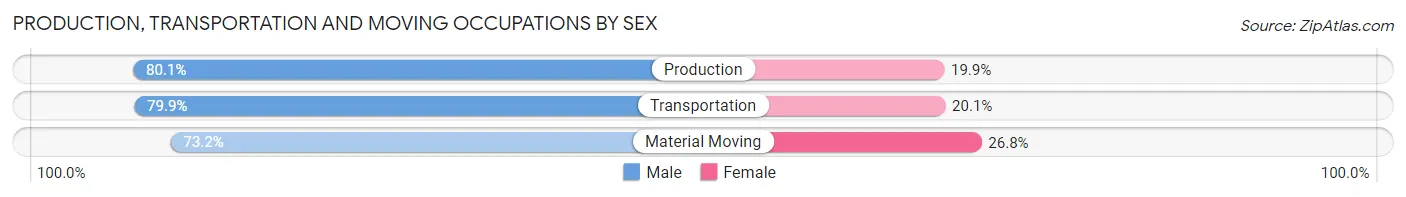
| Occupation | Male | Female |
| Production | 4,565 (80.1%) | 1,135 (19.9%) |
| Transportation | 2,864 (79.9%) | 721 (20.1%) |
| Material Moving | 2,775 (73.2%) | 1,014 (26.8%) |
| Total (Category) | 10,204 (78.0%) | 2,870 (22.0%) |
| Total (Overall) | 65,473 (54.7%) | 54,279 (45.3%) |
Employment Industries by Sex in Kitsap County
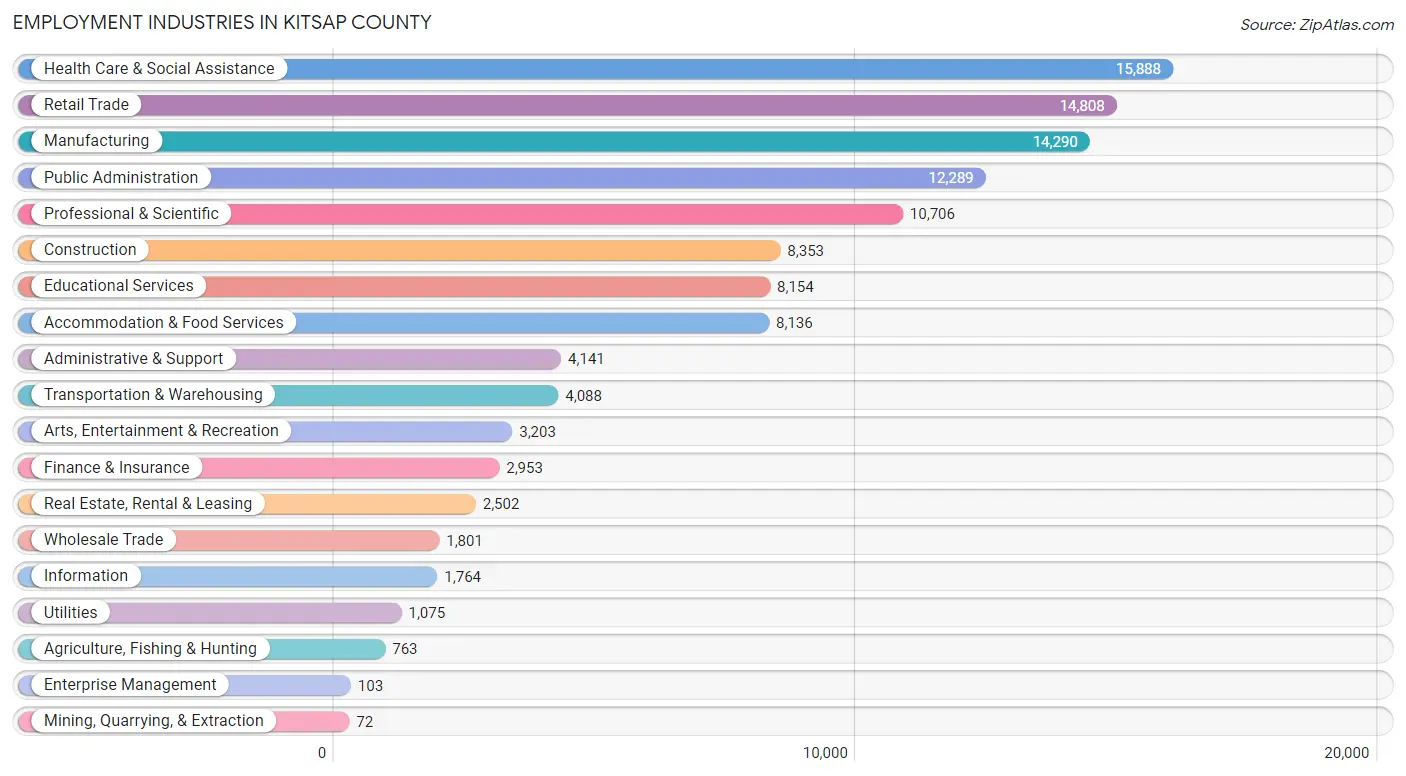
Employment Industries in Kitsap County
The major employment industries in Kitsap County include Health Care & Social Assistance (15,888 | 13.3%), Retail Trade (14,808 | 12.4%), Manufacturing (14,290 | 11.9%), Public Administration (12,289 | 10.3%), and Professional & Scientific (10,706 | 8.9%).
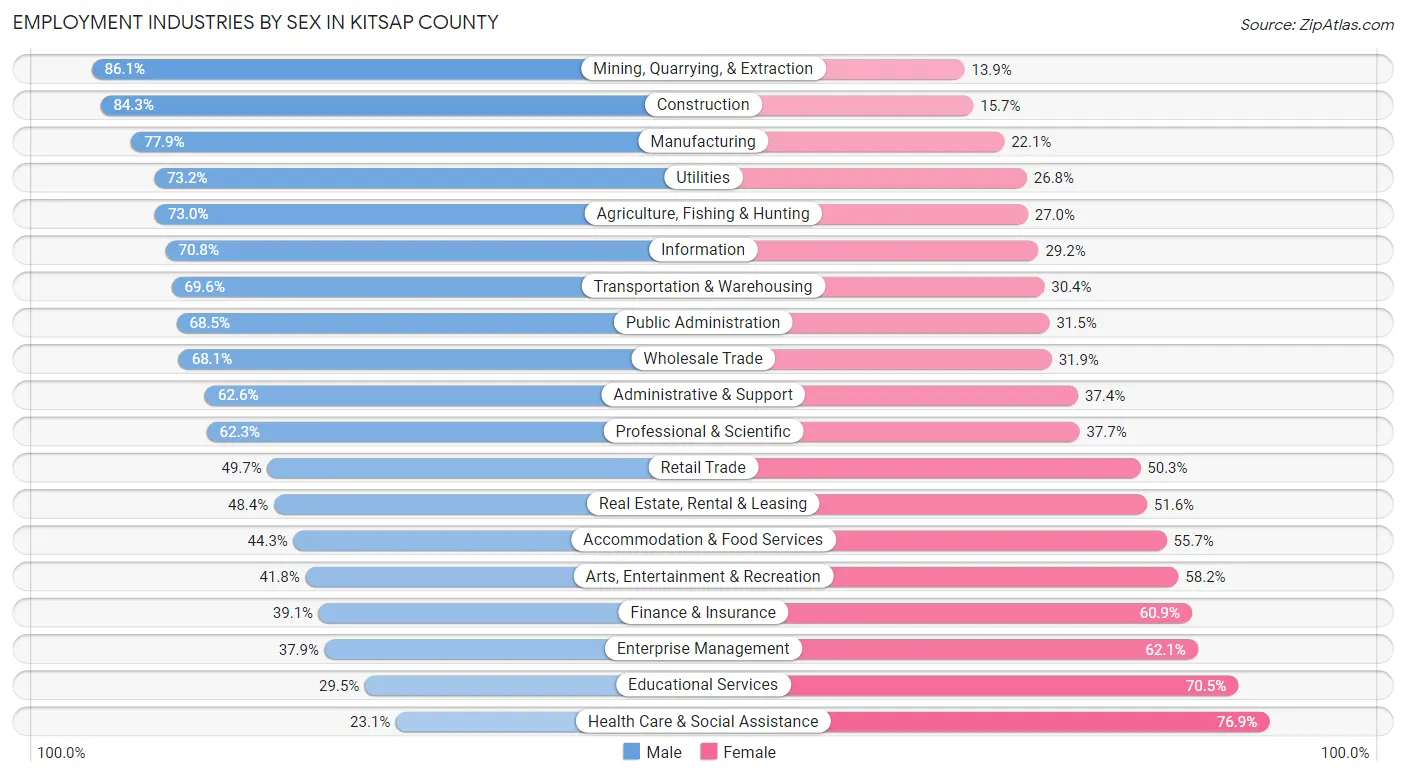
Employment Industries by Sex in Kitsap County
The Kitsap County industries that see more men than women are Mining, Quarrying, & Extraction (86.1%), Construction (84.3%), and Manufacturing (77.9%), whereas the industries that tend to have a higher number of women are Health Care & Social Assistance (76.9%), Educational Services (70.5%), and Enterprise Management (62.1%).
| Industry | Male | Female |
| Agriculture, Fishing & Hunting | 557 (73.0%) | 206 (27.0%) |
| Mining, Quarrying, & Extraction | 62 (86.1%) | 10 (13.9%) |
| Construction | 7,041 (84.3%) | 1,312 (15.7%) |
| Manufacturing | 11,132 (77.9%) | 3,158 (22.1%) |
| Wholesale Trade | 1,226 (68.1%) | 575 (31.9%) |
| Retail Trade | 7,361 (49.7%) | 7,447 (50.3%) |
| Transportation & Warehousing | 2,845 (69.6%) | 1,243 (30.4%) |
| Utilities | 787 (73.2%) | 288 (26.8%) |
| Information | 1,249 (70.8%) | 515 (29.2%) |
| Finance & Insurance | 1,154 (39.1%) | 1,799 (60.9%) |
| Real Estate, Rental & Leasing | 1,210 (48.4%) | 1,292 (51.6%) |
| Professional & Scientific | 6,671 (62.3%) | 4,035 (37.7%) |
| Enterprise Management | 39 (37.9%) | 64 (62.1%) |
| Administrative & Support | 2,593 (62.6%) | 1,548 (37.4%) |
| Educational Services | 2,406 (29.5%) | 5,748 (70.5%) |
| Health Care & Social Assistance | 3,669 (23.1%) | 12,219 (76.9%) |
| Arts, Entertainment & Recreation | 1,340 (41.8%) | 1,863 (58.2%) |
| Accommodation & Food Services | 3,605 (44.3%) | 4,531 (55.7%) |
| Public Administration | 8,420 (68.5%) | 3,869 (31.5%) |
| Total | 65,473 (54.7%) | 54,279 (45.3%) |
Education in Kitsap County
School Enrollment in Kitsap County
The most common levels of schooling among the 57,188 students in Kitsap County are elementary school (12,368 | 21.6%), high school (12,347 | 21.6%), and middle school (12,067 | 21.1%).
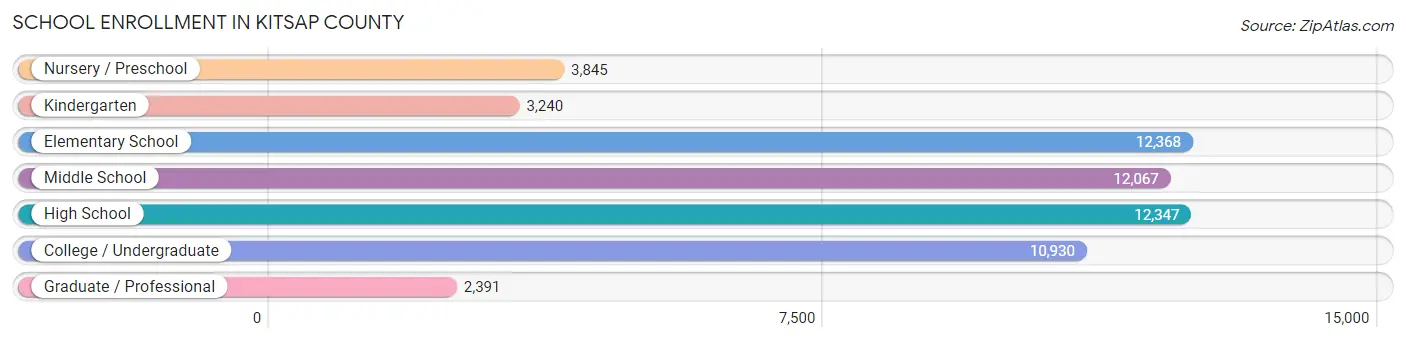
| School Level | # Students | % Students |
| Nursery / Preschool | 3,845 | 6.7% |
| Kindergarten | 3,240 | 5.7% |
| Elementary School | 12,368 | 21.6% |
| Middle School | 12,067 | 21.1% |
| High School | 12,347 | 21.6% |
| College / Undergraduate | 10,930 | 19.1% |
| Graduate / Professional | 2,391 | 4.2% |
| Total | 57,188 | 100.0% |
School Enrollment by Age by Funding Source in Kitsap County
Out of a total of 57,188 students who are enrolled in schools in Kitsap County, 9,207 (16.1%) attend a private institution, while the remaining 47,981 (83.9%) are enrolled in public schools. The age group of 3 to 4 year olds has the highest likelihood of being enrolled in private schools, with 1,654 (53.0% in the age bracket) enrolled. Conversely, the age group of 15 to 17 year olds has the lowest likelihood of being enrolled in a private school, with 8,078 (90.6% in the age bracket) attending a public institution.
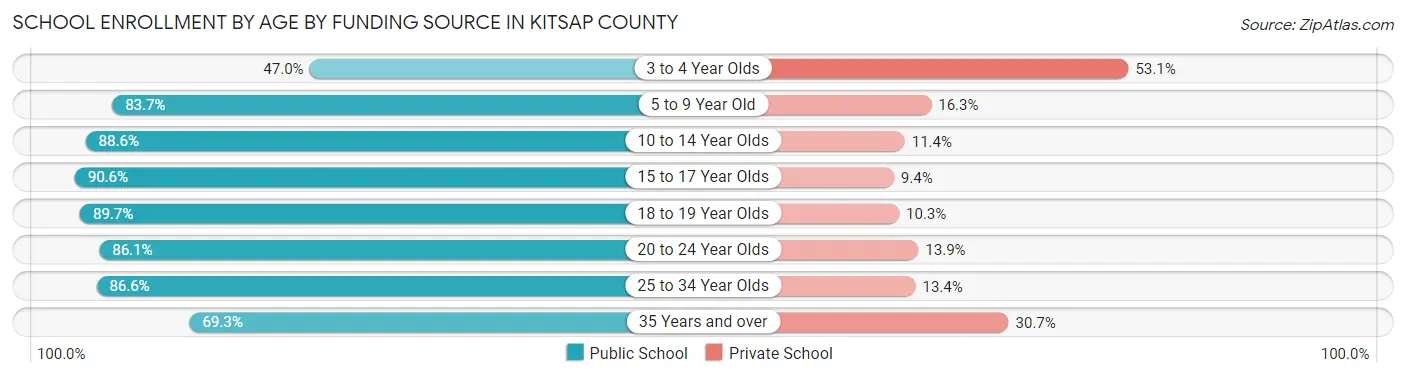
| Age Bracket | Public School | Private School |
| 3 to 4 Year Olds | 1,464 (46.9%) | 1,654 (53.0%) |
| 5 to 9 Year Old | 12,252 (83.7%) | 2,389 (16.3%) |
| 10 to 14 Year Olds | 13,339 (88.6%) | 1,713 (11.4%) |
| 15 to 17 Year Olds | 8,078 (90.6%) | 834 (9.4%) |
| 18 to 19 Year Olds | 3,168 (89.7%) | 365 (10.3%) |
| 20 to 24 Year Olds | 3,165 (86.1%) | 512 (13.9%) |
| 25 to 34 Year Olds | 3,964 (86.6%) | 613 (13.4%) |
| 35 Years and over | 2,548 (69.3%) | 1,130 (30.7%) |
| Total | 47,981 (83.9%) | 9,207 (16.1%) |
Educational Attainment by Field of Study in Kitsap County
Business (10,488 | 13.9%), engineering (7,690 | 10.2%), education (7,437 | 9.9%), social sciences (7,178 | 9.5%), and science & technology (7,154 | 9.5%) are the most common fields of study among 75,288 individuals in Kitsap County who have obtained a bachelor's degree or higher.
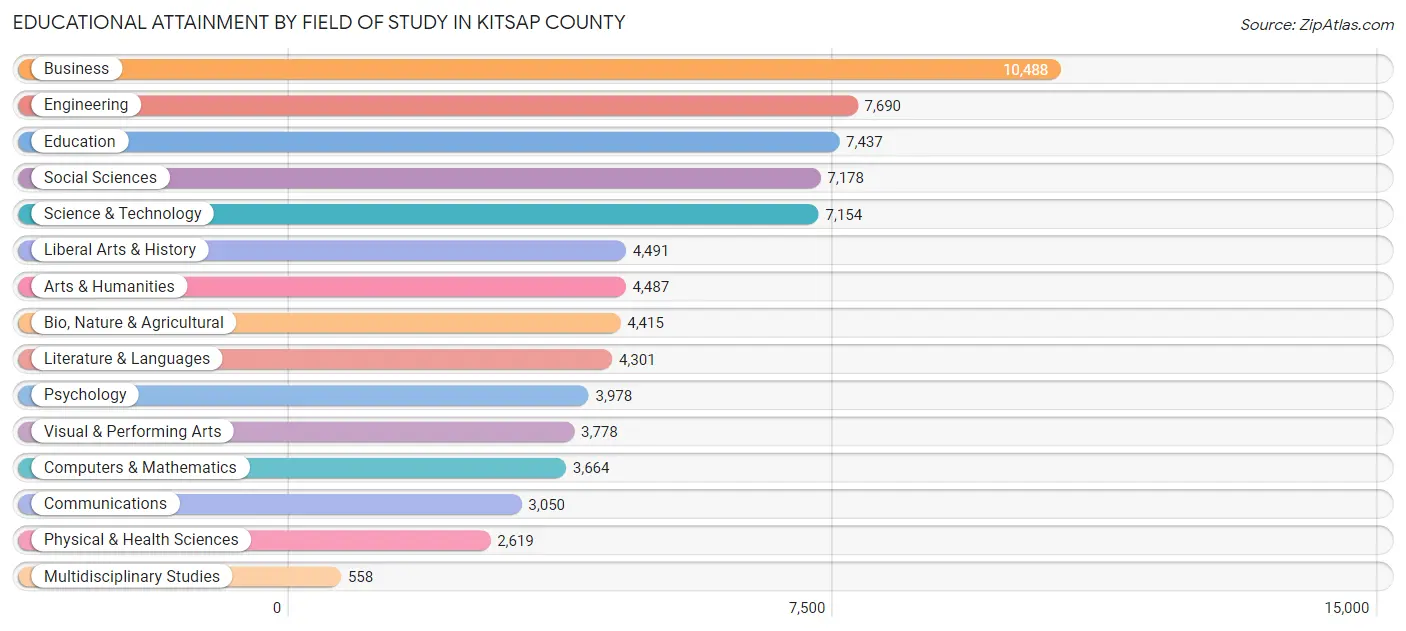
| Field of Study | # Graduates | % Graduates |
| Computers & Mathematics | 3,664 | 4.9% |
| Bio, Nature & Agricultural | 4,415 | 5.9% |
| Physical & Health Sciences | 2,619 | 3.5% |
| Psychology | 3,978 | 5.3% |
| Social Sciences | 7,178 | 9.5% |
| Engineering | 7,690 | 10.2% |
| Multidisciplinary Studies | 558 | 0.7% |
| Science & Technology | 7,154 | 9.5% |
| Business | 10,488 | 13.9% |
| Education | 7,437 | 9.9% |
| Literature & Languages | 4,301 | 5.7% |
| Liberal Arts & History | 4,491 | 6.0% |
| Visual & Performing Arts | 3,778 | 5.0% |
| Communications | 3,050 | 4.1% |
| Arts & Humanities | 4,487 | 6.0% |
| Total | 75,288 | 100.0% |
Transportation & Commute in Kitsap County
Vehicle Availability by Sex in Kitsap County
The most prevalent vehicle ownership categories in Kitsap County are males with 2 vehicles (28,314, accounting for 39.4%) and females with 2 vehicles (20,734, making up 52.8%).
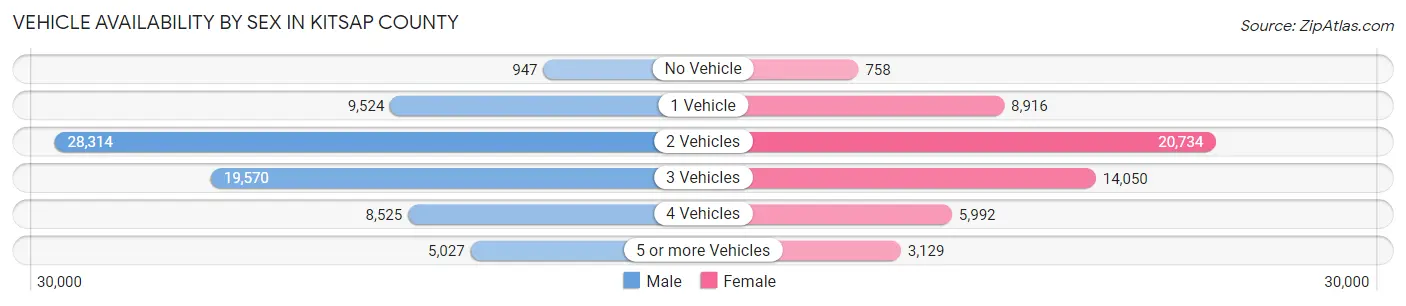
| Vehicles Available | Male | Female |
| No Vehicle | 947 (1.3%) | 758 (1.4%) |
| 1 Vehicle | 9,524 (13.2%) | 8,916 (16.6%) |
| 2 Vehicles | 28,314 (39.4%) | 20,734 (38.7%) |
| 3 Vehicles | 19,570 (27.2%) | 14,050 (26.2%) |
| 4 Vehicles | 8,525 (11.9%) | 5,992 (11.2%) |
| 5 or more Vehicles | 5,027 (7.0%) | 3,129 (5.8%) |
| Total | 71,907 (100.0%) | 53,579 (100.0%) |
Commute Time in Kitsap County
The most frequently occuring commute durations in Kitsap County are 15 to 19 minutes (18,882 commuters, 16.3%), 20 to 24 minutes (16,989 commuters, 14.7%), and 10 to 14 minutes (16,260 commuters, 14.0%).
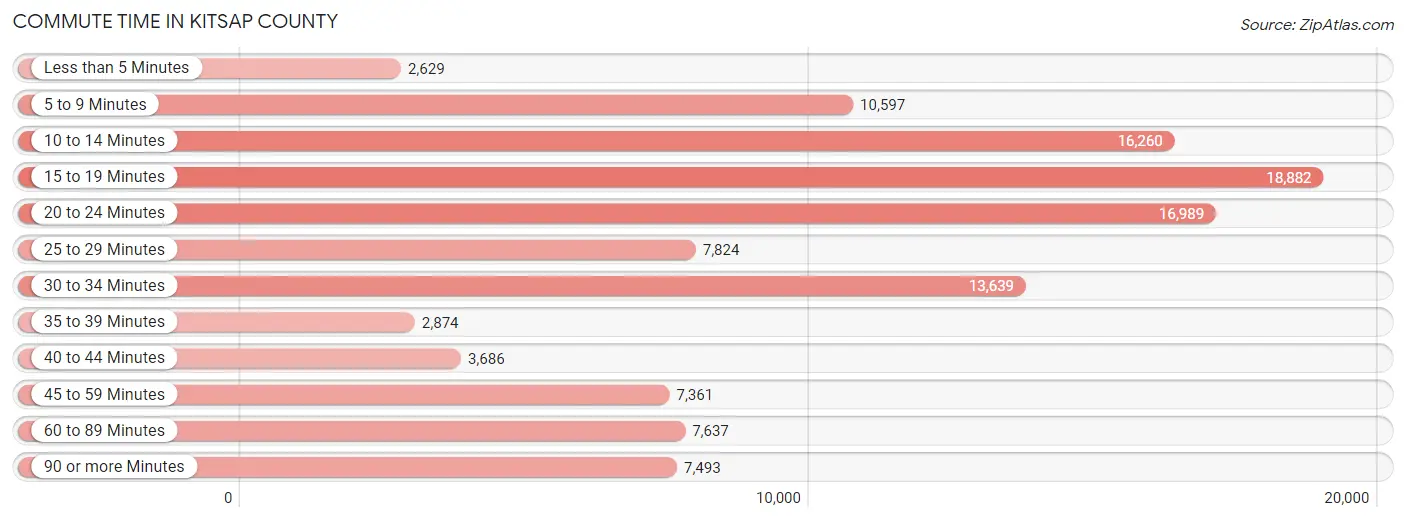
| Commute Time | # Commuters | % Commuters |
| Less than 5 Minutes | 2,629 | 2.3% |
| 5 to 9 Minutes | 10,597 | 9.1% |
| 10 to 14 Minutes | 16,260 | 14.0% |
| 15 to 19 Minutes | 18,882 | 16.3% |
| 20 to 24 Minutes | 16,989 | 14.7% |
| 25 to 29 Minutes | 7,824 | 6.8% |
| 30 to 34 Minutes | 13,639 | 11.8% |
| 35 to 39 Minutes | 2,874 | 2.5% |
| 40 to 44 Minutes | 3,686 | 3.2% |
| 45 to 59 Minutes | 7,361 | 6.4% |
| 60 to 89 Minutes | 7,637 | 6.6% |
| 90 or more Minutes | 7,493 | 6.5% |
Commute Time by Sex in Kitsap County
The most common commute times in Kitsap County are 15 to 19 minutes (11,021 commuters, 16.0%) for males and 15 to 19 minutes (7,861 commuters, 16.7%) for females.
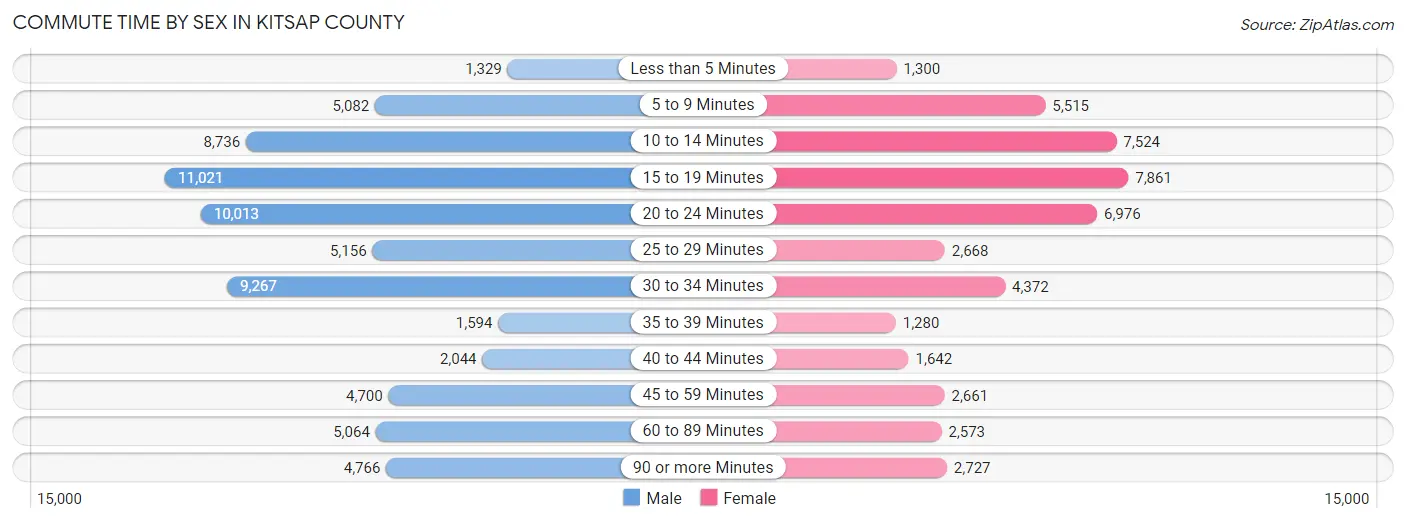
| Commute Time | Male | Female |
| Less than 5 Minutes | 1,329 (1.9%) | 1,300 (2.8%) |
| 5 to 9 Minutes | 5,082 (7.4%) | 5,515 (11.7%) |
| 10 to 14 Minutes | 8,736 (12.7%) | 7,524 (16.0%) |
| 15 to 19 Minutes | 11,021 (16.0%) | 7,861 (16.7%) |
| 20 to 24 Minutes | 10,013 (14.6%) | 6,976 (14.8%) |
| 25 to 29 Minutes | 5,156 (7.5%) | 2,668 (5.7%) |
| 30 to 34 Minutes | 9,267 (13.5%) | 4,372 (9.3%) |
| 35 to 39 Minutes | 1,594 (2.3%) | 1,280 (2.7%) |
| 40 to 44 Minutes | 2,044 (3.0%) | 1,642 (3.5%) |
| 45 to 59 Minutes | 4,700 (6.8%) | 2,661 (5.7%) |
| 60 to 89 Minutes | 5,064 (7.4%) | 2,573 (5.5%) |
| 90 or more Minutes | 4,766 (6.9%) | 2,727 (5.8%) |
Time of Departure to Work by Sex in Kitsap County
The most frequent times of departure to work in Kitsap County are 6:00 AM to 6:29 AM (9,450, 13.7%) for males and 7:00 AM to 7:29 AM (6,011, 12.8%) for females.
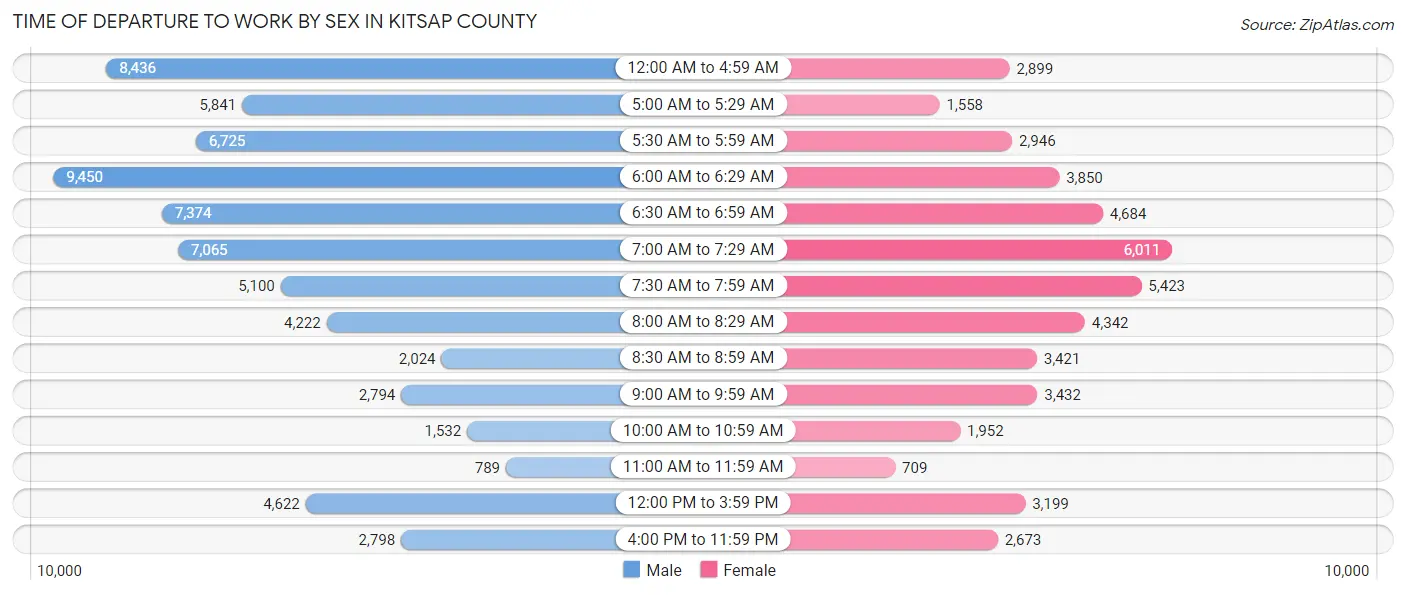
| Time of Departure | Male | Female |
| 12:00 AM to 4:59 AM | 8,436 (12.3%) | 2,899 (6.2%) |
| 5:00 AM to 5:29 AM | 5,841 (8.5%) | 1,558 (3.3%) |
| 5:30 AM to 5:59 AM | 6,725 (9.8%) | 2,946 (6.2%) |
| 6:00 AM to 6:29 AM | 9,450 (13.7%) | 3,850 (8.2%) |
| 6:30 AM to 6:59 AM | 7,374 (10.7%) | 4,684 (10.0%) |
| 7:00 AM to 7:29 AM | 7,065 (10.3%) | 6,011 (12.8%) |
| 7:30 AM to 7:59 AM | 5,100 (7.4%) | 5,423 (11.5%) |
| 8:00 AM to 8:29 AM | 4,222 (6.1%) | 4,342 (9.2%) |
| 8:30 AM to 8:59 AM | 2,024 (2.9%) | 3,421 (7.3%) |
| 9:00 AM to 9:59 AM | 2,794 (4.1%) | 3,432 (7.3%) |
| 10:00 AM to 10:59 AM | 1,532 (2.2%) | 1,952 (4.1%) |
| 11:00 AM to 11:59 AM | 789 (1.1%) | 709 (1.5%) |
| 12:00 PM to 3:59 PM | 4,622 (6.7%) | 3,199 (6.8%) |
| 4:00 PM to 11:59 PM | 2,798 (4.1%) | 2,673 (5.7%) |
| Total | 68,772 (100.0%) | 47,099 (100.0%) |
Housing Occupancy in Kitsap County
Occupancy by Ownership in Kitsap County
Of the total 106,031 dwellings in Kitsap County, owner-occupied units account for 74,050 (69.8%), while renter-occupied units make up 31,981 (30.2%).
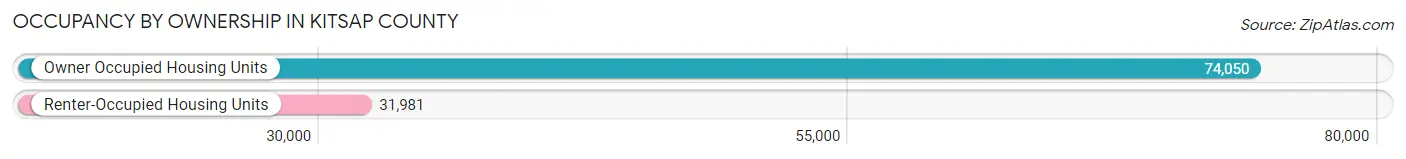
| Occupancy | # Housing Units | % Housing Units |
| Owner Occupied Housing Units | 74,050 | 69.8% |
| Renter-Occupied Housing Units | 31,981 | 30.2% |
| Total Occupied Housing Units | 106,031 | 100.0% |
Occupancy by Household Size in Kitsap County
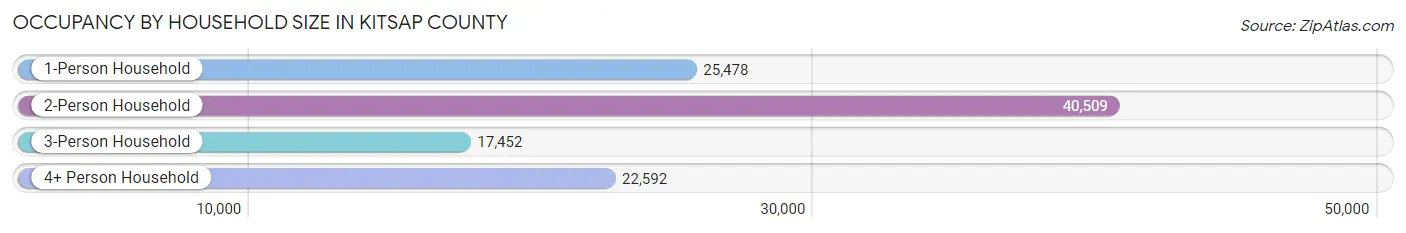
| Household Size | # Housing Units | % Housing Units |
| 1-Person Household | 25,478 | 24.0% |
| 2-Person Household | 40,509 | 38.2% |
| 3-Person Household | 17,452 | 16.5% |
| 4+ Person Household | 22,592 | 21.3% |
| Total Housing Units | 106,031 | 100.0% |
Occupancy by Ownership by Household Size in Kitsap County
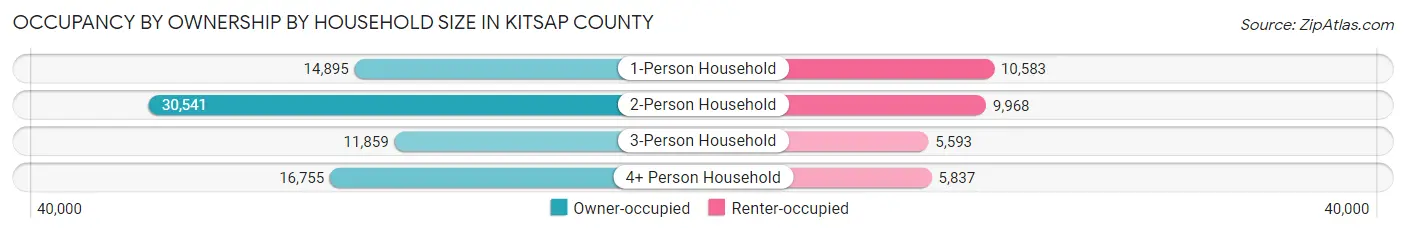
| Household Size | Owner-occupied | Renter-occupied |
| 1-Person Household | 14,895 (58.5%) | 10,583 (41.5%) |
| 2-Person Household | 30,541 (75.4%) | 9,968 (24.6%) |
| 3-Person Household | 11,859 (67.9%) | 5,593 (32.1%) |
| 4+ Person Household | 16,755 (74.2%) | 5,837 (25.8%) |
| Total Housing Units | 74,050 (69.8%) | 31,981 (30.2%) |
Occupancy by Educational Attainment in Kitsap County
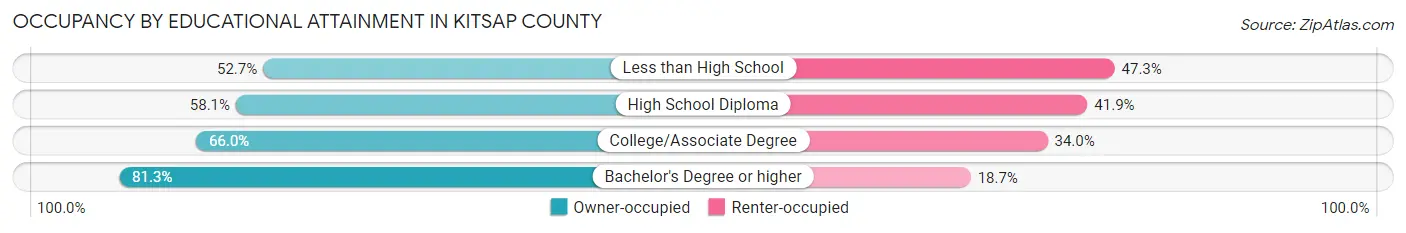
| Household Size | Owner-occupied | Renter-occupied |
| Less than High School | 2,036 (52.7%) | 1,825 (47.3%) |
| High School Diploma | 10,825 (58.1%) | 7,801 (41.9%) |
| College/Associate Degree | 29,014 (66.0%) | 14,934 (34.0%) |
| Bachelor's Degree or higher | 32,175 (81.3%) | 7,421 (18.7%) |
Occupancy by Age of Householder in Kitsap County
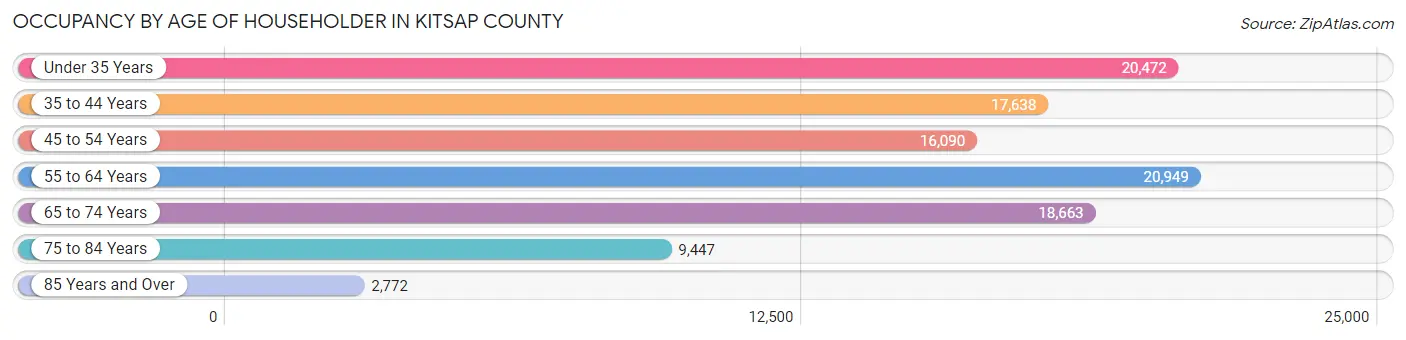
| Age Bracket | # Households | % Households |
| Under 35 Years | 20,472 | 19.3% |
| 35 to 44 Years | 17,638 | 16.6% |
| 45 to 54 Years | 16,090 | 15.2% |
| 55 to 64 Years | 20,949 | 19.8% |
| 65 to 74 Years | 18,663 | 17.6% |
| 75 to 84 Years | 9,447 | 8.9% |
| 85 Years and Over | 2,772 | 2.6% |
| Total | 106,031 | 100.0% |
Housing Finances in Kitsap County
Median Income by Occupancy in Kitsap County
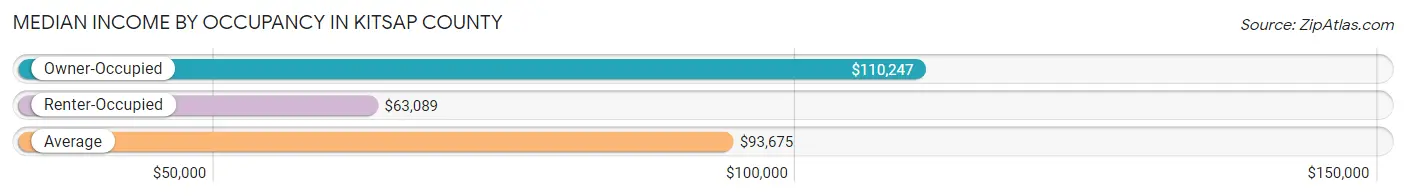
| Occupancy Type | # Households | Median Income |
| Owner-Occupied | 74,050 (69.8%) | $110,247 |
| Renter-Occupied | 31,981 (30.2%) | $63,089 |
| Average | 106,031 (100.0%) | $93,675 |
Occupancy by Householder Income Bracket in Kitsap County
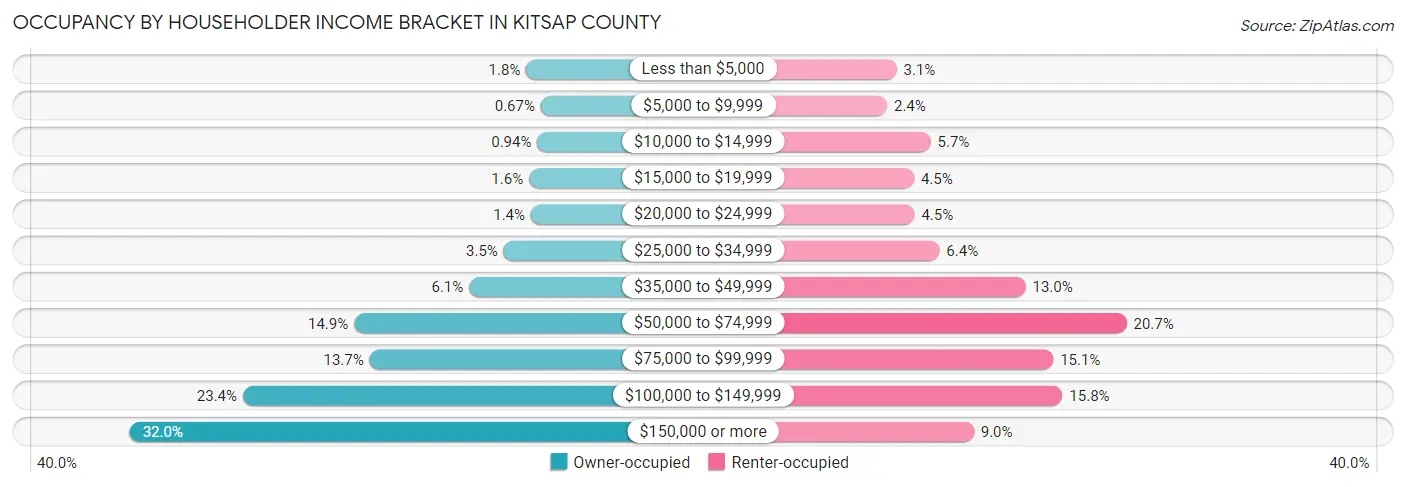
| Income Bracket | Owner-occupied | Renter-occupied |
| Less than $5,000 | 1,316 (1.8%) | 1,001 (3.1%) |
| $5,000 to $9,999 | 497 (0.7%) | 766 (2.4%) |
| $10,000 to $14,999 | 696 (0.9%) | 1,828 (5.7%) |
| $15,000 to $19,999 | 1,163 (1.6%) | 1,424 (4.4%) |
| $20,000 to $24,999 | 1,062 (1.4%) | 1,436 (4.5%) |
| $25,000 to $34,999 | 2,590 (3.5%) | 2,045 (6.4%) |
| $35,000 to $49,999 | 4,542 (6.1%) | 4,142 (13.0%) |
| $50,000 to $74,999 | 11,031 (14.9%) | 6,605 (20.6%) |
| $75,000 to $99,999 | 10,161 (13.7%) | 4,815 (15.1%) |
| $100,000 to $149,999 | 17,302 (23.4%) | 5,039 (15.8%) |
| $150,000 or more | 23,690 (32.0%) | 2,880 (9.0%) |
| Total | 74,050 (100.0%) | 31,981 (100.0%) |
Monthly Housing Cost Tiers in Kitsap County
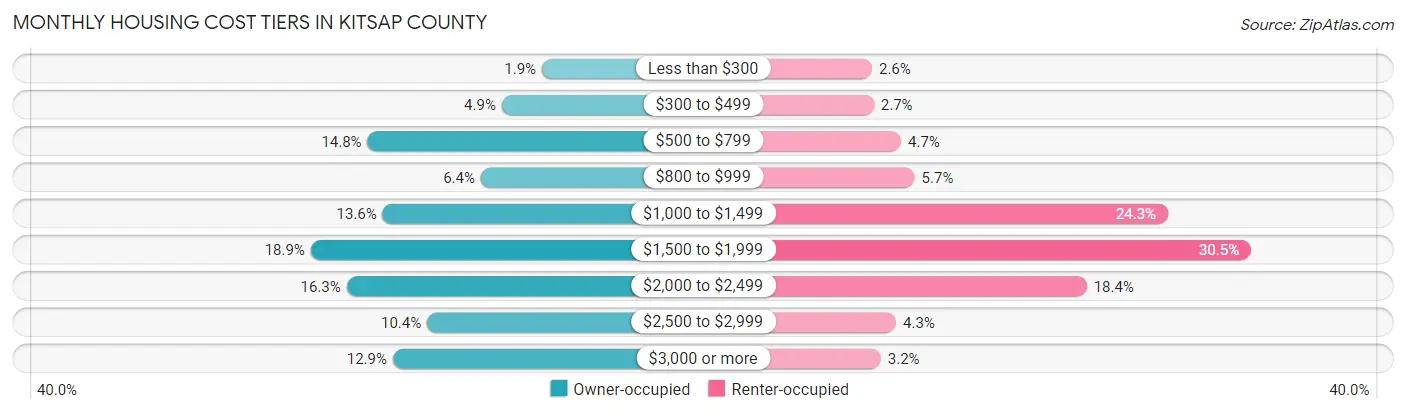
| Monthly Cost | Owner-occupied | Renter-occupied |
| Less than $300 | 1,407 (1.9%) | 815 (2.5%) |
| $300 to $499 | 3,596 (4.9%) | 858 (2.7%) |
| $500 to $799 | 10,924 (14.7%) | 1,499 (4.7%) |
| $800 to $999 | 4,737 (6.4%) | 1,821 (5.7%) |
| $1,000 to $1,499 | 10,100 (13.6%) | 7,783 (24.3%) |
| $1,500 to $1,999 | 14,019 (18.9%) | 9,740 (30.5%) |
| $2,000 to $2,499 | 12,062 (16.3%) | 5,871 (18.4%) |
| $2,500 to $2,999 | 7,669 (10.4%) | 1,383 (4.3%) |
| $3,000 or more | 9,536 (12.9%) | 1,023 (3.2%) |
| Total | 74,050 (100.0%) | 31,981 (100.0%) |
Physical Housing Characteristics in Kitsap County
Housing Structures in Kitsap County
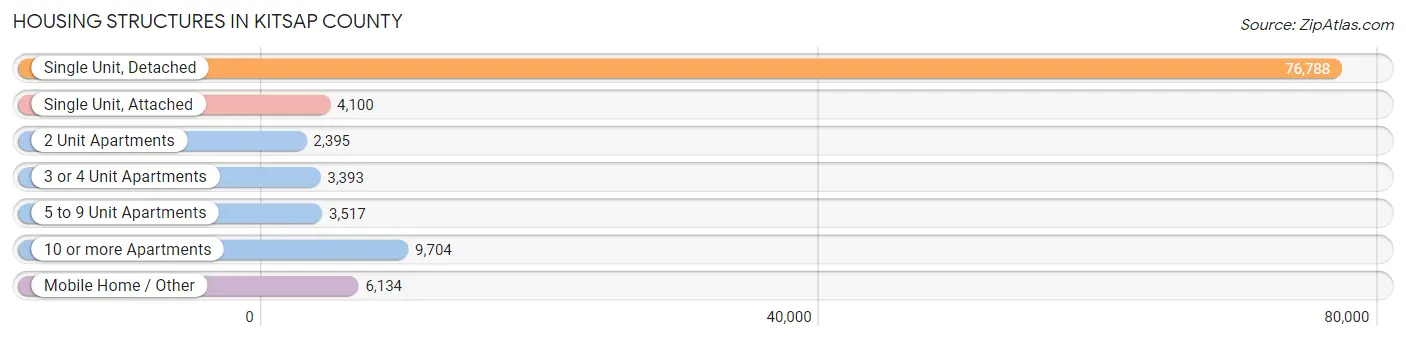
| Structure Type | # Housing Units | % Housing Units |
| Single Unit, Detached | 76,788 | 72.4% |
| Single Unit, Attached | 4,100 | 3.9% |
| 2 Unit Apartments | 2,395 | 2.3% |
| 3 or 4 Unit Apartments | 3,393 | 3.2% |
| 5 to 9 Unit Apartments | 3,517 | 3.3% |
| 10 or more Apartments | 9,704 | 9.1% |
| Mobile Home / Other | 6,134 | 5.8% |
| Total | 106,031 | 100.0% |
Housing Structures by Occupancy in Kitsap County
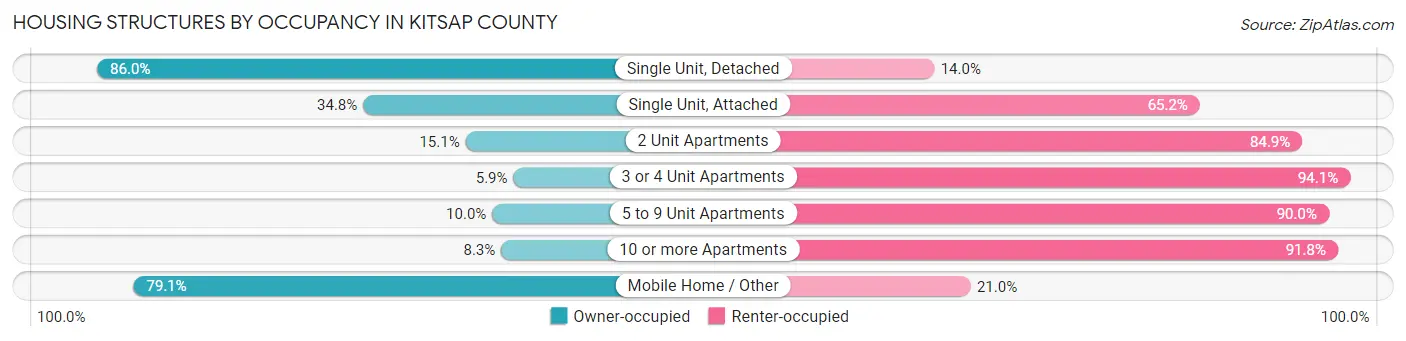
| Structure Type | Owner-occupied | Renter-occupied |
| Single Unit, Detached | 66,059 (86.0%) | 10,729 (14.0%) |
| Single Unit, Attached | 1,428 (34.8%) | 2,672 (65.2%) |
| 2 Unit Apartments | 362 (15.1%) | 2,033 (84.9%) |
| 3 or 4 Unit Apartments | 200 (5.9%) | 3,193 (94.1%) |
| 5 to 9 Unit Apartments | 351 (10.0%) | 3,166 (90.0%) |
| 10 or more Apartments | 801 (8.3%) | 8,903 (91.7%) |
| Mobile Home / Other | 4,849 (79.0%) | 1,285 (20.9%) |
| Total | 74,050 (69.8%) | 31,981 (30.2%) |
Housing Structures by Number of Rooms in Kitsap County
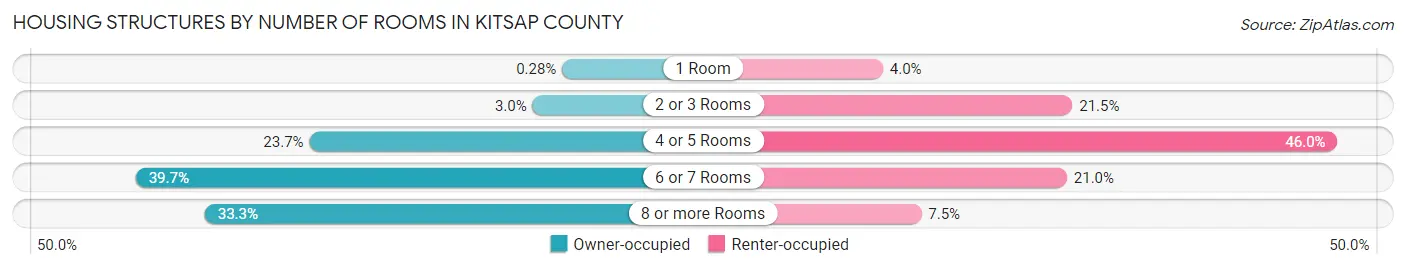
| Number of Rooms | Owner-occupied | Renter-occupied |
| 1 Room | 209 (0.3%) | 1,270 (4.0%) |
| 2 or 3 Rooms | 2,236 (3.0%) | 6,874 (21.5%) |
| 4 or 5 Rooms | 17,517 (23.7%) | 14,715 (46.0%) |
| 6 or 7 Rooms | 29,409 (39.7%) | 6,714 (21.0%) |
| 8 or more Rooms | 24,679 (33.3%) | 2,408 (7.5%) |
| Total | 74,050 (100.0%) | 31,981 (100.0%) |
Housing Structure by Heating Type in Kitsap County
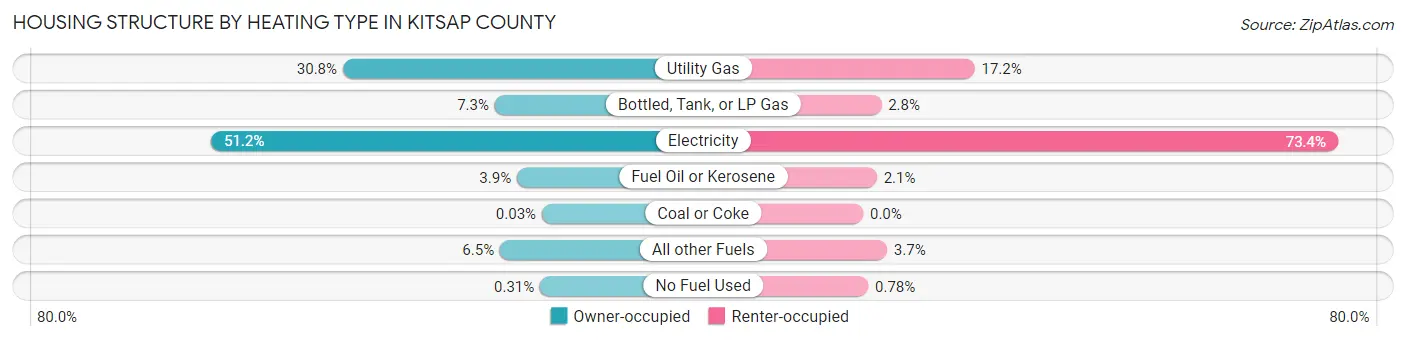
| Heating Type | Owner-occupied | Renter-occupied |
| Utility Gas | 22,805 (30.8%) | 5,513 (17.2%) |
| Bottled, Tank, or LP Gas | 5,413 (7.3%) | 898 (2.8%) |
| Electricity | 37,892 (51.2%) | 23,467 (73.4%) |
| Fuel Oil or Kerosene | 2,871 (3.9%) | 675 (2.1%) |
| Coal or Coke | 24 (0.0%) | 0 (0.0%) |
| All other Fuels | 4,817 (6.5%) | 1,180 (3.7%) |
| No Fuel Used | 228 (0.3%) | 248 (0.8%) |
| Total | 74,050 (100.0%) | 31,981 (100.0%) |
Household Vehicle Usage in Kitsap County
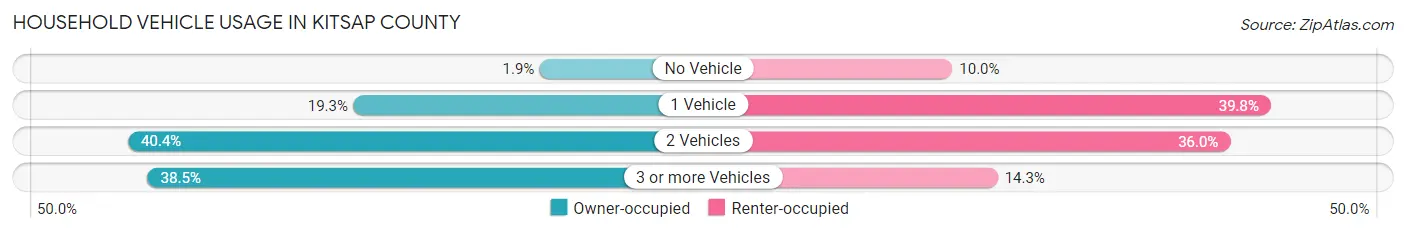
| Vehicles per Household | Owner-occupied | Renter-occupied |
| No Vehicle | 1,388 (1.9%) | 3,207 (10.0%) |
| 1 Vehicle | 14,266 (19.3%) | 12,712 (39.8%) |
| 2 Vehicles | 29,876 (40.4%) | 11,501 (36.0%) |
| 3 or more Vehicles | 28,520 (38.5%) | 4,561 (14.3%) |
| Total | 74,050 (100.0%) | 31,981 (100.0%) |
Real Estate & Mortgages in Kitsap County
Real Estate and Mortgage Overview in Kitsap County
| Characteristic | Without Mortgage | With Mortgage |
| Housing Units | 23,087 | 50,963 |
| Median Property Value | $464,700 | $462,400 |
| Median Household Income | $83,648 | $18,647 |
| Monthly Housing Costs | $688 | $9,456 |
| Real Estate Taxes | $4,042 | $603 |
Property Value by Mortgage Status in Kitsap County
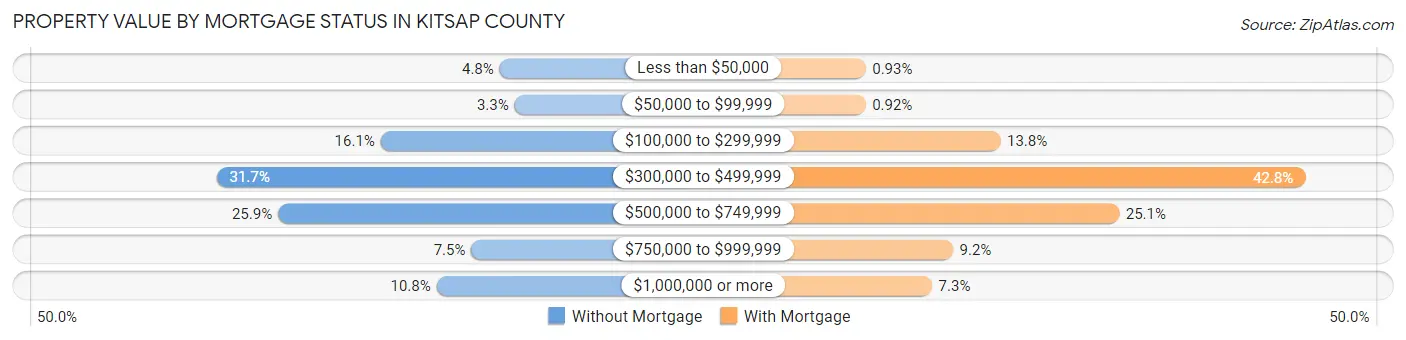
| Property Value | Without Mortgage | With Mortgage |
| Less than $50,000 | 1,100 (4.8%) | 476 (0.9%) |
| $50,000 to $99,999 | 770 (3.3%) | 468 (0.9%) |
| $100,000 to $299,999 | 3,714 (16.1%) | 7,013 (13.8%) |
| $300,000 to $499,999 | 7,323 (31.7%) | 21,824 (42.8%) |
| $500,000 to $749,999 | 5,972 (25.9%) | 12,776 (25.1%) |
| $750,000 to $999,999 | 1,722 (7.5%) | 4,710 (9.2%) |
| $1,000,000 or more | 2,486 (10.8%) | 3,696 (7.2%) |
| Total | 23,087 (100.0%) | 50,963 (100.0%) |
Household Income by Mortgage Status in Kitsap County
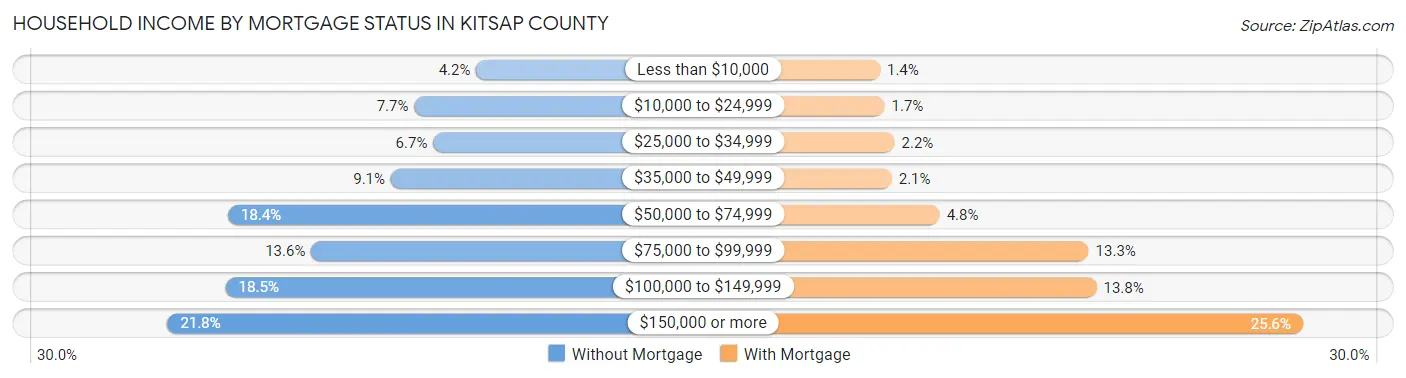
| Household Income | Without Mortgage | With Mortgage |
| Less than $10,000 | 968 (4.2%) | 715 (1.4%) |
| $10,000 to $24,999 | 1,785 (7.7%) | 845 (1.7%) |
| $25,000 to $34,999 | 1,536 (6.7%) | 1,136 (2.2%) |
| $35,000 to $49,999 | 2,093 (9.1%) | 1,054 (2.1%) |
| $50,000 to $74,999 | 4,244 (18.4%) | 2,449 (4.8%) |
| $75,000 to $99,999 | 3,144 (13.6%) | 6,787 (13.3%) |
| $100,000 to $149,999 | 4,274 (18.5%) | 7,017 (13.8%) |
| $150,000 or more | 5,043 (21.8%) | 13,028 (25.6%) |
| Total | 23,087 (100.0%) | 50,963 (100.0%) |
Property Value to Household Income Ratio in Kitsap County
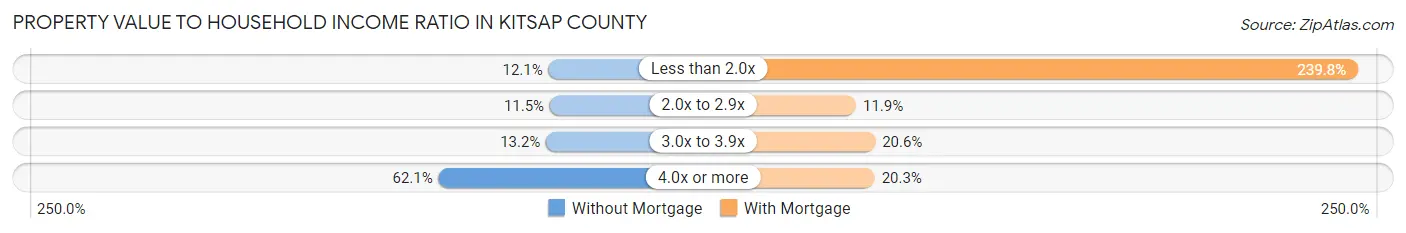
| Value-to-Income Ratio | Without Mortgage | With Mortgage |
| Less than 2.0x | 2,794 (12.1%) | 122,187 (239.8%) |
| 2.0x to 2.9x | 2,649 (11.5%) | 6,041 (11.8%) |
| 3.0x to 3.9x | 3,042 (13.2%) | 10,472 (20.5%) |
| 4.0x or more | 14,330 (62.1%) | 10,361 (20.3%) |
| Total | 23,087 (100.0%) | 50,963 (100.0%) |
Real Estate Taxes by Mortgage Status in Kitsap County
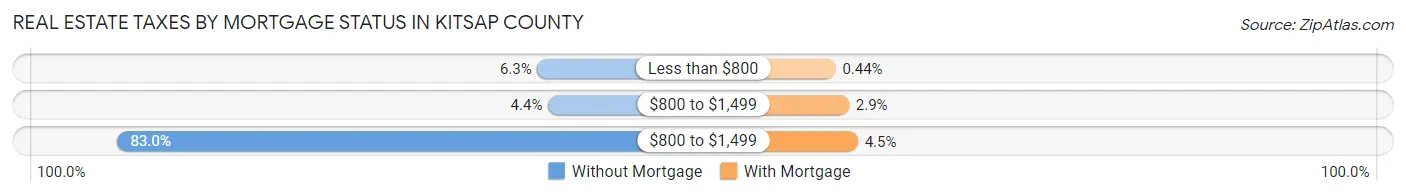
| Property Taxes | Without Mortgage | With Mortgage |
| Less than $800 | 1,456 (6.3%) | 224 (0.4%) |
| $800 to $1,499 | 1,007 (4.4%) | 1,474 (2.9%) |
| $800 to $1,499 | 19,169 (83.0%) | 2,294 (4.5%) |
| Total | 23,087 (100.0%) | 50,963 (100.0%) |
Health & Disability in Kitsap County
Health Insurance Coverage by Age in Kitsap County
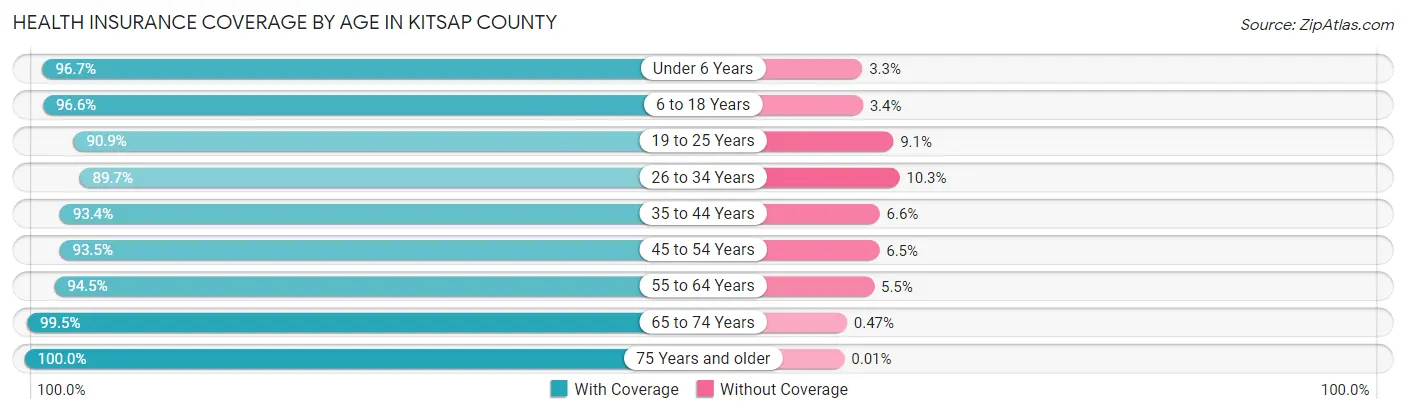
| Age Bracket | With Coverage | Without Coverage |
| Under 6 Years | 17,098 (96.7%) | 591 (3.3%) |
| 6 to 18 Years | 38,751 (96.6%) | 1,376 (3.4%) |
| 19 to 25 Years | 17,498 (90.9%) | 1,756 (9.1%) |
| 26 to 34 Years | 28,690 (89.7%) | 3,284 (10.3%) |
| 35 to 44 Years | 30,421 (93.4%) | 2,144 (6.6%) |
| 45 to 54 Years | 28,599 (93.5%) | 1,997 (6.5%) |
| 55 to 64 Years | 34,999 (94.5%) | 2,054 (5.5%) |
| 65 to 74 Years | 31,335 (99.5%) | 148 (0.5%) |
| 75 Years and older | 18,992 (100.0%) | 2 (0.0%) |
| Total | 246,383 (94.9%) | 13,352 (5.1%) |
Health Insurance Coverage by Citizenship Status in Kitsap County
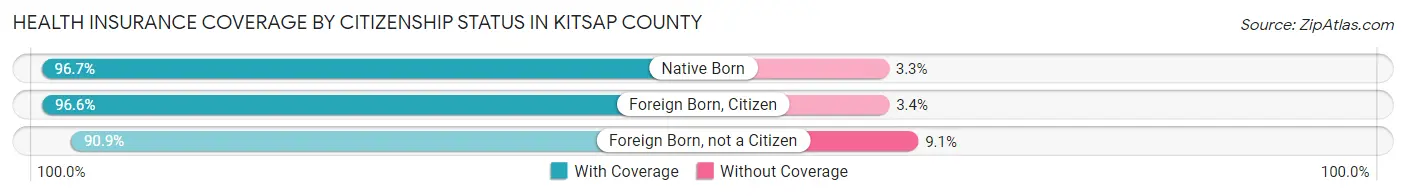
| Citizenship Status | With Coverage | Without Coverage |
| Native Born | 17,098 (96.7%) | 591 (3.3%) |
| Foreign Born, Citizen | 38,751 (96.6%) | 1,376 (3.4%) |
| Foreign Born, not a Citizen | 17,498 (90.9%) | 1,756 (9.1%) |
Health Insurance Coverage by Household Income in Kitsap County
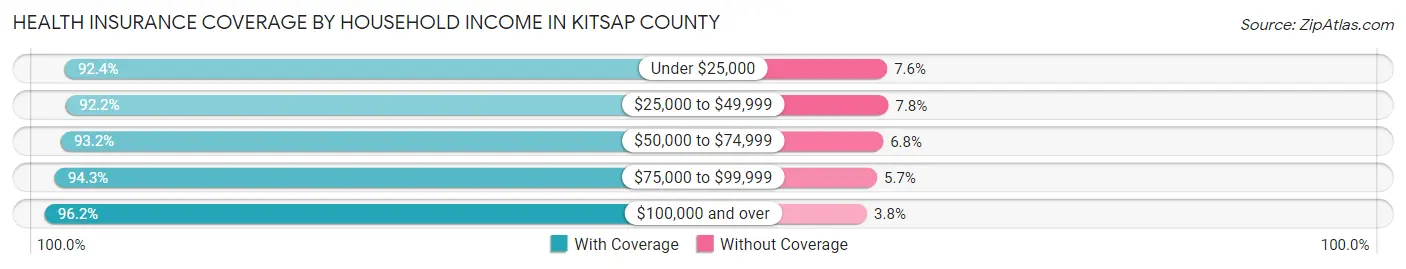
| Household Income | With Coverage | Without Coverage |
| Under $25,000 | 17,245 (92.4%) | 1,412 (7.6%) |
| $25,000 to $49,999 | 22,629 (92.2%) | 1,919 (7.8%) |
| $50,000 to $74,999 | 34,107 (93.2%) | 2,496 (6.8%) |
| $75,000 to $99,999 | 33,957 (94.3%) | 2,045 (5.7%) |
| $100,000 and over | 137,515 (96.2%) | 5,450 (3.8%) |
Public vs Private Health Insurance Coverage by Age in Kitsap County
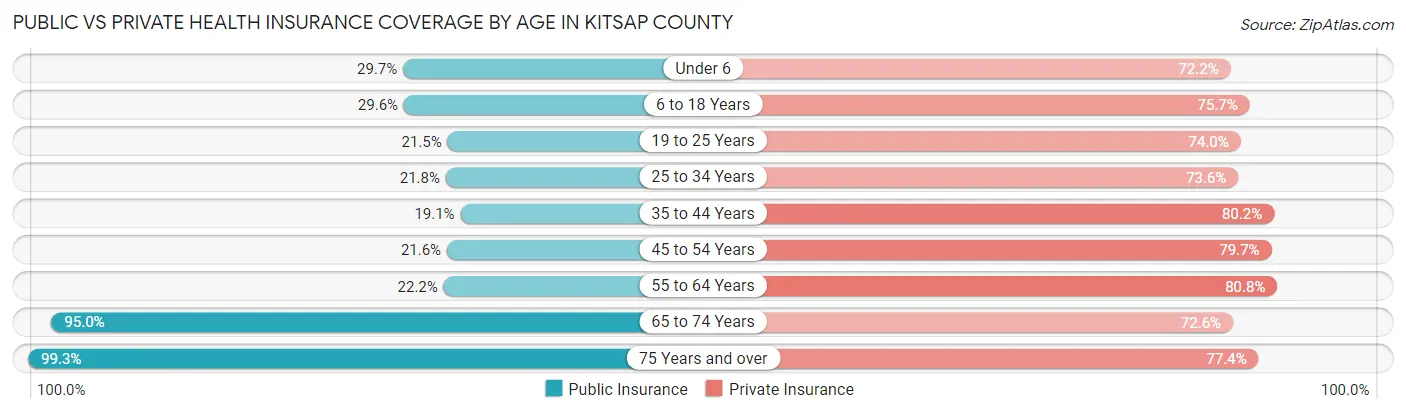
| Age Bracket | Public Insurance | Private Insurance |
| Under 6 | 5,261 (29.7%) | 12,763 (72.2%) |
| 6 to 18 Years | 11,878 (29.6%) | 30,373 (75.7%) |
| 19 to 25 Years | 4,138 (21.5%) | 14,251 (74.0%) |
| 25 to 34 Years | 6,978 (21.8%) | 23,522 (73.6%) |
| 35 to 44 Years | 6,220 (19.1%) | 26,130 (80.2%) |
| 45 to 54 Years | 6,613 (21.6%) | 24,396 (79.7%) |
| 55 to 64 Years | 8,238 (22.2%) | 29,945 (80.8%) |
| 65 to 74 Years | 29,915 (95.0%) | 22,852 (72.6%) |
| 75 Years and over | 18,868 (99.3%) | 14,694 (77.4%) |
| Total | 98,109 (37.8%) | 198,926 (76.6%) |
Disability Status by Sex by Age in Kitsap County
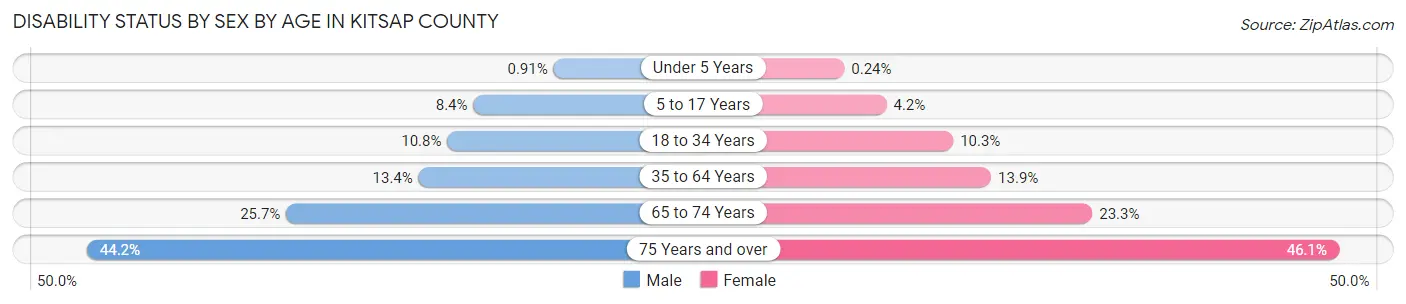
| Age Bracket | Male | Female |
| Under 5 Years | 70 (0.9%) | 17 (0.2%) |
| 5 to 17 Years | 1,716 (8.4%) | 814 (4.2%) |
| 18 to 34 Years | 2,934 (10.8%) | 2,775 (10.3%) |
| 35 to 64 Years | 6,664 (13.4%) | 7,013 (13.9%) |
| 65 to 74 Years | 3,862 (25.7%) | 3,828 (23.3%) |
| 75 Years and over | 3,765 (44.2%) | 4,833 (46.1%) |
Disability Class by Sex by Age in Kitsap County
Disability Class: Hearing Difficulty
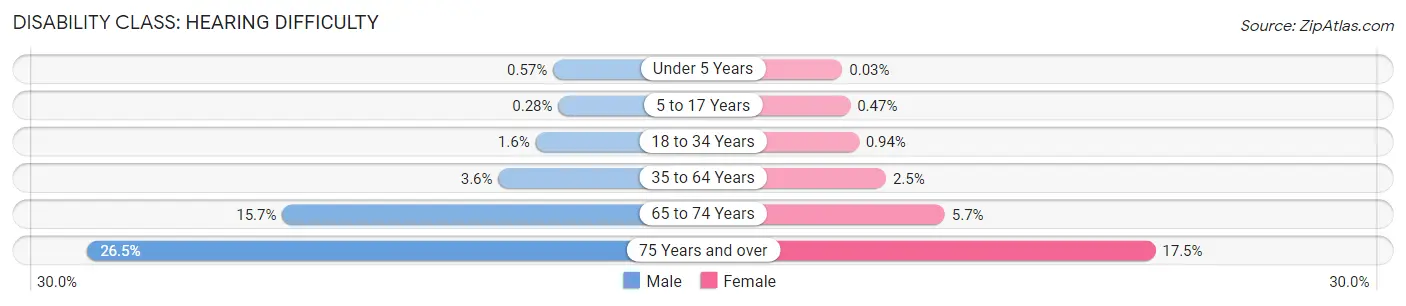
| Age Bracket | Male | Female |
| Under 5 Years | 44 (0.6%) | 2 (0.0%) |
| 5 to 17 Years | 58 (0.3%) | 93 (0.5%) |
| 18 to 34 Years | 421 (1.5%) | 252 (0.9%) |
| 35 to 64 Years | 1,797 (3.6%) | 1,242 (2.5%) |
| 65 to 74 Years | 2,350 (15.7%) | 946 (5.7%) |
| 75 Years and over | 2,257 (26.5%) | 1,830 (17.5%) |
Disability Class: Vision Difficulty
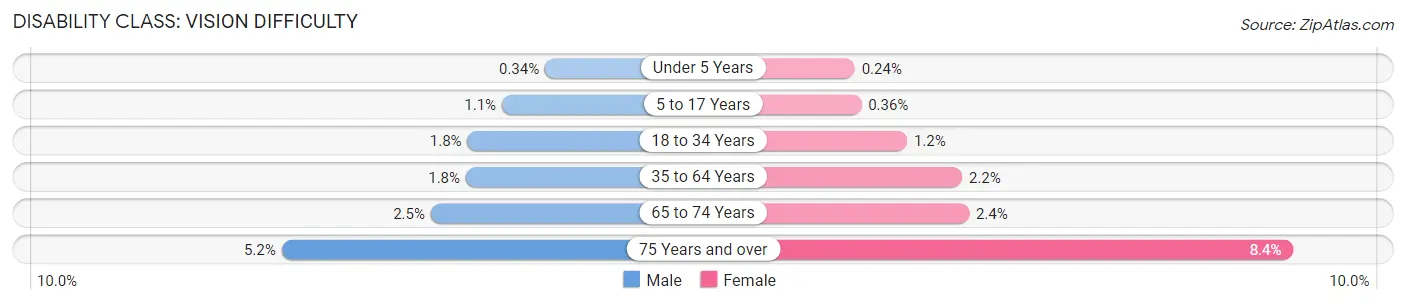
| Age Bracket | Male | Female |
| Under 5 Years | 26 (0.3%) | 17 (0.2%) |
| 5 to 17 Years | 234 (1.1%) | 71 (0.4%) |
| 18 to 34 Years | 486 (1.8%) | 324 (1.2%) |
| 35 to 64 Years | 898 (1.8%) | 1,129 (2.2%) |
| 65 to 74 Years | 369 (2.5%) | 389 (2.4%) |
| 75 Years and over | 445 (5.2%) | 878 (8.4%) |
Disability Class: Cognitive Difficulty
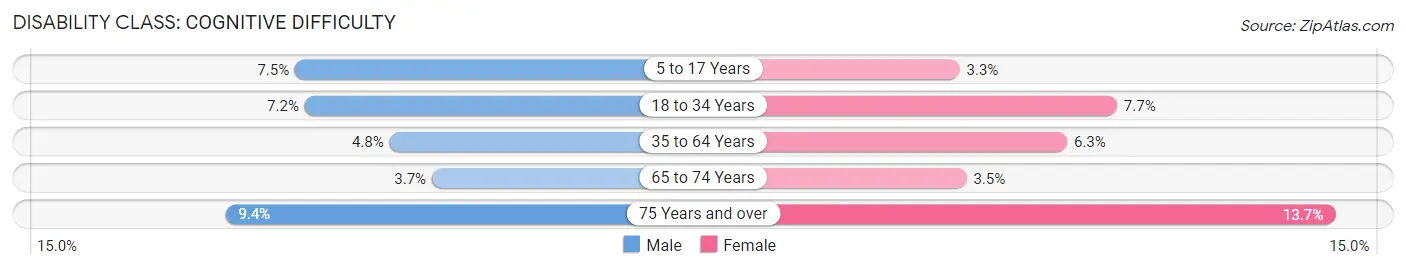
| Age Bracket | Male | Female |
| 5 to 17 Years | 1,534 (7.5%) | 643 (3.3%) |
| 18 to 34 Years | 1,961 (7.2%) | 2,057 (7.7%) |
| 35 to 64 Years | 2,400 (4.8%) | 3,174 (6.3%) |
| 65 to 74 Years | 550 (3.7%) | 571 (3.5%) |
| 75 Years and over | 801 (9.4%) | 1,439 (13.7%) |
Disability Class: Ambulatory Difficulty
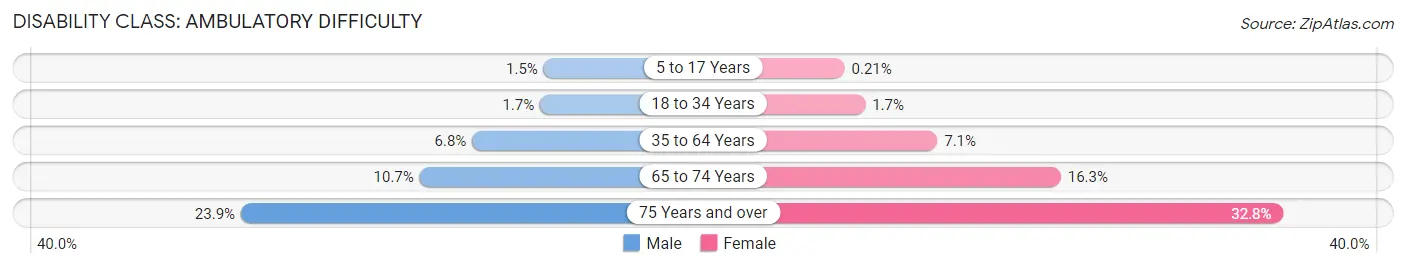
| Age Bracket | Male | Female |
| 5 to 17 Years | 301 (1.5%) | 41 (0.2%) |
| 18 to 34 Years | 471 (1.7%) | 468 (1.7%) |
| 35 to 64 Years | 3,359 (6.8%) | 3,586 (7.1%) |
| 65 to 74 Years | 1,602 (10.7%) | 2,678 (16.3%) |
| 75 Years and over | 2,038 (23.9%) | 3,435 (32.8%) |
Disability Class: Self-Care Difficulty
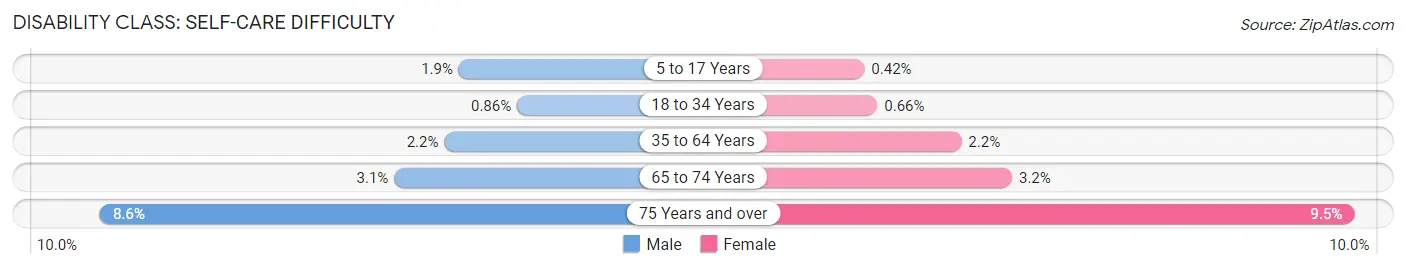
| Age Bracket | Male | Female |
| 5 to 17 Years | 398 (1.9%) | 83 (0.4%) |
| 18 to 34 Years | 235 (0.9%) | 177 (0.7%) |
| 35 to 64 Years | 1,099 (2.2%) | 1,123 (2.2%) |
| 65 to 74 Years | 472 (3.1%) | 520 (3.2%) |
| 75 Years and over | 732 (8.6%) | 997 (9.5%) |
Technology Access in Kitsap County
Computing Device Access in Kitsap County
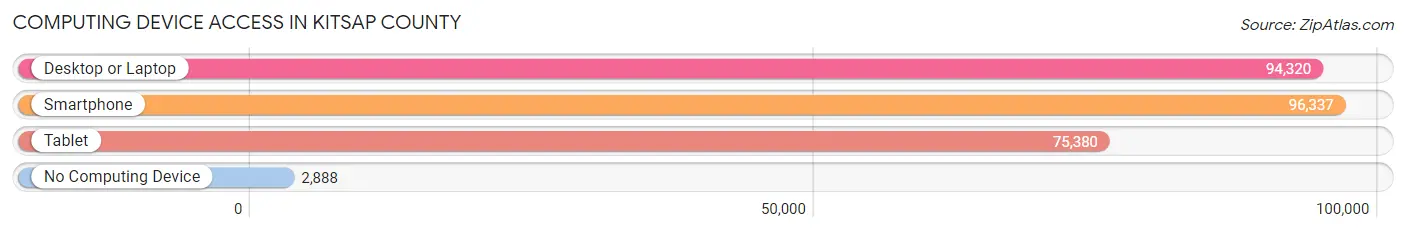
| Device Type | # Households | % Households |
| Desktop or Laptop | 94,320 | 89.0% |
| Smartphone | 96,337 | 90.9% |
| Tablet | 75,380 | 71.1% |
| No Computing Device | 2,888 | 2.7% |
| Total | 106,031 | 100.0% |
Internet Access in Kitsap County
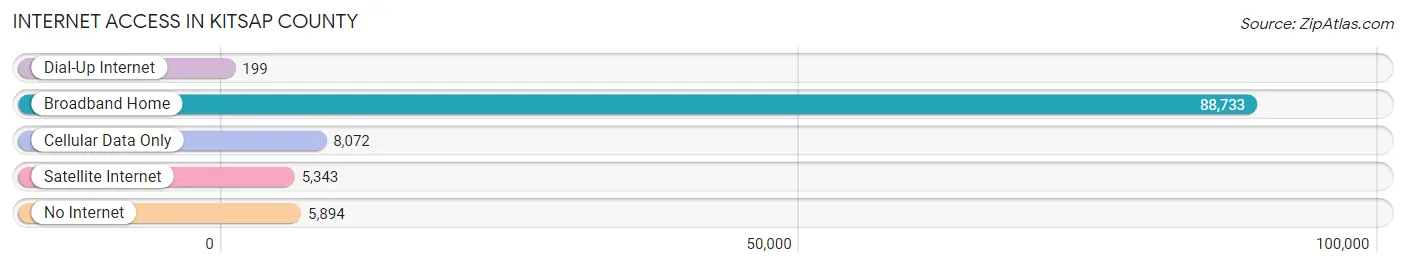
| Internet Type | # Households | % Households |
| Dial-Up Internet | 199 | 0.2% |
| Broadband Home | 88,733 | 83.7% |
| Cellular Data Only | 8,072 | 7.6% |
| Satellite Internet | 5,343 | 5.0% |
| No Internet | 5,894 | 5.6% |
| Total | 106,031 | 100.0% |
Kitsap County Summary
Kitsap County is located in the Puget Sound region of Washington State, and is bordered by the Olympic Mountains to the west, the Hood Canal to the east, and the Strait of Juan de Fuca to the north. The county is home to over 250,000 people, making it the third most populous county in the state. Kitsap County is known for its natural beauty, with its many parks, forests, and beaches, as well as its proximity to Seattle and other major cities in the region.
Geography
Kitsap County is located in the Puget Sound region of Washington State, and is bordered by the Olympic Mountains to the west, the Hood Canal to the east, and the Strait of Juan de Fuca to the north. The county is home to over 250,000 people, making it the third most populous county in the state. Kitsap County is known for its natural beauty, with its many parks, forests, and beaches, as well as its proximity to Seattle and other major cities in the region. The county is divided into two distinct regions: the Kitsap Peninsula and the Olympic Peninsula. The Kitsap Peninsula is the more populated of the two, and is home to the cities of Bremerton, Port Orchard, and Poulsbo. The Olympic Peninsula is less populated, and is home to the cities of Port Angeles, Sequim, and Port Townsend.
History
Kitsap County was first inhabited by the Suquamish and other Native American tribes. The first European settlers arrived in the area in the late 1800s, and the county was officially established in 1857. The county was named after Chief Kitsap of the Suquamish tribe, who was known for his hospitality and friendship towards the settlers.
The county experienced rapid growth in the early 1900s, as the timber and fishing industries flourished. The county was also home to several military bases, including Naval Base Kitsap and Naval Submarine Base Bangor. The county’s economy was further bolstered by the construction of the Hood Canal Bridge in 1961, which connected the Kitsap Peninsula to the Olympic Peninsula.
Economy
Kitsap County’s economy is largely driven by the military, with Naval Base Kitsap and Naval Submarine Base Bangor providing a significant number of jobs. The county is also home to several major employers, including Puget Sound Naval Shipyard, Keyport Naval Undersea Warfare Center, and the Puget Sound Naval Shipyard.
The county is also home to a thriving tourism industry, with its many parks, forests, and beaches. The county is also home to several wineries, breweries, and distilleries, as well as a growing number of restaurants and shops.
Demographics
As of the 2010 census, the population of Kitsap County was 251,133. The population is largely white (83.3%), with smaller percentages of African American (4.2%), Asian (4.2%), and Hispanic or Latino (7.2%) residents. The median household income in the county is $60,845, and the median home value is $269,400.
Conclusion
Kitsap County is a beautiful and vibrant county located in the Puget Sound region of Washington State. The county is home to over 250,000 people, and is known for its natural beauty, its thriving economy, and its diverse population. The county is home to several major employers, as well as a thriving tourism industry, and is a great place to live, work, and play.
Common Questions
What is the Total Population of Kitsap County?
Total Population of Kitsap County is 275,411.
What is the Total Male Population of Kitsap County?
Total Male Population of Kitsap County is 141,665.
What is the Total Female Population of Kitsap County?
Total Female Population of Kitsap County is 133,746.
What is the Ratio of Males per 100 Females in Kitsap County?
There are 105.92 Males per 100 Females in Kitsap County.
What is the Ratio of Females per 100 Males in Kitsap County?
There are 94.41 Females per 100 Males in Kitsap County.
What is the Median Population Age in Kitsap County?
Median Population Age in Kitsap County is 39.7 Years.
What is the Average Family Size in Kitsap County
Average Family Size in Kitsap County is 3.0 People.
What is the Average Household Size in Kitsap County
Average Household Size in Kitsap County is 2.5 People.
What is Per Capita Income in Kitsap County?
Per Capita income in Kitsap County is $47,713.
What is the Median Family Income in Kitsap County?
Median Family Income in Kitsap County is $109,621.
What is the Median Household income in Kitsap County?
Median Household Income in Kitsap County is $93,675.
What is Income or Wage Gap in Kitsap County?
Income or Wage Gap in Kitsap County is 34.4%.
Women in Kitsap County earn 65.6 cents for every dollar earned by a man.
What is Family Income Deficit in Kitsap County?
Family Income Deficit in Kitsap County is $12,277.
Families that are below poverty line in Kitsap County earn $12,277 less on average than the poverty threshold level.
What is Inequality or Gini Index in Kitsap County?
Inequality or Gini Index in Kitsap County is 0.43.
How Large is the Labor Force in Kitsap County?
There are 139,783 People in the Labor Forcein in Kitsap County.
What is the Percentage of People in the Labor Force in Kitsap County?
61.7% of People are in the Labor Force in Kitsap County.
What is the Unemployment Rate in Kitsap County?
Unemployment Rate in Kitsap County is 4.7%.