Island County, WA
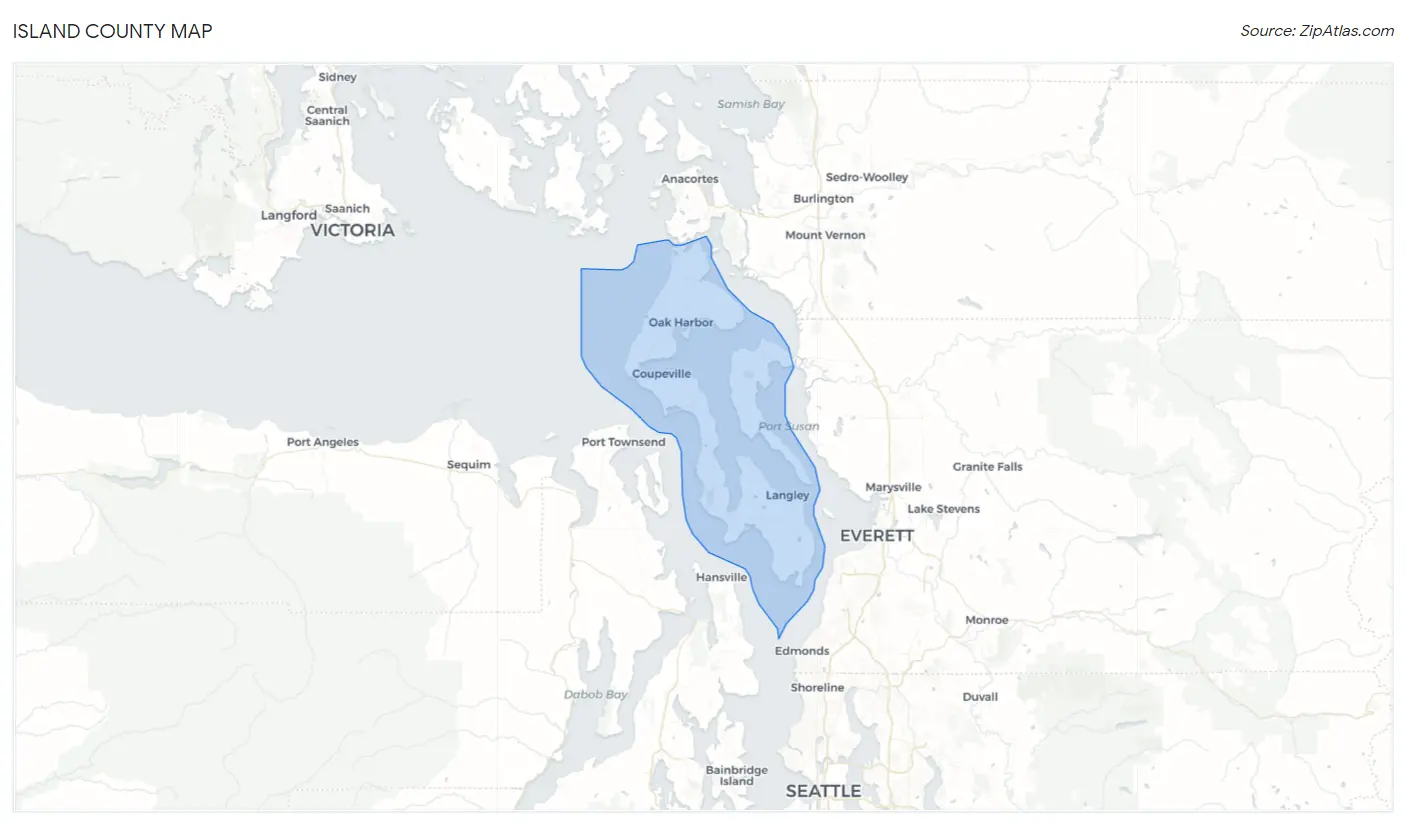
Island County Map
Island County Overview
86,510
TOTAL POPULATION
43,409
MALE POPULATION
43,101
FEMALE POPULATION
100.71
MALES / 100 FEMALES
99.29
FEMALES / 100 MALES
44.2
MEDIAN AGE
2.8
AVG FAMILY SIZE
2.4
AVG HOUSEHOLD SIZE
$44,217
PER CAPITA INCOME
$98,023
AVG FAMILY INCOME
$82,850
AVG HOUSEHOLD INCOME
35.3%
WAGE / INCOME GAP [ % ]
64.7¢/ $1
WAGE / INCOME GAP [ $ ]
$11,176
FAMILY INCOME DEFICIT
0.42
INEQUALITY / GINI INDEX
41,728
LABOR FORCE [ PEOPLE ]
57.4%
PERCENT IN LABOR FORCE
5.5%
UNEMPLOYMENT RATE
Island County Area Codes
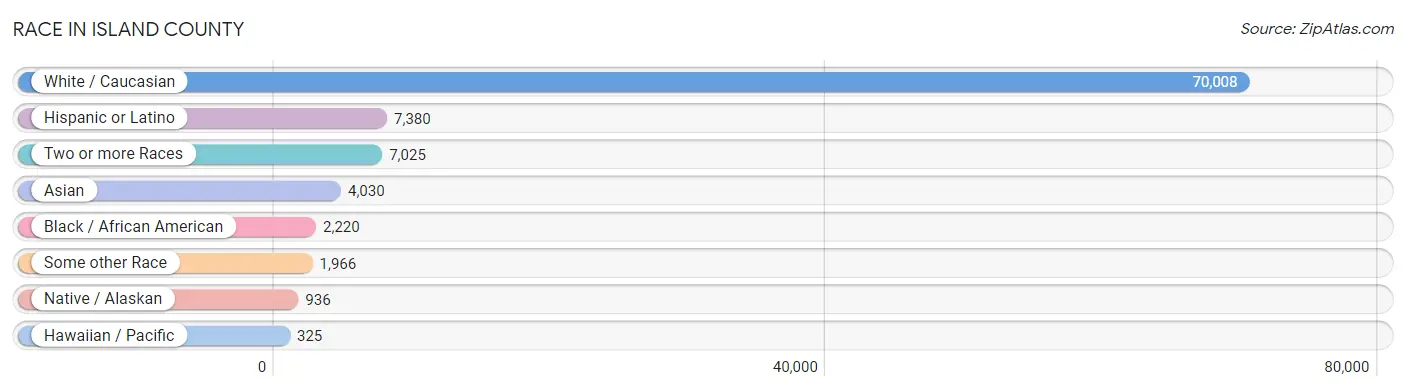
Race in Island County
The most populous races in Island County are White / Caucasian (70,008 | 80.9%), Hispanic or Latino (7,380 | 8.5%), and Two or more Races (7,025 | 8.1%).
| Race | # Population | % Population |
| Asian | 4,030 | 4.7% |
| Black / African American | 2,220 | 2.6% |
| Hawaiian / Pacific | 325 | 0.4% |
| Hispanic or Latino | 7,380 | 8.5% |
| Native / Alaskan | 936 | 1.1% |
| White / Caucasian | 70,008 | 80.9% |
| Two or more Races | 7,025 | 8.1% |
| Some other Race | 1,966 | 2.3% |
| Total | 86,510 | 100.0% |
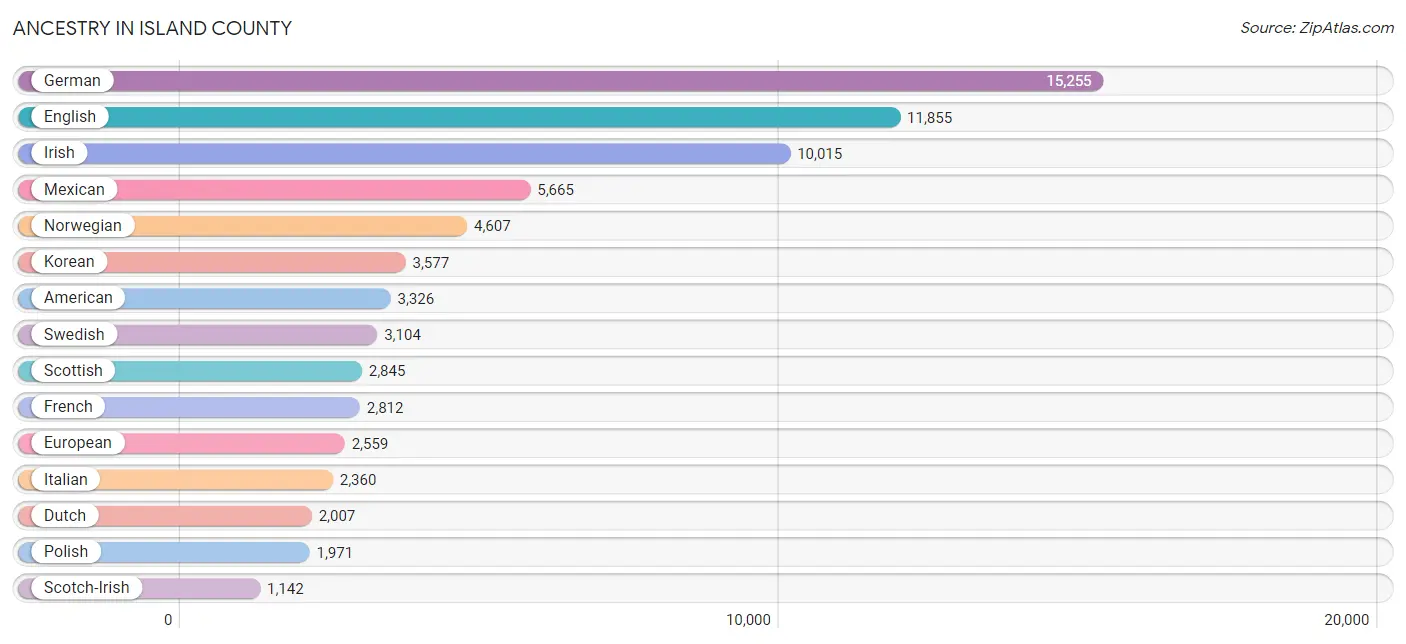
Ancestry in Island County
The most populous ancestries reported in Island County are German (15,255 | 17.6%), English (11,855 | 13.7%), Irish (10,015 | 11.6%), Mexican (5,665 | 6.6%), and Norwegian (4,607 | 5.3%), together accounting for 54.8% of all Island County residents.
| Ancestry | # Population | % Population |
| Afghan | 2 | 0.0% |
| African | 53 | 0.1% |
| Alaska Native | 17 | 0.0% |
| Alaskan Athabascan | 15 | 0.0% |
| Aleut | 33 | 0.0% |
| Alsatian | 12 | 0.0% |
| American | 3,326 | 3.8% |
| Apache | 62 | 0.1% |
| Arab | 128 | 0.2% |
| Armenian | 29 | 0.0% |
| Assyrian / Chaldean / Syriac | 9 | 0.0% |
| Australian | 56 | 0.1% |
| Austrian | 189 | 0.2% |
| Bangladeshi | 35 | 0.0% |
| Barbadian | 34 | 0.0% |
| Basque | 34 | 0.0% |
| Belgian | 190 | 0.2% |
| Belizean | 132 | 0.2% |
| Bhutanese | 648 | 0.7% |
| Blackfeet | 47 | 0.1% |
| British | 1,072 | 1.2% |
| Bulgarian | 7 | 0.0% |
| Burmese | 298 | 0.3% |
| Cajun | 5 | 0.0% |
| Canadian | 314 | 0.4% |
| Celtic | 9 | 0.0% |
| Central American | 324 | 0.4% |
| Central American Indian | 63 | 0.1% |
| Cherokee | 238 | 0.3% |
| Cheyenne | 4 | 0.0% |
| Chickasaw | 33 | 0.0% |
| Chilean | 64 | 0.1% |
| Chinese | 10 | 0.0% |
| Chippewa | 30 | 0.0% |
| Choctaw | 42 | 0.1% |
| Colville | 1 | 0.0% |
| Costa Rican | 4 | 0.0% |
| Croatian | 87 | 0.1% |
| Cuban | 91 | 0.1% |
| Czech | 276 | 0.3% |
| Czechoslovakian | 79 | 0.1% |
| Danish | 979 | 1.1% |
| Dominican | 55 | 0.1% |
| Dutch | 2,007 | 2.3% |
| Eastern European | 153 | 0.2% |
| Ecuadorian | 72 | 0.1% |
| Egyptian | 3 | 0.0% |
| English | 11,855 | 13.7% |
| Estonian | 54 | 0.1% |
| European | 2,559 | 3.0% |
| Fijian | 69 | 0.1% |
| Finnish | 429 | 0.5% |
| French | 2,812 | 3.3% |
| French Canadian | 756 | 0.9% |
| German | 15,255 | 17.6% |
| German Russian | 13 | 0.0% |
| Ghanaian | 7 | 0.0% |
| Greek | 389 | 0.4% |
| Guamanian / Chamorro | 121 | 0.1% |
| Guatemalan | 42 | 0.1% |
| Guyanese | 11 | 0.0% |
| Honduran | 7 | 0.0% |
| Hungarian | 215 | 0.3% |
| Icelander | 34 | 0.0% |
| Indian (Asian) | 776 | 0.9% |
| Indonesian | 6 | 0.0% |
| Inupiat | 42 | 0.1% |
| Iranian | 27 | 0.0% |
| Irish | 10,015 | 11.6% |
| Iroquois | 10 | 0.0% |
| Israeli | 8 | 0.0% |
| Italian | 2,360 | 2.7% |
| Jamaican | 58 | 0.1% |
| Kenyan | 52 | 0.1% |
| Korean | 3,577 | 4.1% |
| Laotian | 9 | 0.0% |
| Latvian | 50 | 0.1% |
| Lebanese | 56 | 0.1% |
| Lithuanian | 83 | 0.1% |
| Luxembourger | 9 | 0.0% |
| Macedonian | 19 | 0.0% |
| Malaysian | 33 | 0.0% |
| Maltese | 29 | 0.0% |
| Mexican | 5,665 | 6.6% |
| Mexican American Indian | 254 | 0.3% |
| Moroccan | 10 | 0.0% |
| Native Hawaiian | 299 | 0.4% |
| Navajo | 238 | 0.3% |
| New Zealander | 54 | 0.1% |
| Nicaraguan | 42 | 0.1% |
| Nigerian | 38 | 0.0% |
| Northern European | 523 | 0.6% |
| Norwegian | 4,607 | 5.3% |
| Paiute | 22 | 0.0% |
| Pakistani | 78 | 0.1% |
| Panamanian | 14 | 0.0% |
| Pennsylvania German | 14 | 0.0% |
| Peruvian | 3 | 0.0% |
| Polish | 1,971 | 2.3% |
| Portuguese | 608 | 0.7% |
| Pueblo | 66 | 0.1% |
| Puerto Rican | 504 | 0.6% |
| Puget Sound Salish | 150 | 0.2% |
| Romanian | 100 | 0.1% |
| Russian | 320 | 0.4% |
| Salvadoran | 215 | 0.3% |
| Samoan | 35 | 0.0% |
| Scandinavian | 896 | 1.0% |
| Scotch-Irish | 1,142 | 1.3% |
| Scottish | 2,845 | 3.3% |
| Seminole | 10 | 0.0% |
| Serbian | 13 | 0.0% |
| Sioux | 93 | 0.1% |
| Slavic | 98 | 0.1% |
| Slovak | 88 | 0.1% |
| South African | 23 | 0.0% |
| South American | 223 | 0.3% |
| South American Indian | 20 | 0.0% |
| Spaniard | 122 | 0.1% |
| Spanish | 114 | 0.1% |
| Sri Lankan | 588 | 0.7% |
| Subsaharan African | 197 | 0.2% |
| Swedish | 3,104 | 3.6% |
| Swiss | 329 | 0.4% |
| Syrian | 38 | 0.0% |
| Thai | 256 | 0.3% |
| Tlingit-Haida | 42 | 0.1% |
| Tsimshian | 18 | 0.0% |
| Turkish | 21 | 0.0% |
| Ukrainian | 372 | 0.4% |
| Venezuelan | 84 | 0.1% |
| Welsh | 1,001 | 1.2% |
| Yakama | 12 | 0.0% |
| Yaqui | 106 | 0.1% |
| Yugoslavian | 7 | 0.0% | View All 135 Rows |
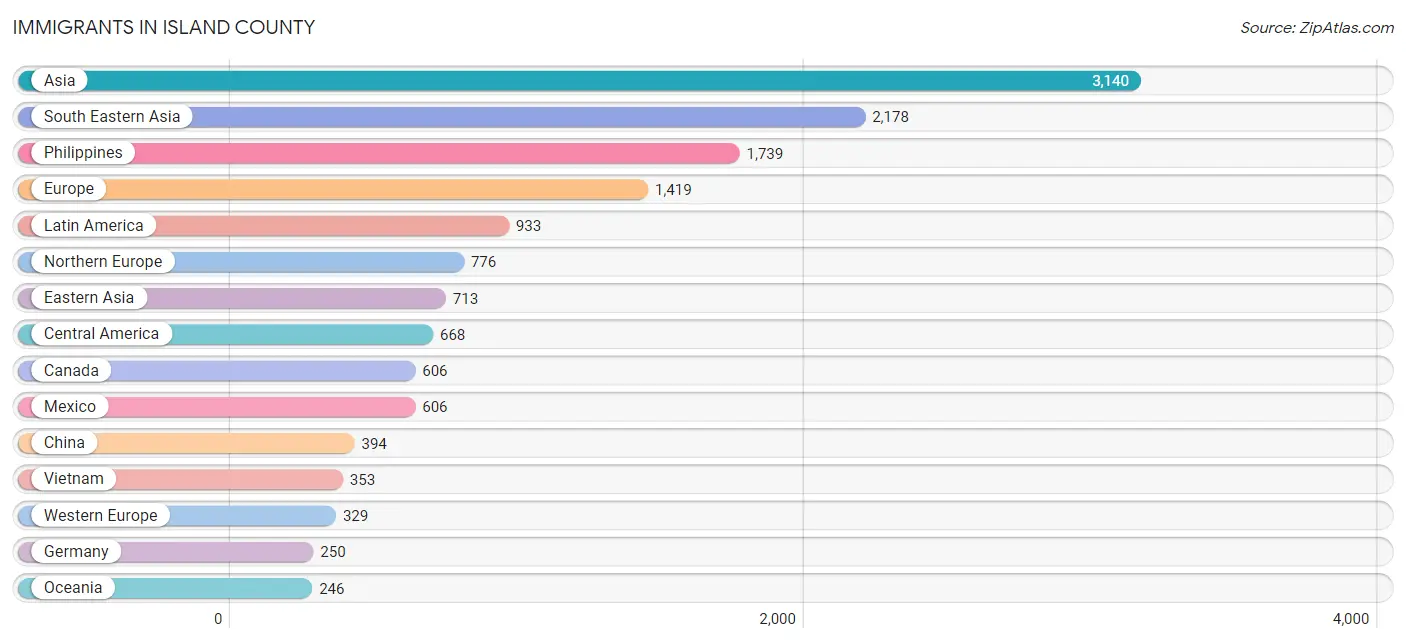
Immigrants in Island County
The most numerous immigrant groups reported in Island County came from Asia (3,140 | 3.6%), South Eastern Asia (2,178 | 2.5%), Philippines (1,739 | 2.0%), Europe (1,419 | 1.6%), and Latin America (933 | 1.1%), together accounting for 10.9% of all Island County residents.
| Immigration Origin | # Population | % Population |
| Afghanistan | 2 | 0.0% |
| Africa | 163 | 0.2% |
| Asia | 3,140 | 3.6% |
| Australia | 14 | 0.0% |
| Bahamas | 21 | 0.0% |
| Belize | 47 | 0.1% |
| Canada | 606 | 0.7% |
| Caribbean | 137 | 0.2% |
| Central America | 668 | 0.8% |
| China | 394 | 0.5% |
| Costa Rica | 4 | 0.0% |
| Denmark | 144 | 0.2% |
| Dominica | 33 | 0.0% |
| Dominican Republic | 51 | 0.1% |
| Eastern Africa | 74 | 0.1% |
| Eastern Asia | 713 | 0.8% |
| Eastern Europe | 160 | 0.2% |
| England | 199 | 0.2% |
| Europe | 1,419 | 1.6% |
| Fiji | 123 | 0.1% |
| France | 33 | 0.0% |
| Germany | 250 | 0.3% |
| Ghana | 7 | 0.0% |
| Guatemala | 11 | 0.0% |
| Guyana | 31 | 0.0% |
| Hong Kong | 26 | 0.0% |
| Hungary | 37 | 0.0% |
| India | 134 | 0.2% |
| Indonesia | 9 | 0.0% |
| Iran | 27 | 0.0% |
| Iraq | 27 | 0.0% |
| Ireland | 11 | 0.0% |
| Israel | 17 | 0.0% |
| Italy | 73 | 0.1% |
| Jamaica | 32 | 0.0% |
| Japan | 122 | 0.1% |
| Kenya | 52 | 0.1% |
| Korea | 197 | 0.2% |
| Latin America | 933 | 1.1% |
| Latvia | 9 | 0.0% |
| Mexico | 606 | 0.7% |
| Moldova | 7 | 0.0% |
| Nepal | 42 | 0.1% |
| Netherlands | 36 | 0.0% |
| Nigeria | 38 | 0.0% |
| Northern Europe | 776 | 0.9% |
| Norway | 55 | 0.1% |
| Oceania | 246 | 0.3% |
| Philippines | 1,739 | 2.0% |
| Poland | 25 | 0.0% |
| Portugal | 61 | 0.1% |
| Romania | 32 | 0.0% |
| Russia | 28 | 0.0% |
| Scotland | 32 | 0.0% |
| South Africa | 35 | 0.0% |
| South America | 128 | 0.2% |
| South Central Asia | 205 | 0.2% |
| South Eastern Asia | 2,178 | 2.5% |
| Southern Europe | 154 | 0.2% |
| Spain | 20 | 0.0% |
| Sweden | 38 | 0.0% |
| Switzerland | 10 | 0.0% |
| Taiwan | 81 | 0.1% |
| Thailand | 71 | 0.1% |
| Ukraine | 22 | 0.0% |
| Venezuela | 97 | 0.1% |
| Vietnam | 353 | 0.4% |
| Western Africa | 45 | 0.1% |
| Western Asia | 44 | 0.1% |
| Western Europe | 329 | 0.4% | View All 70 Rows |
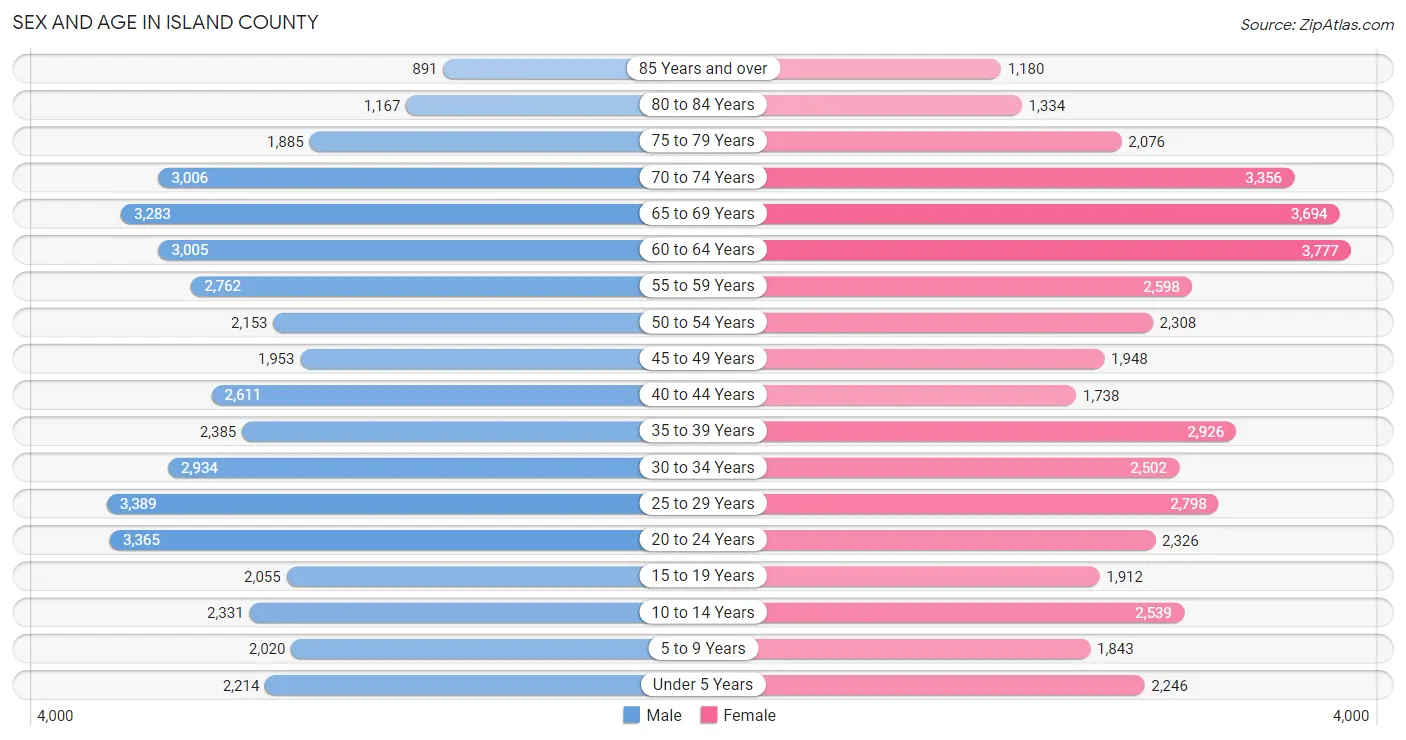
Sex and Age in Island County
Sex and Age in Island County
The most populous age groups in Island County are 25 to 29 Years (3,389 | 7.8%) for men and 60 to 64 Years (3,777 | 8.8%) for women.
| Age Bracket | Male | Female |
| Under 5 Years | 2,214 (5.1%) | 2,246 (5.2%) |
| 5 to 9 Years | 2,020 (4.6%) | 1,843 (4.3%) |
| 10 to 14 Years | 2,331 (5.4%) | 2,539 (5.9%) |
| 15 to 19 Years | 2,055 (4.7%) | 1,912 (4.4%) |
| 20 to 24 Years | 3,365 (7.7%) | 2,326 (5.4%) |
| 25 to 29 Years | 3,389 (7.8%) | 2,798 (6.5%) |
| 30 to 34 Years | 2,934 (6.8%) | 2,502 (5.8%) |
| 35 to 39 Years | 2,385 (5.5%) | 2,926 (6.8%) |
| 40 to 44 Years | 2,611 (6.0%) | 1,738 (4.0%) |
| 45 to 49 Years | 1,953 (4.5%) | 1,948 (4.5%) |
| 50 to 54 Years | 2,153 (5.0%) | 2,308 (5.3%) |
| 55 to 59 Years | 2,762 (6.4%) | 2,598 (6.0%) |
| 60 to 64 Years | 3,005 (6.9%) | 3,777 (8.8%) |
| 65 to 69 Years | 3,283 (7.6%) | 3,694 (8.6%) |
| 70 to 74 Years | 3,006 (6.9%) | 3,356 (7.8%) |
| 75 to 79 Years | 1,885 (4.3%) | 2,076 (4.8%) |
| 80 to 84 Years | 1,167 (2.7%) | 1,334 (3.1%) |
| 85 Years and over | 891 (2.1%) | 1,180 (2.7%) |
| Total | 43,409 (100.0%) | 43,101 (100.0%) |
Families and Households in Island County
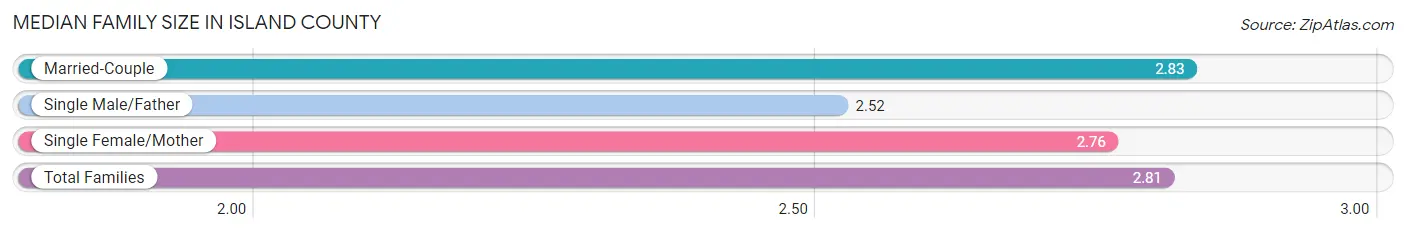
Median Family Size in Island County
The median family size in Island County is 2.81 persons per family, with married-couple families (20,194 | 84.1%) accounting for the largest median family size of 2.83 persons per family. On the other hand, single male/father families (1,167 | 4.9%) represent the smallest median family size with 2.52 persons per family.
| Family Type | # Families | Family Size |
| Married-Couple | 20,194 (84.1%) | 2.83 |
| Single Male/Father | 1,167 (4.9%) | 2.52 |
| Single Female/Mother | 2,657 (11.1%) | 2.76 |
| Total Families | 24,018 (100.0%) | 2.81 |
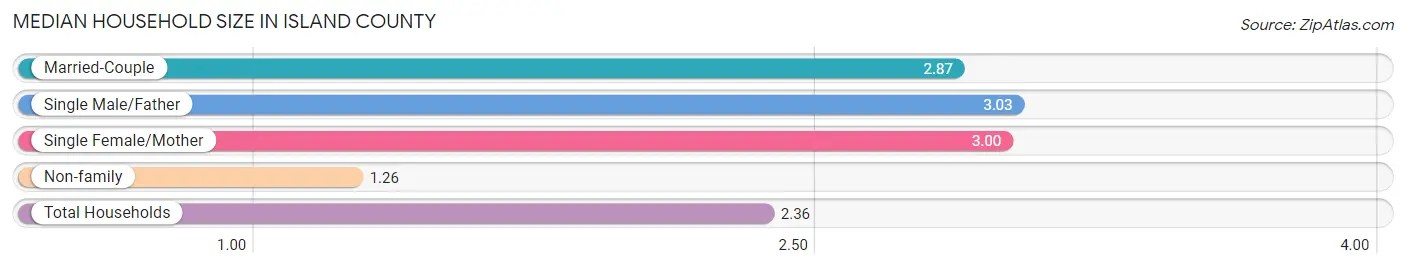
Median Household Size in Island County
The median household size in Island County is 2.36 persons per household, with single male/father households (1,167 | 3.3%) accounting for the largest median household size of 3.03 persons per household. non-family households (11,480 | 32.3%) represent the smallest median household size with 1.26 persons per household.
| Household Type | # Households | Household Size |
| Married-Couple | 20,194 (56.9%) | 2.87 |
| Single Male/Father | 1,167 (3.3%) | 3.03 |
| Single Female/Mother | 2,657 (7.5%) | 3.00 |
| Non-family | 11,480 (32.3%) | 1.26 |
| Total Households | 35,498 (100.0%) | 2.36 |
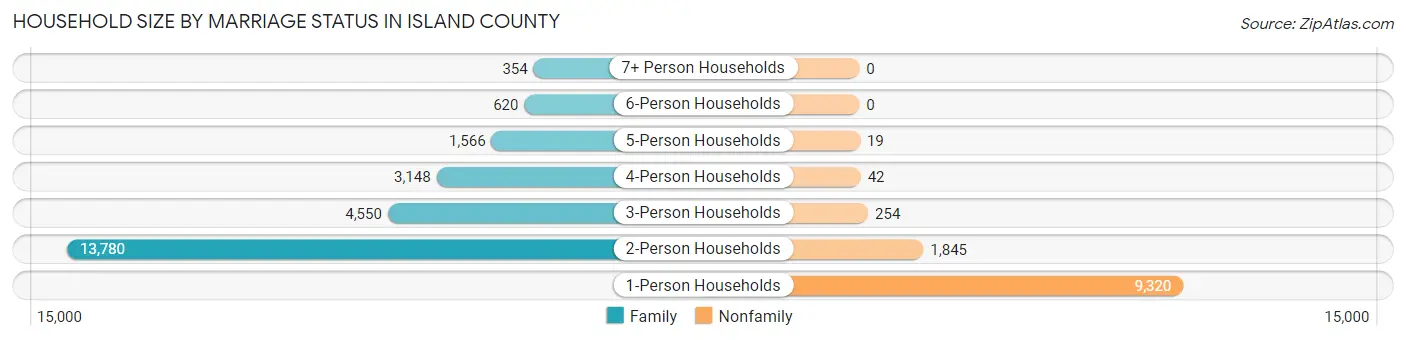
Household Size by Marriage Status in Island County
Out of a total of 35,498 households in Island County, 24,018 (67.7%) are family households, while 11,480 (32.3%) are nonfamily households. The most numerous type of family households are 2-person households, comprising 13,780, and the most common type of nonfamily households are 1-person households, comprising 9,320.
| Household Size | Family Households | Nonfamily Households |
| 1-Person Households | - | 9,320 (26.3%) |
| 2-Person Households | 13,780 (38.8%) | 1,845 (5.2%) |
| 3-Person Households | 4,550 (12.8%) | 254 (0.7%) |
| 4-Person Households | 3,148 (8.9%) | 42 (0.1%) |
| 5-Person Households | 1,566 (4.4%) | 19 (0.1%) |
| 6-Person Households | 620 (1.8%) | 0 (0.0%) |
| 7+ Person Households | 354 (1.0%) | 0 (0.0%) |
| Total | 24,018 (67.7%) | 11,480 (32.3%) |
Female Fertility in Island County
Fertility by Age in Island County
Average fertility rate in Island County is 61.0 births per 1,000 women. Women in the age bracket of 20 to 34 years have the highest fertility rate with 95.0 births per 1,000 women. Women in the age bracket of 20 to 34 years acount for 70.8% of all women with births.
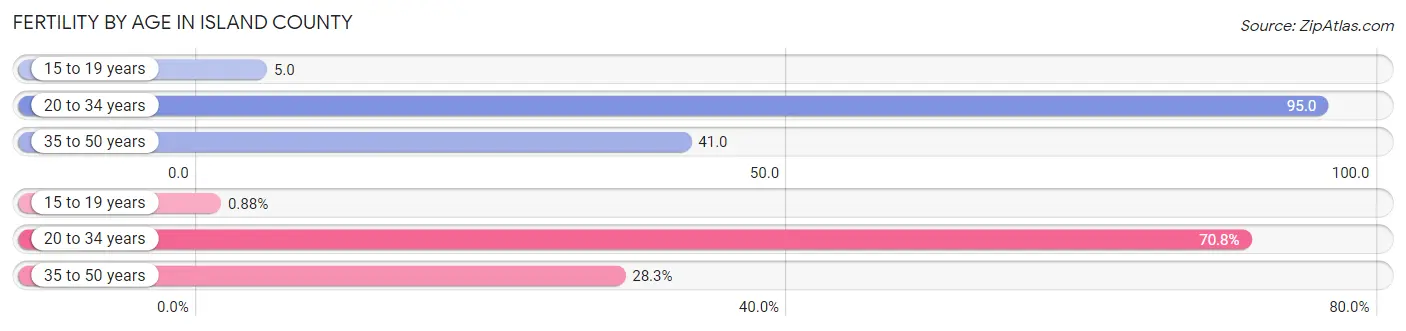
| Age Bracket | Women with Births | Births / 1,000 Women |
| 15 to 19 years | 9 (0.9%) | 5.0 |
| 20 to 34 years | 725 (70.8%) | 95.0 |
| 35 to 50 years | 290 (28.3%) | 41.0 |
| Total | 1,024 (100.0%) | 61.0 |
Fertility by Age by Marriage Status in Island County
83.9% of women with births (1,024) in Island County are married. The highest percentage of unmarried women with births falls into 35 to 50 years age bracket with 31.7% of them unmarried at the time of birth, while the lowest percentage of unmarried women with births belong to 15 to 19 years age bracket with 0.0% of them unmarried.
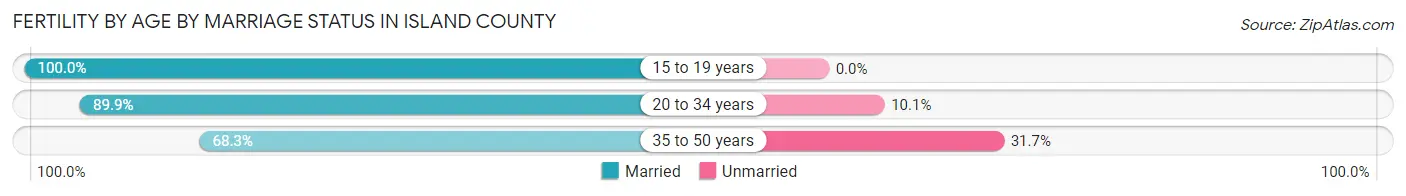
| Age Bracket | Married | Unmarried |
| 15 to 19 years | 9 (100.0%) | 0 (0.0%) |
| 20 to 34 years | 652 (89.9%) | 73 (10.1%) |
| 35 to 50 years | 198 (68.3%) | 92 (31.7%) |
| Total | 859 (83.9%) | 165 (16.1%) |
Fertility by Education in Island County
Average fertility rate in Island County is 61.0 births per 1,000 women. Women with the education attainment of bachelor's degree have the highest fertility rate of 106.0 births per 1,000 women, while women with the education attainment of less than high school have the lowest fertility at 25.0 births per 1,000 women. Women with the education attainment of college or associate's degree represent 41.7% of all women with births.
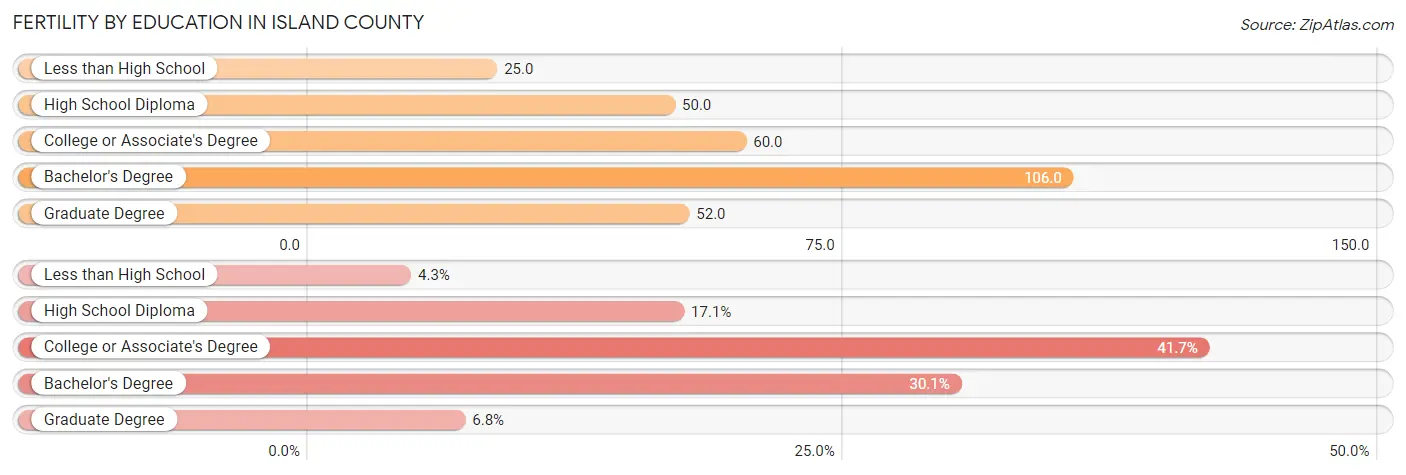
| Educational Attainment | Women with Births | Births / 1,000 Women |
| Less than High School | 44 (4.3%) | 25.0 |
| High School Diploma | 175 (17.1%) | 50.0 |
| College or Associate's Degree | 427 (41.7%) | 60.0 |
| Bachelor's Degree | 308 (30.1%) | 106.0 |
| Graduate Degree | 70 (6.8%) | 52.0 |
| Total | 1,024 (100.0%) | 61.0 |
Fertility by Education by Marriage Status in Island County
16.1% of women with births in Island County are unmarried. Women with the educational attainment of less than high school are most likely to be married with 100.0% of them married at childbirth, while women with the educational attainment of high school diploma are least likely to be married with 47.4% of them unmarried at childbirth.
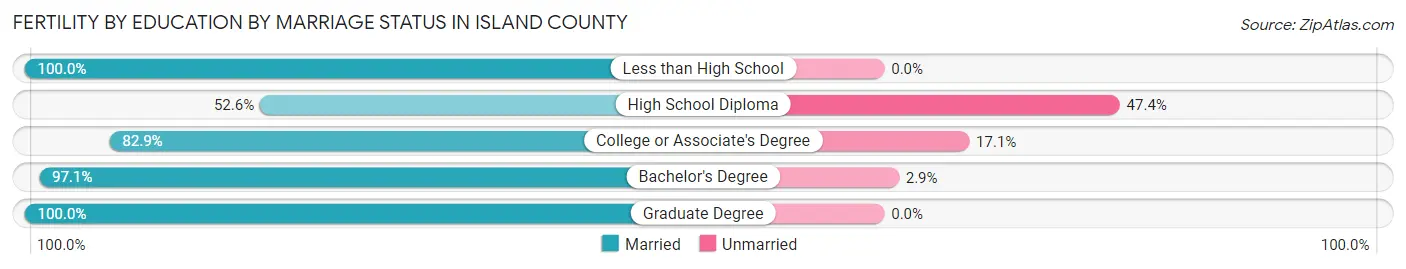
| Educational Attainment | Married | Unmarried |
| Less than High School | 44 (100.0%) | 0 (0.0%) |
| High School Diploma | 92 (52.6%) | 83 (47.4%) |
| College or Associate's Degree | 354 (82.9%) | 73 (17.1%) |
| Bachelor's Degree | 299 (97.1%) | 9 (2.9%) |
| Graduate Degree | 70 (100.0%) | 0 (0.0%) |
| Total | 859 (83.9%) | 165 (16.1%) |
Income in Island County
Income Overview in Island County
Per Capita Income in Island County is $44,217, while median incomes of families and households are $98,023 and $82,850 respectively.
| Characteristic | Number | Measure |
| Per Capita Income | 86,510 | $44,217 |
| Median Family Income | 24,018 | $98,023 |
| Mean Family Income | 24,018 | $120,798 |
| Median Household Income | 35,498 | $82,850 |
| Mean Household Income | 35,498 | $105,640 |
| Income Deficit | 24,018 | $11,176 |
| Wage / Income Gap (%) | 86,510 | 35.29% |
| Wage / Income Gap ($) | 86,510 | 64.71¢ per $1 |
| Gini / Inequality Index | 86,510 | 0.42 |
Earnings by Sex in Island County
Average Earnings in Island County are $43,493, $51,352 for men and $33,228 for women, a difference of 35.3%.
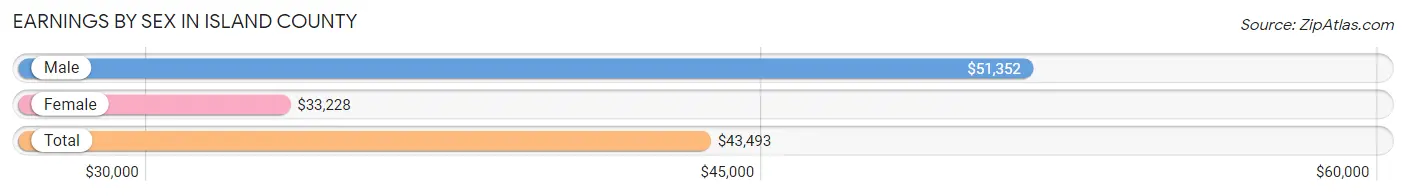
| Sex | Number | Average Earnings |
| Male | 24,322 (55.5%) | $51,352 |
| Female | 19,525 (44.5%) | $33,228 |
| Total | 43,847 (100.0%) | $43,493 |
Earnings by Sex by Income Bracket in Island County
The most common earnings brackets in Island County are $100,000+ for men (4,884 | 20.1%) and $25,000 to $29,999 for women (1,787 | 9.1%).
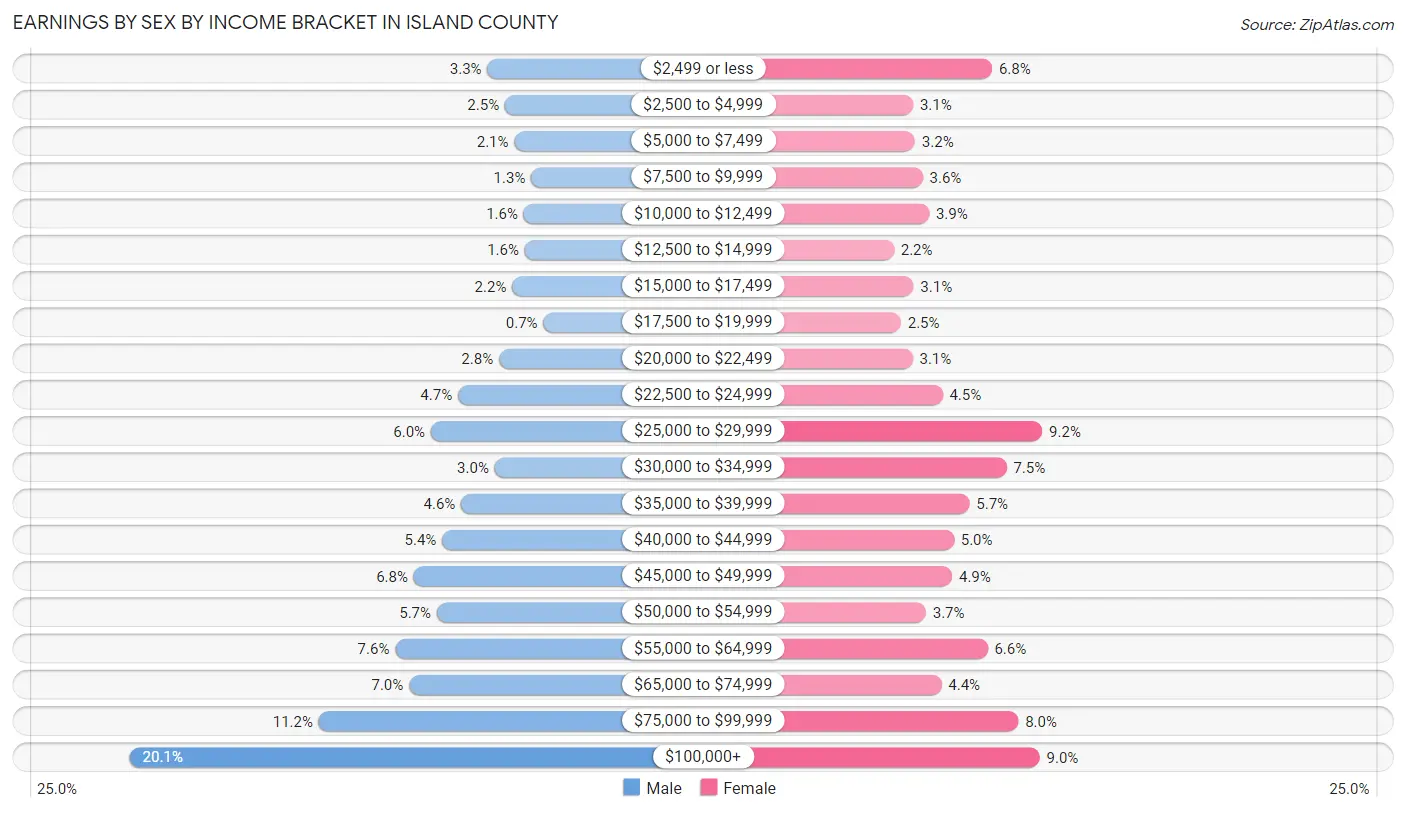
| Income | Male | Female |
| $2,499 or less | 807 (3.3%) | 1,328 (6.8%) |
| $2,500 to $4,999 | 609 (2.5%) | 606 (3.1%) |
| $5,000 to $7,499 | 501 (2.1%) | 623 (3.2%) |
| $7,500 to $9,999 | 308 (1.3%) | 693 (3.5%) |
| $10,000 to $12,499 | 394 (1.6%) | 751 (3.8%) |
| $12,500 to $14,999 | 383 (1.6%) | 429 (2.2%) |
| $15,000 to $17,499 | 525 (2.2%) | 610 (3.1%) |
| $17,500 to $19,999 | 170 (0.7%) | 494 (2.5%) |
| $20,000 to $22,499 | 677 (2.8%) | 602 (3.1%) |
| $22,500 to $24,999 | 1,143 (4.7%) | 874 (4.5%) |
| $25,000 to $29,999 | 1,452 (6.0%) | 1,787 (9.1%) |
| $30,000 to $34,999 | 724 (3.0%) | 1,461 (7.5%) |
| $35,000 to $39,999 | 1,107 (4.5%) | 1,121 (5.7%) |
| $40,000 to $44,999 | 1,323 (5.4%) | 979 (5.0%) |
| $45,000 to $49,999 | 1,646 (6.8%) | 962 (4.9%) |
| $50,000 to $54,999 | 1,383 (5.7%) | 722 (3.7%) |
| $55,000 to $64,999 | 1,859 (7.6%) | 1,287 (6.6%) |
| $65,000 to $74,999 | 1,699 (7.0%) | 865 (4.4%) |
| $75,000 to $99,999 | 2,728 (11.2%) | 1,568 (8.0%) |
| $100,000+ | 4,884 (20.1%) | 1,763 (9.0%) |
| Total | 24,322 (100.0%) | 19,525 (100.0%) |
Earnings by Sex by Educational Attainment in Island County
Average earnings in Island County are $59,406 for men and $36,863 for women, a difference of 38.0%. Men with an educational attainment of bachelor's degree enjoy the highest average annual earnings of $92,963, while those with less than high school education earn the least with $42,021. Women with an educational attainment of graduate degree earn the most with the average annual earnings of $57,273, while those with less than high school education have the smallest earnings of $26,594.
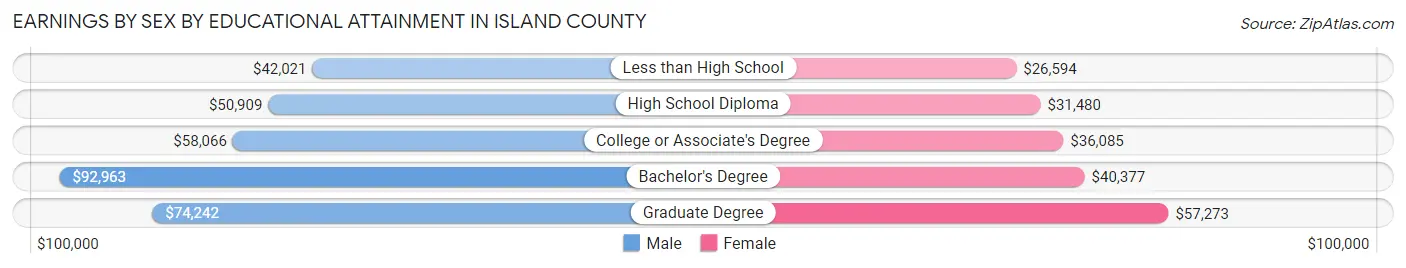
| Educational Attainment | Male Income | Female Income |
| Less than High School | $42,021 | $26,594 |
| High School Diploma | $50,909 | $31,480 |
| College or Associate's Degree | $58,066 | $36,085 |
| Bachelor's Degree | $92,963 | $40,377 |
| Graduate Degree | $74,242 | $57,273 |
| Total | $59,406 | $36,863 |
Family Income in Island County
Family Income Brackets in Island County
According to the Island County family income data, there are 5,908 families falling into the $100,000 to $149,999 income range, which is the most common income bracket and makes up 24.6% of all families. Conversely, the $10,000 to $14,999 income bracket is the least frequent group with only 192 families (0.8%) belonging to this category.
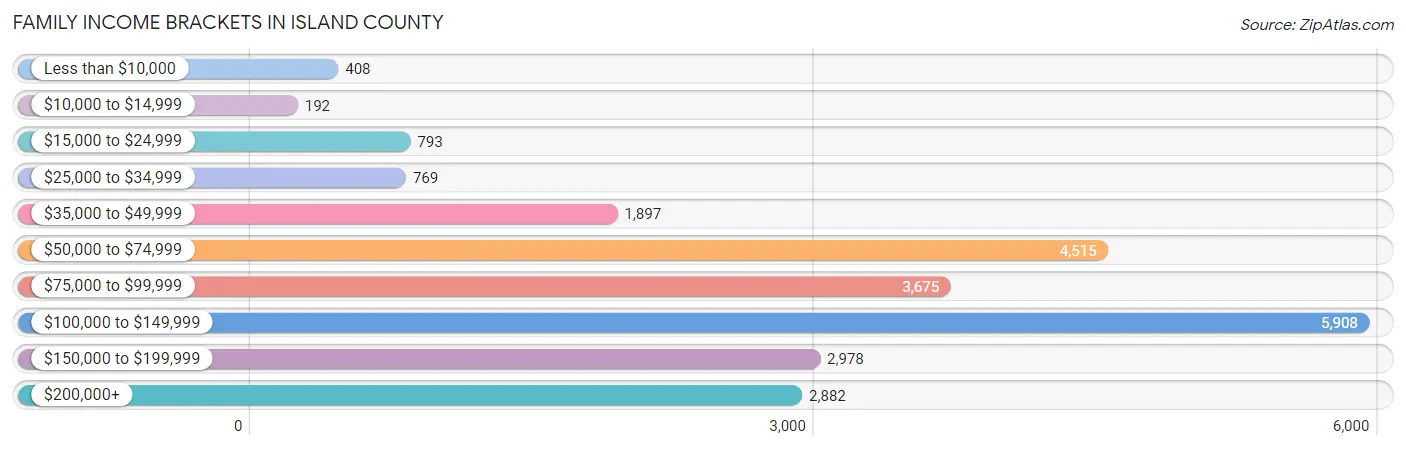
| Income Bracket | # Families | % Families |
| Less than $10,000 | 408 | 1.7% |
| $10,000 to $14,999 | 192 | 0.8% |
| $15,000 to $24,999 | 793 | 3.3% |
| $25,000 to $34,999 | 769 | 3.2% |
| $35,000 to $49,999 | 1,897 | 7.9% |
| $50,000 to $74,999 | 4,515 | 18.8% |
| $75,000 to $99,999 | 3,675 | 15.3% |
| $100,000 to $149,999 | 5,908 | 24.6% |
| $150,000 to $199,999 | 2,978 | 12.4% |
| $200,000+ | 2,882 | 12.0% |
Family Income by Famaliy Size in Island County
6-person families (565 | 2.4%) account for the highest median family income in Island County with $116,274 per family, while 2-person families (14,397 | 59.9%) have the highest median income of $48,033 per family member.
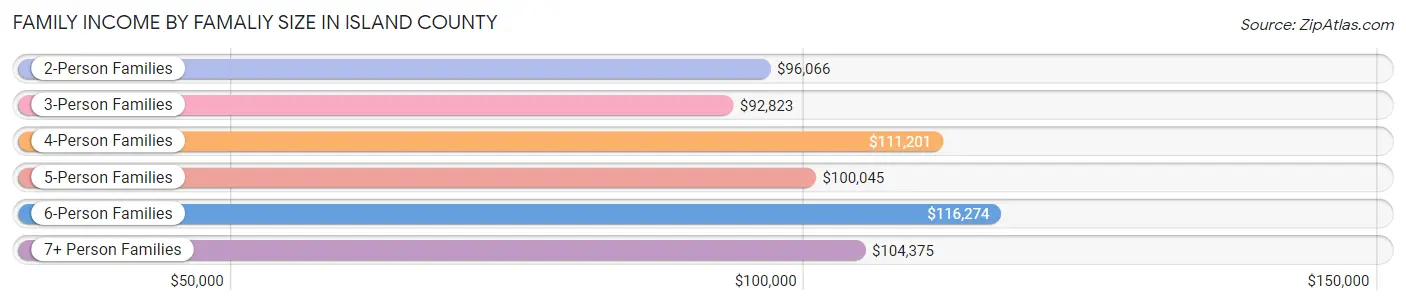
| Income Bracket | # Families | Median Income |
| 2-Person Families | 14,397 (59.9%) | $96,066 |
| 3-Person Families | 4,545 (18.9%) | $92,823 |
| 4-Person Families | 2,739 (11.4%) | $111,201 |
| 5-Person Families | 1,444 (6.0%) | $100,045 |
| 6-Person Families | 565 (2.4%) | $116,274 |
| 7+ Person Families | 328 (1.4%) | $104,375 |
| Total | 24,018 (100.0%) | $98,023 |
Family Income by Number of Earners in Island County
The median family income in Island County is $98,023, with families comprising 3+ earners (1,719) having the highest median family income of $163,290, while families with no earners (5,779) have the lowest median family income of $72,172, accounting for 7.2% and 24.1% of families, respectively.
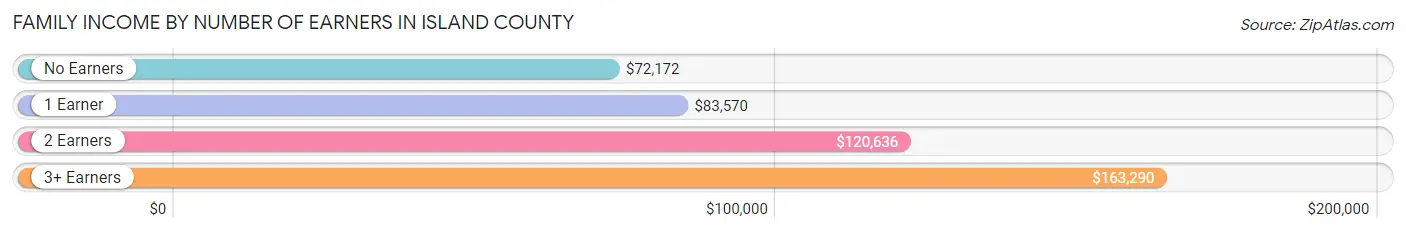
| Number of Earners | # Families | Median Income |
| No Earners | 5,779 (24.1%) | $72,172 |
| 1 Earner | 7,487 (31.2%) | $83,570 |
| 2 Earners | 9,033 (37.6%) | $120,636 |
| 3+ Earners | 1,719 (7.2%) | $163,290 |
| Total | 24,018 (100.0%) | $98,023 |
Household Income in Island County
Household Income Brackets in Island County
With 7,419 households falling in the category, the $100,000 to $149,999 income range is the most frequent in Island County, accounting for 20.9% of all households. In contrast, only 639 households (1.8%) fall into the $10,000 to $14,999 income bracket, making it the least populous group.
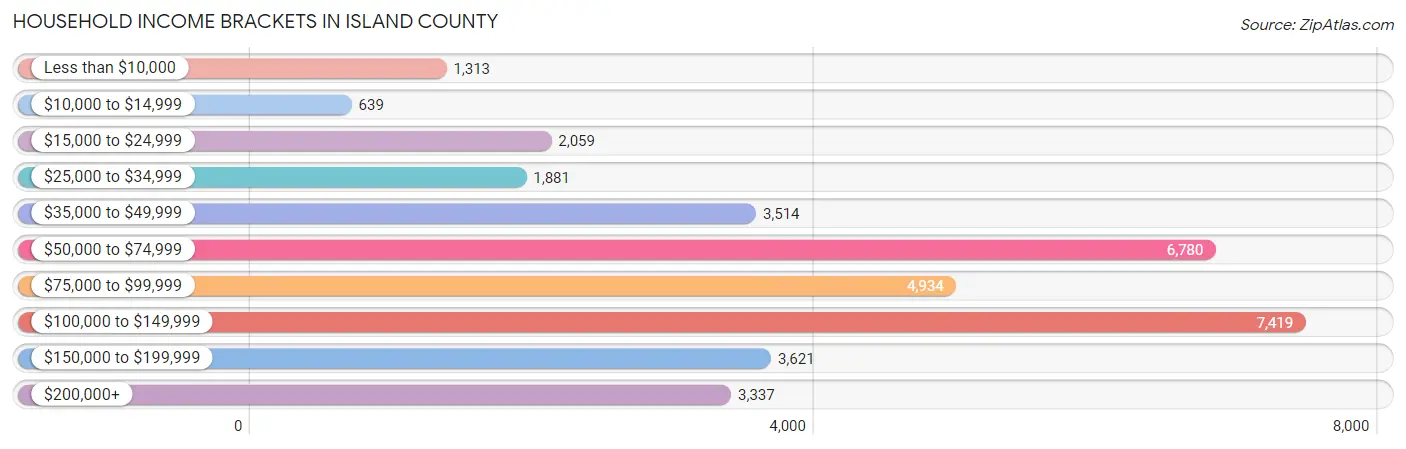
| Income Bracket | # Households | % Households |
| Less than $10,000 | 1,313 | 3.7% |
| $10,000 to $14,999 | 639 | 1.8% |
| $15,000 to $24,999 | 2,059 | 5.8% |
| $25,000 to $34,999 | 1,881 | 5.3% |
| $35,000 to $49,999 | 3,514 | 9.9% |
| $50,000 to $74,999 | 6,780 | 19.1% |
| $75,000 to $99,999 | 4,934 | 13.9% |
| $100,000 to $149,999 | 7,419 | 20.9% |
| $150,000 to $199,999 | 3,621 | 10.2% |
| $200,000+ | 3,337 | 9.4% |
Household Income by Householder Age in Island County
The median household income in Island County is $82,850, with the highest median household income of $113,057 found in the 45 to 64 years age bracket for the primary householder. A total of 11,052 households (31.1%) fall into this category. Meanwhile, the 15 to 24 years age bracket for the primary householder has the lowest median household income of $60,812, with 1,200 households (3.4%) in this group.
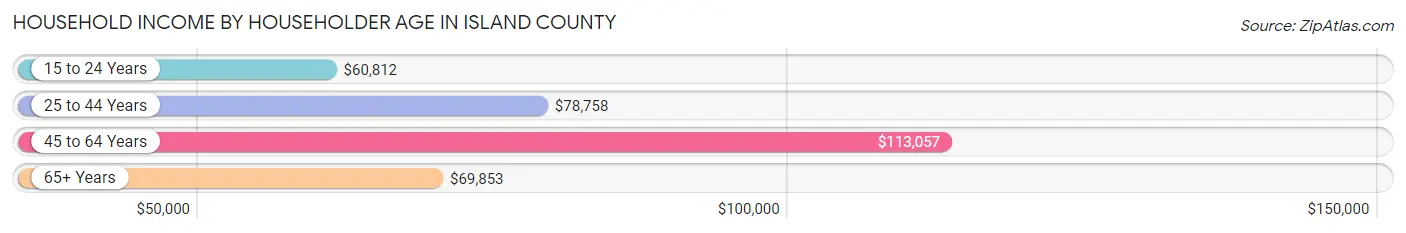
| Income Bracket | # Households | Median Income |
| 15 to 24 Years | 1,200 (3.4%) | $60,812 |
| 25 to 44 Years | 9,973 (28.1%) | $78,758 |
| 45 to 64 Years | 11,052 (31.1%) | $113,057 |
| 65+ Years | 13,273 (37.4%) | $69,853 |
| Total | 35,498 (100.0%) | $82,850 |
Poverty in Island County
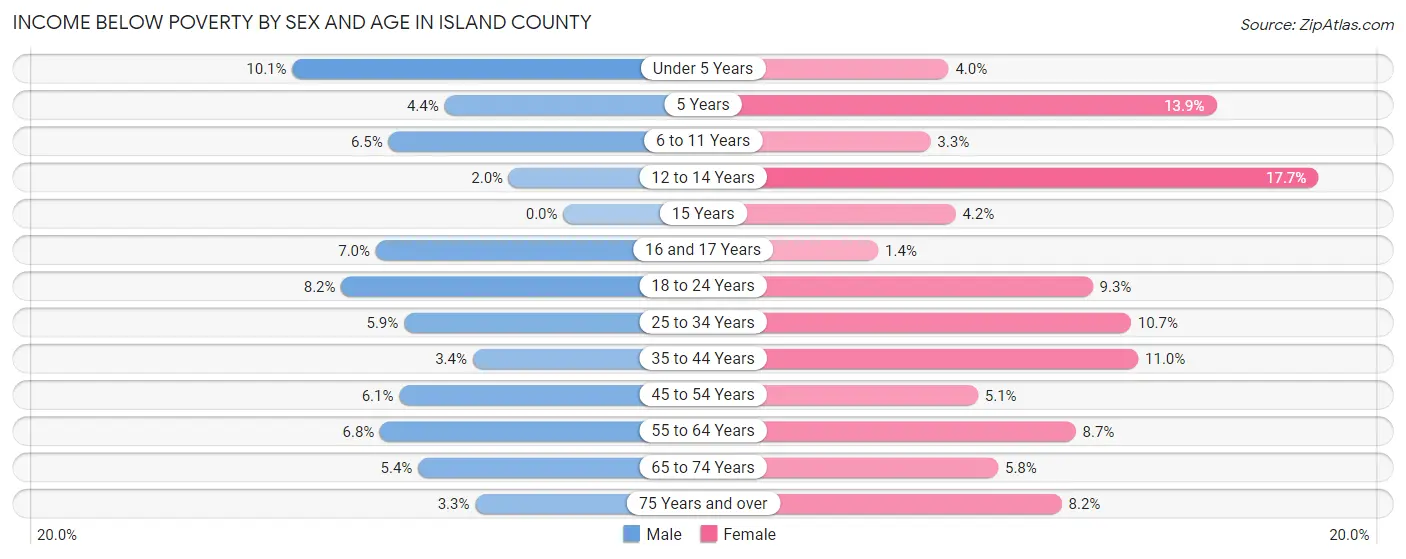
Income Below Poverty by Sex and Age in Island County
With 5.7% poverty level for males and 8.0% for females among the residents of Island County, under 5 year old males and 12 to 14 year old females are the most vulnerable to poverty, with 221 males (10.1%) and 248 females (17.7%) in their respective age groups living below the poverty level.
| Age Bracket | Male | Female |
| Under 5 Years | 221 (10.1%) | 88 (4.0%) |
| 5 Years | 23 (4.4%) | 51 (13.9%) |
| 6 to 11 Years | 179 (6.5%) | 84 (3.3%) |
| 12 to 14 Years | 20 (2.0%) | 248 (17.7%) |
| 15 Years | 0 (0.0%) | 14 (4.2%) |
| 16 and 17 Years | 60 (7.0%) | 10 (1.3%) |
| 18 to 24 Years | 216 (8.2%) | 262 (9.3%) |
| 25 to 34 Years | 352 (5.9%) | 567 (10.7%) |
| 35 to 44 Years | 167 (3.4%) | 513 (11.0%) |
| 45 to 54 Years | 249 (6.1%) | 215 (5.1%) |
| 55 to 64 Years | 392 (6.8%) | 553 (8.7%) |
| 65 to 74 Years | 338 (5.4%) | 408 (5.8%) |
| 75 Years and over | 128 (3.3%) | 367 (8.2%) |
| Total | 2,345 (5.7%) | 3,380 (8.0%) |
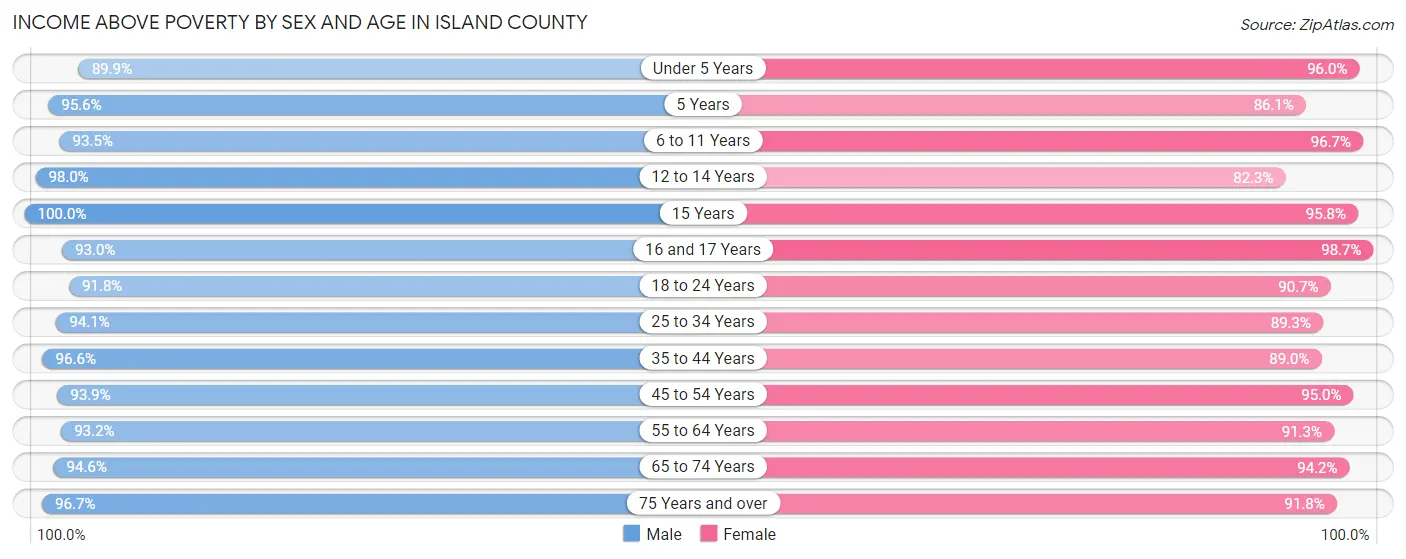
Income Above Poverty by Sex and Age in Island County
According to the poverty statistics in Island County, males aged 15 years and females aged 16 and 17 years are the age groups that are most secure financially, with 100.0% of males and 98.7% of females in these age groups living above the poverty line.
| Age Bracket | Male | Female |
| Under 5 Years | 1,975 (89.9%) | 2,133 (96.0%) |
| 5 Years | 499 (95.6%) | 316 (86.1%) |
| 6 to 11 Years | 2,579 (93.5%) | 2,470 (96.7%) |
| 12 to 14 Years | 969 (98.0%) | 1,155 (82.3%) |
| 15 Years | 288 (100.0%) | 318 (95.8%) |
| 16 and 17 Years | 802 (93.0%) | 733 (98.7%) |
| 18 to 24 Years | 2,405 (91.8%) | 2,553 (90.7%) |
| 25 to 34 Years | 5,603 (94.1%) | 4,715 (89.3%) |
| 35 to 44 Years | 4,803 (96.6%) | 4,151 (89.0%) |
| 45 to 54 Years | 3,843 (93.9%) | 4,040 (95.0%) |
| 55 to 64 Years | 5,375 (93.2%) | 5,818 (91.3%) |
| 65 to 74 Years | 5,928 (94.6%) | 6,624 (94.2%) |
| 75 Years and over | 3,792 (96.7%) | 4,131 (91.8%) |
| Total | 38,861 (94.3%) | 39,157 (92.0%) |
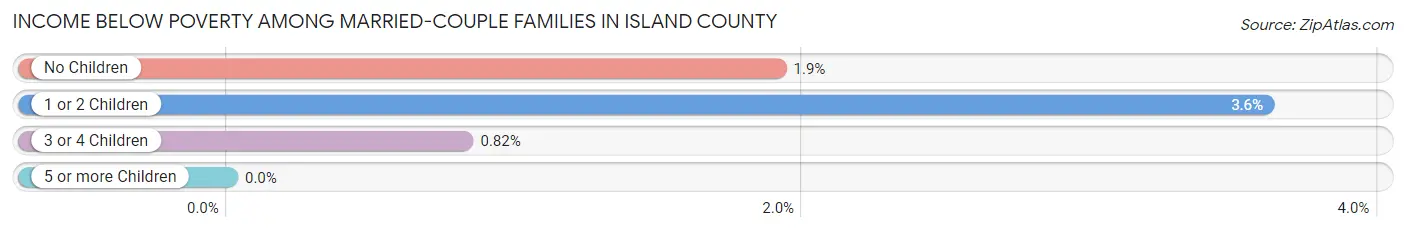
Income Below Poverty Among Married-Couple Families in Island County
The poverty statistics for married-couple families in Island County show that 2.2% or 449 of the total 20,194 families live below the poverty line. Families with 1 or 2 children have the highest poverty rate of 3.6%, comprising of 173 families. On the other hand, families with 5 or more children have the lowest poverty rate of 0.0%, which includes 0 families.
| Children | Above Poverty | Below Poverty |
| No Children | 13,585 (98.1%) | 264 (1.9%) |
| 1 or 2 Children | 4,621 (96.4%) | 173 (3.6%) |
| 3 or 4 Children | 1,446 (99.2%) | 12 (0.8%) |
| 5 or more Children | 93 (100.0%) | 0 (0.0%) |
| Total | 19,745 (97.8%) | 449 (2.2%) |
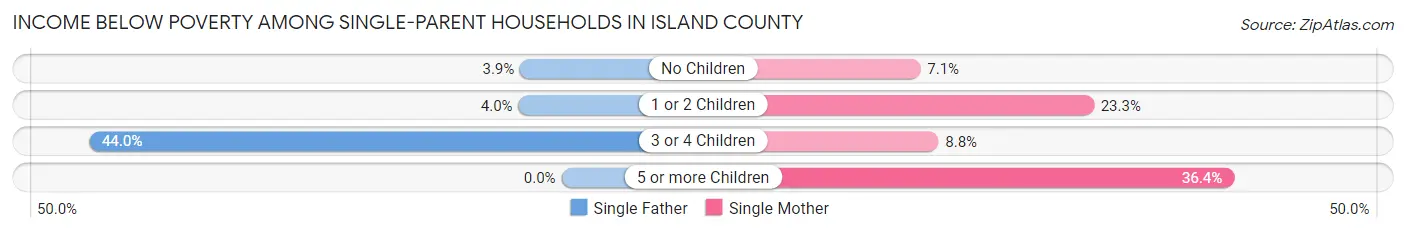
Income Below Poverty Among Single-Parent Households in Island County
According to the poverty data in Island County, 4.8% or 56 single-father households and 16.4% or 436 single-mother households are living below the poverty line. Among single-father households, those with 3 or 4 children have the highest poverty rate, with 11 households (44.0%) experiencing poverty. Likewise, among single-mother households, those with 5 or more children have the highest poverty rate, with 24 households (36.4%) falling below the poverty line.
| Children | Single Father | Single Mother |
| No Children | 19 (3.8%) | 76 (7.1%) |
| 1 or 2 Children | 26 (4.0%) | 324 (23.3%) |
| 3 or 4 Children | 11 (44.0%) | 12 (8.8%) |
| 5 or more Children | 0 (0.0%) | 24 (36.4%) |
| Total | 56 (4.8%) | 436 (16.4%) |
Income Below Poverty Among Married-Couple vs Single-Parent Households in Island County
The poverty data for Island County shows that 449 of the married-couple family households (2.2%) and 492 of the single-parent households (12.9%) are living below the poverty level. Within the married-couple family households, those with 1 or 2 children have the highest poverty rate, with 173 households (3.6%) falling below the poverty line. Among the single-parent households, those with 5 or more children have the highest poverty rate, with 24 household (36.4%) living below poverty.
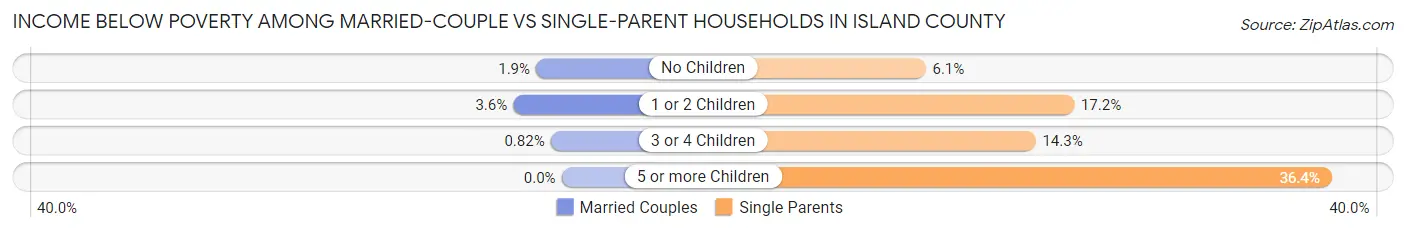
| Children | Married-Couple Families | Single-Parent Households |
| No Children | 264 (1.9%) | 95 (6.1%) |
| 1 or 2 Children | 173 (3.6%) | 350 (17.2%) |
| 3 or 4 Children | 12 (0.8%) | 23 (14.3%) |
| 5 or more Children | 0 (0.0%) | 24 (36.4%) |
| Total | 449 (2.2%) | 492 (12.9%) |
Employment Characteristics in Island County
Employment by Class of Employer in Island County
Among the 38,999 employed individuals in Island County, private company employees (18,336 | 47.0%), federal government employees (9,519 | 24.4%), and local government employees (2,826 | 7.2%) make up the most common classes of employment.
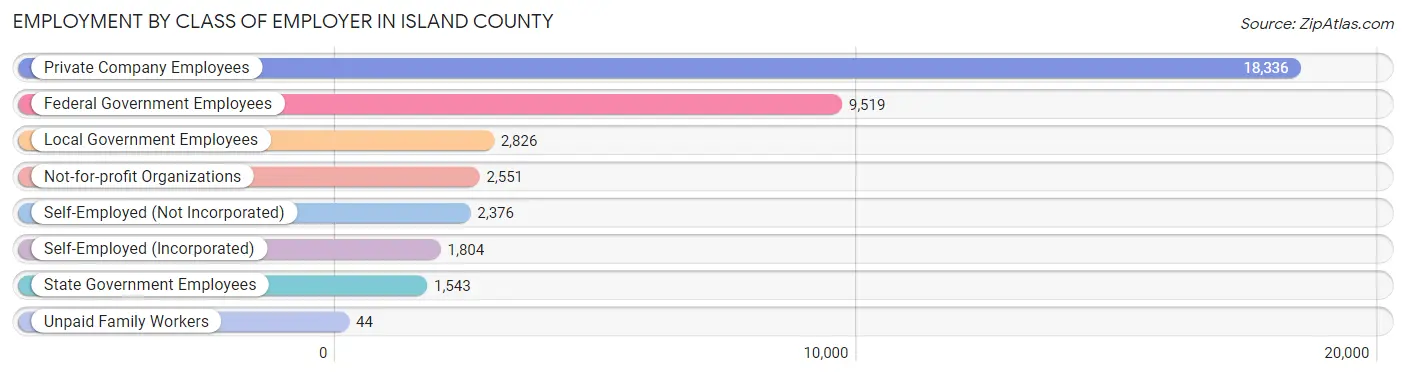
| Employer Class | # Employees | % Employees |
| Private Company Employees | 18,336 | 47.0% |
| Self-Employed (Incorporated) | 1,804 | 4.6% |
| Self-Employed (Not Incorporated) | 2,376 | 6.1% |
| Not-for-profit Organizations | 2,551 | 6.5% |
| Local Government Employees | 2,826 | 7.2% |
| State Government Employees | 1,543 | 4.0% |
| Federal Government Employees | 9,519 | 24.4% |
| Unpaid Family Workers | 44 | 0.1% |
| Total | 38,999 | 100.0% |
Employment Status by Age in Island County
According to the labor force statistics for Island County, out of the total population over 16 years of age (72,697), 57.4% or 41,728 individuals are in the labor force, with 5.5% or 2,295 of them unemployed. The age group with the highest labor force participation rate is 20 to 24 years, with 92.0% or 5,236 individuals in the labor force. Within the labor force, the 16 to 19 years age range has the highest percentage of unemployed individuals, with 26.3% or 450 of them being unemployed.
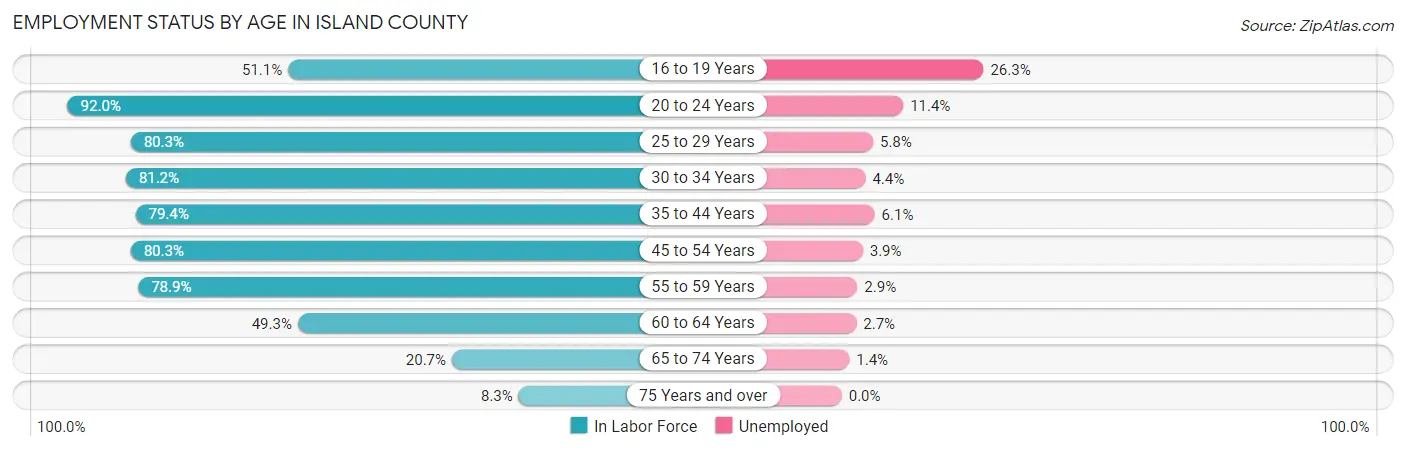
| Age Bracket | In Labor Force | Unemployed |
| 16 to 19 Years | 1,710 (51.1%) | 450 (26.3%) |
| 20 to 24 Years | 5,236 (92.0%) | 597 (11.4%) |
| 25 to 29 Years | 4,968 (80.3%) | 288 (5.8%) |
| 30 to 34 Years | 4,414 (81.2%) | 194 (4.4%) |
| 35 to 44 Years | 7,670 (79.4%) | 468 (6.1%) |
| 45 to 54 Years | 6,715 (80.3%) | 262 (3.9%) |
| 55 to 59 Years | 4,229 (78.9%) | 123 (2.9%) |
| 60 to 64 Years | 3,344 (49.3%) | 90 (2.7%) |
| 65 to 74 Years | 2,761 (20.7%) | 39 (1.4%) |
| 75 Years and over | 708 (8.3%) | 0 (0.0%) |
| Total | 41,728 (57.4%) | 2,295 (5.5%) |
Employment Status by Educational Attainment in Island County
According to labor force statistics for Island County, 75.0% of individuals (31,340) out of the total population between 25 and 64 years of age (41,787) are in the labor force, with 4.4% or 1,379 of them being unemployed. The group with the highest labor force participation rate are those with the educational attainment of bachelor's degree or higher, with 80.5% or 10,119 individuals in the labor force. Within the labor force, individuals with less than high school education have the highest percentage of unemployment, with 11.8% or 148 of them being unemployed.
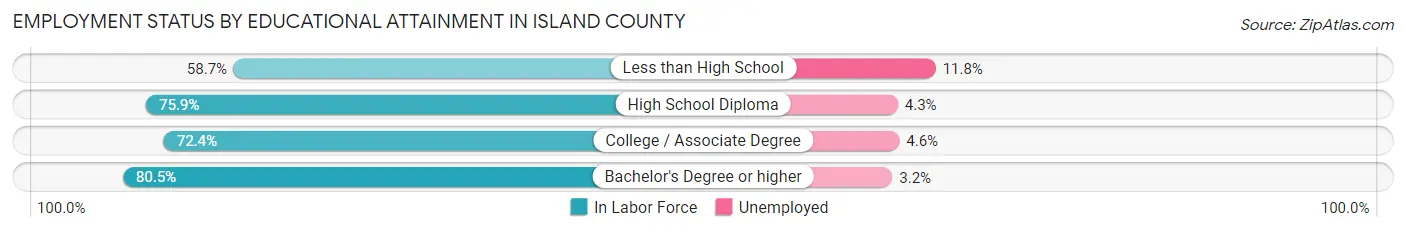
| Educational Attainment | In Labor Force | Unemployed |
| Less than High School | 1,252 (58.7%) | 252 (11.8%) |
| High School Diploma | 7,558 (75.9%) | 428 (4.3%) |
| College / Associate Degree | 12,399 (72.4%) | 788 (4.6%) |
| Bachelor's Degree or higher | 10,119 (80.5%) | 402 (3.2%) |
| Total | 31,340 (75.0%) | 1,839 (4.4%) |
Employment Occupations by Sex in Island County
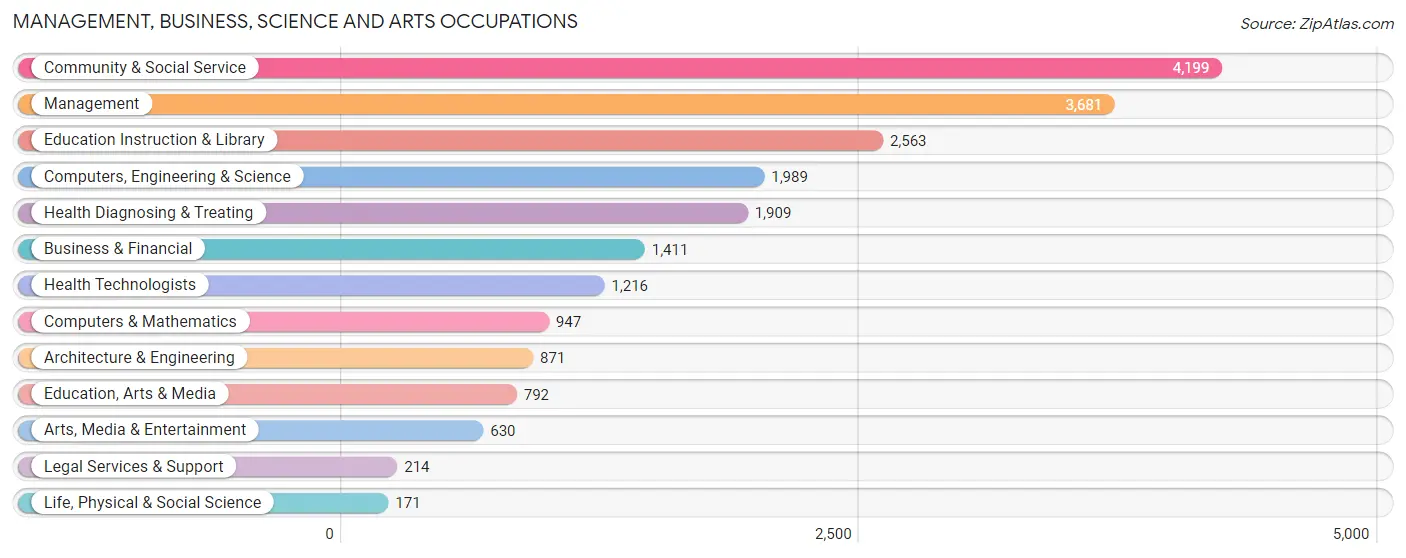
Management, Business, Science and Arts Occupations
The most common Management, Business, Science and Arts occupations in Island County are Community & Social Service (4,199 | 12.9%), Management (3,681 | 11.3%), Education Instruction & Library (2,563 | 7.9%), Computers, Engineering & Science (1,989 | 6.1%), and Health Diagnosing & Treating (1,909 | 5.9%).
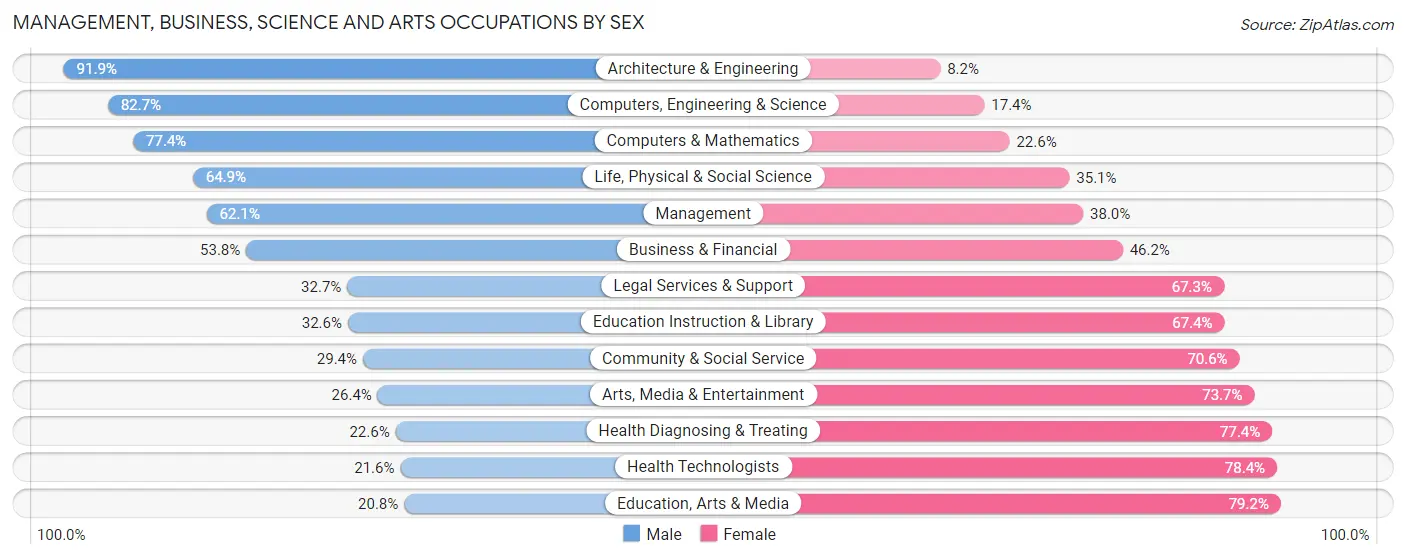
Management, Business, Science and Arts Occupations by Sex
Within the Management, Business, Science and Arts occupations in Island County, the most male-oriented occupations are Architecture & Engineering (91.8%), Computers, Engineering & Science (82.7%), and Computers & Mathematics (77.4%), while the most female-oriented occupations are Education, Arts & Media (79.2%), Health Technologists (78.4%), and Health Diagnosing & Treating (77.4%).
| Occupation | Male | Female |
| Management | 2,284 (62.1%) | 1,397 (38.0%) |
| Business & Financial | 759 (53.8%) | 652 (46.2%) |
| Computers, Engineering & Science | 1,644 (82.7%) | 345 (17.3%) |
| Computers & Mathematics | 733 (77.4%) | 214 (22.6%) |
| Architecture & Engineering | 800 (91.8%) | 71 (8.2%) |
| Life, Physical & Social Science | 111 (64.9%) | 60 (35.1%) |
| Community & Social Service | 1,236 (29.4%) | 2,963 (70.6%) |
| Education, Arts & Media | 165 (20.8%) | 627 (79.2%) |
| Legal Services & Support | 70 (32.7%) | 144 (67.3%) |
| Education Instruction & Library | 835 (32.6%) | 1,728 (67.4%) |
| Arts, Media & Entertainment | 166 (26.4%) | 464 (73.7%) |
| Health Diagnosing & Treating | 432 (22.6%) | 1,477 (77.4%) |
| Health Technologists | 263 (21.6%) | 953 (78.4%) |
| Total (Category) | 6,355 (48.2%) | 6,834 (51.8%) |
| Total (Overall) | 16,771 (51.5%) | 15,771 (48.5%) |
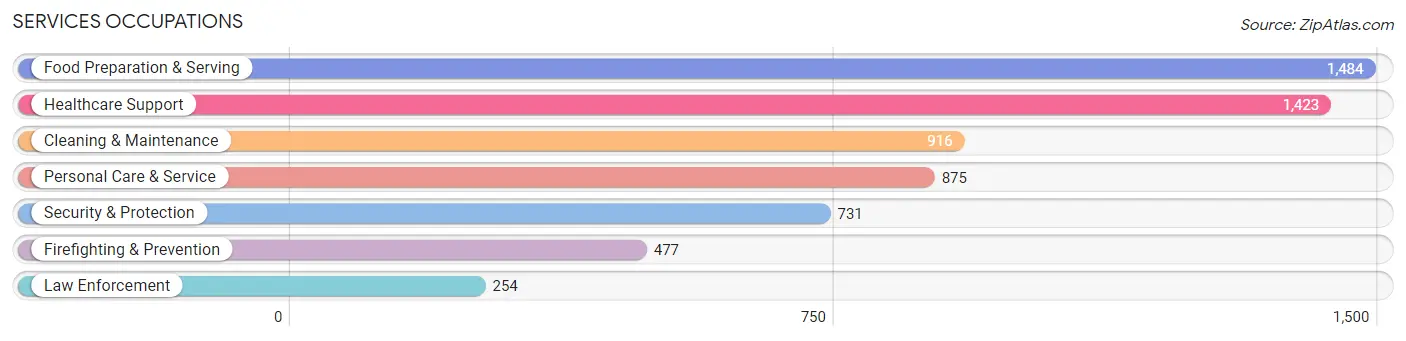
Services Occupations
The most common Services occupations in Island County are Food Preparation & Serving (1,484 | 4.6%), Healthcare Support (1,423 | 4.4%), Cleaning & Maintenance (916 | 2.8%), Personal Care & Service (875 | 2.7%), and Security & Protection (731 | 2.2%).
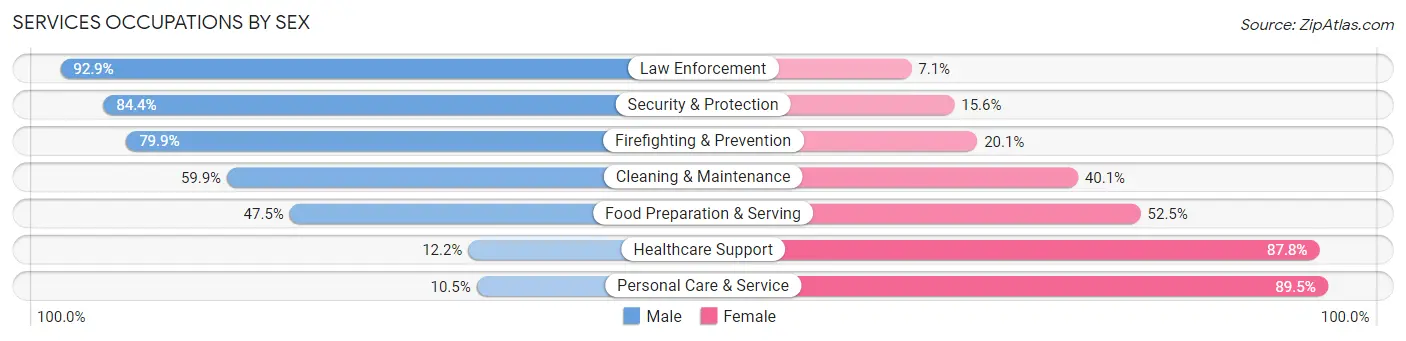
Services Occupations by Sex
Within the Services occupations in Island County, the most male-oriented occupations are Law Enforcement (92.9%), Security & Protection (84.4%), and Firefighting & Prevention (79.9%), while the most female-oriented occupations are Personal Care & Service (89.5%), Healthcare Support (87.8%), and Food Preparation & Serving (52.5%).
| Occupation | Male | Female |
| Healthcare Support | 173 (12.2%) | 1,250 (87.8%) |
| Security & Protection | 617 (84.4%) | 114 (15.6%) |
| Firefighting & Prevention | 381 (79.9%) | 96 (20.1%) |
| Law Enforcement | 236 (92.9%) | 18 (7.1%) |
| Food Preparation & Serving | 705 (47.5%) | 779 (52.5%) |
| Cleaning & Maintenance | 549 (59.9%) | 367 (40.1%) |
| Personal Care & Service | 92 (10.5%) | 783 (89.5%) |
| Total (Category) | 2,136 (39.3%) | 3,293 (60.7%) |
| Total (Overall) | 16,771 (51.5%) | 15,771 (48.5%) |
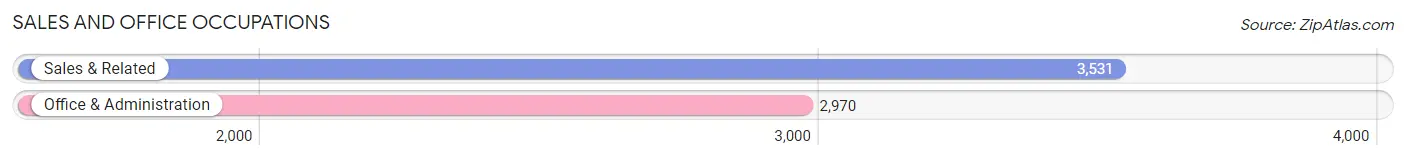
Sales and Office Occupations
The most common Sales and Office occupations in Island County are Sales & Related (3,531 | 10.8%), and Office & Administration (2,970 | 9.1%).
Sales and Office Occupations by Sex
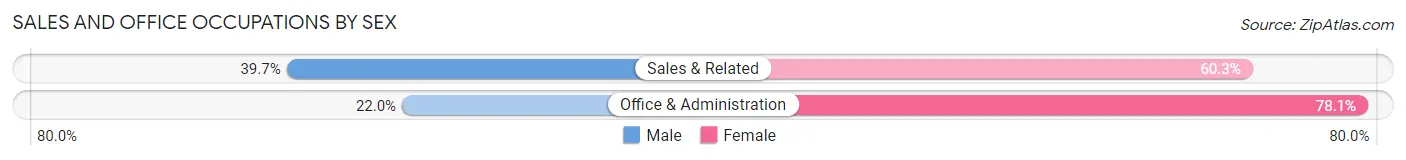
| Occupation | Male | Female |
| Sales & Related | 1,402 (39.7%) | 2,129 (60.3%) |
| Office & Administration | 652 (22.0%) | 2,318 (78.0%) |
| Total (Category) | 2,054 (31.6%) | 4,447 (68.4%) |
| Total (Overall) | 16,771 (51.5%) | 15,771 (48.5%) |
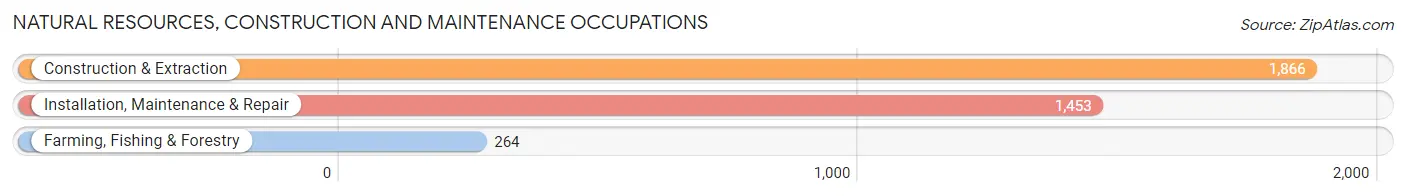
Natural Resources, Construction and Maintenance Occupations
The most common Natural Resources, Construction and Maintenance occupations in Island County are Construction & Extraction (1,866 | 5.7%), Installation, Maintenance & Repair (1,453 | 4.5%), and Farming, Fishing & Forestry (264 | 0.8%).
Natural Resources, Construction and Maintenance Occupations by Sex
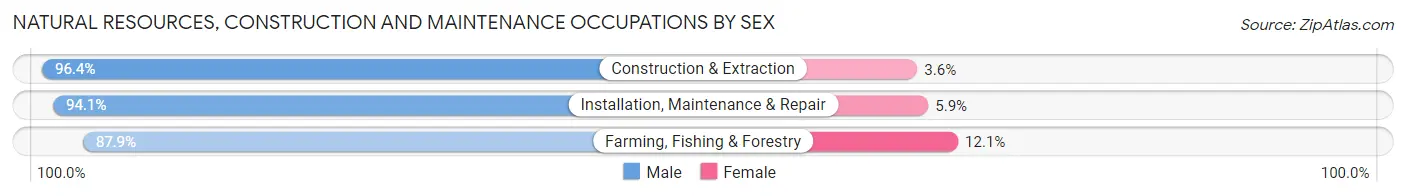
| Occupation | Male | Female |
| Farming, Fishing & Forestry | 232 (87.9%) | 32 (12.1%) |
| Construction & Extraction | 1,798 (96.4%) | 68 (3.6%) |
| Installation, Maintenance & Repair | 1,367 (94.1%) | 86 (5.9%) |
| Total (Category) | 3,397 (94.8%) | 186 (5.2%) |
| Total (Overall) | 16,771 (51.5%) | 15,771 (48.5%) |
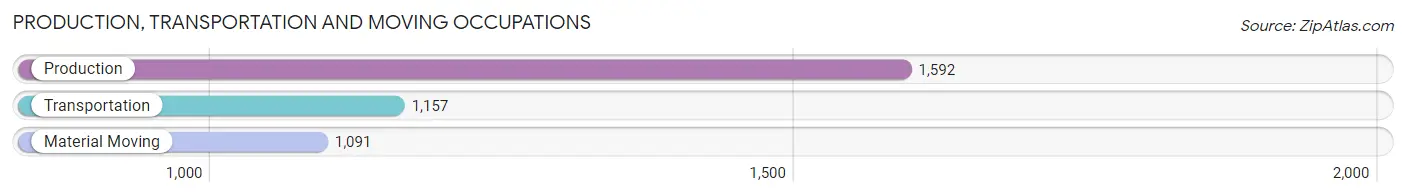
Production, Transportation and Moving Occupations
The most common Production, Transportation and Moving occupations in Island County are Production (1,592 | 4.9%), Transportation (1,157 | 3.6%), and Material Moving (1,091 | 3.4%).
Production, Transportation and Moving Occupations by Sex
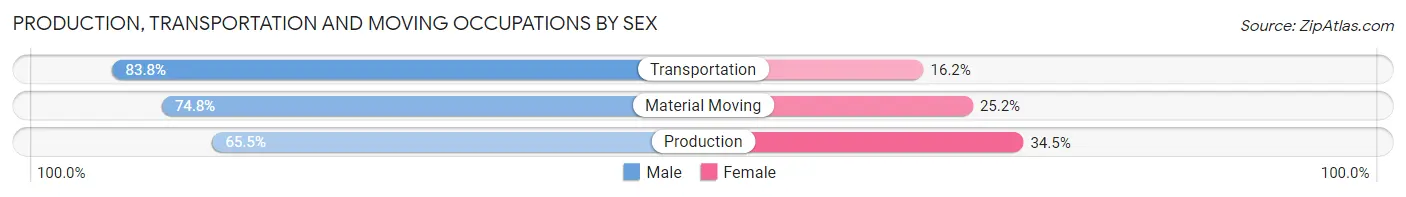
| Occupation | Male | Female |
| Production | 1,043 (65.5%) | 549 (34.5%) |
| Transportation | 970 (83.8%) | 187 (16.2%) |
| Material Moving | 816 (74.8%) | 275 (25.2%) |
| Total (Category) | 2,829 (73.7%) | 1,011 (26.3%) |
| Total (Overall) | 16,771 (51.5%) | 15,771 (48.5%) |
Employment Industries by Sex in Island County
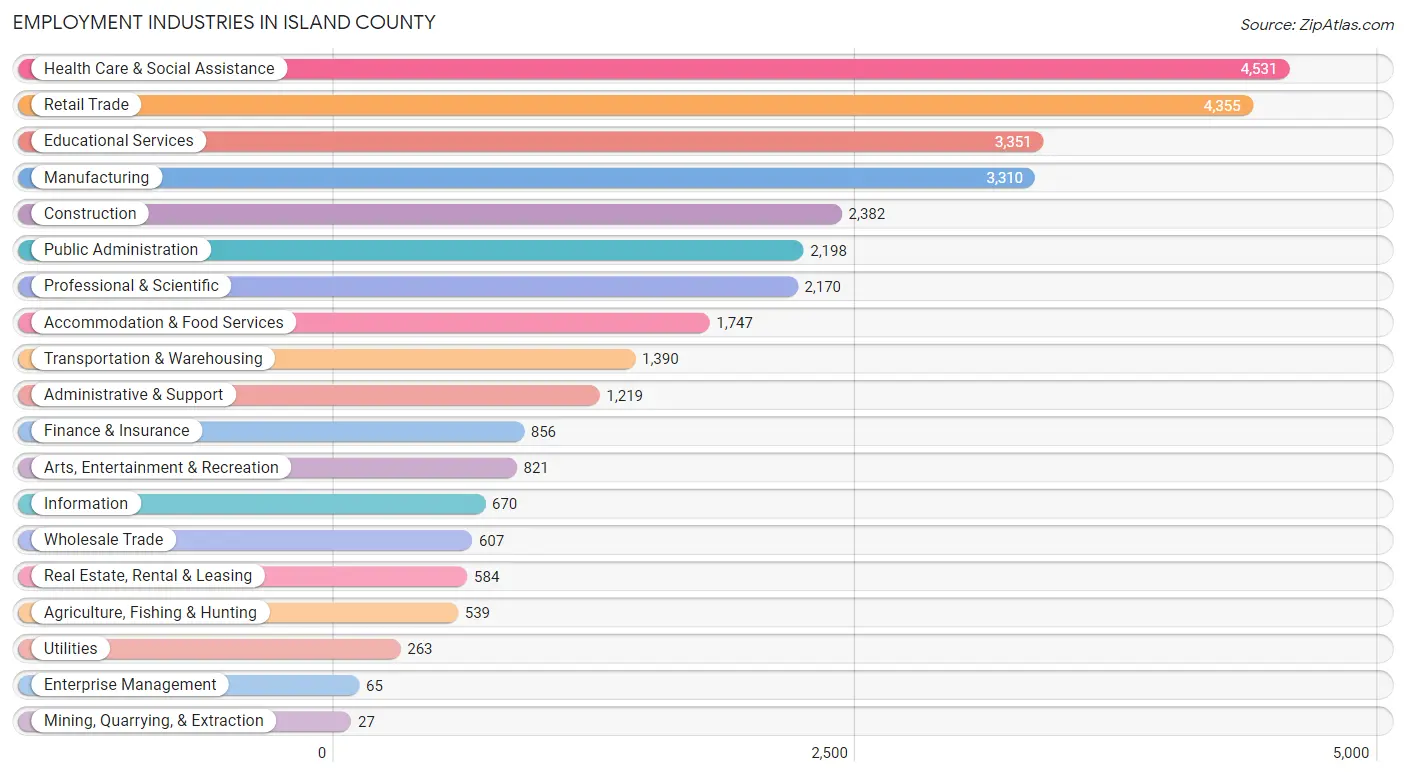
Employment Industries in Island County
The major employment industries in Island County include Health Care & Social Assistance (4,531 | 13.9%), Retail Trade (4,355 | 13.4%), Educational Services (3,351 | 10.3%), Manufacturing (3,310 | 10.2%), and Construction (2,382 | 7.3%).
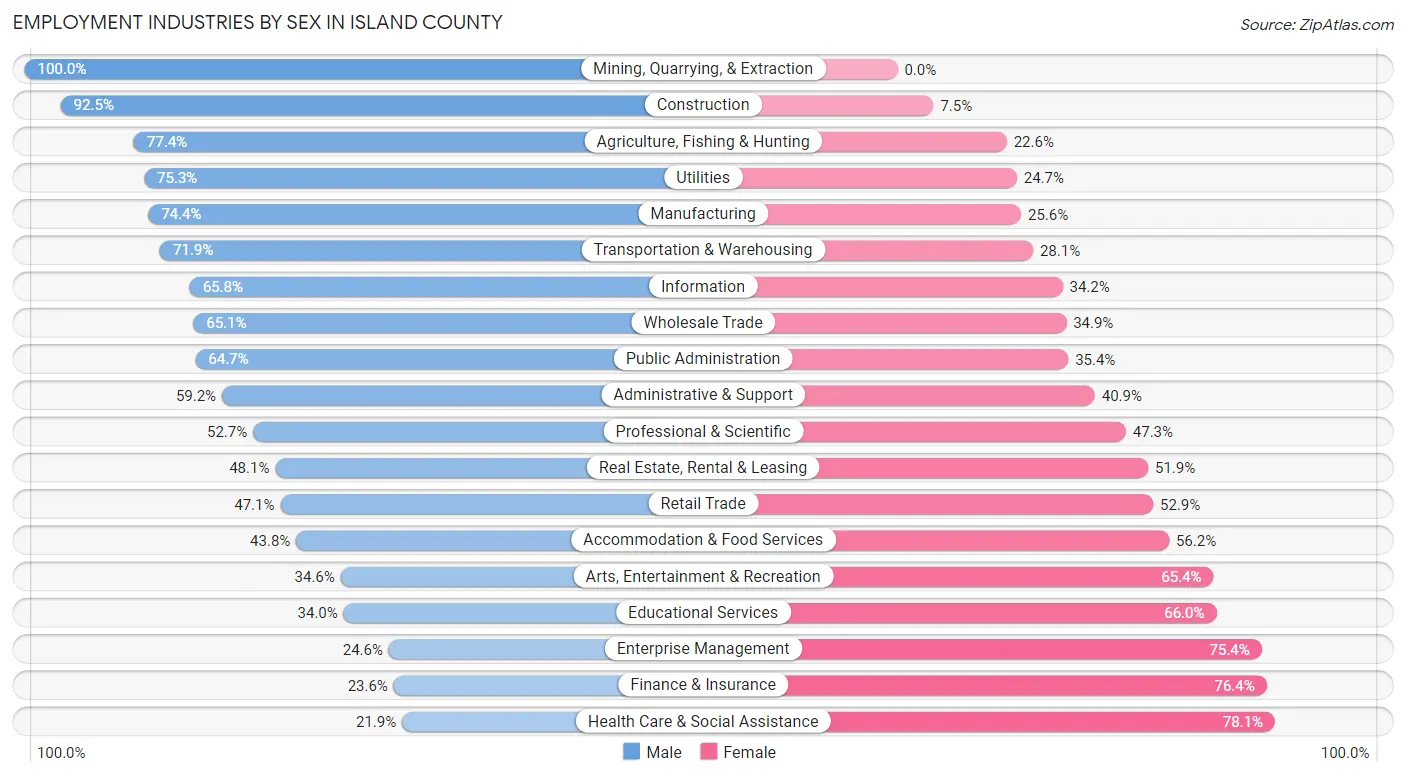
Employment Industries by Sex in Island County
The Island County industries that see more men than women are Mining, Quarrying, & Extraction (100.0%), Construction (92.5%), and Agriculture, Fishing & Hunting (77.4%), whereas the industries that tend to have a higher number of women are Health Care & Social Assistance (78.1%), Finance & Insurance (76.4%), and Enterprise Management (75.4%).
| Industry | Male | Female |
| Agriculture, Fishing & Hunting | 417 (77.4%) | 122 (22.6%) |
| Mining, Quarrying, & Extraction | 27 (100.0%) | 0 (0.0%) |
| Construction | 2,204 (92.5%) | 178 (7.5%) |
| Manufacturing | 2,463 (74.4%) | 847 (25.6%) |
| Wholesale Trade | 395 (65.1%) | 212 (34.9%) |
| Retail Trade | 2,050 (47.1%) | 2,305 (52.9%) |
| Transportation & Warehousing | 1,000 (71.9%) | 390 (28.1%) |
| Utilities | 198 (75.3%) | 65 (24.7%) |
| Information | 441 (65.8%) | 229 (34.2%) |
| Finance & Insurance | 202 (23.6%) | 654 (76.4%) |
| Real Estate, Rental & Leasing | 281 (48.1%) | 303 (51.9%) |
| Professional & Scientific | 1,144 (52.7%) | 1,026 (47.3%) |
| Enterprise Management | 16 (24.6%) | 49 (75.4%) |
| Administrative & Support | 721 (59.2%) | 498 (40.8%) |
| Educational Services | 1,139 (34.0%) | 2,212 (66.0%) |
| Health Care & Social Assistance | 991 (21.9%) | 3,540 (78.1%) |
| Arts, Entertainment & Recreation | 284 (34.6%) | 537 (65.4%) |
| Accommodation & Food Services | 765 (43.8%) | 982 (56.2%) |
| Public Administration | 1,421 (64.6%) | 777 (35.3%) |
| Total | 16,771 (51.5%) | 15,771 (48.5%) |
Education in Island County
School Enrollment in Island County
The most common levels of schooling among the 15,735 students in Island County are middle school (3,750 | 23.8%), elementary school (3,287 | 20.9%), and college / undergraduate (3,126 | 19.9%).
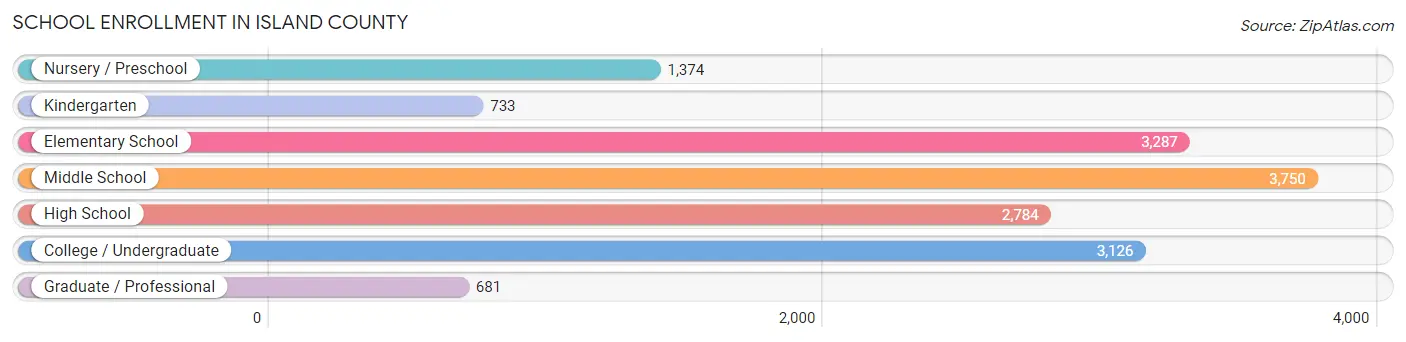
| School Level | # Students | % Students |
| Nursery / Preschool | 1,374 | 8.7% |
| Kindergarten | 733 | 4.7% |
| Elementary School | 3,287 | 20.9% |
| Middle School | 3,750 | 23.8% |
| High School | 2,784 | 17.7% |
| College / Undergraduate | 3,126 | 19.9% |
| Graduate / Professional | 681 | 4.3% |
| Total | 15,735 | 100.0% |
School Enrollment by Age by Funding Source in Island County
Out of a total of 15,735 students who are enrolled in schools in Island County, 2,927 (18.6%) attend a private institution, while the remaining 12,808 (81.4%) are enrolled in public schools. The age group of 3 to 4 year olds has the highest likelihood of being enrolled in private schools, with 569 (53.4% in the age bracket) enrolled. Conversely, the age group of 15 to 17 year olds has the lowest likelihood of being enrolled in a private school, with 1,919 (88.9% in the age bracket) attending a public institution.
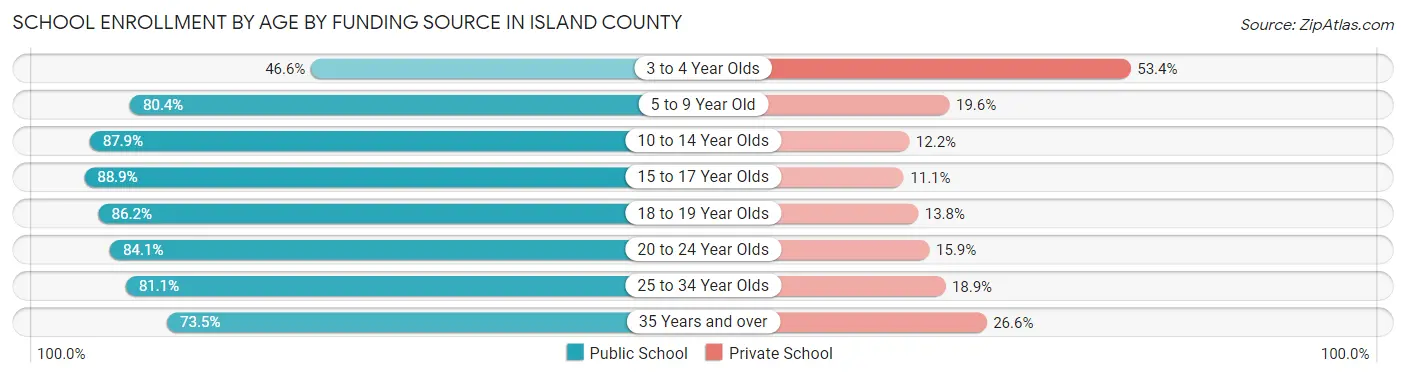
| Age Bracket | Public School | Private School |
| 3 to 4 Year Olds | 497 (46.6%) | 569 (53.4%) |
| 5 to 9 Year Old | 2,861 (80.4%) | 699 (19.6%) |
| 10 to 14 Year Olds | 4,188 (87.8%) | 579 (12.1%) |
| 15 to 17 Year Olds | 1,919 (88.9%) | 240 (11.1%) |
| 18 to 19 Year Olds | 662 (86.2%) | 106 (13.8%) |
| 20 to 24 Year Olds | 671 (84.1%) | 127 (15.9%) |
| 25 to 34 Year Olds | 1,011 (81.1%) | 235 (18.9%) |
| 35 Years and over | 1,007 (73.5%) | 364 (26.6%) |
| Total | 12,808 (81.4%) | 2,927 (18.6%) |
Educational Attainment by Field of Study in Island County
Business (3,139 | 12.8%), education (3,024 | 12.4%), science & technology (2,755 | 11.3%), social sciences (2,191 | 9.0%), and bio, nature & agricultural (2,181 | 8.9%) are the most common fields of study among 24,465 individuals in Island County who have obtained a bachelor's degree or higher.
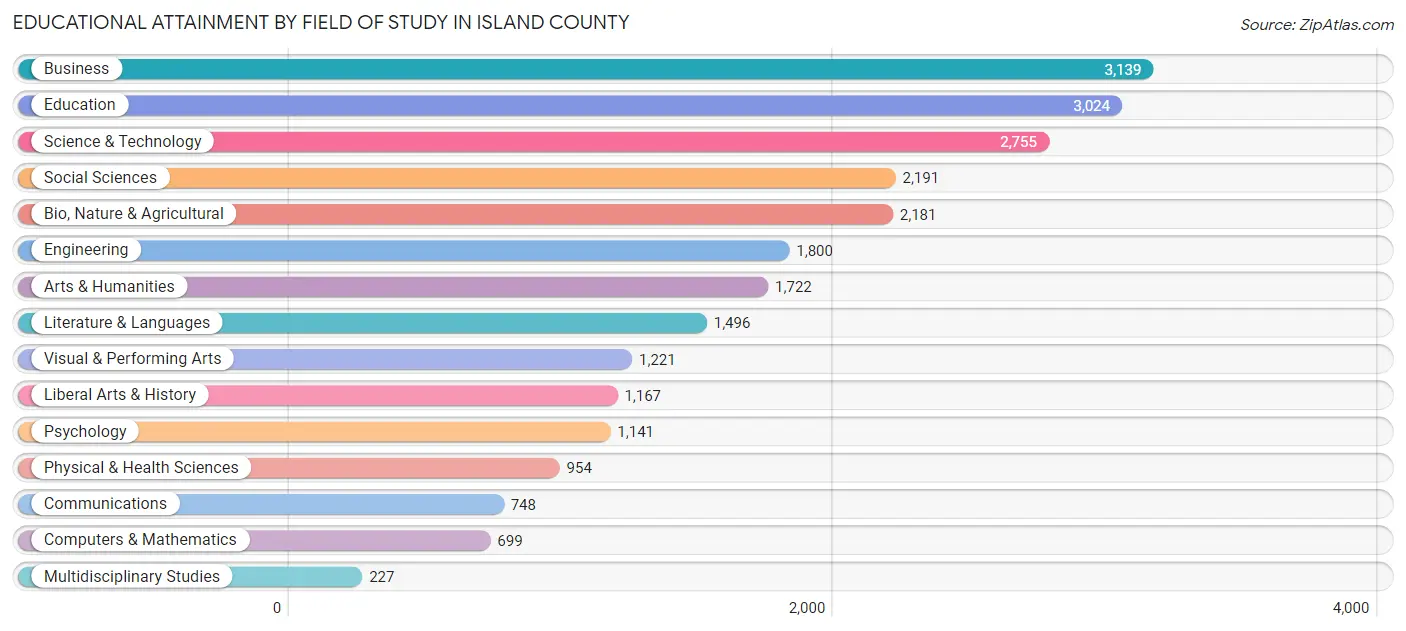
| Field of Study | # Graduates | % Graduates |
| Computers & Mathematics | 699 | 2.9% |
| Bio, Nature & Agricultural | 2,181 | 8.9% |
| Physical & Health Sciences | 954 | 3.9% |
| Psychology | 1,141 | 4.7% |
| Social Sciences | 2,191 | 9.0% |
| Engineering | 1,800 | 7.4% |
| Multidisciplinary Studies | 227 | 0.9% |
| Science & Technology | 2,755 | 11.3% |
| Business | 3,139 | 12.8% |
| Education | 3,024 | 12.4% |
| Literature & Languages | 1,496 | 6.1% |
| Liberal Arts & History | 1,167 | 4.8% |
| Visual & Performing Arts | 1,221 | 5.0% |
| Communications | 748 | 3.1% |
| Arts & Humanities | 1,722 | 7.0% |
| Total | 24,465 | 100.0% |
Transportation & Commute in Island County
Vehicle Availability by Sex in Island County
The most prevalent vehicle ownership categories in Island County are males with 2 vehicles (8,361, accounting for 41.2%) and females with 2 vehicles (6,010, making up 50.9%).
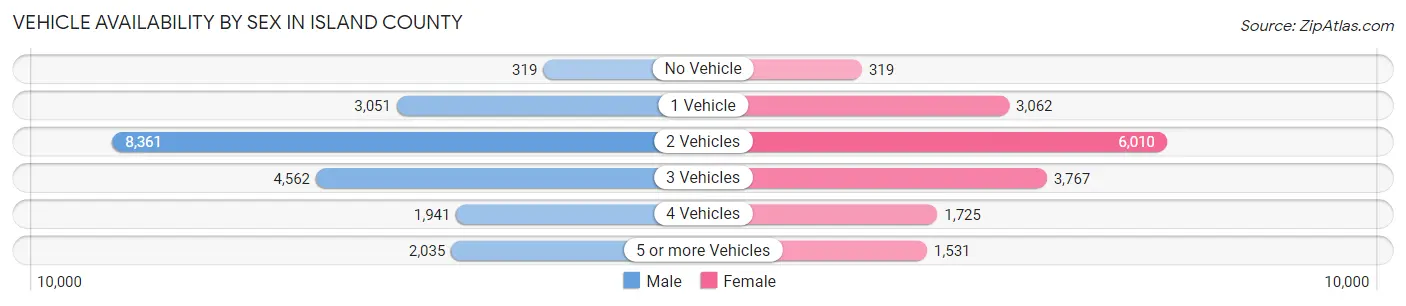
| Vehicles Available | Male | Female |
| No Vehicle | 319 (1.6%) | 319 (1.9%) |
| 1 Vehicle | 3,051 (15.0%) | 3,062 (18.6%) |
| 2 Vehicles | 8,361 (41.2%) | 6,010 (36.6%) |
| 3 Vehicles | 4,562 (22.5%) | 3,767 (23.0%) |
| 4 Vehicles | 1,941 (9.6%) | 1,725 (10.5%) |
| 5 or more Vehicles | 2,035 (10.0%) | 1,531 (9.3%) |
| Total | 20,269 (100.0%) | 16,414 (100.0%) |
Commute Time in Island County
The most frequently occuring commute durations in Island County are 15 to 19 minutes (5,909 commuters, 17.2%), 10 to 14 minutes (5,888 commuters, 17.2%), and 5 to 9 minutes (5,454 commuters, 15.9%).
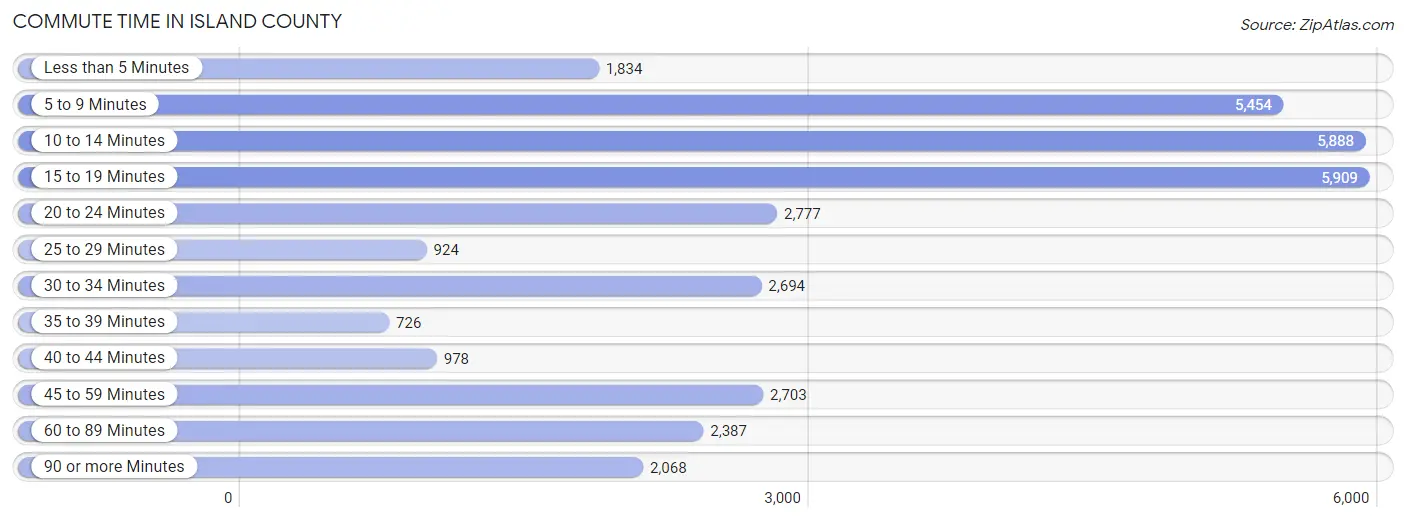
| Commute Time | # Commuters | % Commuters |
| Less than 5 Minutes | 1,834 | 5.3% |
| 5 to 9 Minutes | 5,454 | 15.9% |
| 10 to 14 Minutes | 5,888 | 17.2% |
| 15 to 19 Minutes | 5,909 | 17.2% |
| 20 to 24 Minutes | 2,777 | 8.1% |
| 25 to 29 Minutes | 924 | 2.7% |
| 30 to 34 Minutes | 2,694 | 7.8% |
| 35 to 39 Minutes | 726 | 2.1% |
| 40 to 44 Minutes | 978 | 2.9% |
| 45 to 59 Minutes | 2,703 | 7.9% |
| 60 to 89 Minutes | 2,387 | 7.0% |
| 90 or more Minutes | 2,068 | 6.0% |
Commute Time by Sex in Island County
The most common commute times in Island County are 10 to 14 minutes (3,470 commuters, 17.4%) for males and 15 to 19 minutes (2,514 commuters, 17.5%) for females.
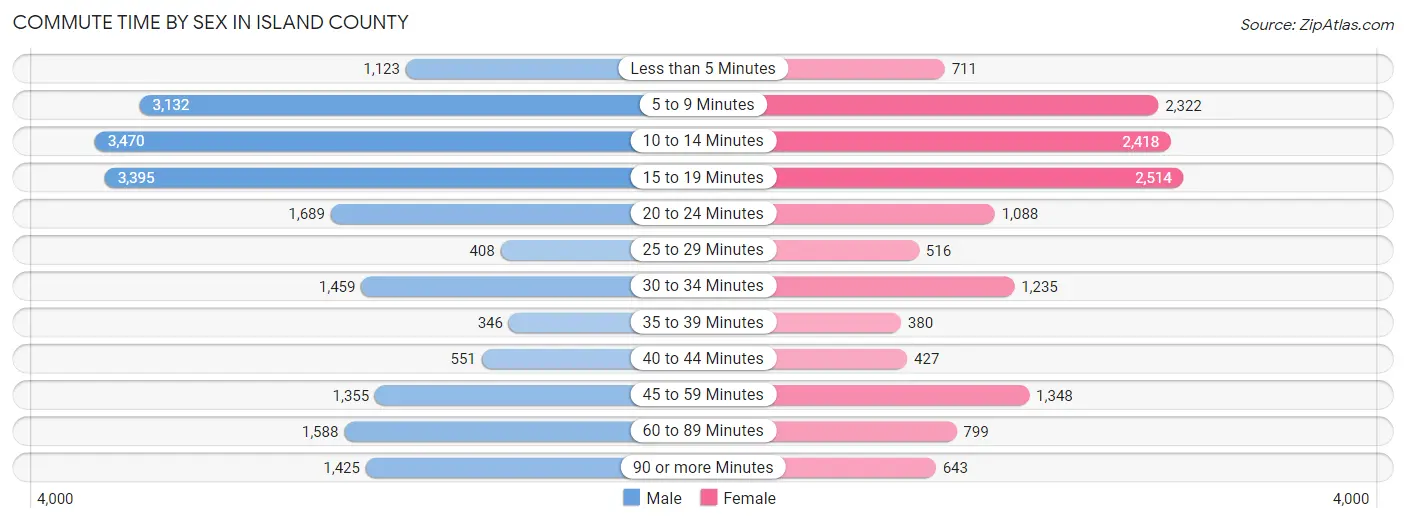
| Commute Time | Male | Female |
| Less than 5 Minutes | 1,123 (5.6%) | 711 (4.9%) |
| 5 to 9 Minutes | 3,132 (15.7%) | 2,322 (16.1%) |
| 10 to 14 Minutes | 3,470 (17.4%) | 2,418 (16.8%) |
| 15 to 19 Minutes | 3,395 (17.0%) | 2,514 (17.5%) |
| 20 to 24 Minutes | 1,689 (8.5%) | 1,088 (7.6%) |
| 25 to 29 Minutes | 408 (2.1%) | 516 (3.6%) |
| 30 to 34 Minutes | 1,459 (7.3%) | 1,235 (8.6%) |
| 35 to 39 Minutes | 346 (1.7%) | 380 (2.6%) |
| 40 to 44 Minutes | 551 (2.8%) | 427 (3.0%) |
| 45 to 59 Minutes | 1,355 (6.8%) | 1,348 (9.4%) |
| 60 to 89 Minutes | 1,588 (8.0%) | 799 (5.6%) |
| 90 or more Minutes | 1,425 (7.1%) | 643 (4.5%) |
Time of Departure to Work by Sex in Island County
The most frequent times of departure to work in Island County are 7:00 AM to 7:29 AM (2,905, 14.6%) for males and 7:00 AM to 7:29 AM (2,073, 14.4%) for females.
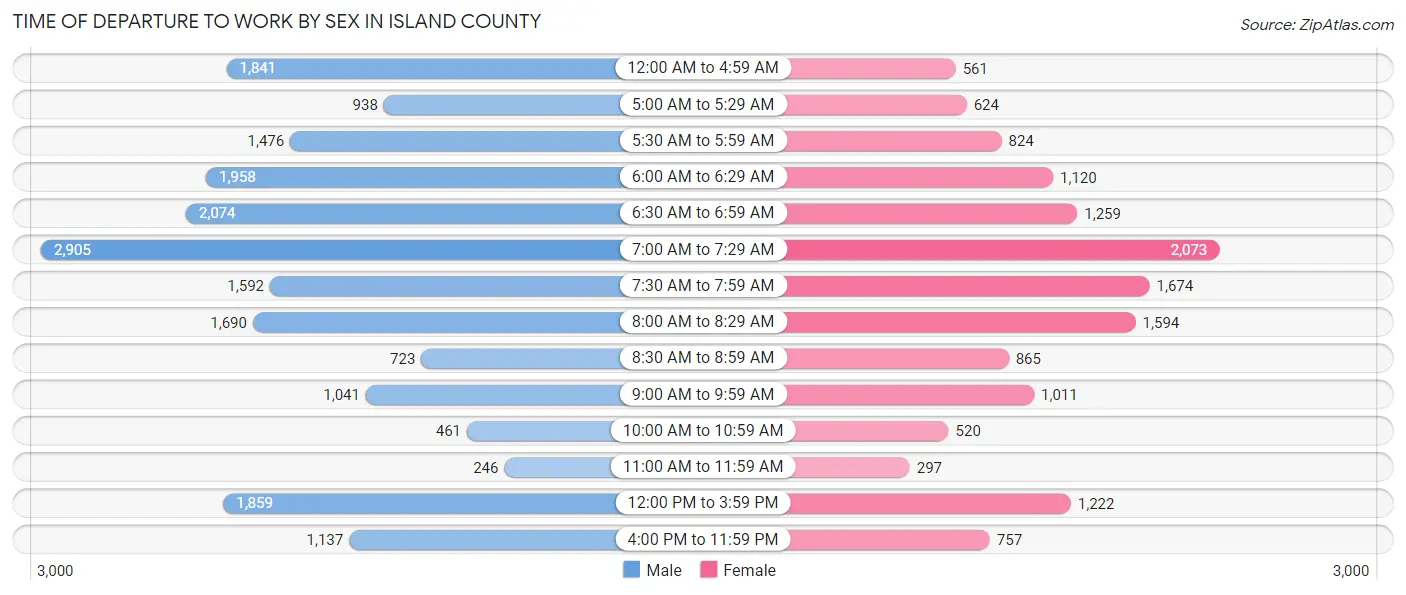
| Time of Departure | Male | Female |
| 12:00 AM to 4:59 AM | 1,841 (9.2%) | 561 (3.9%) |
| 5:00 AM to 5:29 AM | 938 (4.7%) | 624 (4.3%) |
| 5:30 AM to 5:59 AM | 1,476 (7.4%) | 824 (5.7%) |
| 6:00 AM to 6:29 AM | 1,958 (9.8%) | 1,120 (7.8%) |
| 6:30 AM to 6:59 AM | 2,074 (10.4%) | 1,259 (8.7%) |
| 7:00 AM to 7:29 AM | 2,905 (14.6%) | 2,073 (14.4%) |
| 7:30 AM to 7:59 AM | 1,592 (8.0%) | 1,674 (11.6%) |
| 8:00 AM to 8:29 AM | 1,690 (8.5%) | 1,594 (11.1%) |
| 8:30 AM to 8:59 AM | 723 (3.6%) | 865 (6.0%) |
| 9:00 AM to 9:59 AM | 1,041 (5.2%) | 1,011 (7.0%) |
| 10:00 AM to 10:59 AM | 461 (2.3%) | 520 (3.6%) |
| 11:00 AM to 11:59 AM | 246 (1.2%) | 297 (2.1%) |
| 12:00 PM to 3:59 PM | 1,859 (9.3%) | 1,222 (8.5%) |
| 4:00 PM to 11:59 PM | 1,137 (5.7%) | 757 (5.3%) |
| Total | 19,941 (100.0%) | 14,401 (100.0%) |
Housing Occupancy in Island County
Occupancy by Ownership in Island County
Of the total 35,498 dwellings in Island County, owner-occupied units account for 26,207 (73.8%), while renter-occupied units make up 9,291 (26.2%).
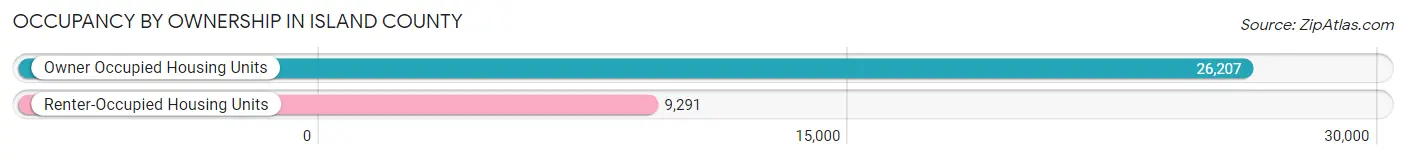
| Occupancy | # Housing Units | % Housing Units |
| Owner Occupied Housing Units | 26,207 | 73.8% |
| Renter-Occupied Housing Units | 9,291 | 26.2% |
| Total Occupied Housing Units | 35,498 | 100.0% |
Occupancy by Household Size in Island County
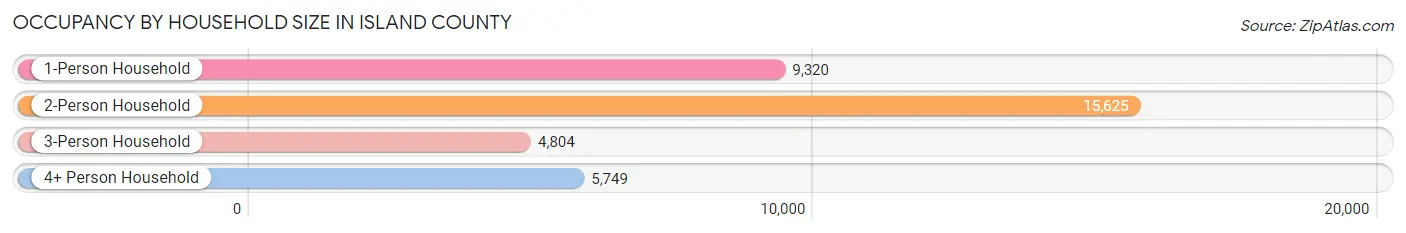
| Household Size | # Housing Units | % Housing Units |
| 1-Person Household | 9,320 | 26.3% |
| 2-Person Household | 15,625 | 44.0% |
| 3-Person Household | 4,804 | 13.5% |
| 4+ Person Household | 5,749 | 16.2% |
| Total Housing Units | 35,498 | 100.0% |
Occupancy by Ownership by Household Size in Island County
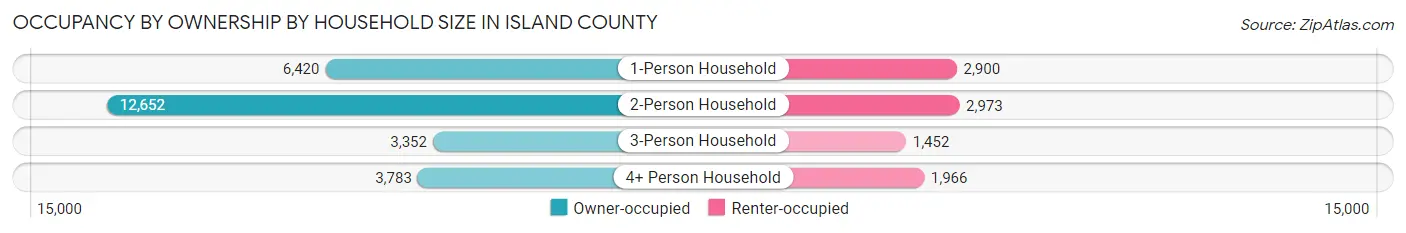
| Household Size | Owner-occupied | Renter-occupied |
| 1-Person Household | 6,420 (68.9%) | 2,900 (31.1%) |
| 2-Person Household | 12,652 (81.0%) | 2,973 (19.0%) |
| 3-Person Household | 3,352 (69.8%) | 1,452 (30.2%) |
| 4+ Person Household | 3,783 (65.8%) | 1,966 (34.2%) |
| Total Housing Units | 26,207 (73.8%) | 9,291 (26.2%) |
Occupancy by Educational Attainment in Island County
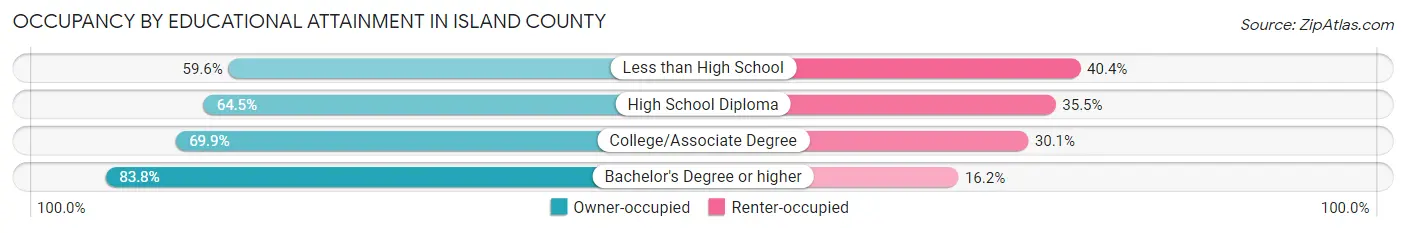
| Household Size | Owner-occupied | Renter-occupied |
| Less than High School | 760 (59.6%) | 516 (40.4%) |
| High School Diploma | 3,845 (64.5%) | 2,119 (35.5%) |
| College/Associate Degree | 10,461 (69.9%) | 4,499 (30.1%) |
| Bachelor's Degree or higher | 11,141 (83.8%) | 2,157 (16.2%) |
Occupancy by Age of Householder in Island County
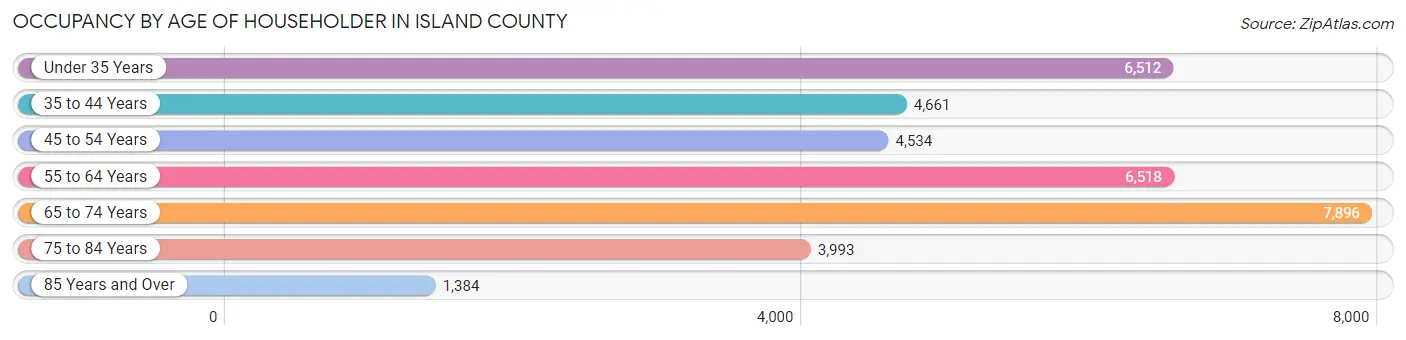
| Age Bracket | # Households | % Households |
| Under 35 Years | 6,512 | 18.3% |
| 35 to 44 Years | 4,661 | 13.1% |
| 45 to 54 Years | 4,534 | 12.8% |
| 55 to 64 Years | 6,518 | 18.4% |
| 65 to 74 Years | 7,896 | 22.2% |
| 75 to 84 Years | 3,993 | 11.3% |
| 85 Years and Over | 1,384 | 3.9% |
| Total | 35,498 | 100.0% |
Housing Finances in Island County
Median Income by Occupancy in Island County
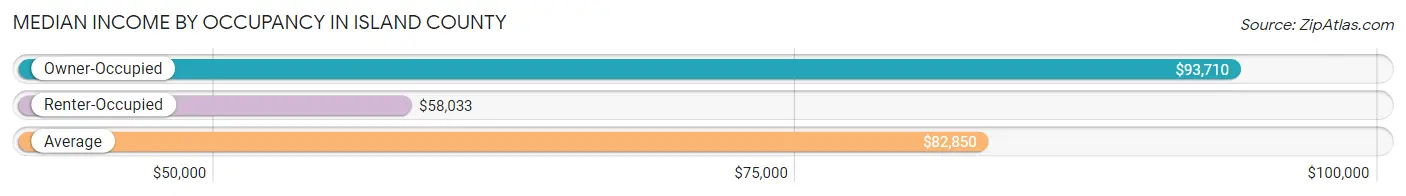
| Occupancy Type | # Households | Median Income |
| Owner-Occupied | 26,207 (73.8%) | $93,710 |
| Renter-Occupied | 9,291 (26.2%) | $58,033 |
| Average | 35,498 (100.0%) | $82,850 |
Occupancy by Householder Income Bracket in Island County
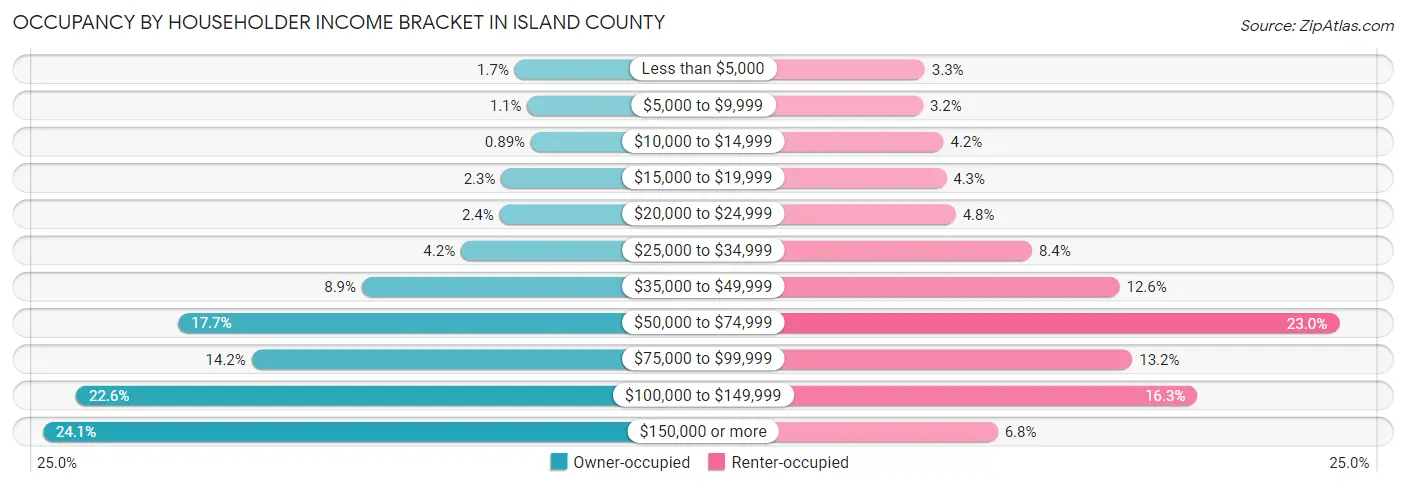
| Income Bracket | Owner-occupied | Renter-occupied |
| Less than $5,000 | 436 (1.7%) | 307 (3.3%) |
| $5,000 to $9,999 | 278 (1.1%) | 298 (3.2%) |
| $10,000 to $14,999 | 233 (0.9%) | 389 (4.2%) |
| $15,000 to $19,999 | 602 (2.3%) | 401 (4.3%) |
| $20,000 to $24,999 | 623 (2.4%) | 443 (4.8%) |
| $25,000 to $34,999 | 1,107 (4.2%) | 780 (8.4%) |
| $35,000 to $49,999 | 2,343 (8.9%) | 1,168 (12.6%) |
| $50,000 to $74,999 | 4,633 (17.7%) | 2,139 (23.0%) |
| $75,000 to $99,999 | 3,718 (14.2%) | 1,225 (13.2%) |
| $100,000 to $149,999 | 5,909 (22.6%) | 1,512 (16.3%) |
| $150,000 or more | 6,325 (24.1%) | 629 (6.8%) |
| Total | 26,207 (100.0%) | 9,291 (100.0%) |
Monthly Housing Cost Tiers in Island County
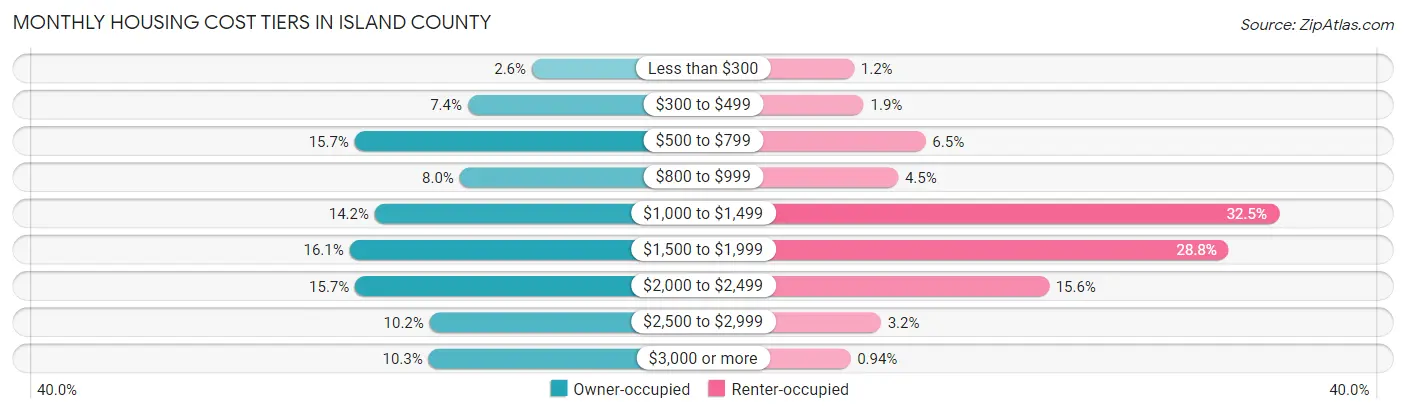
| Monthly Cost | Owner-occupied | Renter-occupied |
| Less than $300 | 693 (2.6%) | 112 (1.2%) |
| $300 to $499 | 1,929 (7.4%) | 179 (1.9%) |
| $500 to $799 | 4,111 (15.7%) | 602 (6.5%) |
| $800 to $999 | 2,086 (8.0%) | 414 (4.5%) |
| $1,000 to $1,499 | 3,723 (14.2%) | 3,020 (32.5%) |
| $1,500 to $1,999 | 4,211 (16.1%) | 2,677 (28.8%) |
| $2,000 to $2,499 | 4,103 (15.7%) | 1,446 (15.6%) |
| $2,500 to $2,999 | 2,665 (10.2%) | 296 (3.2%) |
| $3,000 or more | 2,686 (10.2%) | 87 (0.9%) |
| Total | 26,207 (100.0%) | 9,291 (100.0%) |
Physical Housing Characteristics in Island County
Housing Structures in Island County
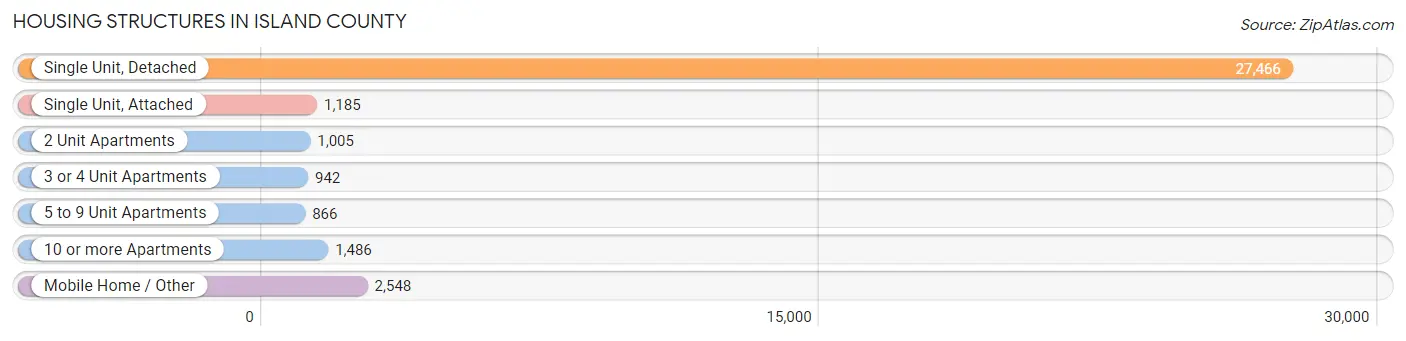
| Structure Type | # Housing Units | % Housing Units |
| Single Unit, Detached | 27,466 | 77.4% |
| Single Unit, Attached | 1,185 | 3.3% |
| 2 Unit Apartments | 1,005 | 2.8% |
| 3 or 4 Unit Apartments | 942 | 2.6% |
| 5 to 9 Unit Apartments | 866 | 2.4% |
| 10 or more Apartments | 1,486 | 4.2% |
| Mobile Home / Other | 2,548 | 7.2% |
| Total | 35,498 | 100.0% |
Housing Structures by Occupancy in Island County
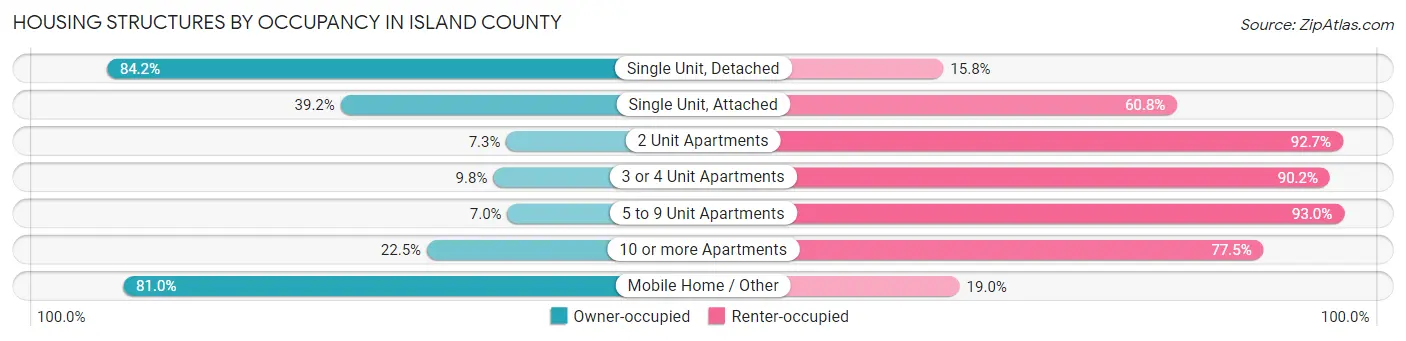
| Structure Type | Owner-occupied | Renter-occupied |
| Single Unit, Detached | 23,117 (84.2%) | 4,349 (15.8%) |
| Single Unit, Attached | 464 (39.2%) | 721 (60.8%) |
| 2 Unit Apartments | 73 (7.3%) | 932 (92.7%) |
| 3 or 4 Unit Apartments | 92 (9.8%) | 850 (90.2%) |
| 5 to 9 Unit Apartments | 61 (7.0%) | 805 (93.0%) |
| 10 or more Apartments | 335 (22.5%) | 1,151 (77.5%) |
| Mobile Home / Other | 2,065 (81.0%) | 483 (19.0%) |
| Total | 26,207 (73.8%) | 9,291 (26.2%) |
Housing Structures by Number of Rooms in Island County
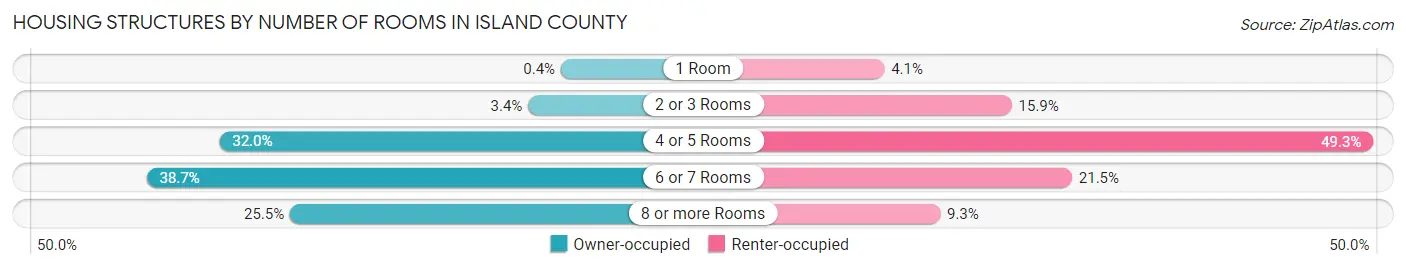
| Number of Rooms | Owner-occupied | Renter-occupied |
| 1 Room | 106 (0.4%) | 381 (4.1%) |
| 2 or 3 Rooms | 898 (3.4%) | 1,475 (15.9%) |
| 4 or 5 Rooms | 8,383 (32.0%) | 4,582 (49.3%) |
| 6 or 7 Rooms | 10,151 (38.7%) | 1,993 (21.4%) |
| 8 or more Rooms | 6,669 (25.5%) | 860 (9.3%) |
| Total | 26,207 (100.0%) | 9,291 (100.0%) |
Housing Structure by Heating Type in Island County
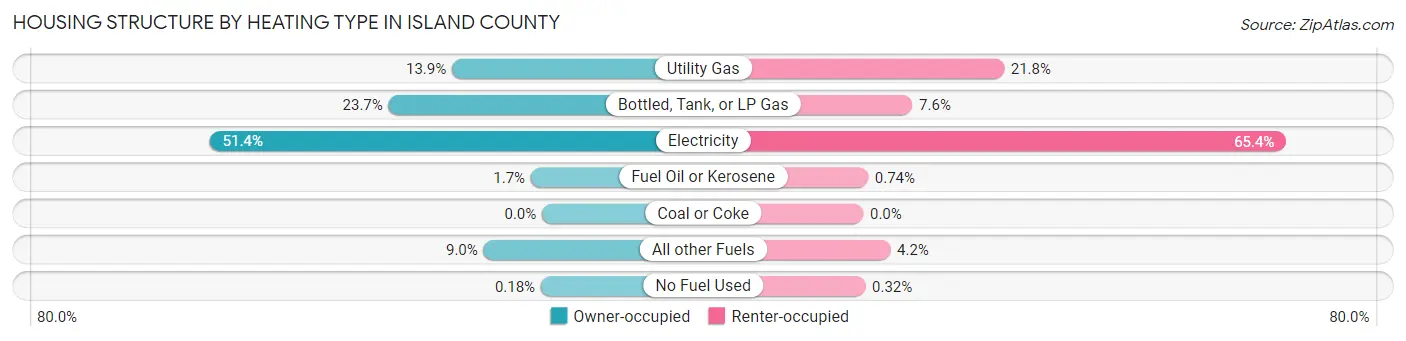
| Heating Type | Owner-occupied | Renter-occupied |
| Utility Gas | 3,649 (13.9%) | 2,022 (21.8%) |
| Bottled, Tank, or LP Gas | 6,220 (23.7%) | 705 (7.6%) |
| Electricity | 13,468 (51.4%) | 6,077 (65.4%) |
| Fuel Oil or Kerosene | 454 (1.7%) | 69 (0.7%) |
| Coal or Coke | 0 (0.0%) | 0 (0.0%) |
| All other Fuels | 2,370 (9.0%) | 388 (4.2%) |
| No Fuel Used | 46 (0.2%) | 30 (0.3%) |
| Total | 26,207 (100.0%) | 9,291 (100.0%) |
Household Vehicle Usage in Island County
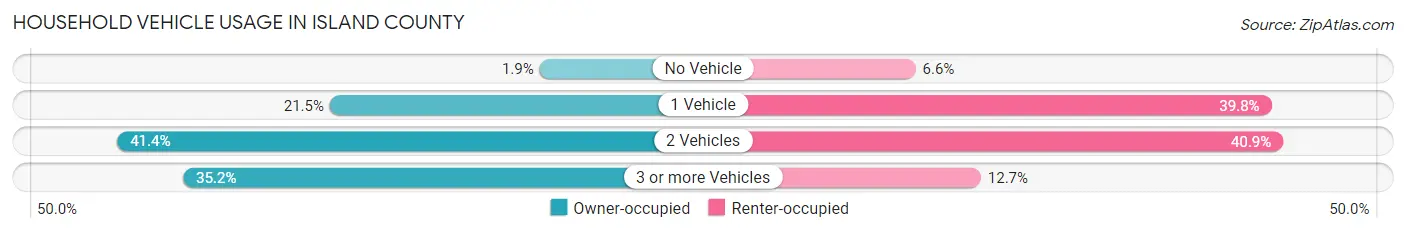
| Vehicles per Household | Owner-occupied | Renter-occupied |
| No Vehicle | 506 (1.9%) | 613 (6.6%) |
| 1 Vehicle | 5,638 (21.5%) | 3,699 (39.8%) |
| 2 Vehicles | 10,836 (41.3%) | 3,800 (40.9%) |
| 3 or more Vehicles | 9,227 (35.2%) | 1,179 (12.7%) |
| Total | 26,207 (100.0%) | 9,291 (100.0%) |
Real Estate & Mortgages in Island County
Real Estate and Mortgage Overview in Island County
| Characteristic | Without Mortgage | With Mortgage |
| Housing Units | 9,747 | 16,460 |
| Median Property Value | $490,000 | $476,900 |
| Median Household Income | $73,663 | $4,521 |
| Monthly Housing Costs | $706 | $2,658 |
| Real Estate Taxes | $3,728 | $181 |
Property Value by Mortgage Status in Island County
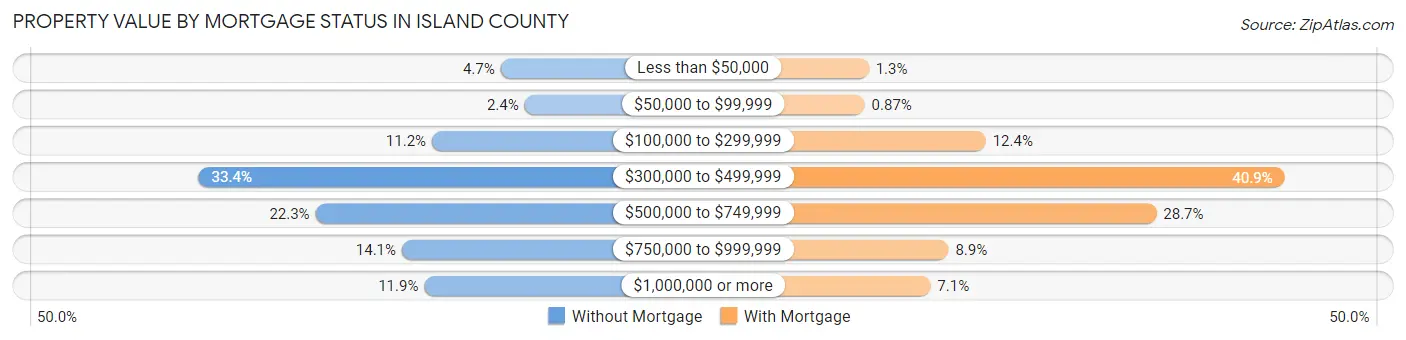
| Property Value | Without Mortgage | With Mortgage |
| Less than $50,000 | 455 (4.7%) | 205 (1.3%) |
| $50,000 to $99,999 | 233 (2.4%) | 143 (0.9%) |
| $100,000 to $299,999 | 1,093 (11.2%) | 2,041 (12.4%) |
| $300,000 to $499,999 | 3,257 (33.4%) | 6,726 (40.9%) |
| $500,000 to $749,999 | 2,174 (22.3%) | 4,715 (28.6%) |
| $750,000 to $999,999 | 1,371 (14.1%) | 1,457 (8.8%) |
| $1,000,000 or more | 1,164 (11.9%) | 1,173 (7.1%) |
| Total | 9,747 (100.0%) | 16,460 (100.0%) |
Household Income by Mortgage Status in Island County
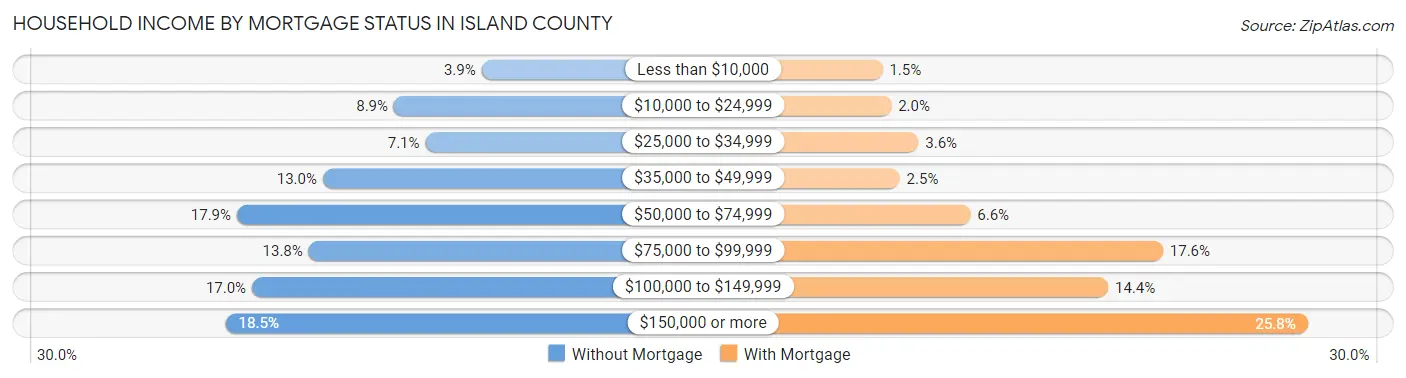
| Household Income | Without Mortgage | With Mortgage |
| Less than $10,000 | 379 (3.9%) | 253 (1.5%) |
| $10,000 to $24,999 | 867 (8.9%) | 335 (2.0%) |
| $25,000 to $34,999 | 692 (7.1%) | 591 (3.6%) |
| $35,000 to $49,999 | 1,263 (13.0%) | 415 (2.5%) |
| $50,000 to $74,999 | 1,742 (17.9%) | 1,080 (6.6%) |
| $75,000 to $99,999 | 1,342 (13.8%) | 2,891 (17.6%) |
| $100,000 to $149,999 | 1,658 (17.0%) | 2,376 (14.4%) |
| $150,000 or more | 1,804 (18.5%) | 4,251 (25.8%) |
| Total | 9,747 (100.0%) | 16,460 (100.0%) |
Property Value to Household Income Ratio in Island County
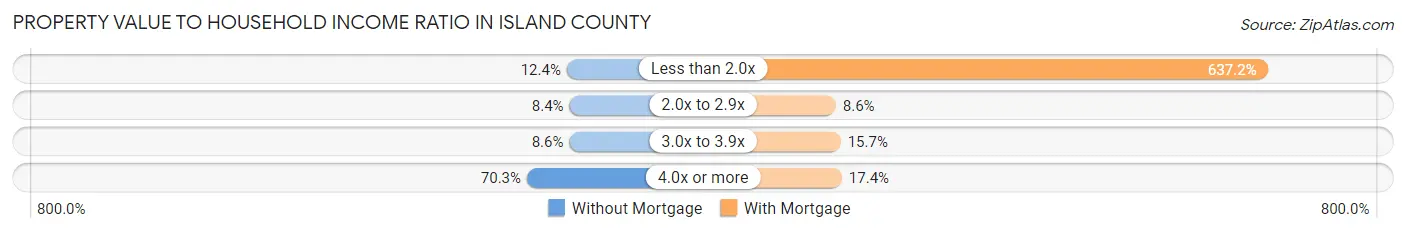
| Value-to-Income Ratio | Without Mortgage | With Mortgage |
| Less than 2.0x | 1,205 (12.4%) | 104,876 (637.2%) |
| 2.0x to 2.9x | 819 (8.4%) | 1,422 (8.6%) |
| 3.0x to 3.9x | 833 (8.6%) | 2,590 (15.7%) |
| 4.0x or more | 6,849 (70.3%) | 2,871 (17.4%) |
| Total | 9,747 (100.0%) | 16,460 (100.0%) |
Real Estate Taxes by Mortgage Status in Island County
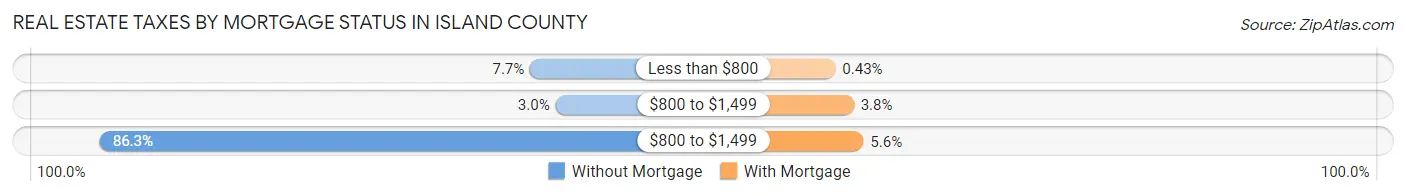
| Property Taxes | Without Mortgage | With Mortgage |
| Less than $800 | 748 (7.7%) | 70 (0.4%) |
| $800 to $1,499 | 295 (3.0%) | 622 (3.8%) |
| $800 to $1,499 | 8,408 (86.3%) | 913 (5.6%) |
| Total | 9,747 (100.0%) | 16,460 (100.0%) |
Health & Disability in Island County
Health Insurance Coverage by Age in Island County
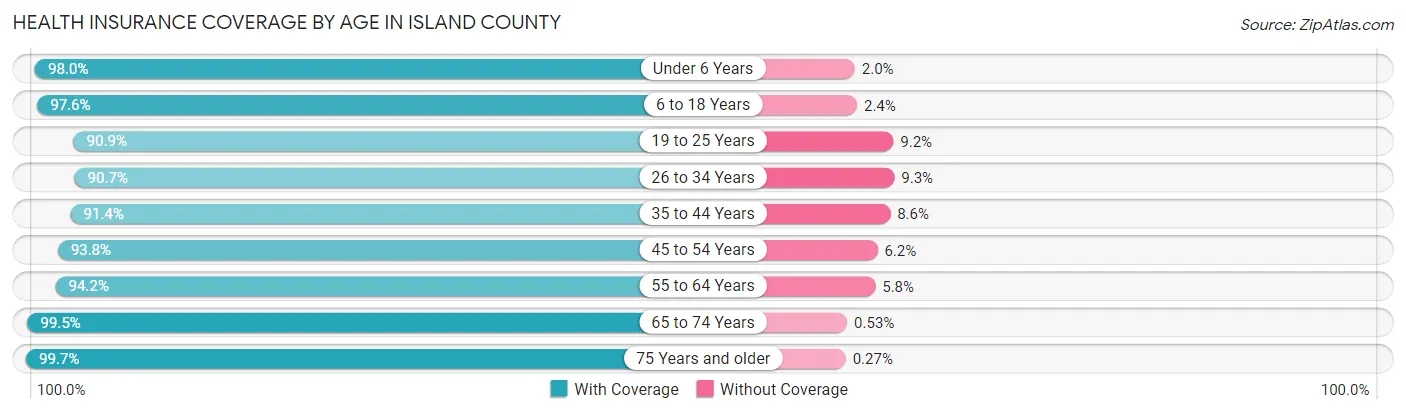
| Age Bracket | With Coverage | Without Coverage |
| Under 6 Years | 5,255 (98.0%) | 105 (2.0%) |
| 6 to 18 Years | 10,470 (97.6%) | 255 (2.4%) |
| 19 to 25 Years | 4,407 (90.8%) | 444 (9.1%) |
| 26 to 34 Years | 6,876 (90.7%) | 708 (9.3%) |
| 35 to 44 Years | 7,569 (91.4%) | 709 (8.6%) |
| 45 to 54 Years | 7,783 (93.8%) | 513 (6.2%) |
| 55 to 64 Years | 11,395 (94.2%) | 699 (5.8%) |
| 65 to 74 Years | 13,227 (99.5%) | 71 (0.5%) |
| 75 Years and older | 8,395 (99.7%) | 23 (0.3%) |
| Total | 75,377 (95.5%) | 3,527 (4.5%) |
Health Insurance Coverage by Citizenship Status in Island County
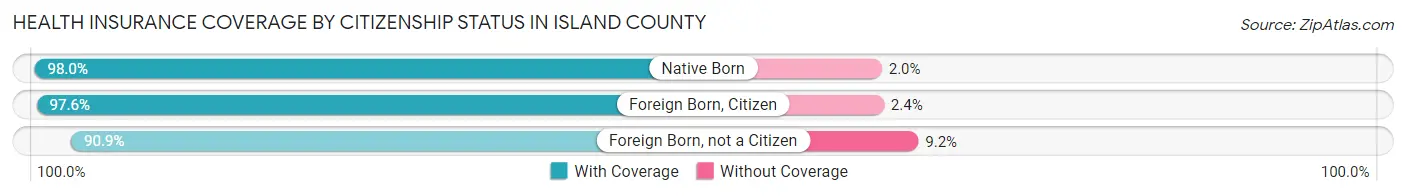
| Citizenship Status | With Coverage | Without Coverage |
| Native Born | 5,255 (98.0%) | 105 (2.0%) |
| Foreign Born, Citizen | 10,470 (97.6%) | 255 (2.4%) |
| Foreign Born, not a Citizen | 4,407 (90.8%) | 444 (9.1%) |
Health Insurance Coverage by Household Income in Island County
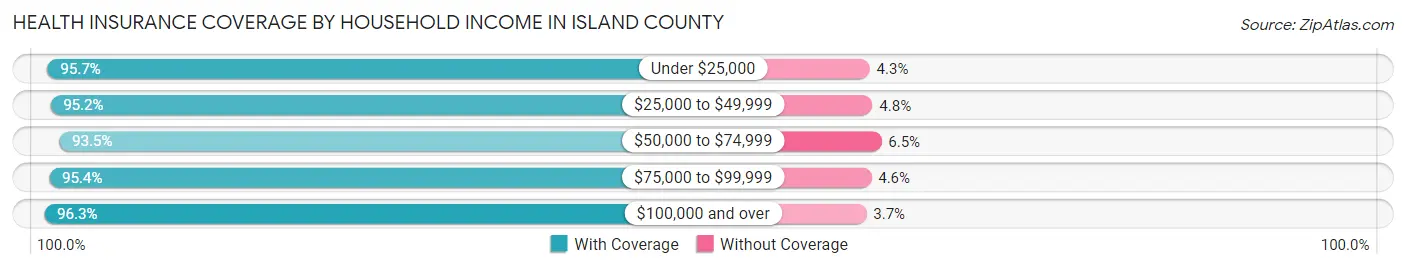
| Household Income | With Coverage | Without Coverage |
| Under $25,000 | 6,068 (95.7%) | 271 (4.3%) |
| $25,000 to $49,999 | 8,492 (95.2%) | 428 (4.8%) |
| $50,000 to $74,999 | 13,004 (93.5%) | 899 (6.5%) |
| $75,000 to $99,999 | 11,134 (95.4%) | 536 (4.6%) |
| $100,000 and over | 36,580 (96.3%) | 1,392 (3.7%) |
Public vs Private Health Insurance Coverage by Age in Island County
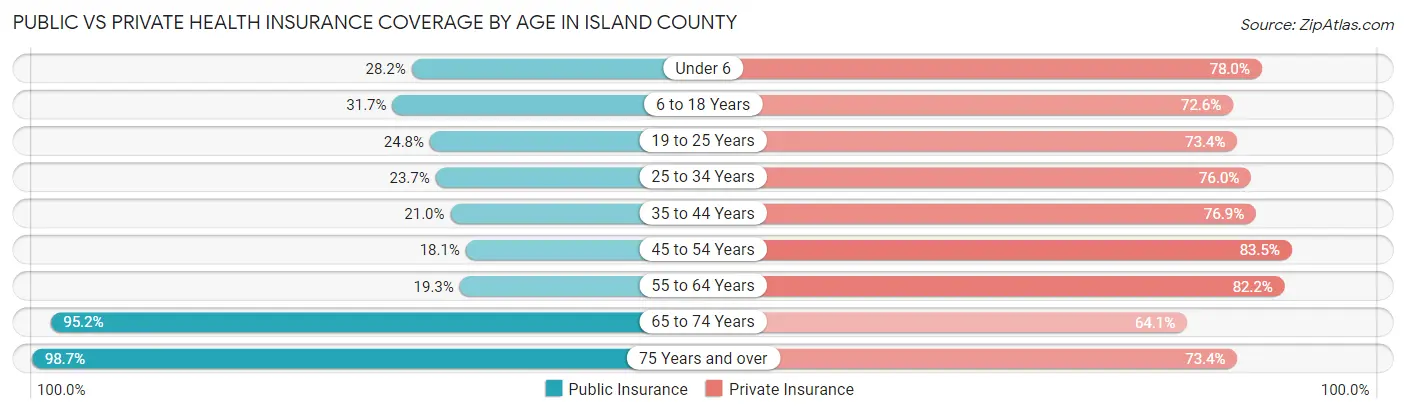
| Age Bracket | Public Insurance | Private Insurance |
| Under 6 | 1,510 (28.2%) | 4,178 (77.9%) |
| 6 to 18 Years | 3,404 (31.7%) | 7,788 (72.6%) |
| 19 to 25 Years | 1,202 (24.8%) | 3,561 (73.4%) |
| 25 to 34 Years | 1,799 (23.7%) | 5,762 (76.0%) |
| 35 to 44 Years | 1,736 (21.0%) | 6,365 (76.9%) |
| 45 to 54 Years | 1,504 (18.1%) | 6,927 (83.5%) |
| 55 to 64 Years | 2,329 (19.3%) | 9,941 (82.2%) |
| 65 to 74 Years | 12,663 (95.2%) | 8,522 (64.1%) |
| 75 Years and over | 8,305 (98.7%) | 6,181 (73.4%) |
| Total | 34,452 (43.7%) | 59,225 (75.1%) |
Disability Status by Sex by Age in Island County
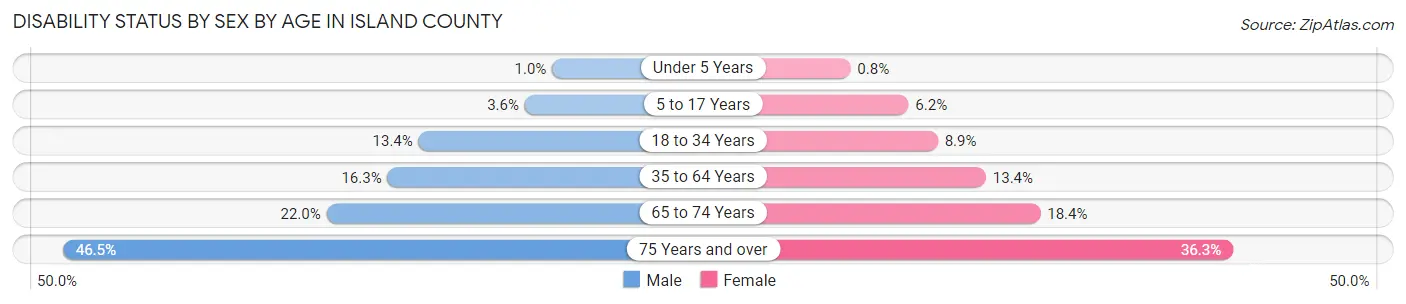
| Age Bracket | Male | Female |
| Under 5 Years | 23 (1.0%) | 18 (0.8%) |
| 5 to 17 Years | 197 (3.6%) | 337 (6.2%) |
| 18 to 34 Years | 803 (13.4%) | 634 (8.9%) |
| 35 to 64 Years | 2,219 (16.3%) | 2,016 (13.4%) |
| 65 to 74 Years | 1,377 (22.0%) | 1,295 (18.4%) |
| 75 Years and over | 1,821 (46.5%) | 1,633 (36.3%) |
Disability Class by Sex by Age in Island County
Disability Class: Hearing Difficulty
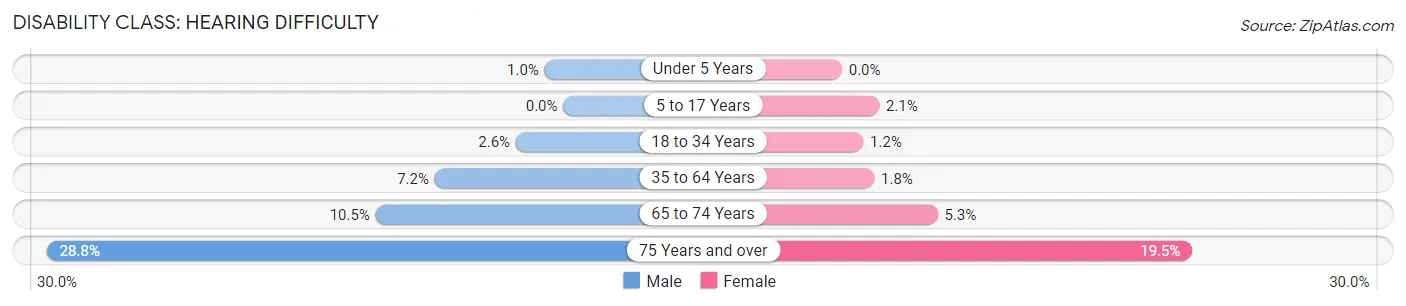
| Age Bracket | Male | Female |
| Under 5 Years | 23 (1.0%) | 0 (0.0%) |
| 5 to 17 Years | 0 (0.0%) | 113 (2.1%) |
| 18 to 34 Years | 158 (2.6%) | 85 (1.2%) |
| 35 to 64 Years | 974 (7.2%) | 271 (1.8%) |
| 65 to 74 Years | 655 (10.4%) | 375 (5.3%) |
| 75 Years and over | 1,128 (28.8%) | 878 (19.5%) |
Disability Class: Vision Difficulty
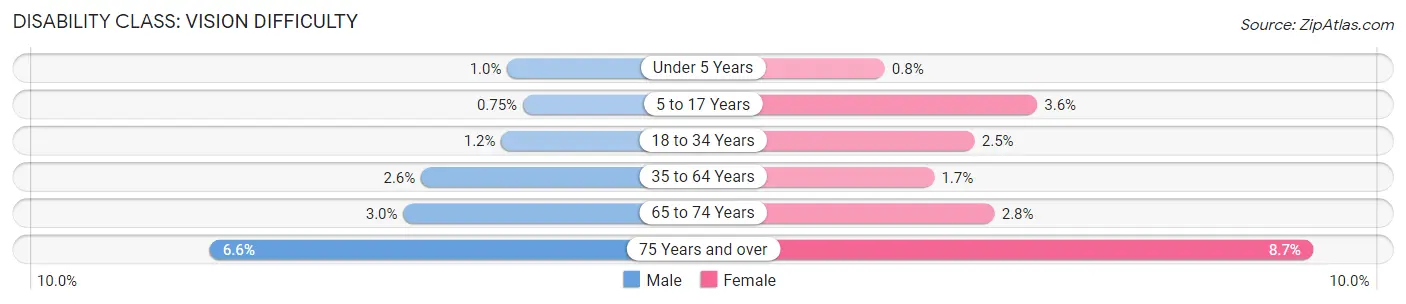
| Age Bracket | Male | Female |
| Under 5 Years | 23 (1.0%) | 18 (0.8%) |
| 5 to 17 Years | 41 (0.7%) | 198 (3.6%) |
| 18 to 34 Years | 69 (1.1%) | 176 (2.5%) |
| 35 to 64 Years | 359 (2.6%) | 260 (1.7%) |
| 65 to 74 Years | 186 (3.0%) | 200 (2.8%) |
| 75 Years and over | 257 (6.6%) | 393 (8.7%) |
Disability Class: Cognitive Difficulty
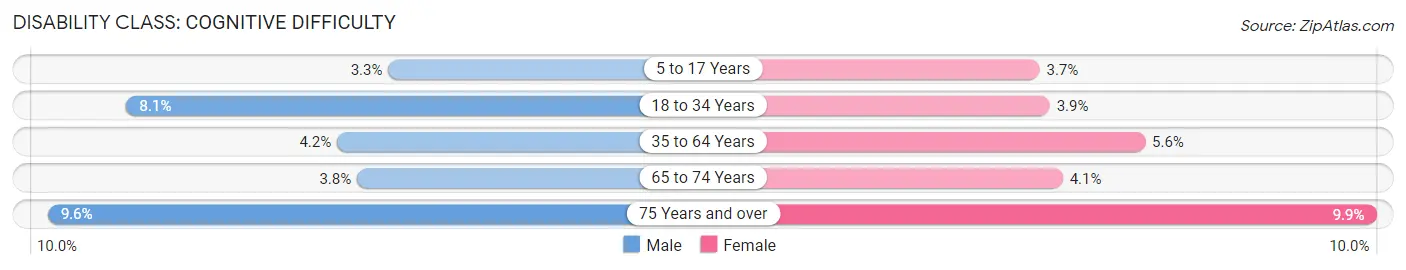
| Age Bracket | Male | Female |
| 5 to 17 Years | 179 (3.3%) | 200 (3.7%) |
| 18 to 34 Years | 485 (8.1%) | 275 (3.9%) |
| 35 to 64 Years | 571 (4.2%) | 849 (5.6%) |
| 65 to 74 Years | 240 (3.8%) | 288 (4.1%) |
| 75 Years and over | 375 (9.6%) | 446 (9.9%) |
Disability Class: Ambulatory Difficulty
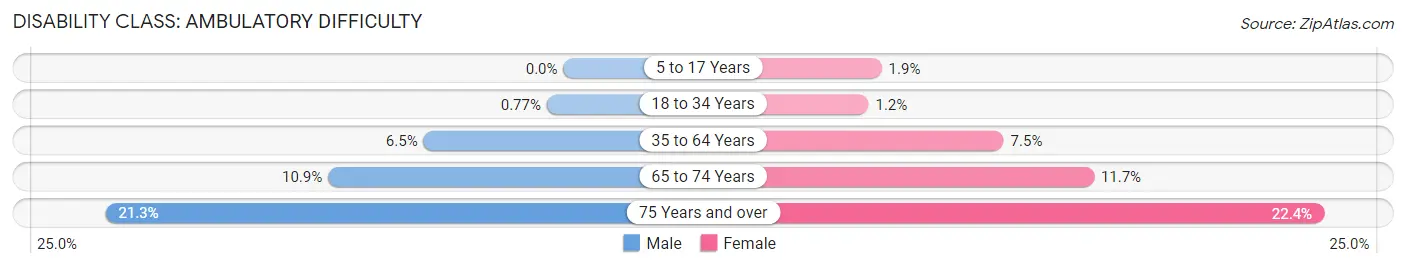
| Age Bracket | Male | Female |
| 5 to 17 Years | 0 (0.0%) | 101 (1.8%) |
| 18 to 34 Years | 46 (0.8%) | 88 (1.2%) |
| 35 to 64 Years | 882 (6.5%) | 1,132 (7.5%) |
| 65 to 74 Years | 684 (10.9%) | 823 (11.7%) |
| 75 Years and over | 833 (21.2%) | 1,006 (22.4%) |
Disability Class: Self-Care Difficulty
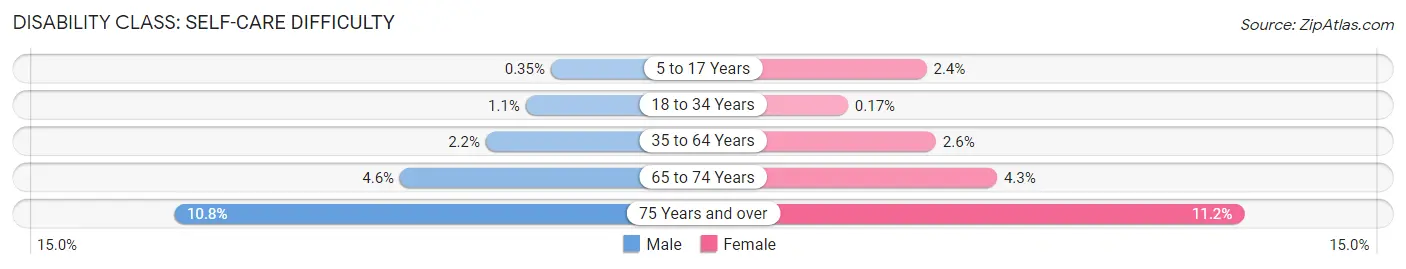
| Age Bracket | Male | Female |
| 5 to 17 Years | 19 (0.4%) | 129 (2.4%) |
| 18 to 34 Years | 63 (1.1%) | 12 (0.2%) |
| 35 to 64 Years | 294 (2.2%) | 395 (2.6%) |
| 65 to 74 Years | 285 (4.5%) | 304 (4.3%) |
| 75 Years and over | 425 (10.8%) | 504 (11.2%) |
Technology Access in Island County
Computing Device Access in Island County
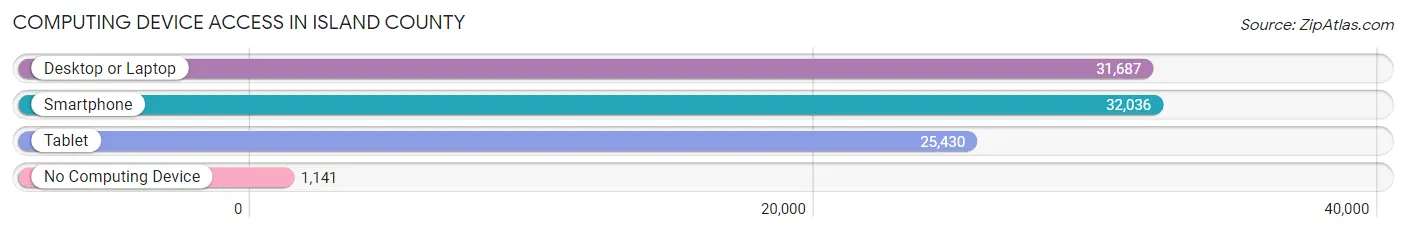
| Device Type | # Households | % Households |
| Desktop or Laptop | 31,687 | 89.3% |
| Smartphone | 32,036 | 90.2% |
| Tablet | 25,430 | 71.6% |
| No Computing Device | 1,141 | 3.2% |
| Total | 35,498 | 100.0% |
Internet Access in Island County
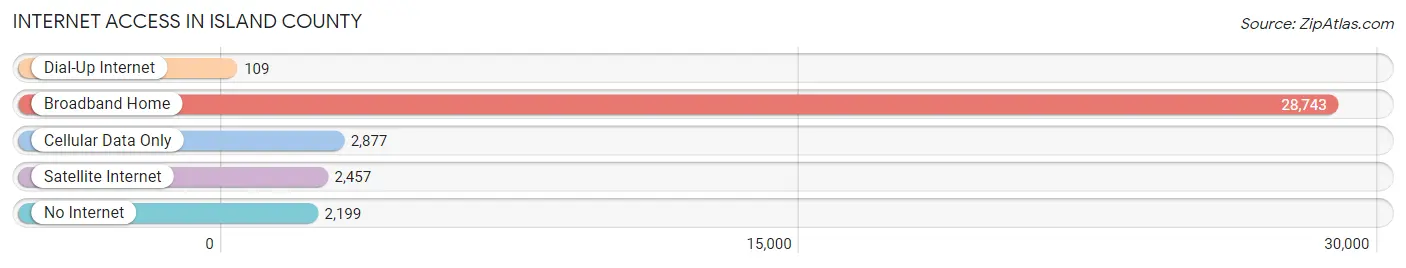
| Internet Type | # Households | % Households |
| Dial-Up Internet | 109 | 0.3% |
| Broadband Home | 28,743 | 81.0% |
| Cellular Data Only | 2,877 | 8.1% |
| Satellite Internet | 2,457 | 6.9% |
| No Internet | 2,199 | 6.2% |
| Total | 35,498 | 100.0% |
Island County Summary
Island County is a county located in the U.S. state of Washington. As of the 2010 census, its population was 78,506. The county seat and largest city is Coupeville. The county was created out of Thurston County on December 22, 1852 and is named for the numerous islands in its waters.
Geography
Island County is located in the northwest corner of Washington State, bordered by the Strait of Juan de Fuca to the west, the Saratoga Passage to the north, and Skagit County to the east. The county covers an area of 523 square miles, of which 441 square miles is land and 82 square miles is water. The county is composed of two large islands, Whidbey and Camano, and several smaller islands, including Baby, Ben Ure, Deception, Minor, Smith, and Strawberry. The highest point in the county is Mount Constitution on Orcas Island, at 2,409 feet.
The county is home to several state parks, including Deception Pass State Park, Fort Casey State Park, and South Whidbey State Park. The county also contains several wildlife areas, including the Skagit Wildlife Area, the San Juan Islands National Wildlife Refuge, and the Whidbey Island National Wildlife Refuge.
Economy
Island County’s economy is largely based on tourism, with the county’s many parks and beaches attracting visitors from around the world. The county is also home to several military installations, including Naval Air Station Whidbey Island and the Whidbey Island Naval Air Station. The county’s largest employers are the Navy, Island County government, and the Central Whidbey Island School District.
Demographics
As of the 2010 census, there were 78,506 people, 30,945 households, and 21,845 families residing in the county. The population density was 178.2 people per square mile. There were 33,945 housing units at an average density of 76.7 per square mile. The racial makeup of the county was 87.2% White, 4.2% Asian, 2.2% Black or African American, 0.7% Native American, 0.2% Pacific Islander, 2.7% from other races, and 2.8% from two or more races. Hispanic or Latino of any race were 6.3% of the population.
The median income for a household in the county was $54,945, and the median income for a family was $63,945. The per capita income for the county was $27,945. About 6.7% of families and 9.2% of the population were below the poverty line, including 11.2% of those under age 18 and 6.2% of those age 65 or over.
Conclusion
Island County is a beautiful and diverse county located in the northwest corner of Washington State. The county is home to several state parks, wildlife areas, and military installations, and its economy is largely based on tourism and the military. The county’s population is diverse, with a mix of races and ethnicities, and a median income that is slightly higher than the state average. Island County is a great place to live, work, and visit.
Common Questions
What is the Total Population of Island County?
Total Population of Island County is 86,510.
What is the Total Male Population of Island County?
Total Male Population of Island County is 43,409.
What is the Total Female Population of Island County?
Total Female Population of Island County is 43,101.
What is the Ratio of Males per 100 Females in Island County?
There are 100.71 Males per 100 Females in Island County.
What is the Ratio of Females per 100 Males in Island County?
There are 99.29 Females per 100 Males in Island County.
What is the Median Population Age in Island County?
Median Population Age in Island County is 44.2 Years.
What is the Average Family Size in Island County
Average Family Size in Island County is 2.8 People.
What is the Average Household Size in Island County
Average Household Size in Island County is 2.4 People.
What is Per Capita Income in Island County?
Per Capita income in Island County is $44,217.
What is the Median Family Income in Island County?
Median Family Income in Island County is $98,023.
What is the Median Household income in Island County?
Median Household Income in Island County is $82,850.
What is Income or Wage Gap in Island County?
Income or Wage Gap in Island County is 35.3%.
Women in Island County earn 64.7 cents for every dollar earned by a man.
What is Family Income Deficit in Island County?
Family Income Deficit in Island County is $11,176.
Families that are below poverty line in Island County earn $11,176 less on average than the poverty threshold level.
What is Inequality or Gini Index in Island County?
Inequality or Gini Index in Island County is 0.42.
How Large is the Labor Force in Island County?
There are 41,728 People in the Labor Forcein in Island County.
What is the Percentage of People in the Labor Force in Island County?
57.4% of People are in the Labor Force in Island County.
What is the Unemployment Rate in Island County?
Unemployment Rate in Island County is 5.5%.