Grays Harbor County, WA
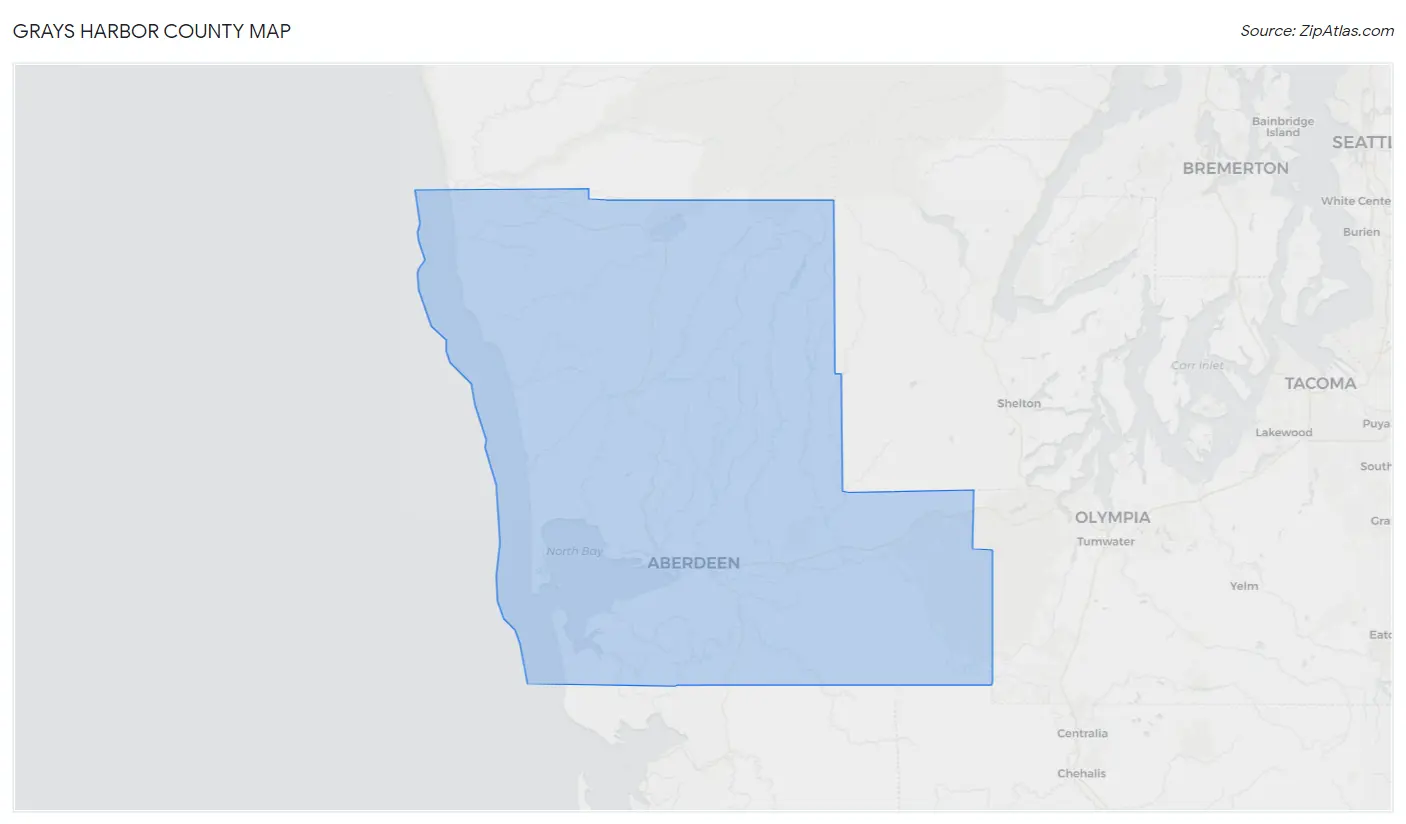
Grays Harbor County Map
Grays Harbor County Overview
75,672
TOTAL POPULATION
39,090
MALE POPULATION
36,582
FEMALE POPULATION
106.86
MALES / 100 FEMALES
93.58
FEMALES / 100 MALES
44.4
MEDIAN AGE
3.1
AVG FAMILY SIZE
2.5
AVG HOUSEHOLD SIZE
$31,703
PER CAPITA INCOME
$76,153
AVG FAMILY INCOME
$59,105
AVG HOUSEHOLD INCOME
18.8%
WAGE / INCOME GAP [ % ]
81.2¢/ $1
WAGE / INCOME GAP [ $ ]
$11,998
FAMILY INCOME DEFICIT
0.44
INEQUALITY / GINI INDEX
31,382
LABOR FORCE [ PEOPLE ]
50.4%
PERCENT IN LABOR FORCE
6.4%
UNEMPLOYMENT RATE
Grays Harbor County Area Codes
Race in Grays Harbor County
The most populous races in Grays Harbor County are White / Caucasian (62,047 | 82.0%), Hispanic or Latino (8,186 | 10.8%), and Two or more Races (5,917 | 7.8%).
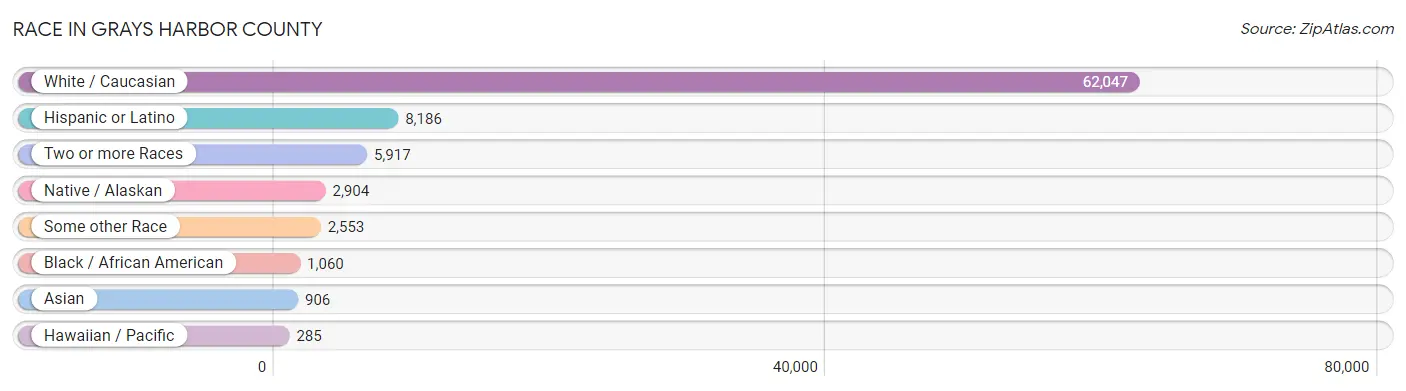
| Race | # Population | % Population |
| Asian | 906 | 1.2% |
| Black / African American | 1,060 | 1.4% |
| Hawaiian / Pacific | 285 | 0.4% |
| Hispanic or Latino | 8,186 | 10.8% |
| Native / Alaskan | 2,904 | 3.8% |
| White / Caucasian | 62,047 | 82.0% |
| Two or more Races | 5,917 | 7.8% |
| Some other Race | 2,553 | 3.4% |
| Total | 75,672 | 100.0% |
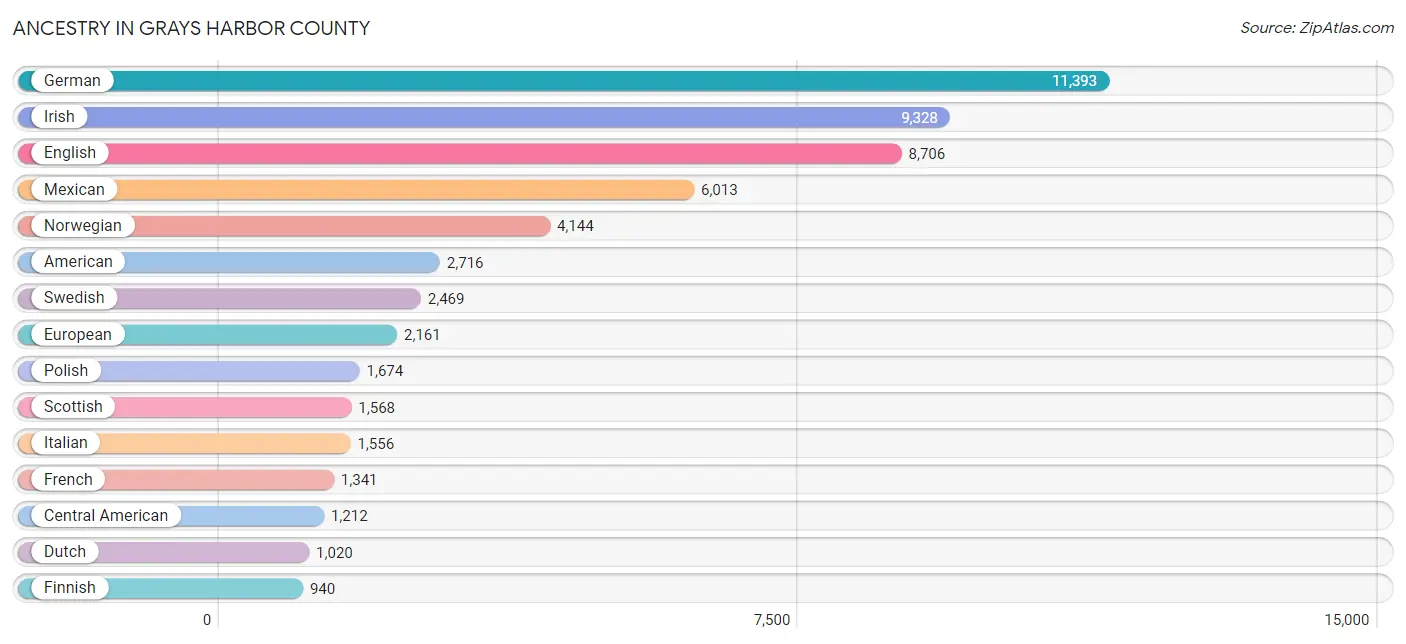
Ancestry in Grays Harbor County
The most populous ancestries reported in Grays Harbor County are German (11,393 | 15.1%), Irish (9,328 | 12.3%), English (8,706 | 11.5%), Mexican (6,013 | 8.0%), and Norwegian (4,144 | 5.5%), together accounting for 52.3% of all Grays Harbor County residents.
| Ancestry | # Population | % Population |
| African | 106 | 0.1% |
| Alaska Native | 95 | 0.1% |
| Alaskan Athabascan | 4 | 0.0% |
| Aleut | 25 | 0.0% |
| American | 2,716 | 3.6% |
| Arab | 67 | 0.1% |
| Austrian | 58 | 0.1% |
| Belgian | 16 | 0.0% |
| Bhutanese | 188 | 0.3% |
| Blackfeet | 54 | 0.1% |
| British | 638 | 0.8% |
| Bulgarian | 23 | 0.0% |
| Burmese | 295 | 0.4% |
| Cajun | 3 | 0.0% |
| Cambodian | 36 | 0.1% |
| Canadian | 217 | 0.3% |
| Cape Verdean | 11 | 0.0% |
| Central American | 1,212 | 1.6% |
| Central American Indian | 4 | 0.0% |
| Cherokee | 211 | 0.3% |
| Cheyenne | 11 | 0.0% |
| Chinese | 43 | 0.1% |
| Chippewa | 60 | 0.1% |
| Choctaw | 161 | 0.2% |
| Colombian | 41 | 0.1% |
| Colville | 4 | 0.0% |
| Creek | 17 | 0.0% |
| Croatian | 330 | 0.4% |
| Cuban | 108 | 0.1% |
| Czech | 67 | 0.1% |
| Czechoslovakian | 47 | 0.1% |
| Danish | 511 | 0.7% |
| Dutch | 1,020 | 1.3% |
| Eastern European | 193 | 0.3% |
| Ecuadorian | 7 | 0.0% |
| English | 8,706 | 11.5% |
| Ethiopian | 55 | 0.1% |
| European | 2,161 | 2.9% |
| Finnish | 940 | 1.2% |
| French | 1,341 | 1.8% |
| French American Indian | 122 | 0.2% |
| French Canadian | 581 | 0.8% |
| German | 11,393 | 15.1% |
| Greek | 154 | 0.2% |
| Guamanian / Chamorro | 167 | 0.2% |
| Guatemalan | 875 | 1.2% |
| Hungarian | 162 | 0.2% |
| Icelander | 92 | 0.1% |
| Indian (Asian) | 345 | 0.5% |
| Inupiat | 19 | 0.0% |
| Iraqi | 31 | 0.0% |
| Irish | 9,328 | 12.3% |
| Iroquois | 7 | 0.0% |
| Italian | 1,556 | 2.1% |
| Jamaican | 18 | 0.0% |
| Japanese | 77 | 0.1% |
| Korean | 611 | 0.8% |
| Latvian | 39 | 0.1% |
| Lebanese | 20 | 0.0% |
| Lithuanian | 61 | 0.1% |
| Malaysian | 19 | 0.0% |
| Mexican | 6,013 | 8.0% |
| Mexican American Indian | 50 | 0.1% |
| Native Hawaiian | 115 | 0.2% |
| Navajo | 47 | 0.1% |
| Nicaraguan | 9 | 0.0% |
| Northern European | 117 | 0.2% |
| Norwegian | 4,144 | 5.5% |
| Pakistani | 156 | 0.2% |
| Pennsylvania German | 8 | 0.0% |
| Peruvian | 12 | 0.0% |
| Polish | 1,674 | 2.2% |
| Portuguese | 217 | 0.3% |
| Potawatomi | 10 | 0.0% |
| Pueblo | 41 | 0.1% |
| Puerto Rican | 178 | 0.2% |
| Puget Sound Salish | 260 | 0.3% |
| Romanian | 57 | 0.1% |
| Russian | 599 | 0.8% |
| Salvadoran | 328 | 0.4% |
| Samoan | 109 | 0.1% |
| Scandinavian | 785 | 1.0% |
| Scotch-Irish | 733 | 1.0% |
| Scottish | 1,568 | 2.1% |
| Serbian | 23 | 0.0% |
| Shoshone | 1 | 0.0% |
| Sioux | 98 | 0.1% |
| Slavic | 8 | 0.0% |
| Slovak | 14 | 0.0% |
| Slovene | 4 | 0.0% |
| South American | 60 | 0.1% |
| South American Indian | 17 | 0.0% |
| Spaniard | 93 | 0.1% |
| Spanish | 93 | 0.1% |
| Sri Lankan | 134 | 0.2% |
| Subsaharan African | 174 | 0.2% |
| Swedish | 2,469 | 3.3% |
| Swiss | 262 | 0.4% |
| Syrian | 16 | 0.0% |
| Thai | 157 | 0.2% |
| Tlingit-Haida | 15 | 0.0% |
| Tongan | 42 | 0.1% |
| Tsimshian | 19 | 0.0% |
| Ukrainian | 39 | 0.1% |
| Welsh | 694 | 0.9% |
| West Indian | 4 | 0.0% |
| Yakama | 33 | 0.0% |
| Yugoslavian | 17 | 0.0% |
| Yup'ik | 27 | 0.0% |
| Zimbabwean | 2 | 0.0% | View All 110 Rows |
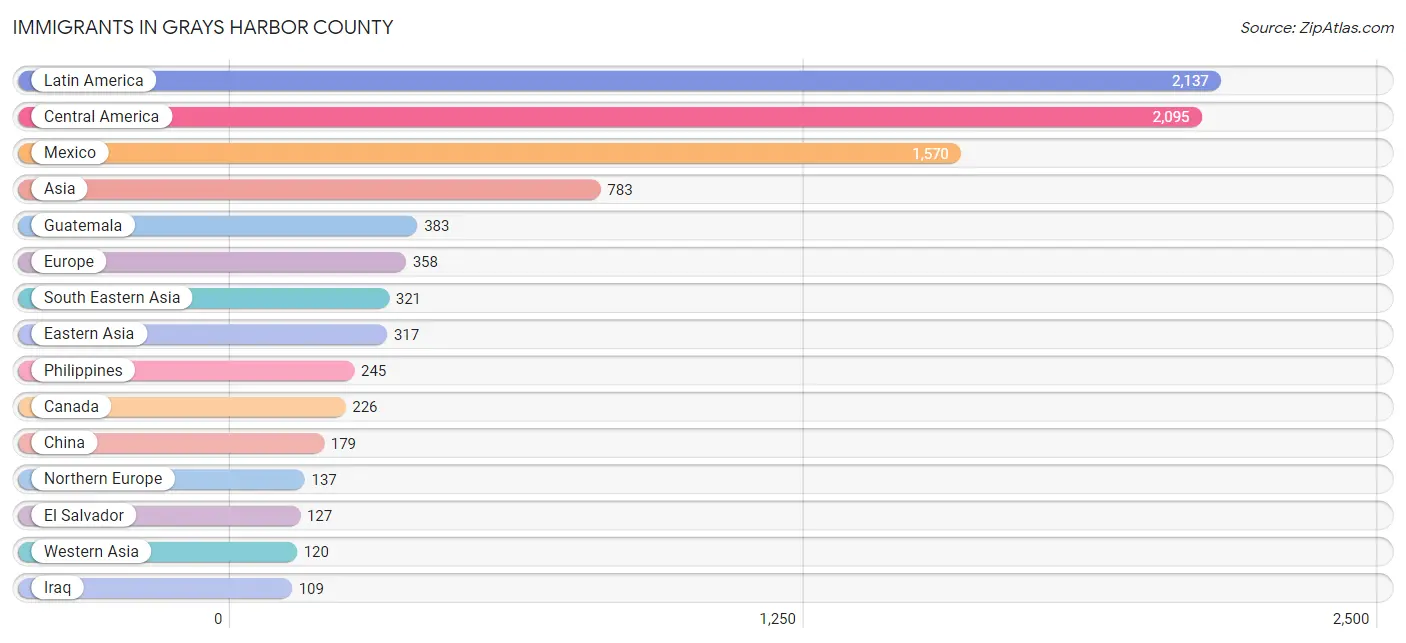
Immigrants in Grays Harbor County
The most numerous immigrant groups reported in Grays Harbor County came from Latin America (2,137 | 2.8%), Central America (2,095 | 2.8%), Mexico (1,570 | 2.1%), Asia (783 | 1.0%), and Guatemala (383 | 0.5%), together accounting for 9.2% of all Grays Harbor County residents.
| Immigration Origin | # Population | % Population |
| Africa | 63 | 0.1% |
| Asia | 783 | 1.0% |
| Australia | 14 | 0.0% |
| Cambodia | 7 | 0.0% |
| Canada | 226 | 0.3% |
| Central America | 2,095 | 2.8% |
| China | 179 | 0.2% |
| Colombia | 36 | 0.1% |
| Croatia | 8 | 0.0% |
| Czechoslovakia | 17 | 0.0% |
| Eastern Africa | 57 | 0.1% |
| Eastern Asia | 317 | 0.4% |
| Eastern Europe | 97 | 0.1% |
| El Salvador | 127 | 0.2% |
| England | 77 | 0.1% |
| Ethiopia | 55 | 0.1% |
| Europe | 358 | 0.5% |
| Germany | 105 | 0.1% |
| Guatemala | 383 | 0.5% |
| Hungary | 11 | 0.0% |
| India | 25 | 0.0% |
| Indonesia | 12 | 0.0% |
| Iraq | 109 | 0.1% |
| Israel | 7 | 0.0% |
| Italy | 13 | 0.0% |
| Japan | 66 | 0.1% |
| Korea | 72 | 0.1% |
| Laos | 19 | 0.0% |
| Latin America | 2,137 | 2.8% |
| Mexico | 1,570 | 2.1% |
| Micronesia | 7 | 0.0% |
| Netherlands | 4 | 0.0% |
| Nicaragua | 9 | 0.0% |
| Northern Africa | 6 | 0.0% |
| Northern Europe | 137 | 0.2% |
| Norway | 5 | 0.0% |
| Oceania | 24 | 0.0% |
| Panama | 6 | 0.0% |
| Peru | 6 | 0.0% |
| Philippines | 245 | 0.3% |
| Poland | 6 | 0.0% |
| Romania | 26 | 0.0% |
| Russia | 12 | 0.0% |
| Serbia | 17 | 0.0% |
| South America | 42 | 0.1% |
| South Central Asia | 25 | 0.0% |
| South Eastern Asia | 321 | 0.4% |
| Southern Europe | 15 | 0.0% |
| Spain | 2 | 0.0% |
| Sudan | 6 | 0.0% |
| Syria | 4 | 0.0% |
| Thailand | 33 | 0.0% |
| Vietnam | 5 | 0.0% |
| Western Asia | 120 | 0.2% |
| Western Europe | 109 | 0.1% |
| Zimbabwe | 2 | 0.0% | View All 56 Rows |
Sex and Age in Grays Harbor County
Sex and Age in Grays Harbor County
The most populous age groups in Grays Harbor County are 60 to 64 Years (3,159 | 8.1%) for men and 60 to 64 Years (3,332 | 9.1%) for women.
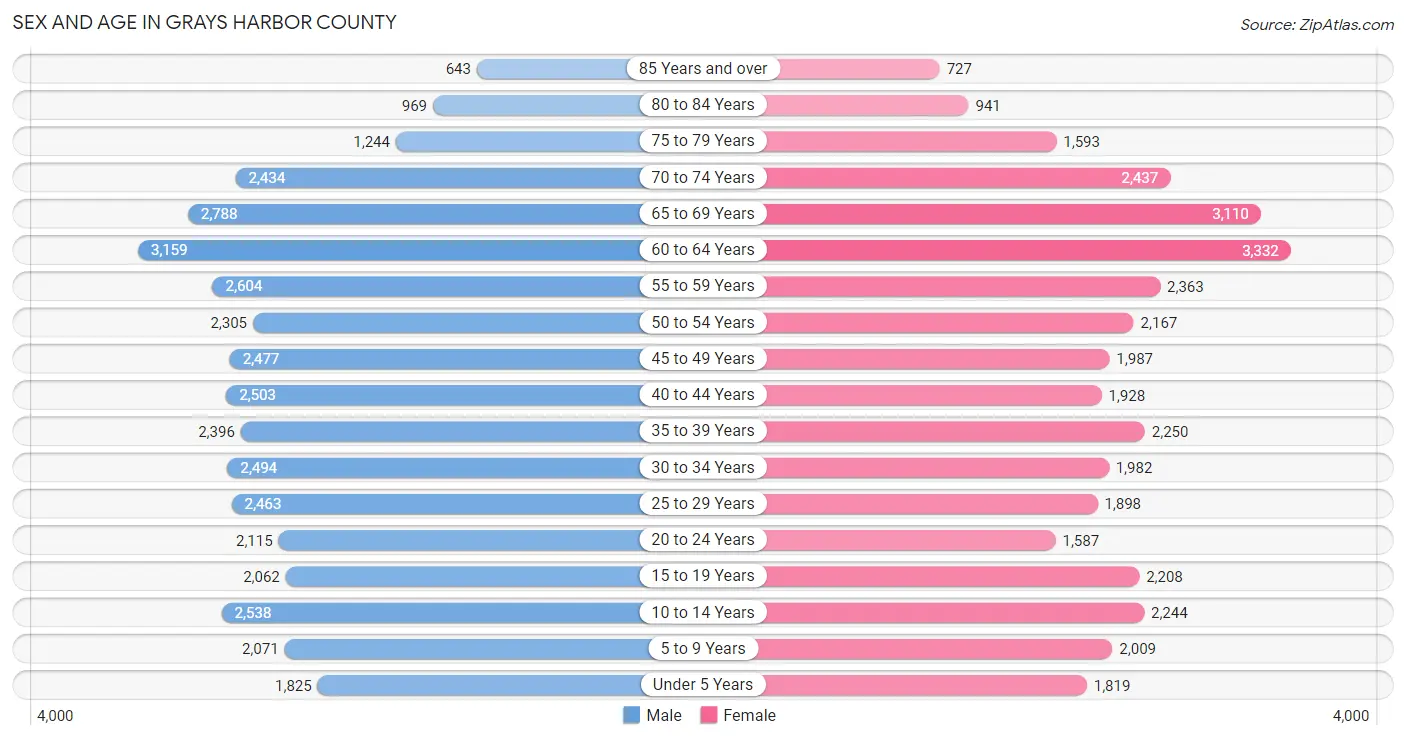
| Age Bracket | Male | Female |
| Under 5 Years | 1,825 (4.7%) | 1,819 (5.0%) |
| 5 to 9 Years | 2,071 (5.3%) | 2,009 (5.5%) |
| 10 to 14 Years | 2,538 (6.5%) | 2,244 (6.1%) |
| 15 to 19 Years | 2,062 (5.3%) | 2,208 (6.0%) |
| 20 to 24 Years | 2,115 (5.4%) | 1,587 (4.3%) |
| 25 to 29 Years | 2,463 (6.3%) | 1,898 (5.2%) |
| 30 to 34 Years | 2,494 (6.4%) | 1,982 (5.4%) |
| 35 to 39 Years | 2,396 (6.1%) | 2,250 (6.1%) |
| 40 to 44 Years | 2,503 (6.4%) | 1,928 (5.3%) |
| 45 to 49 Years | 2,477 (6.3%) | 1,987 (5.4%) |
| 50 to 54 Years | 2,305 (5.9%) | 2,167 (5.9%) |
| 55 to 59 Years | 2,604 (6.7%) | 2,363 (6.5%) |
| 60 to 64 Years | 3,159 (8.1%) | 3,332 (9.1%) |
| 65 to 69 Years | 2,788 (7.1%) | 3,110 (8.5%) |
| 70 to 74 Years | 2,434 (6.2%) | 2,437 (6.7%) |
| 75 to 79 Years | 1,244 (3.2%) | 1,593 (4.3%) |
| 80 to 84 Years | 969 (2.5%) | 941 (2.6%) |
| 85 Years and over | 643 (1.6%) | 727 (2.0%) |
| Total | 39,090 (100.0%) | 36,582 (100.0%) |
Families and Households in Grays Harbor County
Median Family Size in Grays Harbor County
The median family size in Grays Harbor County is 3.06 persons per family, with single female/mother families (3,064 | 16.7%) accounting for the largest median family size of 3.29 persons per family. On the other hand, married-couple families (13,736 | 74.9%) represent the smallest median family size with 3.00 persons per family.
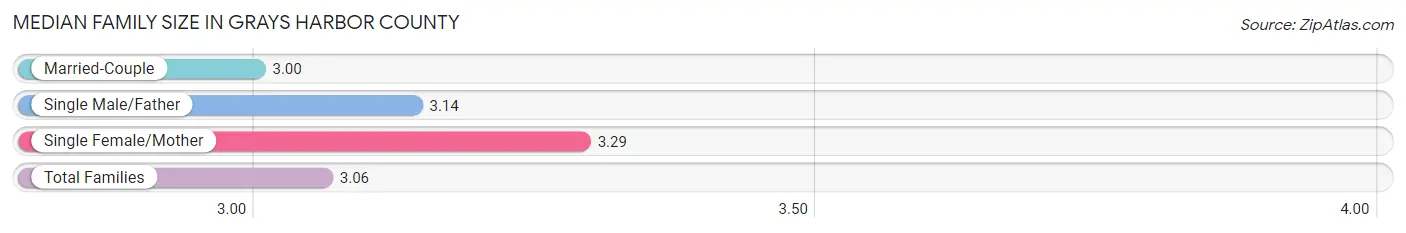
| Family Type | # Families | Family Size |
| Married-Couple | 13,736 (74.9%) | 3.00 |
| Single Male/Father | 1,550 (8.5%) | 3.14 |
| Single Female/Mother | 3,064 (16.7%) | 3.29 |
| Total Families | 18,350 (100.0%) | 3.06 |
Median Household Size in Grays Harbor County
The median household size in Grays Harbor County is 2.46 persons per household, with single male/father households (1,550 | 5.2%) accounting for the largest median household size of 3.77 persons per household. non-family households (11,192 | 37.9%) represent the smallest median household size with 1.22 persons per household.
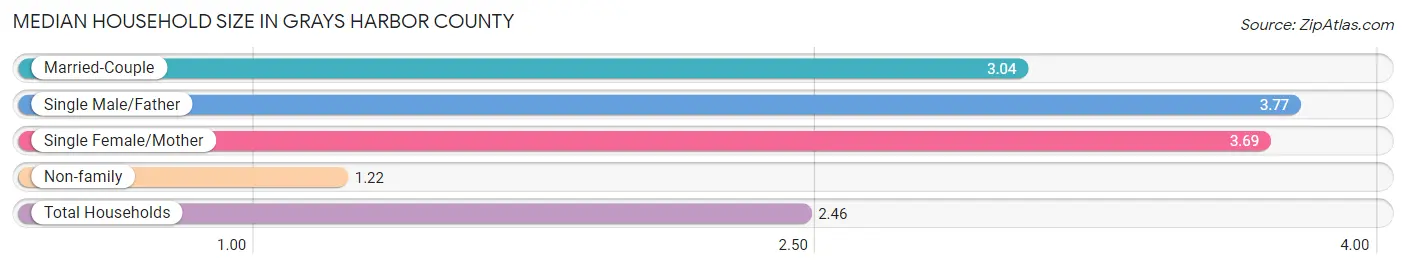
| Household Type | # Households | Household Size |
| Married-Couple | 13,736 (46.5%) | 3.04 |
| Single Male/Father | 1,550 (5.2%) | 3.77 |
| Single Female/Mother | 3,064 (10.4%) | 3.69 |
| Non-family | 11,192 (37.9%) | 1.22 |
| Total Households | 29,542 (100.0%) | 2.46 |
Household Size by Marriage Status in Grays Harbor County
Out of a total of 29,542 households in Grays Harbor County, 18,350 (62.1%) are family households, while 11,192 (37.9%) are nonfamily households. The most numerous type of family households are 2-person households, comprising 9,497, and the most common type of nonfamily households are 1-person households, comprising 9,278.
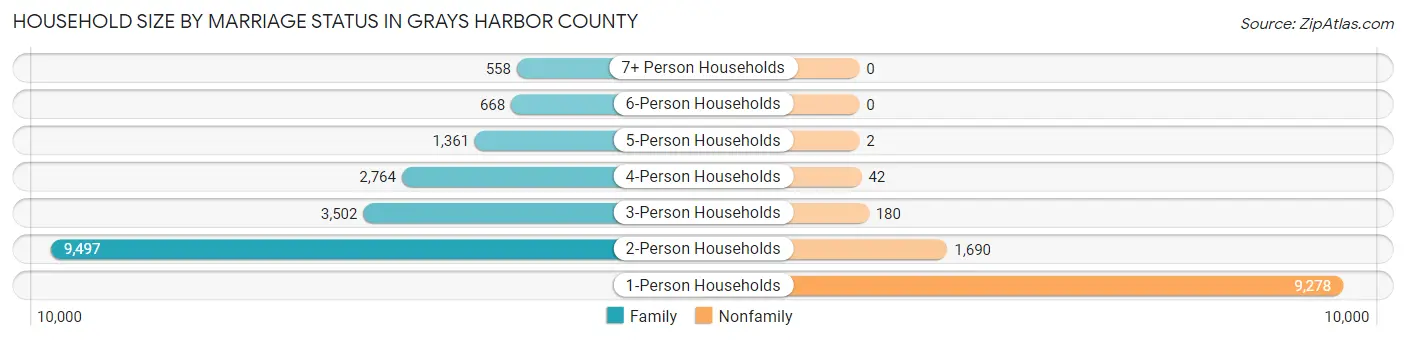
| Household Size | Family Households | Nonfamily Households |
| 1-Person Households | - | 9,278 (31.4%) |
| 2-Person Households | 9,497 (32.2%) | 1,690 (5.7%) |
| 3-Person Households | 3,502 (11.8%) | 180 (0.6%) |
| 4-Person Households | 2,764 (9.4%) | 42 (0.1%) |
| 5-Person Households | 1,361 (4.6%) | 2 (0.0%) |
| 6-Person Households | 668 (2.3%) | 0 (0.0%) |
| 7+ Person Households | 558 (1.9%) | 0 (0.0%) |
| Total | 18,350 (62.1%) | 11,192 (37.9%) |
Female Fertility in Grays Harbor County
Fertility by Age in Grays Harbor County
Average fertility rate in Grays Harbor County is 63.0 births per 1,000 women. Women in the age bracket of 20 to 34 years have the highest fertility rate with 135.0 births per 1,000 women. Women in the age bracket of 20 to 34 years acount for 82.4% of all women with births.
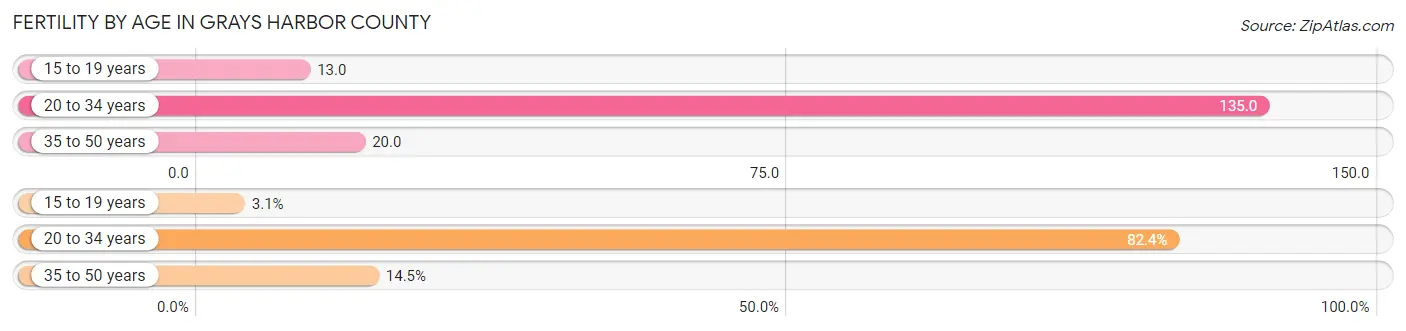
| Age Bracket | Women with Births | Births / 1,000 Women |
| 15 to 19 years | 28 (3.1%) | 13.0 |
| 20 to 34 years | 739 (82.4%) | 135.0 |
| 35 to 50 years | 130 (14.5%) | 20.0 |
| Total | 897 (100.0%) | 63.0 |
Fertility by Age by Marriage Status in Grays Harbor County
43.9% of women with births (897) in Grays Harbor County are married. The highest percentage of unmarried women with births falls into 15 to 19 years age bracket with 100.0% of them unmarried at the time of birth, while the lowest percentage of unmarried women with births belong to 35 to 50 years age bracket with 14.6% of them unmarried.
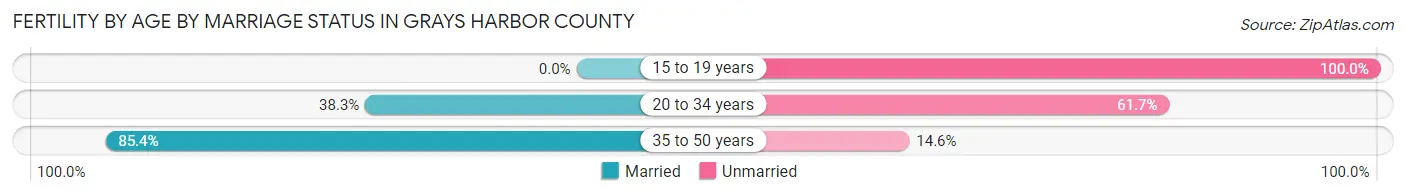
| Age Bracket | Married | Unmarried |
| 15 to 19 years | 0 (0.0%) | 28 (100.0%) |
| 20 to 34 years | 283 (38.3%) | 456 (61.7%) |
| 35 to 50 years | 111 (85.4%) | 19 (14.6%) |
| Total | 394 (43.9%) | 503 (56.1%) |
Fertility by Education in Grays Harbor County
Average fertility rate in Grays Harbor County is 63.0 births per 1,000 women. Women with the education attainment of college or associate's degree have the highest fertility rate of 79.0 births per 1,000 women, while women with the education attainment of bachelor's degree have the lowest fertility at 51.0 births per 1,000 women. Women with the education attainment of college or associate's degree represent 41.1% of all women with births.
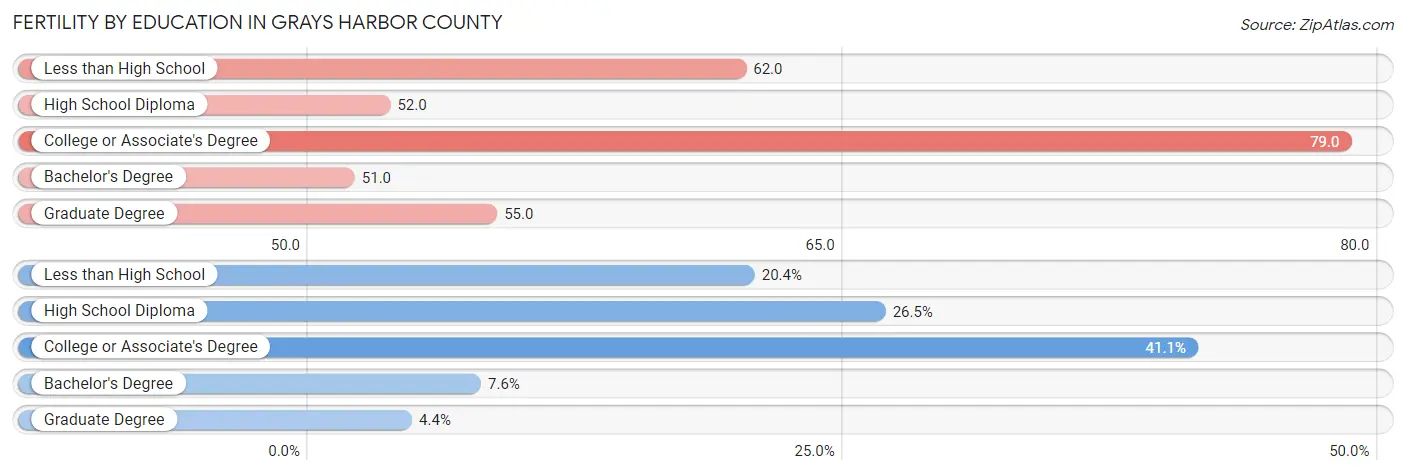
| Educational Attainment | Women with Births | Births / 1,000 Women |
| Less than High School | 183 (20.4%) | 62.0 |
| High School Diploma | 238 (26.5%) | 52.0 |
| College or Associate's Degree | 369 (41.1%) | 79.0 |
| Bachelor's Degree | 68 (7.6%) | 51.0 |
| Graduate Degree | 39 (4.3%) | 55.0 |
| Total | 897 (100.0%) | 63.0 |
Fertility by Education by Marriage Status in Grays Harbor County
56.1% of women with births in Grays Harbor County are unmarried. Women with the educational attainment of bachelor's degree are most likely to be married with 100.0% of them married at childbirth, while women with the educational attainment of college or associate's degree are least likely to be married with 82.1% of them unmarried at childbirth.
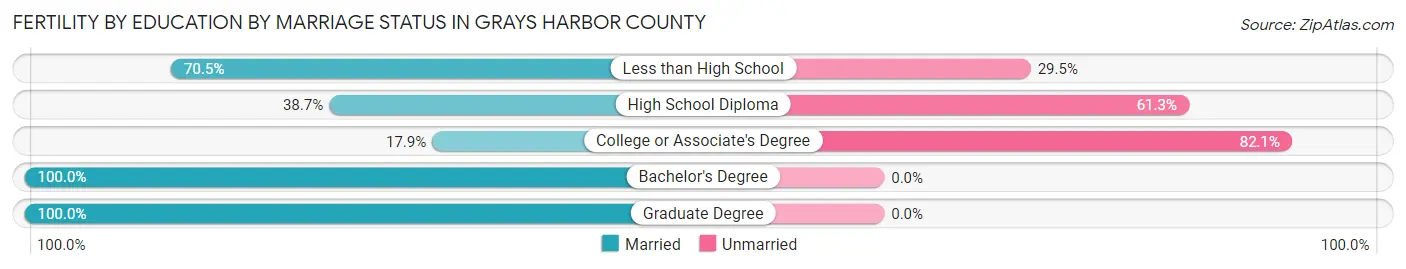
| Educational Attainment | Married | Unmarried |
| Less than High School | 129 (70.5%) | 54 (29.5%) |
| High School Diploma | 92 (38.7%) | 146 (61.3%) |
| College or Associate's Degree | 66 (17.9%) | 303 (82.1%) |
| Bachelor's Degree | 68 (100.0%) | 0 (0.0%) |
| Graduate Degree | 39 (100.0%) | 0 (0.0%) |
| Total | 394 (43.9%) | 503 (56.1%) |
Income in Grays Harbor County
Income Overview in Grays Harbor County
Per Capita Income in Grays Harbor County is $31,703, while median incomes of families and households are $76,153 and $59,105 respectively.
| Characteristic | Number | Measure |
| Per Capita Income | 75,672 | $31,703 |
| Median Family Income | 18,350 | $76,153 |
| Mean Family Income | 18,350 | $93,467 |
| Median Household Income | 29,542 | $59,105 |
| Mean Household Income | 29,542 | $77,581 |
| Income Deficit | 18,350 | $11,998 |
| Wage / Income Gap (%) | 75,672 | 18.77% |
| Wage / Income Gap ($) | 75,672 | 81.23¢ per $1 |
| Gini / Inequality Index | 75,672 | 0.44 |
Earnings by Sex in Grays Harbor County
Average Earnings in Grays Harbor County are $35,642, $40,194 for men and $32,651 for women, a difference of 18.8%.
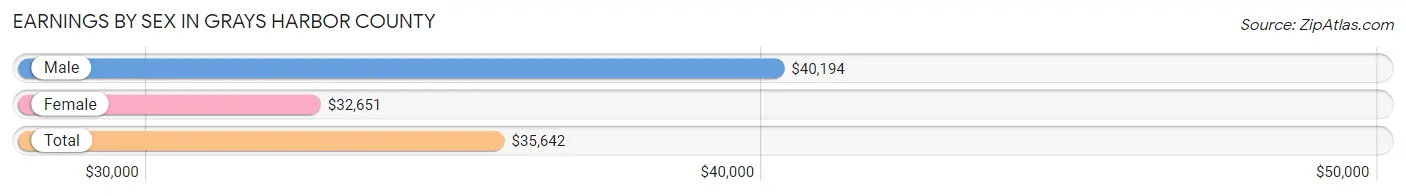
| Sex | Number | Average Earnings |
| Male | 18,712 (54.5%) | $40,194 |
| Female | 15,589 (45.5%) | $32,651 |
| Total | 34,301 (100.0%) | $35,642 |
Earnings by Sex by Income Bracket in Grays Harbor County
The most common earnings brackets in Grays Harbor County are $100,000+ for men (2,088 | 11.2%) and $25,000 to $29,999 for women (1,290 | 8.3%).
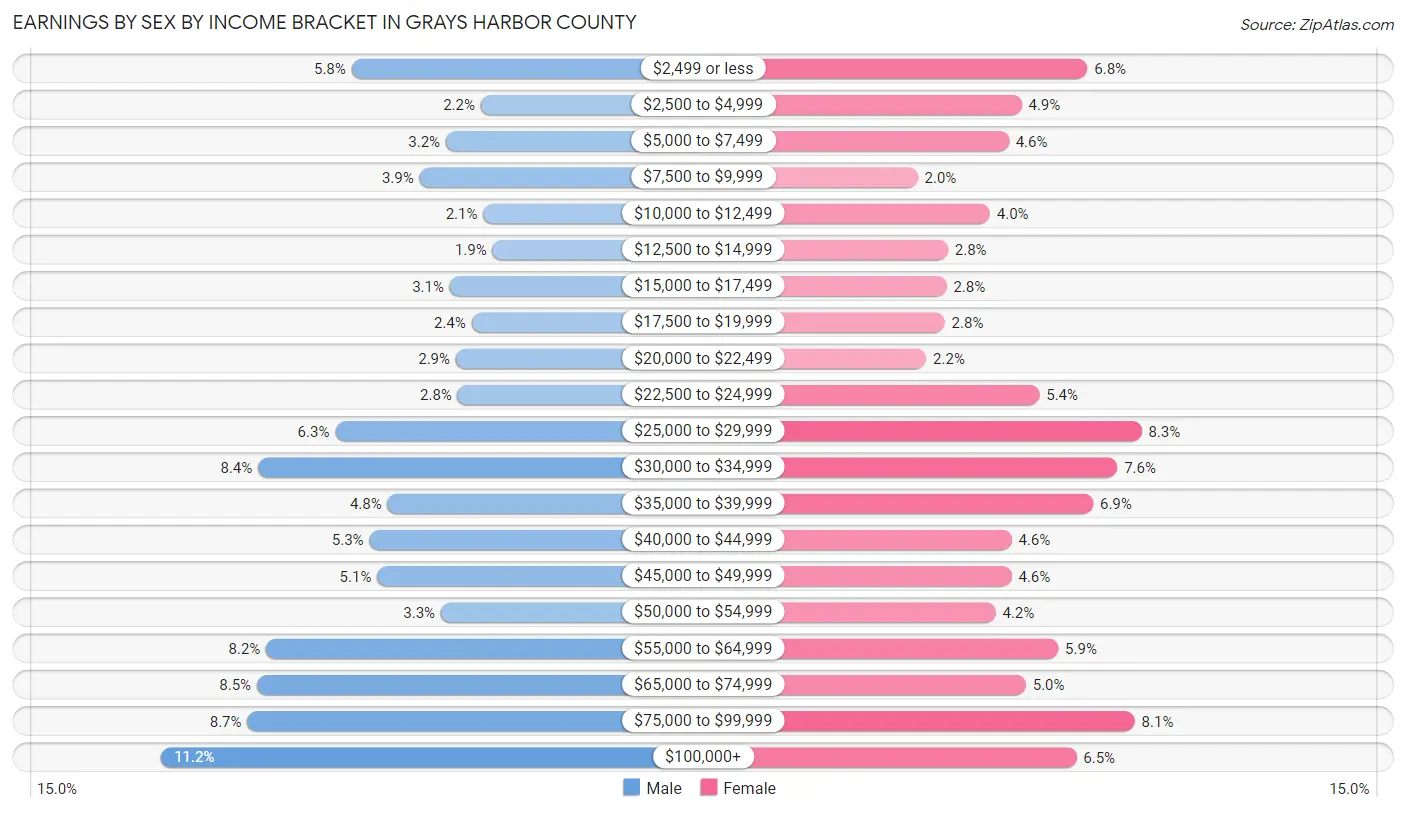
| Income | Male | Female |
| $2,499 or less | 1,087 (5.8%) | 1,054 (6.8%) |
| $2,500 to $4,999 | 407 (2.2%) | 765 (4.9%) |
| $5,000 to $7,499 | 592 (3.2%) | 710 (4.5%) |
| $7,500 to $9,999 | 730 (3.9%) | 311 (2.0%) |
| $10,000 to $12,499 | 394 (2.1%) | 627 (4.0%) |
| $12,500 to $14,999 | 347 (1.8%) | 442 (2.8%) |
| $15,000 to $17,499 | 571 (3.0%) | 437 (2.8%) |
| $17,500 to $19,999 | 456 (2.4%) | 428 (2.8%) |
| $20,000 to $22,499 | 538 (2.9%) | 348 (2.2%) |
| $22,500 to $24,999 | 529 (2.8%) | 844 (5.4%) |
| $25,000 to $29,999 | 1,174 (6.3%) | 1,290 (8.3%) |
| $30,000 to $34,999 | 1,579 (8.4%) | 1,184 (7.6%) |
| $35,000 to $39,999 | 898 (4.8%) | 1,078 (6.9%) |
| $40,000 to $44,999 | 994 (5.3%) | 721 (4.6%) |
| $45,000 to $49,999 | 953 (5.1%) | 721 (4.6%) |
| $50,000 to $54,999 | 618 (3.3%) | 652 (4.2%) |
| $55,000 to $64,999 | 1,537 (8.2%) | 926 (5.9%) |
| $65,000 to $74,999 | 1,585 (8.5%) | 784 (5.0%) |
| $75,000 to $99,999 | 1,635 (8.7%) | 1,261 (8.1%) |
| $100,000+ | 2,088 (11.2%) | 1,006 (6.5%) |
| Total | 18,712 (100.0%) | 15,589 (100.0%) |
Earnings by Sex by Educational Attainment in Grays Harbor County
Average earnings in Grays Harbor County are $44,070 for men and $35,912 for women, a difference of 18.5%. Men with an educational attainment of graduate degree enjoy the highest average annual earnings of $71,250, while those with less than high school education earn the least with $33,884. Women with an educational attainment of graduate degree earn the most with the average annual earnings of $81,000, while those with less than high school education have the smallest earnings of $24,676.
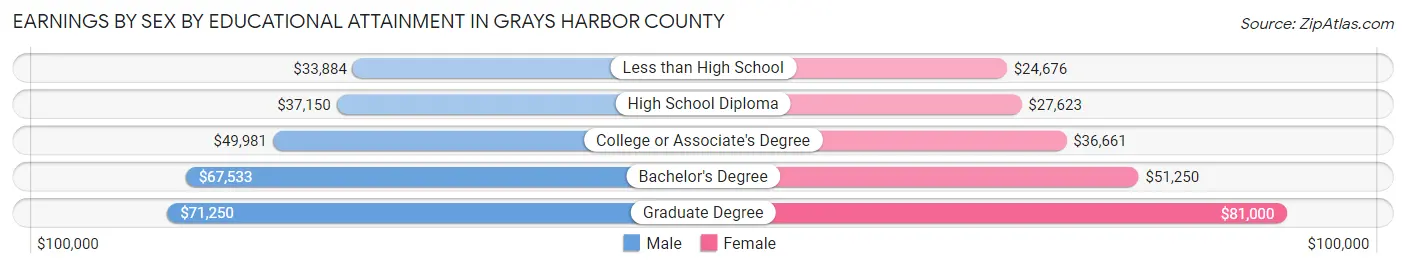
| Educational Attainment | Male Income | Female Income |
| Less than High School | $33,884 | $24,676 |
| High School Diploma | $37,150 | $27,623 |
| College or Associate's Degree | $49,981 | $36,661 |
| Bachelor's Degree | $67,533 | $51,250 |
| Graduate Degree | $71,250 | $81,000 |
| Total | $44,070 | $35,912 |
Family Income in Grays Harbor County
Family Income Brackets in Grays Harbor County
According to the Grays Harbor County family income data, there are 3,597 families falling into the $50,000 to $74,999 income range, which is the most common income bracket and makes up 19.6% of all families. Conversely, the $10,000 to $14,999 income bracket is the least frequent group with only 459 families (2.5%) belonging to this category.
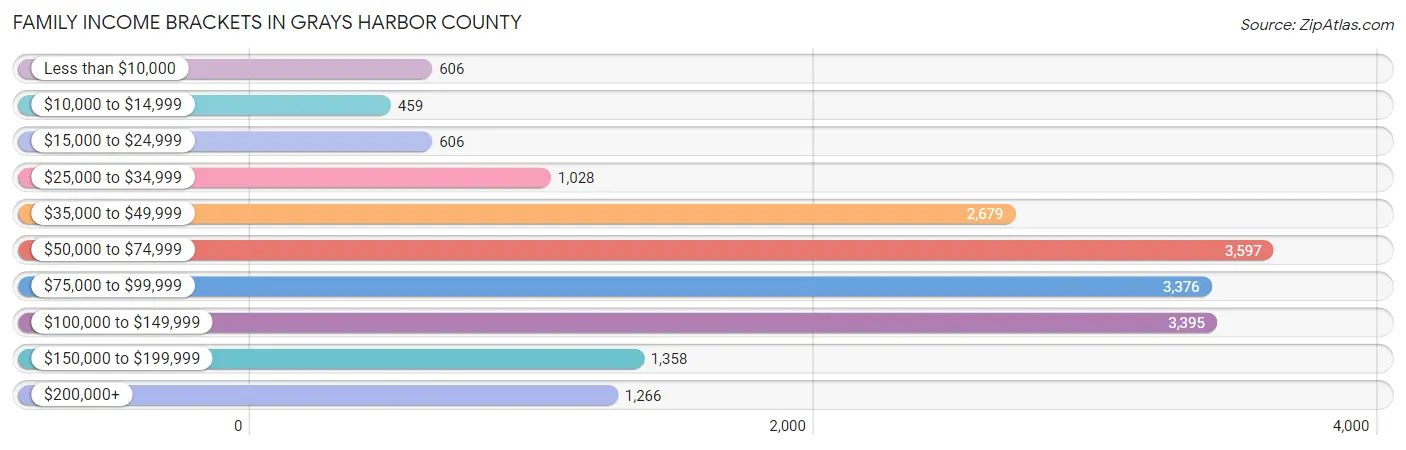
| Income Bracket | # Families | % Families |
| Less than $10,000 | 606 | 3.3% |
| $10,000 to $14,999 | 459 | 2.5% |
| $15,000 to $24,999 | 606 | 3.3% |
| $25,000 to $34,999 | 1,028 | 5.6% |
| $35,000 to $49,999 | 2,679 | 14.6% |
| $50,000 to $74,999 | 3,597 | 19.6% |
| $75,000 to $99,999 | 3,376 | 18.4% |
| $100,000 to $149,999 | 3,395 | 18.5% |
| $150,000 to $199,999 | 1,358 | 7.4% |
| $200,000+ | 1,266 | 6.9% |
Family Income by Famaliy Size in Grays Harbor County
6-person families (627 | 3.4%) account for the highest median family income in Grays Harbor County with $88,068 per family, while 2-person families (10,185 | 55.5%) have the highest median income of $35,701 per family member.
| Income Bracket | # Families | Median Income |
| 2-Person Families | 10,185 (55.5%) | $71,402 |
| 3-Person Families | 3,589 (19.6%) | $80,876 |
| 4-Person Families | 2,427 (13.2%) | $85,927 |
| 5-Person Families | 1,117 (6.1%) | $84,509 |
| 6-Person Families | 627 (3.4%) | $88,068 |
| 7+ Person Families | 405 (2.2%) | $0 |
| Total | 18,350 (100.0%) | $76,153 |
Family Income by Number of Earners in Grays Harbor County
The median family income in Grays Harbor County is $76,153, with families comprising 3+ earners (1,404) having the highest median family income of $128,036, while families with no earners (4,587) have the lowest median family income of $50,507, accounting for 7.6% and 25.0% of families, respectively.
| Number of Earners | # Families | Median Income |
| No Earners | 4,587 (25.0%) | $50,507 |
| 1 Earner | 6,251 (34.1%) | $59,948 |
| 2 Earners | 6,108 (33.3%) | $105,877 |
| 3+ Earners | 1,404 (7.6%) | $128,036 |
| Total | 18,350 (100.0%) | $76,153 |
Household Income in Grays Harbor County
Household Income Brackets in Grays Harbor County
With 5,643 households falling in the category, the $50,000 to $74,999 income range is the most frequent in Grays Harbor County, accounting for 19.1% of all households. In contrast, only 1,448 households (4.9%) fall into the $200,000+ income bracket, making it the least populous group.
| Income Bracket | # Households | % Households |
| Less than $10,000 | 1,595 | 5.4% |
| $10,000 to $14,999 | 1,507 | 5.1% |
| $15,000 to $24,999 | 2,334 | 7.9% |
| $25,000 to $34,999 | 2,570 | 8.7% |
| $35,000 to $49,999 | 4,402 | 14.9% |
| $50,000 to $74,999 | 5,643 | 19.1% |
| $75,000 to $99,999 | 4,195 | 14.2% |
| $100,000 to $149,999 | 4,254 | 14.4% |
| $150,000 to $199,999 | 1,625 | 5.5% |
| $200,000+ | 1,448 | 4.9% |
Household Income by Householder Age in Grays Harbor County
The median household income in Grays Harbor County is $59,105, with the highest median household income of $69,870 found in the 25 to 44 years age bracket for the primary householder. A total of 7,404 households (25.1%) fall into this category. Meanwhile, the 15 to 24 years age bracket for the primary householder has the lowest median household income of $45,985, with 832 households (2.8%) in this group.
| Income Bracket | # Households | Median Income |
| 15 to 24 Years | 832 (2.8%) | $45,985 |
| 25 to 44 Years | 7,404 (25.1%) | $69,870 |
| 45 to 64 Years | 10,890 (36.9%) | $68,667 |
| 65+ Years | 10,416 (35.3%) | $46,408 |
| Total | 29,542 (100.0%) | $59,105 |
Poverty in Grays Harbor County
Income Below Poverty by Sex and Age in Grays Harbor County
With 14.1% poverty level for males and 15.7% for females among the residents of Grays Harbor County, 16 and 17 year old males and 15 year old females are the most vulnerable to poverty, with 305 males (38.5%) and 166 females (43.7%) in their respective age groups living below the poverty level.
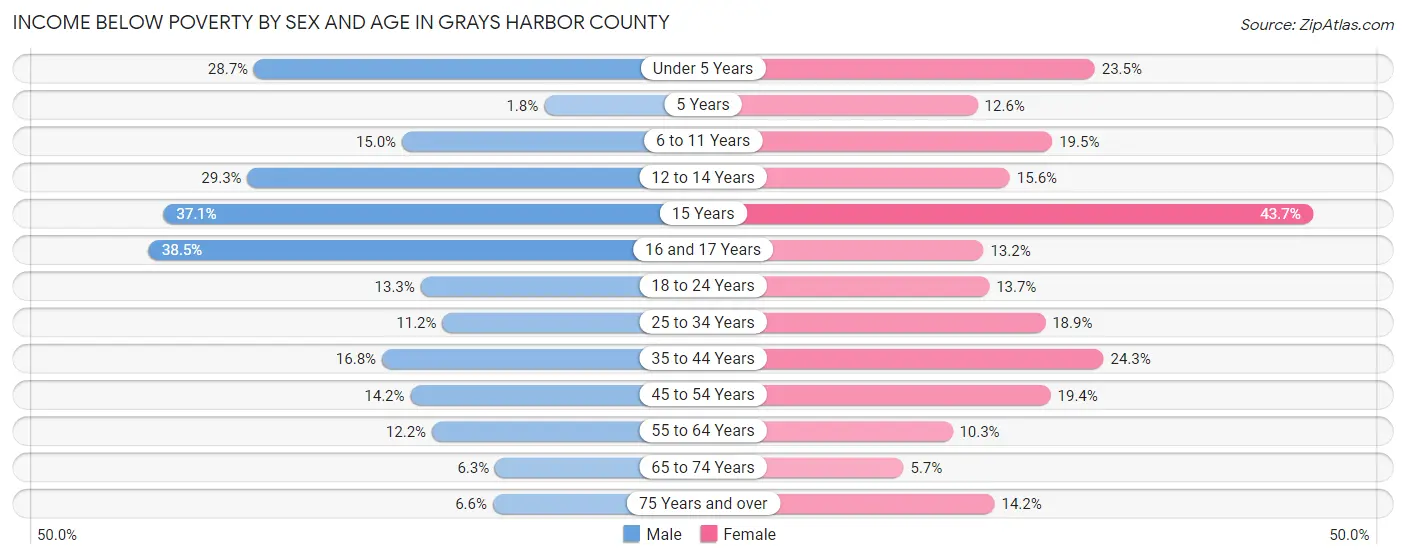
| Age Bracket | Male | Female |
| Under 5 Years | 514 (28.7%) | 422 (23.5%) |
| 5 Years | 5 (1.8%) | 29 (12.6%) |
| 6 to 11 Years | 434 (15.0%) | 520 (19.5%) |
| 12 to 14 Years | 360 (29.3%) | 197 (15.6%) |
| 15 Years | 193 (37.1%) | 166 (43.7%) |
| 16 and 17 Years | 305 (38.5%) | 129 (13.2%) |
| 18 to 24 Years | 363 (13.3%) | 333 (13.7%) |
| 25 to 34 Years | 500 (11.2%) | 717 (18.9%) |
| 35 to 44 Years | 684 (16.8%) | 1,015 (24.3%) |
| 45 to 54 Years | 604 (14.2%) | 805 (19.4%) |
| 55 to 64 Years | 661 (12.2%) | 583 (10.3%) |
| 65 to 74 Years | 326 (6.3%) | 315 (5.7%) |
| 75 Years and over | 181 (6.6%) | 445 (14.2%) |
| Total | 5,130 (14.1%) | 5,676 (15.7%) |
Income Above Poverty by Sex and Age in Grays Harbor County
According to the poverty statistics in Grays Harbor County, males aged 5 years and females aged 65 to 74 years are the age groups that are most secure financially, with 98.2% of males and 94.3% of females in these age groups living above the poverty line.
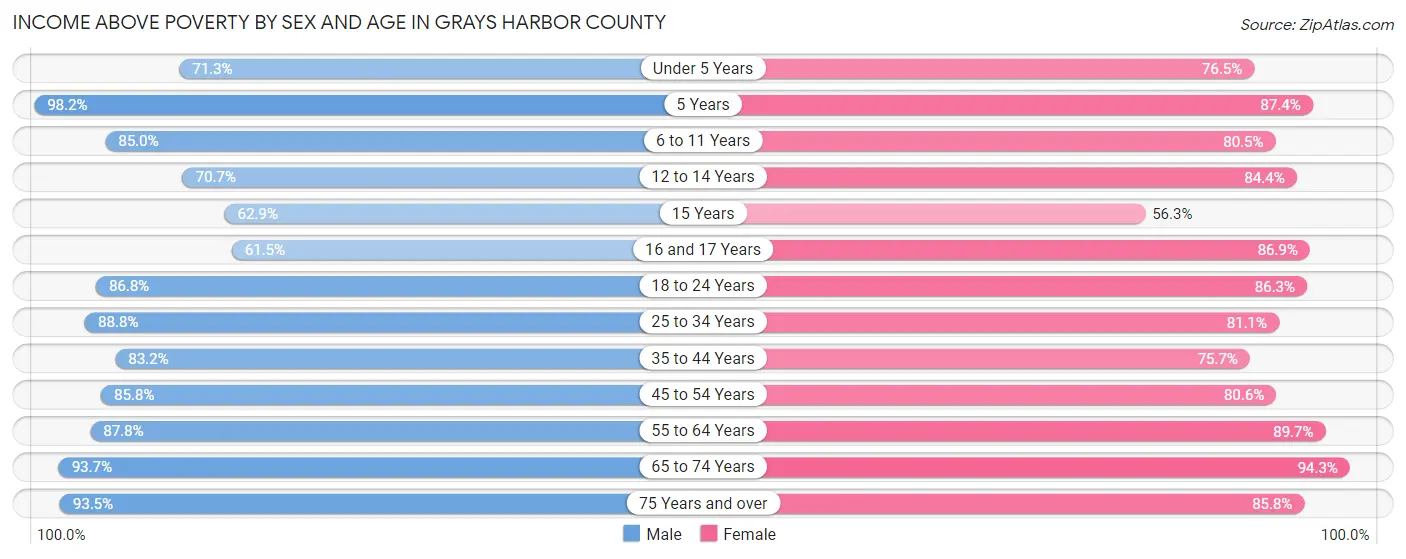
| Age Bracket | Male | Female |
| Under 5 Years | 1,276 (71.3%) | 1,375 (76.5%) |
| 5 Years | 275 (98.2%) | 201 (87.4%) |
| 6 to 11 Years | 2,464 (85.0%) | 2,143 (80.5%) |
| 12 to 14 Years | 868 (70.7%) | 1,066 (84.4%) |
| 15 Years | 327 (62.9%) | 214 (56.3%) |
| 16 and 17 Years | 488 (61.5%) | 852 (86.9%) |
| 18 to 24 Years | 2,377 (86.8%) | 2,101 (86.3%) |
| 25 to 34 Years | 3,952 (88.8%) | 3,080 (81.1%) |
| 35 to 44 Years | 3,377 (83.2%) | 3,163 (75.7%) |
| 45 to 54 Years | 3,649 (85.8%) | 3,349 (80.6%) |
| 55 to 64 Years | 4,759 (87.8%) | 5,095 (89.7%) |
| 65 to 74 Years | 4,818 (93.7%) | 5,180 (94.3%) |
| 75 Years and over | 2,584 (93.4%) | 2,693 (85.8%) |
| Total | 31,214 (85.9%) | 30,512 (84.3%) |
Income Below Poverty Among Married-Couple Families in Grays Harbor County
The poverty statistics for married-couple families in Grays Harbor County show that 4.7% or 650 of the total 13,736 families live below the poverty line. Families with 5 or more children have the highest poverty rate of 71.7%, comprising of 137 families. On the other hand, families with no children have the lowest poverty rate of 3.1%, which includes 298 families.
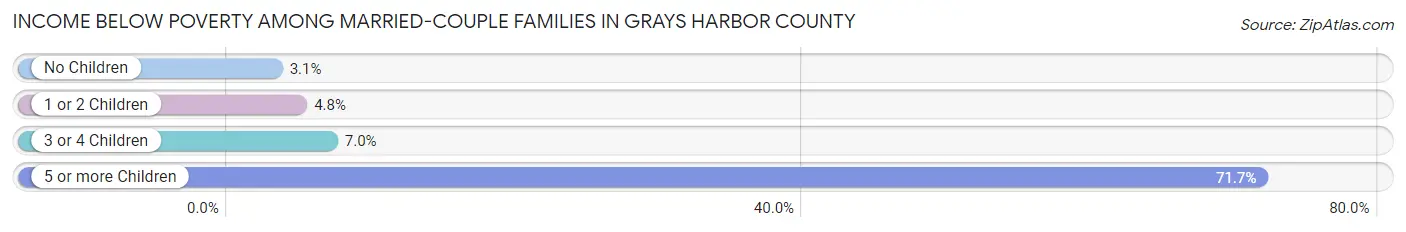
| Children | Above Poverty | Below Poverty |
| No Children | 9,291 (96.9%) | 298 (3.1%) |
| 1 or 2 Children | 2,683 (95.2%) | 136 (4.8%) |
| 3 or 4 Children | 1,058 (93.0%) | 79 (7.0%) |
| 5 or more Children | 54 (28.3%) | 137 (71.7%) |
| Total | 13,086 (95.3%) | 650 (4.7%) |
Income Below Poverty Among Single-Parent Households in Grays Harbor County
According to the poverty data in Grays Harbor County, 12.2% or 189 single-father households and 26.8% or 822 single-mother households are living below the poverty line. Among single-father households, those with 5 or more children have the highest poverty rate, with 19 households (73.1%) experiencing poverty. Likewise, among single-mother households, those with 5 or more children have the highest poverty rate, with 20 households (87.0%) falling below the poverty line.
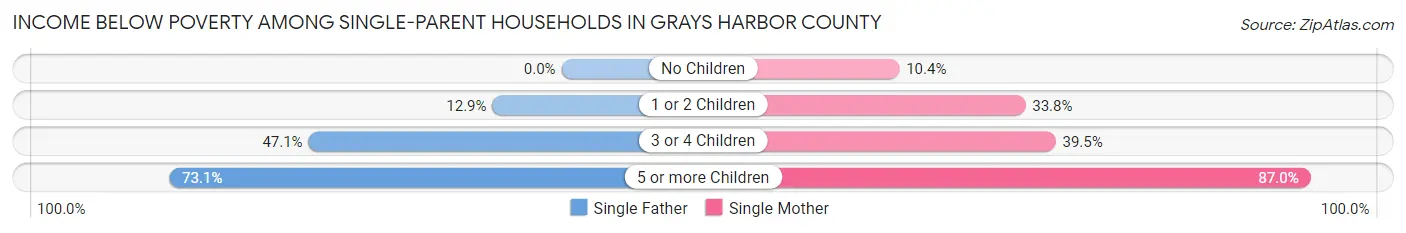
| Children | Single Father | Single Mother |
| No Children | 0 (0.0%) | 112 (10.3%) |
| 1 or 2 Children | 96 (12.9%) | 499 (33.8%) |
| 3 or 4 Children | 74 (47.1%) | 191 (39.5%) |
| 5 or more Children | 19 (73.1%) | 20 (87.0%) |
| Total | 189 (12.2%) | 822 (26.8%) |
Income Below Poverty Among Married-Couple vs Single-Parent Households in Grays Harbor County
The poverty data for Grays Harbor County shows that 650 of the married-couple family households (4.7%) and 1,011 of the single-parent households (21.9%) are living below the poverty level. Within the married-couple family households, those with 5 or more children have the highest poverty rate, with 137 households (71.7%) falling below the poverty line. Among the single-parent households, those with 5 or more children have the highest poverty rate, with 39 household (79.6%) living below poverty.
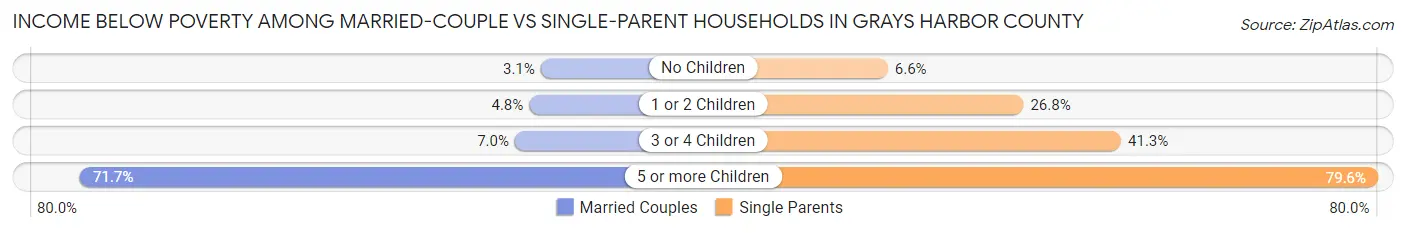
| Children | Married-Couple Families | Single-Parent Households |
| No Children | 298 (3.1%) | 112 (6.6%) |
| 1 or 2 Children | 136 (4.8%) | 595 (26.8%) |
| 3 or 4 Children | 79 (7.0%) | 265 (41.3%) |
| 5 or more Children | 137 (71.7%) | 39 (79.6%) |
| Total | 650 (4.7%) | 1,011 (21.9%) |
Employment Characteristics in Grays Harbor County
Employment by Class of Employer in Grays Harbor County
Among the 28,624 employed individuals in Grays Harbor County, private company employees (16,373 | 57.2%), local government employees (3,370 | 11.8%), and state government employees (2,962 | 10.3%) make up the most common classes of employment.
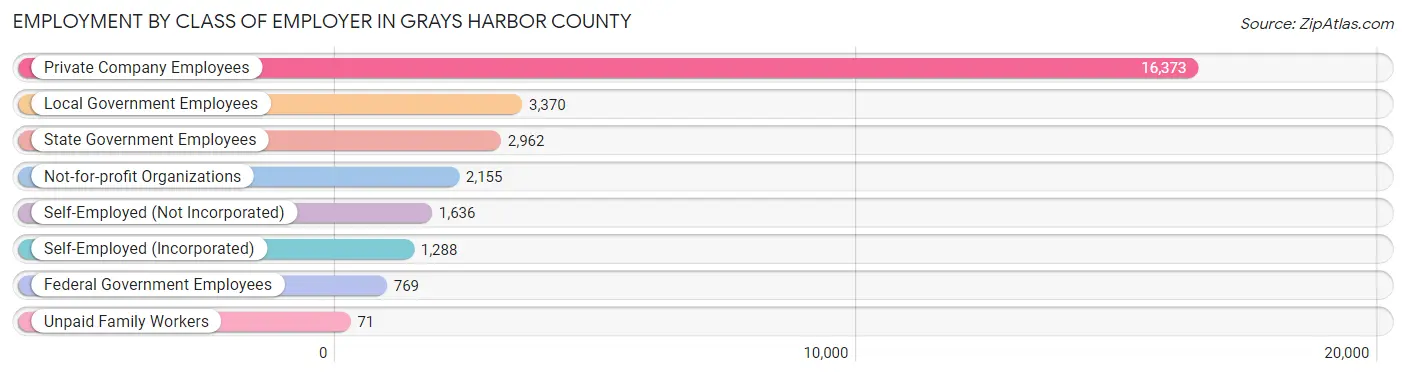
| Employer Class | # Employees | % Employees |
| Private Company Employees | 16,373 | 57.2% |
| Self-Employed (Incorporated) | 1,288 | 4.5% |
| Self-Employed (Not Incorporated) | 1,636 | 5.7% |
| Not-for-profit Organizations | 2,155 | 7.5% |
| Local Government Employees | 3,370 | 11.8% |
| State Government Employees | 2,962 | 10.3% |
| Federal Government Employees | 769 | 2.7% |
| Unpaid Family Workers | 71 | 0.3% |
| Total | 28,624 | 100.0% |
Employment Status by Age in Grays Harbor County
According to the labor force statistics for Grays Harbor County, out of the total population over 16 years of age (62,265), 50.4% or 31,382 individuals are in the labor force, with 6.4% or 2,008 of them unemployed. The age group with the highest labor force participation rate is 20 to 24 years, with 77.3% or 2,862 individuals in the labor force. Within the labor force, the 16 to 19 years age range has the highest percentage of unemployed individuals, with 18.0% or 179 of them being unemployed.
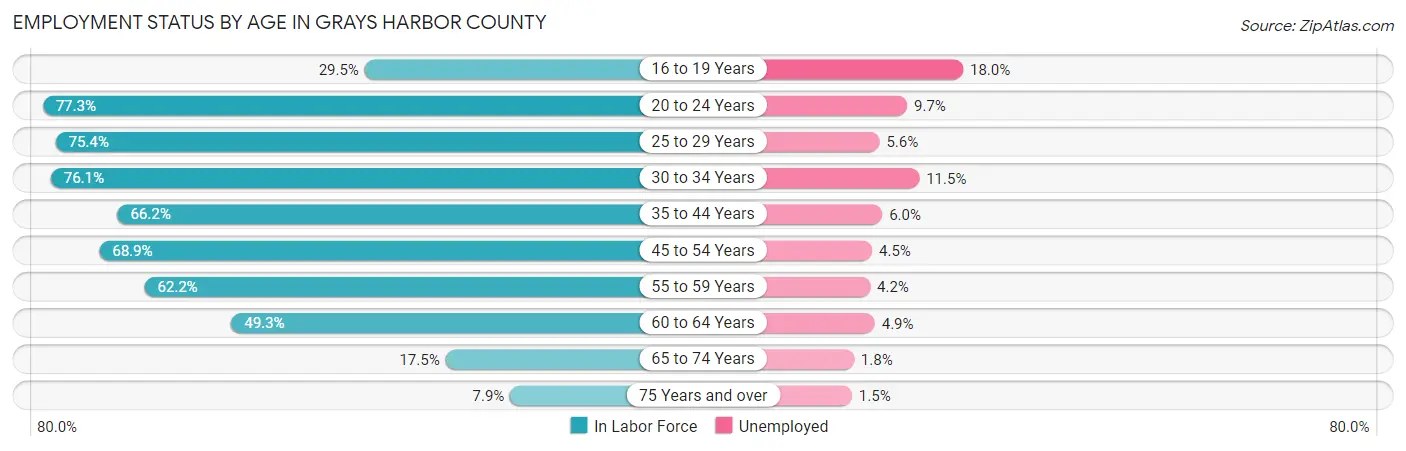
| Age Bracket | In Labor Force | Unemployed |
| 16 to 19 Years | 994 (29.5%) | 179 (18.0%) |
| 20 to 24 Years | 2,862 (77.3%) | 278 (9.7%) |
| 25 to 29 Years | 3,288 (75.4%) | 184 (5.6%) |
| 30 to 34 Years | 3,406 (76.1%) | 392 (11.5%) |
| 35 to 44 Years | 6,009 (66.2%) | 361 (6.0%) |
| 45 to 54 Years | 6,157 (68.9%) | 277 (4.5%) |
| 55 to 59 Years | 3,089 (62.2%) | 130 (4.2%) |
| 60 to 64 Years | 3,200 (49.3%) | 157 (4.9%) |
| 65 to 74 Years | 1,885 (17.5%) | 34 (1.8%) |
| 75 Years and over | 483 (7.9%) | 7 (1.5%) |
| Total | 31,382 (50.4%) | 2,008 (6.4%) |
Employment Status by Educational Attainment in Grays Harbor County
According to labor force statistics for Grays Harbor County, 65.6% of individuals (25,130) out of the total population between 25 and 64 years of age (38,308) are in the labor force, with 6.0% or 1,508 of them being unemployed. The group with the highest labor force participation rate are those with the educational attainment of bachelor's degree or higher, with 79.6% or 4,887 individuals in the labor force. Within the labor force, individuals with less than high school education have the highest percentage of unemployment, with 11.7% or 287 of them being unemployed.
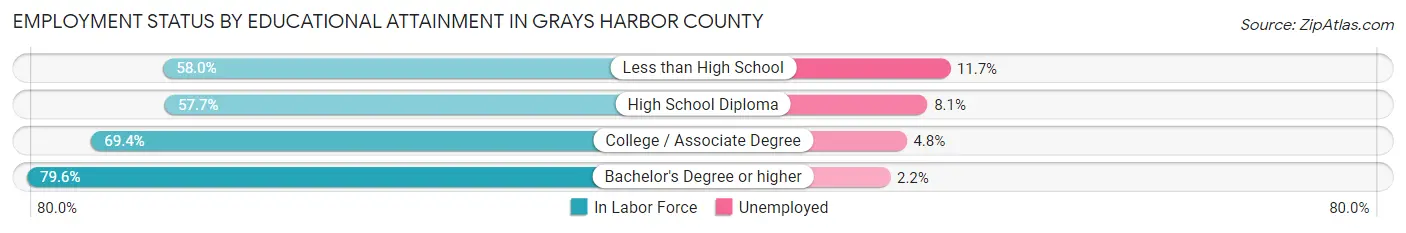
| Educational Attainment | In Labor Force | Unemployed |
| Less than High School | 2,453 (58.0%) | 495 (11.7%) |
| High School Diploma | 7,822 (57.7%) | 1,098 (8.1%) |
| College / Associate Degree | 9,981 (69.4%) | 690 (4.8%) |
| Bachelor's Degree or higher | 4,887 (79.6%) | 135 (2.2%) |
| Total | 25,130 (65.6%) | 2,298 (6.0%) |
Employment Occupations by Sex in Grays Harbor County
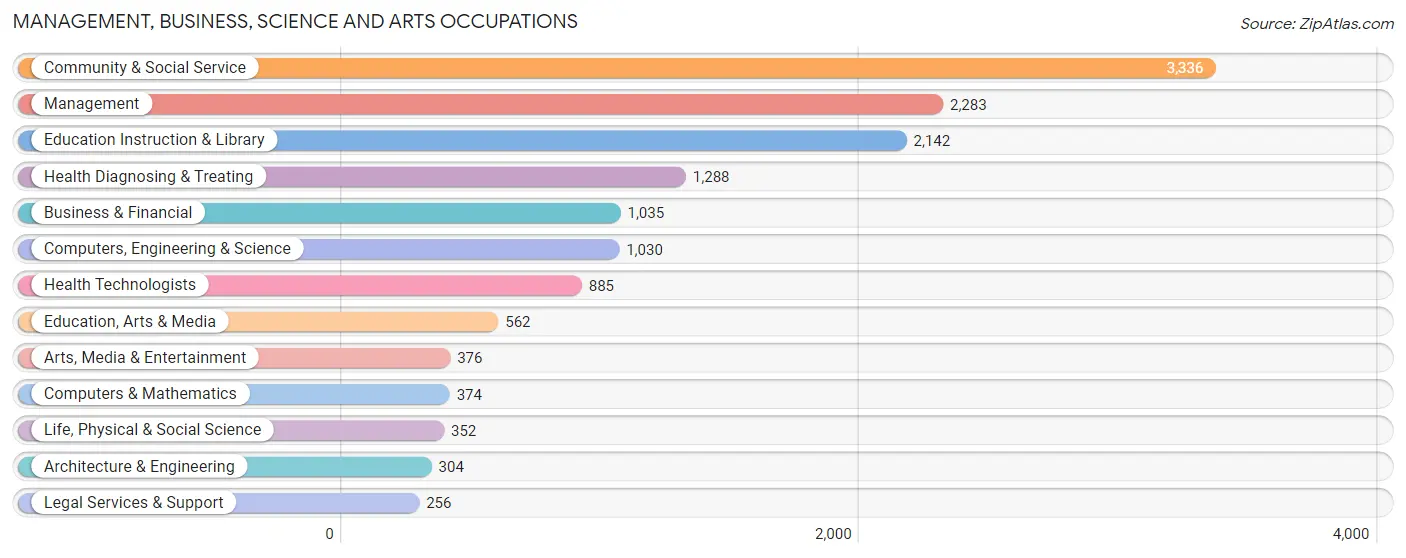
Management, Business, Science and Arts Occupations
The most common Management, Business, Science and Arts occupations in Grays Harbor County are Community & Social Service (3,336 | 11.4%), Management (2,283 | 7.8%), Education Instruction & Library (2,142 | 7.3%), Health Diagnosing & Treating (1,288 | 4.4%), and Business & Financial (1,035 | 3.5%).
Management, Business, Science and Arts Occupations by Sex
Within the Management, Business, Science and Arts occupations in Grays Harbor County, the most male-oriented occupations are Architecture & Engineering (87.2%), Computers & Mathematics (74.3%), and Computers, Engineering & Science (71.8%), while the most female-oriented occupations are Health Technologists (86.9%), Health Diagnosing & Treating (84.9%), and Legal Services & Support (77.7%).
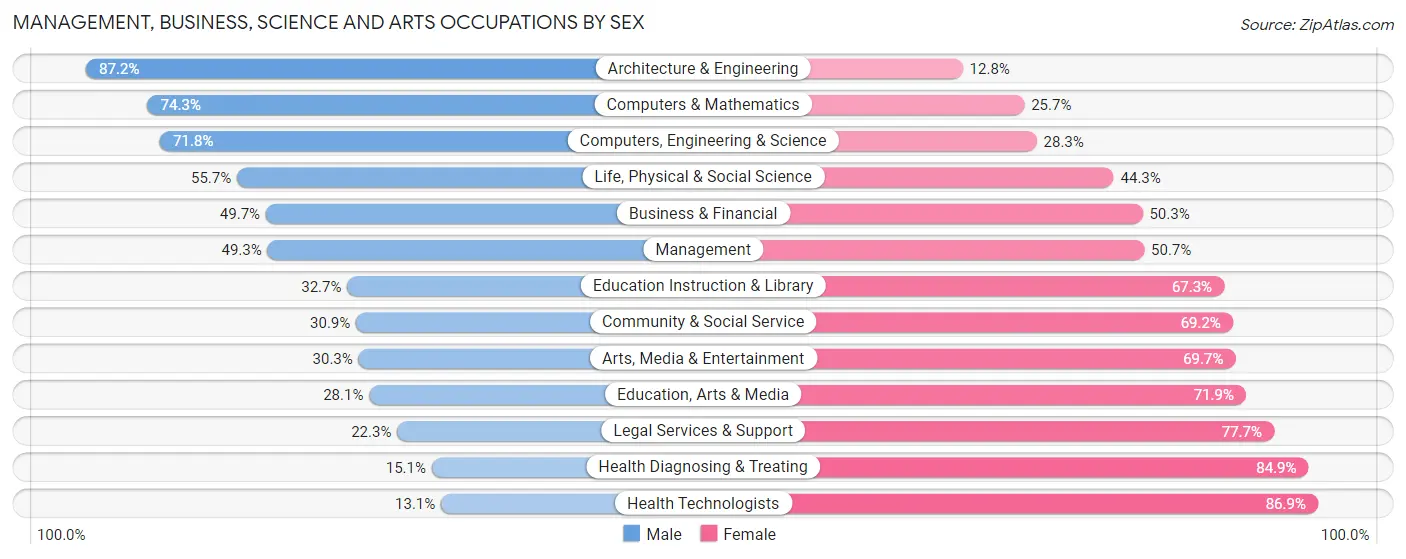
| Occupation | Male | Female |
| Management | 1,126 (49.3%) | 1,157 (50.7%) |
| Business & Financial | 514 (49.7%) | 521 (50.3%) |
| Computers, Engineering & Science | 739 (71.8%) | 291 (28.2%) |
| Computers & Mathematics | 278 (74.3%) | 96 (25.7%) |
| Architecture & Engineering | 265 (87.2%) | 39 (12.8%) |
| Life, Physical & Social Science | 196 (55.7%) | 156 (44.3%) |
| Community & Social Service | 1,029 (30.8%) | 2,307 (69.2%) |
| Education, Arts & Media | 158 (28.1%) | 404 (71.9%) |
| Legal Services & Support | 57 (22.3%) | 199 (77.7%) |
| Education Instruction & Library | 700 (32.7%) | 1,442 (67.3%) |
| Arts, Media & Entertainment | 114 (30.3%) | 262 (69.7%) |
| Health Diagnosing & Treating | 194 (15.1%) | 1,094 (84.9%) |
| Health Technologists | 116 (13.1%) | 769 (86.9%) |
| Total (Category) | 3,602 (40.2%) | 5,370 (59.9%) |
| Total (Overall) | 15,234 (52.0%) | 14,066 (48.0%) |
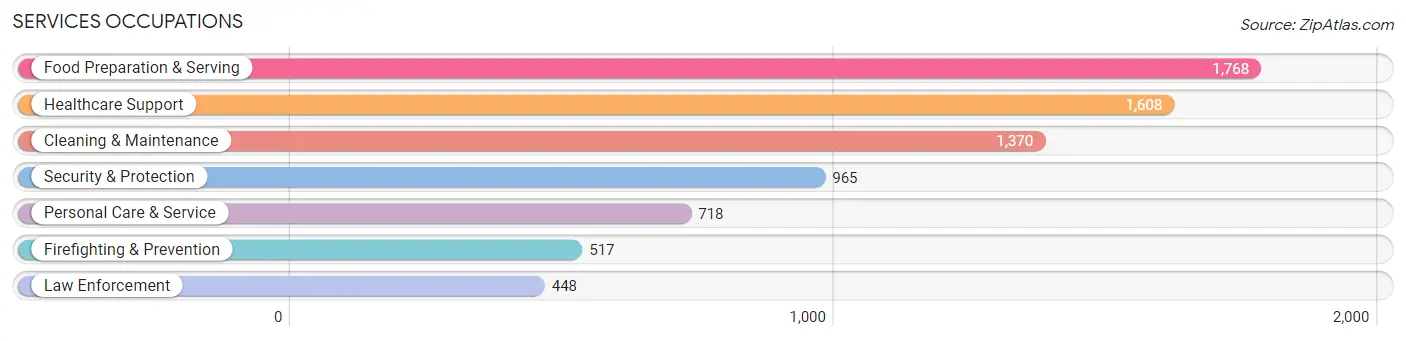
Services Occupations
The most common Services occupations in Grays Harbor County are Food Preparation & Serving (1,768 | 6.0%), Healthcare Support (1,608 | 5.5%), Cleaning & Maintenance (1,370 | 4.7%), Security & Protection (965 | 3.3%), and Personal Care & Service (718 | 2.5%).
Services Occupations by Sex
Within the Services occupations in Grays Harbor County, the most male-oriented occupations are Law Enforcement (88.8%), Security & Protection (80.4%), and Firefighting & Prevention (73.1%), while the most female-oriented occupations are Personal Care & Service (81.8%), Healthcare Support (80.0%), and Food Preparation & Serving (58.6%).
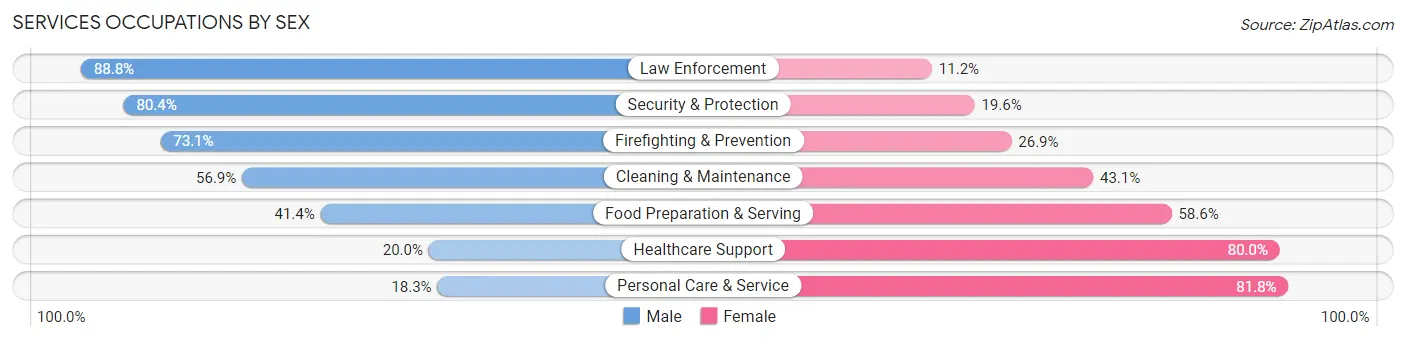
| Occupation | Male | Female |
| Healthcare Support | 321 (20.0%) | 1,287 (80.0%) |
| Security & Protection | 776 (80.4%) | 189 (19.6%) |
| Firefighting & Prevention | 378 (73.1%) | 139 (26.9%) |
| Law Enforcement | 398 (88.8%) | 50 (11.2%) |
| Food Preparation & Serving | 732 (41.4%) | 1,036 (58.6%) |
| Cleaning & Maintenance | 780 (56.9%) | 590 (43.1%) |
| Personal Care & Service | 131 (18.2%) | 587 (81.8%) |
| Total (Category) | 2,740 (42.6%) | 3,689 (57.4%) |
| Total (Overall) | 15,234 (52.0%) | 14,066 (48.0%) |
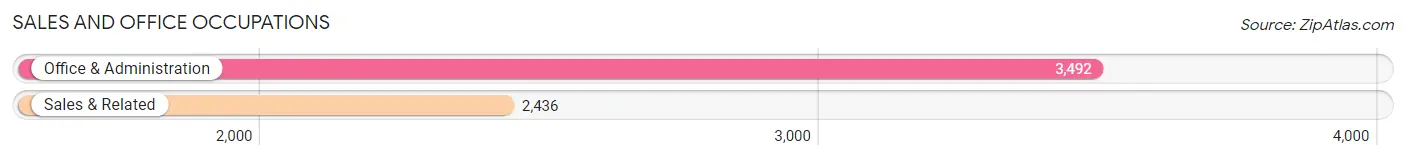
Sales and Office Occupations
The most common Sales and Office occupations in Grays Harbor County are Office & Administration (3,492 | 11.9%), and Sales & Related (2,436 | 8.3%).
Sales and Office Occupations by Sex
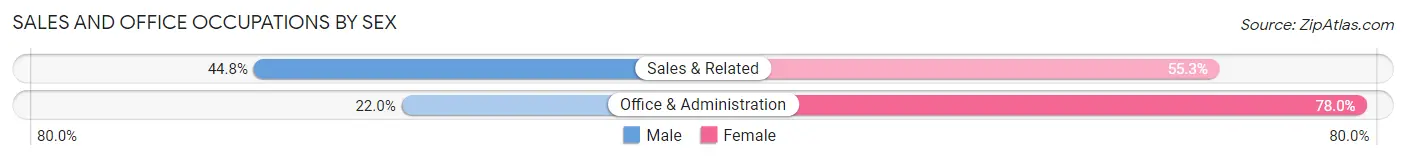
| Occupation | Male | Female |
| Sales & Related | 1,090 (44.8%) | 1,346 (55.2%) |
| Office & Administration | 769 (22.0%) | 2,723 (78.0%) |
| Total (Category) | 1,859 (31.4%) | 4,069 (68.6%) |
| Total (Overall) | 15,234 (52.0%) | 14,066 (48.0%) |
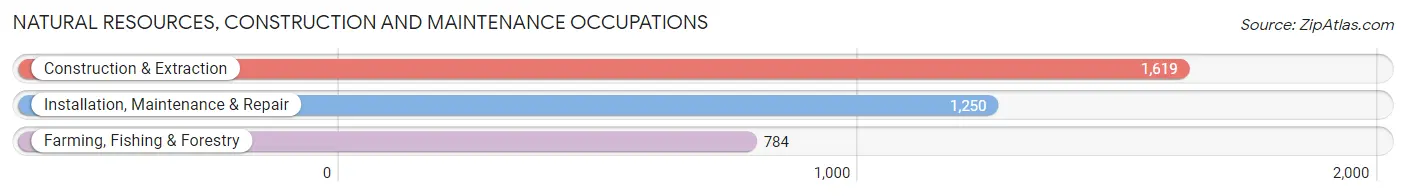
Natural Resources, Construction and Maintenance Occupations
The most common Natural Resources, Construction and Maintenance occupations in Grays Harbor County are Construction & Extraction (1,619 | 5.5%), Installation, Maintenance & Repair (1,250 | 4.3%), and Farming, Fishing & Forestry (784 | 2.7%).
Natural Resources, Construction and Maintenance Occupations by Sex
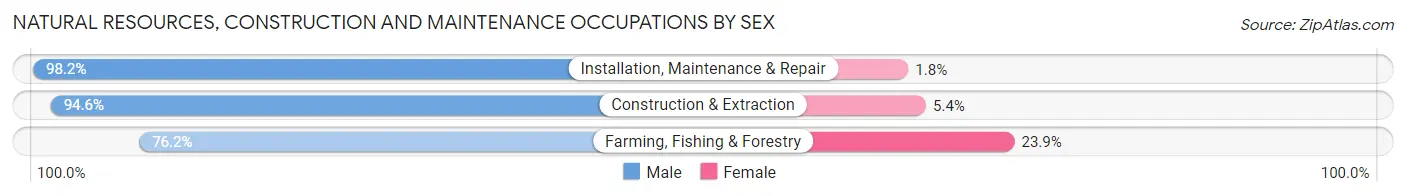
| Occupation | Male | Female |
| Farming, Fishing & Forestry | 597 (76.1%) | 187 (23.8%) |
| Construction & Extraction | 1,531 (94.6%) | 88 (5.4%) |
| Installation, Maintenance & Repair | 1,228 (98.2%) | 22 (1.8%) |
| Total (Category) | 3,356 (91.9%) | 297 (8.1%) |
| Total (Overall) | 15,234 (52.0%) | 14,066 (48.0%) |
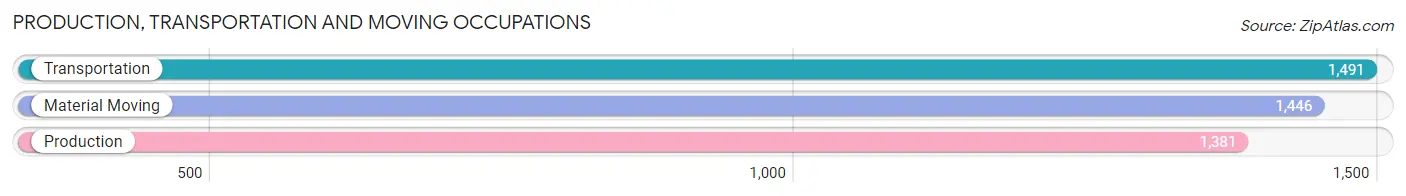
Production, Transportation and Moving Occupations
The most common Production, Transportation and Moving occupations in Grays Harbor County are Transportation (1,491 | 5.1%), Material Moving (1,446 | 4.9%), and Production (1,381 | 4.7%).
Production, Transportation and Moving Occupations by Sex

| Occupation | Male | Female |
| Production | 1,196 (86.6%) | 185 (13.4%) |
| Transportation | 1,273 (85.4%) | 218 (14.6%) |
| Material Moving | 1,208 (83.5%) | 238 (16.5%) |
| Total (Category) | 3,677 (85.2%) | 641 (14.8%) |
| Total (Overall) | 15,234 (52.0%) | 14,066 (48.0%) |
Employment Industries by Sex in Grays Harbor County
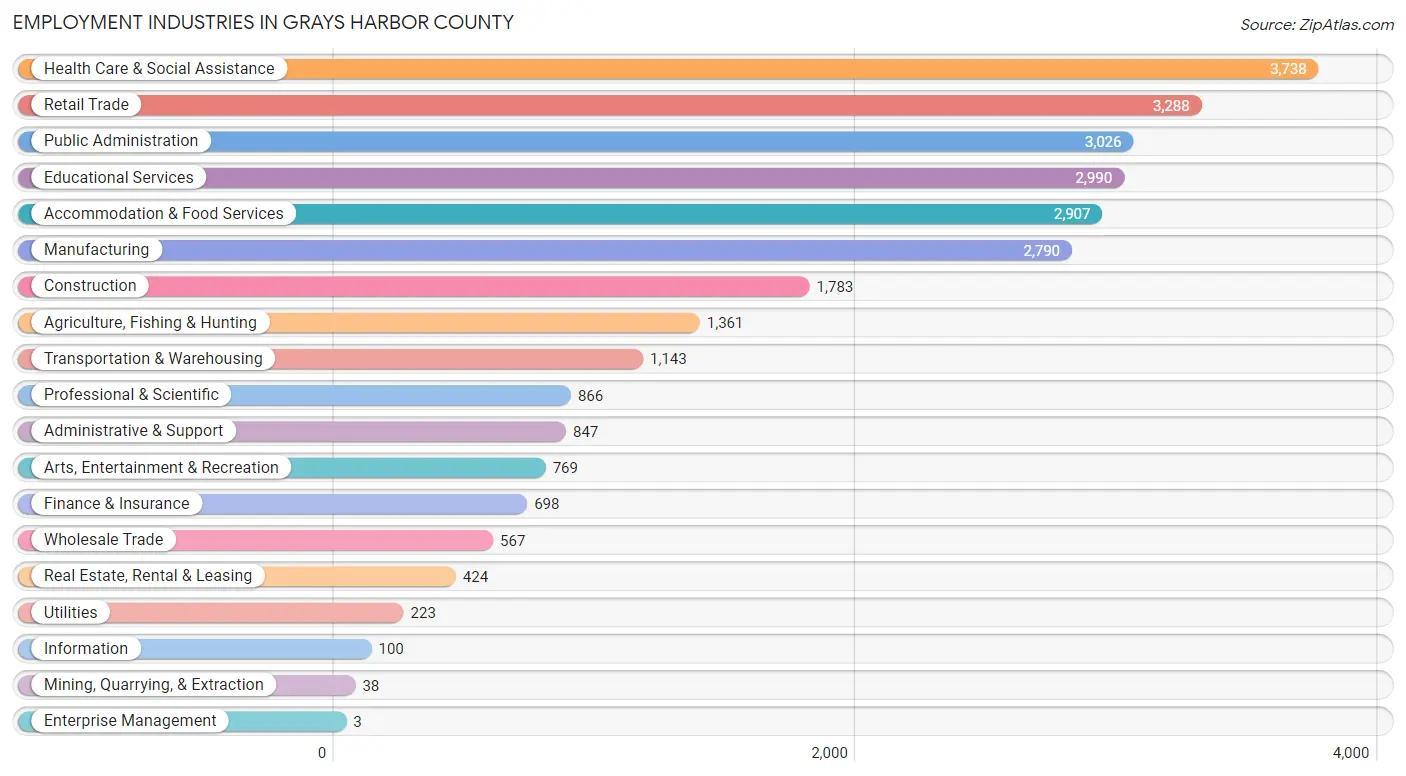
Employment Industries in Grays Harbor County
The major employment industries in Grays Harbor County include Health Care & Social Assistance (3,738 | 12.8%), Retail Trade (3,288 | 11.2%), Public Administration (3,026 | 10.3%), Educational Services (2,990 | 10.2%), and Accommodation & Food Services (2,907 | 9.9%).
Employment Industries by Sex in Grays Harbor County
The Grays Harbor County industries that see more men than women are Mining, Quarrying, & Extraction (100.0%), Enterprise Management (100.0%), and Construction (93.0%), whereas the industries that tend to have a higher number of women are Health Care & Social Assistance (79.7%), Information (66.0%), and Educational Services (64.5%).
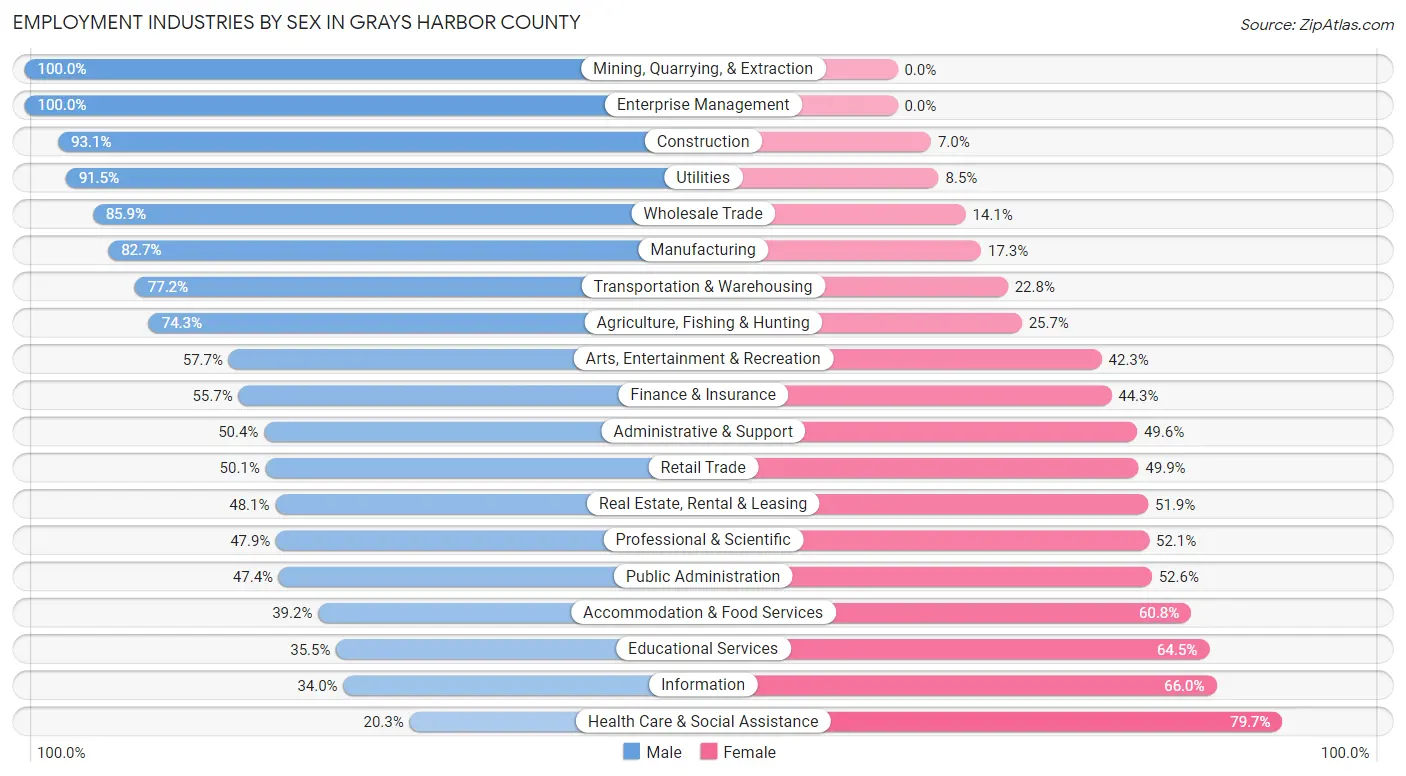
| Industry | Male | Female |
| Agriculture, Fishing & Hunting | 1,011 (74.3%) | 350 (25.7%) |
| Mining, Quarrying, & Extraction | 38 (100.0%) | 0 (0.0%) |
| Construction | 1,659 (93.0%) | 124 (7.0%) |
| Manufacturing | 2,307 (82.7%) | 483 (17.3%) |
| Wholesale Trade | 487 (85.9%) | 80 (14.1%) |
| Retail Trade | 1,648 (50.1%) | 1,640 (49.9%) |
| Transportation & Warehousing | 882 (77.2%) | 261 (22.8%) |
| Utilities | 204 (91.5%) | 19 (8.5%) |
| Information | 34 (34.0%) | 66 (66.0%) |
| Finance & Insurance | 389 (55.7%) | 309 (44.3%) |
| Real Estate, Rental & Leasing | 204 (48.1%) | 220 (51.9%) |
| Professional & Scientific | 415 (47.9%) | 451 (52.1%) |
| Enterprise Management | 3 (100.0%) | 0 (0.0%) |
| Administrative & Support | 427 (50.4%) | 420 (49.6%) |
| Educational Services | 1,061 (35.5%) | 1,929 (64.5%) |
| Health Care & Social Assistance | 760 (20.3%) | 2,978 (79.7%) |
| Arts, Entertainment & Recreation | 444 (57.7%) | 325 (42.3%) |
| Accommodation & Food Services | 1,140 (39.2%) | 1,767 (60.8%) |
| Public Administration | 1,433 (47.4%) | 1,593 (52.6%) |
| Total | 15,234 (52.0%) | 14,066 (48.0%) |
Education in Grays Harbor County
School Enrollment in Grays Harbor County
The most common levels of schooling among the 14,122 students in Grays Harbor County are middle school (3,867 | 27.4%), elementary school (3,480 | 24.6%), and high school (3,458 | 24.5%).
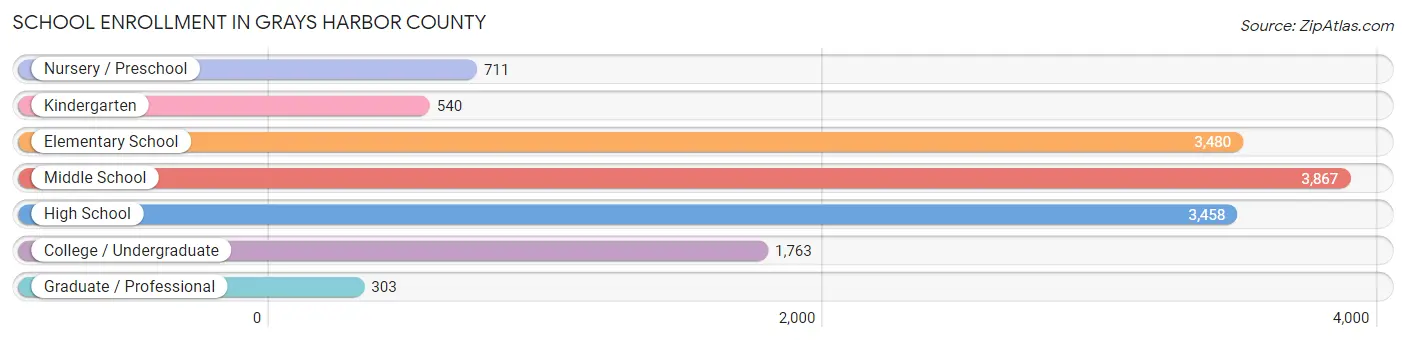
| School Level | # Students | % Students |
| Nursery / Preschool | 711 | 5.0% |
| Kindergarten | 540 | 3.8% |
| Elementary School | 3,480 | 24.6% |
| Middle School | 3,867 | 27.4% |
| High School | 3,458 | 24.5% |
| College / Undergraduate | 1,763 | 12.5% |
| Graduate / Professional | 303 | 2.1% |
| Total | 14,122 | 100.0% |
School Enrollment by Age by Funding Source in Grays Harbor County
Out of a total of 14,122 students who are enrolled in schools in Grays Harbor County, 1,031 (7.3%) attend a private institution, while the remaining 13,091 (92.7%) are enrolled in public schools. The age group of 3 to 4 year olds has the highest likelihood of being enrolled in private schools, with 193 (32.1% in the age bracket) enrolled. Conversely, the age group of 18 to 19 year olds has the lowest likelihood of being enrolled in a private school, with 980 (100.0% in the age bracket) attending a public institution.
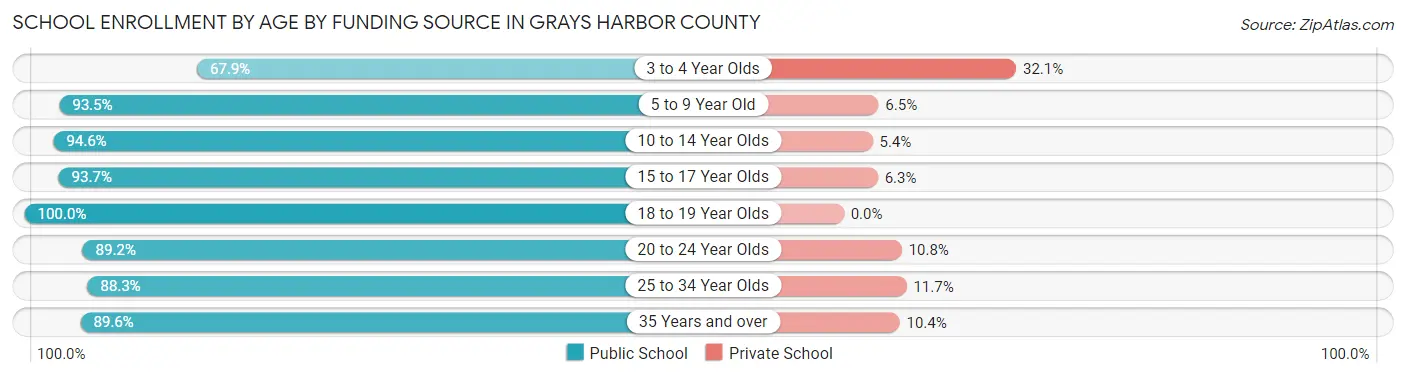
| Age Bracket | Public School | Private School |
| 3 to 4 Year Olds | 408 (67.9%) | 193 (32.1%) |
| 5 to 9 Year Old | 3,484 (93.5%) | 241 (6.5%) |
| 10 to 14 Year Olds | 4,334 (94.6%) | 246 (5.4%) |
| 15 to 17 Year Olds | 2,290 (93.7%) | 155 (6.3%) |
| 18 to 19 Year Olds | 980 (100.0%) | 0 (0.0%) |
| 20 to 24 Year Olds | 561 (89.2%) | 68 (10.8%) |
| 25 to 34 Year Olds | 483 (88.3%) | 64 (11.7%) |
| 35 Years and over | 551 (89.6%) | 64 (10.4%) |
| Total | 13,091 (92.7%) | 1,031 (7.3%) |
Educational Attainment by Field of Study in Grays Harbor County
Education (1,918 | 18.8%), business (1,195 | 11.7%), science & technology (1,067 | 10.5%), bio, nature & agricultural (935 | 9.2%), and social sciences (752 | 7.4%) are the most common fields of study among 10,200 individuals in Grays Harbor County who have obtained a bachelor's degree or higher.
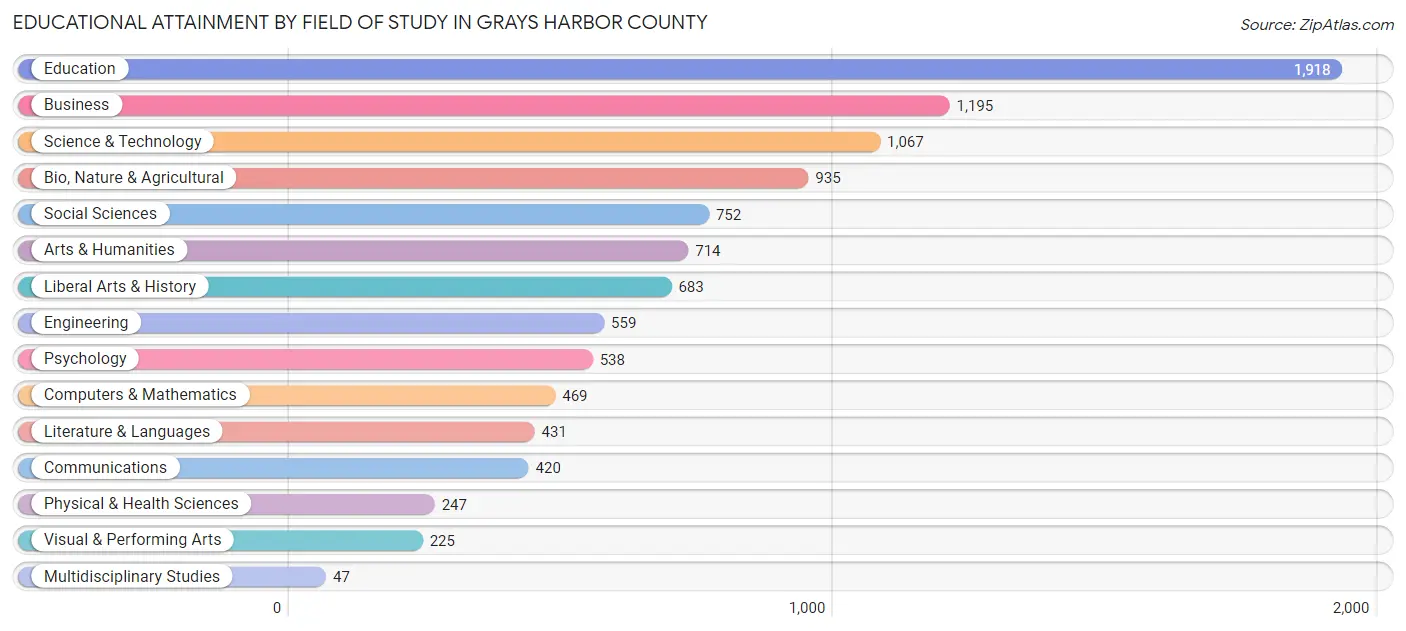
| Field of Study | # Graduates | % Graduates |
| Computers & Mathematics | 469 | 4.6% |
| Bio, Nature & Agricultural | 935 | 9.2% |
| Physical & Health Sciences | 247 | 2.4% |
| Psychology | 538 | 5.3% |
| Social Sciences | 752 | 7.4% |
| Engineering | 559 | 5.5% |
| Multidisciplinary Studies | 47 | 0.5% |
| Science & Technology | 1,067 | 10.5% |
| Business | 1,195 | 11.7% |
| Education | 1,918 | 18.8% |
| Literature & Languages | 431 | 4.2% |
| Liberal Arts & History | 683 | 6.7% |
| Visual & Performing Arts | 225 | 2.2% |
| Communications | 420 | 4.1% |
| Arts & Humanities | 714 | 7.0% |
| Total | 10,200 | 100.0% |
Transportation & Commute in Grays Harbor County
Vehicle Availability by Sex in Grays Harbor County
The most prevalent vehicle ownership categories in Grays Harbor County are males with 2 vehicles (4,754, accounting for 32.1%) and females with 2 vehicles (4,510, making up 34.6%).
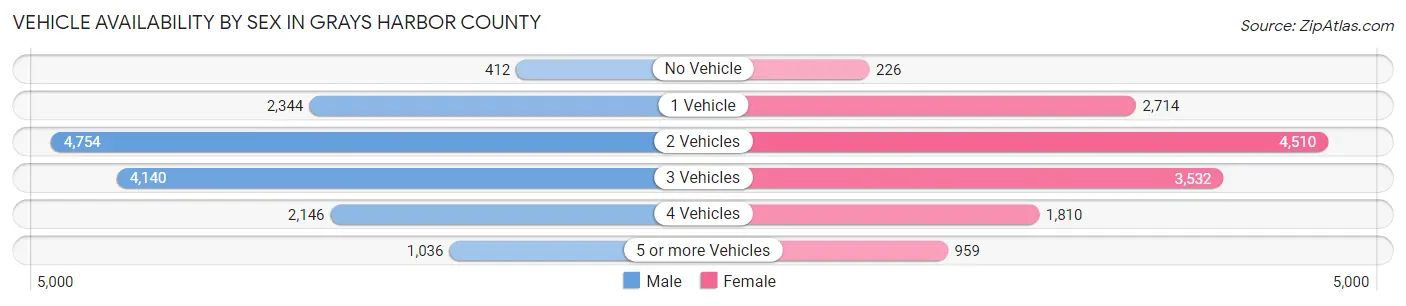
| Vehicles Available | Male | Female |
| No Vehicle | 412 (2.8%) | 226 (1.6%) |
| 1 Vehicle | 2,344 (15.8%) | 2,714 (19.7%) |
| 2 Vehicles | 4,754 (32.1%) | 4,510 (32.8%) |
| 3 Vehicles | 4,140 (27.9%) | 3,532 (25.7%) |
| 4 Vehicles | 2,146 (14.5%) | 1,810 (13.2%) |
| 5 or more Vehicles | 1,036 (7.0%) | 959 (7.0%) |
| Total | 14,832 (100.0%) | 13,751 (100.0%) |
Commute Time in Grays Harbor County
The most frequently occuring commute durations in Grays Harbor County are 5 to 9 minutes (5,643 commuters, 21.5%), 15 to 19 minutes (4,015 commuters, 15.3%), and 10 to 14 minutes (3,625 commuters, 13.8%).
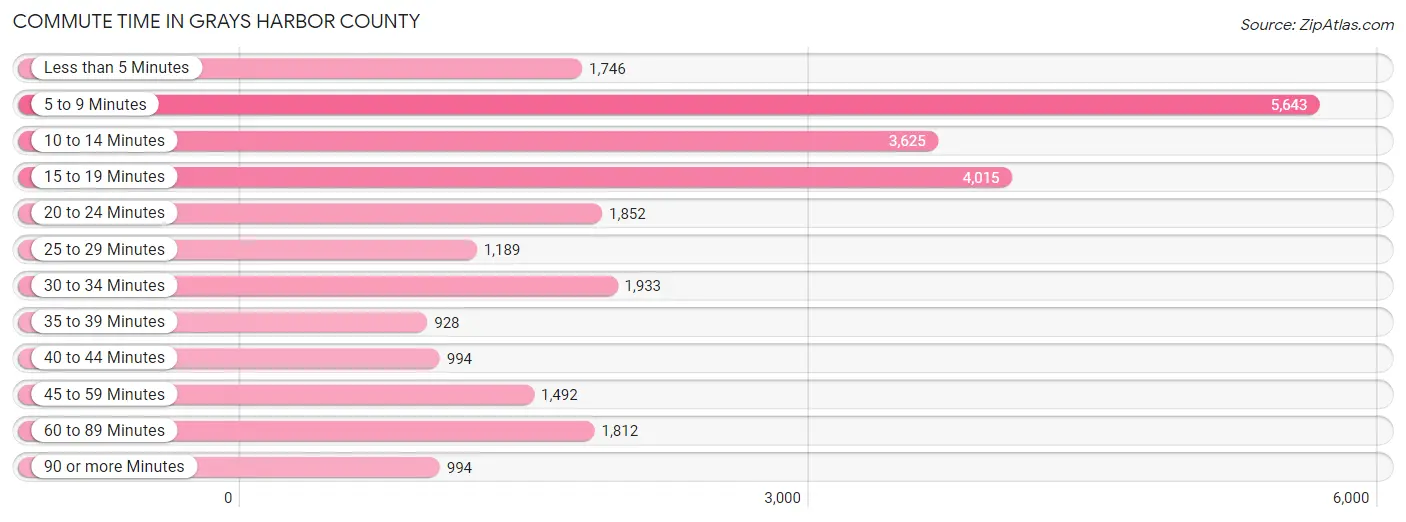
| Commute Time | # Commuters | % Commuters |
| Less than 5 Minutes | 1,746 | 6.7% |
| 5 to 9 Minutes | 5,643 | 21.5% |
| 10 to 14 Minutes | 3,625 | 13.8% |
| 15 to 19 Minutes | 4,015 | 15.3% |
| 20 to 24 Minutes | 1,852 | 7.1% |
| 25 to 29 Minutes | 1,189 | 4.5% |
| 30 to 34 Minutes | 1,933 | 7.4% |
| 35 to 39 Minutes | 928 | 3.5% |
| 40 to 44 Minutes | 994 | 3.8% |
| 45 to 59 Minutes | 1,492 | 5.7% |
| 60 to 89 Minutes | 1,812 | 6.9% |
| 90 or more Minutes | 994 | 3.8% |
Commute Time by Sex in Grays Harbor County
The most common commute times in Grays Harbor County are 5 to 9 minutes (2,760 commuters, 20.1%) for males and 5 to 9 minutes (2,883 commuters, 23.1%) for females.
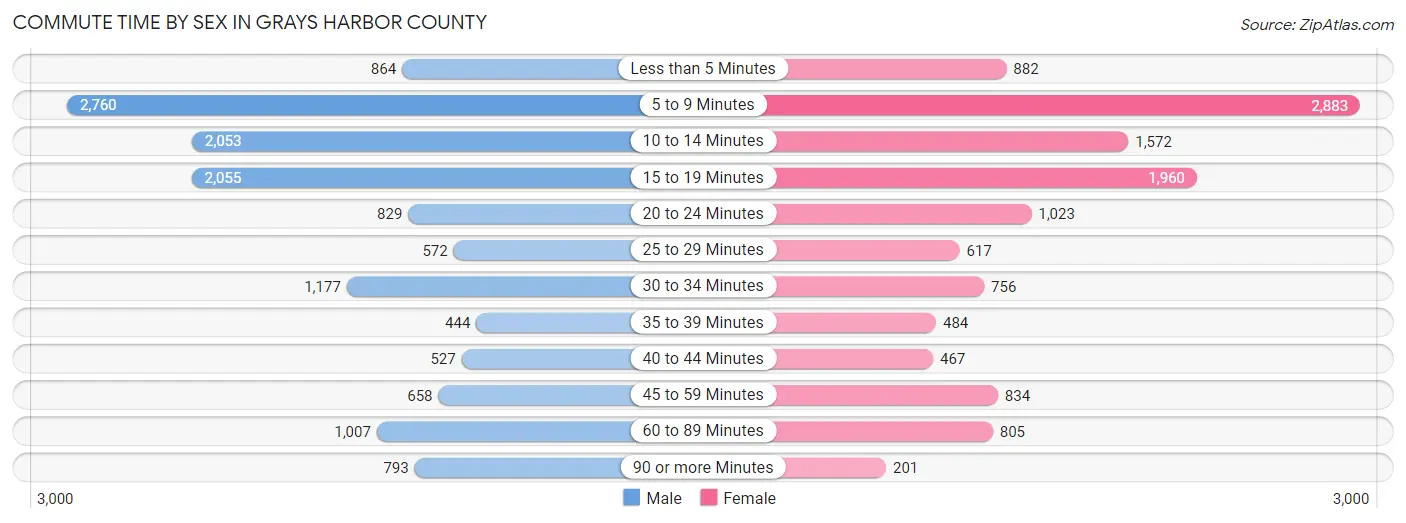
| Commute Time | Male | Female |
| Less than 5 Minutes | 864 (6.3%) | 882 (7.1%) |
| 5 to 9 Minutes | 2,760 (20.1%) | 2,883 (23.1%) |
| 10 to 14 Minutes | 2,053 (14.9%) | 1,572 (12.6%) |
| 15 to 19 Minutes | 2,055 (15.0%) | 1,960 (15.7%) |
| 20 to 24 Minutes | 829 (6.0%) | 1,023 (8.2%) |
| 25 to 29 Minutes | 572 (4.2%) | 617 (4.9%) |
| 30 to 34 Minutes | 1,177 (8.6%) | 756 (6.1%) |
| 35 to 39 Minutes | 444 (3.2%) | 484 (3.9%) |
| 40 to 44 Minutes | 527 (3.8%) | 467 (3.7%) |
| 45 to 59 Minutes | 658 (4.8%) | 834 (6.7%) |
| 60 to 89 Minutes | 1,007 (7.3%) | 805 (6.5%) |
| 90 or more Minutes | 793 (5.8%) | 201 (1.6%) |
Time of Departure to Work by Sex in Grays Harbor County
The most frequent times of departure to work in Grays Harbor County are 7:30 AM to 7:59 AM (1,820, 13.3%) for males and 7:30 AM to 7:59 AM (1,966, 15.8%) for females.
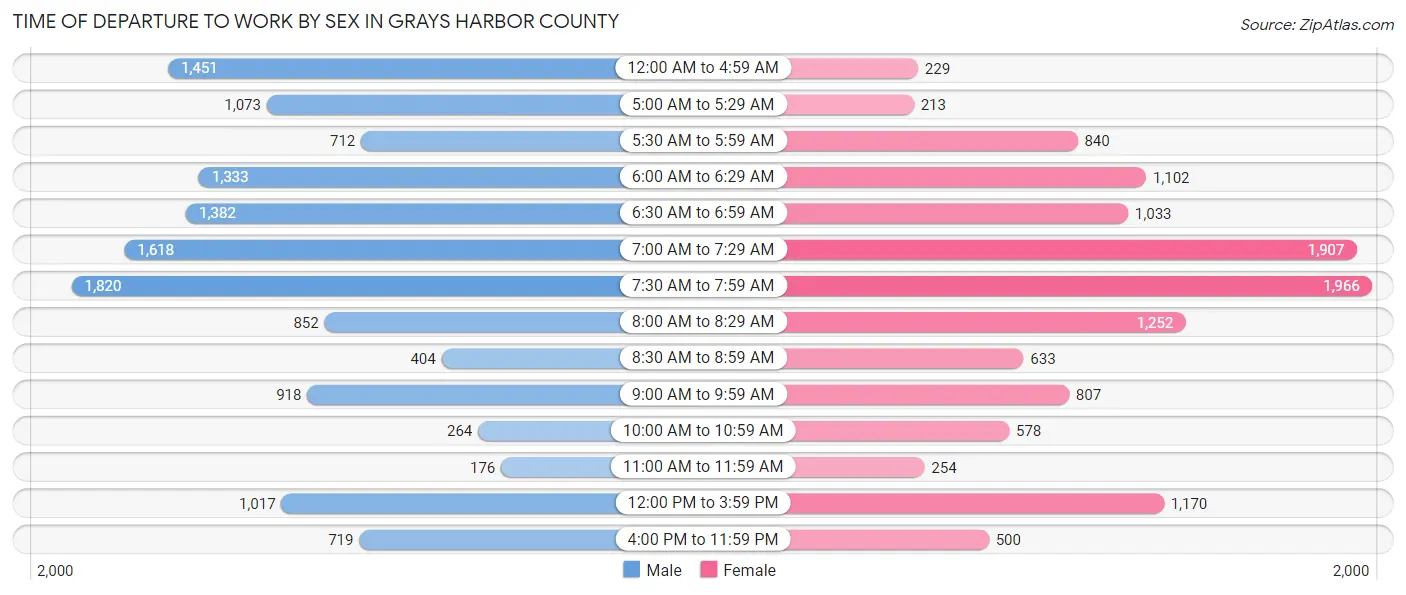
| Time of Departure | Male | Female |
| 12:00 AM to 4:59 AM | 1,451 (10.6%) | 229 (1.8%) |
| 5:00 AM to 5:29 AM | 1,073 (7.8%) | 213 (1.7%) |
| 5:30 AM to 5:59 AM | 712 (5.2%) | 840 (6.7%) |
| 6:00 AM to 6:29 AM | 1,333 (9.7%) | 1,102 (8.8%) |
| 6:30 AM to 6:59 AM | 1,382 (10.1%) | 1,033 (8.3%) |
| 7:00 AM to 7:29 AM | 1,618 (11.8%) | 1,907 (15.3%) |
| 7:30 AM to 7:59 AM | 1,820 (13.3%) | 1,966 (15.8%) |
| 8:00 AM to 8:29 AM | 852 (6.2%) | 1,252 (10.0%) |
| 8:30 AM to 8:59 AM | 404 (2.9%) | 633 (5.1%) |
| 9:00 AM to 9:59 AM | 918 (6.7%) | 807 (6.5%) |
| 10:00 AM to 10:59 AM | 264 (1.9%) | 578 (4.6%) |
| 11:00 AM to 11:59 AM | 176 (1.3%) | 254 (2.0%) |
| 12:00 PM to 3:59 PM | 1,017 (7.4%) | 1,170 (9.4%) |
| 4:00 PM to 11:59 PM | 719 (5.2%) | 500 (4.0%) |
| Total | 13,739 (100.0%) | 12,484 (100.0%) |
Housing Occupancy in Grays Harbor County
Occupancy by Ownership in Grays Harbor County
Of the total 29,542 dwellings in Grays Harbor County, owner-occupied units account for 21,045 (71.2%), while renter-occupied units make up 8,497 (28.8%).
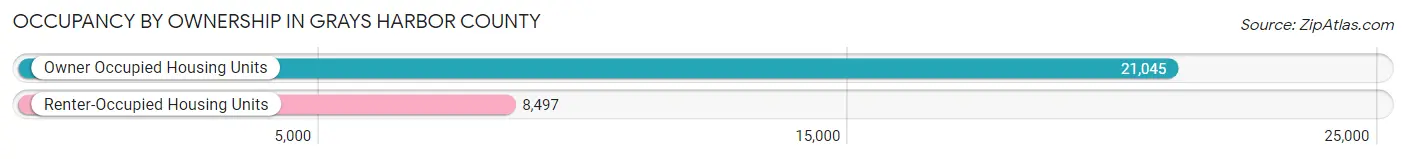
| Occupancy | # Housing Units | % Housing Units |
| Owner Occupied Housing Units | 21,045 | 71.2% |
| Renter-Occupied Housing Units | 8,497 | 28.8% |
| Total Occupied Housing Units | 29,542 | 100.0% |
Occupancy by Household Size in Grays Harbor County
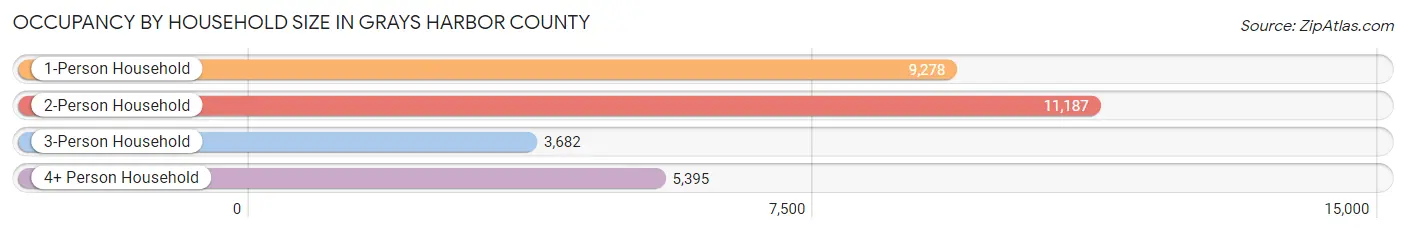
| Household Size | # Housing Units | % Housing Units |
| 1-Person Household | 9,278 | 31.4% |
| 2-Person Household | 11,187 | 37.9% |
| 3-Person Household | 3,682 | 12.5% |
| 4+ Person Household | 5,395 | 18.3% |
| Total Housing Units | 29,542 | 100.0% |
Occupancy by Ownership by Household Size in Grays Harbor County
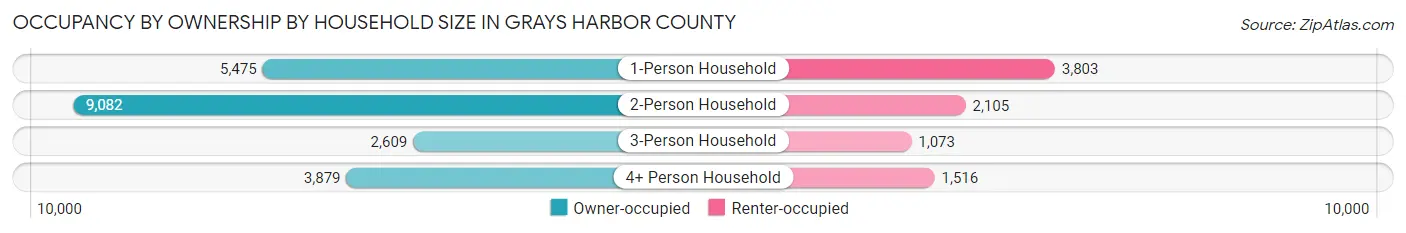
| Household Size | Owner-occupied | Renter-occupied |
| 1-Person Household | 5,475 (59.0%) | 3,803 (41.0%) |
| 2-Person Household | 9,082 (81.2%) | 2,105 (18.8%) |
| 3-Person Household | 2,609 (70.9%) | 1,073 (29.1%) |
| 4+ Person Household | 3,879 (71.9%) | 1,516 (28.1%) |
| Total Housing Units | 21,045 (71.2%) | 8,497 (28.8%) |
Occupancy by Educational Attainment in Grays Harbor County
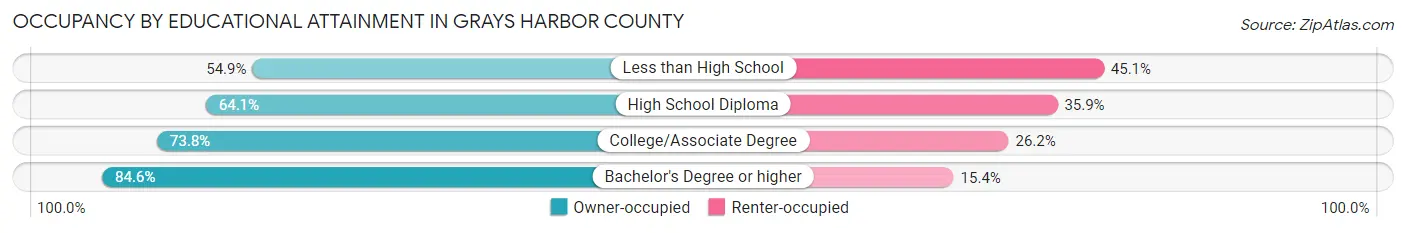
| Household Size | Owner-occupied | Renter-occupied |
| Less than High School | 1,236 (54.9%) | 1,017 (45.1%) |
| High School Diploma | 6,160 (64.1%) | 3,456 (35.9%) |
| College/Associate Degree | 8,877 (73.8%) | 3,158 (26.2%) |
| Bachelor's Degree or higher | 4,772 (84.6%) | 866 (15.4%) |
Occupancy by Age of Householder in Grays Harbor County
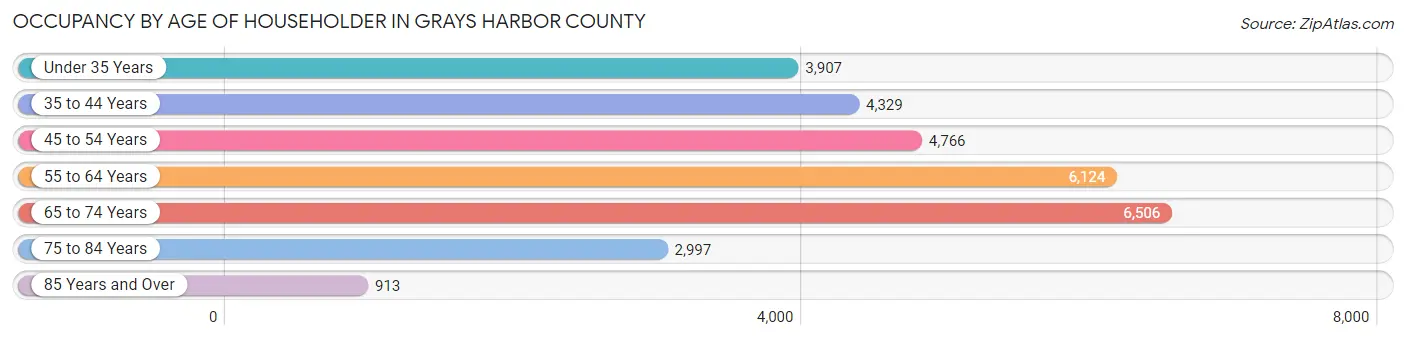
| Age Bracket | # Households | % Households |
| Under 35 Years | 3,907 | 13.2% |
| 35 to 44 Years | 4,329 | 14.6% |
| 45 to 54 Years | 4,766 | 16.1% |
| 55 to 64 Years | 6,124 | 20.7% |
| 65 to 74 Years | 6,506 | 22.0% |
| 75 to 84 Years | 2,997 | 10.1% |
| 85 Years and Over | 913 | 3.1% |
| Total | 29,542 | 100.0% |
Housing Finances in Grays Harbor County
Median Income by Occupancy in Grays Harbor County
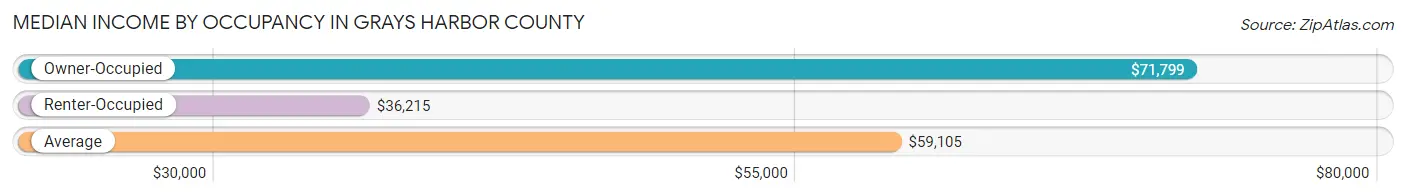
| Occupancy Type | # Households | Median Income |
| Owner-Occupied | 21,045 (71.2%) | $71,799 |
| Renter-Occupied | 8,497 (28.8%) | $36,215 |
| Average | 29,542 (100.0%) | $59,105 |
Occupancy by Householder Income Bracket in Grays Harbor County
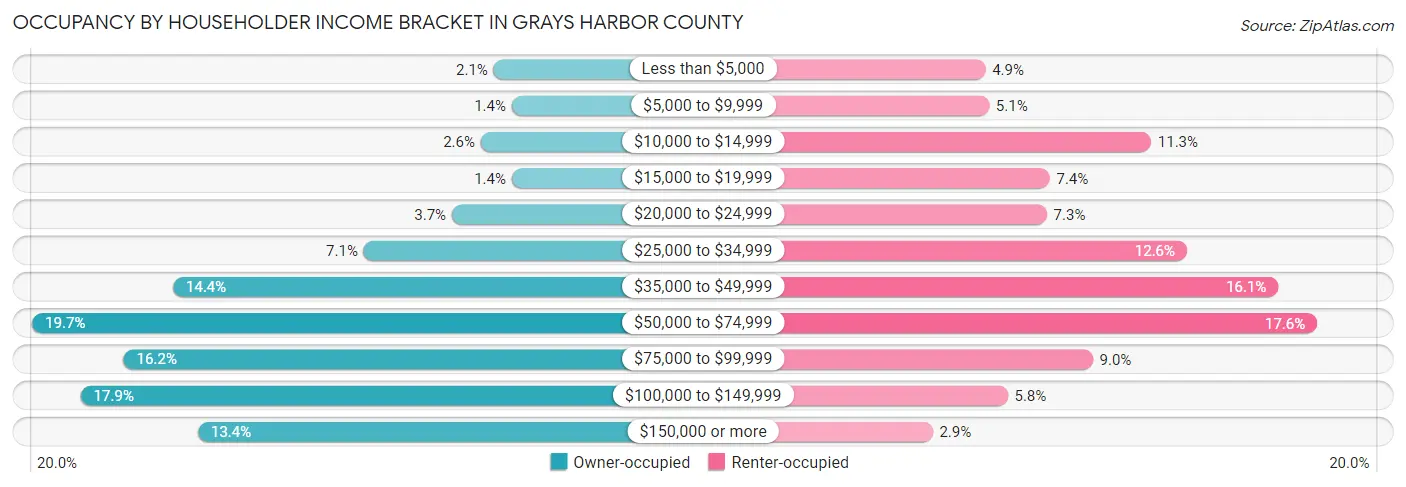
| Income Bracket | Owner-occupied | Renter-occupied |
| Less than $5,000 | 448 (2.1%) | 420 (4.9%) |
| $5,000 to $9,999 | 303 (1.4%) | 432 (5.1%) |
| $10,000 to $14,999 | 552 (2.6%) | 956 (11.3%) |
| $15,000 to $19,999 | 304 (1.4%) | 628 (7.4%) |
| $20,000 to $24,999 | 783 (3.7%) | 619 (7.3%) |
| $25,000 to $34,999 | 1,490 (7.1%) | 1,072 (12.6%) |
| $35,000 to $49,999 | 3,020 (14.3%) | 1,368 (16.1%) |
| $50,000 to $74,999 | 4,147 (19.7%) | 1,494 (17.6%) |
| $75,000 to $99,999 | 3,416 (16.2%) | 767 (9.0%) |
| $100,000 to $149,999 | 3,761 (17.9%) | 492 (5.8%) |
| $150,000 or more | 2,821 (13.4%) | 249 (2.9%) |
| Total | 21,045 (100.0%) | 8,497 (100.0%) |
Monthly Housing Cost Tiers in Grays Harbor County
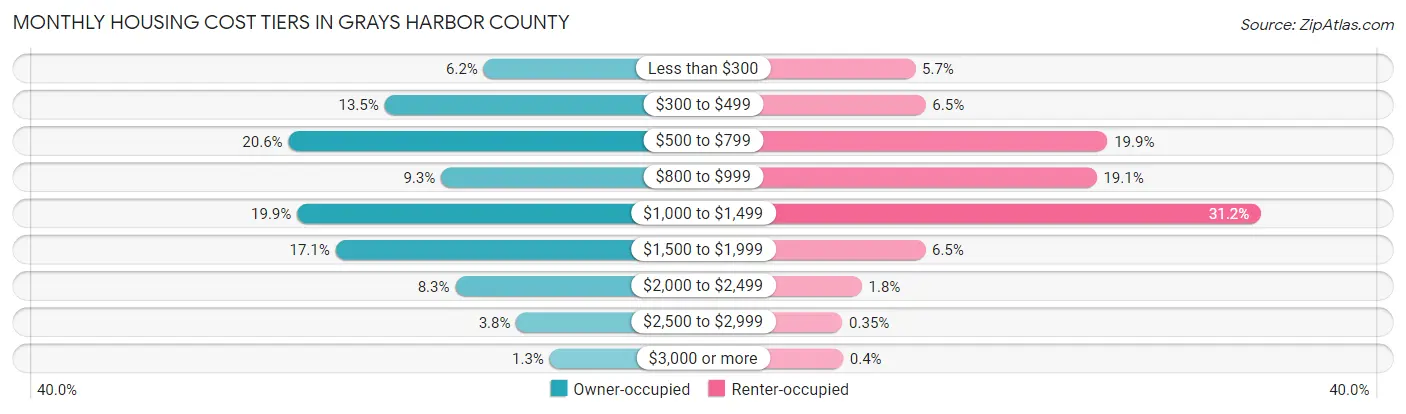
| Monthly Cost | Owner-occupied | Renter-occupied |
| Less than $300 | 1,302 (6.2%) | 486 (5.7%) |
| $300 to $499 | 2,838 (13.5%) | 551 (6.5%) |
| $500 to $799 | 4,330 (20.6%) | 1,688 (19.9%) |
| $800 to $999 | 1,964 (9.3%) | 1,621 (19.1%) |
| $1,000 to $1,499 | 4,194 (19.9%) | 2,651 (31.2%) |
| $1,500 to $1,999 | 3,598 (17.1%) | 548 (6.5%) |
| $2,000 to $2,499 | 1,743 (8.3%) | 151 (1.8%) |
| $2,500 to $2,999 | 797 (3.8%) | 30 (0.4%) |
| $3,000 or more | 279 (1.3%) | 34 (0.4%) |
| Total | 21,045 (100.0%) | 8,497 (100.0%) |
Physical Housing Characteristics in Grays Harbor County
Housing Structures in Grays Harbor County
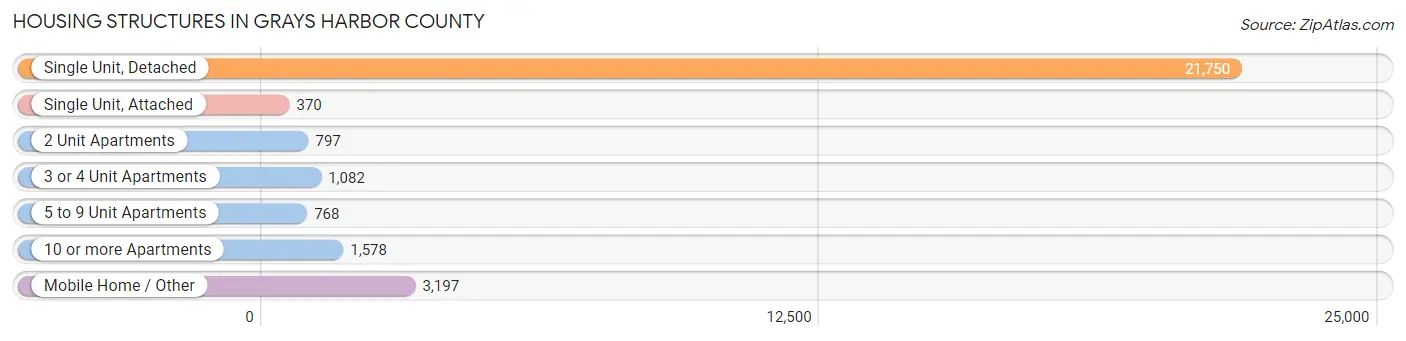
| Structure Type | # Housing Units | % Housing Units |
| Single Unit, Detached | 21,750 | 73.6% |
| Single Unit, Attached | 370 | 1.3% |
| 2 Unit Apartments | 797 | 2.7% |
| 3 or 4 Unit Apartments | 1,082 | 3.7% |
| 5 to 9 Unit Apartments | 768 | 2.6% |
| 10 or more Apartments | 1,578 | 5.3% |
| Mobile Home / Other | 3,197 | 10.8% |
| Total | 29,542 | 100.0% |
Housing Structures by Occupancy in Grays Harbor County
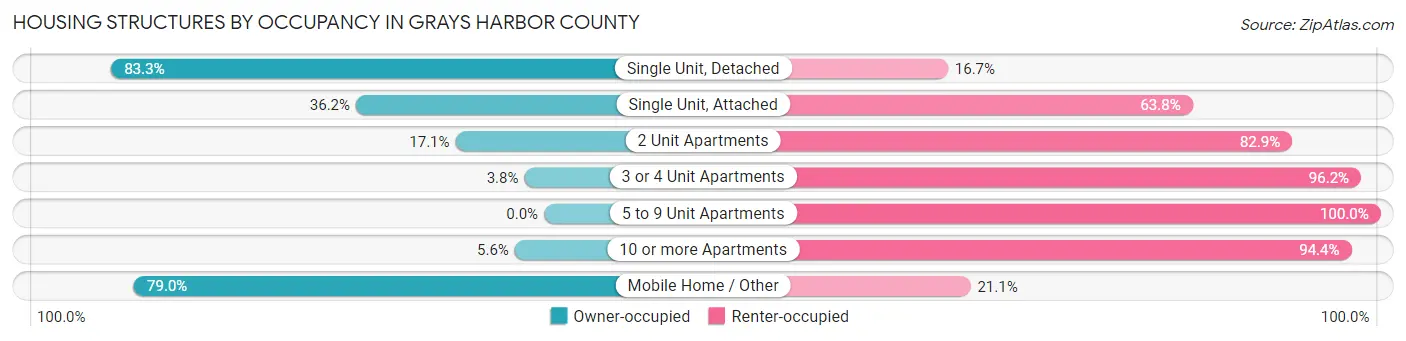
| Structure Type | Owner-occupied | Renter-occupied |
| Single Unit, Detached | 18,121 (83.3%) | 3,629 (16.7%) |
| Single Unit, Attached | 134 (36.2%) | 236 (63.8%) |
| 2 Unit Apartments | 136 (17.1%) | 661 (82.9%) |
| 3 or 4 Unit Apartments | 41 (3.8%) | 1,041 (96.2%) |
| 5 to 9 Unit Apartments | 0 (0.0%) | 768 (100.0%) |
| 10 or more Apartments | 89 (5.6%) | 1,489 (94.4%) |
| Mobile Home / Other | 2,524 (78.9%) | 673 (21.0%) |
| Total | 21,045 (71.2%) | 8,497 (28.8%) |
Housing Structures by Number of Rooms in Grays Harbor County
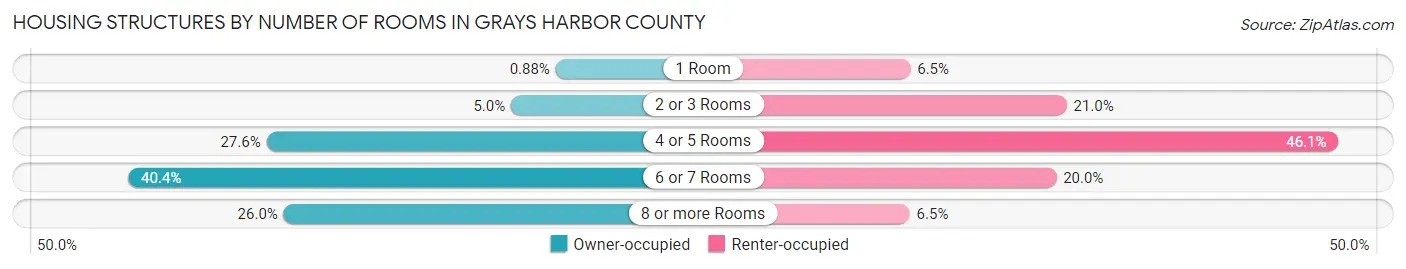
| Number of Rooms | Owner-occupied | Renter-occupied |
| 1 Room | 186 (0.9%) | 553 (6.5%) |
| 2 or 3 Rooms | 1,055 (5.0%) | 1,781 (21.0%) |
| 4 or 5 Rooms | 5,815 (27.6%) | 3,916 (46.1%) |
| 6 or 7 Rooms | 8,509 (40.4%) | 1,699 (20.0%) |
| 8 or more Rooms | 5,480 (26.0%) | 548 (6.5%) |
| Total | 21,045 (100.0%) | 8,497 (100.0%) |
Housing Structure by Heating Type in Grays Harbor County
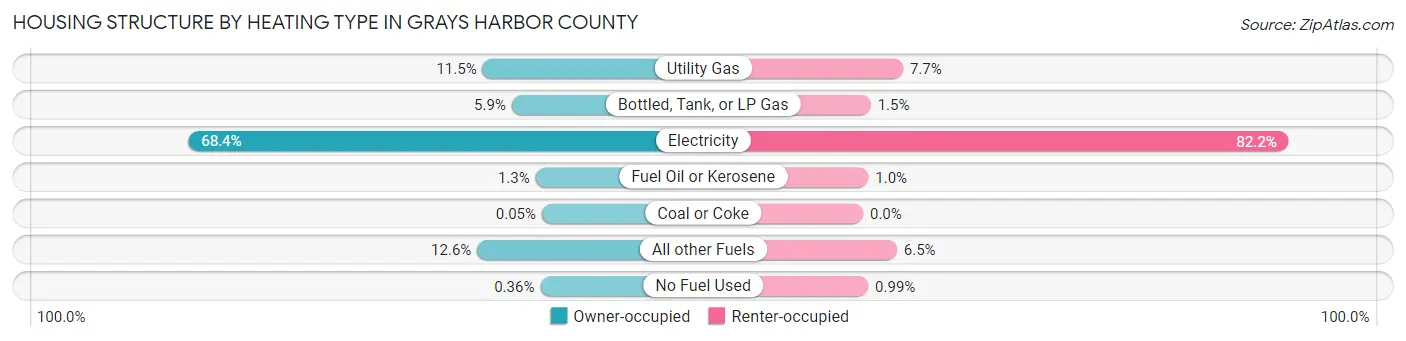
| Heating Type | Owner-occupied | Renter-occupied |
| Utility Gas | 2,425 (11.5%) | 656 (7.7%) |
| Bottled, Tank, or LP Gas | 1,238 (5.9%) | 127 (1.5%) |
| Electricity | 14,385 (68.3%) | 6,988 (82.2%) |
| Fuel Oil or Kerosene | 268 (1.3%) | 87 (1.0%) |
| Coal or Coke | 11 (0.1%) | 0 (0.0%) |
| All other Fuels | 2,642 (12.6%) | 555 (6.5%) |
| No Fuel Used | 76 (0.4%) | 84 (1.0%) |
| Total | 21,045 (100.0%) | 8,497 (100.0%) |
Household Vehicle Usage in Grays Harbor County
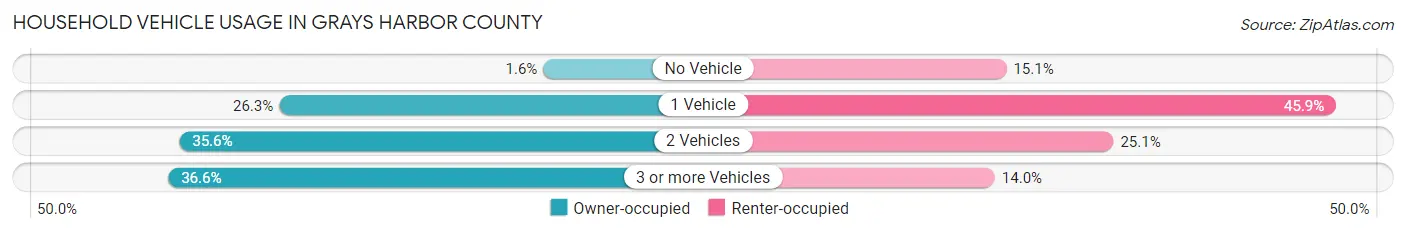
| Vehicles per Household | Owner-occupied | Renter-occupied |
| No Vehicle | 335 (1.6%) | 1,281 (15.1%) |
| 1 Vehicle | 5,525 (26.3%) | 3,896 (45.9%) |
| 2 Vehicles | 7,484 (35.6%) | 2,130 (25.1%) |
| 3 or more Vehicles | 7,701 (36.6%) | 1,190 (14.0%) |
| Total | 21,045 (100.0%) | 8,497 (100.0%) |
Real Estate & Mortgages in Grays Harbor County
Real Estate and Mortgage Overview in Grays Harbor County
| Characteristic | Without Mortgage | With Mortgage |
| Housing Units | 9,449 | 11,596 |
| Median Property Value | $213,300 | $279,600 |
| Median Household Income | $54,346 | $1,937 |
| Monthly Housing Costs | $538 | $277 |
| Real Estate Taxes | $2,012 | $388 |
Property Value by Mortgage Status in Grays Harbor County
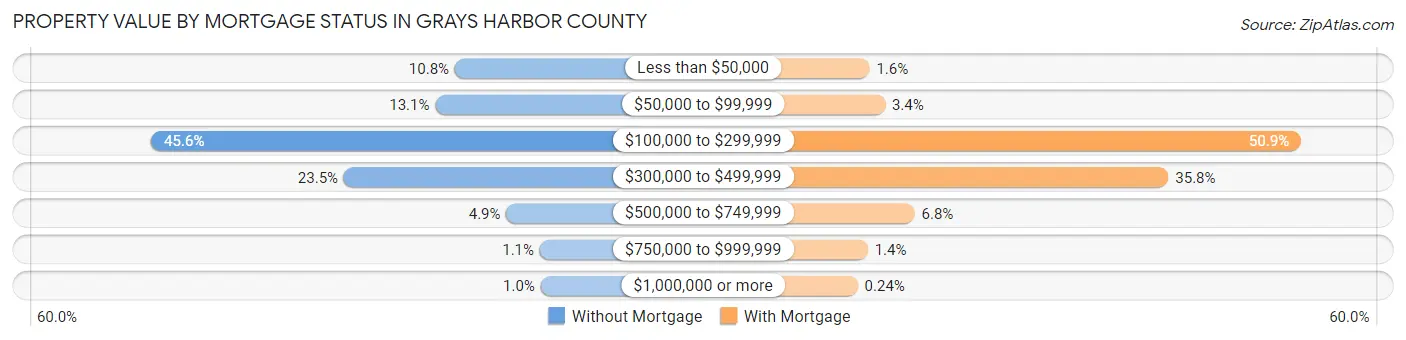
| Property Value | Without Mortgage | With Mortgage |
| Less than $50,000 | 1,022 (10.8%) | 184 (1.6%) |
| $50,000 to $99,999 | 1,234 (13.1%) | 390 (3.4%) |
| $100,000 to $299,999 | 4,304 (45.6%) | 5,905 (50.9%) |
| $300,000 to $499,999 | 2,221 (23.5%) | 4,145 (35.7%) |
| $500,000 to $749,999 | 467 (4.9%) | 783 (6.8%) |
| $750,000 to $999,999 | 105 (1.1%) | 161 (1.4%) |
| $1,000,000 or more | 96 (1.0%) | 28 (0.2%) |
| Total | 9,449 (100.0%) | 11,596 (100.0%) |
Household Income by Mortgage Status in Grays Harbor County
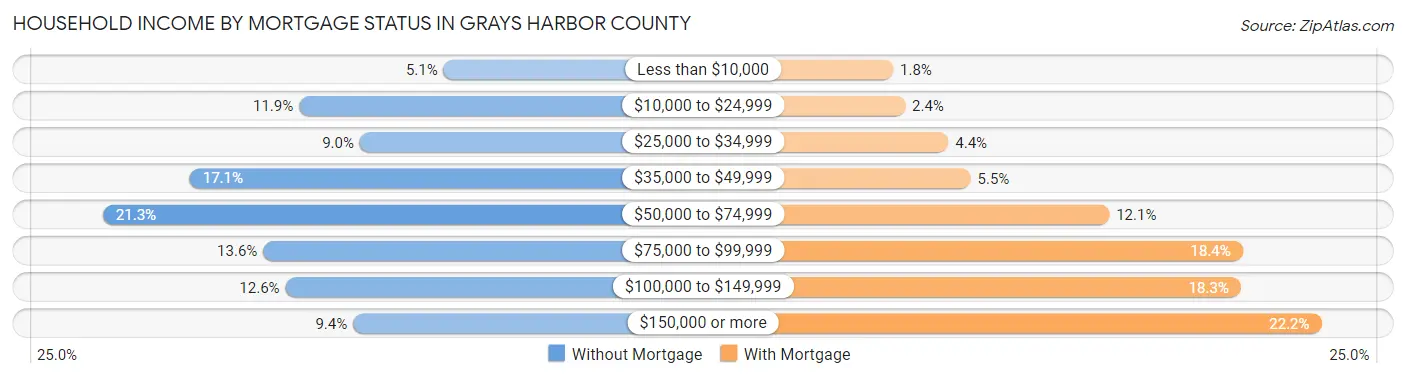
| Household Income | Without Mortgage | With Mortgage |
| Less than $10,000 | 477 (5.1%) | 208 (1.8%) |
| $10,000 to $24,999 | 1,127 (11.9%) | 274 (2.4%) |
| $25,000 to $34,999 | 854 (9.0%) | 512 (4.4%) |
| $35,000 to $49,999 | 1,619 (17.1%) | 636 (5.5%) |
| $50,000 to $74,999 | 2,010 (21.3%) | 1,401 (12.1%) |
| $75,000 to $99,999 | 1,289 (13.6%) | 2,137 (18.4%) |
| $100,000 to $149,999 | 1,189 (12.6%) | 2,127 (18.3%) |
| $150,000 or more | 884 (9.4%) | 2,572 (22.2%) |
| Total | 9,449 (100.0%) | 11,596 (100.0%) |
Property Value to Household Income Ratio in Grays Harbor County
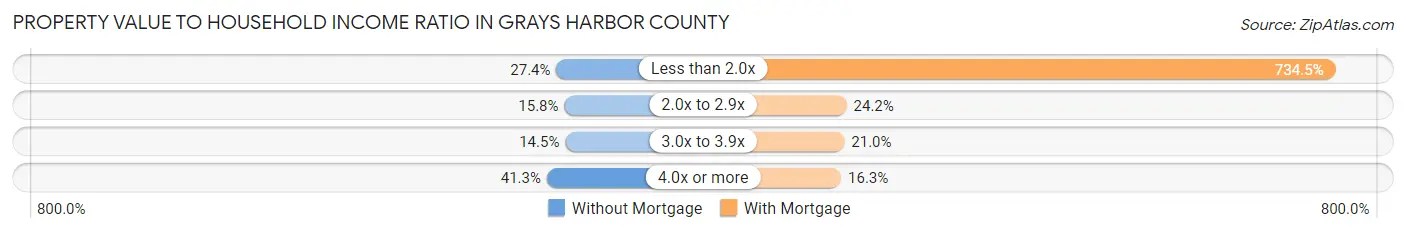
| Value-to-Income Ratio | Without Mortgage | With Mortgage |
| Less than 2.0x | 2,588 (27.4%) | 85,169 (734.5%) |
| 2.0x to 2.9x | 1,491 (15.8%) | 2,807 (24.2%) |
| 3.0x to 3.9x | 1,374 (14.5%) | 2,437 (21.0%) |
| 4.0x or more | 3,901 (41.3%) | 1,888 (16.3%) |
| Total | 9,449 (100.0%) | 11,596 (100.0%) |
Real Estate Taxes by Mortgage Status in Grays Harbor County
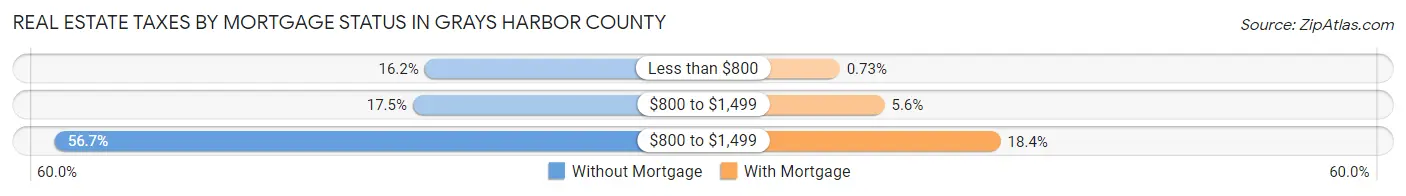
| Property Taxes | Without Mortgage | With Mortgage |
| Less than $800 | 1,528 (16.2%) | 85 (0.7%) |
| $800 to $1,499 | 1,650 (17.5%) | 654 (5.6%) |
| $800 to $1,499 | 5,357 (56.7%) | 2,130 (18.4%) |
| Total | 9,449 (100.0%) | 11,596 (100.0%) |
Health & Disability in Grays Harbor County
Health Insurance Coverage by Age in Grays Harbor County
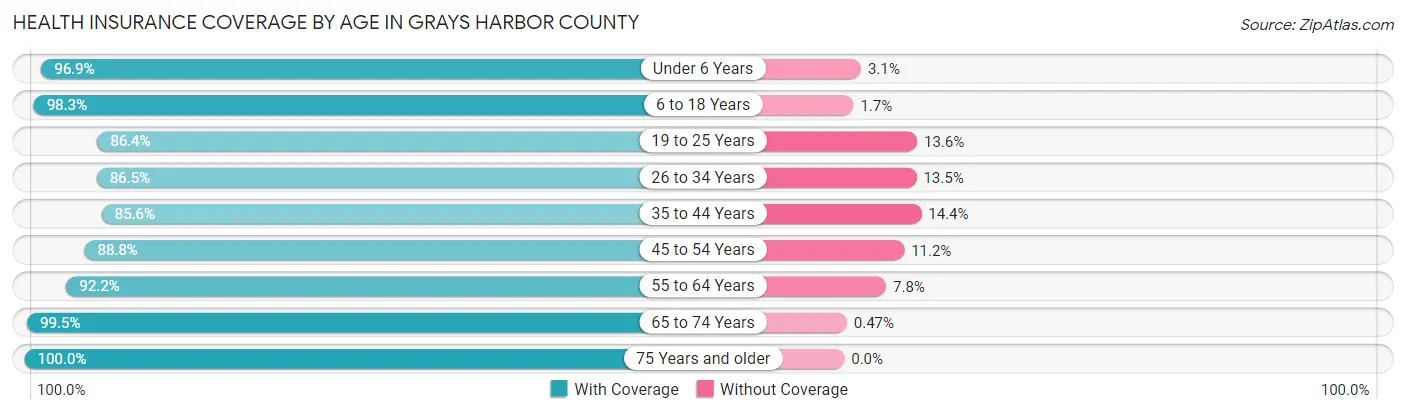
| Age Bracket | With Coverage | Without Coverage |
| Under 6 Years | 4,030 (96.9%) | 130 (3.1%) |
| 6 to 18 Years | 11,629 (98.3%) | 202 (1.7%) |
| 19 to 25 Years | 4,267 (86.4%) | 670 (13.6%) |
| 26 to 34 Years | 6,609 (86.5%) | 1,028 (13.5%) |
| 35 to 44 Years | 7,030 (85.6%) | 1,180 (14.4%) |
| 45 to 54 Years | 7,468 (88.8%) | 939 (11.2%) |
| 55 to 64 Years | 10,232 (92.2%) | 866 (7.8%) |
| 65 to 74 Years | 10,589 (99.5%) | 50 (0.5%) |
| 75 Years and older | 5,903 (100.0%) | 0 (0.0%) |
| Total | 67,757 (93.0%) | 5,065 (7.0%) |
Health Insurance Coverage by Citizenship Status in Grays Harbor County
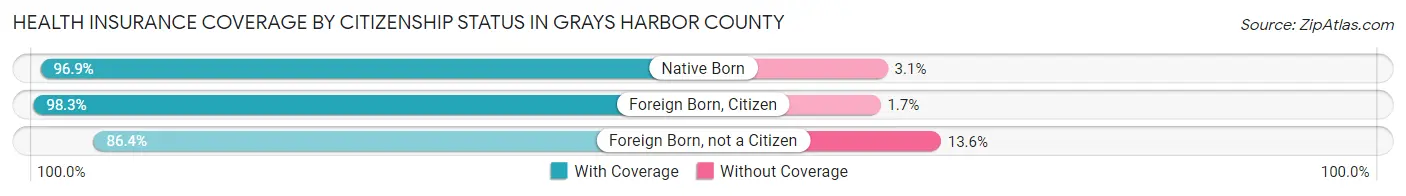
| Citizenship Status | With Coverage | Without Coverage |
| Native Born | 4,030 (96.9%) | 130 (3.1%) |
| Foreign Born, Citizen | 11,629 (98.3%) | 202 (1.7%) |
| Foreign Born, not a Citizen | 4,267 (86.4%) | 670 (13.6%) |
Health Insurance Coverage by Household Income in Grays Harbor County
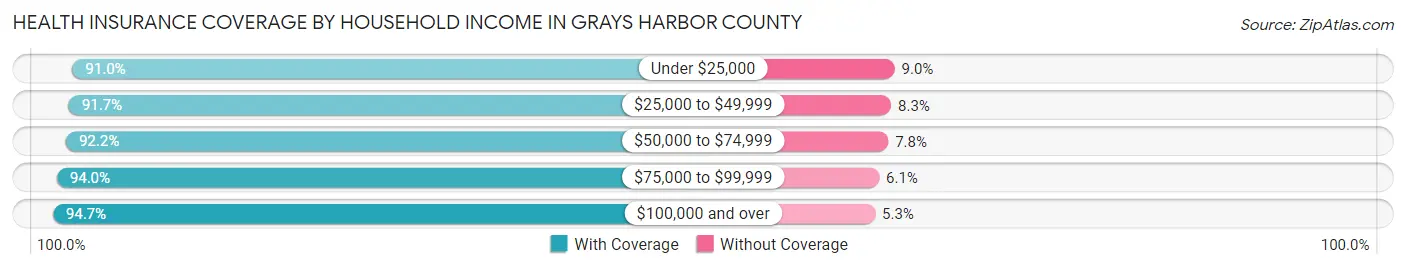
| Household Income | With Coverage | Without Coverage |
| Under $25,000 | 7,821 (91.0%) | 770 (9.0%) |
| $25,000 to $49,999 | 13,295 (91.7%) | 1,204 (8.3%) |
| $50,000 to $74,999 | 13,239 (92.2%) | 1,114 (7.8%) |
| $75,000 to $99,999 | 11,567 (94.0%) | 745 (6.0%) |
| $100,000 and over | 21,600 (94.7%) | 1,209 (5.3%) |
Public vs Private Health Insurance Coverage by Age in Grays Harbor County
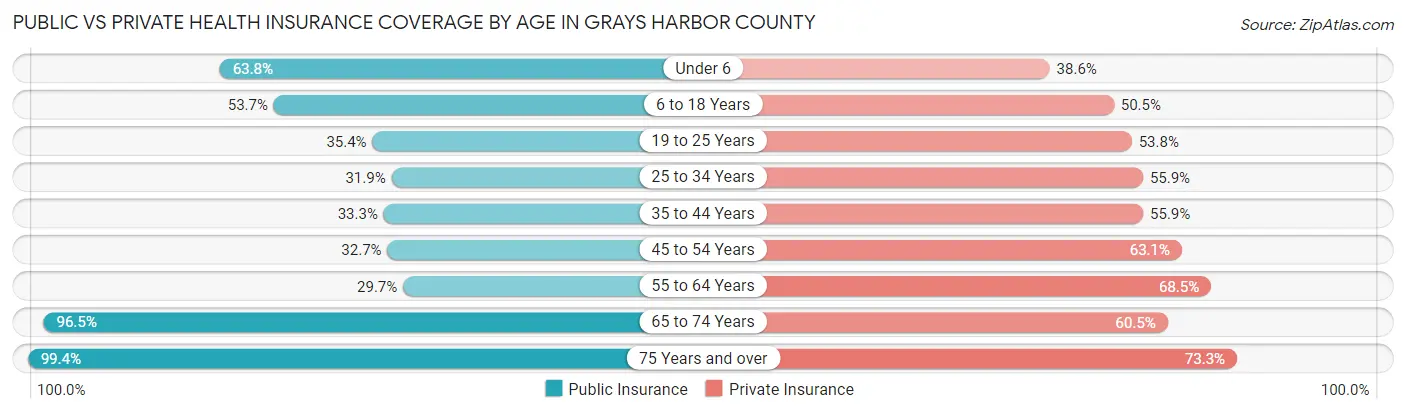
| Age Bracket | Public Insurance | Private Insurance |
| Under 6 | 2,653 (63.8%) | 1,605 (38.6%) |
| 6 to 18 Years | 6,358 (53.7%) | 5,972 (50.5%) |
| 19 to 25 Years | 1,749 (35.4%) | 2,657 (53.8%) |
| 25 to 34 Years | 2,436 (31.9%) | 4,269 (55.9%) |
| 35 to 44 Years | 2,737 (33.3%) | 4,592 (55.9%) |
| 45 to 54 Years | 2,746 (32.7%) | 5,305 (63.1%) |
| 55 to 64 Years | 3,300 (29.7%) | 7,605 (68.5%) |
| 65 to 74 Years | 10,264 (96.5%) | 6,434 (60.5%) |
| 75 Years and over | 5,868 (99.4%) | 4,329 (73.3%) |
| Total | 38,111 (52.3%) | 42,768 (58.7%) |
Disability Status by Sex by Age in Grays Harbor County
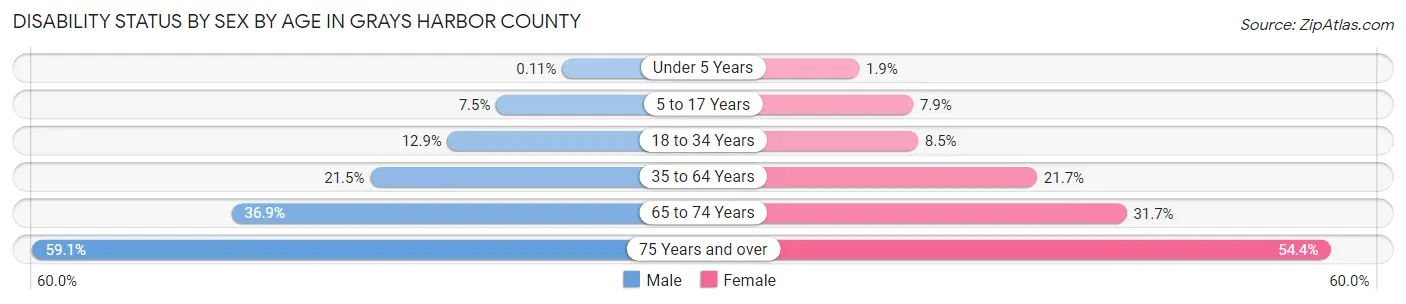
| Age Bracket | Male | Female |
| Under 5 Years | 2 (0.1%) | 35 (1.9%) |
| 5 to 17 Years | 442 (7.5%) | 445 (7.9%) |
| 18 to 34 Years | 922 (12.9%) | 528 (8.5%) |
| 35 to 64 Years | 2,946 (21.5%) | 3,045 (21.7%) |
| 65 to 74 Years | 1,900 (36.9%) | 1,742 (31.7%) |
| 75 Years and over | 1,634 (59.1%) | 1,707 (54.4%) |
Disability Class by Sex by Age in Grays Harbor County
Disability Class: Hearing Difficulty
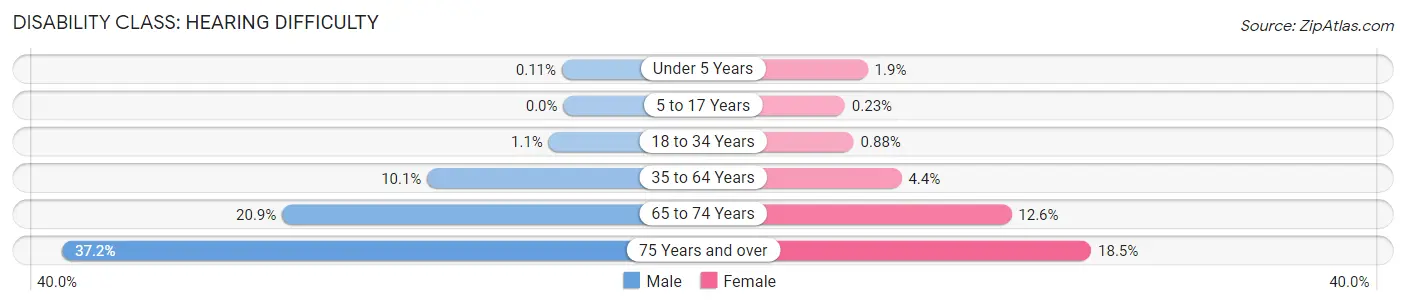
| Age Bracket | Male | Female |
| Under 5 Years | 2 (0.1%) | 35 (1.9%) |
| 5 to 17 Years | 0 (0.0%) | 13 (0.2%) |
| 18 to 34 Years | 78 (1.1%) | 55 (0.9%) |
| 35 to 64 Years | 1,385 (10.1%) | 621 (4.4%) |
| 65 to 74 Years | 1,074 (20.9%) | 692 (12.6%) |
| 75 Years and over | 1,029 (37.2%) | 581 (18.5%) |
Disability Class: Vision Difficulty
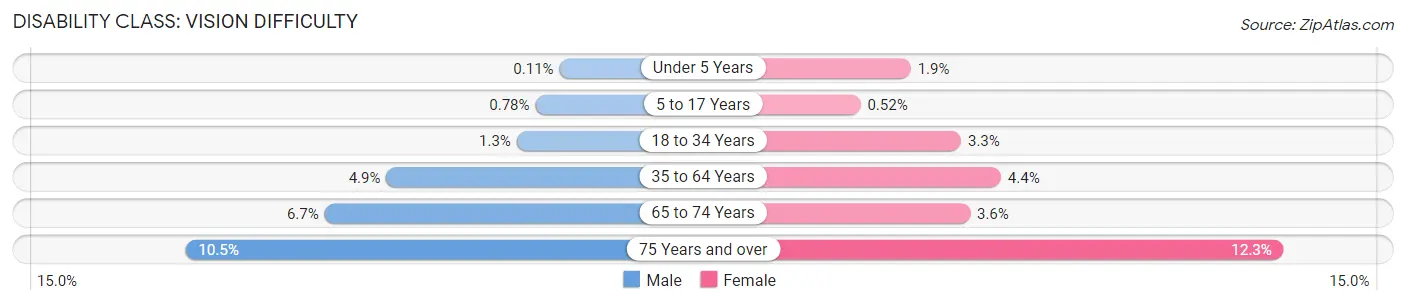
| Age Bracket | Male | Female |
| Under 5 Years | 2 (0.1%) | 35 (1.9%) |
| 5 to 17 Years | 46 (0.8%) | 29 (0.5%) |
| 18 to 34 Years | 93 (1.3%) | 207 (3.3%) |
| 35 to 64 Years | 675 (4.9%) | 620 (4.4%) |
| 65 to 74 Years | 342 (6.7%) | 196 (3.6%) |
| 75 Years and over | 291 (10.5%) | 386 (12.3%) |
Disability Class: Cognitive Difficulty
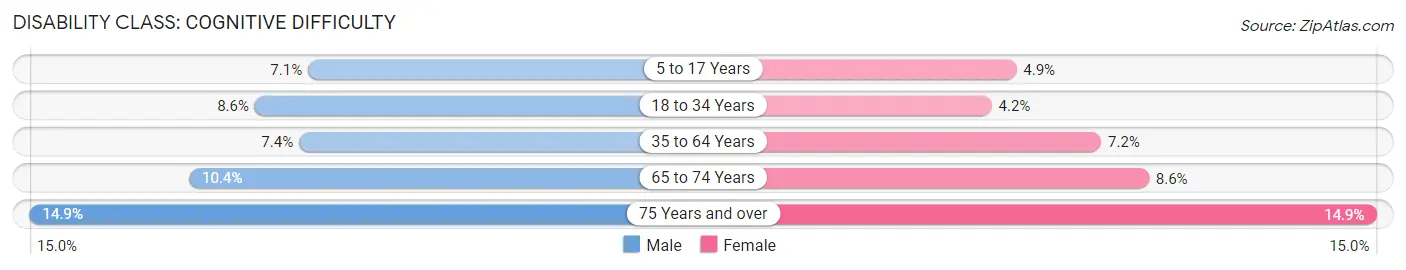
| Age Bracket | Male | Female |
| 5 to 17 Years | 421 (7.1%) | 273 (4.9%) |
| 18 to 34 Years | 615 (8.6%) | 260 (4.2%) |
| 35 to 64 Years | 1,009 (7.4%) | 1,011 (7.2%) |
| 65 to 74 Years | 536 (10.4%) | 470 (8.6%) |
| 75 Years and over | 411 (14.9%) | 467 (14.9%) |
Disability Class: Ambulatory Difficulty
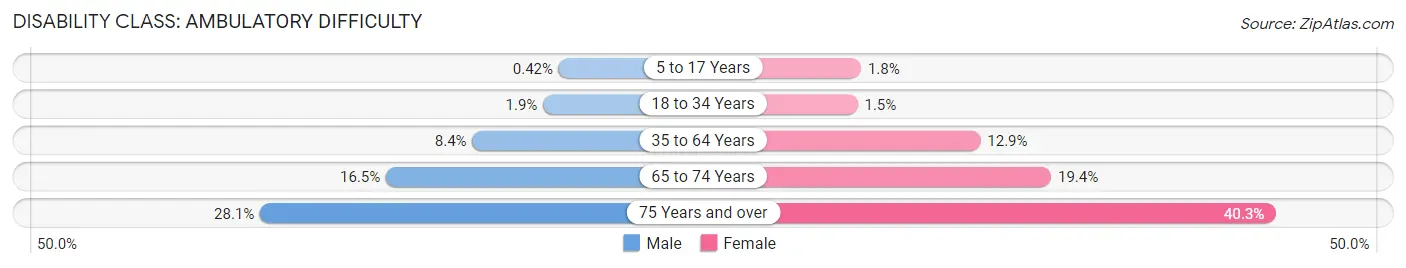
| Age Bracket | Male | Female |
| 5 to 17 Years | 25 (0.4%) | 100 (1.8%) |
| 18 to 34 Years | 134 (1.9%) | 91 (1.5%) |
| 35 to 64 Years | 1,157 (8.4%) | 1,802 (12.9%) |
| 65 to 74 Years | 846 (16.5%) | 1,067 (19.4%) |
| 75 Years and over | 778 (28.1%) | 1,265 (40.3%) |
Disability Class: Self-Care Difficulty
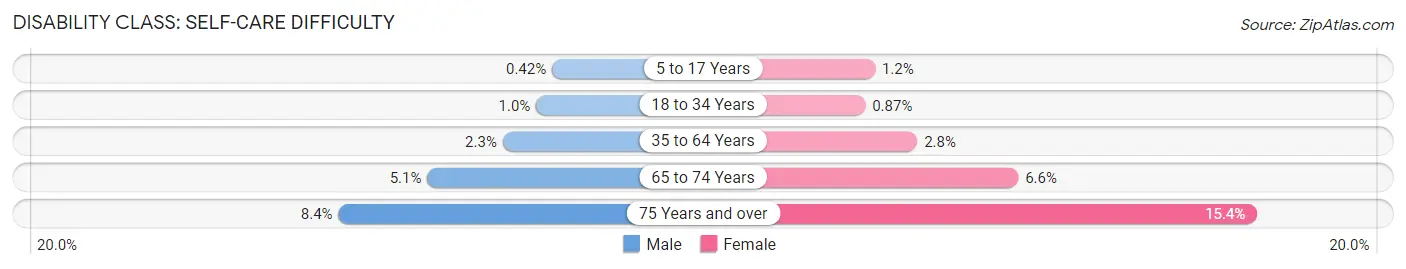
| Age Bracket | Male | Female |
| 5 to 17 Years | 25 (0.4%) | 69 (1.2%) |
| 18 to 34 Years | 72 (1.0%) | 54 (0.9%) |
| 35 to 64 Years | 309 (2.2%) | 392 (2.8%) |
| 65 to 74 Years | 260 (5.1%) | 360 (6.6%) |
| 75 Years and over | 231 (8.4%) | 484 (15.4%) |
Technology Access in Grays Harbor County
Computing Device Access in Grays Harbor County
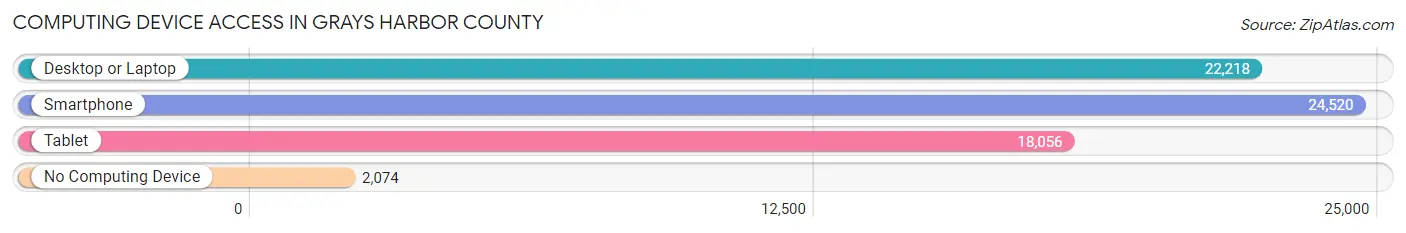
| Device Type | # Households | % Households |
| Desktop or Laptop | 22,218 | 75.2% |
| Smartphone | 24,520 | 83.0% |
| Tablet | 18,056 | 61.1% |
| No Computing Device | 2,074 | 7.0% |
| Total | 29,542 | 100.0% |
Internet Access in Grays Harbor County
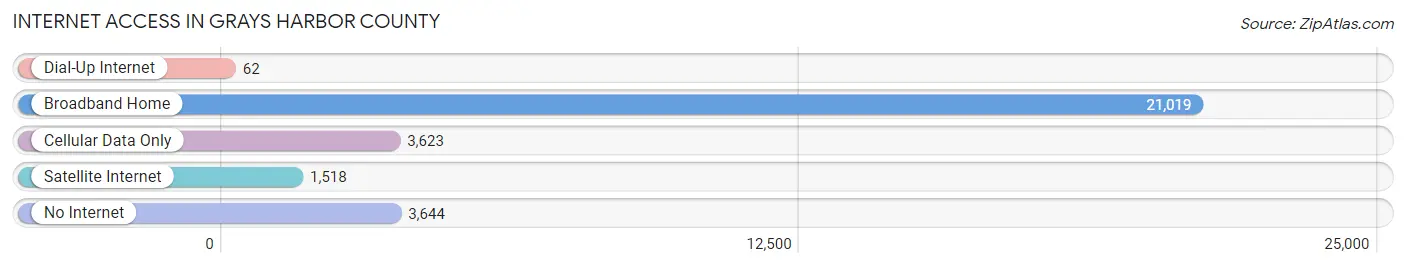
| Internet Type | # Households | % Households |
| Dial-Up Internet | 62 | 0.2% |
| Broadband Home | 21,019 | 71.2% |
| Cellular Data Only | 3,623 | 12.3% |
| Satellite Internet | 1,518 | 5.1% |
| No Internet | 3,644 | 12.3% |
| Total | 29,542 | 100.0% |
Grays Harbor County Summary
Grays Harbor County is located in the western part of Washington State, on the Pacific Ocean. It is bordered by Pacific County to the south, Mason County to the east, and Thurston County to the north. The county seat is Montesano, and the largest city is Aberdeen. The county was named after the Grays Harbor, which was named after Captain Robert Gray, an American sea captain who explored the area in 1792.
Geography
Grays Harbor County covers an area of 2,224 square miles, making it the fifth-largest county in Washington State. The county is located in the coastal lowlands of the Pacific Northwest, and is characterized by a rugged coastline, heavily forested hills, and numerous rivers and streams. The Chehalis River, which flows through the county, is the largest river in the county. The county is also home to several lakes, including Lake Quinault, Lake Sylvia, and Lake Cushman.
The climate of Grays Harbor County is generally mild and wet, with an average annual precipitation of over 50 inches. Summers are generally warm and dry, while winters are cool and wet.
Economy
Grays Harbor County has a diverse economy, with a mix of industries including timber, fishing, manufacturing, and tourism. The county is home to several large timber companies, including Weyerhaeuser and Simpson Timber. Fishing is also an important industry in the county, with salmon, crab, and other seafood being harvested from the waters of Grays Harbor.
Manufacturing is also an important part of the county's economy, with several large companies, such as Boeing and Microsoft, having operations in the county. Tourism is also an important part of the county's economy, with visitors coming to the area to enjoy the beaches, forests, and other attractions.
Demographics
As of the 2010 census, Grays Harbor County had a population of 72,797. The population is spread out, with the largest cities being Aberdeen (16,734), Hoquiam (8,726), and Montesano (3,976). The county is predominantly white (90.2%), with the remaining population being made up of African Americans (2.3%), Native Americans (1.7%), Asians (1.3%), and other races (4.5%).
The median household income in Grays Harbor County is $45,845, and the median family income is $54,845. The county has a poverty rate of 14.2%, which is higher than the national average.
Conclusion
Grays Harbor County is a diverse and vibrant county located in the western part of Washington State. The county is home to a variety of industries, including timber, fishing, manufacturing, and tourism. The county is predominantly white, with a median household income of $45,845 and a poverty rate of 14.2%. Grays Harbor County is a great place to live, work, and play, and is a great place to call home.
Common Questions
What is the Total Population of Grays Harbor County?
Total Population of Grays Harbor County is 75,672.
What is the Total Male Population of Grays Harbor County?
Total Male Population of Grays Harbor County is 39,090.
What is the Total Female Population of Grays Harbor County?
Total Female Population of Grays Harbor County is 36,582.
What is the Ratio of Males per 100 Females in Grays Harbor County?
There are 106.86 Males per 100 Females in Grays Harbor County.
What is the Ratio of Females per 100 Males in Grays Harbor County?
There are 93.58 Females per 100 Males in Grays Harbor County.
What is the Median Population Age in Grays Harbor County?
Median Population Age in Grays Harbor County is 44.4 Years.
What is the Average Family Size in Grays Harbor County
Average Family Size in Grays Harbor County is 3.1 People.
What is the Average Household Size in Grays Harbor County
Average Household Size in Grays Harbor County is 2.5 People.
What is Per Capita Income in Grays Harbor County?
Per Capita income in Grays Harbor County is $31,703.
What is the Median Family Income in Grays Harbor County?
Median Family Income in Grays Harbor County is $76,153.
What is the Median Household income in Grays Harbor County?
Median Household Income in Grays Harbor County is $59,105.
What is Income or Wage Gap in Grays Harbor County?
Income or Wage Gap in Grays Harbor County is 18.8%.
Women in Grays Harbor County earn 81.2 cents for every dollar earned by a man.
What is Family Income Deficit in Grays Harbor County?
Family Income Deficit in Grays Harbor County is $11,998.
Families that are below poverty line in Grays Harbor County earn $11,998 less on average than the poverty threshold level.
What is Inequality or Gini Index in Grays Harbor County?
Inequality or Gini Index in Grays Harbor County is 0.44.
How Large is the Labor Force in Grays Harbor County?
There are 31,382 People in the Labor Forcein in Grays Harbor County.
What is the Percentage of People in the Labor Force in Grays Harbor County?
50.4% of People are in the Labor Force in Grays Harbor County.
What is the Unemployment Rate in Grays Harbor County?
Unemployment Rate in Grays Harbor County is 6.4%.