Clallam County, WA
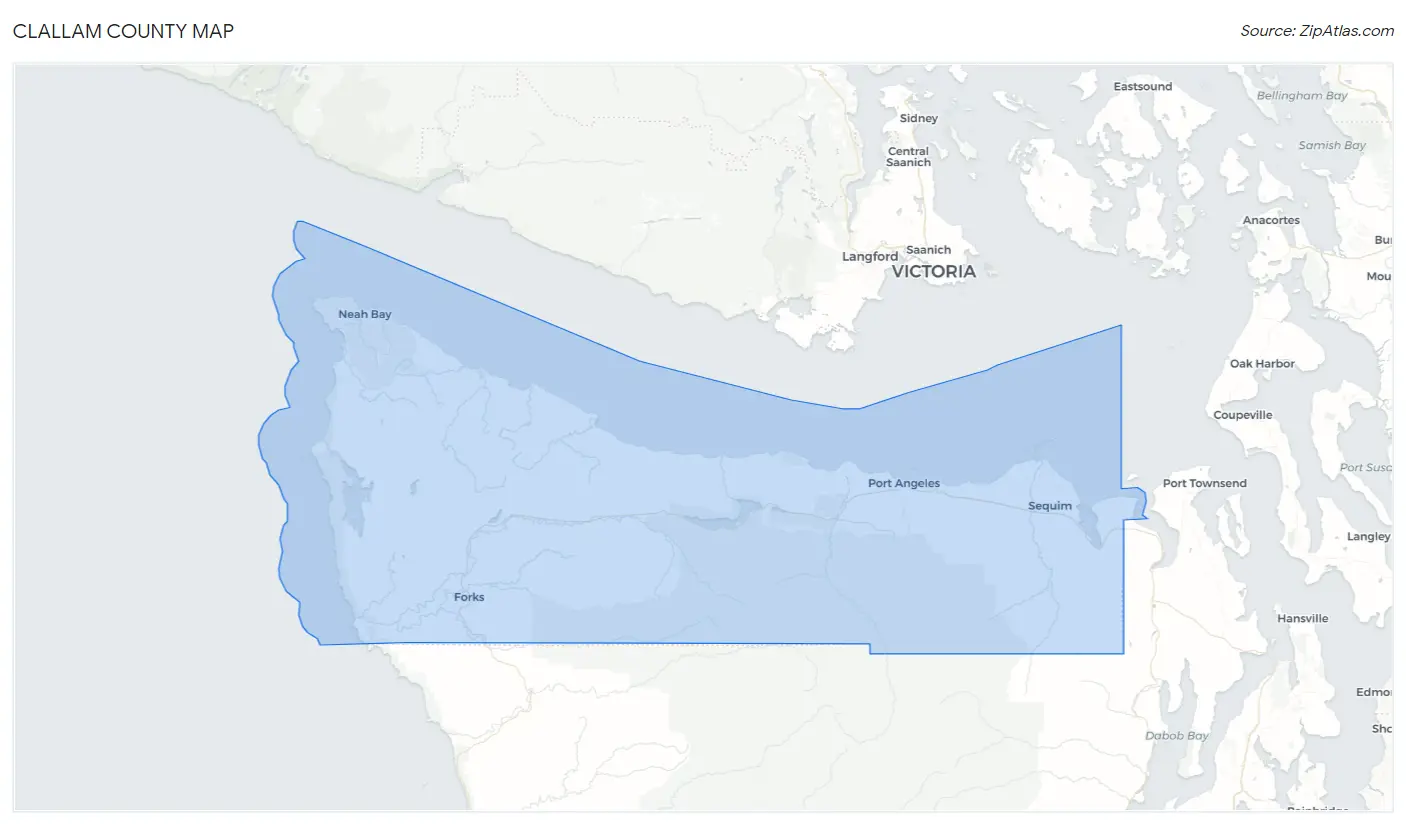
Clallam County Map
Clallam County Overview
77,333
TOTAL POPULATION
38,422
MALE POPULATION
38,911
FEMALE POPULATION
98.74
MALES / 100 FEMALES
101.27
FEMALES / 100 MALES
51.2
MEDIAN AGE
2.8
AVG FAMILY SIZE
2.2
AVG HOUSEHOLD SIZE
$38,181
PER CAPITA INCOME
$82,053
AVG FAMILY INCOME
$66,108
AVG HOUSEHOLD INCOME
29.0%
WAGE / INCOME GAP [ % ]
71.0¢/ $1
WAGE / INCOME GAP [ $ ]
$12,649
FAMILY INCOME DEFICIT
0.44
INEQUALITY / GINI INDEX
32,445
LABOR FORCE [ PEOPLE ]
49.1%
PERCENT IN LABOR FORCE
5.4%
UNEMPLOYMENT RATE
Clallam County Area Codes
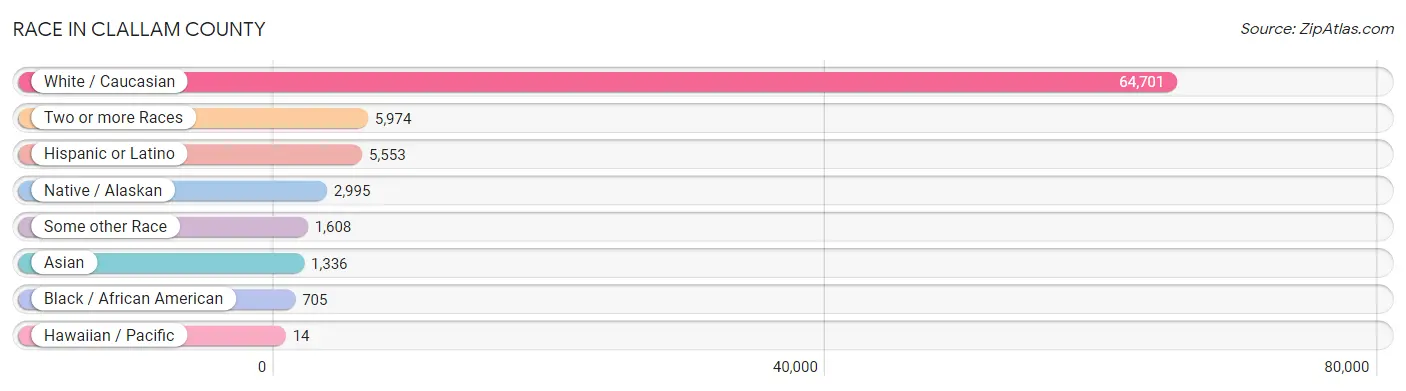
Race in Clallam County
The most populous races in Clallam County are White / Caucasian (64,701 | 83.7%), Two or more Races (5,974 | 7.7%), and Hispanic or Latino (5,553 | 7.2%).
| Race | # Population | % Population |
| Asian | 1,336 | 1.7% |
| Black / African American | 705 | 0.9% |
| Hawaiian / Pacific | 14 | 0.0% |
| Hispanic or Latino | 5,553 | 7.2% |
| Native / Alaskan | 2,995 | 3.9% |
| White / Caucasian | 64,701 | 83.7% |
| Two or more Races | 5,974 | 7.7% |
| Some other Race | 1,608 | 2.1% |
| Total | 77,333 | 100.0% |
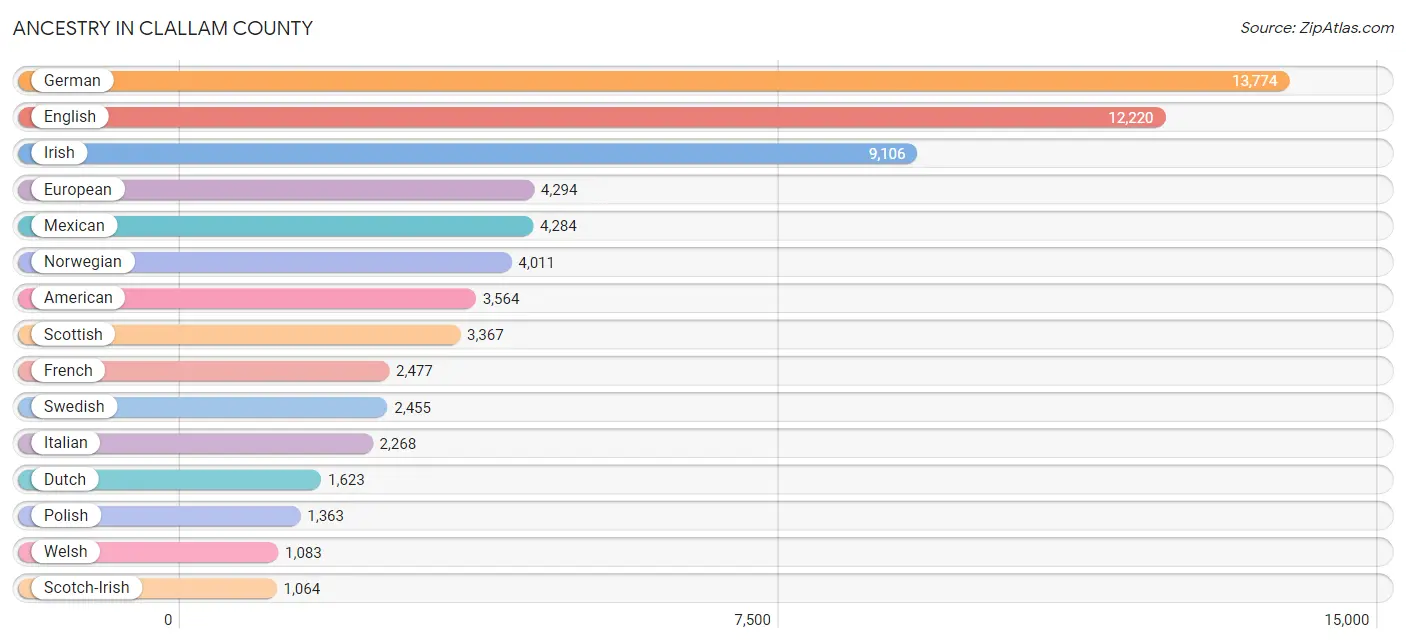
Ancestry in Clallam County
The most populous ancestries reported in Clallam County are German (13,774 | 17.8%), English (12,220 | 15.8%), Irish (9,106 | 11.8%), European (4,294 | 5.6%), and Mexican (4,284 | 5.5%), together accounting for 56.5% of all Clallam County residents.
| Ancestry | # Population | % Population |
| African | 24 | 0.0% |
| Alaska Native | 27 | 0.0% |
| Albanian | 56 | 0.1% |
| Aleut | 189 | 0.2% |
| American | 3,564 | 4.6% |
| Apache | 43 | 0.1% |
| Arab | 190 | 0.3% |
| Armenian | 30 | 0.0% |
| Australian | 9 | 0.0% |
| Austrian | 69 | 0.1% |
| Bahamian | 54 | 0.1% |
| Basque | 18 | 0.0% |
| Belgian | 46 | 0.1% |
| Bermudan | 11 | 0.0% |
| Bhutanese | 548 | 0.7% |
| Blackfeet | 98 | 0.1% |
| Bolivian | 25 | 0.0% |
| Brazilian | 27 | 0.0% |
| British | 864 | 1.1% |
| Burmese | 256 | 0.3% |
| Canadian | 178 | 0.2% |
| Carpatho Rusyn | 16 | 0.0% |
| Celtic | 7 | 0.0% |
| Central American | 369 | 0.5% |
| Central American Indian | 59 | 0.1% |
| Cherokee | 576 | 0.7% |
| Cheyenne | 21 | 0.0% |
| Chickasaw | 116 | 0.2% |
| Chilean | 17 | 0.0% |
| Chinese | 1 | 0.0% |
| Chippewa | 146 | 0.2% |
| Colombian | 41 | 0.1% |
| Colville | 7 | 0.0% |
| Costa Rican | 28 | 0.0% |
| Cree | 10 | 0.0% |
| Croatian | 123 | 0.2% |
| Cuban | 26 | 0.0% |
| Czech | 215 | 0.3% |
| Czechoslovakian | 43 | 0.1% |
| Danish | 516 | 0.7% |
| Delaware | 14 | 0.0% |
| Dominican | 76 | 0.1% |
| Dutch | 1,623 | 2.1% |
| Dutch West Indian | 10 | 0.0% |
| Eastern European | 189 | 0.2% |
| Ecuadorian | 83 | 0.1% |
| Egyptian | 36 | 0.1% |
| English | 12,220 | 15.8% |
| Ethiopian | 29 | 0.0% |
| European | 4,294 | 5.6% |
| Finnish | 511 | 0.7% |
| French | 2,477 | 3.2% |
| French American Indian | 157 | 0.2% |
| French Canadian | 557 | 0.7% |
| German | 13,774 | 17.8% |
| Greek | 96 | 0.1% |
| Guamanian / Chamorro | 4 | 0.0% |
| Guatemalan | 100 | 0.1% |
| Haitian | 19 | 0.0% |
| Honduran | 82 | 0.1% |
| Hungarian | 228 | 0.3% |
| Icelander | 28 | 0.0% |
| Indian (Asian) | 479 | 0.6% |
| Indonesian | 67 | 0.1% |
| Inupiat | 5 | 0.0% |
| Iranian | 26 | 0.0% |
| Irish | 9,106 | 11.8% |
| Iroquois | 11 | 0.0% |
| Israeli | 5 | 0.0% |
| Italian | 2,268 | 2.9% |
| Jamaican | 26 | 0.0% |
| Japanese | 51 | 0.1% |
| Kiowa | 8 | 0.0% |
| Korean | 590 | 0.8% |
| Laotian | 42 | 0.1% |
| Latvian | 18 | 0.0% |
| Lebanese | 32 | 0.0% |
| Lithuanian | 48 | 0.1% |
| Luxembourger | 10 | 0.0% |
| Malaysian | 67 | 0.1% |
| Maltese | 8 | 0.0% |
| Mexican | 4,284 | 5.5% |
| Mexican American Indian | 53 | 0.1% |
| Native Hawaiian | 121 | 0.2% |
| Navajo | 67 | 0.1% |
| New Zealander | 8 | 0.0% |
| Nicaraguan | 83 | 0.1% |
| Nigerian | 43 | 0.1% |
| Northern European | 361 | 0.5% |
| Norwegian | 4,011 | 5.2% |
| Ottawa | 5 | 0.0% |
| Pakistani | 48 | 0.1% |
| Panamanian | 15 | 0.0% |
| Pennsylvania German | 52 | 0.1% |
| Polish | 1,363 | 1.8% |
| Portuguese | 340 | 0.4% |
| Pueblo | 3 | 0.0% |
| Puerto Rican | 136 | 0.2% |
| Puget Sound Salish | 174 | 0.2% |
| Romanian | 120 | 0.2% |
| Russian | 549 | 0.7% |
| Salvadoran | 61 | 0.1% |
| Samoan | 13 | 0.0% |
| Scandinavian | 1,005 | 1.3% |
| Scotch-Irish | 1,064 | 1.4% |
| Scottish | 3,367 | 4.3% |
| Seminole | 36 | 0.1% |
| Serbian | 22 | 0.0% |
| Shoshone | 7 | 0.0% |
| Sioux | 138 | 0.2% |
| Slavic | 63 | 0.1% |
| Slovak | 84 | 0.1% |
| Slovene | 43 | 0.1% |
| Somali | 9 | 0.0% |
| South American | 195 | 0.3% |
| South American Indian | 9 | 0.0% |
| Spaniard | 255 | 0.3% |
| Spanish | 140 | 0.2% |
| Spanish American | 11 | 0.0% |
| Sri Lankan | 107 | 0.1% |
| Subsaharan African | 123 | 0.2% |
| Swedish | 2,455 | 3.2% |
| Swiss | 521 | 0.7% |
| Syrian | 27 | 0.0% |
| Thai | 296 | 0.4% |
| Tlingit-Haida | 104 | 0.1% |
| Trinidadian and Tobagonian | 10 | 0.0% |
| Turkish | 143 | 0.2% |
| Ukrainian | 297 | 0.4% |
| Venezuelan | 18 | 0.0% |
| Welsh | 1,083 | 1.4% |
| Yakama | 3 | 0.0% |
| Yaqui | 41 | 0.1% |
| Yugoslavian | 24 | 0.0% |
| Yup'ik | 12 | 0.0% | View All 135 Rows |
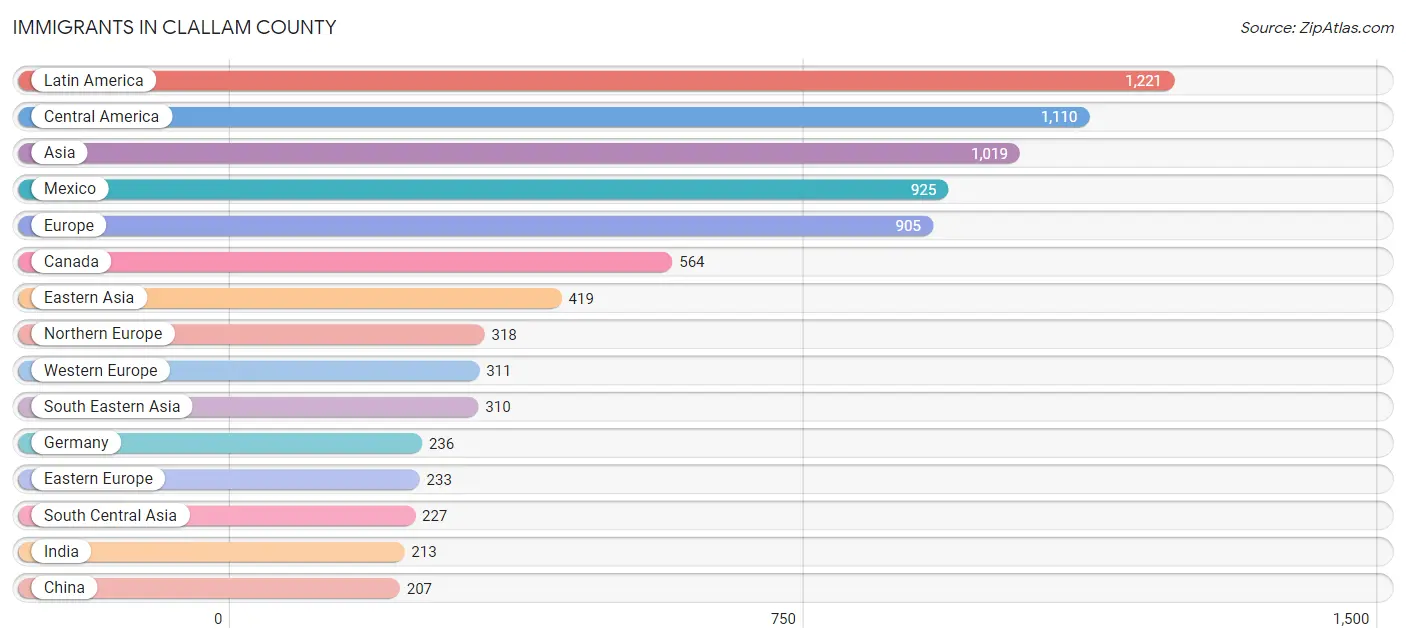
Immigrants in Clallam County
The most numerous immigrant groups reported in Clallam County came from Latin America (1,221 | 1.6%), Central America (1,110 | 1.4%), Asia (1,019 | 1.3%), Mexico (925 | 1.2%), and Europe (905 | 1.2%), together accounting for 6.7% of all Clallam County residents.
| Immigration Origin | # Population | % Population |
| Africa | 87 | 0.1% |
| Albania | 44 | 0.1% |
| Argentina | 9 | 0.0% |
| Asia | 1,019 | 1.3% |
| Bahamas | 14 | 0.0% |
| Belgium | 11 | 0.0% |
| Brazil | 16 | 0.0% |
| Cambodia | 10 | 0.0% |
| Canada | 564 | 0.7% |
| Caribbean | 64 | 0.1% |
| Central America | 1,110 | 1.4% |
| Chile | 17 | 0.0% |
| China | 207 | 0.3% |
| Colombia | 5 | 0.0% |
| Costa Rica | 23 | 0.0% |
| Denmark | 12 | 0.0% |
| Dominican Republic | 13 | 0.0% |
| Eastern Africa | 47 | 0.1% |
| Eastern Asia | 419 | 0.5% |
| Eastern Europe | 233 | 0.3% |
| Egypt | 14 | 0.0% |
| El Salvador | 2 | 0.0% |
| England | 163 | 0.2% |
| Ethiopia | 29 | 0.0% |
| Europe | 905 | 1.2% |
| Germany | 236 | 0.3% |
| Guatemala | 78 | 0.1% |
| Haiti | 19 | 0.0% |
| Honduras | 63 | 0.1% |
| Hungary | 12 | 0.0% |
| India | 213 | 0.3% |
| Indonesia | 12 | 0.0% |
| Iran | 14 | 0.0% |
| Ireland | 2 | 0.0% |
| Israel | 13 | 0.0% |
| Italy | 12 | 0.0% |
| Jamaica | 8 | 0.0% |
| Japan | 130 | 0.2% |
| Korea | 82 | 0.1% |
| Latin America | 1,221 | 1.6% |
| Lithuania | 9 | 0.0% |
| Malaysia | 23 | 0.0% |
| Mexico | 925 | 1.2% |
| Moldova | 11 | 0.0% |
| Netherlands | 64 | 0.1% |
| Nicaragua | 14 | 0.0% |
| Nigeria | 13 | 0.0% |
| Northern Africa | 14 | 0.0% |
| Northern Europe | 318 | 0.4% |
| Norway | 13 | 0.0% |
| Oceania | 71 | 0.1% |
| Panama | 5 | 0.0% |
| Philippines | 157 | 0.2% |
| Poland | 30 | 0.0% |
| Romania | 13 | 0.0% |
| Russia | 23 | 0.0% |
| Scotland | 13 | 0.0% |
| Somalia | 9 | 0.0% |
| South Africa | 4 | 0.0% |
| South America | 47 | 0.1% |
| South Central Asia | 227 | 0.3% |
| South Eastern Asia | 310 | 0.4% |
| Southern Europe | 43 | 0.1% |
| Spain | 31 | 0.0% |
| Sweden | 27 | 0.0% |
| Syria | 9 | 0.0% |
| Taiwan | 50 | 0.1% |
| Thailand | 46 | 0.1% |
| Trinidad and Tobago | 10 | 0.0% |
| Ukraine | 4 | 0.0% |
| Vietnam | 62 | 0.1% |
| Western Africa | 13 | 0.0% |
| Western Asia | 22 | 0.0% |
| Western Europe | 311 | 0.4% |
| Zimbabwe | 9 | 0.0% | View All 75 Rows |
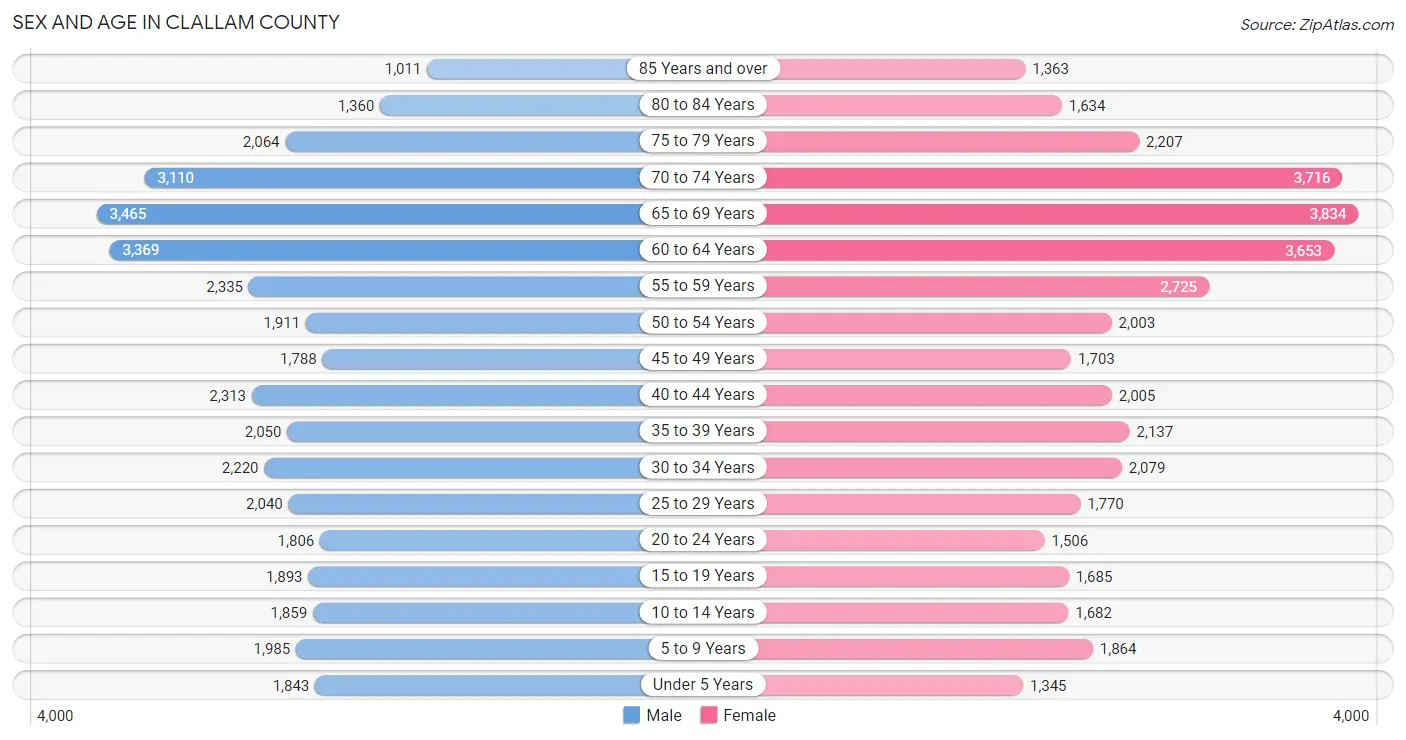
Sex and Age in Clallam County
Sex and Age in Clallam County
The most populous age groups in Clallam County are 65 to 69 Years (3,465 | 9.0%) for men and 65 to 69 Years (3,834 | 9.9%) for women.
| Age Bracket | Male | Female |
| Under 5 Years | 1,843 (4.8%) | 1,345 (3.5%) |
| 5 to 9 Years | 1,985 (5.2%) | 1,864 (4.8%) |
| 10 to 14 Years | 1,859 (4.8%) | 1,682 (4.3%) |
| 15 to 19 Years | 1,893 (4.9%) | 1,685 (4.3%) |
| 20 to 24 Years | 1,806 (4.7%) | 1,506 (3.9%) |
| 25 to 29 Years | 2,040 (5.3%) | 1,770 (4.5%) |
| 30 to 34 Years | 2,220 (5.8%) | 2,079 (5.3%) |
| 35 to 39 Years | 2,050 (5.3%) | 2,137 (5.5%) |
| 40 to 44 Years | 2,313 (6.0%) | 2,005 (5.1%) |
| 45 to 49 Years | 1,788 (4.6%) | 1,703 (4.4%) |
| 50 to 54 Years | 1,911 (5.0%) | 2,003 (5.1%) |
| 55 to 59 Years | 2,335 (6.1%) | 2,725 (7.0%) |
| 60 to 64 Years | 3,369 (8.8%) | 3,653 (9.4%) |
| 65 to 69 Years | 3,465 (9.0%) | 3,834 (9.9%) |
| 70 to 74 Years | 3,110 (8.1%) | 3,716 (9.6%) |
| 75 to 79 Years | 2,064 (5.4%) | 2,207 (5.7%) |
| 80 to 84 Years | 1,360 (3.5%) | 1,634 (4.2%) |
| 85 Years and over | 1,011 (2.6%) | 1,363 (3.5%) |
| Total | 38,422 (100.0%) | 38,911 (100.0%) |
Families and Households in Clallam County
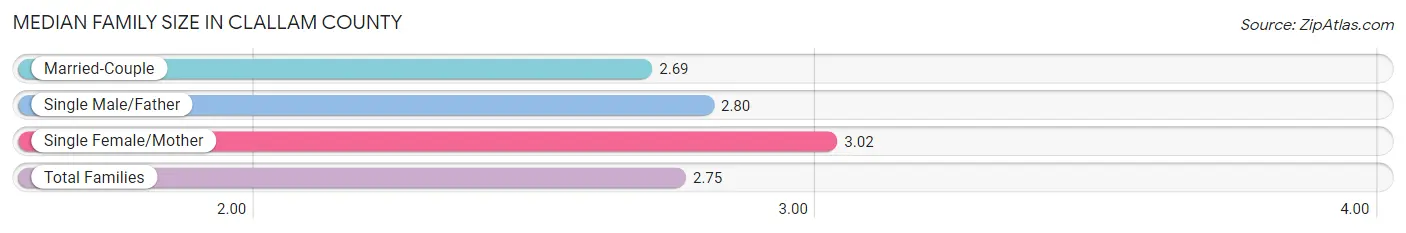
Median Family Size in Clallam County
The median family size in Clallam County is 2.75 persons per family, with single female/mother families (3,282 | 15.5%) accounting for the largest median family size of 3.02 persons per family. On the other hand, married-couple families (16,484 | 78.1%) represent the smallest median family size with 2.69 persons per family.
| Family Type | # Families | Family Size |
| Married-Couple | 16,484 (78.1%) | 2.69 |
| Single Male/Father | 1,338 (6.3%) | 2.80 |
| Single Female/Mother | 3,282 (15.5%) | 3.02 |
| Total Families | 21,104 (100.0%) | 2.75 |
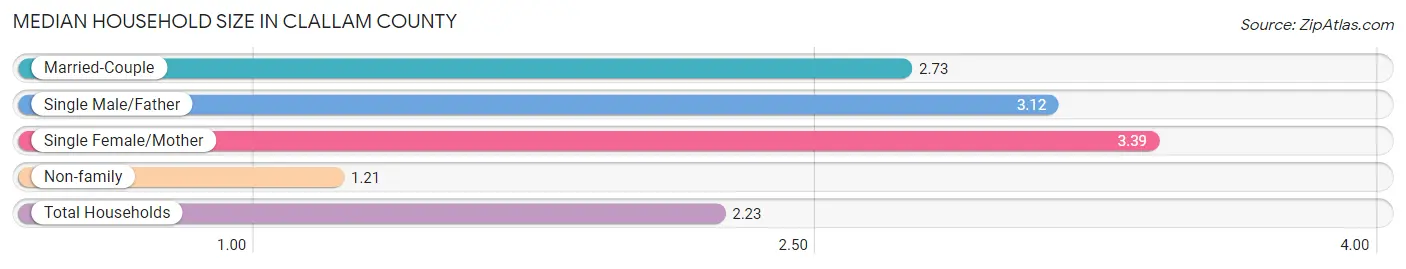
Median Household Size in Clallam County
The median household size in Clallam County is 2.23 persons per household, with single female/mother households (3,282 | 9.6%) accounting for the largest median household size of 3.39 persons per household. non-family households (13,024 | 38.2%) represent the smallest median household size with 1.21 persons per household.
| Household Type | # Households | Household Size |
| Married-Couple | 16,484 (48.3%) | 2.73 |
| Single Male/Father | 1,338 (3.9%) | 3.12 |
| Single Female/Mother | 3,282 (9.6%) | 3.39 |
| Non-family | 13,024 (38.2%) | 1.21 |
| Total Households | 34,128 (100.0%) | 2.23 |
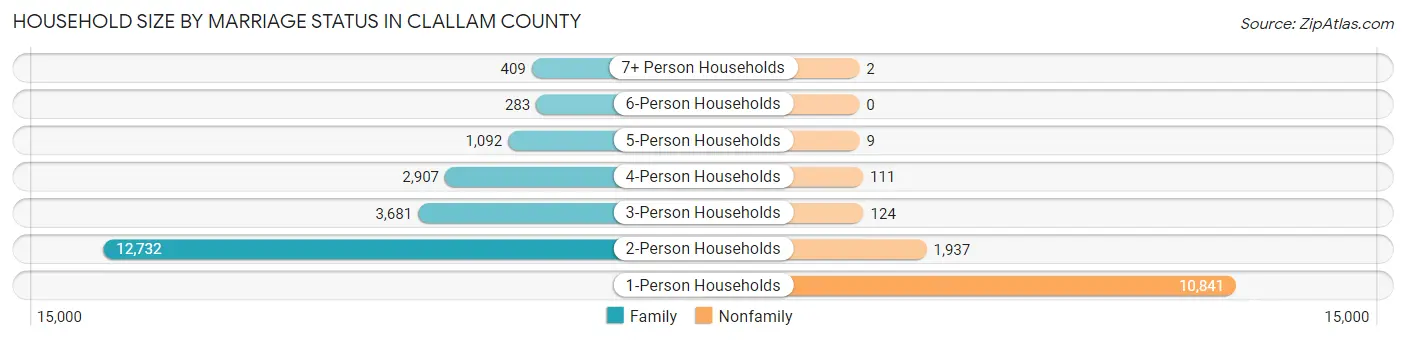
Household Size by Marriage Status in Clallam County
Out of a total of 34,128 households in Clallam County, 21,104 (61.8%) are family households, while 13,024 (38.2%) are nonfamily households. The most numerous type of family households are 2-person households, comprising 12,732, and the most common type of nonfamily households are 1-person households, comprising 10,841.
| Household Size | Family Households | Nonfamily Households |
| 1-Person Households | - | 10,841 (31.8%) |
| 2-Person Households | 12,732 (37.3%) | 1,937 (5.7%) |
| 3-Person Households | 3,681 (10.8%) | 124 (0.4%) |
| 4-Person Households | 2,907 (8.5%) | 111 (0.3%) |
| 5-Person Households | 1,092 (3.2%) | 9 (0.0%) |
| 6-Person Households | 283 (0.8%) | 0 (0.0%) |
| 7+ Person Households | 409 (1.2%) | 2 (0.0%) |
| Total | 21,104 (61.8%) | 13,024 (38.2%) |
Female Fertility in Clallam County
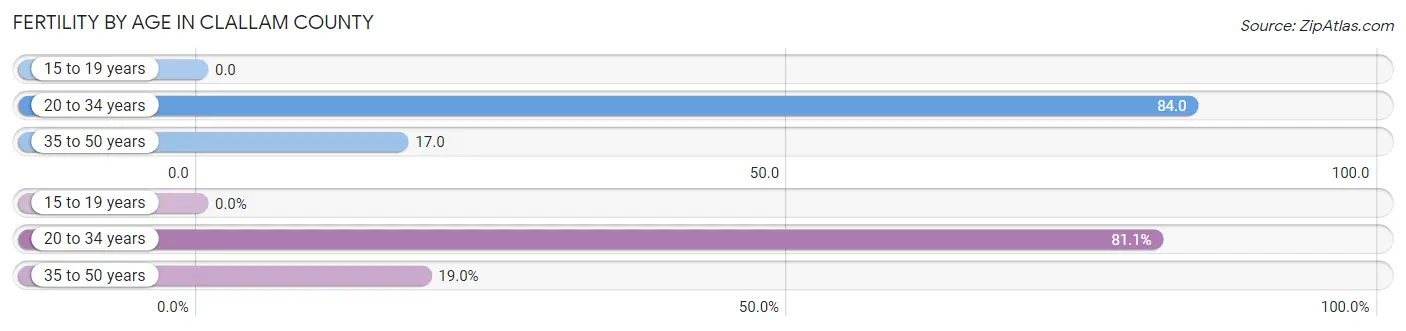
Fertility by Age in Clallam County
Average fertility rate in Clallam County is 42.0 births per 1,000 women. Women in the age bracket of 20 to 34 years have the highest fertility rate with 84.0 births per 1,000 women. Women in the age bracket of 20 to 34 years acount for 81.0% of all women with births.
| Age Bracket | Women with Births | Births / 1,000 Women |
| 15 to 19 years | 0 (0.0%) | 0.0 |
| 20 to 34 years | 449 (81.0%) | 84.0 |
| 35 to 50 years | 105 (19.0%) | 17.0 |
| Total | 554 (100.0%) | 42.0 |
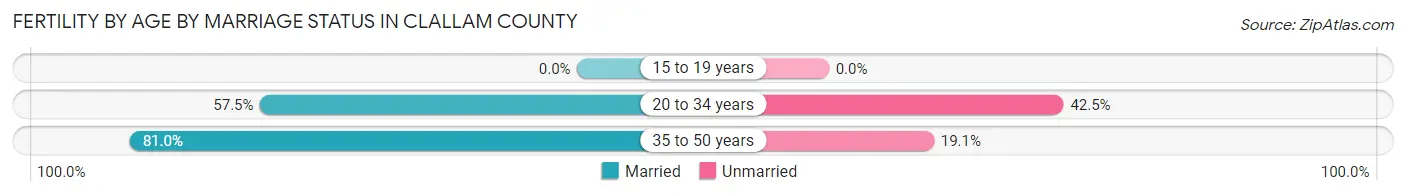
Fertility by Age by Marriage Status in Clallam County
61.9% of women with births (554) in Clallam County are married. The highest percentage of unmarried women with births falls into 20 to 34 years age bracket with 42.5% of them unmarried at the time of birth, while the lowest percentage of unmarried women with births belong to 35 to 50 years age bracket with 19.1% of them unmarried.
| Age Bracket | Married | Unmarried |
| 15 to 19 years | 0 (0.0%) | 0 (0.0%) |
| 20 to 34 years | 258 (57.5%) | 191 (42.5%) |
| 35 to 50 years | 85 (80.9%) | 20 (19.1%) |
| Total | 343 (61.9%) | 211 (38.1%) |
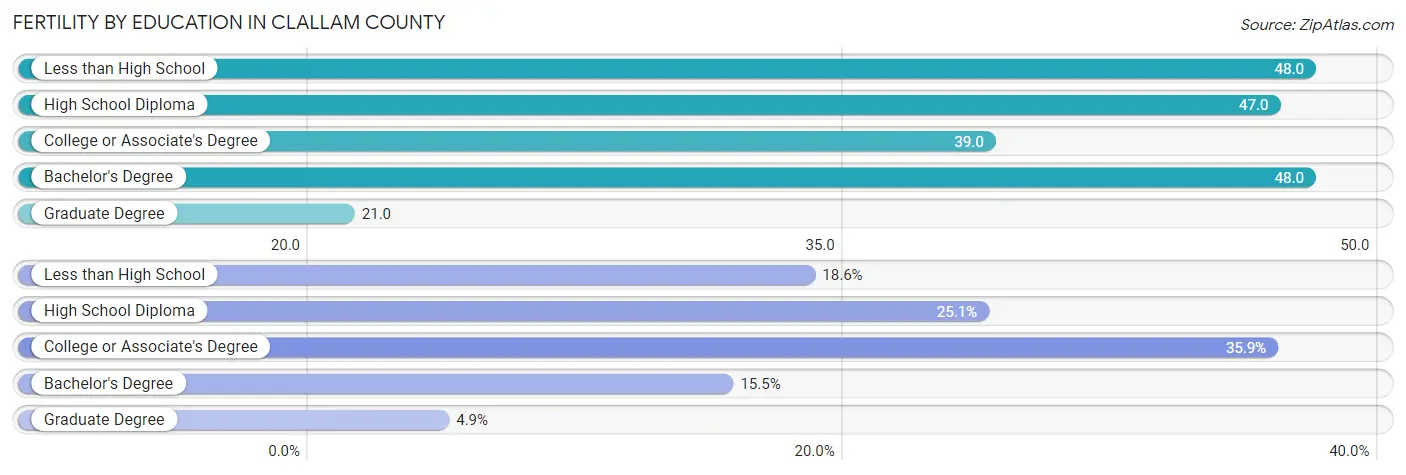
Fertility by Education in Clallam County
Average fertility rate in Clallam County is 42.0 births per 1,000 women. Women with the education attainment of less than high school have the highest fertility rate of 48.0 births per 1,000 women, while women with the education attainment of graduate degree have the lowest fertility at 21.0 births per 1,000 women. Women with the education attainment of college or associate's degree represent 35.9% of all women with births.
| Educational Attainment | Women with Births | Births / 1,000 Women |
| Less than High School | 103 (18.6%) | 48.0 |
| High School Diploma | 139 (25.1%) | 47.0 |
| College or Associate's Degree | 199 (35.9%) | 39.0 |
| Bachelor's Degree | 86 (15.5%) | 48.0 |
| Graduate Degree | 27 (4.9%) | 21.0 |
| Total | 554 (100.0%) | 42.0 |
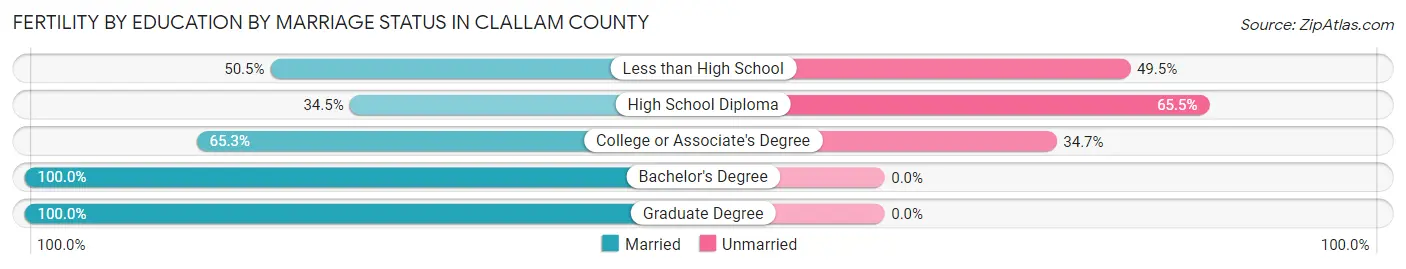
Fertility by Education by Marriage Status in Clallam County
38.1% of women with births in Clallam County are unmarried. Women with the educational attainment of bachelor's degree are most likely to be married with 100.0% of them married at childbirth, while women with the educational attainment of high school diploma are least likely to be married with 65.5% of them unmarried at childbirth.
| Educational Attainment | Married | Unmarried |
| Less than High School | 52 (50.5%) | 51 (49.5%) |
| High School Diploma | 48 (34.5%) | 91 (65.5%) |
| College or Associate's Degree | 130 (65.3%) | 69 (34.7%) |
| Bachelor's Degree | 86 (100.0%) | 0 (0.0%) |
| Graduate Degree | 27 (100.0%) | 0 (0.0%) |
| Total | 343 (61.9%) | 211 (38.1%) |
Income in Clallam County
Income Overview in Clallam County
Per Capita Income in Clallam County is $38,181, while median incomes of families and households are $82,053 and $66,108 respectively.
| Characteristic | Number | Measure |
| Per Capita Income | 77,333 | $38,181 |
| Median Family Income | 21,104 | $82,053 |
| Mean Family Income | 21,104 | $100,293 |
| Median Household Income | 34,128 | $66,108 |
| Mean Household Income | 34,128 | $84,791 |
| Income Deficit | 21,104 | $12,649 |
| Wage / Income Gap (%) | 77,333 | 29.03% |
| Wage / Income Gap ($) | 77,333 | 70.97¢ per $1 |
| Gini / Inequality Index | 77,333 | 0.44 |
Earnings by Sex in Clallam County
Average Earnings in Clallam County are $38,027, $45,108 for men and $32,014 for women, a difference of 29.0%.
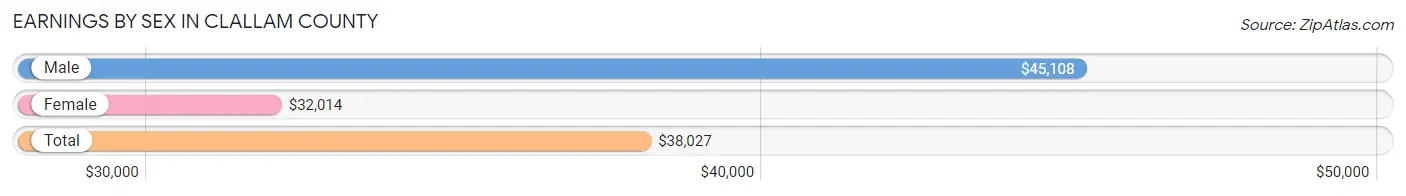
| Sex | Number | Average Earnings |
| Male | 18,276 (52.4%) | $45,108 |
| Female | 16,575 (47.6%) | $32,014 |
| Total | 34,851 (100.0%) | $38,027 |
Earnings by Sex by Income Bracket in Clallam County
The most common earnings brackets in Clallam County are $100,000+ for men (2,627 | 14.4%) and $75,000 to $99,999 for women (1,444 | 8.7%).
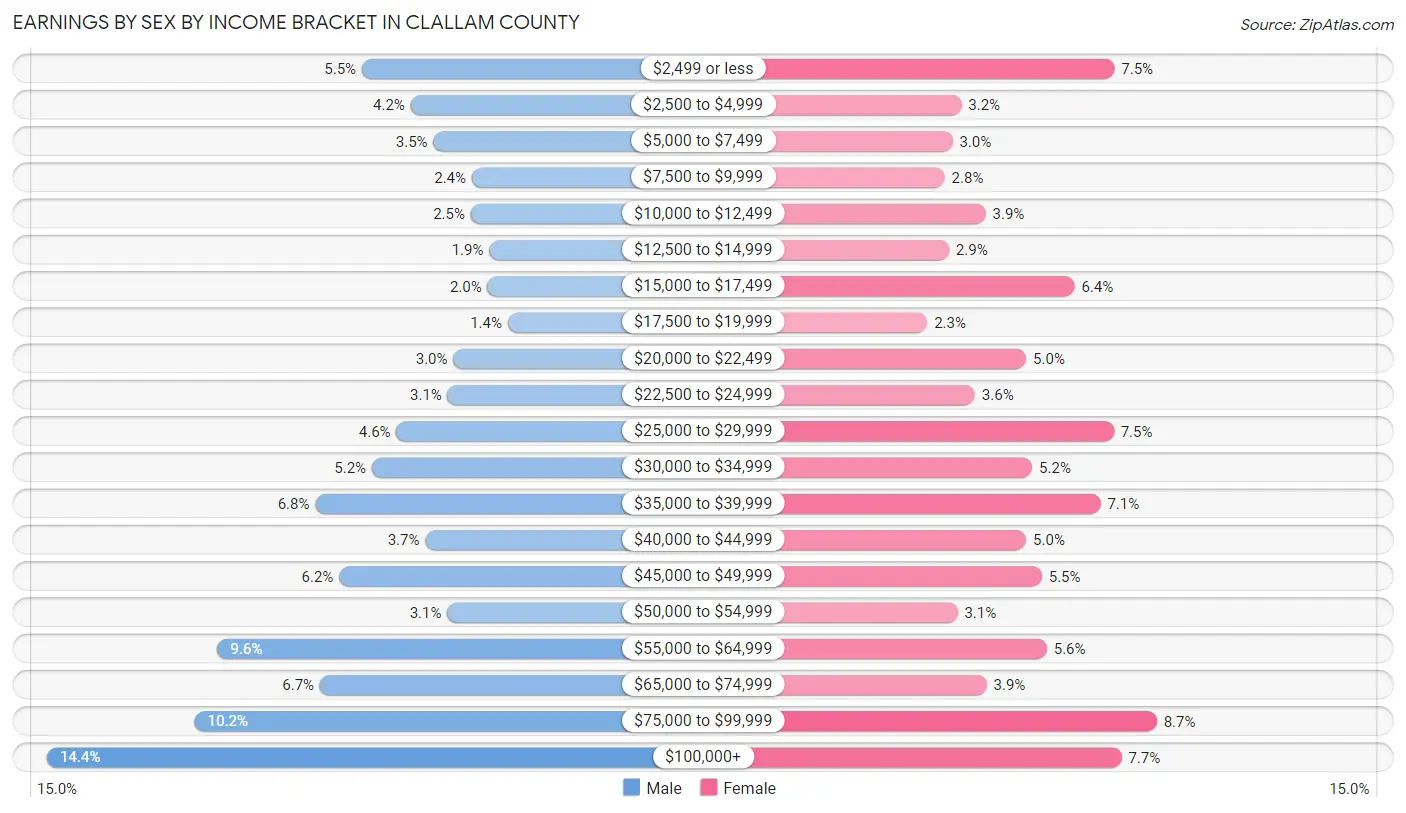
| Income | Male | Female |
| $2,499 or less | 1,008 (5.5%) | 1,247 (7.5%) |
| $2,500 to $4,999 | 759 (4.2%) | 534 (3.2%) |
| $5,000 to $7,499 | 641 (3.5%) | 493 (3.0%) |
| $7,500 to $9,999 | 444 (2.4%) | 455 (2.8%) |
| $10,000 to $12,499 | 450 (2.5%) | 647 (3.9%) |
| $12,500 to $14,999 | 354 (1.9%) | 475 (2.9%) |
| $15,000 to $17,499 | 363 (2.0%) | 1,061 (6.4%) |
| $17,500 to $19,999 | 260 (1.4%) | 375 (2.3%) |
| $20,000 to $22,499 | 540 (2.9%) | 835 (5.0%) |
| $22,500 to $24,999 | 569 (3.1%) | 597 (3.6%) |
| $25,000 to $29,999 | 831 (4.5%) | 1,243 (7.5%) |
| $30,000 to $34,999 | 958 (5.2%) | 864 (5.2%) |
| $35,000 to $39,999 | 1,249 (6.8%) | 1,182 (7.1%) |
| $40,000 to $44,999 | 683 (3.7%) | 836 (5.0%) |
| $45,000 to $49,999 | 1,126 (6.2%) | 908 (5.5%) |
| $50,000 to $54,999 | 570 (3.1%) | 516 (3.1%) |
| $55,000 to $64,999 | 1,751 (9.6%) | 931 (5.6%) |
| $65,000 to $74,999 | 1,225 (6.7%) | 652 (3.9%) |
| $75,000 to $99,999 | 1,868 (10.2%) | 1,444 (8.7%) |
| $100,000+ | 2,627 (14.4%) | 1,280 (7.7%) |
| Total | 18,276 (100.0%) | 16,575 (100.0%) |
Earnings by Sex by Educational Attainment in Clallam County
Average earnings in Clallam County are $48,598 for men and $36,332 for women, a difference of 25.2%. Men with an educational attainment of graduate degree enjoy the highest average annual earnings of $82,034, while those with less than high school education earn the least with $34,771. Women with an educational attainment of graduate degree earn the most with the average annual earnings of $69,091, while those with less than high school education have the smallest earnings of $26,967.
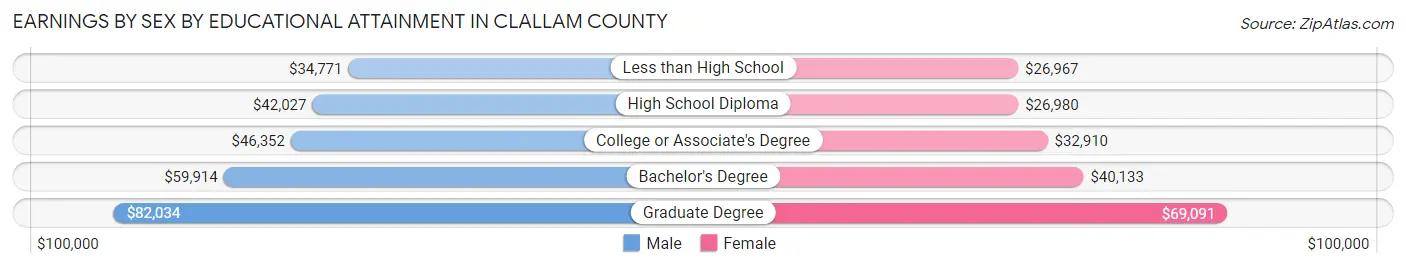
| Educational Attainment | Male Income | Female Income |
| Less than High School | $34,771 | $26,967 |
| High School Diploma | $42,027 | $26,980 |
| College or Associate's Degree | $46,352 | $32,910 |
| Bachelor's Degree | $59,914 | $40,133 |
| Graduate Degree | $82,034 | $69,091 |
| Total | $48,598 | $36,332 |
Family Income in Clallam County
Family Income Brackets in Clallam County
According to the Clallam County family income data, there are 4,263 families falling into the $100,000 to $149,999 income range, which is the most common income bracket and makes up 20.2% of all families. Conversely, the $10,000 to $14,999 income bracket is the least frequent group with only 211 families (1.0%) belonging to this category.
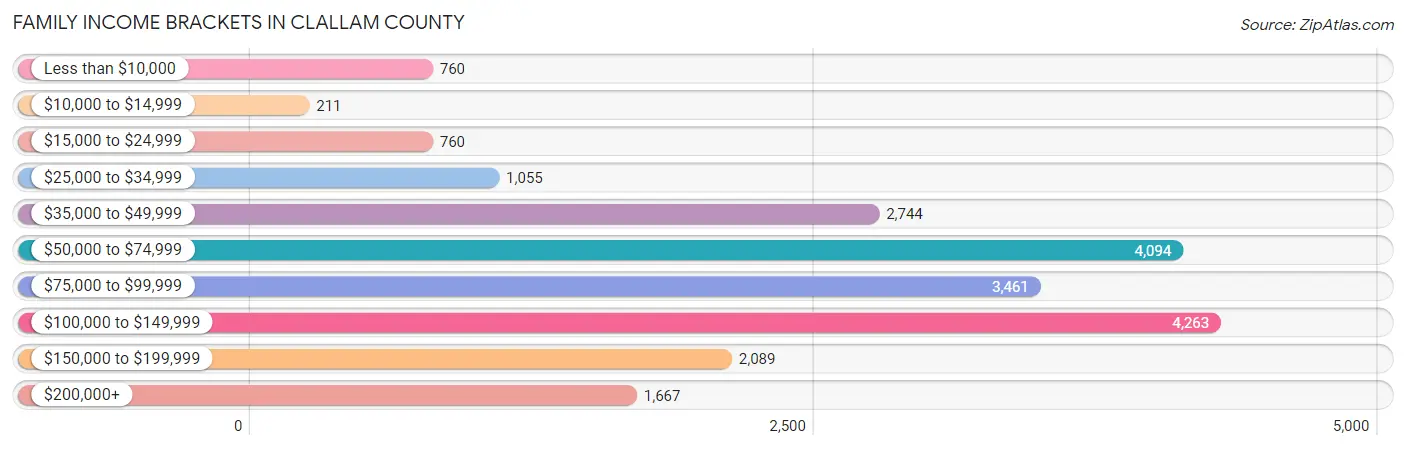
| Income Bracket | # Families | % Families |
| Less than $10,000 | 760 | 3.6% |
| $10,000 to $14,999 | 211 | 1.0% |
| $15,000 to $24,999 | 760 | 3.6% |
| $25,000 to $34,999 | 1,055 | 5.0% |
| $35,000 to $49,999 | 2,744 | 13.0% |
| $50,000 to $74,999 | 4,094 | 19.4% |
| $75,000 to $99,999 | 3,461 | 16.4% |
| $100,000 to $149,999 | 4,263 | 20.2% |
| $150,000 to $199,999 | 2,089 | 9.9% |
| $200,000+ | 1,667 | 7.9% |
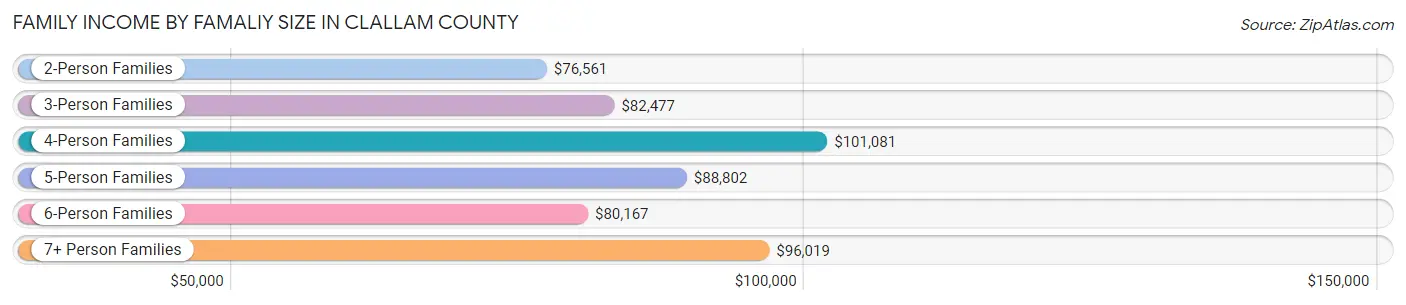
Family Income by Famaliy Size in Clallam County
4-person families (2,538 | 12.0%) account for the highest median family income in Clallam County with $101,081 per family, while 2-person families (13,533 | 64.1%) have the highest median income of $38,280 per family member.
| Income Bracket | # Families | Median Income |
| 2-Person Families | 13,533 (64.1%) | $76,561 |
| 3-Person Families | 3,514 (16.7%) | $82,477 |
| 4-Person Families | 2,538 (12.0%) | $101,081 |
| 5-Person Families | 973 (4.6%) | $88,802 |
| 6-Person Families | 208 (1.0%) | $80,167 |
| 7+ Person Families | 338 (1.6%) | $96,019 |
| Total | 21,104 (100.0%) | $82,053 |
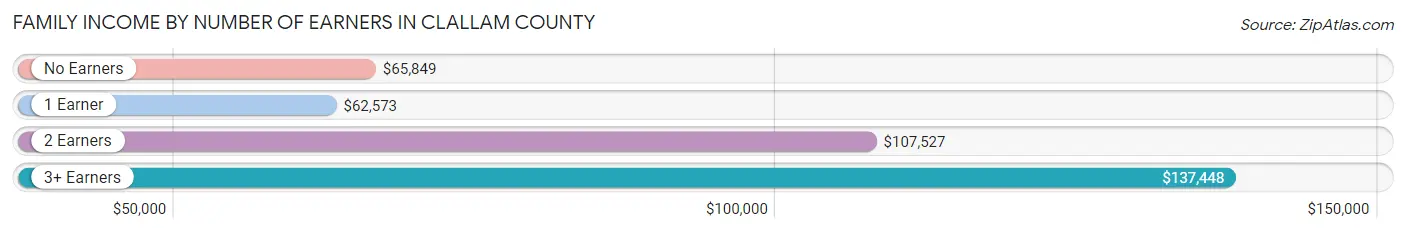
Family Income by Number of Earners in Clallam County
The median family income in Clallam County is $82,053, with families comprising 3+ earners (1,197) having the highest median family income of $137,448, while families with 1 earner (6,692) have the lowest median family income of $62,573, accounting for 5.7% and 31.7% of families, respectively.
| Number of Earners | # Families | Median Income |
| No Earners | 6,463 (30.6%) | $65,849 |
| 1 Earner | 6,692 (31.7%) | $62,573 |
| 2 Earners | 6,752 (32.0%) | $107,527 |
| 3+ Earners | 1,197 (5.7%) | $137,448 |
| Total | 21,104 (100.0%) | $82,053 |
Household Income in Clallam County
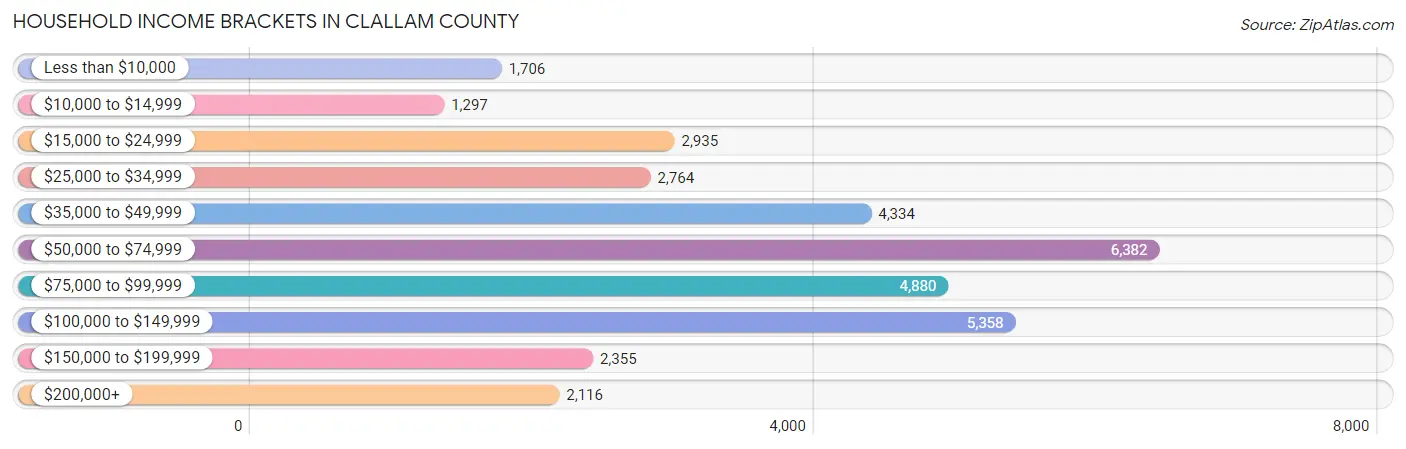
Household Income Brackets in Clallam County
With 6,382 households falling in the category, the $50,000 to $74,999 income range is the most frequent in Clallam County, accounting for 18.7% of all households. In contrast, only 1,297 households (3.8%) fall into the $10,000 to $14,999 income bracket, making it the least populous group.
| Income Bracket | # Households | % Households |
| Less than $10,000 | 1,706 | 5.0% |
| $10,000 to $14,999 | 1,297 | 3.8% |
| $15,000 to $24,999 | 2,935 | 8.6% |
| $25,000 to $34,999 | 2,764 | 8.1% |
| $35,000 to $49,999 | 4,334 | 12.7% |
| $50,000 to $74,999 | 6,382 | 18.7% |
| $75,000 to $99,999 | 4,880 | 14.3% |
| $100,000 to $149,999 | 5,358 | 15.7% |
| $150,000 to $199,999 | 2,355 | 6.9% |
| $200,000+ | 2,116 | 6.2% |
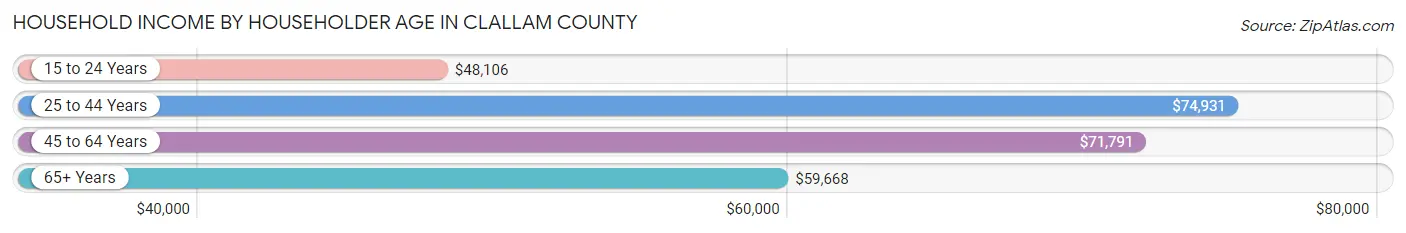
Household Income by Householder Age in Clallam County
The median household income in Clallam County is $66,108, with the highest median household income of $74,931 found in the 25 to 44 years age bracket for the primary householder. A total of 7,724 households (22.6%) fall into this category. Meanwhile, the 15 to 24 years age bracket for the primary householder has the lowest median household income of $48,106, with 754 households (2.2%) in this group.
| Income Bracket | # Households | Median Income |
| 15 to 24 Years | 754 (2.2%) | $48,106 |
| 25 to 44 Years | 7,724 (22.6%) | $74,931 |
| 45 to 64 Years | 10,674 (31.3%) | $71,791 |
| 65+ Years | 14,976 (43.9%) | $59,668 |
| Total | 34,128 (100.0%) | $66,108 |
Poverty in Clallam County
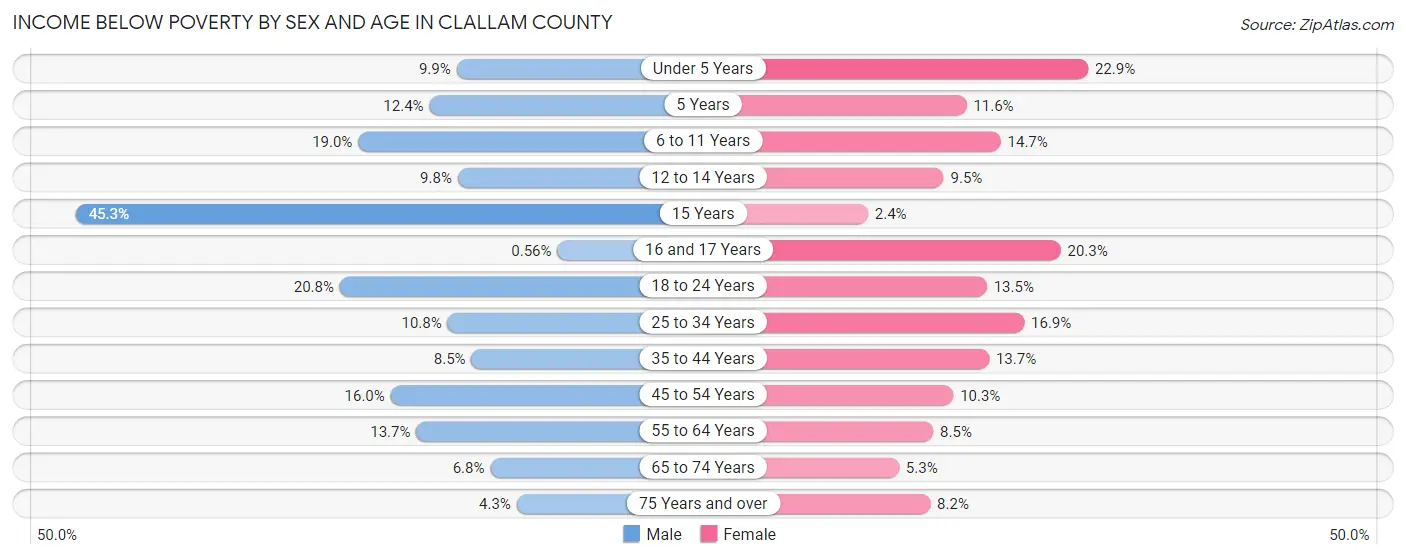
Income Below Poverty by Sex and Age in Clallam County
With 11.1% poverty level for males and 10.7% for females among the residents of Clallam County, 15 year old males and under 5 year old females are the most vulnerable to poverty, with 100 males (45.3%) and 300 females (22.9%) in their respective age groups living below the poverty level.
| Age Bracket | Male | Female |
| Under 5 Years | 182 (9.9%) | 300 (22.9%) |
| 5 Years | 43 (12.4%) | 56 (11.6%) |
| 6 to 11 Years | 439 (19.0%) | 274 (14.7%) |
| 12 to 14 Years | 109 (9.8%) | 105 (9.5%) |
| 15 Years | 100 (45.3%) | 11 (2.4%) |
| 16 and 17 Years | 5 (0.6%) | 137 (20.3%) |
| 18 to 24 Years | 517 (20.7%) | 273 (13.5%) |
| 25 to 34 Years | 444 (10.7%) | 650 (16.9%) |
| 35 to 44 Years | 364 (8.5%) | 564 (13.7%) |
| 45 to 54 Years | 588 (16.0%) | 383 (10.3%) |
| 55 to 64 Years | 768 (13.7%) | 537 (8.5%) |
| 65 to 74 Years | 444 (6.8%) | 398 (5.3%) |
| 75 Years and over | 187 (4.3%) | 411 (8.2%) |
| Total | 4,190 (11.1%) | 4,099 (10.7%) |
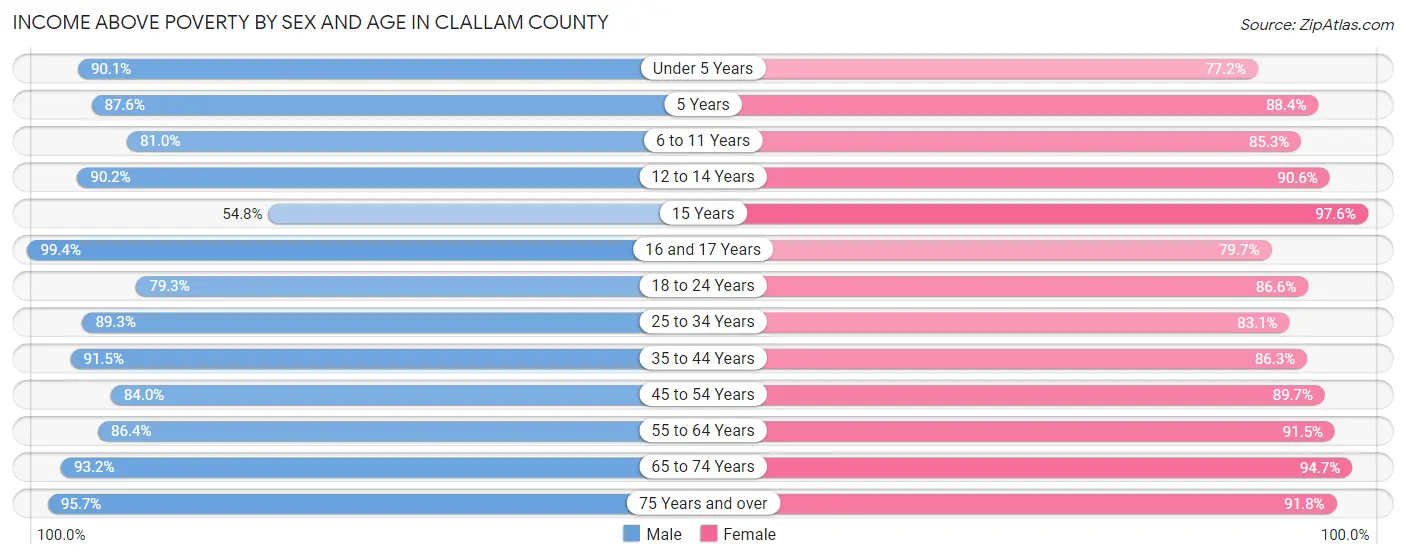
Income Above Poverty by Sex and Age in Clallam County
According to the poverty statistics in Clallam County, males aged 16 and 17 years and females aged 15 years are the age groups that are most secure financially, with 99.4% of males and 97.6% of females in these age groups living above the poverty line.
| Age Bracket | Male | Female |
| Under 5 Years | 1,654 (90.1%) | 1,013 (77.1%) |
| 5 Years | 303 (87.6%) | 428 (88.4%) |
| 6 to 11 Years | 1,867 (81.0%) | 1,585 (85.3%) |
| 12 to 14 Years | 1,003 (90.2%) | 1,006 (90.5%) |
| 15 Years | 121 (54.7%) | 444 (97.6%) |
| 16 and 17 Years | 887 (99.4%) | 538 (79.7%) |
| 18 to 24 Years | 1,974 (79.2%) | 1,756 (86.6%) |
| 25 to 34 Years | 3,687 (89.2%) | 3,191 (83.1%) |
| 35 to 44 Years | 3,903 (91.5%) | 3,564 (86.3%) |
| 45 to 54 Years | 3,081 (84.0%) | 3,322 (89.7%) |
| 55 to 64 Years | 4,860 (86.4%) | 5,793 (91.5%) |
| 65 to 74 Years | 6,104 (93.2%) | 7,108 (94.7%) |
| 75 Years and over | 4,134 (95.7%) | 4,600 (91.8%) |
| Total | 33,578 (88.9%) | 34,348 (89.3%) |
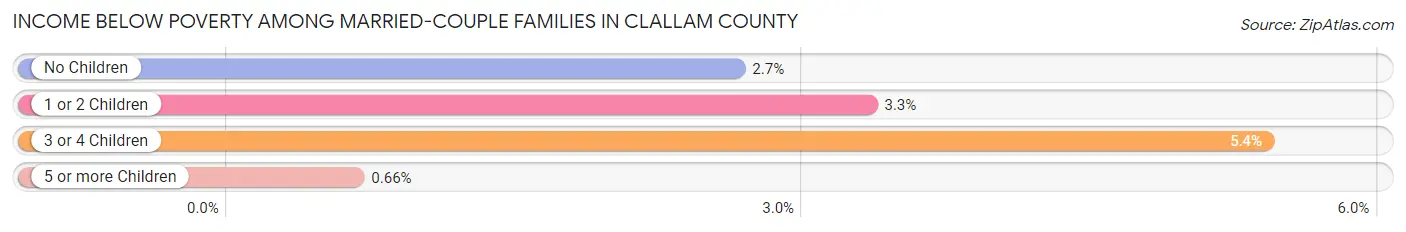
Income Below Poverty Among Married-Couple Families in Clallam County
The poverty statistics for married-couple families in Clallam County show that 2.9% or 474 of the total 16,484 families live below the poverty line. Families with 3 or 4 children have the highest poverty rate of 5.4%, comprising of 36 families. On the other hand, families with 5 or more children have the lowest poverty rate of 0.7%, which includes 1 families.
| Children | Above Poverty | Below Poverty |
| No Children | 12,106 (97.4%) | 329 (2.6%) |
| 1 or 2 Children | 3,123 (96.7%) | 108 (3.3%) |
| 3 or 4 Children | 630 (94.6%) | 36 (5.4%) |
| 5 or more Children | 151 (99.3%) | 1 (0.7%) |
| Total | 16,010 (97.1%) | 474 (2.9%) |
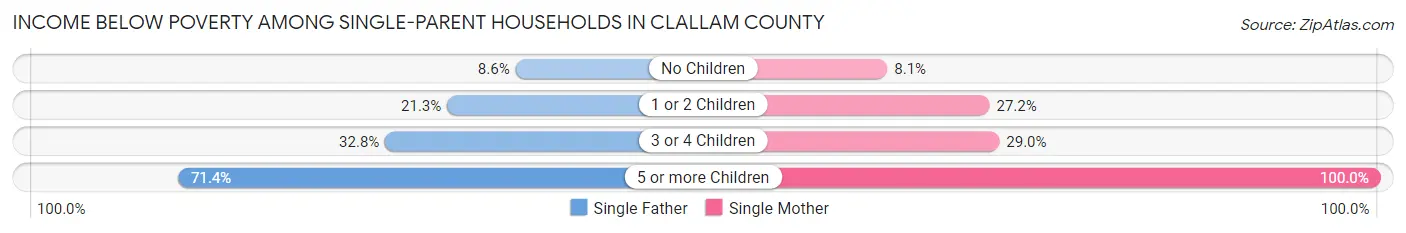
Income Below Poverty Among Single-Parent Households in Clallam County
According to the poverty data in Clallam County, 17.3% or 231 single-father households and 20.7% or 679 single-mother households are living below the poverty line. Among single-father households, those with 5 or more children have the highest poverty rate, with 20 households (71.4%) experiencing poverty. Likewise, among single-mother households, those with 5 or more children have the highest poverty rate, with 52 households (100.0%) falling below the poverty line.
| Children | Single Father | Single Mother |
| No Children | 51 (8.6%) | 110 (8.1%) |
| 1 or 2 Children | 138 (21.3%) | 410 (27.2%) |
| 3 or 4 Children | 22 (32.8%) | 107 (29.0%) |
| 5 or more Children | 20 (71.4%) | 52 (100.0%) |
| Total | 231 (17.3%) | 679 (20.7%) |
Income Below Poverty Among Married-Couple vs Single-Parent Households in Clallam County
The poverty data for Clallam County shows that 474 of the married-couple family households (2.9%) and 910 of the single-parent households (19.7%) are living below the poverty level. Within the married-couple family households, those with 3 or 4 children have the highest poverty rate, with 36 households (5.4%) falling below the poverty line. Among the single-parent households, those with 5 or more children have the highest poverty rate, with 72 household (90.0%) living below poverty.
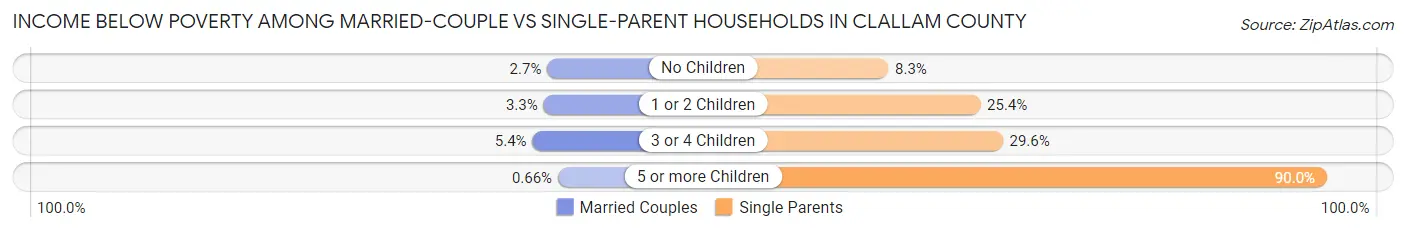
| Children | Married-Couple Families | Single-Parent Households |
| No Children | 329 (2.6%) | 161 (8.3%) |
| 1 or 2 Children | 108 (3.3%) | 548 (25.4%) |
| 3 or 4 Children | 36 (5.4%) | 129 (29.6%) |
| 5 or more Children | 1 (0.7%) | 72 (90.0%) |
| Total | 474 (2.9%) | 910 (19.7%) |
Employment Characteristics in Clallam County
Employment by Class of Employer in Clallam County
Among the 29,996 employed individuals in Clallam County, private company employees (15,903 | 53.0%), local government employees (3,264 | 10.9%), and not-for-profit organizations (2,688 | 9.0%) make up the most common classes of employment.
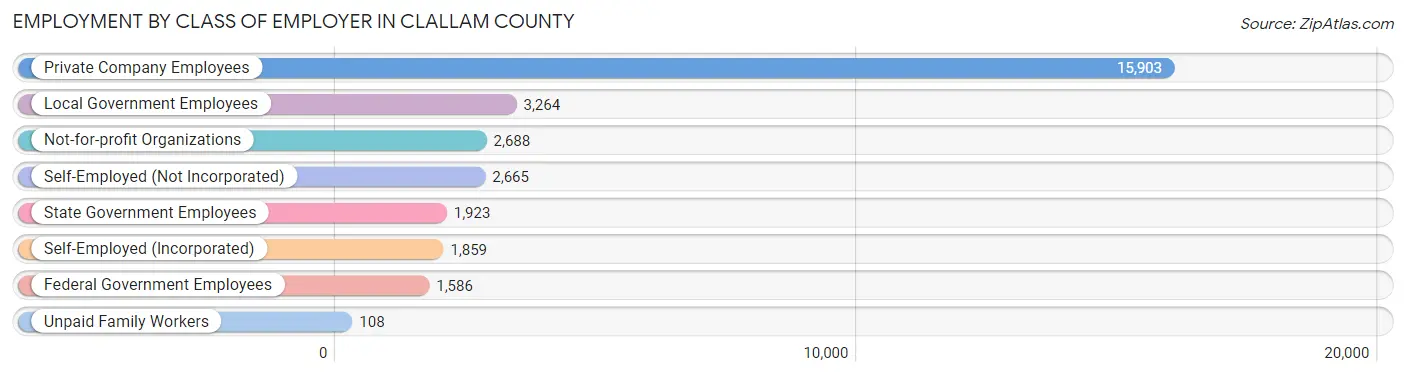
| Employer Class | # Employees | % Employees |
| Private Company Employees | 15,903 | 53.0% |
| Self-Employed (Incorporated) | 1,859 | 6.2% |
| Self-Employed (Not Incorporated) | 2,665 | 8.9% |
| Not-for-profit Organizations | 2,688 | 9.0% |
| Local Government Employees | 3,264 | 10.9% |
| State Government Employees | 1,923 | 6.4% |
| Federal Government Employees | 1,586 | 5.3% |
| Unpaid Family Workers | 108 | 0.4% |
| Total | 29,996 | 100.0% |
Employment Status by Age in Clallam County
According to the labor force statistics for Clallam County, out of the total population over 16 years of age (66,079), 49.1% or 32,445 individuals are in the labor force, with 5.4% or 1,752 of them unemployed. The age group with the highest labor force participation rate is 25 to 29 years, with 81.4% or 3,101 individuals in the labor force. Within the labor force, the 16 to 19 years age range has the highest percentage of unemployed individuals, with 17.6% or 231 of them being unemployed.
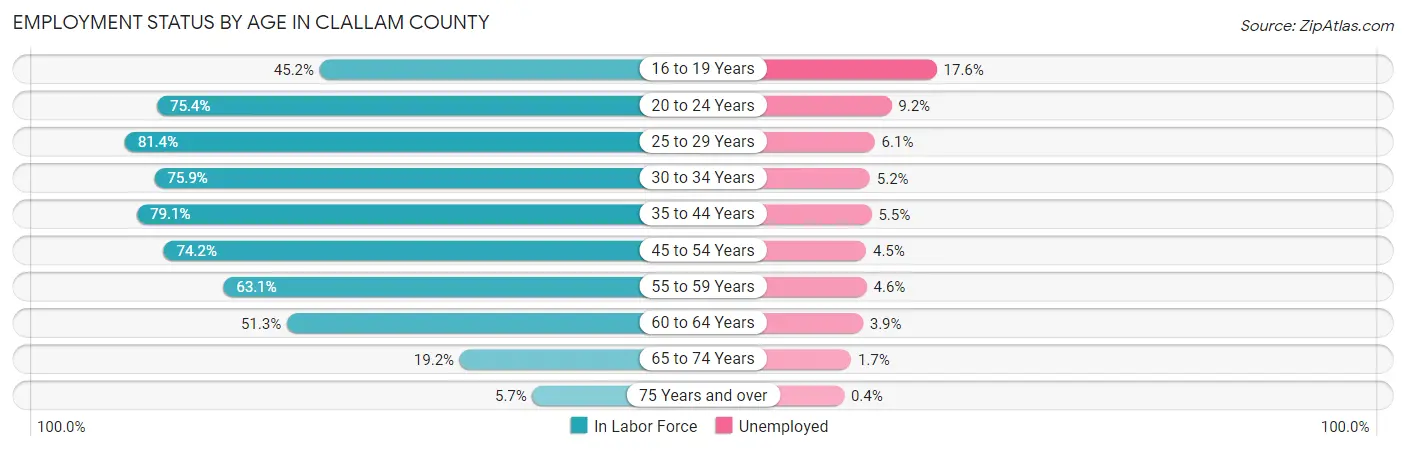
| Age Bracket | In Labor Force | Unemployed |
| 16 to 19 Years | 1,312 (45.2%) | 231 (17.6%) |
| 20 to 24 Years | 2,497 (75.4%) | 230 (9.2%) |
| 25 to 29 Years | 3,101 (81.4%) | 189 (6.1%) |
| 30 to 34 Years | 3,263 (75.9%) | 170 (5.2%) |
| 35 to 44 Years | 6,727 (79.1%) | 370 (5.5%) |
| 45 to 54 Years | 5,495 (74.2%) | 247 (4.5%) |
| 55 to 59 Years | 3,193 (63.1%) | 147 (4.6%) |
| 60 to 64 Years | 3,602 (51.3%) | 140 (3.9%) |
| 65 to 74 Years | 2,712 (19.2%) | 46 (1.7%) |
| 75 Years and over | 549 (5.7%) | 2 (0.4%) |
| Total | 32,445 (49.1%) | 1,752 (5.4%) |
Employment Status by Educational Attainment in Clallam County
According to labor force statistics for Clallam County, 70.3% of individuals (25,379) out of the total population between 25 and 64 years of age (36,101) are in the labor force, with 5.0% or 1,269 of them being unemployed. The group with the highest labor force participation rate are those with the educational attainment of bachelor's degree or higher, with 78.7% or 7,784 individuals in the labor force. Within the labor force, individuals with less than high school education have the highest percentage of unemployment, with 10.3% or 165 of them being unemployed.
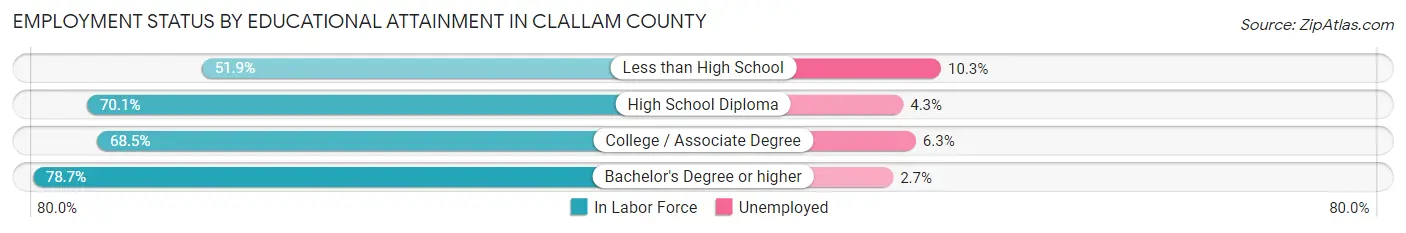
| Educational Attainment | In Labor Force | Unemployed |
| Less than High School | 1,599 (51.9%) | 317 (10.3%) |
| High School Diploma | 6,407 (70.1%) | 393 (4.3%) |
| College / Associate Degree | 9,582 (68.5%) | 881 (6.3%) |
| Bachelor's Degree or higher | 7,784 (78.7%) | 267 (2.7%) |
| Total | 25,379 (70.3%) | 1,805 (5.0%) |
Employment Occupations by Sex in Clallam County
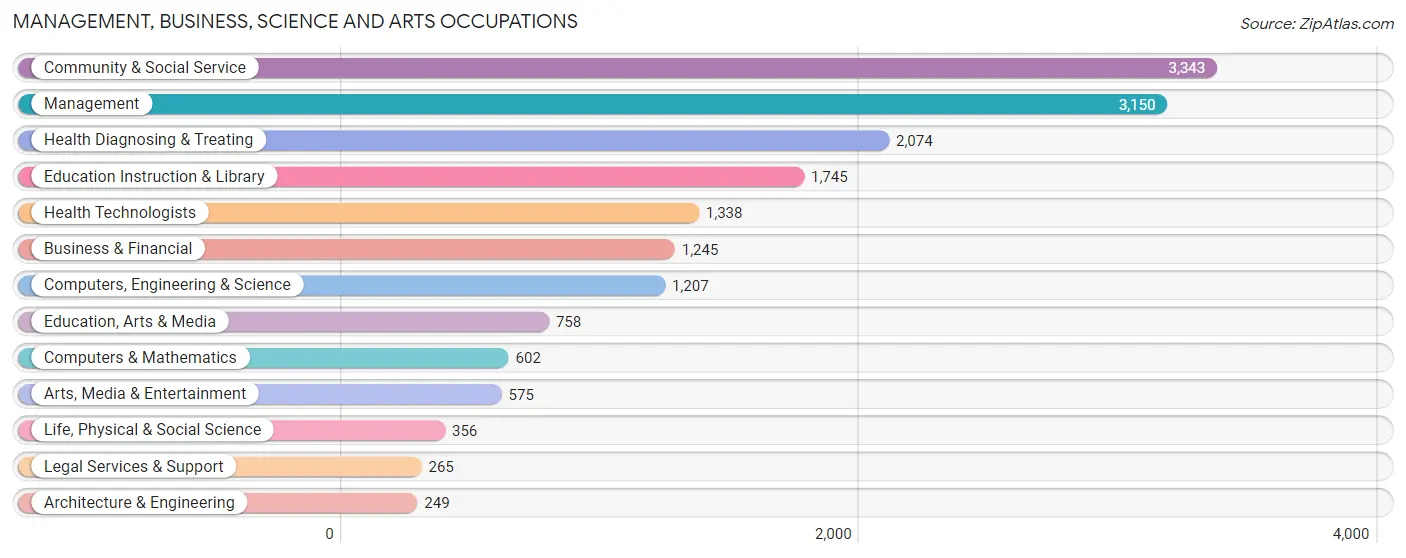
Management, Business, Science and Arts Occupations
The most common Management, Business, Science and Arts occupations in Clallam County are Community & Social Service (3,343 | 11.1%), Management (3,150 | 10.4%), Health Diagnosing & Treating (2,074 | 6.9%), Education Instruction & Library (1,745 | 5.8%), and Health Technologists (1,338 | 4.4%).
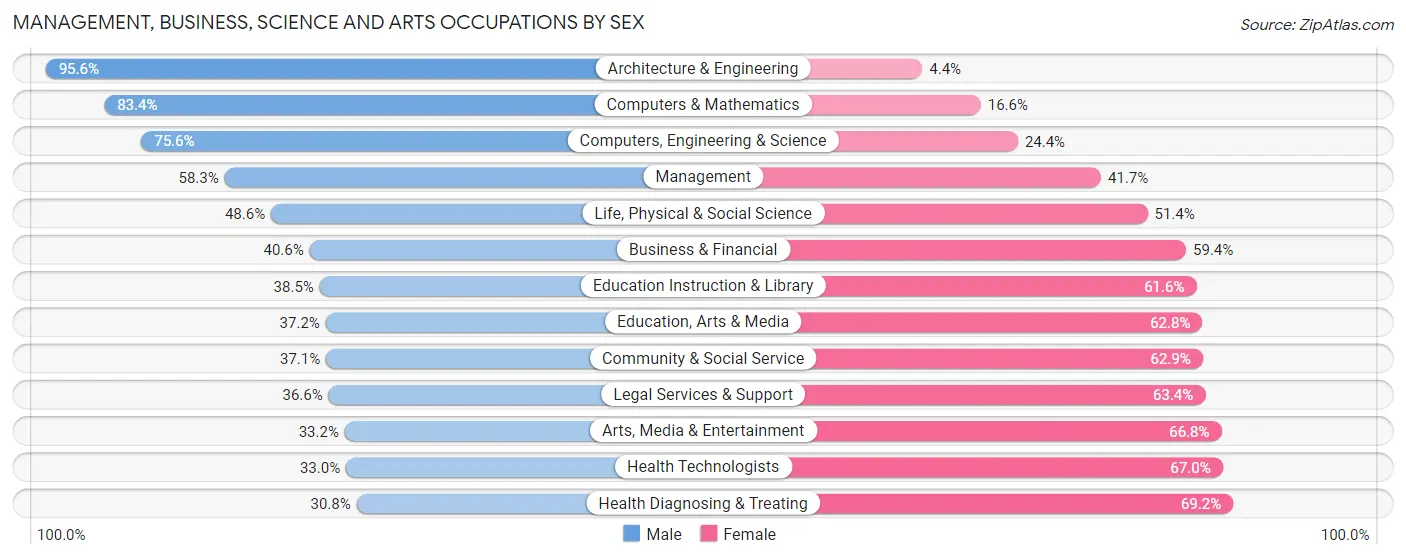
Management, Business, Science and Arts Occupations by Sex
Within the Management, Business, Science and Arts occupations in Clallam County, the most male-oriented occupations are Architecture & Engineering (95.6%), Computers & Mathematics (83.4%), and Computers, Engineering & Science (75.6%), while the most female-oriented occupations are Health Diagnosing & Treating (69.2%), Health Technologists (67.0%), and Arts, Media & Entertainment (66.8%).
| Occupation | Male | Female |
| Management | 1,836 (58.3%) | 1,314 (41.7%) |
| Business & Financial | 505 (40.6%) | 740 (59.4%) |
| Computers, Engineering & Science | 913 (75.6%) | 294 (24.4%) |
| Computers & Mathematics | 502 (83.4%) | 100 (16.6%) |
| Architecture & Engineering | 238 (95.6%) | 11 (4.4%) |
| Life, Physical & Social Science | 173 (48.6%) | 183 (51.4%) |
| Community & Social Service | 1,241 (37.1%) | 2,102 (62.9%) |
| Education, Arts & Media | 282 (37.2%) | 476 (62.8%) |
| Legal Services & Support | 97 (36.6%) | 168 (63.4%) |
| Education Instruction & Library | 671 (38.5%) | 1,074 (61.6%) |
| Arts, Media & Entertainment | 191 (33.2%) | 384 (66.8%) |
| Health Diagnosing & Treating | 638 (30.8%) | 1,436 (69.2%) |
| Health Technologists | 441 (33.0%) | 897 (67.0%) |
| Total (Category) | 5,133 (46.6%) | 5,886 (53.4%) |
| Total (Overall) | 15,432 (51.1%) | 14,784 (48.9%) |
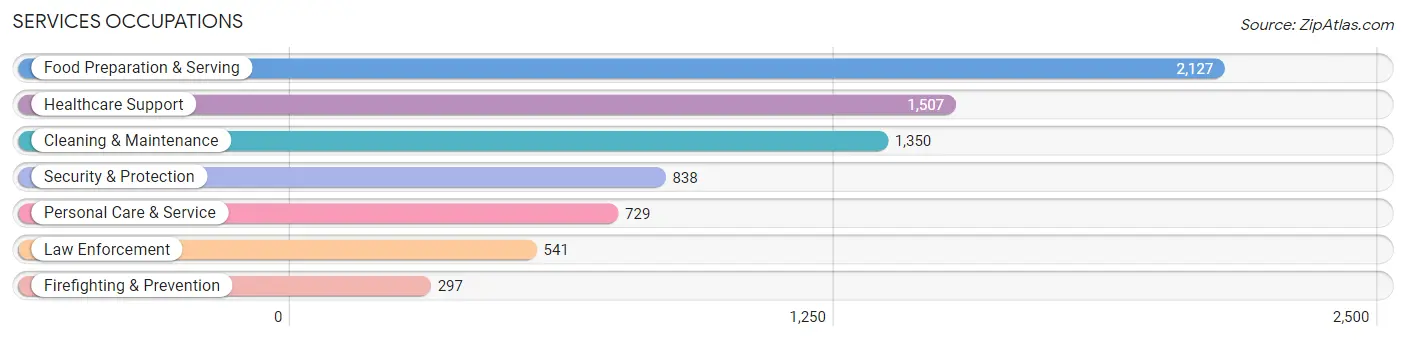
Services Occupations
The most common Services occupations in Clallam County are Food Preparation & Serving (2,127 | 7.0%), Healthcare Support (1,507 | 5.0%), Cleaning & Maintenance (1,350 | 4.5%), Security & Protection (838 | 2.8%), and Personal Care & Service (729 | 2.4%).
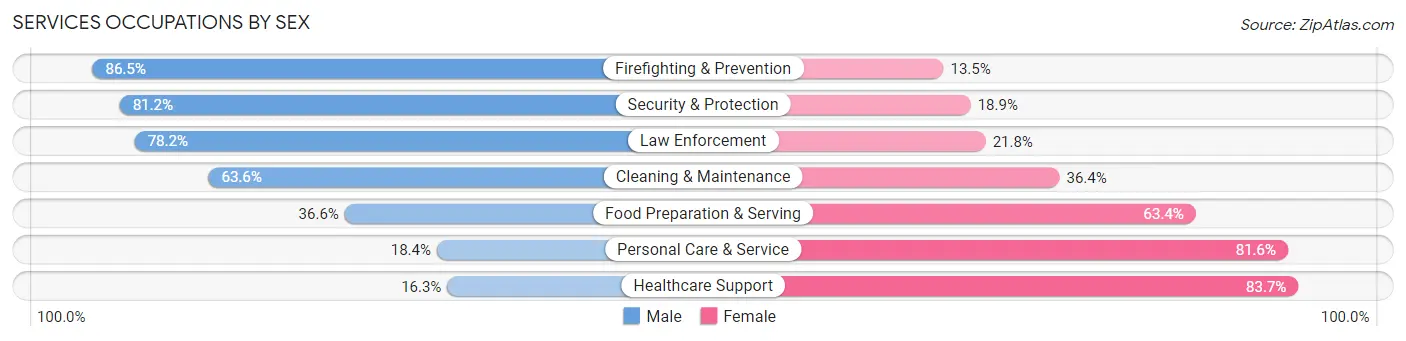
Services Occupations by Sex
Within the Services occupations in Clallam County, the most male-oriented occupations are Firefighting & Prevention (86.5%), Security & Protection (81.1%), and Law Enforcement (78.2%), while the most female-oriented occupations are Healthcare Support (83.7%), Personal Care & Service (81.6%), and Food Preparation & Serving (63.4%).
| Occupation | Male | Female |
| Healthcare Support | 246 (16.3%) | 1,261 (83.7%) |
| Security & Protection | 680 (81.1%) | 158 (18.9%) |
| Firefighting & Prevention | 257 (86.5%) | 40 (13.5%) |
| Law Enforcement | 423 (78.2%) | 118 (21.8%) |
| Food Preparation & Serving | 779 (36.6%) | 1,348 (63.4%) |
| Cleaning & Maintenance | 858 (63.6%) | 492 (36.4%) |
| Personal Care & Service | 134 (18.4%) | 595 (81.6%) |
| Total (Category) | 2,697 (41.2%) | 3,854 (58.8%) |
| Total (Overall) | 15,432 (51.1%) | 14,784 (48.9%) |
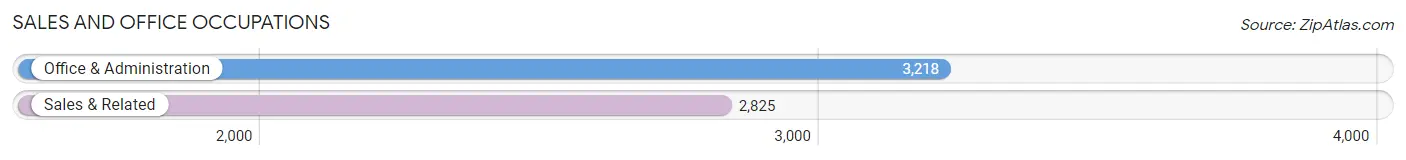
Sales and Office Occupations
The most common Sales and Office occupations in Clallam County are Office & Administration (3,218 | 10.6%), and Sales & Related (2,825 | 9.3%).
Sales and Office Occupations by Sex
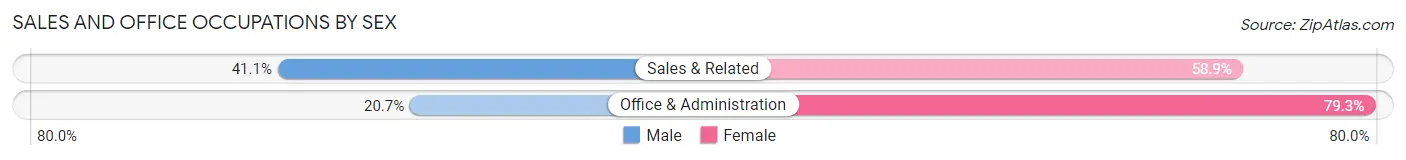
| Occupation | Male | Female |
| Sales & Related | 1,160 (41.1%) | 1,665 (58.9%) |
| Office & Administration | 666 (20.7%) | 2,552 (79.3%) |
| Total (Category) | 1,826 (30.2%) | 4,217 (69.8%) |
| Total (Overall) | 15,432 (51.1%) | 14,784 (48.9%) |
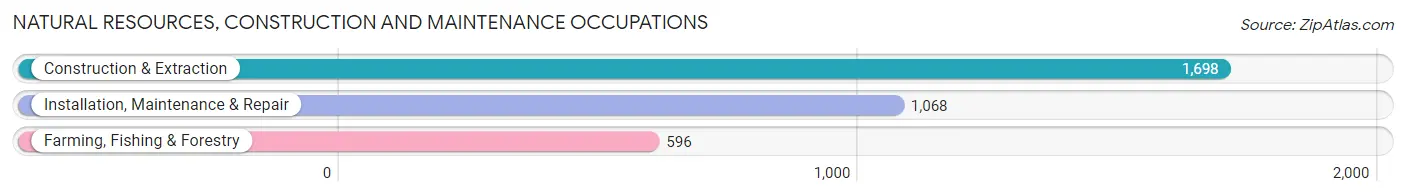
Natural Resources, Construction and Maintenance Occupations
The most common Natural Resources, Construction and Maintenance occupations in Clallam County are Construction & Extraction (1,698 | 5.6%), Installation, Maintenance & Repair (1,068 | 3.5%), and Farming, Fishing & Forestry (596 | 2.0%).
Natural Resources, Construction and Maintenance Occupations by Sex
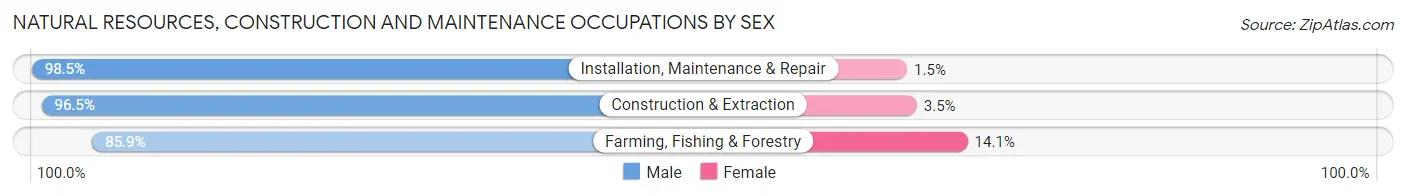
| Occupation | Male | Female |
| Farming, Fishing & Forestry | 512 (85.9%) | 84 (14.1%) |
| Construction & Extraction | 1,638 (96.5%) | 60 (3.5%) |
| Installation, Maintenance & Repair | 1,052 (98.5%) | 16 (1.5%) |
| Total (Category) | 3,202 (95.2%) | 160 (4.8%) |
| Total (Overall) | 15,432 (51.1%) | 14,784 (48.9%) |
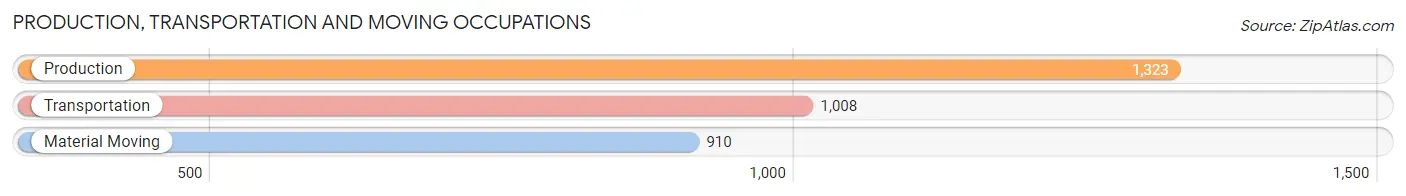
Production, Transportation and Moving Occupations
The most common Production, Transportation and Moving occupations in Clallam County are Production (1,323 | 4.4%), Transportation (1,008 | 3.3%), and Material Moving (910 | 3.0%).
Production, Transportation and Moving Occupations by Sex
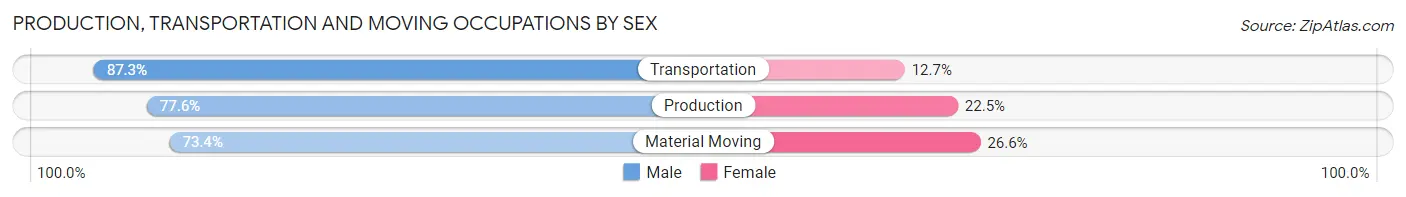
| Occupation | Male | Female |
| Production | 1,026 (77.5%) | 297 (22.5%) |
| Transportation | 880 (87.3%) | 128 (12.7%) |
| Material Moving | 668 (73.4%) | 242 (26.6%) |
| Total (Category) | 2,574 (79.4%) | 667 (20.6%) |
| Total (Overall) | 15,432 (51.1%) | 14,784 (48.9%) |
Employment Industries by Sex in Clallam County
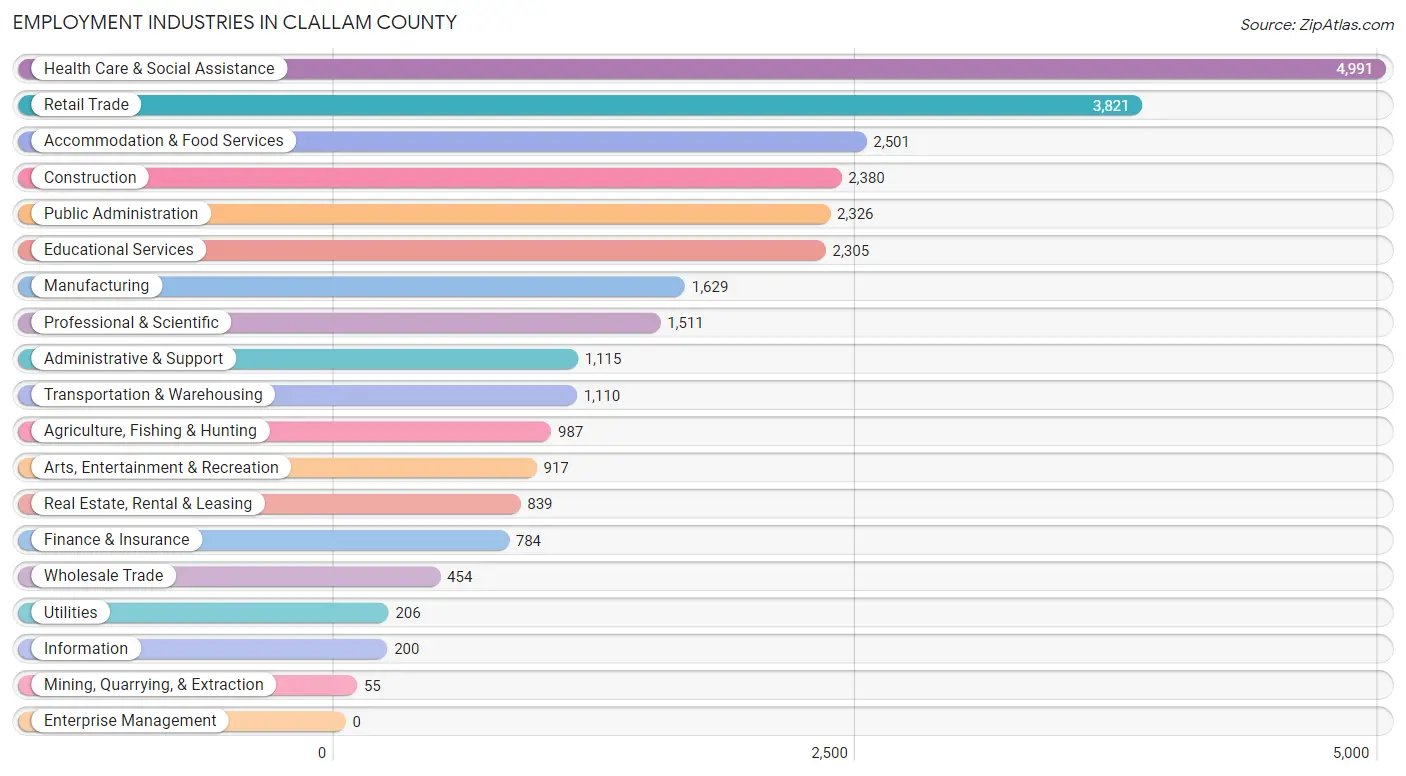
Employment Industries in Clallam County
The major employment industries in Clallam County include Health Care & Social Assistance (4,991 | 16.5%), Retail Trade (3,821 | 12.7%), Accommodation & Food Services (2,501 | 8.3%), Construction (2,380 | 7.9%), and Public Administration (2,326 | 7.7%).
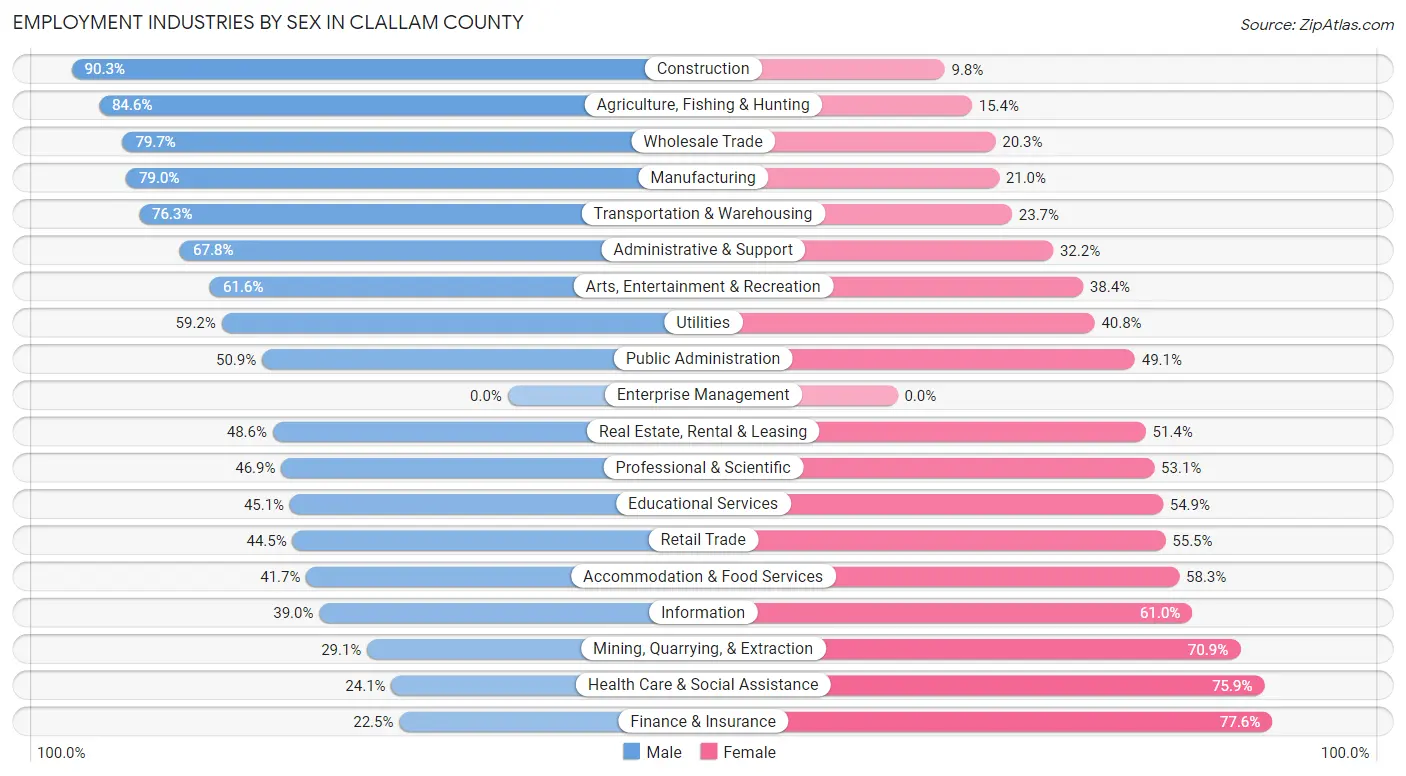
Employment Industries by Sex in Clallam County
The Clallam County industries that see more men than women are Construction (90.2%), Agriculture, Fishing & Hunting (84.6%), and Wholesale Trade (79.7%), whereas the industries that tend to have a higher number of women are Finance & Insurance (77.5%), Health Care & Social Assistance (75.9%), and Mining, Quarrying, & Extraction (70.9%).
| Industry | Male | Female |
| Agriculture, Fishing & Hunting | 835 (84.6%) | 152 (15.4%) |
| Mining, Quarrying, & Extraction | 16 (29.1%) | 39 (70.9%) |
| Construction | 2,148 (90.2%) | 232 (9.8%) |
| Manufacturing | 1,287 (79.0%) | 342 (21.0%) |
| Wholesale Trade | 362 (79.7%) | 92 (20.3%) |
| Retail Trade | 1,702 (44.5%) | 2,119 (55.5%) |
| Transportation & Warehousing | 847 (76.3%) | 263 (23.7%) |
| Utilities | 122 (59.2%) | 84 (40.8%) |
| Information | 78 (39.0%) | 122 (61.0%) |
| Finance & Insurance | 176 (22.5%) | 608 (77.5%) |
| Real Estate, Rental & Leasing | 408 (48.6%) | 431 (51.4%) |
| Professional & Scientific | 708 (46.9%) | 803 (53.1%) |
| Enterprise Management | 0 (0.0%) | 0 (0.0%) |
| Administrative & Support | 756 (67.8%) | 359 (32.2%) |
| Educational Services | 1,039 (45.1%) | 1,266 (54.9%) |
| Health Care & Social Assistance | 1,202 (24.1%) | 3,789 (75.9%) |
| Arts, Entertainment & Recreation | 565 (61.6%) | 352 (38.4%) |
| Accommodation & Food Services | 1,043 (41.7%) | 1,458 (58.3%) |
| Public Administration | 1,183 (50.9%) | 1,143 (49.1%) |
| Total | 15,432 (51.1%) | 14,784 (48.9%) |
Education in Clallam County
School Enrollment in Clallam County
The most common levels of schooling among the 12,434 students in Clallam County are high school (2,777 | 22.3%), middle school (2,748 | 22.1%), and elementary school (2,391 | 19.2%).
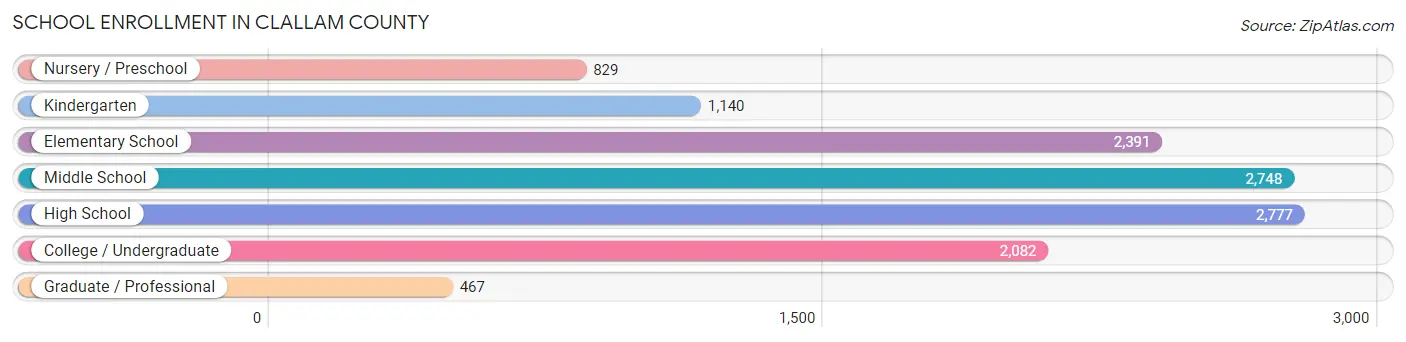
| School Level | # Students | % Students |
| Nursery / Preschool | 829 | 6.7% |
| Kindergarten | 1,140 | 9.2% |
| Elementary School | 2,391 | 19.2% |
| Middle School | 2,748 | 22.1% |
| High School | 2,777 | 22.3% |
| College / Undergraduate | 2,082 | 16.7% |
| Graduate / Professional | 467 | 3.8% |
| Total | 12,434 | 100.0% |
School Enrollment by Age by Funding Source in Clallam County
Out of a total of 12,434 students who are enrolled in schools in Clallam County, 2,300 (18.5%) attend a private institution, while the remaining 10,134 (81.5%) are enrolled in public schools. The age group of 3 to 4 year olds has the highest likelihood of being enrolled in private schools, with 350 (47.9% in the age bracket) enrolled. Conversely, the age group of 18 to 19 year olds has the lowest likelihood of being enrolled in a private school, with 688 (93.7% in the age bracket) attending a public institution.
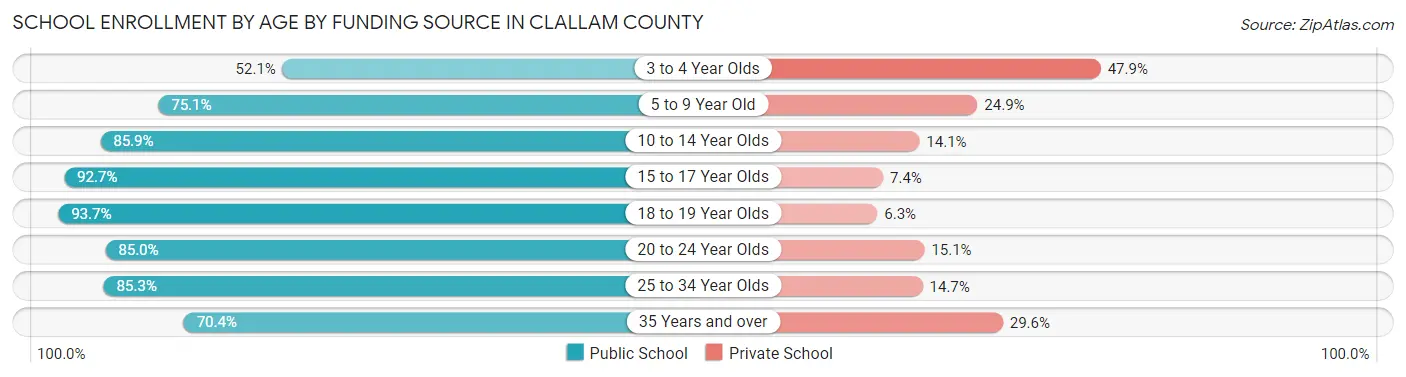
| Age Bracket | Public School | Private School |
| 3 to 4 Year Olds | 381 (52.1%) | 350 (47.9%) |
| 5 to 9 Year Old | 2,499 (75.1%) | 829 (24.9%) |
| 10 to 14 Year Olds | 2,782 (85.9%) | 457 (14.1%) |
| 15 to 17 Year Olds | 2,029 (92.6%) | 161 (7.3%) |
| 18 to 19 Year Olds | 688 (93.7%) | 46 (6.3%) |
| 20 to 24 Year Olds | 559 (85.0%) | 99 (15.0%) |
| 25 to 34 Year Olds | 563 (85.3%) | 97 (14.7%) |
| 35 Years and over | 629 (70.4%) | 265 (29.6%) |
| Total | 10,134 (81.5%) | 2,300 (18.5%) |
Educational Attainment by Field of Study in Clallam County
Education (3,076 | 15.1%), business (2,360 | 11.6%), bio, nature & agricultural (2,171 | 10.7%), science & technology (1,915 | 9.4%), and arts & humanities (1,648 | 8.1%) are the most common fields of study among 20,328 individuals in Clallam County who have obtained a bachelor's degree or higher.
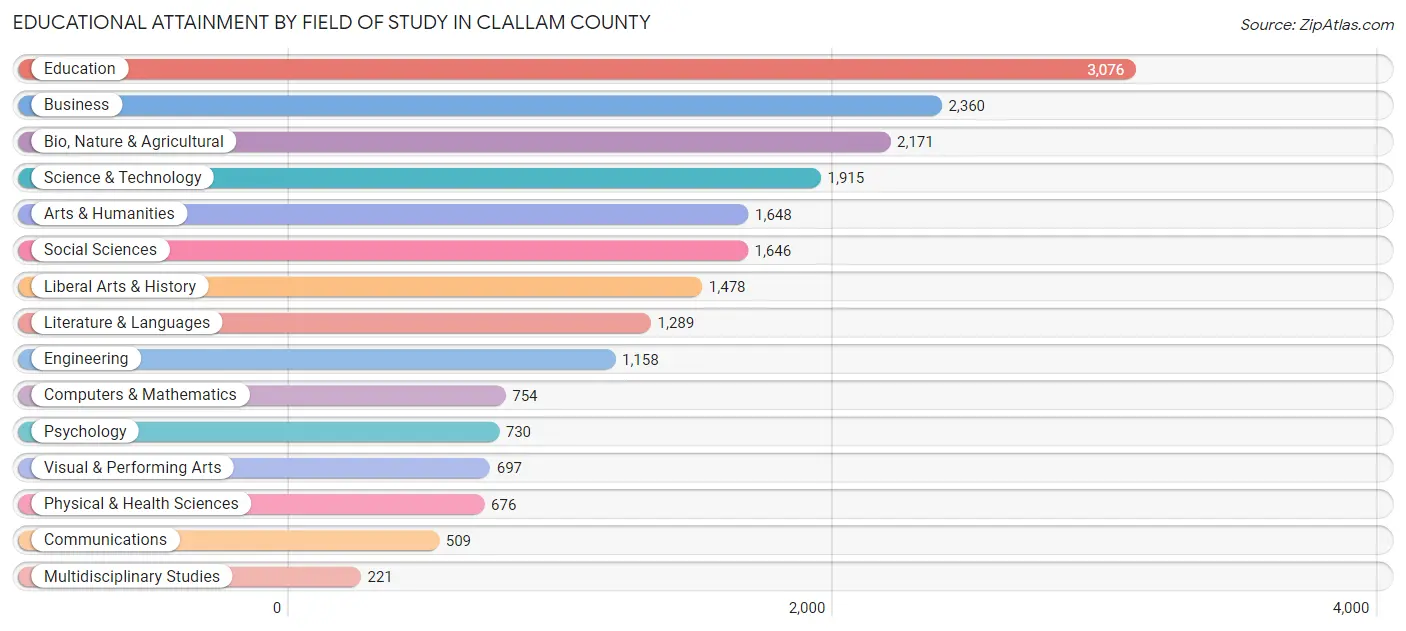
| Field of Study | # Graduates | % Graduates |
| Computers & Mathematics | 754 | 3.7% |
| Bio, Nature & Agricultural | 2,171 | 10.7% |
| Physical & Health Sciences | 676 | 3.3% |
| Psychology | 730 | 3.6% |
| Social Sciences | 1,646 | 8.1% |
| Engineering | 1,158 | 5.7% |
| Multidisciplinary Studies | 221 | 1.1% |
| Science & Technology | 1,915 | 9.4% |
| Business | 2,360 | 11.6% |
| Education | 3,076 | 15.1% |
| Literature & Languages | 1,289 | 6.3% |
| Liberal Arts & History | 1,478 | 7.3% |
| Visual & Performing Arts | 697 | 3.4% |
| Communications | 509 | 2.5% |
| Arts & Humanities | 1,648 | 8.1% |
| Total | 20,328 | 100.0% |
Transportation & Commute in Clallam County
Vehicle Availability by Sex in Clallam County
The most prevalent vehicle ownership categories in Clallam County are males with 2 vehicles (6,253, accounting for 40.6%) and females with 2 vehicles (5,223, making up 43.4%).
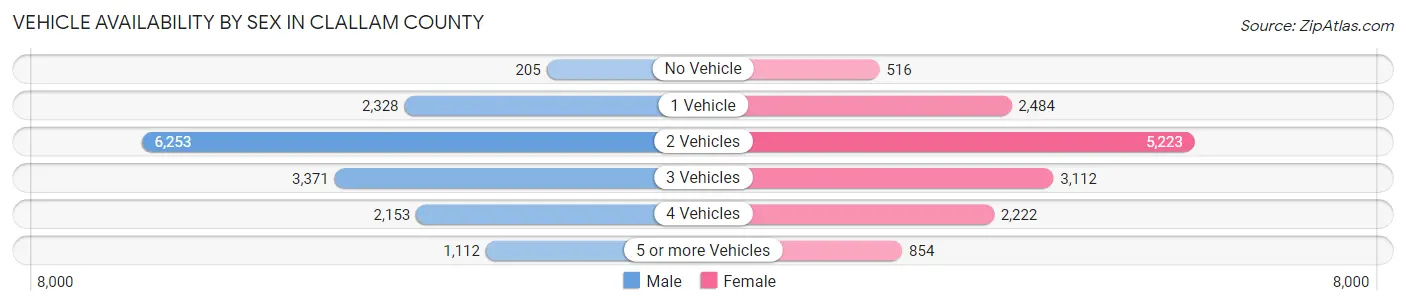
| Vehicles Available | Male | Female |
| No Vehicle | 205 (1.3%) | 516 (3.6%) |
| 1 Vehicle | 2,328 (15.1%) | 2,484 (17.2%) |
| 2 Vehicles | 6,253 (40.6%) | 5,223 (36.2%) |
| 3 Vehicles | 3,371 (21.9%) | 3,112 (21.6%) |
| 4 Vehicles | 2,153 (14.0%) | 2,222 (15.4%) |
| 5 or more Vehicles | 1,112 (7.2%) | 854 (5.9%) |
| Total | 15,422 (100.0%) | 14,411 (100.0%) |
Commute Time in Clallam County
The most frequently occuring commute durations in Clallam County are 5 to 9 minutes (5,826 commuters, 21.9%), 10 to 14 minutes (5,277 commuters, 19.9%), and 15 to 19 minutes (3,498 commuters, 13.2%).
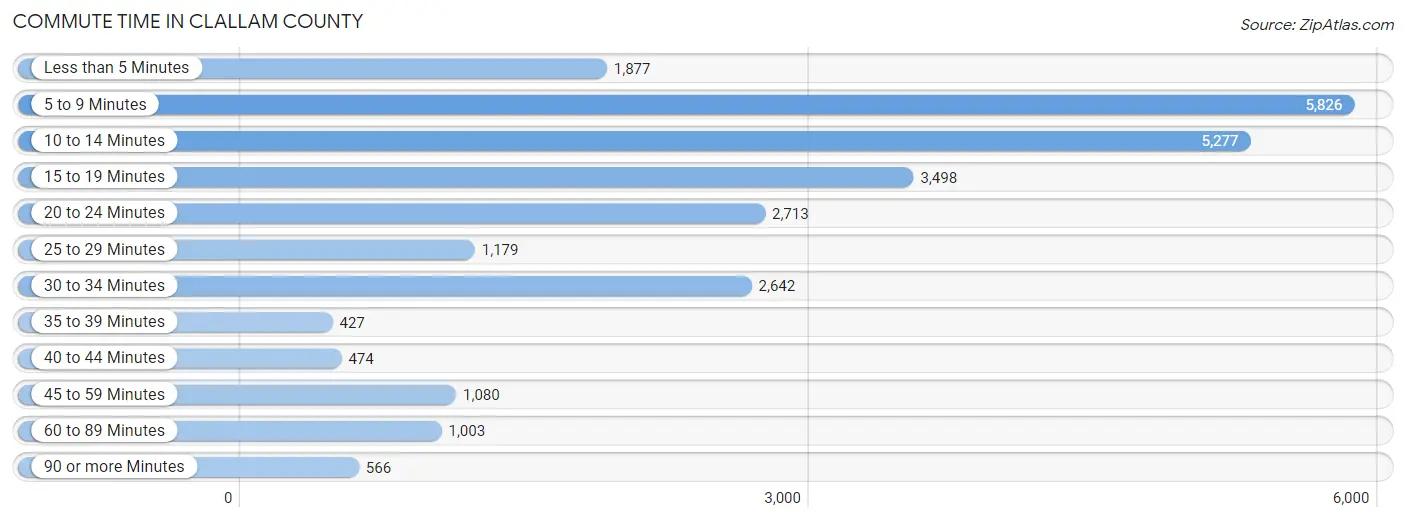
| Commute Time | # Commuters | % Commuters |
| Less than 5 Minutes | 1,877 | 7.1% |
| 5 to 9 Minutes | 5,826 | 21.9% |
| 10 to 14 Minutes | 5,277 | 19.9% |
| 15 to 19 Minutes | 3,498 | 13.2% |
| 20 to 24 Minutes | 2,713 | 10.2% |
| 25 to 29 Minutes | 1,179 | 4.4% |
| 30 to 34 Minutes | 2,642 | 10.0% |
| 35 to 39 Minutes | 427 | 1.6% |
| 40 to 44 Minutes | 474 | 1.8% |
| 45 to 59 Minutes | 1,080 | 4.1% |
| 60 to 89 Minutes | 1,003 | 3.8% |
| 90 or more Minutes | 566 | 2.1% |
Commute Time by Sex in Clallam County
The most common commute times in Clallam County are 5 to 9 minutes (3,000 commuters, 21.1%) for males and 5 to 9 minutes (2,826 commuters, 22.9%) for females.
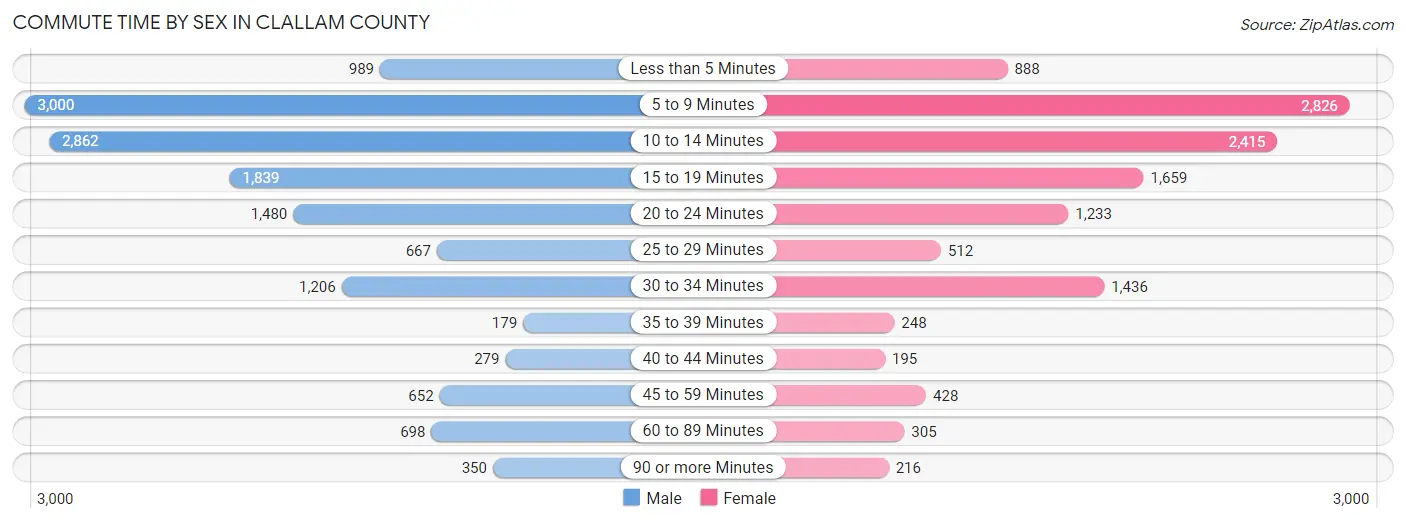
| Commute Time | Male | Female |
| Less than 5 Minutes | 989 (7.0%) | 888 (7.2%) |
| 5 to 9 Minutes | 3,000 (21.1%) | 2,826 (22.9%) |
| 10 to 14 Minutes | 2,862 (20.2%) | 2,415 (19.5%) |
| 15 to 19 Minutes | 1,839 (13.0%) | 1,659 (13.4%) |
| 20 to 24 Minutes | 1,480 (10.4%) | 1,233 (10.0%) |
| 25 to 29 Minutes | 667 (4.7%) | 512 (4.1%) |
| 30 to 34 Minutes | 1,206 (8.5%) | 1,436 (11.6%) |
| 35 to 39 Minutes | 179 (1.3%) | 248 (2.0%) |
| 40 to 44 Minutes | 279 (2.0%) | 195 (1.6%) |
| 45 to 59 Minutes | 652 (4.6%) | 428 (3.5%) |
| 60 to 89 Minutes | 698 (4.9%) | 305 (2.5%) |
| 90 or more Minutes | 350 (2.5%) | 216 (1.8%) |
Time of Departure to Work by Sex in Clallam County
The most frequent times of departure to work in Clallam County are 7:30 AM to 7:59 AM (2,334, 16.4%) for males and 7:30 AM to 7:59 AM (2,562, 20.7%) for females.
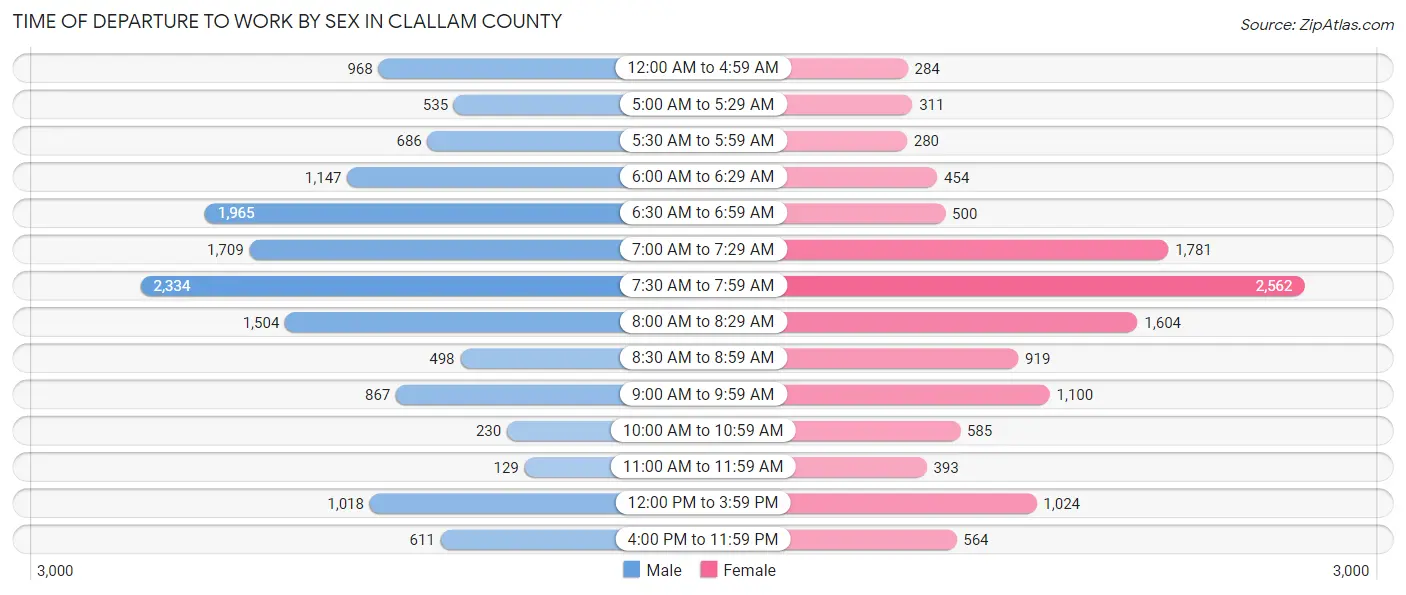
| Time of Departure | Male | Female |
| 12:00 AM to 4:59 AM | 968 (6.8%) | 284 (2.3%) |
| 5:00 AM to 5:29 AM | 535 (3.8%) | 311 (2.5%) |
| 5:30 AM to 5:59 AM | 686 (4.8%) | 280 (2.3%) |
| 6:00 AM to 6:29 AM | 1,147 (8.1%) | 454 (3.7%) |
| 6:30 AM to 6:59 AM | 1,965 (13.8%) | 500 (4.0%) |
| 7:00 AM to 7:29 AM | 1,709 (12.0%) | 1,781 (14.4%) |
| 7:30 AM to 7:59 AM | 2,334 (16.4%) | 2,562 (20.7%) |
| 8:00 AM to 8:29 AM | 1,504 (10.6%) | 1,604 (13.0%) |
| 8:30 AM to 8:59 AM | 498 (3.5%) | 919 (7.4%) |
| 9:00 AM to 9:59 AM | 867 (6.1%) | 1,100 (8.9%) |
| 10:00 AM to 10:59 AM | 230 (1.6%) | 585 (4.7%) |
| 11:00 AM to 11:59 AM | 129 (0.9%) | 393 (3.2%) |
| 12:00 PM to 3:59 PM | 1,018 (7.2%) | 1,024 (8.3%) |
| 4:00 PM to 11:59 PM | 611 (4.3%) | 564 (4.6%) |
| Total | 14,201 (100.0%) | 12,361 (100.0%) |
Housing Occupancy in Clallam County
Occupancy by Ownership in Clallam County
Of the total 34,128 dwellings in Clallam County, owner-occupied units account for 24,894 (72.9%), while renter-occupied units make up 9,234 (27.1%).
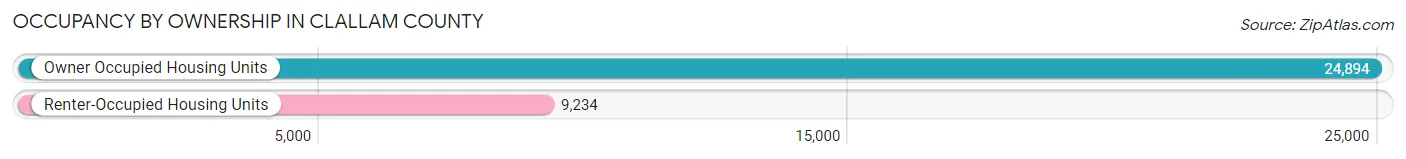
| Occupancy | # Housing Units | % Housing Units |
| Owner Occupied Housing Units | 24,894 | 72.9% |
| Renter-Occupied Housing Units | 9,234 | 27.1% |
| Total Occupied Housing Units | 34,128 | 100.0% |
Occupancy by Household Size in Clallam County
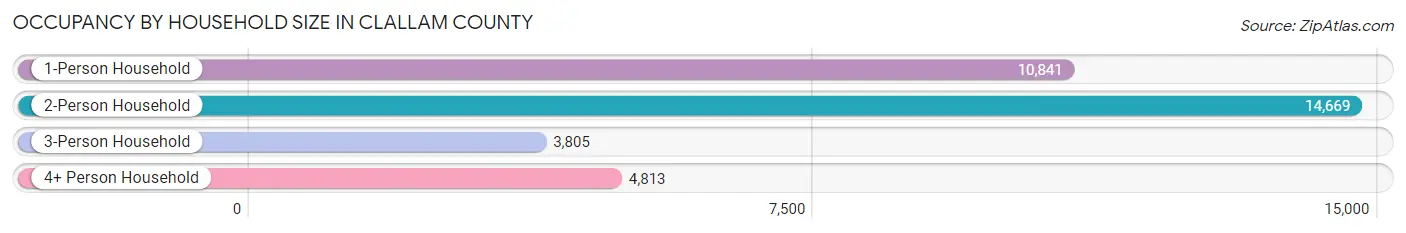
| Household Size | # Housing Units | % Housing Units |
| 1-Person Household | 10,841 | 31.8% |
| 2-Person Household | 14,669 | 43.0% |
| 3-Person Household | 3,805 | 11.2% |
| 4+ Person Household | 4,813 | 14.1% |
| Total Housing Units | 34,128 | 100.0% |
Occupancy by Ownership by Household Size in Clallam County
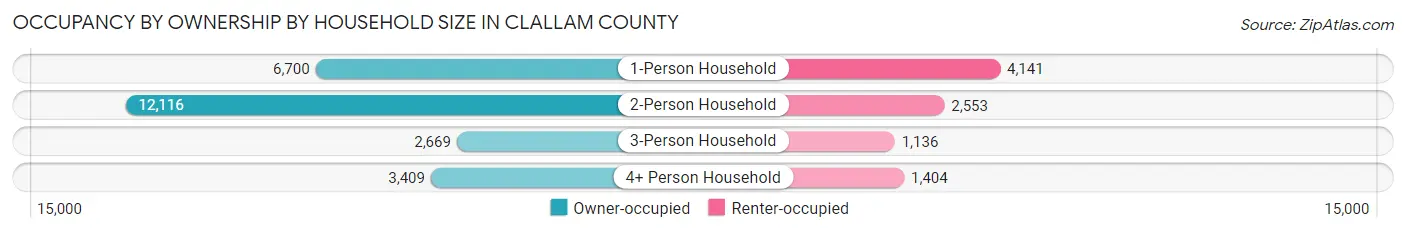
| Household Size | Owner-occupied | Renter-occupied |
| 1-Person Household | 6,700 (61.8%) | 4,141 (38.2%) |
| 2-Person Household | 12,116 (82.6%) | 2,553 (17.4%) |
| 3-Person Household | 2,669 (70.1%) | 1,136 (29.9%) |
| 4+ Person Household | 3,409 (70.8%) | 1,404 (29.2%) |
| Total Housing Units | 24,894 (72.9%) | 9,234 (27.1%) |
Occupancy by Educational Attainment in Clallam County
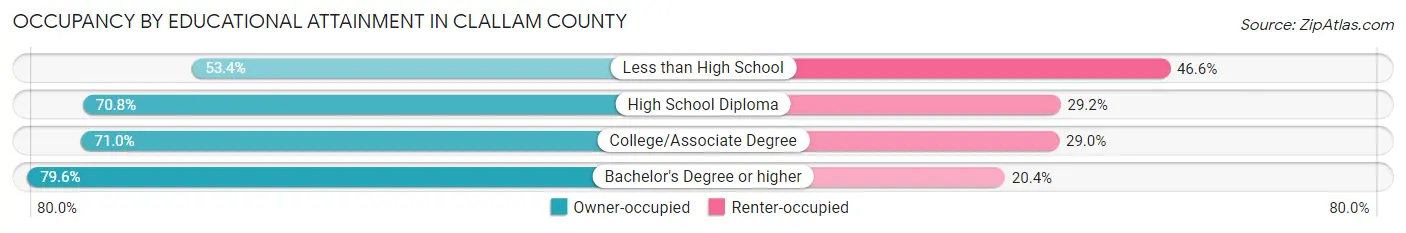
| Household Size | Owner-occupied | Renter-occupied |
| Less than High School | 920 (53.4%) | 803 (46.6%) |
| High School Diploma | 5,002 (70.8%) | 2,067 (29.2%) |
| College/Associate Degree | 9,839 (71.0%) | 4,020 (29.0%) |
| Bachelor's Degree or higher | 9,133 (79.6%) | 2,344 (20.4%) |
Occupancy by Age of Householder in Clallam County
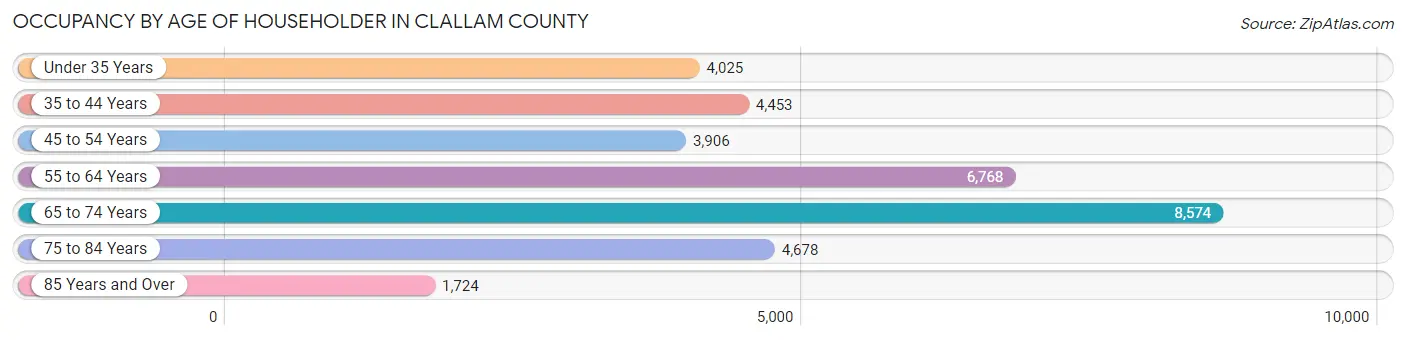
| Age Bracket | # Households | % Households |
| Under 35 Years | 4,025 | 11.8% |
| 35 to 44 Years | 4,453 | 13.1% |
| 45 to 54 Years | 3,906 | 11.5% |
| 55 to 64 Years | 6,768 | 19.8% |
| 65 to 74 Years | 8,574 | 25.1% |
| 75 to 84 Years | 4,678 | 13.7% |
| 85 Years and Over | 1,724 | 5.1% |
| Total | 34,128 | 100.0% |
Housing Finances in Clallam County
Median Income by Occupancy in Clallam County
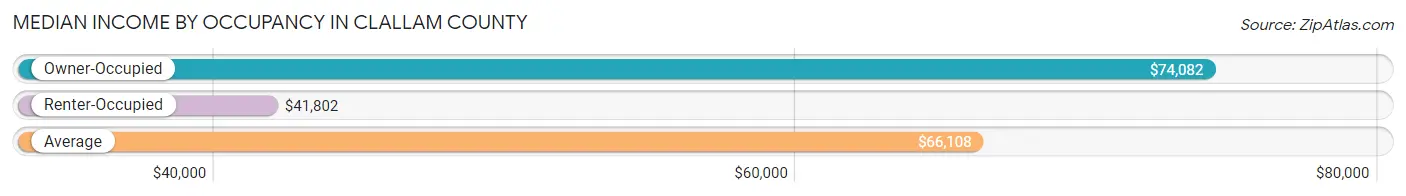
| Occupancy Type | # Households | Median Income |
| Owner-Occupied | 24,894 (72.9%) | $74,082 |
| Renter-Occupied | 9,234 (27.1%) | $41,802 |
| Average | 34,128 (100.0%) | $66,108 |
Occupancy by Householder Income Bracket in Clallam County
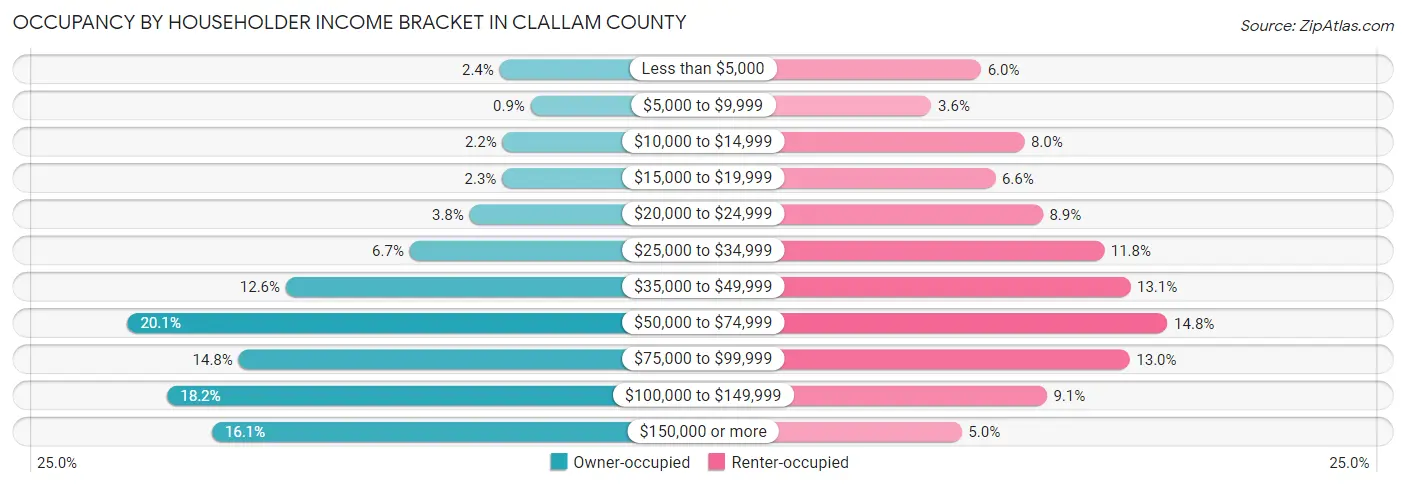
| Income Bracket | Owner-occupied | Renter-occupied |
| Less than $5,000 | 592 (2.4%) | 550 (6.0%) |
| $5,000 to $9,999 | 225 (0.9%) | 332 (3.6%) |
| $10,000 to $14,999 | 557 (2.2%) | 741 (8.0%) |
| $15,000 to $19,999 | 563 (2.3%) | 613 (6.6%) |
| $20,000 to $24,999 | 948 (3.8%) | 822 (8.9%) |
| $25,000 to $34,999 | 1,657 (6.7%) | 1,091 (11.8%) |
| $35,000 to $49,999 | 3,127 (12.6%) | 1,207 (13.1%) |
| $50,000 to $74,999 | 5,003 (20.1%) | 1,370 (14.8%) |
| $75,000 to $99,999 | 3,688 (14.8%) | 1,204 (13.0%) |
| $100,000 to $149,999 | 4,530 (18.2%) | 839 (9.1%) |
| $150,000 or more | 4,004 (16.1%) | 465 (5.0%) |
| Total | 24,894 (100.0%) | 9,234 (100.0%) |
Monthly Housing Cost Tiers in Clallam County
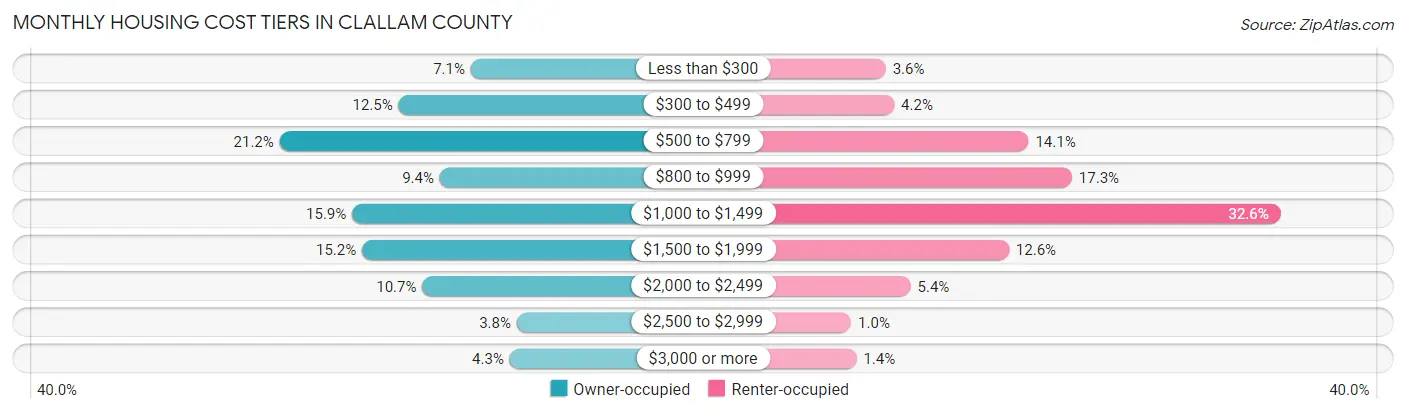
| Monthly Cost | Owner-occupied | Renter-occupied |
| Less than $300 | 1,777 (7.1%) | 329 (3.6%) |
| $300 to $499 | 3,103 (12.5%) | 386 (4.2%) |
| $500 to $799 | 5,282 (21.2%) | 1,299 (14.1%) |
| $800 to $999 | 2,345 (9.4%) | 1,595 (17.3%) |
| $1,000 to $1,499 | 3,954 (15.9%) | 3,013 (32.6%) |
| $1,500 to $1,999 | 3,772 (15.1%) | 1,166 (12.6%) |
| $2,000 to $2,499 | 2,665 (10.7%) | 498 (5.4%) |
| $2,500 to $2,999 | 933 (3.7%) | 93 (1.0%) |
| $3,000 or more | 1,063 (4.3%) | 129 (1.4%) |
| Total | 24,894 (100.0%) | 9,234 (100.0%) |
Physical Housing Characteristics in Clallam County
Housing Structures in Clallam County
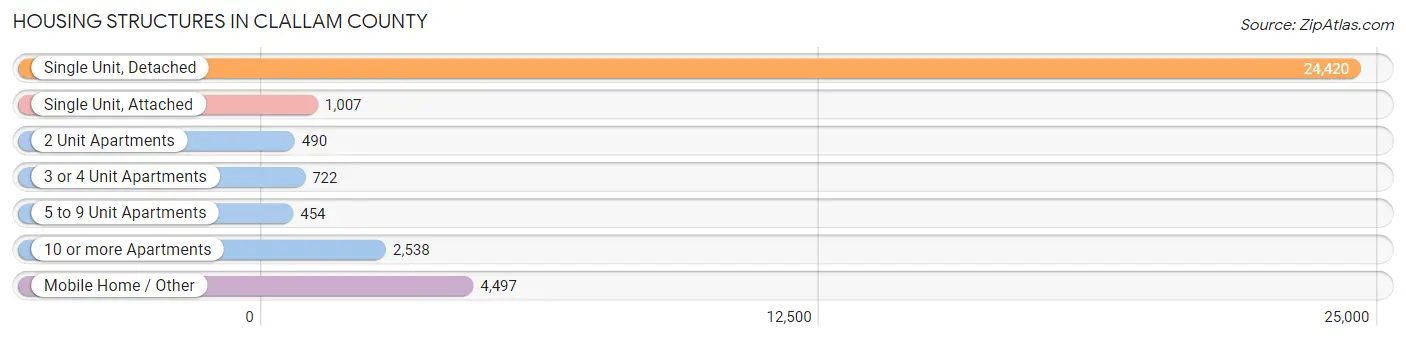
| Structure Type | # Housing Units | % Housing Units |
| Single Unit, Detached | 24,420 | 71.6% |
| Single Unit, Attached | 1,007 | 2.9% |
| 2 Unit Apartments | 490 | 1.4% |
| 3 or 4 Unit Apartments | 722 | 2.1% |
| 5 to 9 Unit Apartments | 454 | 1.3% |
| 10 or more Apartments | 2,538 | 7.4% |
| Mobile Home / Other | 4,497 | 13.2% |
| Total | 34,128 | 100.0% |
Housing Structures by Occupancy in Clallam County
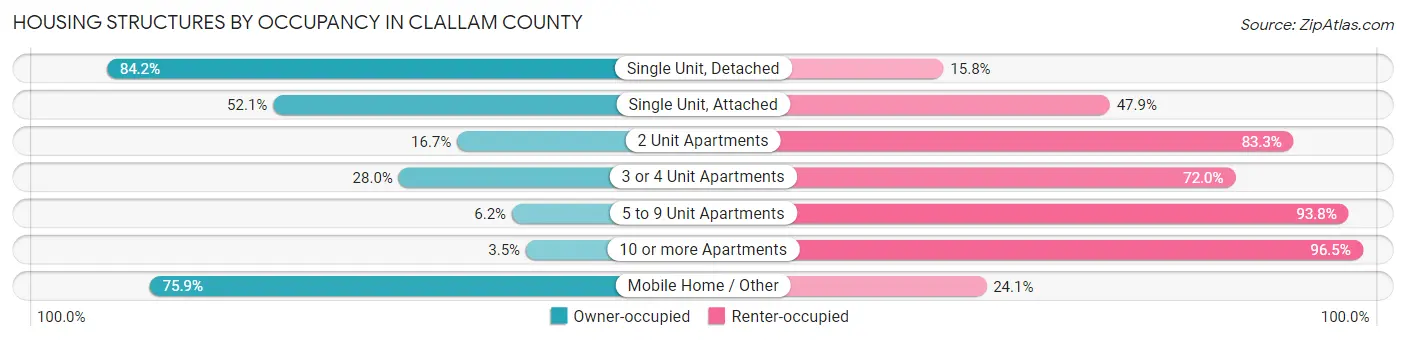
| Structure Type | Owner-occupied | Renter-occupied |
| Single Unit, Detached | 20,555 (84.2%) | 3,865 (15.8%) |
| Single Unit, Attached | 525 (52.1%) | 482 (47.9%) |
| 2 Unit Apartments | 82 (16.7%) | 408 (83.3%) |
| 3 or 4 Unit Apartments | 202 (28.0%) | 520 (72.0%) |
| 5 to 9 Unit Apartments | 28 (6.2%) | 426 (93.8%) |
| 10 or more Apartments | 88 (3.5%) | 2,450 (96.5%) |
| Mobile Home / Other | 3,414 (75.9%) | 1,083 (24.1%) |
| Total | 24,894 (72.9%) | 9,234 (27.1%) |
Housing Structures by Number of Rooms in Clallam County
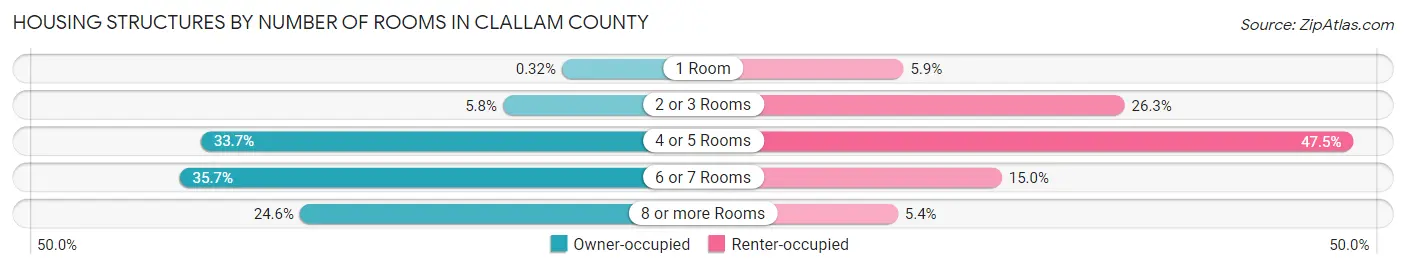
| Number of Rooms | Owner-occupied | Renter-occupied |
| 1 Room | 80 (0.3%) | 543 (5.9%) |
| 2 or 3 Rooms | 1,437 (5.8%) | 2,431 (26.3%) |
| 4 or 5 Rooms | 8,389 (33.7%) | 4,383 (47.5%) |
| 6 or 7 Rooms | 8,877 (35.7%) | 1,382 (15.0%) |
| 8 or more Rooms | 6,111 (24.5%) | 495 (5.4%) |
| Total | 24,894 (100.0%) | 9,234 (100.0%) |
Housing Structure by Heating Type in Clallam County
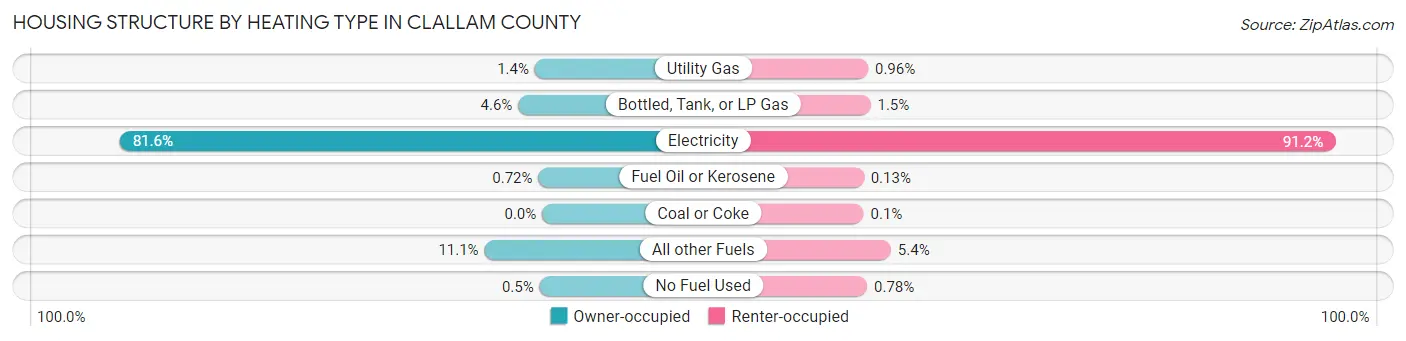
| Heating Type | Owner-occupied | Renter-occupied |
| Utility Gas | 351 (1.4%) | 89 (1.0%) |
| Bottled, Tank, or LP Gas | 1,153 (4.6%) | 134 (1.5%) |
| Electricity | 20,315 (81.6%) | 8,421 (91.2%) |
| Fuel Oil or Kerosene | 179 (0.7%) | 12 (0.1%) |
| Coal or Coke | 0 (0.0%) | 9 (0.1%) |
| All other Fuels | 2,772 (11.1%) | 497 (5.4%) |
| No Fuel Used | 124 (0.5%) | 72 (0.8%) |
| Total | 24,894 (100.0%) | 9,234 (100.0%) |
Household Vehicle Usage in Clallam County
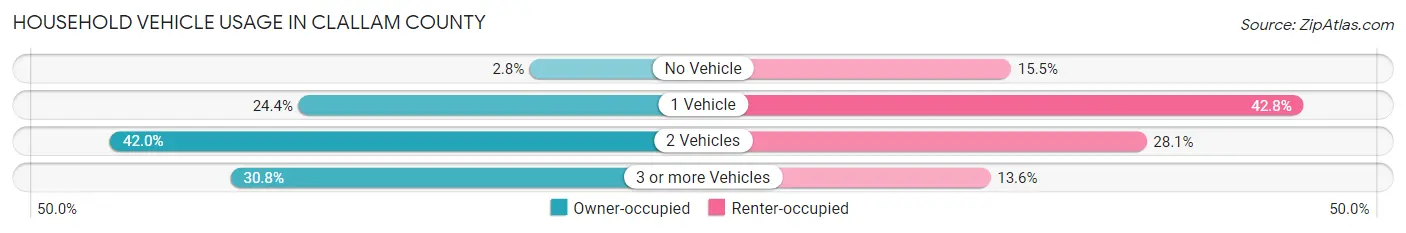
| Vehicles per Household | Owner-occupied | Renter-occupied |
| No Vehicle | 702 (2.8%) | 1,430 (15.5%) |
| 1 Vehicle | 6,076 (24.4%) | 3,953 (42.8%) |
| 2 Vehicles | 10,457 (42.0%) | 2,598 (28.1%) |
| 3 or more Vehicles | 7,659 (30.8%) | 1,253 (13.6%) |
| Total | 24,894 (100.0%) | 9,234 (100.0%) |
Real Estate & Mortgages in Clallam County
Real Estate and Mortgage Overview in Clallam County
| Characteristic | Without Mortgage | With Mortgage |
| Housing Units | 12,220 | 12,674 |
| Median Property Value | $332,500 | $367,100 |
| Median Household Income | $60,485 | $2,645 |
| Monthly Housing Costs | $573 | $1,063 |
| Real Estate Taxes | $2,683 | $375 |
Property Value by Mortgage Status in Clallam County
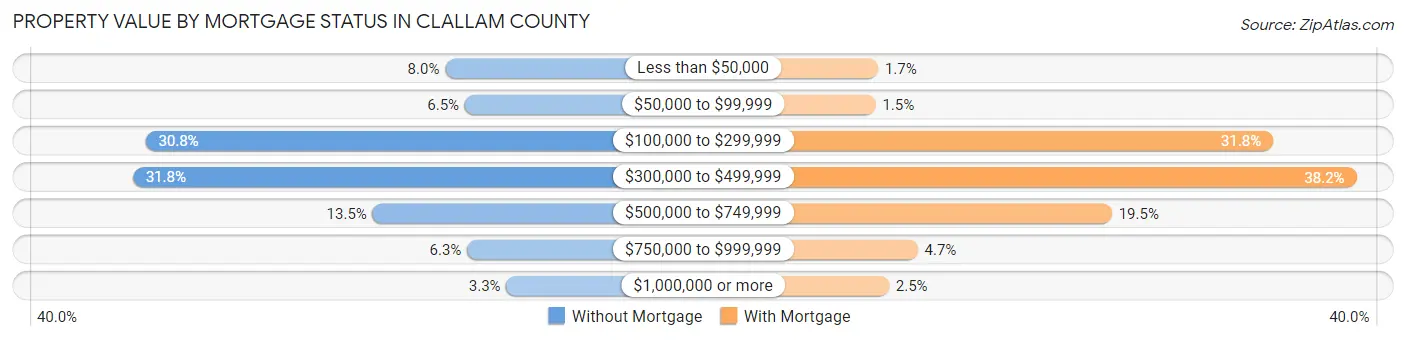
| Property Value | Without Mortgage | With Mortgage |
| Less than $50,000 | 972 (8.0%) | 217 (1.7%) |
| $50,000 to $99,999 | 788 (6.5%) | 193 (1.5%) |
| $100,000 to $299,999 | 3,762 (30.8%) | 4,032 (31.8%) |
| $300,000 to $499,999 | 3,881 (31.8%) | 4,836 (38.2%) |
| $500,000 to $749,999 | 1,647 (13.5%) | 2,474 (19.5%) |
| $750,000 to $999,999 | 768 (6.3%) | 600 (4.7%) |
| $1,000,000 or more | 402 (3.3%) | 322 (2.5%) |
| Total | 12,220 (100.0%) | 12,674 (100.0%) |
Household Income by Mortgage Status in Clallam County
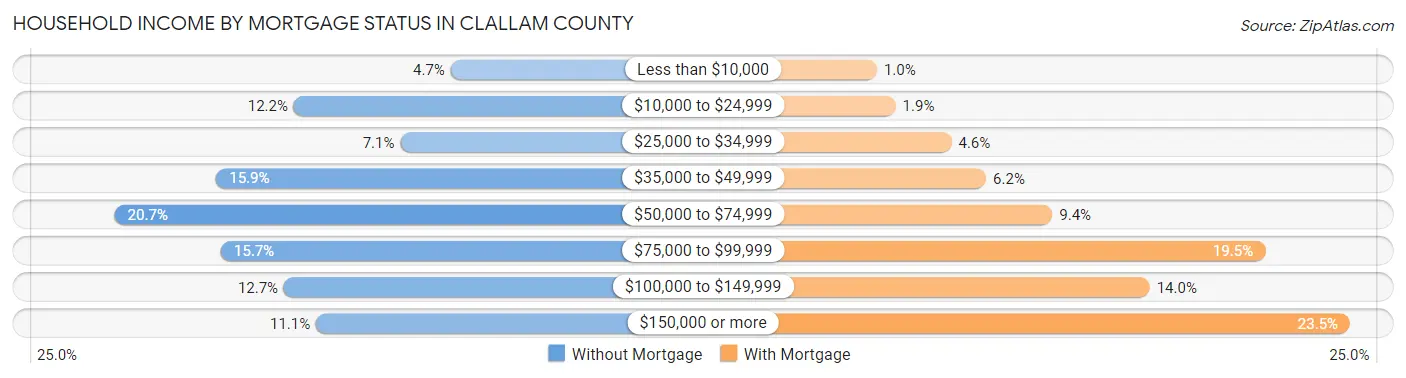
| Household Income | Without Mortgage | With Mortgage |
| Less than $10,000 | 575 (4.7%) | 129 (1.0%) |
| $10,000 to $24,999 | 1,489 (12.2%) | 242 (1.9%) |
| $25,000 to $34,999 | 869 (7.1%) | 579 (4.6%) |
| $35,000 to $49,999 | 1,939 (15.9%) | 788 (6.2%) |
| $50,000 to $74,999 | 2,531 (20.7%) | 1,188 (9.4%) |
| $75,000 to $99,999 | 1,912 (15.7%) | 2,472 (19.5%) |
| $100,000 to $149,999 | 1,546 (12.7%) | 1,776 (14.0%) |
| $150,000 or more | 1,359 (11.1%) | 2,984 (23.5%) |
| Total | 12,220 (100.0%) | 12,674 (100.0%) |
Property Value to Household Income Ratio in Clallam County
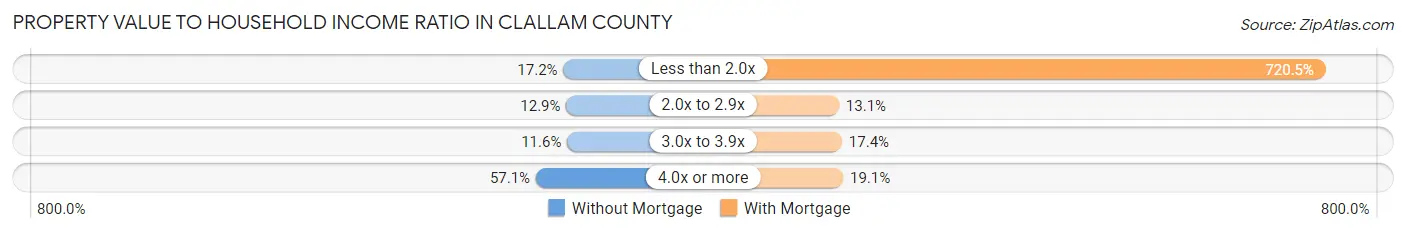
| Value-to-Income Ratio | Without Mortgage | With Mortgage |
| Less than 2.0x | 2,096 (17.2%) | 91,318 (720.5%) |
| 2.0x to 2.9x | 1,573 (12.9%) | 1,658 (13.1%) |
| 3.0x to 3.9x | 1,420 (11.6%) | 2,209 (17.4%) |
| 4.0x or more | 6,972 (57.1%) | 2,421 (19.1%) |
| Total | 12,220 (100.0%) | 12,674 (100.0%) |
Real Estate Taxes by Mortgage Status in Clallam County
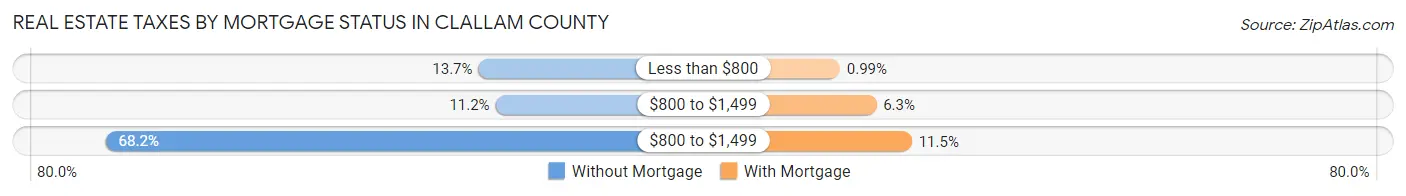
| Property Taxes | Without Mortgage | With Mortgage |
| Less than $800 | 1,674 (13.7%) | 126 (1.0%) |
| $800 to $1,499 | 1,369 (11.2%) | 800 (6.3%) |
| $800 to $1,499 | 8,328 (68.1%) | 1,457 (11.5%) |
| Total | 12,220 (100.0%) | 12,674 (100.0%) |
Health & Disability in Clallam County
Health Insurance Coverage by Age in Clallam County
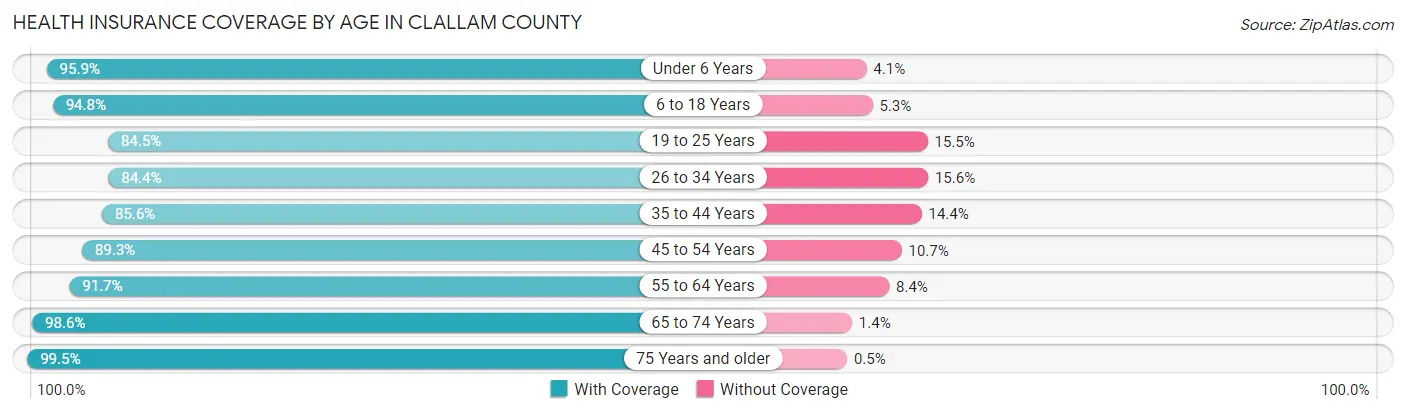
| Age Bracket | With Coverage | Without Coverage |
| Under 6 Years | 3,859 (95.9%) | 166 (4.1%) |
| 6 to 18 Years | 8,962 (94.8%) | 497 (5.2%) |
| 19 to 25 Years | 3,820 (84.5%) | 703 (15.5%) |
| 26 to 34 Years | 5,968 (84.4%) | 1,104 (15.6%) |
| 35 to 44 Years | 7,072 (85.6%) | 1,192 (14.4%) |
| 45 to 54 Years | 6,564 (89.3%) | 786 (10.7%) |
| 55 to 64 Years | 10,951 (91.6%) | 998 (8.4%) |
| 65 to 74 Years | 13,855 (98.6%) | 199 (1.4%) |
| 75 Years and older | 9,285 (99.5%) | 47 (0.5%) |
| Total | 70,336 (92.5%) | 5,692 (7.5%) |
Health Insurance Coverage by Citizenship Status in Clallam County
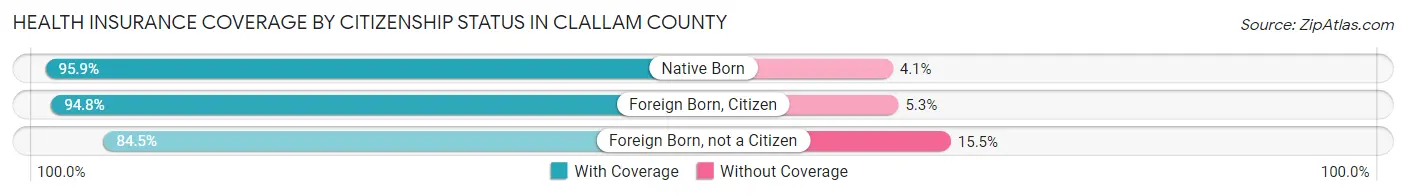
| Citizenship Status | With Coverage | Without Coverage |
| Native Born | 3,859 (95.9%) | 166 (4.1%) |
| Foreign Born, Citizen | 8,962 (94.8%) | 497 (5.2%) |
| Foreign Born, not a Citizen | 3,820 (84.5%) | 703 (15.5%) |
Health Insurance Coverage by Household Income in Clallam County
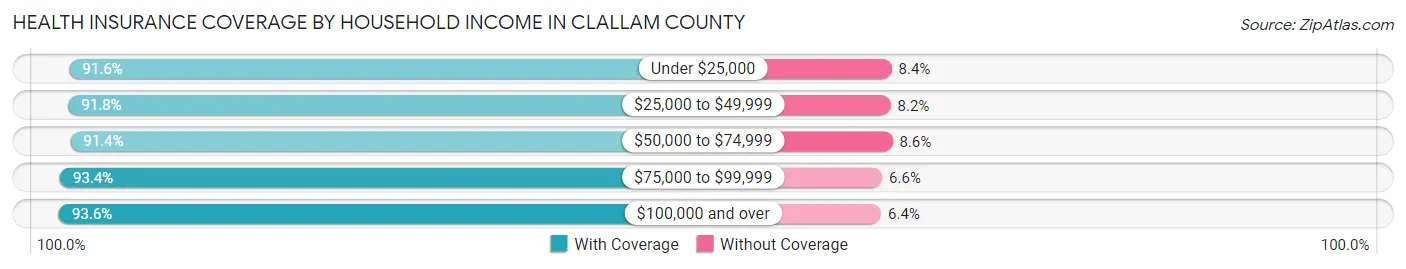
| Household Income | With Coverage | Without Coverage |
| Under $25,000 | 7,554 (91.6%) | 693 (8.4%) |
| $25,000 to $49,999 | 12,889 (91.8%) | 1,153 (8.2%) |
| $50,000 to $74,999 | 12,661 (91.4%) | 1,186 (8.6%) |
| $75,000 to $99,999 | 11,076 (93.4%) | 785 (6.6%) |
| $100,000 and over | 25,893 (93.6%) | 1,780 (6.4%) |
Public vs Private Health Insurance Coverage by Age in Clallam County
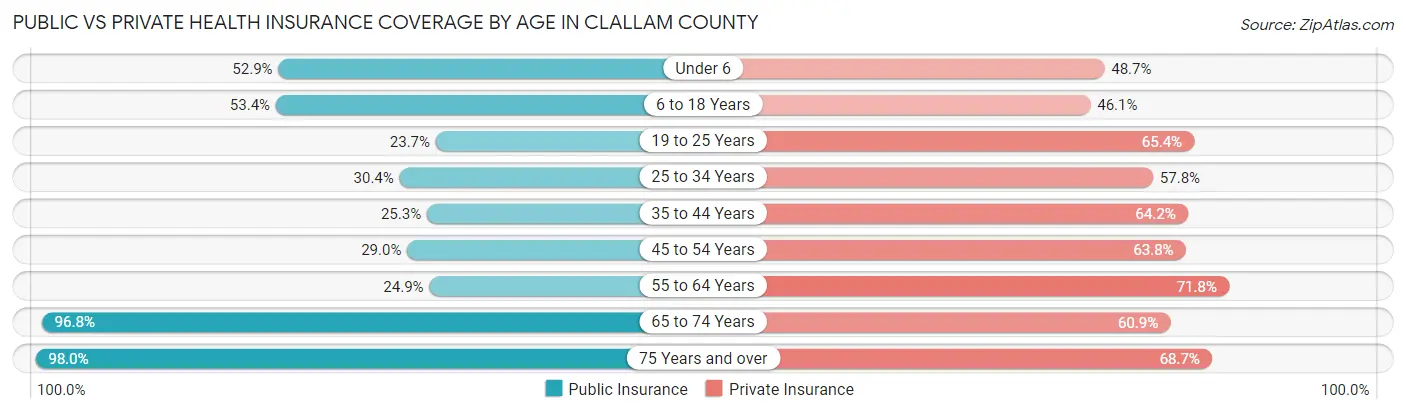
| Age Bracket | Public Insurance | Private Insurance |
| Under 6 | 2,129 (52.9%) | 1,961 (48.7%) |
| 6 to 18 Years | 5,046 (53.3%) | 4,363 (46.1%) |
| 19 to 25 Years | 1,070 (23.7%) | 2,956 (65.3%) |
| 25 to 34 Years | 2,149 (30.4%) | 4,084 (57.8%) |
| 35 to 44 Years | 2,092 (25.3%) | 5,305 (64.2%) |
| 45 to 54 Years | 2,130 (29.0%) | 4,688 (63.8%) |
| 55 to 64 Years | 2,970 (24.9%) | 8,581 (71.8%) |
| 65 to 74 Years | 13,608 (96.8%) | 8,562 (60.9%) |
| 75 Years and over | 9,146 (98.0%) | 6,406 (68.6%) |
| Total | 40,340 (53.1%) | 46,906 (61.7%) |
Disability Status by Sex by Age in Clallam County
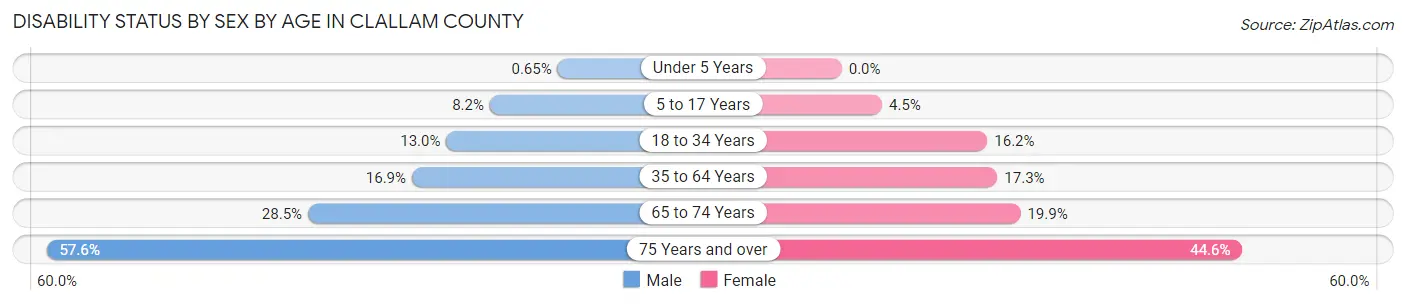
| Age Bracket | Male | Female |
| Under 5 Years | 12 (0.6%) | 0 (0.0%) |
| 5 to 17 Years | 406 (8.2%) | 210 (4.5%) |
| 18 to 34 Years | 832 (13.0%) | 953 (16.2%) |
| 35 to 64 Years | 2,260 (16.9%) | 2,454 (17.3%) |
| 65 to 74 Years | 1,863 (28.4%) | 1,494 (19.9%) |
| 75 Years and over | 2,487 (57.6%) | 2,235 (44.6%) |
Disability Class by Sex by Age in Clallam County
Disability Class: Hearing Difficulty
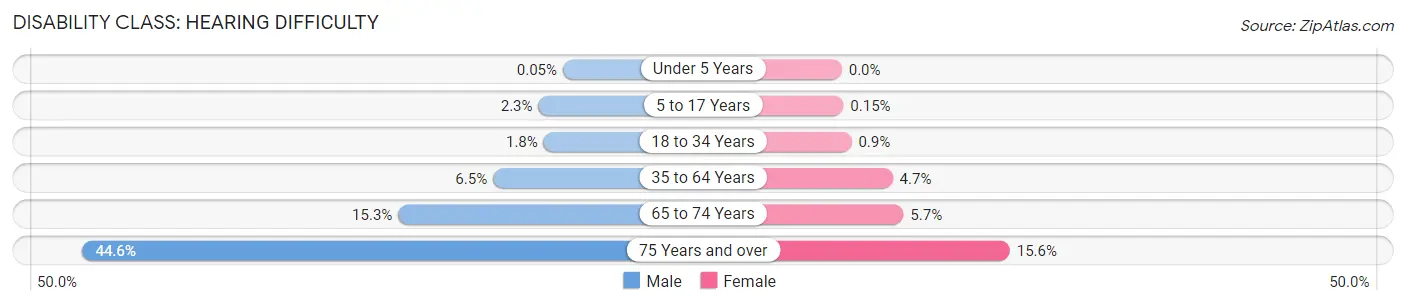
| Age Bracket | Male | Female |
| Under 5 Years | 1 (0.1%) | 0 (0.0%) |
| 5 to 17 Years | 115 (2.3%) | 7 (0.2%) |
| 18 to 34 Years | 117 (1.8%) | 53 (0.9%) |
| 35 to 64 Years | 875 (6.5%) | 668 (4.7%) |
| 65 to 74 Years | 1,004 (15.3%) | 429 (5.7%) |
| 75 Years and over | 1,928 (44.6%) | 781 (15.6%) |
Disability Class: Vision Difficulty
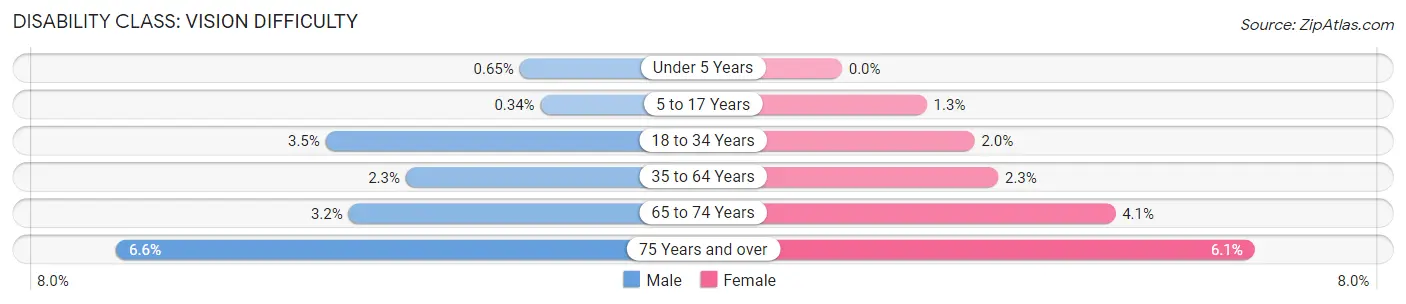
| Age Bracket | Male | Female |
| Under 5 Years | 12 (0.6%) | 0 (0.0%) |
| 5 to 17 Years | 17 (0.3%) | 59 (1.3%) |
| 18 to 34 Years | 225 (3.5%) | 116 (2.0%) |
| 35 to 64 Years | 314 (2.3%) | 329 (2.3%) |
| 65 to 74 Years | 209 (3.2%) | 305 (4.1%) |
| 75 Years and over | 287 (6.6%) | 307 (6.1%) |
Disability Class: Cognitive Difficulty
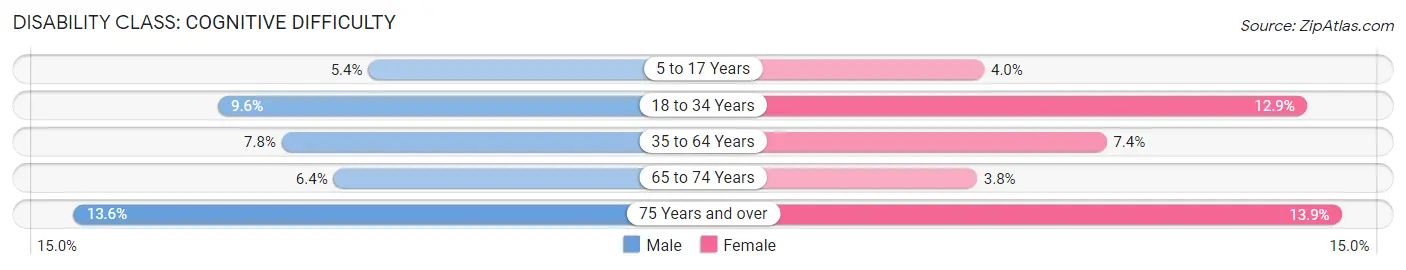
| Age Bracket | Male | Female |
| 5 to 17 Years | 269 (5.4%) | 185 (4.0%) |
| 18 to 34 Years | 613 (9.6%) | 761 (12.9%) |
| 35 to 64 Years | 1,050 (7.8%) | 1,044 (7.4%) |
| 65 to 74 Years | 419 (6.4%) | 282 (3.8%) |
| 75 Years and over | 589 (13.6%) | 697 (13.9%) |
Disability Class: Ambulatory Difficulty
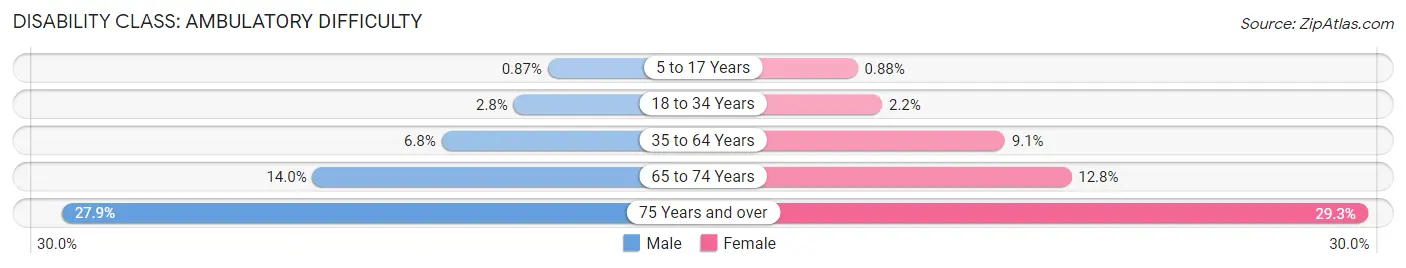
| Age Bracket | Male | Female |
| 5 to 17 Years | 43 (0.9%) | 41 (0.9%) |
| 18 to 34 Years | 177 (2.8%) | 132 (2.2%) |
| 35 to 64 Years | 908 (6.8%) | 1,286 (9.1%) |
| 65 to 74 Years | 915 (14.0%) | 959 (12.8%) |
| 75 Years and over | 1,207 (27.9%) | 1,467 (29.3%) |
Disability Class: Self-Care Difficulty
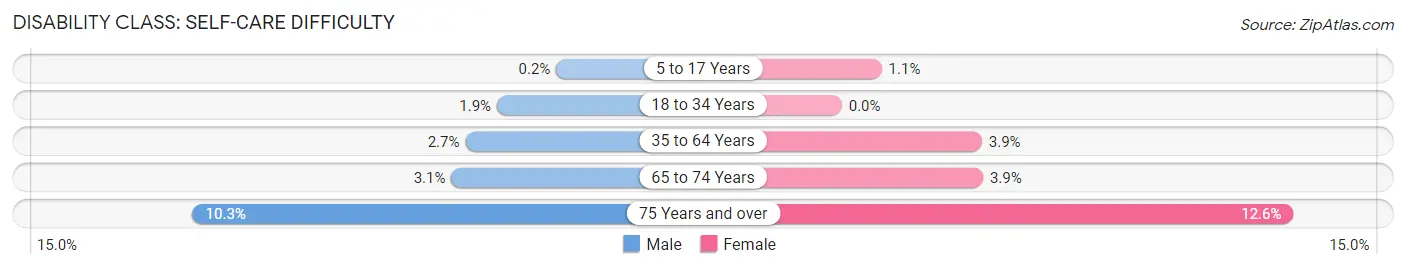
| Age Bracket | Male | Female |
| 5 to 17 Years | 10 (0.2%) | 52 (1.1%) |
| 18 to 34 Years | 118 (1.8%) | 0 (0.0%) |
| 35 to 64 Years | 366 (2.7%) | 552 (3.9%) |
| 65 to 74 Years | 204 (3.1%) | 295 (3.9%) |
| 75 Years and over | 446 (10.3%) | 630 (12.6%) |
Technology Access in Clallam County
Computing Device Access in Clallam County
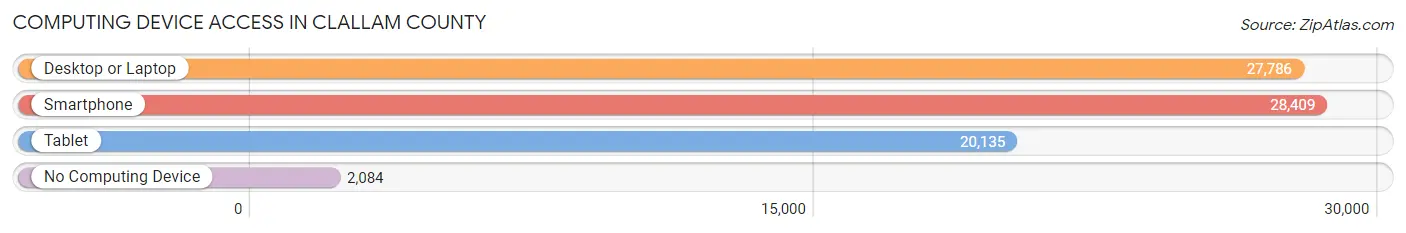
| Device Type | # Households | % Households |
| Desktop or Laptop | 27,786 | 81.4% |
| Smartphone | 28,409 | 83.2% |
| Tablet | 20,135 | 59.0% |
| No Computing Device | 2,084 | 6.1% |
| Total | 34,128 | 100.0% |
Internet Access in Clallam County
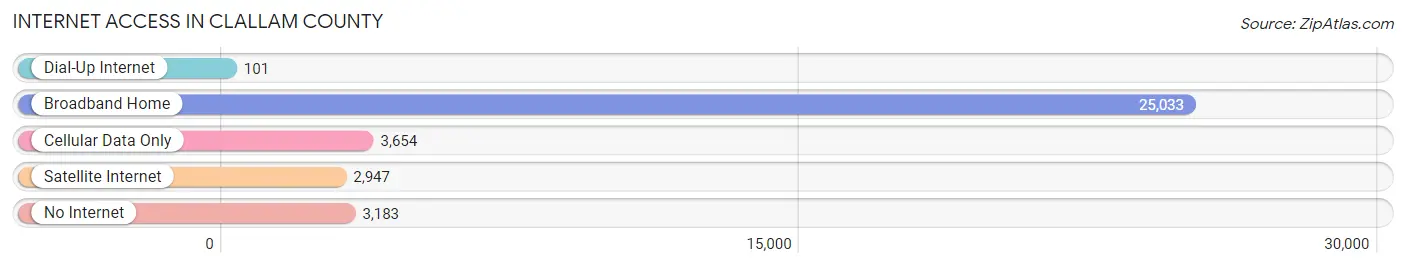
| Internet Type | # Households | % Households |
| Dial-Up Internet | 101 | 0.3% |
| Broadband Home | 25,033 | 73.4% |
| Cellular Data Only | 3,654 | 10.7% |
| Satellite Internet | 2,947 | 8.6% |
| No Internet | 3,183 | 9.3% |
| Total | 34,128 | 100.0% |
Clallam County Summary
Clallam County is located in the northwest corner of Washington State, on the Olympic Peninsula. It is bordered by the Strait of Juan de Fuca to the north, the Pacific Ocean to the west, and the Olympic Mountains to the east. The county seat is Port Angeles, and the largest city is Sequim. Clallam County is home to a population of 76,840 people, as of the 2020 census.
History
The area that is now Clallam County was first inhabited by the Klallam people, who lived in the area for thousands of years before the arrival of European settlers. The first Europeans to explore the area were Spanish explorers, who arrived in the late 1700s. In 1790, the British explorer George Vancouver explored the area and named the Strait of Juan de Fuca.
In 1853, the United States government established the Washington Territory, which included the area that is now Clallam County. The county was officially established in 1854, and was named after the Klallam people.
In the late 1800s, the area began to be settled by European immigrants, primarily from Scandinavia. The county was largely rural until the early 1900s, when the logging industry began to take off. The county also became a popular tourist destination, with visitors coming to explore the Olympic National Park and the surrounding area.
Geography
Clallam County covers an area of 2,671 square miles, making it the third-largest county in Washington State. The county is located on the Olympic Peninsula, and is bordered by the Strait of Juan de Fuca to the north, the Pacific Ocean to the west, and the Olympic Mountains to the east. The county is home to several rivers, including the Elwha, Dungeness, and Sol Duc.
The county is divided into two distinct regions: the North Olympic Peninsula and the South Olympic Peninsula. The North Olympic Peninsula is home to the Olympic National Park, as well as the cities of Port Angeles and Sequim. The South Olympic Peninsula is home to the cities of Forks and Clallam Bay.
Economy
Clallam County’s economy is largely based on tourism, logging, and fishing. The county is home to several popular tourist destinations, including the Olympic National Park, the Dungeness National Wildlife Refuge, and the Olympic Game Farm. The county is also home to several logging companies, which harvest timber from the area’s forests. Fishing is also an important part of the county’s economy, with several commercial fishing operations based in the area.
Demographics
As of the 2020 census, Clallam County had a population of 76,840 people. The population is largely white (90.2%), with smaller percentages of Native American (2.2%), Asian (2.1%), and Hispanic or Latino (2.1%) residents. The median household income in the county is $50,945, and the median home value is $269,400. The unemployment rate in the county is 5.2%.
Conclusion
Clallam County is a beautiful and diverse county located in the northwest corner of Washington State. The county is home to a population of 76,840 people, and is largely rural. The county’s economy is largely based on tourism, logging, and fishing, and the median household income is $50,945. Clallam County is a great place to live, work, and explore.
Common Questions
What is the Total Population of Clallam County?
Total Population of Clallam County is 77,333.
What is the Total Male Population of Clallam County?
Total Male Population of Clallam County is 38,422.
What is the Total Female Population of Clallam County?
Total Female Population of Clallam County is 38,911.
What is the Ratio of Males per 100 Females in Clallam County?
There are 98.74 Males per 100 Females in Clallam County.
What is the Ratio of Females per 100 Males in Clallam County?
There are 101.27 Females per 100 Males in Clallam County.
What is the Median Population Age in Clallam County?
Median Population Age in Clallam County is 51.2 Years.
What is the Average Family Size in Clallam County
Average Family Size in Clallam County is 2.8 People.
What is the Average Household Size in Clallam County
Average Household Size in Clallam County is 2.2 People.
What is Per Capita Income in Clallam County?
Per Capita income in Clallam County is $38,181.
What is the Median Family Income in Clallam County?
Median Family Income in Clallam County is $82,053.
What is the Median Household income in Clallam County?
Median Household Income in Clallam County is $66,108.
What is Income or Wage Gap in Clallam County?
Income or Wage Gap in Clallam County is 29.0%.
Women in Clallam County earn 71.0 cents for every dollar earned by a man.
What is Family Income Deficit in Clallam County?
Family Income Deficit in Clallam County is $12,649.
Families that are below poverty line in Clallam County earn $12,649 less on average than the poverty threshold level.
What is Inequality or Gini Index in Clallam County?
Inequality or Gini Index in Clallam County is 0.44.
How Large is the Labor Force in Clallam County?
There are 32,445 People in the Labor Forcein in Clallam County.
What is the Percentage of People in the Labor Force in Clallam County?
49.1% of People are in the Labor Force in Clallam County.
What is the Unemployment Rate in Clallam County?
Unemployment Rate in Clallam County is 5.4%.