Immigrants from Burma/Myanmar vs Immigrants from Brazil Unemployment

COMPARE

Immigrants from Burma/Myanmar
Race
Ancestry
AfghanAfricanAlaska NativeAlaskan AthabascanAlbanianAleutAlsatianAmericanApacheArabArapahoArgentineanArmenianAssyrian/Chaldean/SyriacAustralianAustrianBahamianBangladeshiBarbadianBasqueBelgianBelizeanBermudanBhutaneseBlackfeetBolivianBrazilianBritishBritish West IndianBulgarianBurmeseCajunCambodianCanadianCape VerdeanCarpatho RusynCelticCentral AmericanCentral American IndianCherokeeCheyenneChickasawChileanChineseChippewaChoctawColombianColvilleComancheCosta RicanCreeCreekCroatianCrowCubanCypriotCzechCzechoslovakianDanishDelawareDominicanDutchDutch West IndianEastern EuropeanEcuadorianEgyptianEnglishEstonianEthiopianEuropeanFijianFilipinoFinnishFrenchFrench American IndianFrench CanadianGermanGerman RussianGhanaianGreekGuamanian/ChamorroGuatemalanGuyaneseHaitianHmongHonduranHopiHoumaHungarianIcelanderIndian (Asian)IndonesianInupiatIranianIraqiIrishIroquoisIsraeliItalianJamaicanJapaneseJordanianKenyanKiowaKoreanLaotianLatvianLebaneseLiberianLithuanianLumbeeLuxembourgerMacedonianMalaysianMalteseMarshalleseMenomineeMexicanMexican American IndianMongolianMoroccanNative HawaiianNavajoNepaleseNew ZealanderNicaraguanNigerianNorthern EuropeanNorwegianOkinawanOsageOttawaPaiutePakistaniPalestinianPanamanianParaguayanPennsylvania GermanPeruvianPimaPolishPortuguesePotawatomiPuebloPuerto RicanPuget Sound SalishRomanianRussianSalvadoranSamoanScandinavianScotch-IrishScottishSeminoleSenegaleseSerbianShoshoneSierra LeoneanSiouxSlavicSlovakSloveneSomaliSouth AfricanSouth AmericanSouth American IndianSoviet UnionSpaniardSpanishSpanish AmericanSpanish American IndianSri LankanSubsaharan AfricanSudaneseSwedishSwissSyrianTaiwaneseThaiTlingit-HaidaTohono O'OdhamTonganTrinidadian and TobagonianTsimshianTurkishU.S. Virgin IslanderUgandanUkrainianUruguayanUteVenezuelanVietnameseWelshWest IndianYakamaYaquiYugoslavianYumanYup'ikZimbabwean
Immigration
NonimmigrantsImmigrantsAfghanistanAfricaAlbaniaArgentinaArmeniaAsiaAustraliaAustriaBahamasBangladeshBarbadosBelarusBelgiumBelizeBoliviaBosnia and HerzegovinaBulgariaBurma/MyanmarCabo VerdeCambodiaCameroonCanadaCaribbeanCentral AmericaChileChinaColombiaCongoCosta RicaCroatiaCubaCzechoslovakiaDenmarkDominicaDominican RepublicEastern AfricaEastern AsiaEastern EuropeEcuadorEgyptEl SalvadorEnglandEritreaEthiopiaEuropeFijiFranceGermanyGhanaGreeceGrenadaGuatemalaGuyanaHaitiHondurasHong KongHungaryIndiaIndonesiaIranIraqIrelandIsraelItalyJamaicaJapanJordanKazakhstanKenyaKoreaKuwaitLaosLatin AmericaLatviaLebanonLiberiaLithuaniaMalaysiaMexicoMicronesiaMiddle AfricaMoldovaMoroccoNepalNetherlandsNicaraguaNigeriaNorth AmericaNorth MacedoniaNorthern AfricaNorthern EuropeNorwayOceaniaPakistanPanamaPeruPhilippinesPolandPortugalRomaniaRussiaSaudi ArabiaScotlandSenegalSerbiaSierra LeoneSingaporeSomaliaSouth AfricaSouth AmericaSouth Central AsiaSouth Eastern AsiaSouthern EuropeSpainSri LankaSt. Vincent and the GrenadinesSudanSwedenSwitzerlandSyriaTaiwanThailandTrinidad and TobagoTurkeyUgandaUkraineUruguayUzbekistanVenezuelaVietnamWest IndiesWestern AfricaWestern AsiaWestern EuropeYemenZaireZimbabweAzores
Immigrants from Brazil
Race
Ancestry
AfghanAfricanAlaska NativeAlaskan AthabascanAlbanianAleutAlsatianAmericanApacheArabArapahoArgentineanArmenianAssyrian/Chaldean/SyriacAustralianAustrianBahamianBangladeshiBarbadianBasqueBelgianBelizeanBermudanBhutaneseBlackfeetBolivianBrazilianBritishBritish West IndianBulgarianBurmeseCajunCambodianCanadianCape VerdeanCarpatho RusynCelticCentral AmericanCentral American IndianCherokeeCheyenneChickasawChileanChineseChippewaChoctawColombianColvilleComancheCosta RicanCreeCreekCroatianCrowCubanCypriotCzechCzechoslovakianDanishDelawareDominicanDutchDutch West IndianEastern EuropeanEcuadorianEgyptianEnglishEstonianEthiopianEuropeanFijianFilipinoFinnishFrenchFrench American IndianFrench CanadianGermanGerman RussianGhanaianGreekGuamanian/ChamorroGuatemalanGuyaneseHaitianHmongHonduranHopiHoumaHungarianIcelanderIndian (Asian)IndonesianInupiatIranianIraqiIrishIroquoisIsraeliItalianJamaicanJapaneseJordanianKenyanKiowaKoreanLaotianLatvianLebaneseLiberianLithuanianLumbeeLuxembourgerMacedonianMalaysianMalteseMarshalleseMenomineeMexicanMexican American IndianMongolianMoroccanNative HawaiianNavajoNepaleseNew ZealanderNicaraguanNigerianNorthern EuropeanNorwegianOkinawanOsageOttawaPaiutePakistaniPalestinianPanamanianParaguayanPennsylvania GermanPeruvianPimaPolishPortuguesePotawatomiPuebloPuerto RicanPuget Sound SalishRomanianRussianSalvadoranSamoanScandinavianScotch-IrishScottishSeminoleSenegaleseSerbianShoshoneSierra LeoneanSiouxSlavicSlovakSloveneSomaliSouth AfricanSouth AmericanSouth American IndianSoviet UnionSpaniardSpanishSpanish AmericanSpanish American IndianSri LankanSubsaharan AfricanSudaneseSwedishSwissSyrianTaiwaneseThaiTlingit-HaidaTohono O'OdhamTonganTrinidadian and TobagonianTsimshianTurkishU.S. Virgin IslanderUgandanUkrainianUruguayanUteVenezuelanVietnameseWelshWest IndianYakamaYaquiYugoslavianYumanYup'ikZimbabwean
Immigration
NonimmigrantsImmigrantsAfghanistanAfricaAlbaniaArgentinaArmeniaAsiaAustraliaAustriaBahamasBangladeshBarbadosBelarusBelgiumBelizeBoliviaBosnia and HerzegovinaBrazilBulgariaCabo VerdeCambodiaCameroonCanadaCaribbeanCentral AmericaChileChinaColombiaCongoCosta RicaCroatiaCubaCzechoslovakiaDenmarkDominicaDominican RepublicEastern AfricaEastern AsiaEastern EuropeEcuadorEgyptEl SalvadorEnglandEritreaEthiopiaEuropeFijiFranceGermanyGhanaGreeceGrenadaGuatemalaGuyanaHaitiHondurasHong KongHungaryIndiaIndonesiaIranIraqIrelandIsraelItalyJamaicaJapanJordanKazakhstanKenyaKoreaKuwaitLaosLatin AmericaLatviaLebanonLiberiaLithuaniaMalaysiaMexicoMicronesiaMiddle AfricaMoldovaMoroccoNepalNetherlandsNicaraguaNigeriaNorth AmericaNorth MacedoniaNorthern AfricaNorthern EuropeNorwayOceaniaPakistanPanamaPeruPhilippinesPolandPortugalRomaniaRussiaSaudi ArabiaScotlandSenegalSerbiaSierra LeoneSingaporeSomaliaSouth AfricaSouth AmericaSouth Central AsiaSouth Eastern AsiaSouthern EuropeSpainSri LankaSt. Vincent and the GrenadinesSudanSwedenSwitzerlandSyriaTaiwanThailandTrinidad and TobagoTurkeyUgandaUkraineUruguayUzbekistanVenezuelaVietnamWest IndiesWestern AfricaWestern AsiaWestern EuropeYemenZaireZimbabweAzores
Unemployment
Income
Poverty
Unemployment
Labor Participation
Family Structure
Vehicle Availability
Education Level
Disability

Unemployment Comparison

Immigrants from Burma/Myanmar

Immigrants from Brazil

Excellent
Good
5.1%
UNEMPLOYMENT
86.2/ 100
METRIC RATING
135th/ 347
METRIC RANK
5.2%
UNEMPLOYMENT
63.1/ 100
METRIC RATING
165th/ 347
METRIC RANK

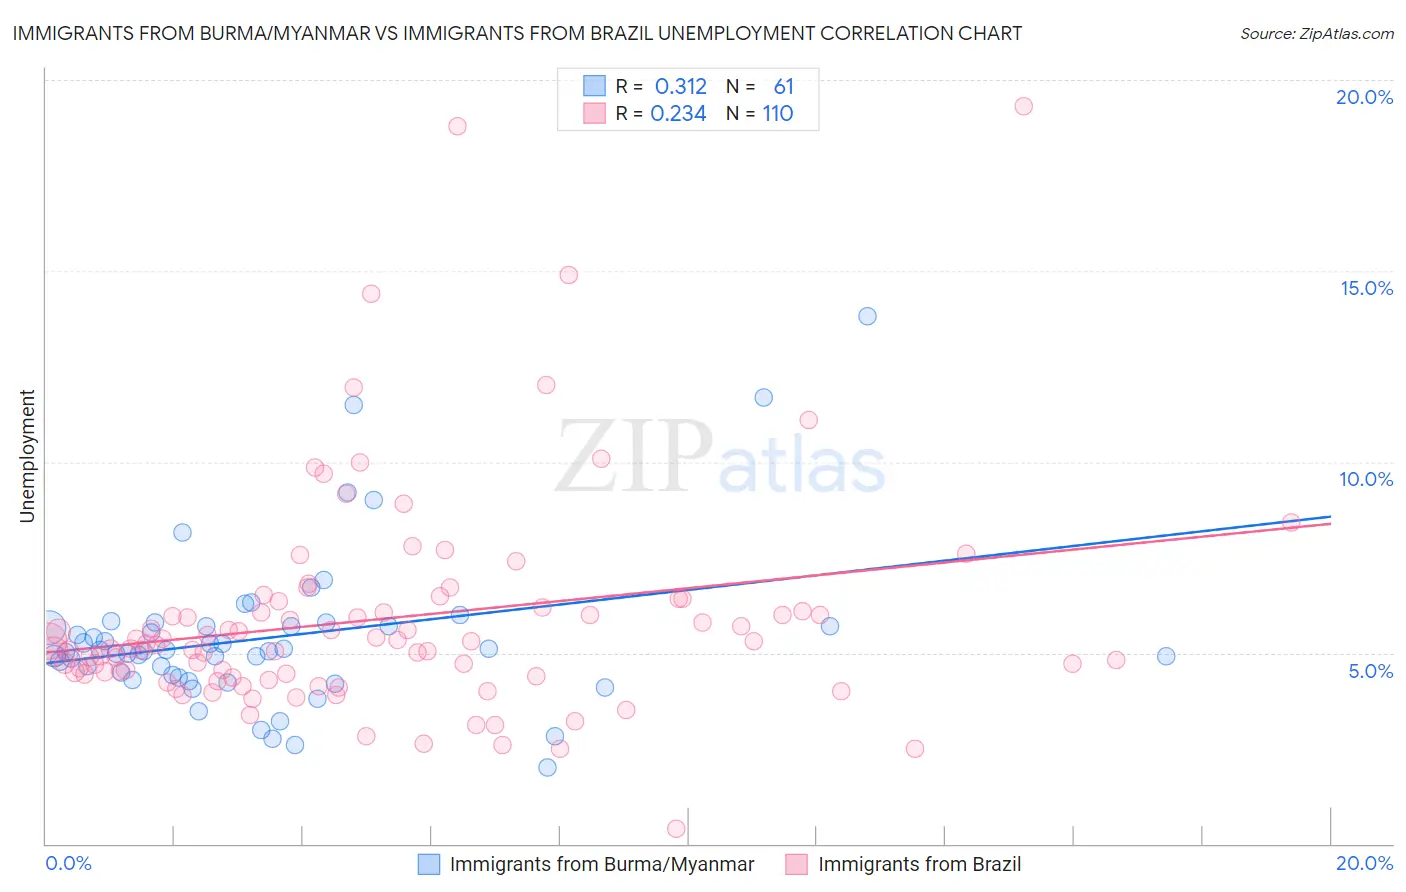
Immigrants from Burma/Myanmar vs Immigrants from Brazil Unemployment Correlation Chart

The statistical analysis conducted on geographies consisting of 172,291,734 people shows a mild positive correlation between the proportion of Immigrants from Burma/Myanmar and unemployment in the United States with a correlation coefficient (R) of 0.312 and weighted average of 5.1%. Similarly, the statistical analysis conducted on geographies consisting of 342,796,240 people shows a weak positive correlation between the proportion of Immigrants from Brazil and unemployment in the United States with a correlation coefficient (R) of 0.234 and weighted average of 5.2%, a difference of 2.1%.
Immigrants from Burma/Myanmar vs Immigrants from Brazil Unemployment

Unemployment Correlation Summary

MeasurementImmigrants from Burma/MyanmarImmigrants from Brazil
Minimum2.0%0.40%
Maximum13.8%19.3%
Range11.8%18.9%
Mean5.4%5.9%
Median5.0%5.2%
Interquartile 25% (IQ1)4.4%4.5%
Interquartile 75% (IQ3)5.7%6.2%
Interquartile Range (IQR)1.3%1.7%
Standard Deviation (Sample)2.1%2.9%
Standard Deviation (Population)2.0%2.9%

Similar Demographics by Unemployment

Demographics Similar to Immigrants from Burma/Myanmar by Unemployment

In terms of unemployment, the demographic groups most similar to Immigrants from Burma/Myanmar are Immigrants from Europe (5.1%, a difference of 0.010%), Immigrants from Spain (5.1%, a difference of 0.010%), Immigrants from Jordan (5.1%, a difference of 0.050%), Immigrants from Ethiopia (5.1%, a difference of 0.060%), and Immigrants from Croatia (5.1%, a difference of 0.070%).
DemographicsRating | RankUnemployment
Immigrants | Eastern Africa
88.1
/100
|
#128
Excellent
5.1%
Immigrants | Latvia
88.0
/100
|
#129
Excellent
5.1%
Iranians
86.9
/100
|
#130
Excellent
5.1%
Immigrants | Croatia
86.8
/100
|
#131
Excellent
5.1%
Immigrants | Ethiopia
86.7
/100
|
#132
Excellent
5.1%
Immigrants | Jordan
86.6
/100
|
#133
Excellent
5.1%
Immigrants | Europe
86.3
/100
|
#134
Excellent
5.1%
Immigrants | Burma/Myanmar
86.2
/100
|
#135
Excellent
5.1%
Immigrants | Spain
86.2
/100
|
#136
Excellent
5.1%
Immigrants | Saudi Arabia
85.6
/100
|
#137
Excellent
5.1%
Immigrants | Hungary
85.6
/100
|
#138
Excellent
5.1%
Pakistanis
85.3
/100
|
#139
Excellent
5.1%
Immigrants | Denmark
84.3
/100
|
#140
Excellent
5.1%
Palestinians
83.4
/100
|
#141
Excellent
5.1%
Immigrants | Pakistan
83.2
/100
|
#142
Excellent
5.1%

Demographics Similar to Immigrants from Brazil by Unemployment

In terms of unemployment, the demographic groups most similar to Immigrants from Brazil are Immigrants from Zaire (5.2%, a difference of 0.11%), Immigrants from Colombia (5.2%, a difference of 0.11%), Spanish (5.2%, a difference of 0.13%), Immigrants from Indonesia (5.2%, a difference of 0.13%), and Colombian (5.2%, a difference of 0.13%).
DemographicsRating | RankUnemployment
Immigrants | Egypt
66.7
/100
|
#158
Good
5.2%
Immigrants | Russia
66.6
/100
|
#159
Good
5.2%
Laotians
66.3
/100
|
#160
Good
5.2%
Immigrants | Oceania
65.2
/100
|
#161
Good
5.2%
Spanish
65.1
/100
|
#162
Good
5.2%
Immigrants | Zaire
64.7
/100
|
#163
Good
5.2%
Immigrants | Colombia
64.7
/100
|
#164
Good
5.2%
Immigrants | Brazil
63.1
/100
|
#165
Good
5.2%
Immigrants | Indonesia
61.2
/100
|
#166
Good
5.2%
Colombians
61.1
/100
|
#167
Good
5.2%
Uruguayans
60.2
/100
|
#168
Good
5.2%
Immigrants | Morocco
59.1
/100
|
#169
Average
5.2%
Immigrants | Nicaragua
57.1
/100
|
#170
Average
5.2%
Puget Sound Salish
56.6
/100
|
#171
Average
5.2%
Immigrants | Vietnam
52.5
/100
|
#172
Average
5.2%