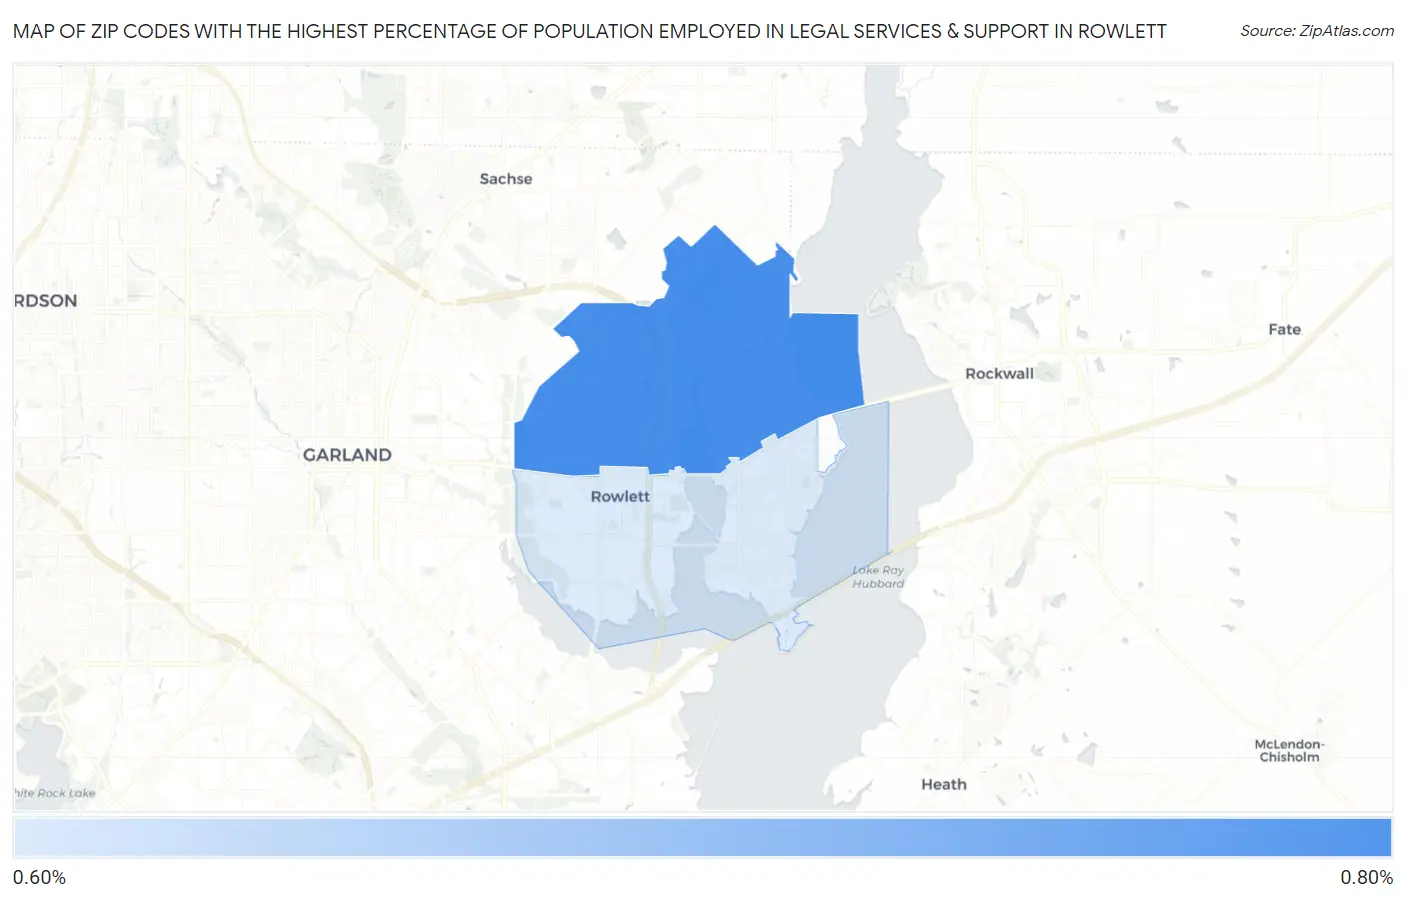
Zip Codes with the Highest Percentage of Population Employed in Legal Services & Support in Rowlett, TX
RELATED REPORTS & OPTIONS
Legal Services & Support
Rowlett
Compare Zip Codes
Map of Zip Codes with the Highest Percentage of Population Employed in Legal Services & Support in Rowlett
0.0%
0.80%
Zip Codes with the Highest Percentage of Population Employed in Legal Services & Support in Rowlett, TX
| Zip Code | % Employed | vs State | vs National | |
| 1. | 75089 | 0.80% | 1.0%(-0.209)#528 | 1.2%(-0.385)#9,455 |
| 2. | 75088 | 0.67% | 1.0%(-0.336)#624 | 1.2%(-0.512)#10,705 |
1
Common Questions
What are the Top Zip Codes with the Highest Percentage of Population Employed in Legal Services & Support in Rowlett, TX?
Top Zip Codes with the Highest Percentage of Population Employed in Legal Services & Support in Rowlett, TX are:
What zip code has the Highest Percentage of Population Employed in Legal Services & Support in Rowlett, TX?
75089 has the Highest Percentage of Population Employed in Legal Services & Support in Rowlett, TX with 0.80%.
What is the Percentage of Population Employed in Legal Services & Support in Rowlett, TX?
Percentage of Population Employed in Legal Services & Support in Rowlett is 0.80%.
What is the Percentage of Population Employed in Legal Services & Support in Texas?
Percentage of Population Employed in Legal Services & Support in Texas is 1.0%.
What is the Percentage of Population Employed in Legal Services & Support in the United States?
Percentage of Population Employed in Legal Services & Support in the United States is 1.2%.