Zip Codes with the Highest Percentage of Population Employed in Office & Administration in Rowlett, TX
RELATED REPORTS & OPTIONS
Office & Administration
Rowlett
Compare Zip Codes
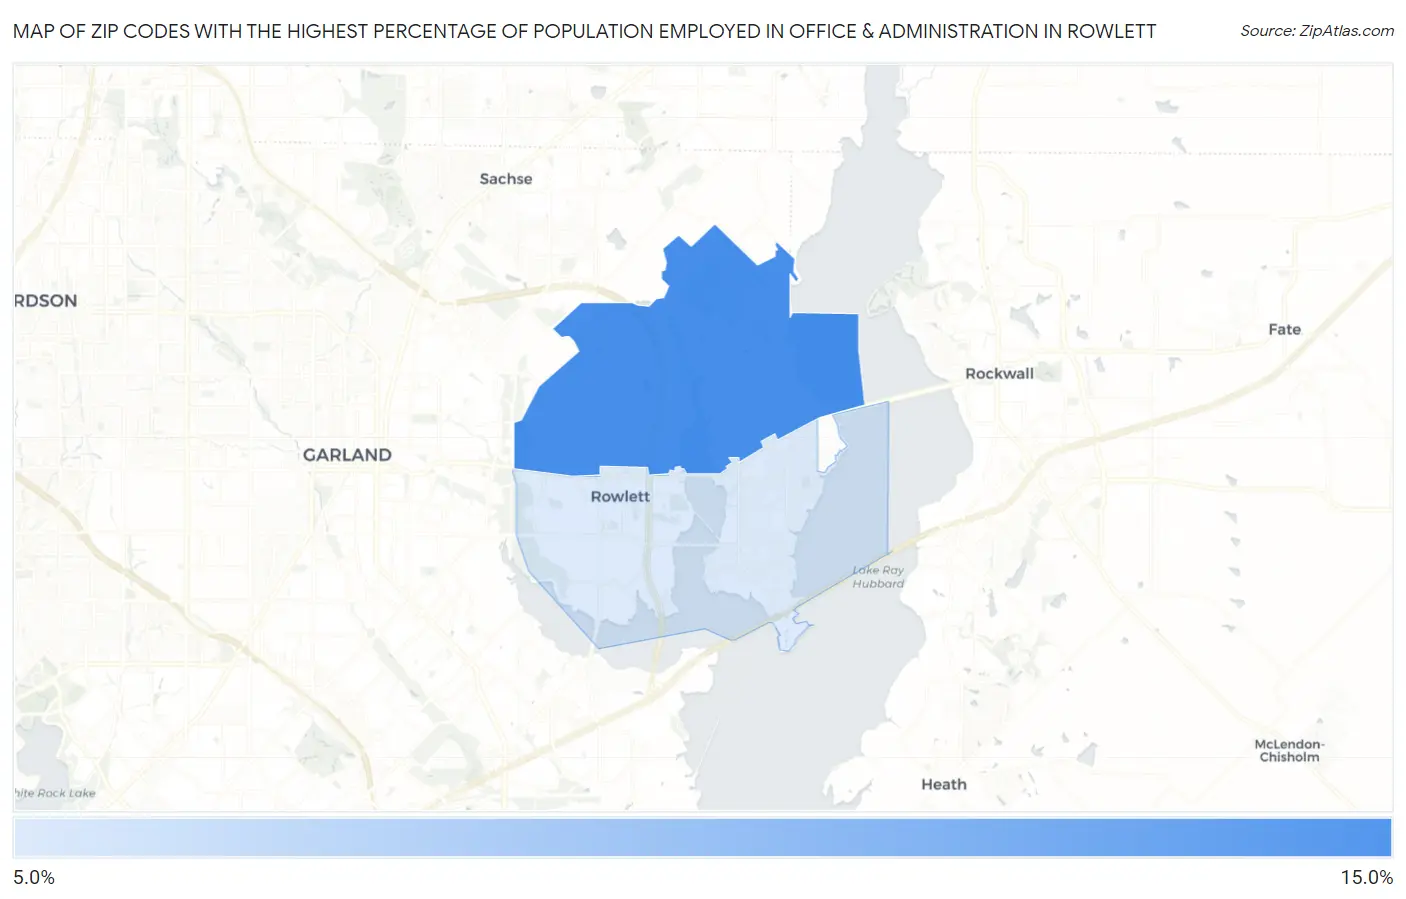
Map of Zip Codes with the Highest Percentage of Population Employed in Office & Administration in Rowlett
0.0%
15.0%
Zip Codes with the Highest Percentage of Population Employed in Office & Administration in Rowlett, TX
| Zip Code | % Employed | vs State | vs National | |
| 1. | 75089 | 12.1% | 11.0%(+1.11)#640 | 10.9%(+1.22)#10,499 |
| 2. | 75088 | 11.6% | 11.0%(+0.595)#718 | 10.9%(+0.710)#12,053 |
1
Common Questions
What are the Top Zip Codes with the Highest Percentage of Population Employed in Office & Administration in Rowlett, TX?
Top Zip Codes with the Highest Percentage of Population Employed in Office & Administration in Rowlett, TX are:
What zip code has the Highest Percentage of Population Employed in Office & Administration in Rowlett, TX?
75089 has the Highest Percentage of Population Employed in Office & Administration in Rowlett, TX with 12.1%.
What is the Percentage of Population Employed in Office & Administration in Rowlett, TX?
Percentage of Population Employed in Office & Administration in Rowlett is 11.8%.
What is the Percentage of Population Employed in Office & Administration in Texas?
Percentage of Population Employed in Office & Administration in Texas is 11.0%.
What is the Percentage of Population Employed in Office & Administration in the United States?
Percentage of Population Employed in Office & Administration in the United States is 10.9%.