Zip Codes with the Highest Percentage of Population Employed in Legal Services & Support in Port Arthur, TX
RELATED REPORTS & OPTIONS
Legal Services & Support
Port Arthur
Compare Zip Codes
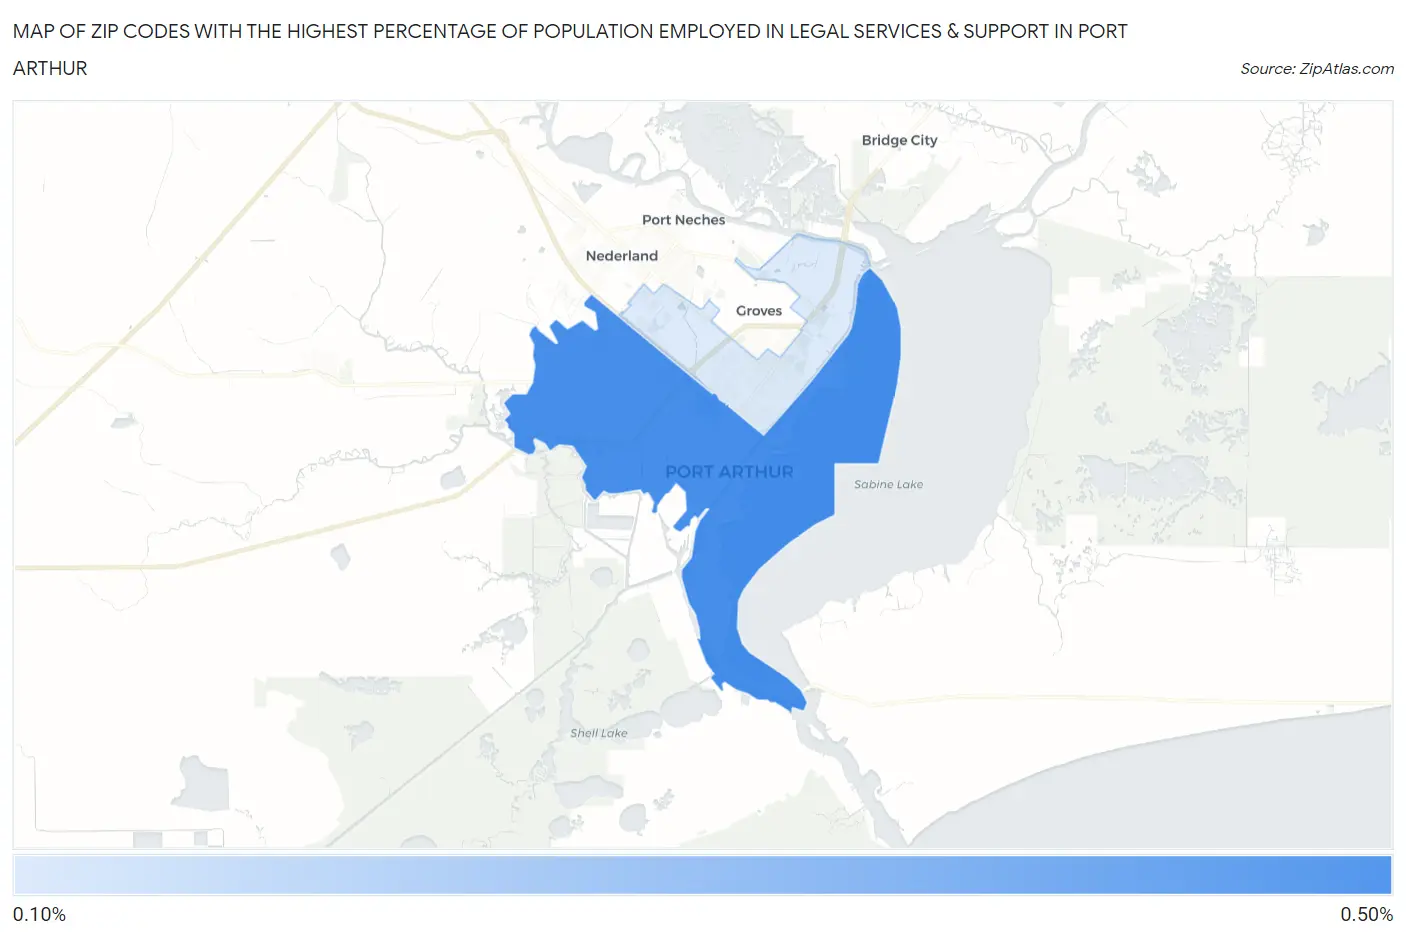
Map of Zip Codes with the Highest Percentage of Population Employed in Legal Services & Support in Port Arthur
0.0%
0.50%
Zip Codes with the Highest Percentage of Population Employed in Legal Services & Support in Port Arthur, TX
| Zip Code | % Employed | vs State | vs National | |
| 1. | 77640 | 0.50% | 1.0%(-0.509)#750 | 1.2%(-0.685)#12,652 |
| 2. | 77642 | 0.19% | 1.0%(-0.817)#1,006 | 1.2%(-0.992)#16,283 |
1
Common Questions
What are the Top Zip Codes with the Highest Percentage of Population Employed in Legal Services & Support in Port Arthur, TX?
Top Zip Codes with the Highest Percentage of Population Employed in Legal Services & Support in Port Arthur, TX are:
What zip code has the Highest Percentage of Population Employed in Legal Services & Support in Port Arthur, TX?
77640 has the Highest Percentage of Population Employed in Legal Services & Support in Port Arthur, TX with 0.50%.
What is the Percentage of Population Employed in Legal Services & Support in Port Arthur, TX?
Percentage of Population Employed in Legal Services & Support in Port Arthur is 0.28%.
What is the Percentage of Population Employed in Legal Services & Support in Texas?
Percentage of Population Employed in Legal Services & Support in Texas is 1.0%.
What is the Percentage of Population Employed in Legal Services & Support in the United States?
Percentage of Population Employed in Legal Services & Support in the United States is 1.2%.