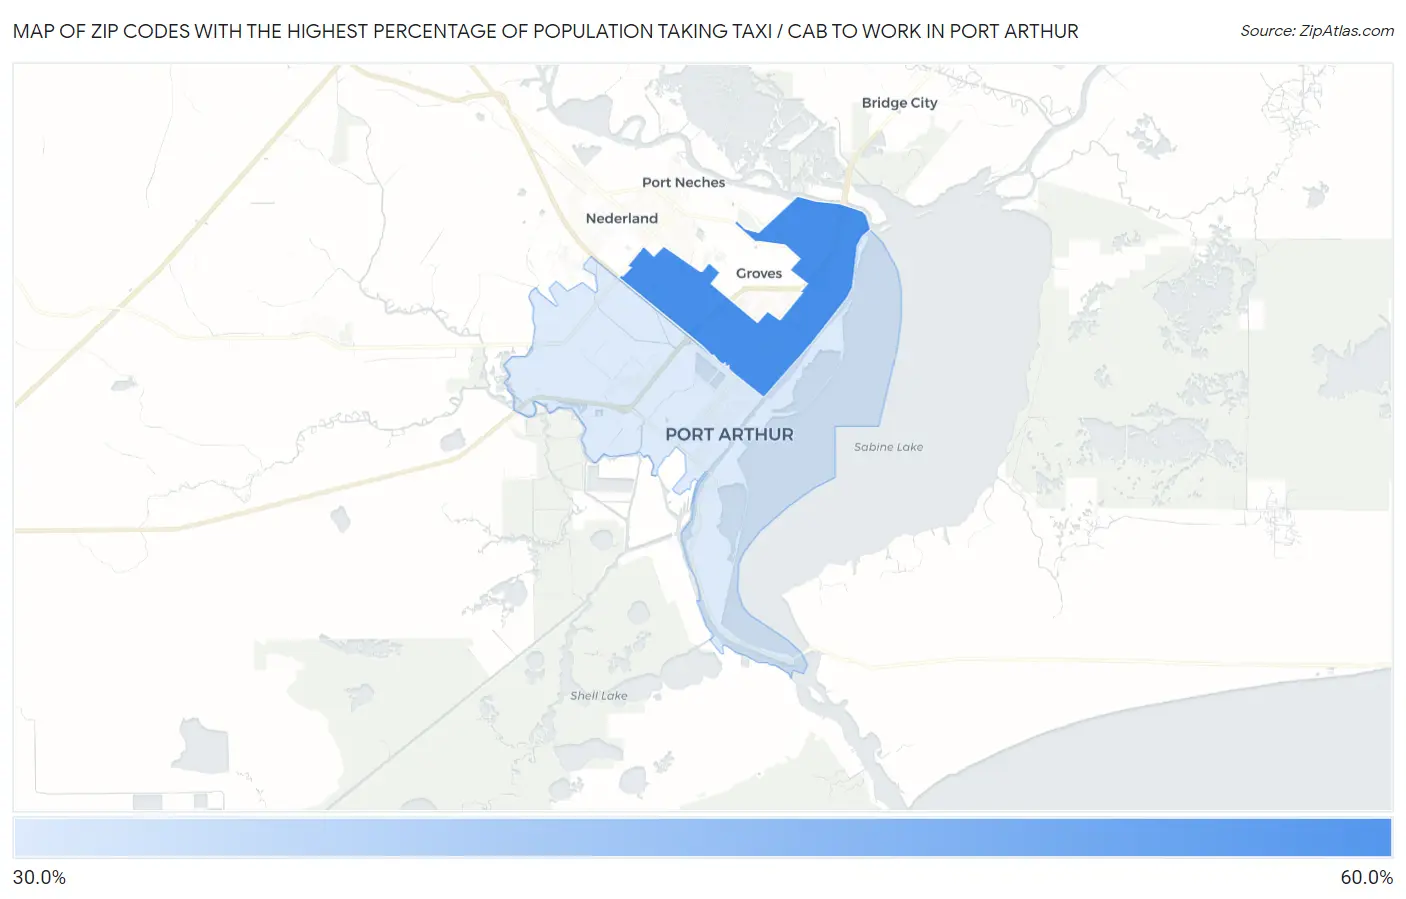
Zip Codes with the Highest Percentage of Population Taking Taxi / Cab to Work in Port Arthur, TX
RELATED REPORTS & OPTIONS
Taxi / Cab
Port Arthur
Compare Zip Codes
Map of Zip Codes with the Highest Percentage of Population Taking Taxi / Cab to Work in Port Arthur
0.0%
60.0%
Zip Codes with the Highest Percentage of Population Taking Taxi / Cab to Work in Port Arthur, TX
| Zip Code | % Take Taxi / Cab | vs State | vs National | |
| 1. | 77642 | 53.4% | 36.9%(+16.5)#107 | 38.2%(+15.2)#1,987 |
| 2. | 77640 | 31.4% | 36.9%(-5.50)#656 | 38.2%(-6.80)#10,409 |
1
Common Questions
What are the Top Zip Codes with the Highest Percentage of Population Taking Taxi / Cab to Work in Port Arthur, TX?
Top Zip Codes with the Highest Percentage of Population Taking Taxi / Cab to Work in Port Arthur, TX are:
What zip code has the Highest Percentage of Population Taking Taxi / Cab to Work in Port Arthur, TX?
77642 has the Highest Percentage of Population Taking Taxi / Cab to Work in Port Arthur, TX with 53.4%.
What is the Percentage of Population Taking Taxi / Cab to Work in Port Arthur, TX?
Percentage of Population Taking Taxi / Cab to Work in Port Arthur is 32.3%.
What is the Percentage of Population Taking Taxi / Cab to Work in Texas?
Percentage of Population Taking Taxi / Cab to Work in Texas is 36.9%.
What is the Percentage of Population Taking Taxi / Cab to Work in the United States?
Percentage of Population Taking Taxi / Cab to Work in the United States is 38.2%.