Zip Codes with the Highest Percentage of Population Employed in Installation, Maintenance & Repair in Port Arthur, TX
RELATED REPORTS & OPTIONS
Installation, Maintenance & Repair
Port Arthur
Compare Zip Codes
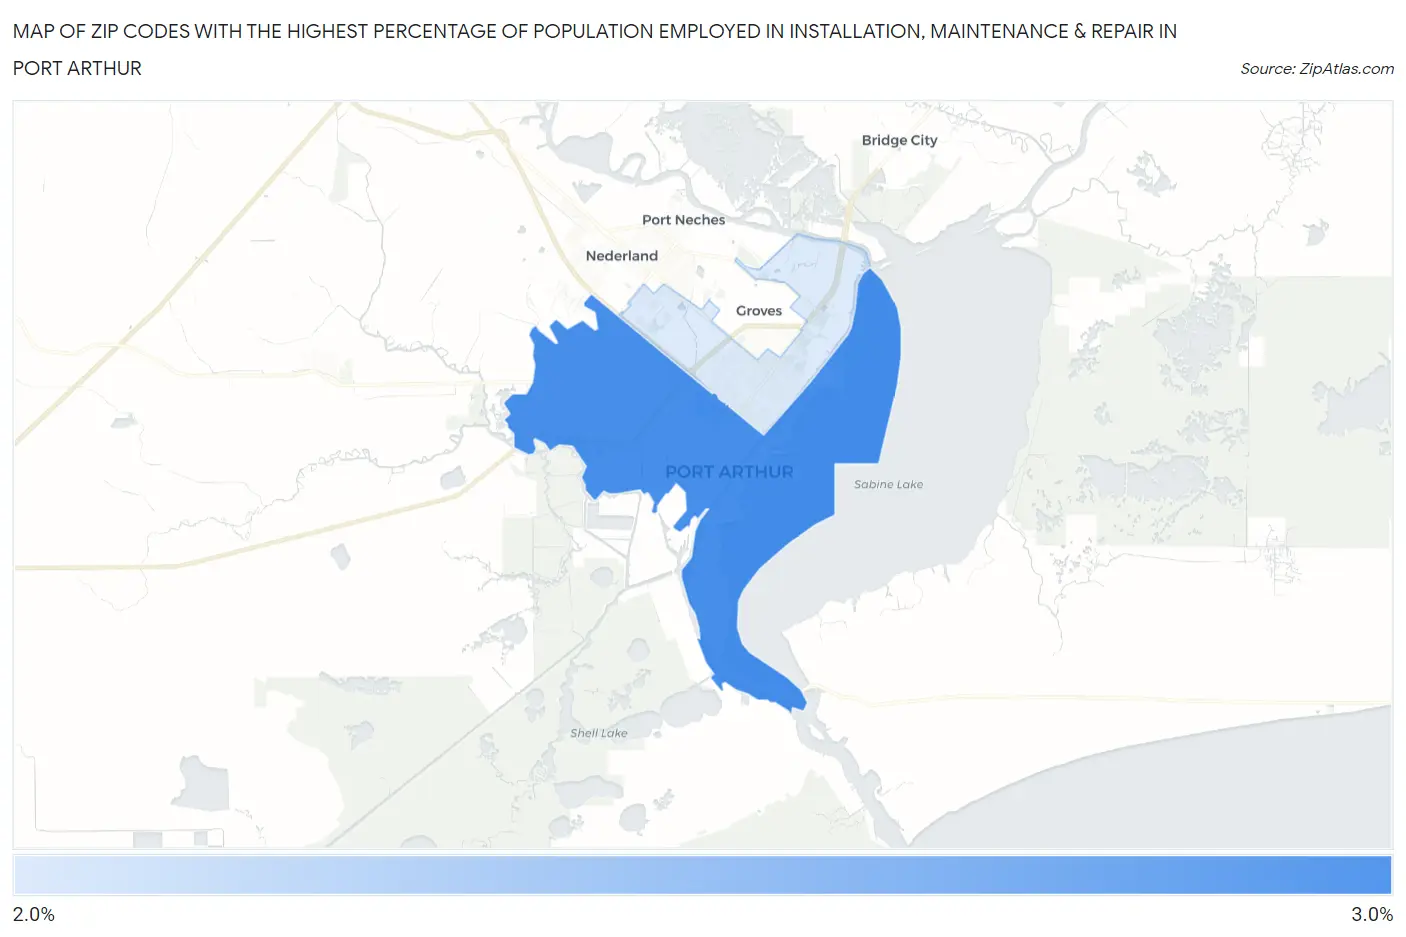
Map of Zip Codes with the Highest Percentage of Population Employed in Installation, Maintenance & Repair in Port Arthur
0.0%
3.0%
Zip Codes with the Highest Percentage of Population Employed in Installation, Maintenance & Repair in Port Arthur, TX
| Zip Code | % Employed | vs State | vs National | |
| 1. | 77640 | 2.8% | 3.4%(-0.576)#1,106 | 3.1%(-0.241)#17,861 |
| 2. | 77642 | 2.7% | 3.4%(-0.752)#1,151 | 3.1%(-0.416)#18,810 |
1
Common Questions
What are the Top Zip Codes with the Highest Percentage of Population Employed in Installation, Maintenance & Repair in Port Arthur, TX?
Top Zip Codes with the Highest Percentage of Population Employed in Installation, Maintenance & Repair in Port Arthur, TX are:
What zip code has the Highest Percentage of Population Employed in Installation, Maintenance & Repair in Port Arthur, TX?
77640 has the Highest Percentage of Population Employed in Installation, Maintenance & Repair in Port Arthur, TX with 2.8%.
What is the Percentage of Population Employed in Installation, Maintenance & Repair in Port Arthur, TX?
Percentage of Population Employed in Installation, Maintenance & Repair in Port Arthur is 2.7%.
What is the Percentage of Population Employed in Installation, Maintenance & Repair in Texas?
Percentage of Population Employed in Installation, Maintenance & Repair in Texas is 3.4%.
What is the Percentage of Population Employed in Installation, Maintenance & Repair in the United States?
Percentage of Population Employed in Installation, Maintenance & Repair in the United States is 3.1%.