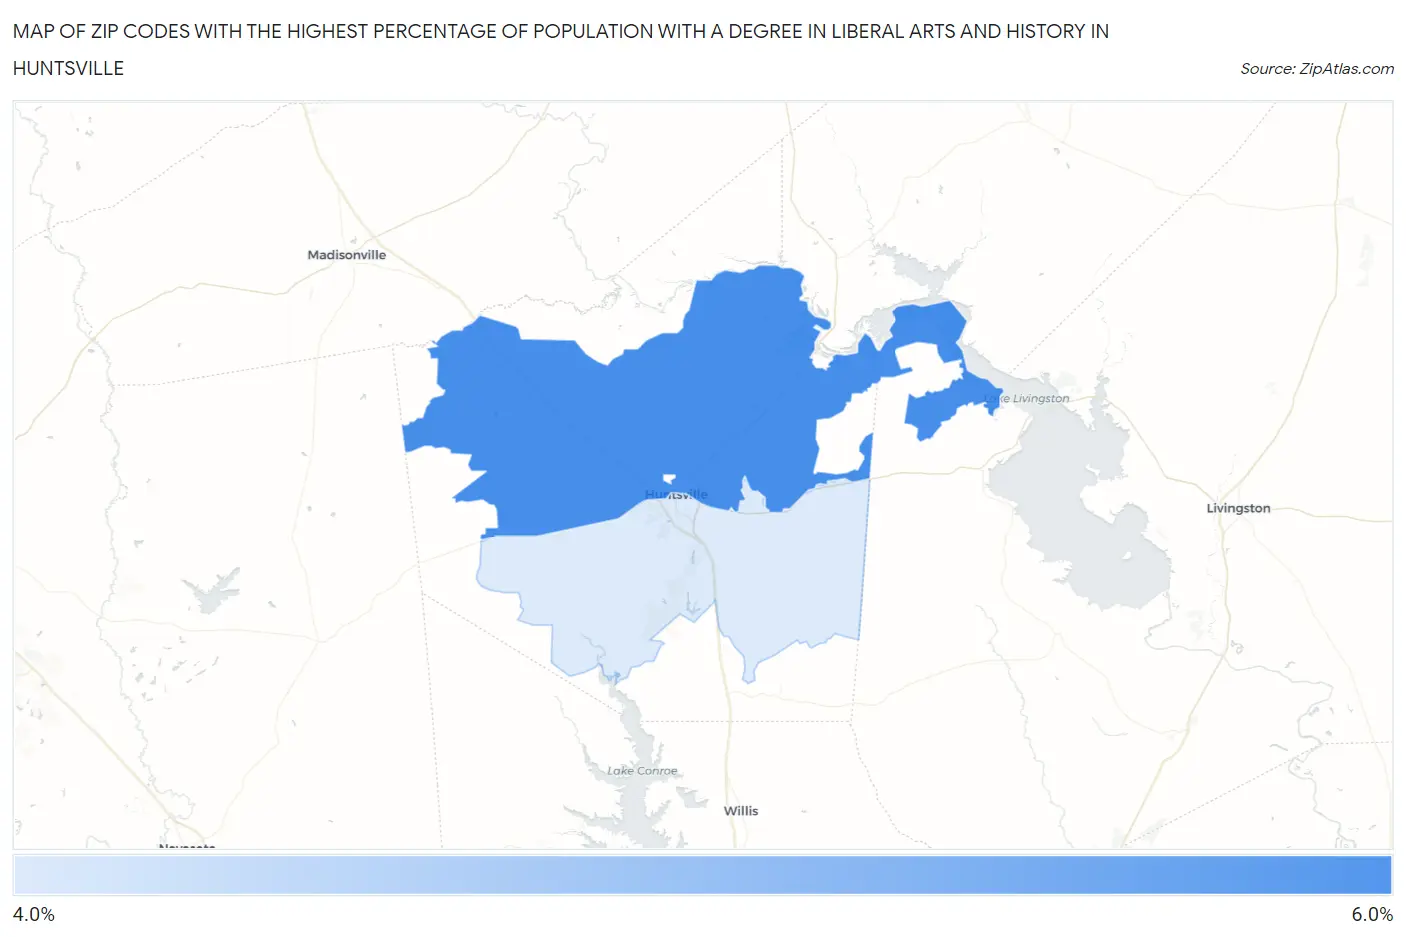
Zip Codes with the Highest Percentage of Population with a Degree in Liberal Arts and History in Huntsville, TX
RELATED REPORTS & OPTIONS
Liberal Arts and History
Huntsville
Compare Zip Codes
Map of Zip Codes with the Highest Percentage of Population with a Degree in Liberal Arts and History in Huntsville
0.0%
6.0%
Zip Codes with the Highest Percentage of Population with a Degree in Liberal Arts and History in Huntsville, TX
| Zip Code | % Graduates | vs State | vs National | |
| 1. | 77320 | 5.8% | 4.2%(+1.61)#460 | 4.9%(+0.887)#9,139 |
| 2. | 77340 | 4.2% | 4.2%(+0.044)#731 | 4.9%(-0.678)#14,032 |
1
Common Questions
What are the Top Zip Codes with the Highest Percentage of Population with a Degree in Liberal Arts and History in Huntsville, TX?
Top Zip Codes with the Highest Percentage of Population with a Degree in Liberal Arts and History in Huntsville, TX are:
What zip code has the Highest Percentage of Population with a Degree in Liberal Arts and History in Huntsville, TX?
77320 has the Highest Percentage of Population with a Degree in Liberal Arts and History in Huntsville, TX with 5.8%.
What is the Percentage of Population with a Degree in Liberal Arts and History in Huntsville, TX?
Percentage of Population with a Degree in Liberal Arts and History in Huntsville is 5.7%.
What is the Percentage of Population with a Degree in Liberal Arts and History in Texas?
Percentage of Population with a Degree in Liberal Arts and History in Texas is 4.2%.
What is the Percentage of Population with a Degree in Liberal Arts and History in the United States?
Percentage of Population with a Degree in Liberal Arts and History in the United States is 4.9%.