Zip Codes with the Highest Percentage of Population Employed in Security & Protection in Huntsville, TX
RELATED REPORTS & OPTIONS
Security & Protection
Huntsville
Compare Zip Codes
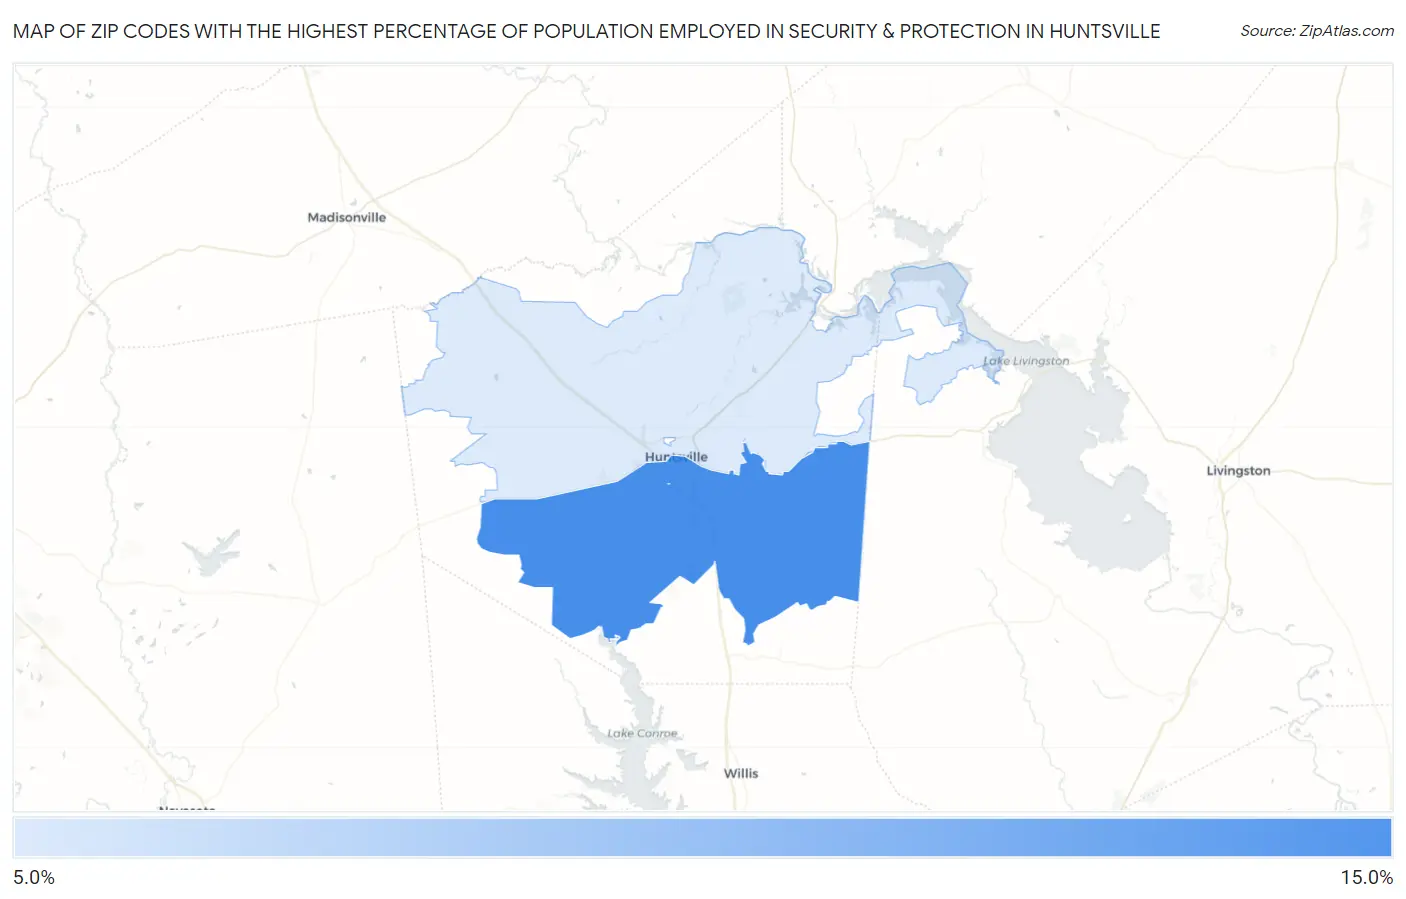
Map of Zip Codes with the Highest Percentage of Population Employed in Security & Protection in Huntsville
0.0%
15.0%
Zip Codes with the Highest Percentage of Population Employed in Security & Protection in Huntsville, TX
| Zip Code | % Employed | vs State | vs National | |
| 1. | 77340 | 11.8% | 2.2%(+9.63)#47 | 2.1%(+9.70)#563 |
| 2. | 77320 | 7.6% | 2.2%(+5.35)#113 | 2.1%(+5.42)#1,304 |
1
Common Questions
What are the Top Zip Codes with the Highest Percentage of Population Employed in Security & Protection in Huntsville, TX?
Top Zip Codes with the Highest Percentage of Population Employed in Security & Protection in Huntsville, TX are:
What zip code has the Highest Percentage of Population Employed in Security & Protection in Huntsville, TX?
77340 has the Highest Percentage of Population Employed in Security & Protection in Huntsville, TX with 11.8%.
What is the Percentage of Population Employed in Security & Protection in Huntsville, TX?
Percentage of Population Employed in Security & Protection in Huntsville is 12.3%.
What is the Percentage of Population Employed in Security & Protection in Texas?
Percentage of Population Employed in Security & Protection in Texas is 2.2%.
What is the Percentage of Population Employed in Security & Protection in the United States?
Percentage of Population Employed in Security & Protection in the United States is 2.1%.