Zip Codes with the Highest Percentage of Population Employed in Legal Services & Support in Grand Prairie, TX
RELATED REPORTS & OPTIONS
Legal Services & Support
Grand Prairie
Compare Zip Codes
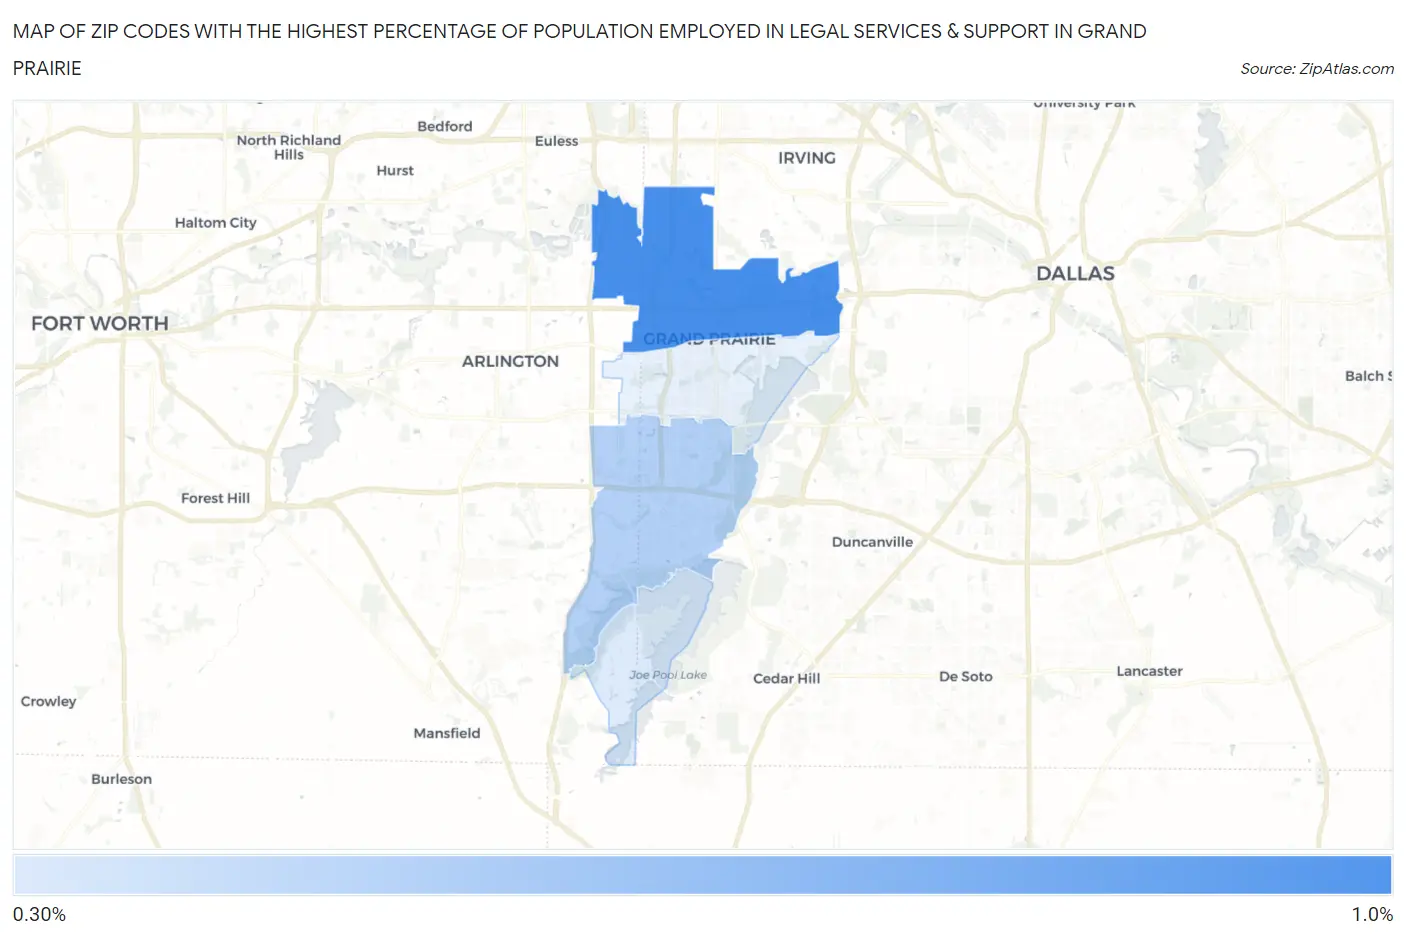
Map of Zip Codes with the Highest Percentage of Population Employed in Legal Services & Support in Grand Prairie
0.0%
1.0%
Zip Codes with the Highest Percentage of Population Employed in Legal Services & Support in Grand Prairie, TX
| Zip Code | % Employed | vs State | vs National | |
| 1. | 75050 | 0.88% | 1.0%(-0.132)#498 | 1.2%(-0.307)#8,810 |
| 2. | 75052 | 0.50% | 1.0%(-0.508)#747 | 1.2%(-0.684)#12,635 |
| 3. | 75054 | 0.35% | 1.0%(-0.655)#882 | 1.2%(-0.831)#14,415 |
1
Common Questions
What are the Top 3 Zip Codes with the Highest Percentage of Population Employed in Legal Services & Support in Grand Prairie, TX?
Top 3 Zip Codes with the Highest Percentage of Population Employed in Legal Services & Support in Grand Prairie, TX are:
What zip code has the Highest Percentage of Population Employed in Legal Services & Support in Grand Prairie, TX?
75050 has the Highest Percentage of Population Employed in Legal Services & Support in Grand Prairie, TX with 0.88%.
What is the Percentage of Population Employed in Legal Services & Support in Grand Prairie, TX?
Percentage of Population Employed in Legal Services & Support in Grand Prairie is 0.49%.
What is the Percentage of Population Employed in Legal Services & Support in Texas?
Percentage of Population Employed in Legal Services & Support in Texas is 1.0%.
What is the Percentage of Population Employed in Legal Services & Support in the United States?
Percentage of Population Employed in Legal Services & Support in the United States is 1.2%.