Zip Codes with the Highest Percentage of Population Employed in Legal Services & Support in Hurst, TX
RELATED REPORTS & OPTIONS
Legal Services & Support
Hurst
Compare Zip Codes
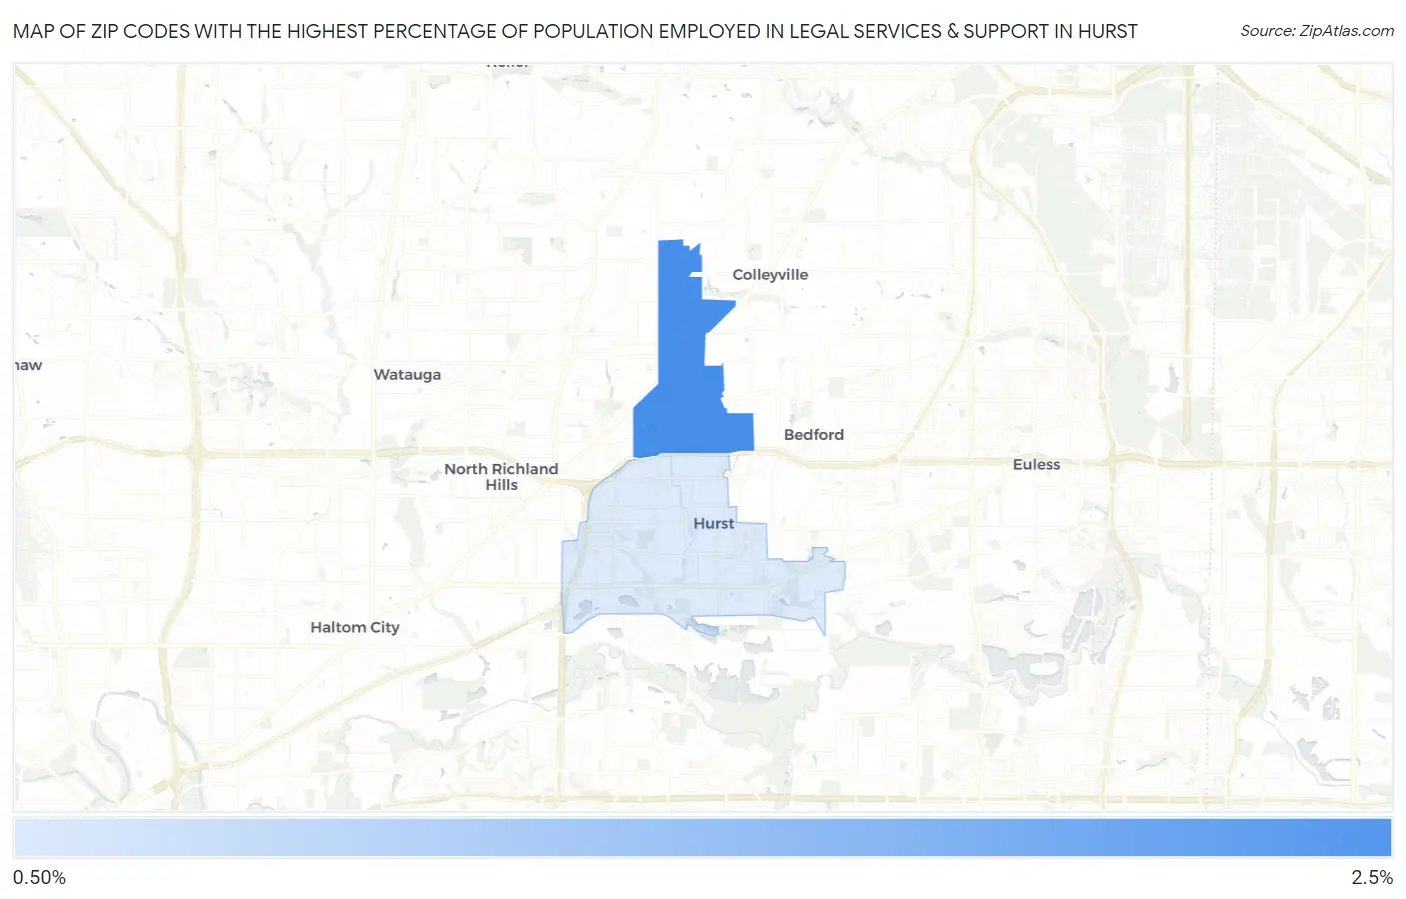
Map of Zip Codes with the Highest Percentage of Population Employed in Legal Services & Support in Hurst
0.0%
2.5%
Zip Codes with the Highest Percentage of Population Employed in Legal Services & Support in Hurst, TX
| Zip Code | % Employed | vs State | vs National | |
| 1. | 76054 | 2.4% | 1.0%(+1.38)#146 | 1.2%(+1.21)#2,695 |
| 2. | 76053 | 0.82% | 1.0%(-0.188)#514 | 1.2%(-0.363)#9,277 |
1
Common Questions
What are the Top Zip Codes with the Highest Percentage of Population Employed in Legal Services & Support in Hurst, TX?
Top Zip Codes with the Highest Percentage of Population Employed in Legal Services & Support in Hurst, TX are:
What zip code has the Highest Percentage of Population Employed in Legal Services & Support in Hurst, TX?
76054 has the Highest Percentage of Population Employed in Legal Services & Support in Hurst, TX with 2.4%.
What is the Percentage of Population Employed in Legal Services & Support in Hurst, TX?
Percentage of Population Employed in Legal Services & Support in Hurst is 1.3%.
What is the Percentage of Population Employed in Legal Services & Support in Texas?
Percentage of Population Employed in Legal Services & Support in Texas is 1.0%.
What is the Percentage of Population Employed in Legal Services & Support in the United States?
Percentage of Population Employed in Legal Services & Support in the United States is 1.2%.