Zip Codes with the Highest Percentage of Population Employed in Legal Services & Support in Corsicana, TX
RELATED REPORTS & OPTIONS
Legal Services & Support
Corsicana
Compare Zip Codes
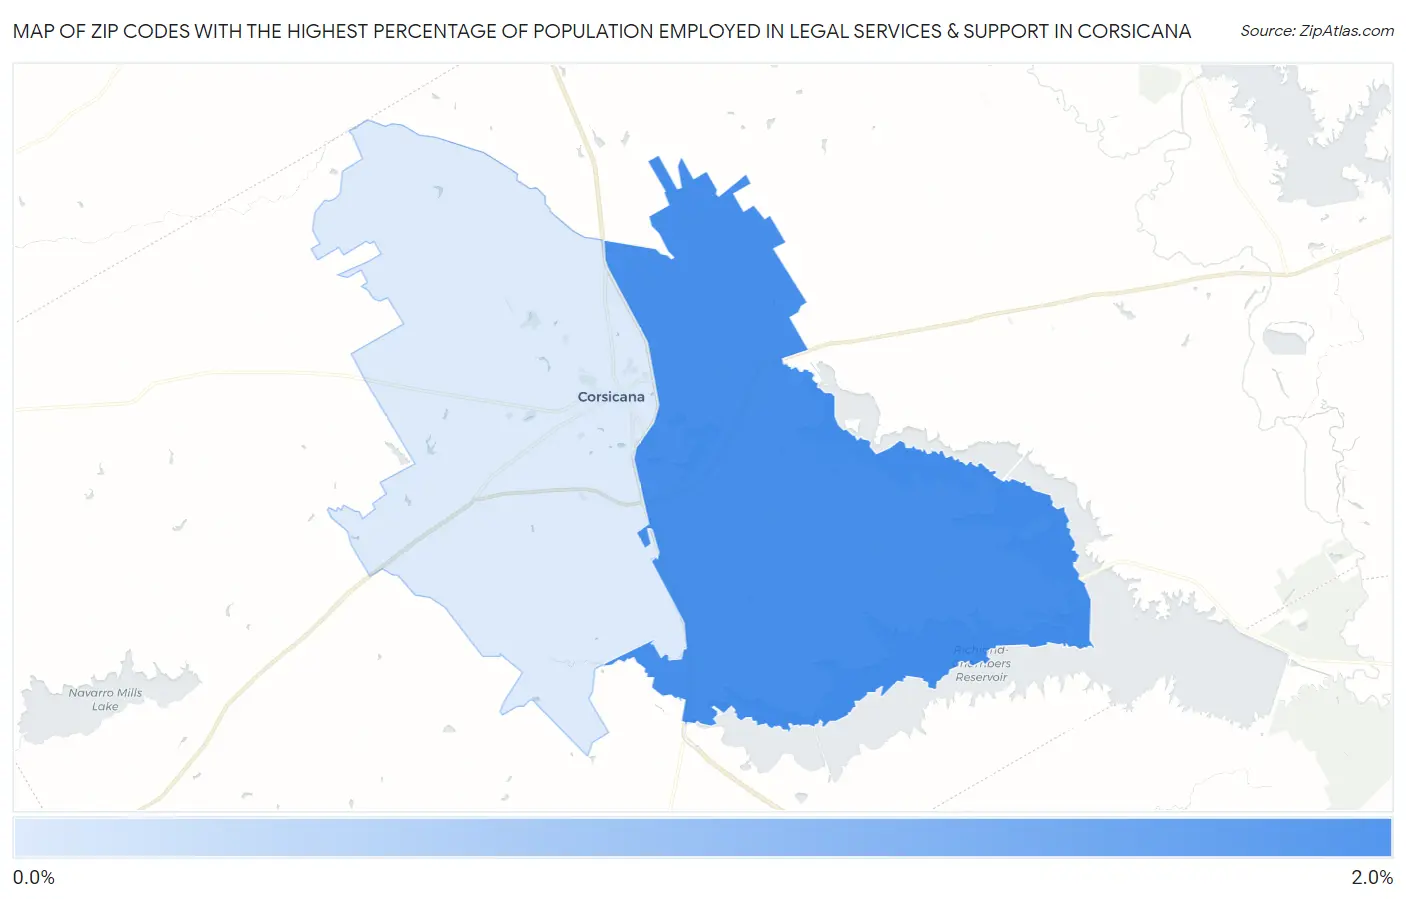
Map of Zip Codes with the Highest Percentage of Population Employed in Legal Services & Support in Corsicana
0.0%
2.0%
Zip Codes with the Highest Percentage of Population Employed in Legal Services & Support in Corsicana, TX
| Zip Code | % Employed | vs State | vs National | |
| 1. | 75109 | 1.5% | 1.0%(+0.510)#264 | 1.2%(+0.335)#4,969 |
| 2. | 75110 | 0.99% | 1.0%(-0.016)#443 | 1.2%(-0.191)#7,878 |
1
Common Questions
What are the Top Zip Codes with the Highest Percentage of Population Employed in Legal Services & Support in Corsicana, TX?
Top Zip Codes with the Highest Percentage of Population Employed in Legal Services & Support in Corsicana, TX are:
What zip code has the Highest Percentage of Population Employed in Legal Services & Support in Corsicana, TX?
75109 has the Highest Percentage of Population Employed in Legal Services & Support in Corsicana, TX with 1.5%.
What is the Percentage of Population Employed in Legal Services & Support in Corsicana, TX?
Percentage of Population Employed in Legal Services & Support in Corsicana is 0.80%.
What is the Percentage of Population Employed in Legal Services & Support in Texas?
Percentage of Population Employed in Legal Services & Support in Texas is 1.0%.
What is the Percentage of Population Employed in Legal Services & Support in the United States?
Percentage of Population Employed in Legal Services & Support in the United States is 1.2%.