Zip Codes with the Highest Percentage of Population Employed in Legal Services & Support in North Richland Hills, TX
RELATED REPORTS & OPTIONS
Legal Services & Support
North Richland Hills
Compare Zip Codes
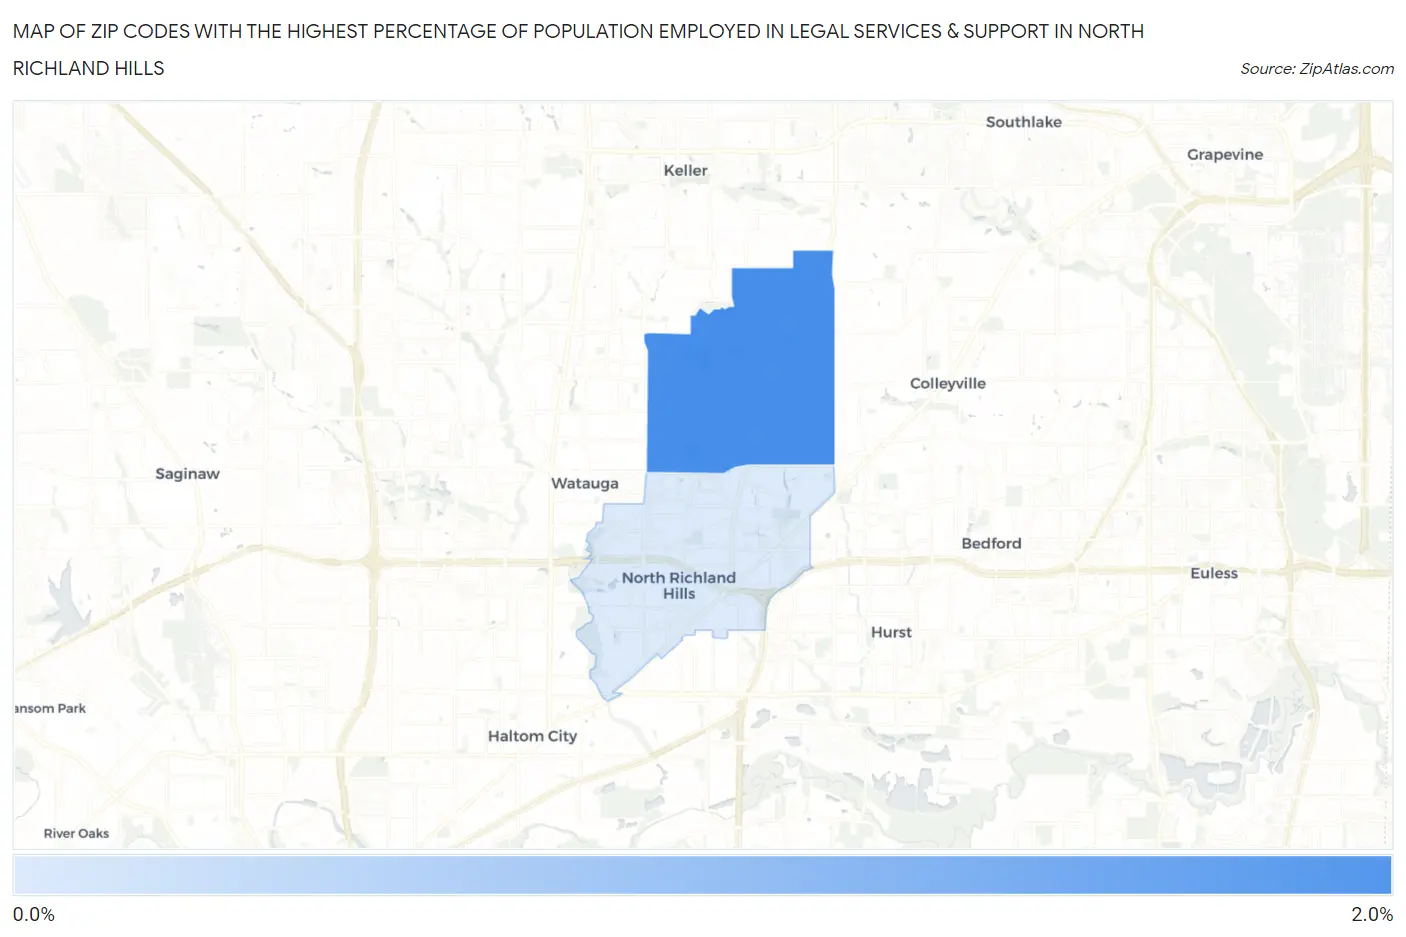
Map of Zip Codes with the Highest Percentage of Population Employed in Legal Services & Support in North Richland Hills
0.0%
2.0%
Zip Codes with the Highest Percentage of Population Employed in Legal Services & Support in North Richland Hills, TX
| Zip Code | % Employed | vs State | vs National | |
| 1. | 76182 | 1.9% | 1.0%(+0.866)#202 | 1.2%(+0.690)#3,801 |
| 2. | 76180 | 0.63% | 1.0%(-0.381)#661 | 1.2%(-0.556)#11,169 |
1
Common Questions
What are the Top Zip Codes with the Highest Percentage of Population Employed in Legal Services & Support in North Richland Hills, TX?
Top Zip Codes with the Highest Percentage of Population Employed in Legal Services & Support in North Richland Hills, TX are:
What zip code has the Highest Percentage of Population Employed in Legal Services & Support in North Richland Hills, TX?
76182 has the Highest Percentage of Population Employed in Legal Services & Support in North Richland Hills, TX with 1.9%.
What is the Percentage of Population Employed in Legal Services & Support in North Richland Hills, TX?
Percentage of Population Employed in Legal Services & Support in North Richland Hills is 1.1%.
What is the Percentage of Population Employed in Legal Services & Support in Texas?
Percentage of Population Employed in Legal Services & Support in Texas is 1.0%.
What is the Percentage of Population Employed in Legal Services & Support in the United States?
Percentage of Population Employed in Legal Services & Support in the United States is 1.2%.